Featured Application
Our data indicate patellofemoral joint stress is similar between unloaded front and back squats, while more trunk flexion during squatting results in lower knee stress. Greater squat depth increases patellofemoral knee joint stress for both front and back squats.
Abstract
The purpose of this study was to identify differences between patellofemoral joint stress (PFJS), patellofemoral joint reaction force (PFJRF), quadriceps force, trunk and knee flexion angles, and horizontal position of applied load relative to the knee and heel between the front squat (FS) and back squat (BS) exercises at two depths (60 and 80% of leg length, where 60% represents a lower squat depth). Twenty-two healthy college-aged females (age: 22.23 ± 1.86 years, mass: 67.65 ± 9.60 kg, height: 171.34 ± 6.38 cm) participated in this study. Mechanical variables were measured or estimated using a 15-camera 3D motion analysis (180 Hz) system and force platforms (1800 Hz). Five repetitions of each squatting technique at each depth were performed. Multivariate testing showed a difference in patellofemoral loading variables, trunk and knee kinematics, and bar position relative to the heel and knee (p = 0.00) between squat depths. There was no difference between techniques, no interaction between depth and techniques (p > 0.05). Follow-up univariate analyses showed differences in PFJS, PFJRF, quadriceps force, horizontal bar position relative to the heel and knee, and knee and trunk flexion between squat depths. The similar joint stress observed between FS and BS may be explained by compensatory trunk mechanics or the use of a light external load.
1. Introduction
Patellofemoral joint pain is a common diagnosis for knee pain, affecting individuals of all ages and activity levels. One theory of patellofemoral pain proposes that increased patellofemoral joint stress (PFJS) creates increased pressure on the subchondral tissues of the patellofemoral joint, resulting in painful symptoms [1]. PFJS is largely influenced by the magnitude of quadriceps force and knee flexion angle, which interact to produce large patellofemoral joint reaction forces (PFJRF) [2]. These forces combined with changes in patellar contact area as the knee flexes have been shown to generate considerable PFJS during common weight-bearing activities.
Squatting has been implicated in patellofemoral pain symptoms, possibly because of how knee flexion angle and quadriceps force influence patellofemoral joint loading. Bieryla et al. (2009) reported that barbell squats allow the ability to modify the amount and location of the external load and the depth of a squat, which may be important modifications for changing the magnitude of PFJRF and subsequent PFJS in symptomatic individuals [3]. To assess the characteristics of patellofemoral joint loads during exercise, musculoskeletal modeling has been used to estimate the quantities of forces within and around the joint [1]. Using this model, Kernozek et al. (2018) and Nunes et al. (2018) reported that anterior displacement of the knee beyond the toes influenced PFJS during a squat exercise [4,5]. Fry et al. (2003) in a two-dimensional study reported that maintaining knee position posterior to the toes while performing a barbell squat increased hip torque about 10 times and decreased knee torque about 0.78 times [6]. Based on these investigations, it appears that placing the applied load more posterior to the knee may result in decreased patellofemoral joint loading while placing the applied load more anterior to the knee may result in increased joint loading. The squat is a closed kinetic chain exercise that requires sequential joint movements and coordination. Different types of squatting require different trunk, knee, and ankle positioning that affects the placement of the line of gravity relative to the knee and influences PFJS. The influence of bar location relative to the body during front and back squat (FS and BS) has been discussed frequently [7,8,9,10]. Kinematically, FS results in a more upright torso position and less hip flexion than BS [7]. Knee joint kinematics between the two types of squats are inconsistent [7,10,11]. There are some discrepancies in terms of how FS and BS require different joint moments and muscle activities [7,8,10,11]. It seems that the inconsistency between studies could be related to the different relative magnitude, methods, or even population [9,10].
The magnitude of patellofemoral joint load also appears to be influenced by squat depth. The effect of squat depth as a main factor on knee loading during squatting with or without resistance has been discussed frequently [12,13,14,15,16,17]. Previous studies showed an increase in peak PFJRF as knee flexion angle increased [16,18,19]. Most studies indicate that greater knee flexion is associated with increased knee extensor (quadriceps) muscular effort during parallel/full back squats at 50% and 90% one-repetition-maximum (1RM) [17], higher peak external knee flexion moments (during parallel, above-parallel, and below-parallel back squats at 0%, 50%, and 90% 1RM) [16], and greater peak PFJS (during no load and 35% Body weight load back squats with 110 degrees of knee flexion [12] or during parallel, above parallel, and below-parallel back squats at 0%, 50%, and 90% 1RM) [14]. Salem and Powers (2001) reported little effect on patellofemoral joint loading during squatting from 70 degrees to 110 degrees of knee flexion using a standard barbell (22 kg) in five female athlete participants [13]. This inconsistency could be because of the small sample size in that study or even an enlargement of the retro-patellar joint surface during a knee flexion greater than 90 degrees [20]. Usually a shallow squatting depth is recommended in rehabilitation programs to keep knee joint loading to a minimum. To the best of our knowledge, the literature does not provide a consensus on the effect of the external load location and depth of squat on PFJS. Therefore, the purpose of this study was to investigate differences in patellofemoral joint loading, quadriceps force, trunk and knee flexion kinematics, and horizontal position of applied load relative to the knee and heel when manipulating applied load location and squat depth.
2. Materials and Methods
2.1. Study Design
This study was a controlled laboratory study with a repeated-measure design, in which each participant performed all test conditions to allow for within-subject comparisons. The two independent variables each with two levels were applied load location (FS vs. BS) and squat depth (60% and 80% of leg length (measured from the greater trochanter to the ipsilateral lateral malleolus of the fibula)). The dependent variables were PFJS, PFJRF, quadriceps force, knee flexion angle, trunk flexion angle, horizontal distance from bar position to the knee joint, and horizontal distance from bar position to the heel. These variables were derived using motion capture and musculoskeletal modeling techniques to evaluate joint loading and movement strategies under each condition.
2.2. Participants
Twenty-two college-aged females (age: 22.23 ± 1.86 years, mass: 67.65 ± 9.60 kg, height: 171.34 ± 6.38 cm, self-reported Tegner Activity Scale level: 4.74 ± 1.76) participated in this study. Inclusion criteria included being relatively healthy females and aged 18 to 30-years-old with experience with weight training for sports requiring barbell-loaded squats using both squatting techniques. Exclusion criteria included any history of a recent knee injury, current knee pain, or knee surgery within the past year. All participants were informed of the study procedures, benefits, and potential risks prior to their voluntary participation. The informed consent form and ethics policies on the use of human subjects was approved by the university’s Institutional Review Board and each participant provided their written informed consent prior to participation.
2.3. Procedures
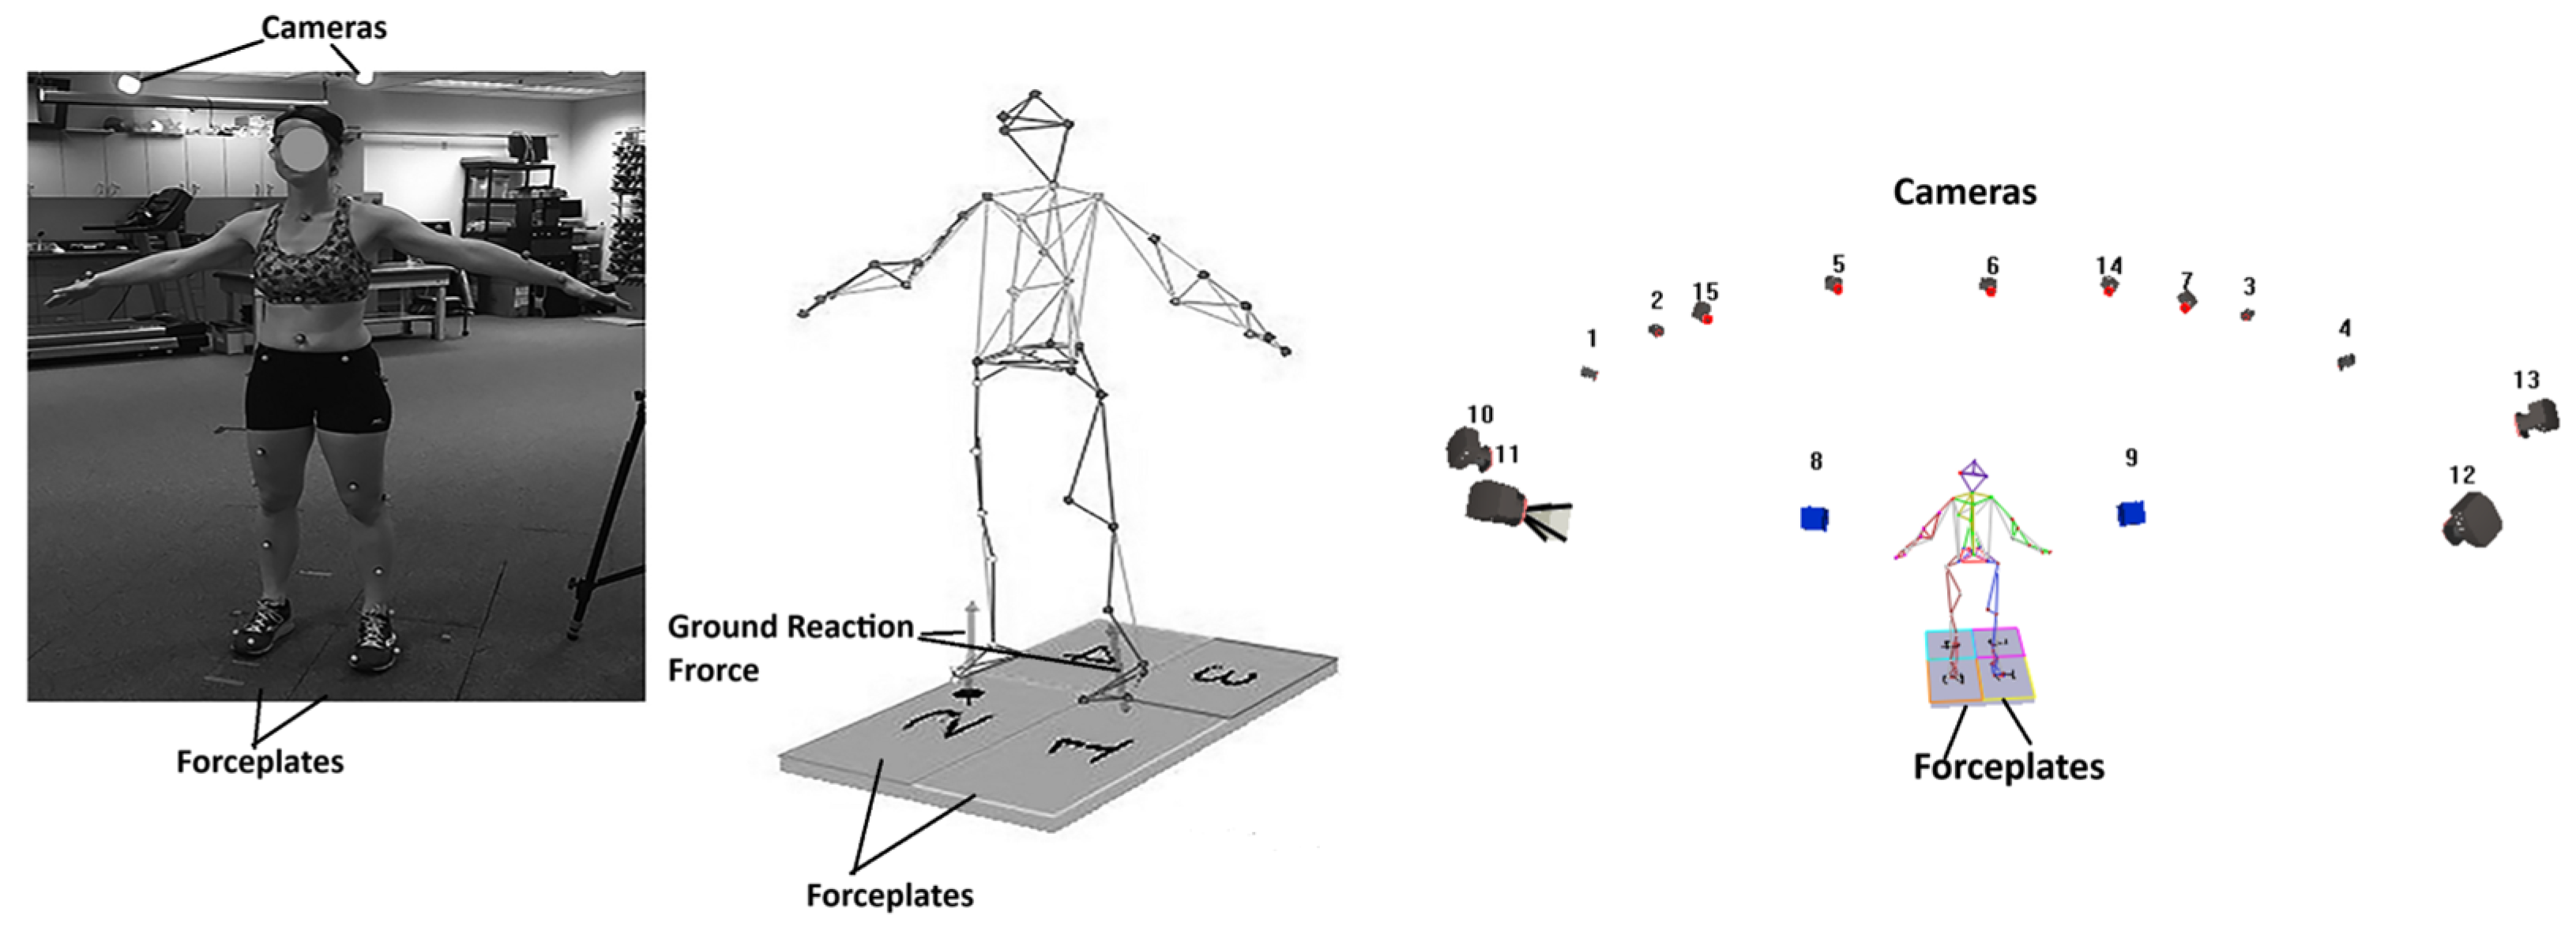
After a two-minute walking warm-up on a treadmill at a self-selected pace, 47 surface-based retroreflective markers were placed on the participant’s skin or tight-fitting clothing (Figure 1). Four markers were placed on their head, six markers on the trunk, five markers on the pelvis, 16 markers bilaterally on the upper extremities, and 16 markers bilaterally on the lower extremities. All subjects were provided the same model athletic shoe (Saucony, Zealot, Lexington, MA, USA) to minimize any confounding effects of footwear. Fifteen cameras (Motion Analysis Corporation, Santa Rosa, CA, USA) and two force platforms (Model 4080, Bertec Corporation, Columbus, OH, USA) were used to collect motion and analog data at 180 Hz and 1800 Hz, respectively. Figure 1 shows the 47-marker set in the static position, the cameras, and the force platforms.
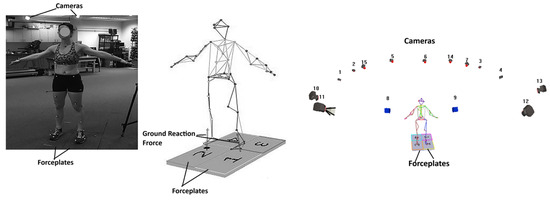
Figure 1.
Custom 47 retro-reflective marker set with camera and force plate placements.
Marker data (three-dimensional marker locations) and force platform data (ground reaction force and moments) were used in a 44 degree-of-freedom (DOF) musculoskeletal model (Human Body Model; Motekforce Link, Amsterdam, Netherlands) with 18 rigid segments to calculate joint kinetics, kinematics, and muscle forces. The trunk was modeled as two segments coupled to provide 3-DOF, the hip was modeled as a ball-and-socket joint with 3-DOF, the knee joint was modeled as a 1-DOF hinge joint, the subtalar joint as a 1-DOF joint, and the ankle joint as a 2-DOF. Three hundred individual muscle tendon units were represented.
Each participant’s leg length was measured from the greater trochanter of the femur to the ipsilateral lateral malleolus of the fibula. Squats were then performed to a depth of 60% or 80% of each participant’s leg length, individualizing depth relative to the length of the participant’s leg. Using this method of measurement, 60% of the leg length measured from the lateral malleolus represented a greater squat depth. An elastic band was tethered behind each participant to act as a tactile cue for squat depth termination when their posterior thigh segment contacted the band. Five minutes were provided for each participant to practice each squat and warm up.
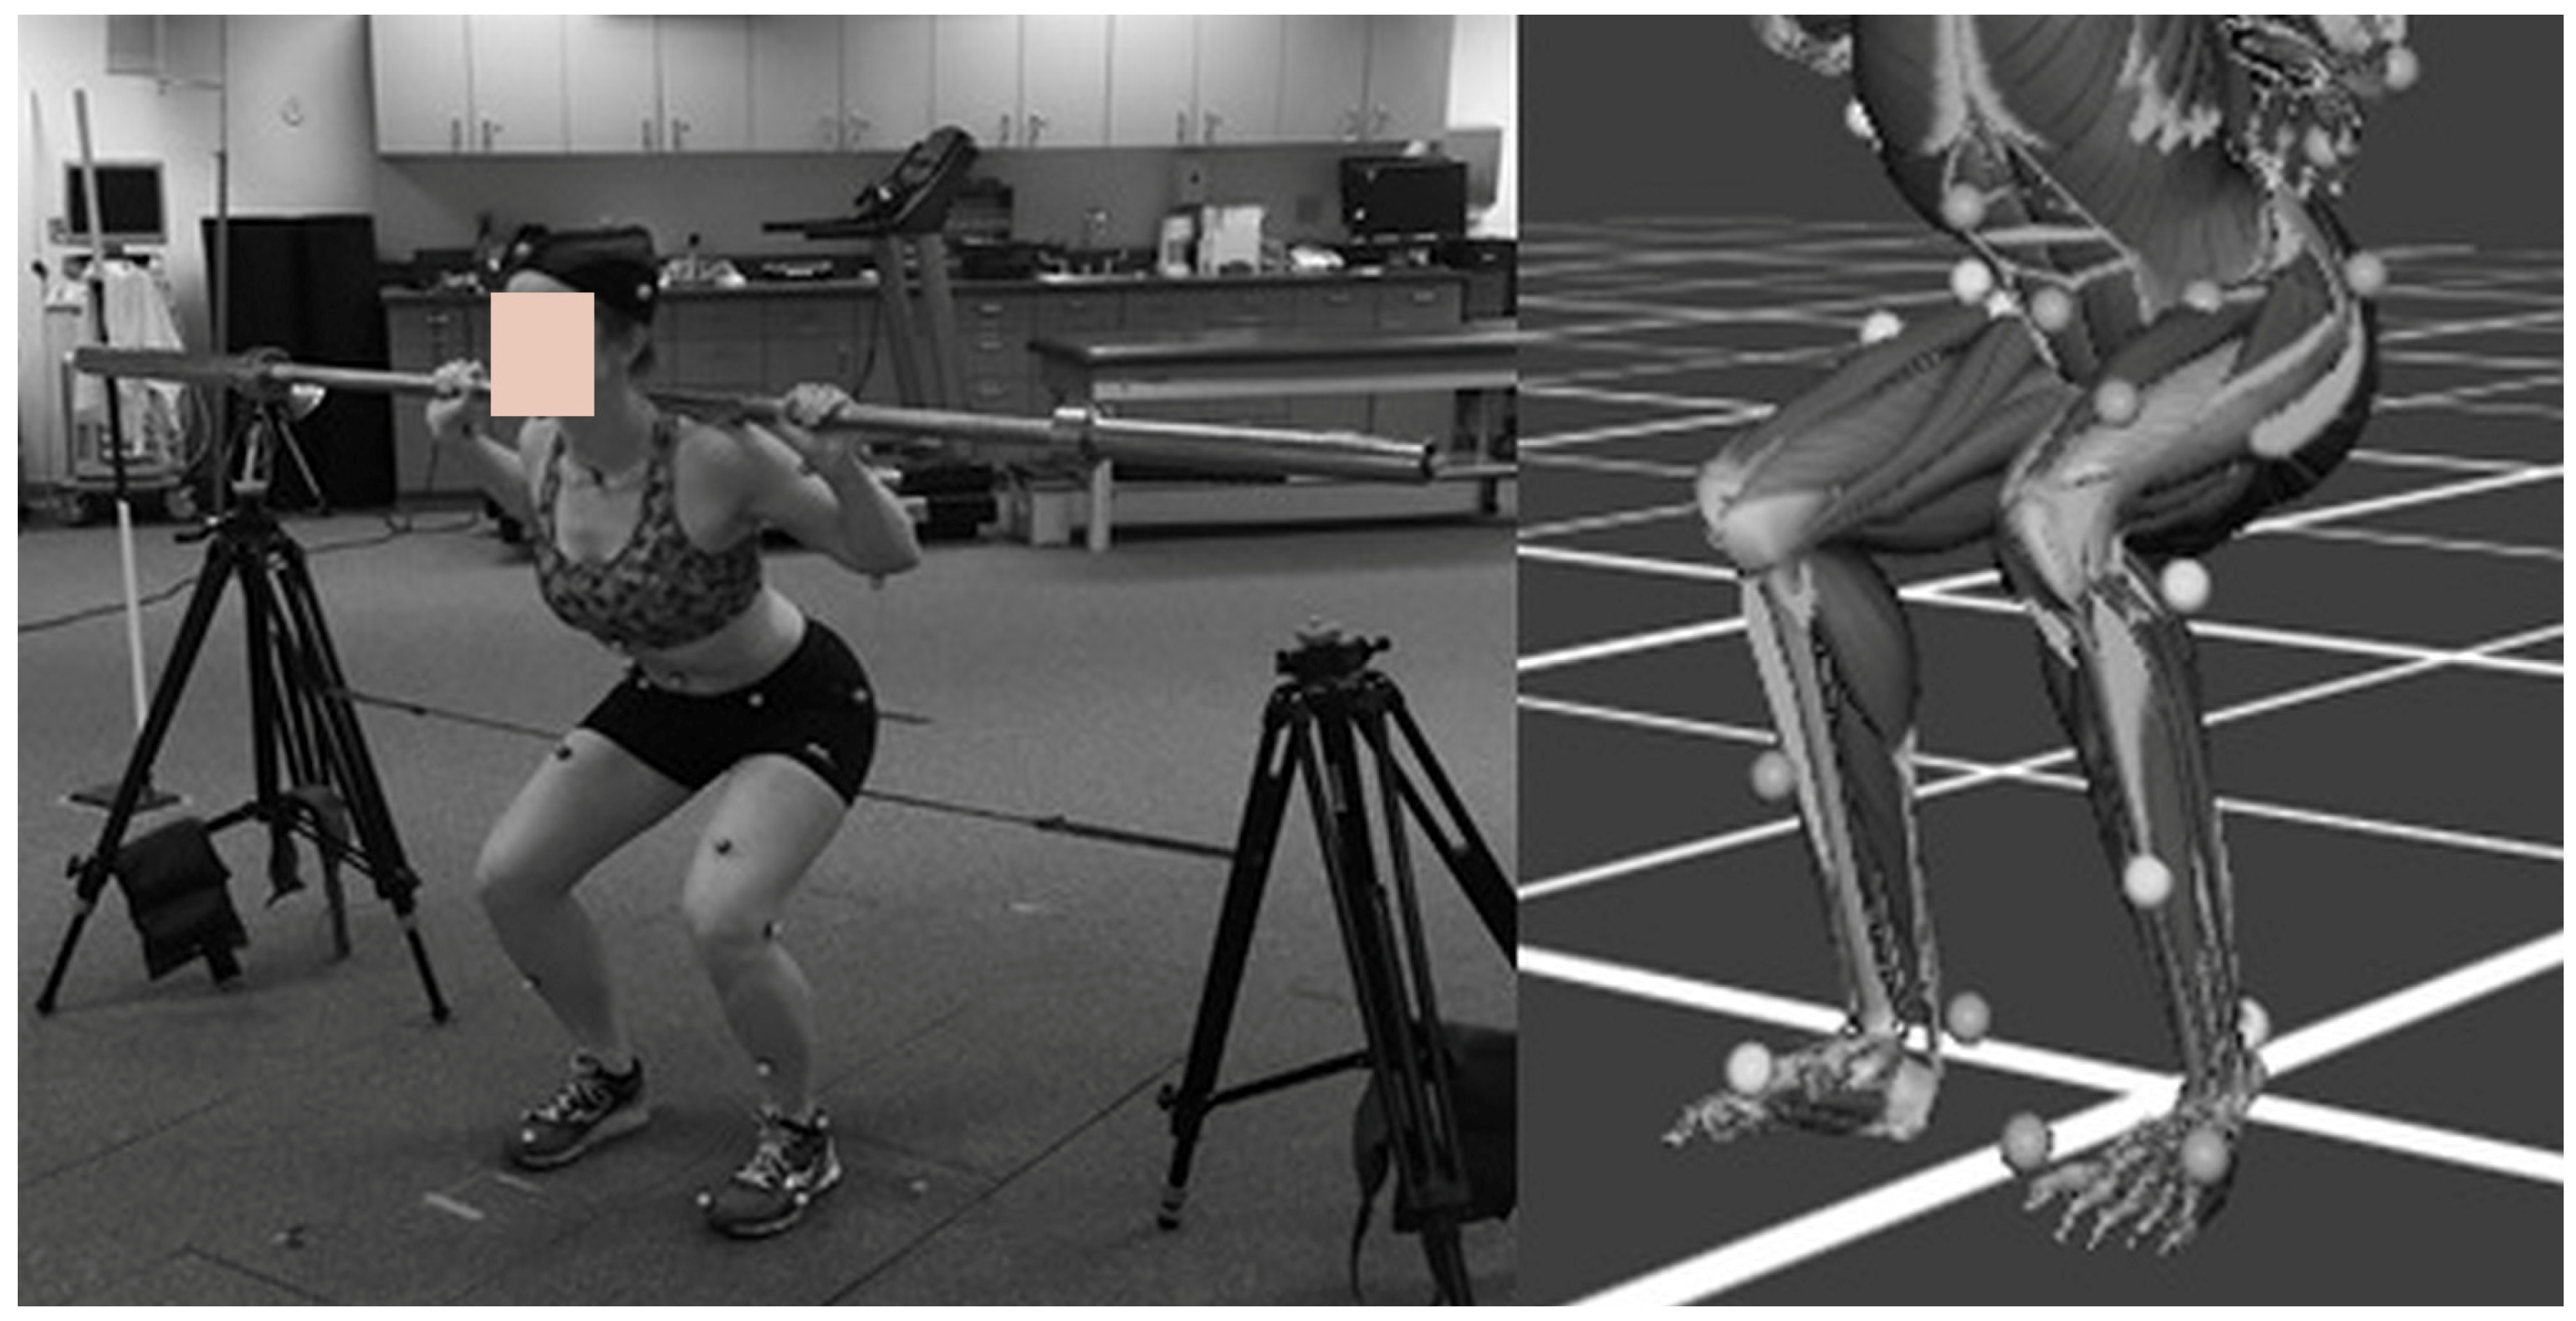
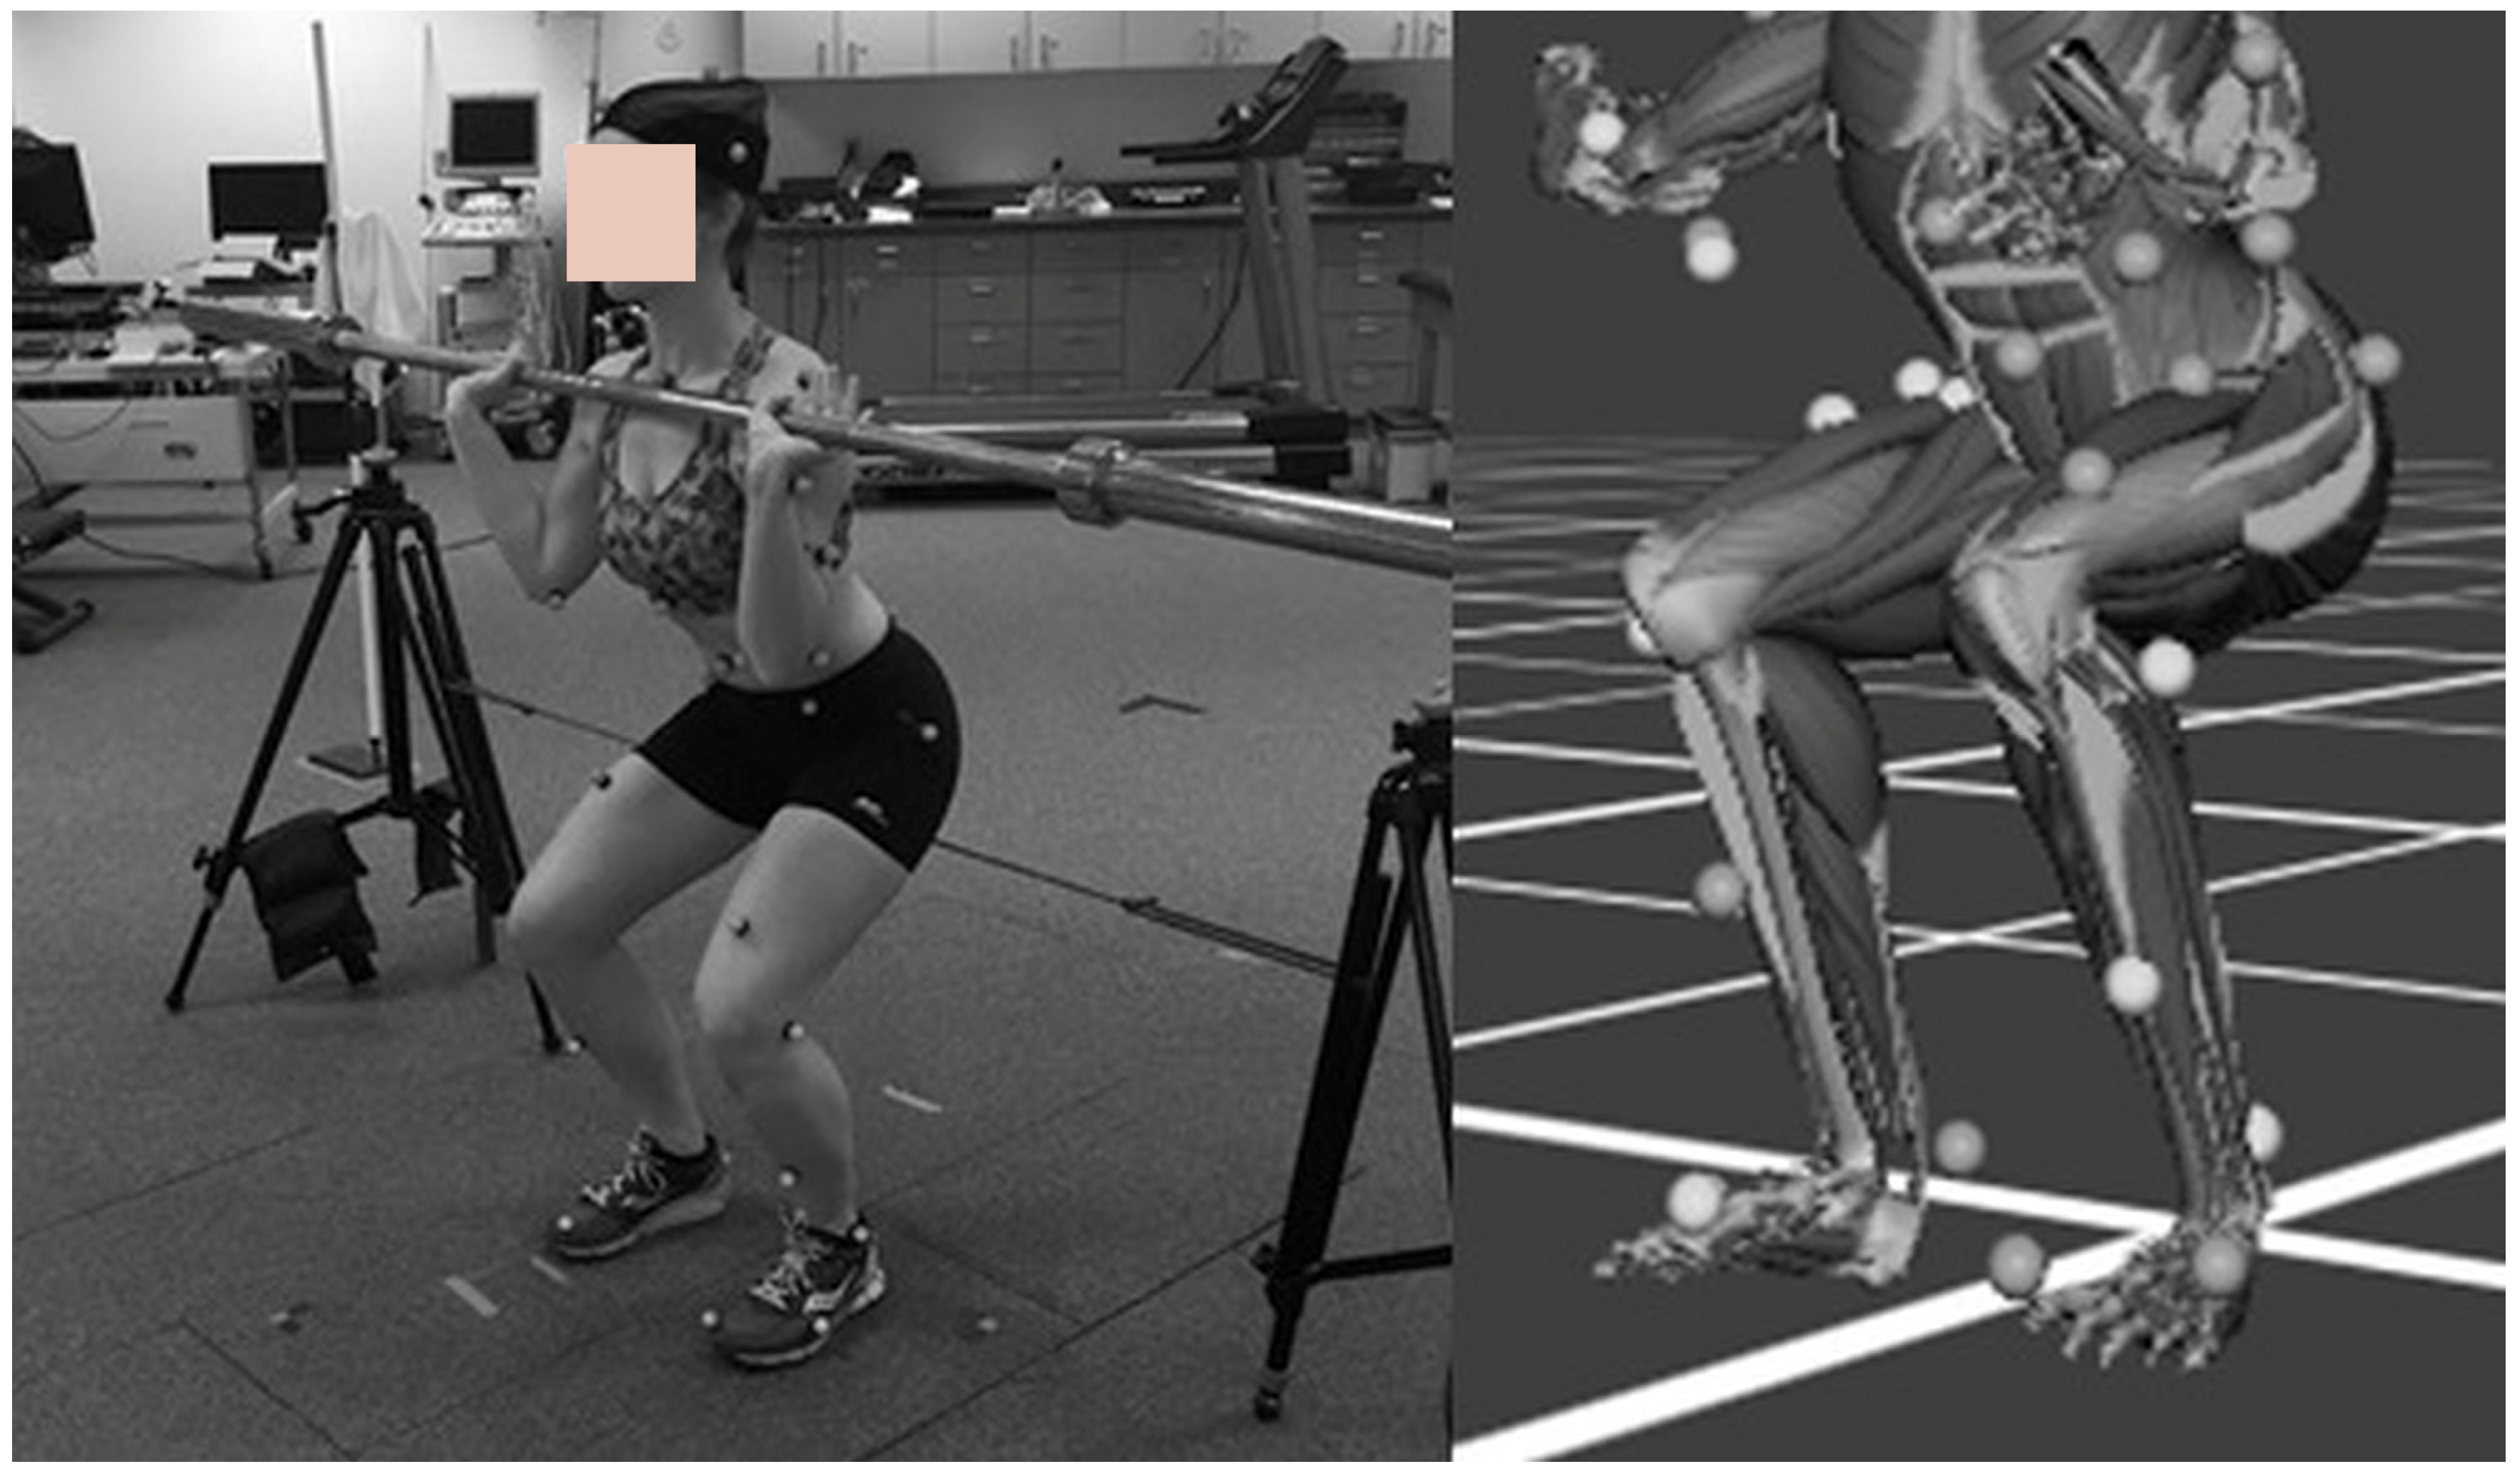
Participants randomly performed one set of five repetitions for each squat condition: front squat at 60% leg length, front squat at 80% leg length, back squat at 60% leg length, and back squat at 80% leg length (Figure 2 and Figure 3). One minute of rest was provided between each squat condition. A metronome set to 60 beats per minute standardized the rate of squatting. Trials were repeated if the participant’s squat did not match the cadence of the metronome, or they did not reach the correct depth as indicated by contact with the band. Adequate time was provided for rest to prevent fatigue and injury. Each participant performed the squat with a 20.41 kg bar, regardless of squat condition, individual body weight, or individual strength. This fixed load was selected to maintain consistency across all conditions and within-subject comparisons; however, we acknowledge that this approach may limit inter-individual comparisons, as the absolute load does not account for differences in participants’ body mass or strength capacities.
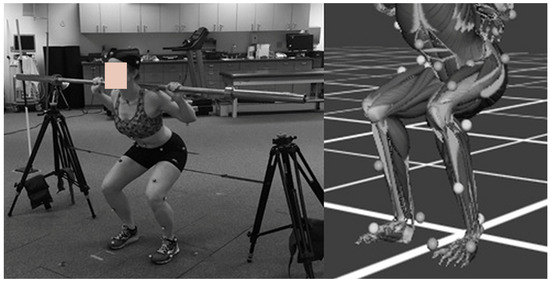
Figure 2.
Back squat execution with barbell.
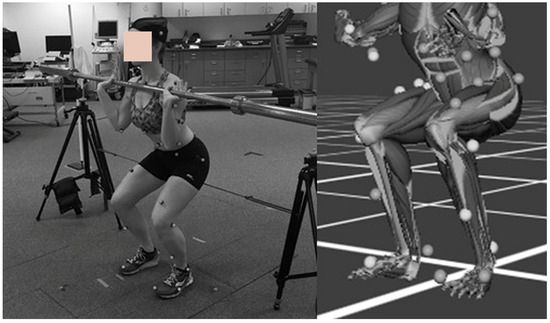
Figure 3.
Front squat execution with barbell.
Patellofemoral Joint Stress Analysis
Skeletal model kinematics were determined with a kinematic solver using global optimization. Joint moments were obtained from equations of motion and inverse dynamics. Muscle forces were then determined from the joint moments by minimizing a static cost function where the sum of squared muscle activations was related to maximum muscle strength. A recurrent neural network was used to solve for static optimization. Total quadriceps force was calculated by summing the individual muscle forces from the rectus femoris, vastus medialis, vastus lateralis, and vastus intermedius. The following set of equations were used to determine the two-dimensional patellofemoral joint reaction force (PFJRF) load based on k [21]. The k value is the ratio between the PFJRF or and the quadriceps force as a function of knee flexion angle (x) [21].
where x was the knee joint angle in the sagittal plane. van Eijden et al. (1986) [22] determined that k was representative of the component of force from the quadriceps to the patellofemoral joint based on the knee angle and the orientation of the quadriceps muscle. Therefore,
k(x) = (4.62 × 10⁻¹ + 1.47 × 10⁻³x − 3.84 × 10−5x2)/(1 − 1.62 × 10⁻²x + 1.55 × 10−4x2 − 6.98 × 10 −7 x3)
PFJRF(x) = k(x) × Quadriceps Force(x)
The following equation was used to determine patellofemoral joint contact area as a function of knee angle [21,22,23]:
Patellofemoral joint contact area(x) = 0.0781x2 + 0.6763x + 151.75
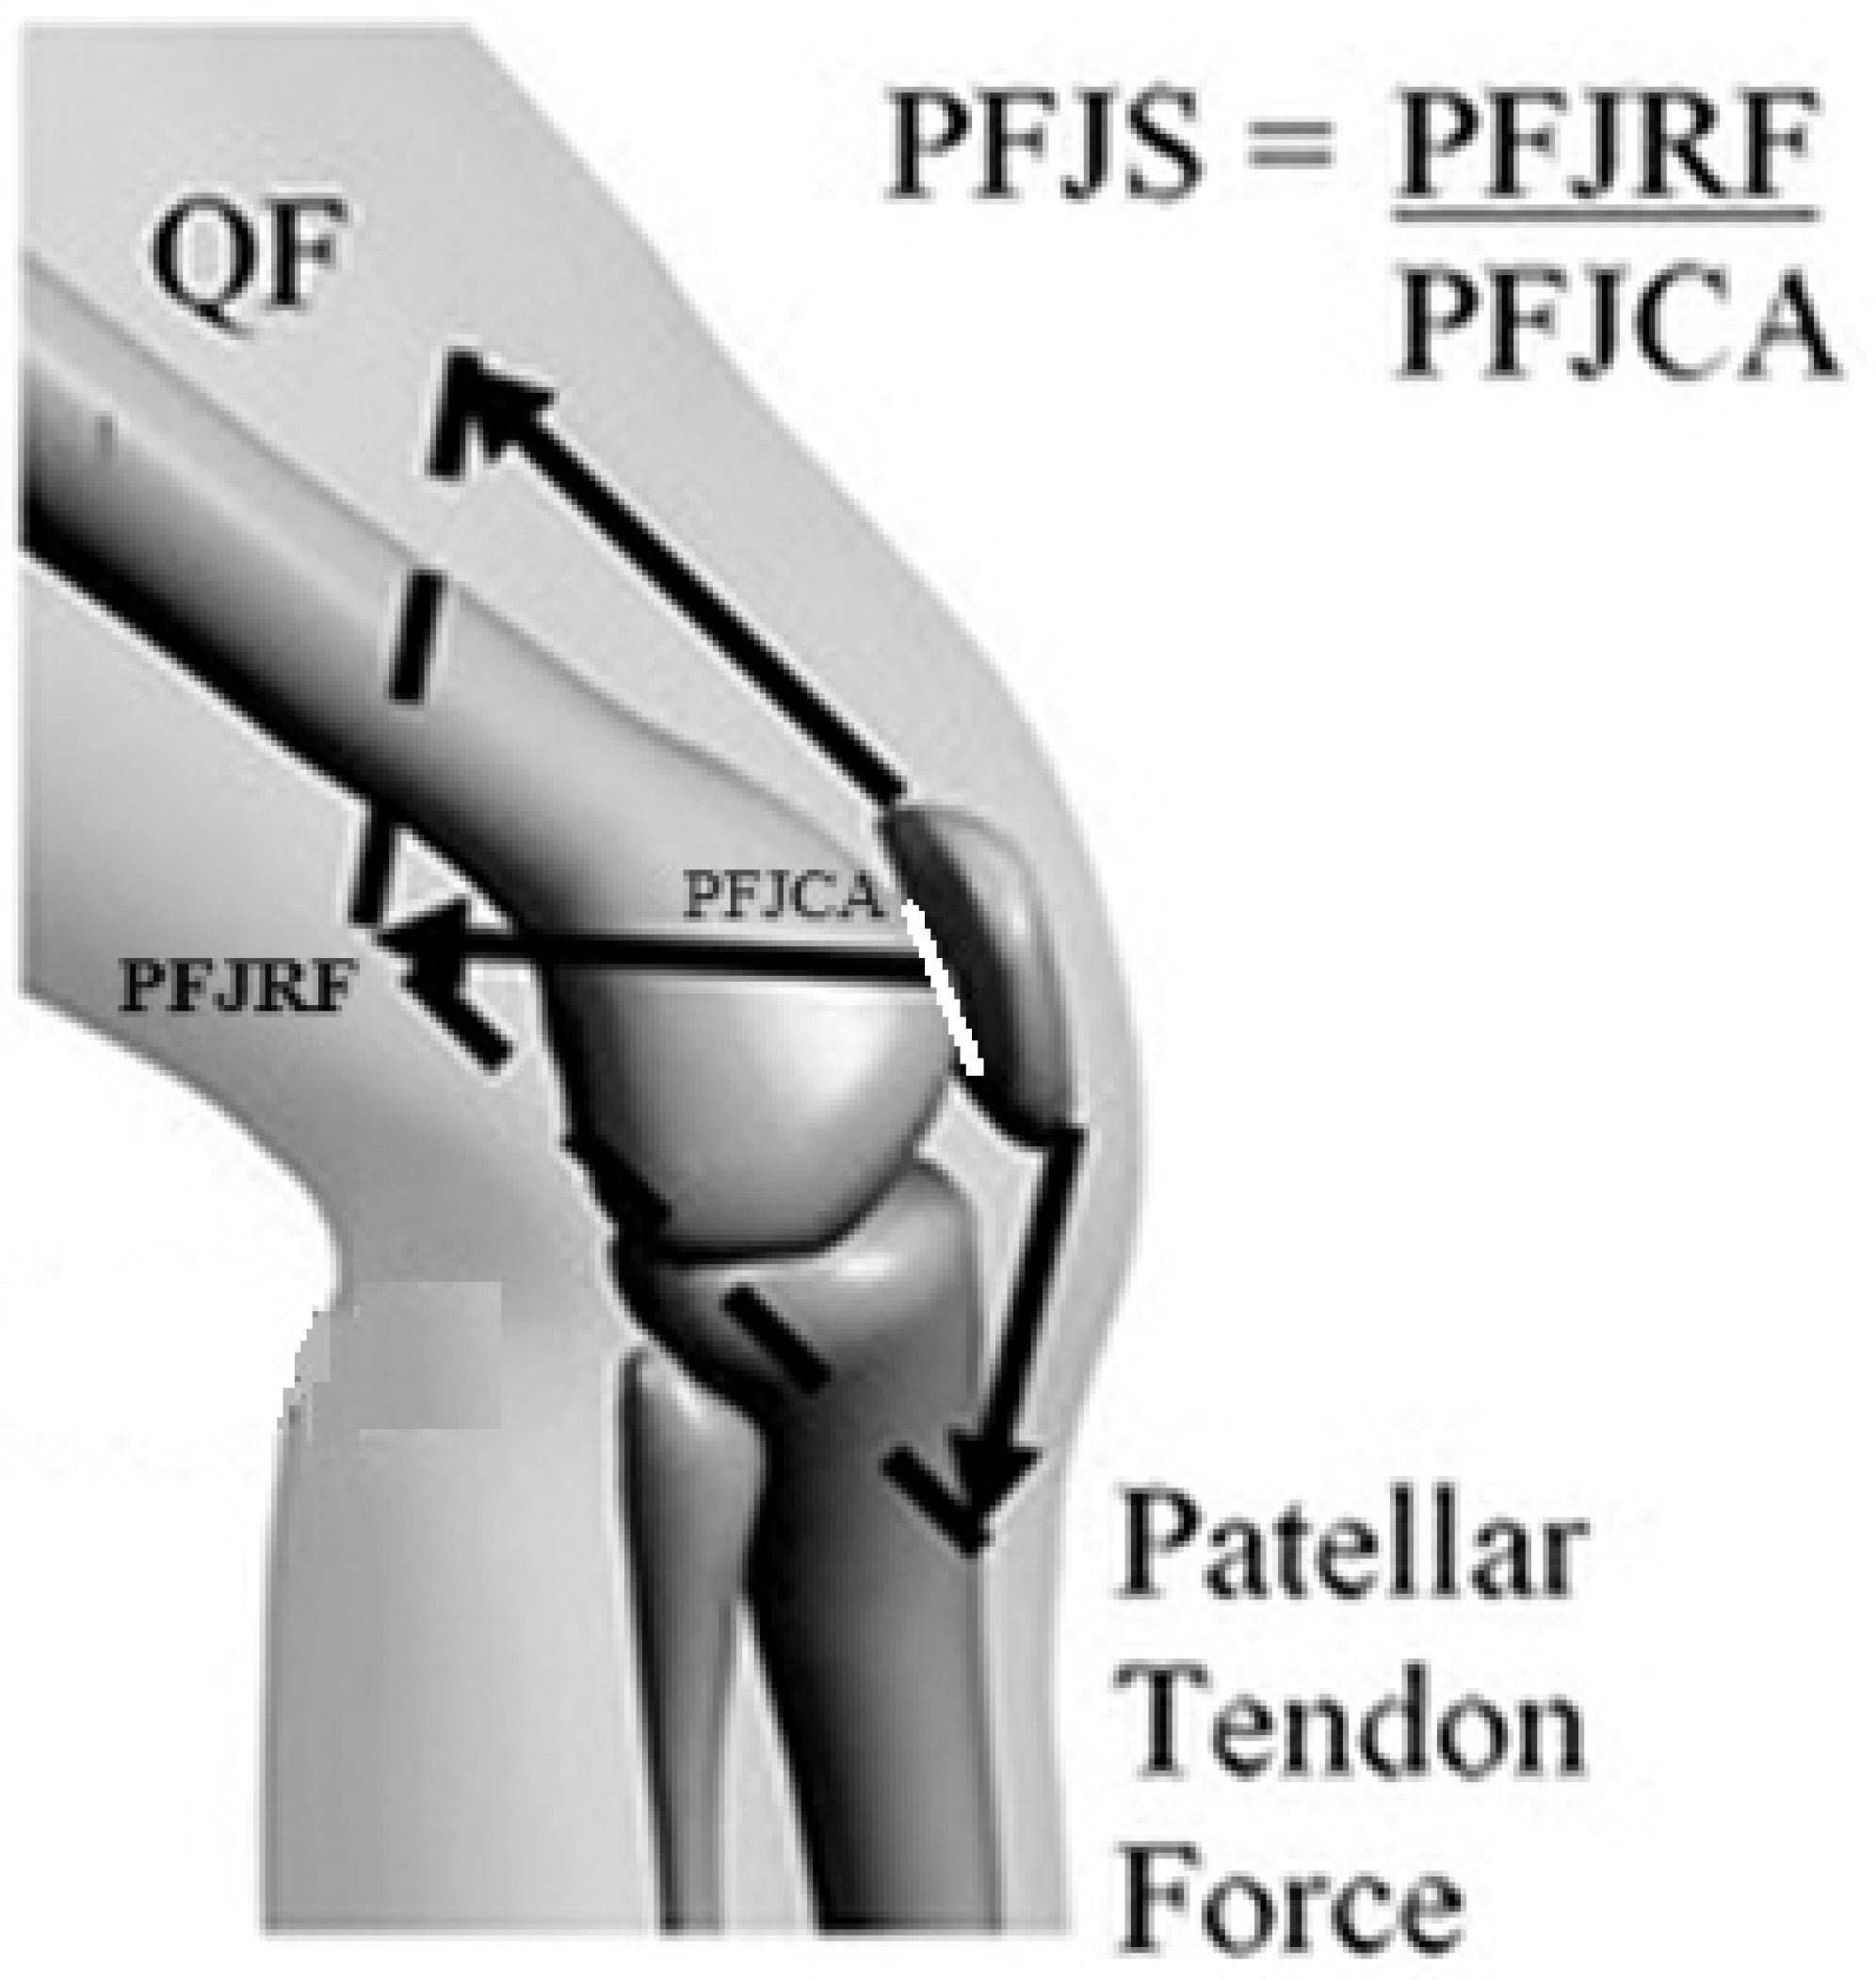
PFJS was then determined by dividing PFJRF by the position-specific patellofemoral joint contact area (Figure 4)
PFJS(x) = PFJRF(x)/Patellofemoral contact area(x)
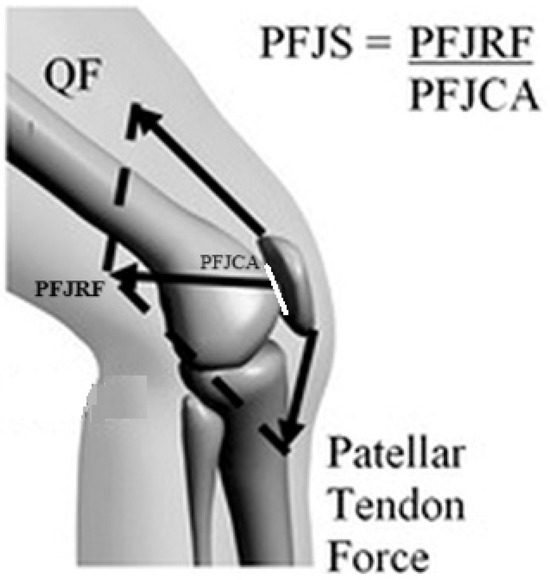
Figure 4.
Patellofemoral Joint Model. Patellofemoral joint reaction force (PFJRF), quadriceps force (QF), patellofemoral joint contact area, and patellofemoral joint stress (PFJS).
2.4. Statistical Analysis
Descriptive statistics (mean ± SD) were calculated for all dependent variables. All assumptions of normality, sphericity, and homogeneity of variances were assessed prior to analysis. Where violations occurred, Greenhouse-Geisser corrections were applied. In addition, Cohen’s d effect sizes (ES) were calculated to assess the magnitude of differences between conditions, with thresholds for interpretation as small (0.2), medium (0.5), and large (0.8).
A two-way repeated-measures multivariate analysis of variance (MANOVA) was conducted to examine the main effects and interactions between squat type (front squat [FS] vs. back squat [BS]) and squat depth (60% vs. 80% of leg length) on the dependent variables. These variables included patellofemoral joint stress (PFJS), patellofemoral joint reaction force (PFJRF), horizontal bar position relative to the heel and knee, trunk flexion angle, and knee flexion angle. The use of MANOVA was justified by the potential intercorrelations among these biomechanical variables and to control for Type I error across multiple dependent variables. When significant multivariate effects were observed, follow-up univariate repeated-measures ANOVAs were performed for each dependent variable. Bonferroni corrections were applied to adjust for multiple comparisons and control the family-wise error rate. Statistical analyses were performed using SPSS 28.0 (IBM, Aramonk, NY, USA). Alpha was set at p ≤ 0.05.
3. Results
Mean and standard deviation (SD) of variables (peak PFJS (MPa), PFJRF (BW), quadriceps force (BW), trunk and knee flexion range of motion (°), and horizontal bar position to knee and heel) and effect size comparisons between two depths are presented in Table 1.

Table 1.
Patellofemoral joint stress, patellofemoral joint reaction force, quadriceps force, knee flexion angle, trunk flexion angle, horizontal bar position relative to the knee, and horizontal bar position relative to the heel and effect size (Cohen’s d) comparison between 60% and 80% of leg length depths.
The multivariate analysis of variance (MANOVA) did not show any differences between techniques (FS/BS) (F-value = 2.46, p = 0.083) and revealed no interaction effects (F-value = 0.97, p= 0.45). However, the MANOVA showed a difference between the two squat depths (F-value = 70.18, p < 0.001). Follow-up univariate analysis indicated a greater PFJS, PFJRF, quadriceps force, trunk ROM, knee ROM, horizontal bar position to knee and heel during the 60% squad depth (p < 0.001).
The 60% leg length depth condition had 62% greater PFJS (p < 0.001), 59% greater PFJRF (p < 0.001), 58% greater quadriceps force (p < 0.001), and 38% greater knee flexion range of motion (p < 0.001). Higher depth causes a higher trunk ROM or trunk flexion by 89% (p < 0.001), a higher knee flexion by 27% (p < 0.001), a greater relative horizontal bar position to the knee (29% (p < 0.001)) and to the heel (25% (p < 0.001)) for both squat techniques.
Figure 5 shows ensemble averaged PFJS (A), quadriceps force (B), and knee flexion angle (C) during all four conditions. It seems that PFJS is at the highest during the middle part of squatting when the knee flexion angle and quadriceps force are at the highest.

Figure 5.
Ensemble average with standard deviation error bars for (A) patellofemoral joint stress (PFJS), (B) quadriceps force (QF), (C) knee flexion angle during a squatting cycle (front squat (FS) and back squat (BS)) at 60% and 80% leg length depths.
4. Discussion
Our study showed the location of applied load (FS vs. BS) did not change PFJS. However, a greater depth (60% leg length) increased the PFJS in both front and back squats. These data showed that as squat depth increases, peak PFJRF, peak knee flexion angle, and peak quadriceps force increase that results in increases in peak PFJS. There were no interaction effects between the type of squat (front/back) and squat depth, indicating the pattern of changes were not dependent on the type of squat.
In this study, the estimated patellofemoral joint stress (PFJS) ranged from approximately 14 to 24 MPa, which is consistent with previous literature using similar modeling techniques and weight-bearing squats (e.g., about 17 MPa [24] and about 25 to 35 MPa [12]). In contrast, the study by Kernozek and Gheidi (2018) [4] reported significantly lower PFJS values (~4 MPa) during unloaded squats, where participants kept their knees either behind or beyond the toes. The differences can be attributed to several factors, including variations in squat type, required knee flexion angles, and the presence or absence of external load. Squatting with added weight increases compressive forces at the joint, and likely alters the contact area, resulting in higher PFJS values [12]. Some studies align with our findings of PFJS not being different between front and back squats [9,25]. Gorsic et al. (2020) reported that knee moments were similar between BS and FS with a straight bar and transformer bar, with the exception of a greater knee moment during descending phase (the eccentric phase) of 70% of straight bar FS compared to BS [9]. In terms of muscle activity, some studies using lower loads (70% 1RM and 50 pounds) did not detect any differences between FS/BS [7,26], but higher vastus lateralis activation was reported during FS while carrying higher loads of 1RM or 90% 1RM [27,28]. Gullett et al. (2009) and Sinclair et al. (2016) both reported greater knee joint loading when performing a load of 70% 1- repetition maximum (1RM) BS compared to a FS [7,8]. Krzyszkowski and Kipp (2020), reported a higher knee extensor moment during an 80% FS 1RM than BS [10]. Specific to the patellofemoral joint, Sinclair et al. (2016) reported a statistically significant patellofemoral contact force of 4.95 +/− 2.16 times bodyweight during a BS versus 4.55 +/− 1.83 during a FS while lifting 70% of their BS 1RM [8]. The differences in patellofemoral contact force between our study and that of Sinclair et al. (2015) [8] may be attributed to several factors, including differences in participant demographics (our study included female participants), variations in modeling techniques, the use of different joint contact area estimation algorithms, and discrepancies in squat depth between the two studies. The lack of difference between techniques in our study may be explained by applying a lighter weight (20.41 kg bar) and the compensations at other joints to maintain a consistent load on the patellofemoral joint. As was expected, when the barbell is placed anterior to the neck (FS), the horizontal position of the barbell anterior to the knee had a larger magnitude compared to a BS. One might expect that the larger external moment arm during FS would require the muscles, particularly the quadriceps, to generate greater force to produce the necessary extension torque for the squat. This increased muscular force would, in turn, be expected to result in higher compressive forces and greater stress on the patellofemoral joint. However, this was not observed in our findings. Krzyszkowski and Kipp (2020) showed that the knee extensor net joint moment difference between FS and BS is higher and most apparent with greater external load (60–80% of 1RM) [10].
Our data showed that the maximum trunk flexion angle decreased during a FS. This showed a balancing effect between the horizontal position of the bar (external moment arm) and the trunk flexion angle, meaning that an increase in one variable showed a decrease in the other. Biscarini et al. (2013) examined the influence of trunk flexion angle on knee joint loads and demonstrated that decreasing the forward inclination of a Smith Squat Rack shift larger moments toward the hip rather than the knee. That study concluded that a decrease in trunk flexion angle could decrease patellar tendon force, knee torque, and compressive forces at the tibiofemoral and patellofemoral joints [29]. Other authors have reported that bar position determines trunk angle in order to balance the line of gravity over the base of support during squatting that may impact the knee external moment arm [25]. So, the implications of decreased trunk flexion angle align with our findings may show that compensatory motions at the trunk may help maintain a relatively constant PFJS. This strategy seems to compensate the technique variation and would show a consistence PFJS during carrying lower external loads [10]. Although the current study utilized a constant external load, the findings that trunk flexion angles may change with alterations to the applied load, whether it is an increased load or an increased external moment arm, support the notion that kinematic characteristics of other joints likely need to be considered to fully understand the mechanics occurring at the knee.
Increasing the depth of squat from 80% leg length to 60% of leg length resulted in an approximate 62% increase in PFJS. The location of applied load (BS vs. FS) only showed a 7% increase in PFJS. These data appear to indicate that squat depth may be the more influential factor in altering PFJS when compared to the location of applied load. Our finding is aligned with the majority of prior publications [12,14,15]. The most obvious explanation is that higher knee flexion during a deeper squat may influence PFJS. Wallace et al. (2002) and Powers et al. (2014) both showed a higher PFJS when the depth of squat is increased to 90 degrees of flexion in healthy subjects with low loading [12] or with just bodyweight [21]. Escamilla et al. (2009) reported that as relative knee flexion angle increased from 60° to 90° during a wall squat, PFJS progressively increased from approximately 4 MPa PFJS to 8 MPa [30]. Results in the present study also showed increases in PFJS (approximately 7 MPa) as squat depth increased. Other studies reported similar results of increased PFJS with increasing knee flexion angles, inferring that depth of squat appears to be directly associated with PFJS. Both Kernozek, Vannatta, and van den Bogert (2015) and Kernozek and Gheidi (2018) showed similar findings of increased PFJS and quadriceps force as the knee moved into greater flexion when analyzed using same musculoskeletal model used in our study [4,24]. It was shown that higher knee flexion during a deeper squat causes a higher PFJRF [18,19]. Bryanton et al. (2012) reported an interaction between squat depth and the amount of knee extensor (quadriceps) muscular effort. Their findings showed that decreased squat depths required less muscular effort than increased squat depths, but there was no difference at intermediate squat depths [17]. Peak PFJRF was also found to increase with peak external knee flexion moments when the knee flexion and squat depth increased [12,14,16].
There may be an interaction effect on joint loading between the magnitude of the applied load and squat depth [12,13,14]. Cotter et al. (2013) reported an increase in net peak external flexion moments from squatting to a higher depth or using a higher external load. [16]. Zavala and colleagues (2021) showed that the effects of depth (above parallel, parallel, and below parallel) on peak PFJS were different between unloaded, 50%, and 85% of depth-specific one repetition maximum conditions. It appears that PFJS increases as both resistance (no load to 50%, and 85–90% 1RM) and squat depth (above parallel, parallel, and below parallel) increase. While we used a fixed load in our study, joint loading variables increased with increasing depth in accordance with prior investigations. A future investigation may test if there is an interaction effect on joint loading between bar location and load.
Kernozek and Gheidi (2018) reported a significant difference in PFJS while squatting as anterior knee position relative to the foot changed [4]. Based on that investigation, we hypothesized that the knee position would result in a difference in PFJS between a front squat and a back squat. However, these hypotheses were not supported by the results of the present study. It has been previously reported that patellofemoral joint contact area increased with greater knee flexion as assessed by MRI imaging [31]. Patellofemoral joint contact area depends on many different factors including gender, body size, joint size, the external load, and knee flexion angle [20]. In this study, the contact area of healthy subjects during the knee flexion of 15, 30, and 45 degrees was used [23] in the regression model as function of knee angle [23]. In general, as the knee flexes, the quadriceps muscles eccentrically contract, producing a force between the patella and the femoral condyles. This force contributes to the PFJRF, with greater quadriceps muscle force [31] resulting in a greater PFJRF. The contact area between the patella and the femur is not consistent throughout the knee’s range of motion, thus the magnitude of PFJRF will vary depending on the angle of knee flexion. As the contact area between the patella and femur increases with greater knee flexion (greater squat depth), more compressive force is applied through the joint and PFJS will increase. This may explain why our study found increased PFJS with greater squat depth.
This study is not without limitations. The first is that the external applied load may have been insufficient to create a significant difference in patellofemoral joint loads and stress between the front and back squat. Our study did not include a bodyweight-only condition that could be used as a reference. Within this study’s sample, the load was consistent for all the participants, potentially creating variability in exertional intensities across participants. However, we utilized a repeated measures design, therefore, the comparisons were likely relevant across the different squat types. A final limitation is the effect of potential fatigue on the participants’ performance. For instance, due to incorrect adherence to the protocol, some participants had to perform multiple trials to meet study’s criteria, so results of the later trials performed by these individuals may have been influenced by muscle fatigue. Further research may be warranted to normalize the amount of applied load relative to the participants 1 RM, or to allow for more skilled practice to minimize trial repetitions due to inconsistency. Future studies could also incorporate electromyography (EMG) to gain a deeper understanding of muscle activation patterns.
5. Conclusions
As shown, PFJRF and PFJS are affected by many factors, the most significant of which appears to be squat depth while carrying a lighter external load. Interestingly, the squat technique (FS/BS) did not influence the amount of PRJRF or PFJS. Changes in bar or trunk position while performing either type of squat influence the horizontal center of pressure (COP) location, which can result in similar quadriceps forces and knee positions, leading to similar PJF joint force and stress between squat types. Based on these findings, the manipulation of squat depth, rather than the location of the applied load, may be the more important factor influencing patellofemoral pain associated with PFJS.
Author Contributions
Conceptualization, methodology, T.K. and N.G.; software and validation, T.K.; data collection and data processing, N.G., R.K., M.B., A.R. and T.K.; writing—original draft preparation, N.G., R.K., M.B., A.R., B.W. and T.K.; writing—review and editing, N.G., T.K. and B.W.; supervision, N.G. and T.K.; project administration, T.K. All authors have read and agreed to the published version of the manuscript.
Funding
This research received no external funding.
Institutional Review Board Statement
The study was conducted in accordance with the Declaration of Helsinki, and approved by the Institutional Review Board of University of Wisconsin-La Crosse.
Informed Consent Statement
Informed consent was obtained from all subjects involved in the study.
Data Availability Statement
The data presented in this study are available upon request from the corresponding author.
Acknowledgments
The authors wish to thank the University of Wisconsin-La Crosse Office of Graduate Studies for their support of the project in the form of a Graduate Student Research, Service and Educational Leadership Grant.
Conflicts of Interest
The authors declare no conflicts of interest.
Abbreviations
| MPa | megapascal |
| SD | standard deviation |
| EMG | electromyography |
| COP | center of pressure |
| m | meter |
| DOF | degree of freedom |
| BW | body weight |
| PFJRF | patellofemoral joint reaction force |
| PFJS | patellofemoral joint stress |
| FS | front squat |
| BS | back squat |
References
- Vannatta, C.N.; Kernozek, T.W. Patellofemoral joint stress during running with alterations in foot strike pattern. Med. Sci. Sports Exerc. 2015, 47, 1001–1008. [Google Scholar] [CrossRef] [PubMed]
- Loudon, J.K. Biomechanics and pathomechanics of the patellofemoral joint. Int. J. Sports Phys. Ther. 2016, 11, 820–830. [Google Scholar] [PubMed]
- Bieryla, K.A.; Anderson, D.E.; Madigan, M.L. Estimations of relative effort during sit-to-stand increase when accounting for variations in maximum voluntary torque with joint angle and angular velocity. J. Electromyogr. Kinesiol. 2009, 19, 139–144. [Google Scholar] [CrossRef] [PubMed]
- Kernozek, T.W.; Gheidi, N.; Zellmer, M.; Hove, J.; Heinert, B.L.; Torry, M.R. Effects of Anterior Knee Displacement During Squatting on Patellofemoral Joint Stress. J. Sport Rehabil. 2018, 27, 237–243. [Google Scholar] [CrossRef]
- Nunes, G.S.; Scattone Silva, R.; Dos Santos, A.F.; Fernandes, R.A.S.; Serrão, F.V.; de Noronha, M. Methods to assess patellofemoral joint stress: A systematic review. Gait Posture 2018, 61, 188–196. [Google Scholar] [CrossRef]
- Fry, A.C.; Smith, J.C.; Schilling, B.K. Effect of knee position on hip and knee torques during the barbell squat. J. Strength Cond. Res. 2003, 17, 629–633. [Google Scholar] [CrossRef]
- Gullett, J.C.; Tillman, M.D.; Gutierrez, G.M.; Chow, J.W. A biomechanical comparison of back and front squats in healthy trained individuals. J. Strength Cond. Res. 2009, 23, 284–292. [Google Scholar] [CrossRef]
- Sinclair, J.; Atkins, S.; Kudiersky, N.; Taylor, P.J.; Vincent, H. Effects of front and back squat techniques on patellofemoral joint kinetics in males. J. Biomed. Eng. Inform. 2015, 2, 76. [Google Scholar] [CrossRef]
- Goršič, M.; Rochelle, L.E.; Layer, J.S.; Smith, D.T.; Novak, D.; Dai, B. Biomechanical comparisons of back and front squats with a straight bar and four squats with a transformer bar. Sports Biomech. 2020, 23, 166–181. [Google Scholar] [CrossRef]
- Krzyszkowski, J.; Kipp, K. Load-dependent mechanical demands of the lower extremity during the back and front squat. J. Sports Sci. 2020, 38, 2005–2012. [Google Scholar] [CrossRef]
- Braidot, A.A.; Brusa, M.H.; Lestussi, F.E.; Parera, G.P. Biomechanics of front and back squat exercises. J. Phys. Conf. Ser. 2007, 90, 012009. [Google Scholar] [CrossRef]
- Wallace, D.A.; Salem, G.J.; Salinas, R.; Powers, C.M. Patellofemoral joint kinetics while squatting with and without an external load. J. Orthop. Sports Phys. Ther. 2002, 32, 141–148. [Google Scholar] [CrossRef] [PubMed]
- Salem, G.J.; Powers, C.M. Patellofemoral joint kinetics during squatting in collegiate women athletes. Clin. Biomech. 2001, 16, 424–430. [Google Scholar] [CrossRef] [PubMed]
- Zavala, L.; Flores, V.; Cotter, J.A.; Becker, J. Patellofemoral joint kinetics in females when using different depths and loads during the barbell back squat. Eur. J. Sport Sci. 2021, 21, 976–984. [Google Scholar] [CrossRef]
- Powers, C.M.; Ho, K.Y.; Chen, Y.J.; Souza, R.B.; Farrokhi, S. Patellofemoral joint stress during weight-bearing and non-weight-bearing quadriceps exercises. J. Orthop. Sports Phys. Ther. 2014, 44, 320–327. [Google Scholar] [CrossRef]
- Cotter, J.A.; Chaudhari, A.M.; Jamison, S.T.; Devor, S.T. Knee joint kinetics in relation to commonly prescribed squat loads and depths. J. Strength Cond. Res. 2013, 27, 1765–1774. [Google Scholar] [CrossRef]
- Bryanton, M.A.; Kennedy, M.D.; Carey, J.P.; Chiu, L.Z.F. Effect of squat depth and barbell load on relative muscular effort in squatting. J. Strength Cond. Res. 2012, 26, 2820–2828. [Google Scholar] [CrossRef]
- Reilly, D.T.; Martens, M. Experimental analysis of the quadriceps muscle force and patello-femoral joint reaction force for various activities. Acta Orthop. Scand. 1972, 43, 126–137. [Google Scholar] [CrossRef]
- Dahlkvist, N.J.; Mayo, P.; Seedhom, B.B. Forces during squatting and rising from a deep squat. Eng. Med. 1982, 11, 69–76. [Google Scholar] [CrossRef]
- Hartmann, H.; Wirth, K.; Klusemann, M. Analysis of the Load on the Knee Joint and Vertebral Column with Changes in Squatting Depth and Weight Load. Sports Med. 2013, 43, 993–1008. [Google Scholar] [CrossRef]
- Heino Brechter, J.; Powers, C.M. Patellofemoral stress during walking in persons with and without patellofemoral pain. Med. Sci. Sports Exerc. 2002, 34, 1582–1593. [Google Scholar] [CrossRef]
- van Eijden, T.M.; Kouwenhoven, E.; Verburg, J.; Weijs, W.A. A mathematical model of the patellofemoral joint. J. Biomech. 1986, 19, 219–229. [Google Scholar] [CrossRef]
- Connolly, K.D.; Ronsky, J.L.; Westover, L.M.; Küpper, J.C.; Frayne, R. Differences in patellofemoral contact mechanics associated with patellofemoral pain syndrome. J. Biomech. 2009, 42, 2802–2807. [Google Scholar] [CrossRef] [PubMed]
- Kernozek, T.W.; Vannatta, C.N.; van den Bogert, A.J. Comparison of two methods of determining patellofemoral joint stress during dynamic activities. Gait Posture 2015, 42, 218–222. [Google Scholar] [CrossRef] [PubMed]
- Russell, P.J.; Phillips, S.J. A preliminary comparison of front and back squat exercises. Res. Q. Exerc. Sport 1989, 60, 201–208. [Google Scholar] [CrossRef]
- Stuart, M.J.; Meglan, D.A.; Lutz, G.E.; Growney, E.S.; An, K.N. Comparison of intersegmental tibiofemoral joint forces and muscle activity during various closed kinetic chain exercises. Am. J. Sports Med. 1996, 24, 792–799. [Google Scholar] [CrossRef] [PubMed]
- Yavuz, H.U.; Erdag, D. Kinematic and Electromyographic Activity Changes during Back Squat with Submaximal and Maximal Loading. Appl. Bionics Biomech. 2017, 2017, 9084725. [Google Scholar] [CrossRef]
- Yavuz, H.U.; Erdağ, D.; Amca, A.M.; Aritan, S. Kinematic and EMG activities during front and back squat variations in maximum loads. J. Sports Sci. 2015, 33, 1058–1066. [Google Scholar] [CrossRef]
- Biscarini, A.; Botti, F.M.; Pettorossi, V.E. Joint torques and joint reaction forces during squatting with a forward or backward inclined Smith machine. J. Appl. Biomech. 2013, 29, 85–97. [Google Scholar] [CrossRef]
- Escamilla, R.F.; Zheng, N.; Macleod, T.D.; Edwards, W.B.; Imamura, R.; Hreljac, A.; Fleisig, G.S.; Wilk, K.E.; Moorman, C.T.; Andrews, J.R. Patellofemoral joint force and stress during the wall squat and one-leg squat. Med. Sci. Sports Exerc. 2009, 41, 879–888. [Google Scholar] [CrossRef]
- Besier, T.; Draper, C.; Gold, G.; Beaupre, G.; Delp, S. Patellofemoral joint contact area increases with knee flexion and weight-bearing. J. Orthop. Res. 2006, 23, 345–350. [Google Scholar] [CrossRef]
Disclaimer/Publisher’s Note: The statements, opinions and data contained in all publications are solely those of the individual author(s) and contributor(s) and not of MDPI and/or the editor(s). MDPI and/or the editor(s) disclaim responsibility for any injury to people or property resulting from any ideas, methods, instructions or products referred to in the content. |
© 2025 by the authors. Licensee MDPI, Basel, Switzerland. This article is an open access article distributed under the terms and conditions of the Creative Commons Attribution (CC BY) license (https://creativecommons.org/licenses/by/4.0/).

