Abstract
This research aimed to develop a comprehensive decision-making model for road rehabilitation, with the goals of extending pavement service life, minimizing major repairs, and improving the efficiency of investment and resource planning. The proposed methodology integrates structural condition, functional performance, and total economic value across the pavement lifecycle. It enables engineers and road managers to make informed decisions based on structural capacity, functional performance, asset value, and optimized rehabilitation strategies. The model was validated through case studies using data from Central European roads and accelerated pavement testing. It compared conventional and high-modulus asphalt overlays of equal thickness, demonstrating that a 3000 MPa increase in modulus extended residual life by over 30% and raised structural value by EUR 5.8/m2. This approach enhances planning and prioritization of rehabilitation activities, supports the use of higher-quality materials, reduces lifecycle costs and CO2 emissions, and facilitates integration with asset management systems. By linking pavement design, performance prediction, and asset management, the model supports strategic decision-making under performance and budget constraints.
1. Introduction
Processing the service life of the pavement at the required level is crucial, considering that the pavement materials embedded within the pavement structure gradually lose their original properties due to traffic loads and climatic conditions. The resulting loss of structural integrity and pavement serviceability requires a sustainable approach through technically and economically efficient rehabilitation methods.
To maximize pavement service life at minimal cost and make informed decisions regarding the use of reinforcing overlays or complete reconstruction using new or recycled materials, a comprehensive decision process is indispensable. This process prioritizes various factors, including the condition of the pavement and its subsystems, such as the structural pavement condition, pavement serviceability, calculation of pavement asset value, economic assessment, and optimization of pavement rehabilitation.
Structural pavement condition refers to the pavement’s ability to withstand traffic loads and represents its current state relative to its pristine condition. It is represented by the residual structural life as a proportion of the design life. The demand for a precise expression of the structural pavement condition led to the development of a new methodology, which determines the pavement’s residual structural life and its ratio to the design life using analytical–experimental measurements and calculations. The method for calculating residual structural life is based on a mathematical model of a layered elastic half-space and fatigue experimental tests. To apply this equation in determining residual structural life, it is necessary to ascertain the actual modulus of elasticity and strength, particularly in the base course of the pavement. These values are estimated during the evaluation of pavement load-bearing capacity using a falling weight deflectometer [1,2]. The falling weight deflectometer imparts an impact on the pavement, eliciting a flexible response in the form of a deflection bowl. The configuration of this bowl reveals the deflection measurements from individual sensors affixed to the pavement at specific distances from the impact point. Through a process referred to as back-calculation [3,4], the actual modulus of elasticity for each pavement layer is computed within a layered elastic half-space model [5,6,7]. Subsequently, based on the modulus of elasticity, the stresses in the pavement layers are determined [8,9,10,11]. Following the calculation of the stresses and strains in the pavement structure in its actual condition, it is then possible to calculate the residual life based on experimentally obtained fatigue parameters of asphalt concrete pavement materials, as defined by the European standard [12,13].
Pavement serviceability refers to the pavement’s ability to provide a safe, economical, and comfortable ride and traffic quality. Pavement serviceability is expressed in terms of roughness and surfacing damage. Roughness and surfacing damage may not always be related to the bearing capacity of the pavement and can often be repaired with thin overlays. However, roughness is generally linked to the overall pavement structure and its bearing capacity. Therefore, it is necessary to assess pavement condition based on the level of bearing capacity. The evaluation includes longitudinal and transverse unevenness and their impact on vehicle operating costs and travel time costs. To derive reliable mathematical deterioration functions, accurately measured real pavement degradation data must be obtained either through analytical and experimental tests conducted in an advanced accelerated pavement testing facility or by analyzing long-term pavement performance data collected through rigorous diagnostic procedures and stored in a road asset inventory. The progression of these adverse changes can be mathematically expressed through degradation functions known as pavement performance models [14,15,16,17,18,19,20].
The degradation function for unevenness can be defined based on experimental tests or long-term diagnostic measurements carried out by the road administrator throughout the pavement lifecycle (20+ years). The pavement performance model is influenced by the type of asphalt binder used—such as polymer-modified, unmodified, or recycled binders—as each exhibits distinct aging, stiffness, and fatigue characteristics under traffic and environmental loads. Similarly, the choice of aggregates, including their size, shape, mineral composition, and resistance to fragmentation and polishing, plays a crucial role in the rate and nature of surface degradation. These material-specific factors directly affect the pavement’s ability to resist rutting, cracking, and settlement, thereby shaping the overall progression of unevenness over time [21,22,23,24].
Rigorous data collection policies, along with effective data management and evaluation practices, are essential for the development of pavement performance models and road asset management systems [25,26,27].
Experimental measurements of actual pavements using accelerated pavement testing facilities can serve to supplement, or ideally substitute, the long-term pavement performance monitoring, particularly because pavement deterioration models are dependent on external boundary conditions such as temperature, humidity, and loading frequency. This critical dependence has been extensively studied not only by the authors in prior work [28,29,30] but also broadly within the pavement research community, as documented in numerous studies on environmental and mechanical degradation mechanisms [31,32].
Given the inherent variability in how boundary conditions affect pavement behavior, it is essential that performance models use locally calibrated deterioration functions to improve prediction accuracy.
The initial definitions and implementation of pavement asset value in road network management, based on objective data, information systems, and decision-making processes, were presented in [33,34,35,36]. The importance of pavement and road assets in relation to service standards and societal utility has been documented in [37,38,39]. Pavement asset value can also be defined as an integrated system-based approach focused on achieving optimal asset condition and utilization, including risk assessment, using a holistic perspective. Pavement asset value must be assessed within a framework using objective and measurable indicators that reflect the value and performance of assets across the full range of their benefits and technical condition [40,41,42,43,44,45]. With the use of reliable and precisely defined deterioration trends in pavement serviceability parameters, it is possible to predict changes in asset value over time using pavement rehabilitation programs [46,47,48,49,50,51,52,53]. Consequently, road network funding policies can be evaluated based on the net increase or decrease in the value of the road network. Investments in development, rehabilitation, and improvement projects can be assessed and optimized through cost–benefit analyses (CBA) [54,55,56,57,58]. The allocation and optimal use of funds can then be achieved through optimization-based decision-making methods, such as the cross-asset allocation method [59,60,61,62,63,64].
2. Materials and Methods
Decision Process Model
The proposed pavement service life decision process algorithm, shown in Figure 1, is designed to include the necessary subsystems to maintain the required pavement service life. It is based on calculations of pavement structural condition, derived from residual structural life, and the progression of pavement serviceability, based on preventing unnecessary deterioration. These elements are integrated into the pavement asset value calculation. Since pavement is part of the road and the broader road network, the road asset value should also be included in the process. Finally, the algorithm incorporates economic assessment and optimization of rehabilitation. The outputs are pavement and road rehabilitation programs, constrained by limited financial resources and funding eligibility requirements.
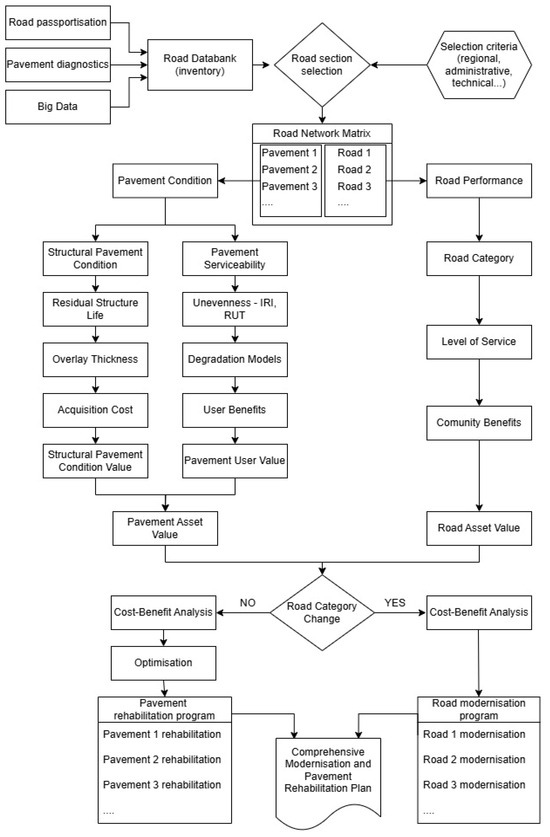
Figure 1.
Pavement service life decision process algorithm.
While Big Data is shown in the flowchart as a potential input, the presented methodology primarily relies on conventional data sources available in road inventory databases maintained by road authorities. The mention of Big Data reflects anticipated future developments rather than current implementation.
As evident from the pavement asset value calculations, it is essential to know the rate of pavement deterioration, which is determined using the structural pavement condition. This condition is expressed by calculating the structural life expectancy and its ratio to the design life. From the perspective of pavement design, the residual service life is a crucial parameter.
To calculate the structural life expectancy, the crack initiation criterion is used, in accordance with the design methods for flexible and semi-rigid pavements. This criterion ensures that the radial stress at the bottom edge of the base course remains below its critical material strength. This condition can be expressed as an inequality, shown in Equation (1) [64,65]:
where σr,I denotes radial stress at the bottom of the base course during period “i” when subjected to the design axle load in MPa; Ri,I is the computed flexural tensile strength value of the base course material being assessed under the conditions in period “i” in MPa, and SN is the fatigue coefficient.
When designing a new pavement, Equation (1) is applied as standard, as the material characteristics are defined by standard parameters—namely, the modulus of elasticity and Poisson’s ratio. The challenge arises when calculating stresses for older, in-service pavements. In such cases, the back-calculation method must be used, based on falling weight deflectometer (FWD) measurements and a numerical elastic deformation model in a layered elastic half-space. The output of the back-calculation method is the actual elastic moduli of the surfacing course, base course, subgrade, and subsoil. When these values are substituted into Equation (2) [64,65], the real current radial stress data are obtained.
The actual calculation of structural life expectancy is based on fatigue coefficients, denoted as coefficients ‘a’ and ‘b’ in the following equation. To derive these coefficients, it is essential to experimentally determine the parameters that define fatigue characteristics, representing the pavement’s resilience to repetitive loading. In this test, a sample of the pavement surfacing layer is subjected to repeated bending. The results are presented in a Wöhler diagram, as shown in Figure 2 and Figure 3. Radial stress and strength resiliency values in ACM layers based on DAL are shown in Table 1.
where ε0j is the maximal amplitude of proportional deformation in the initial phase of measurement; a, b are fatigue parameters that define the stress lines coefficient over a range of “N”, and N is the number of load repetitions.
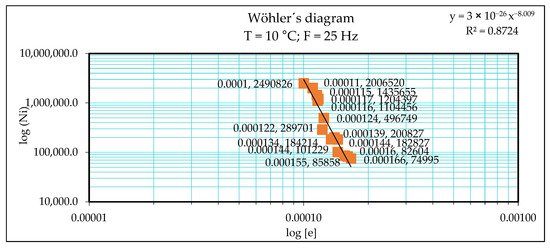
Figure 2.
Wohler diagram AC16-L base course (bitumen grade 50/70).
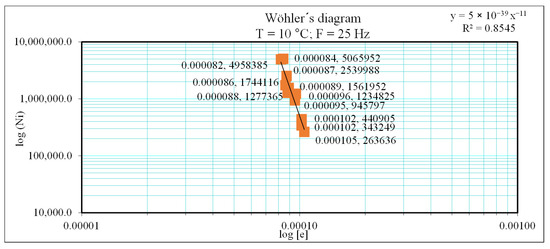
Figure 3.
Wohler diagram AC16-L base course (bitumen grade 50/70 with the recyclate).

Table 1.
Radial stress and strength resiliency values in ACM layers based on DAL.
The maximum number of design axle load repetitions that the pavement can endure can be calculated via Equation (3) [66]:
where DAL denotes design axle load repetitions; ε6 is the average deformation derived from the fatigue curve after 1.0 mil. loading cycles in µm/m; εj is the relative deformation on the bottom of a base course calculated with actual elastic moduli values, is the reliability factor of the fatigue test, and B is the falling gradient of the fatigue line.
If the residual life is calculated, it is already possible to calculate the necessary overlay thickness as a newly designed layer so that the stresses correspond to the values according to Equation (1).
3. Case Study Calculation
To achieve the necessary pavement asset value, it is preferable to employ environmentally friendly technologies that utilize recycled materials. As an illustration, the structural life expectancy calculation based on pavement design is shown in Figure 4, which features an asphalt concrete (AC) cover material incorporating recycled materials. Deformation characteristics for paving materials are listed in Table 2. The complex modulus of the surfacing material is measured at different frequencies, as shown in Table 3.
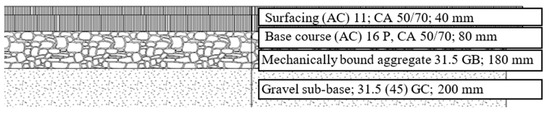
Figure 4.
Pavement cross-section.
Table 2.
Deformation characteristics of pavement cross-section.
Table 3.
Complex modulus of AC11 measured at different frequencies.
The resulting parameters are expressed in the Wohler diagram shown in Figure 2 and Figure 3. Both diagrams were obtained using the two-point (2PT) bending test under controlled conditions of a temperature of 10 °C and a loading frequency of 25 Hz. All tests were conducted on the same equipment and followed identical standard procedures, in accordance with [12]. The ε6 value, which represents the strain ratio of the samples after 106 loading cycles, reveals a 23% difference between the two mixtures.
For the pavement presented in this case study, the fatigue parameters—determined using the methods described in this section—are shown in Table 4. Its structural life expectancy was computed to be 1.4 × 10⁶ design axle loads for the new mixture and 1.1 × 10⁶ design axle loads for the recycled mixture.
For a more accurate structural life expectancy calculation, specimens taken directly from the pavement and cut to the required test dimensions can be used to determine the fatigue characteristics.
3.1. Pavement Unevenness Deterioration
The progression of unevenness deterioration can be mathematically described using degradation models. These models serve as the cornerstone of asset valuation, as they can predict the technical condition of individual assets within a road network.
Mathematically derived degradation functions are employed to predict pavement serviceability throughout its service life. These functions express changes in surface characteristics over time or, preferably, in relation to load cycles. The general shape of the degradation function illustrates the relationship between the relative value of a surface characteristic and either time or the number of load repetitions. Degradation models can be derived through experimental testing on an accelerated pavement testing (APT) facility shown in Figure 5, which simulates traffic loads and climatic parameters at a 1:1 ratio on a test pavement section. Alternatively, they can be developed based on long-term measurements of existing pavements using data archived in road inventories collected over the past 20 years. In our research, we applied both methods, so the degradation functions presented in this study were fitted using data obtained from APT experiments and long-term pavement monitoring, with model accuracy assessed through standard regression diagnostics such as R2 values to ensure adequate representation of observed deterioration trends.
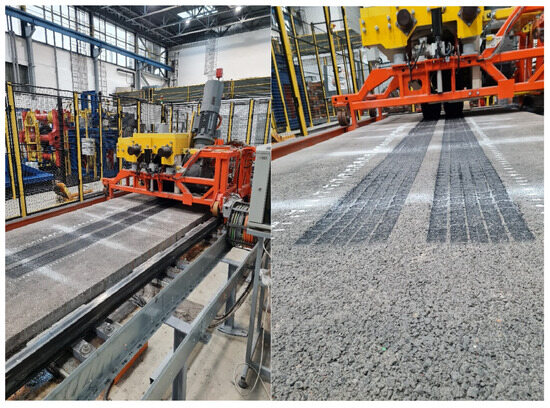
Figure 5.
APT facility.
Measurements of transverse and longitudinal unevenness, skid resistance, and macro-texture were taken every 100,000 load cycles. Figure 6 illustrates the evaluation of transverse unevenness (RUT).
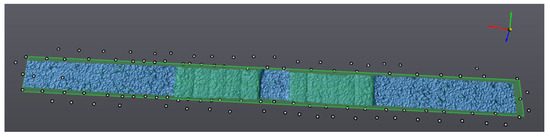
Figure 6.
Transverse evaluation of track depth measured by the Bibus scanner (RUT).
Unevenness is measured using profile levelling combined with a Bibus VX element scanner, which creates a highly accurate 3D point cloud scan (with precision up to 0.1 mm). Before each scanner measurement, contrast powder paint is applied to the pavement surface to enhance imaging, and positioning targets are placed to enable the handheld scanner to determine the point cloud’s position. The scanner outputs both transverse and longitudinal unevenness measurements, as shown in Figure 6 and Figure 7.
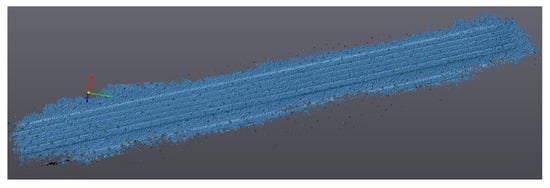
Figure 7.
Longitudinal evaluation of track depth measured by the Bibus scanner (IRI).
The mathematical expression of the derived transverse unevenness is given in Figure 8.
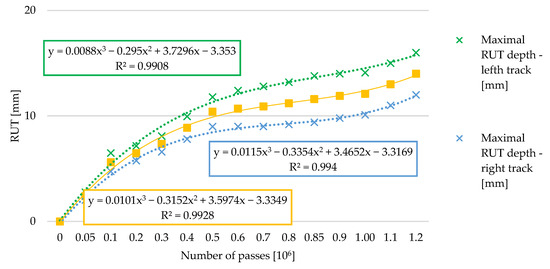
Figure 8.
Evaluation of track depth in relation to the number of passes with different functions.
3.2. Longitudinal Unevenness IRI
Longitudinal unevenness analysis is based on long-term measurements conducted through the road inventory. Long-term pavement performance monitoring has been carried out since 1998 across a road network exceeding 18,000 km in length. These data were used to derive polynomial degradation functions for semi-rigid pavements on arterial roads, specifically validated for Central European climate conditions (Table 5).
Table 5.
Climate zone in which the presented deterioration functions apply.
Measurements were obtained using the PROFILOGRAPH GE system, whose outputs enable mathematical derivation of both longitudinal and transverse roughness functions. Longitudinal roughness is quantified through the international roughness index (IRI), calculated according to Equation (4) [64]:
where Ti is the arithmetical average value of Ti ordinates, and N is the number of measurements.
The degradation function derived from long-term IRI measurements, showing the relationship between IRI values and design axle loads (DALs), is presented in Equation (5):
3.3. Road Asset Value
In addition to pavement condition, asset value is also related to width, direction, and elevation characteristics, which are expressed through road category classification. Therefore, to ensure comprehensiveness, the calculation of road asset value should incorporate these factors. The road asset value calculation comprises road asset performance and pavement asset condition.
For road asset performance, the value depends on the level of service associated with the road category and the value of community benefits provided. For pavement asset condition, the value depends on structural pavement condition, pavement serviceability, and road user costs.
Road asset performance evaluation compares existing road parameters with required (designed or improved) parameters, considering both the level of service and societal benefits in terms of network performance for all road asset states. Pavement asset condition assessment utilizes calculations of structural pavement condition and pavement serviceability deterioration. The current asset value is determined by adjusting the present value using the ratio of remaining residual life to the pavement’s design life.
3.4. Road Asset Performance Value
Road asset performance is determined by the road category level of service and community benefits. The desired road category is defined; subsequently, the value of road asset performance is calculated as the ratio between the acquisition costs of the road asset in its current category and the acquisition cost of a road asset in the desired road category (Equation (6)):
where RCLS is the road category level of service index in %, RCcc denotes the acquisition costs of the road asset in its current category in EUR, and ACdc denotes the acquisition cost of road assets in the projected road category in EUR.
For community benefits, the value of the current category relative to the desired category can be quantified as the ratio of net community benefits provided by the road asset in its current category to net community benefits provided by the road asset in its desired category (Equation (7)):
where CB is the community benefits index in %, NCBcc is the net community benefits of the road asset in its current category in EUR, and NCBdc is the net community benefits of the road asset in the desired road category in EUR.
3.5. Pavement Asset Condition Value
The calculation of the pavement asset condition value is based on both structural pavement condition and pavement serviceability. Structural pavement condition considers the pavement’s ability to withstand traffic loads, expressed as both the number of design axle passes it can sustain before reaching the failure threshold and its structural service life measured in years. Pavement serviceability measures the condition of pavement surface characteristics to ensure safe and economical vehicle operation in the pavement’s current state of deterioration.
3.6. Structural Pavement Condition Value
The structural pavement condition value is a financial metric calculated as the ratio of the current pavement’s structural life expectancy to the predicted life of a desired pavement, multiplied by the acquisition cost based on current prices (Equation (8)):
where SPCV is the structural pavement condition value, ACNP is the acquisition cost based on present prices in EUR, RSL is the structural life expectancy of a current pavement in years, and DSL is the design life of the desired pavement in years.
Additionally, the structural pavement condition can be expressed as a ratio between the acquisition costs of the road asset in its current structural pavement condition and the acquisition cost of a road asset in the desired structural pavement condition (Equation (9)):
where SPCI is the structural pavement condition index in %, RCcspc is the acquisition costs of the road asset in its current structural pavement condition in EUR, and ACdspc is the acquisition cost of a road asset in the desired structural pavement condition in EUR.
3.7. Pavement User Value
The pavement user value represents an economic measure of the value generated by the pavement asset through its ability to fulfil required operational functions for road users. This value is calculated as the ratio between the net road user benefits provided by the pavement in its current serviceability state and the net road user benefits provided by the pavement at its desired serviceability level. The pavement user value is quantified through the pavement user value index (Equation (10)):
where PUV is the pavement user value index in %, NRUBcs denotes net road user benefits of pavement in its current serviceability in EUR, and NRUBdps denotes net road user benefits of pavement in the desired pavement serviceability in EUR.
3.8. Road Asset Value Calculation
The road asset value, shown in Equation (11), represents the total value of the road asset, accounting for both its current category and structural pavement condition value:
where RAV is the road asset value in EUR, RCcc denotes the acquisition cost of the road asset in its current category in EUR, ACNP denotes the acquisition cost of pavement based on present prices in EUR, RSL is the structural life expectancy of the current pavement in years, and DSL is the design life of the desired pavement in years.
The capital investment required to achieve a desired road asset value depends on the rehabilitation or improvement costs needed to bring the road asset to its target performance and serviceability standards. When the existing road asset has salvage value, this amount can be deducted from the required investment. For example, if the road pavement retains sufficient bearing capacity, the following process applies: First, calculate its structural life expectancy; then design either an overlay or mill-and-replace rehabilitation to meet the desired service life requirements for new pavement. The overlay thickness design utilizes the structural life expectancy of both the road structure and its materials, enabling road authorities to optimize capital costs while achieving the target asset value.
4. Case Studies: Impact on Pavement Asset Value Modeling
Because pavement asset value is implemented in economic analyses and rehabilitation program optimization, it becomes necessary to analyze the effects of paving material quality and layer thickness on structural life extension and, consequently, the structural pavement condition value. It is equally important to analyze how different unevenness degradation functions affect the pavement user value.
4.1. Structural Life Extension
Residual structural life can be calculated based on stress analysis using the numerical elastic half-space model method along with Equations (2) and (3). Structural life extension can be modeled by adjusting rehabilitation parameters such as overlay thickness and material quality. The overlay material may match the existing surface material, with the required thickness calculated accordingly. Alternatively, using a material with a higher modulus of elasticity can extend the residual life. The structural pavement condition value, which considers alternative overlay thicknesses, different moduli of elasticity, residual life extension, and rehabilitation costs, is presented in Table 6. These values were calculated using Equation (5) and represent relative values per square meter of the pavement. The current acquisition cost of the pavement structure was estimated at EUR 43.97 per m2.
Table 6.
Structural life extension in relation to the different overlay thicknesses.
Figure 9 presents the analysis of total calculated deformation at the bottom edge of bound pavement layers. The results demonstrate a linear relationship between the complex modulus and deformation at the base course’s bottom edge.
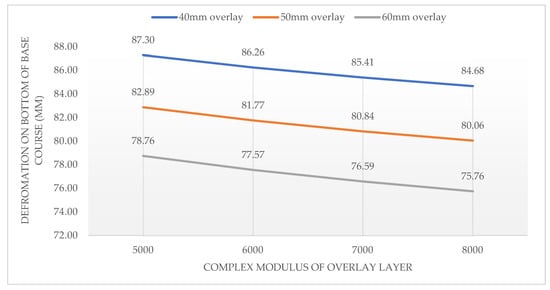
Figure 9.
Calculated deformation on the bottom edge of the base course in relation to complex modulus and thickness of overlay.
The calculation of residual life after overlay application—determined via Equation (3)—and its dependency on the overlay’s complex modulus are shown in Figure 10.
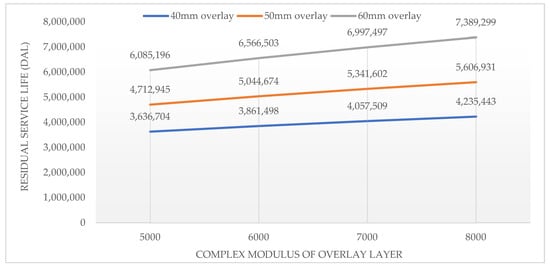
Figure 10.
Structural life extension in relation to complex modulus and thickness of overlay.
As shown in Figure 10, material quality significantly impacts the structural pavement condition asset value. Using materials with a high complex modulus can increase residual service life by up to 30%, ultimately leading to a substantial improvement in the structural pavement condition asset value.
4.2. Unevenness Deterioration
From the perspective of pavement serviceability value, a decisive parameter is the decrease in pavement serviceability represented by the IRI, which leads to increased user costs. However, pavement serviceability decline is not linear and is, therefore, expressed through a polynomial degradation function. The resulting increase in user costs due to worsening IRI can be monetized using tools such as the Highway Development and Management program. Pavement rehabilitation improves IRI, generating benefits through reduced user costs. The relationship between road user benefits, degradation functions, and increased traffic loading is determined through Equation (11). The impact of diminishing benefits relative to worsening IRI parameters for semi-rigid arterial pavements, represented by degradation functions (shown in Figure 8) across different traffic intensities, is calculated in Figure 11. The unevenness parameter deteriorates according to applied design axle loads (DALs), with user benefits decreasing proportionally to unevenness. While the function shapes remain consistent for higher traffic loads, the benefit values vary as they depend on traffic intensity. By incorporating these values into Equation (7), a new road asset’s pavement serviceability value can be determined and evaluated using the pavement user value index (shown in Table 7).
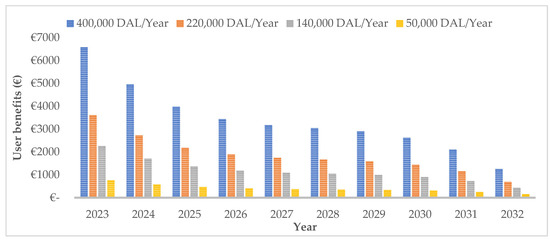
Figure 11.
Different users benefits in relation to the same function, but with different traffic intensity values over time.
Table 7.
Pavement User Value Index.
Applying the user benefits evaluation principle to different unevenness deterioration functions and comparing functions from accelerated testing facilities with long-term monitoring sections (Figure 9) allows for the analysis of their varying impacts. The pavement user value index appears in Table 8, while Figure 12 displays the user benefit evaluation for different unevenness deterioration functions over time.
Table 8.
Pavement user value index for different functions over time.
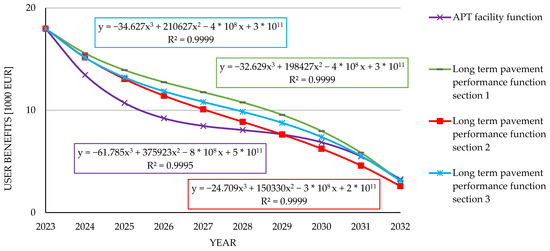
Figure 12.
User benefit evaluation for different unevenness deterioration functions over time.
As shown in Table 7 and Table 8, the total value of user benefits and the pavement user value vary depending not only on traffic intensity but also on the degradation functions used in their calculation. The average total cumulative user benefits amount to EUR 100,433.15, calculated as the mean of user benefits derived from APT and three LTPP sections. Among the evaluated degradation functions, the minimum value reaches 91% (APT) of the average user benefits, while the maximum value reaches 109% (LTPP 1). This represents an 18% dispersion, which is statistically significant.
4.3. Rehabilitation Programs
The output of the decision-making processes (Figure 1) consists of pavement rehabilitation programs. By evaluating structural life extension, pavement unevenness deterioration, and pavement asset value, pavement rehabilitation designs can employ cost–benefit analysis (CBA) methods to optimize value for money through maximizing the net present value, internal rate of return, and benefit–cost ratio. However, achieving these parameters throughout the pavement lifecycle requires incorporating rehabilitation performance optimization methods into the schedule. This optimization considers overlay thickness designs based on structural evaluation, unevenness parameter degradation until reaching critical thresholds, cost factors, and user benefit calculations at different time intervals. The optimization can be performed using various methods grounded in economic analysis or through an optimization Index.
The economic analysis-based optimization strategy for rehabilitation program funding involves identifying combinations of rehabilitation methods with varying quality levels across different representative road sections to maximize the road network’s net present value during the reference period. As part of this optimization process, an economic analysis evaluates all alternatives across all sections and budget constraint scenarios. The optimization procedure itself utilizes integer linear programming methods through Equations (12) and (13):
where S is the road section (element of the road network matrix), Ms is the number of maintenance standards alternatives for road section s, m is the maintenance standard, OPTsm is the optimization criterion (max NPV, max ΔIRI), sm is the combination of maintenance standard alternative m on road section s, and Xsm is a binary variable, where Xsm equals 1 if alternative m is chosen for section s, and Xsm equals 0 if alternative m is not chosen for section s.
where RZsmt is the funding demand for financing the road rehabilitation program in year t; TRt is the undiscounted annual funding limit in year t, and t is the funding period.
The advantage of optimization is that the result is mathematically an absolute optimal solution. Optimization using the optimal index method is based on a mathematical model of costs and benefits over the pavement lifecycle (Equation (14)), applying rehabilitation methods at the times illustrated in Figure 13.
where OI is the optimization index, RC denotes rehabilitation costs [EUR], NPAVBR is the net present asset value before rehabilitation [EUR], NPAVAR is the net present asset value after rehabilitation [EUR], and Tt is the extended lifecycle [EUR].
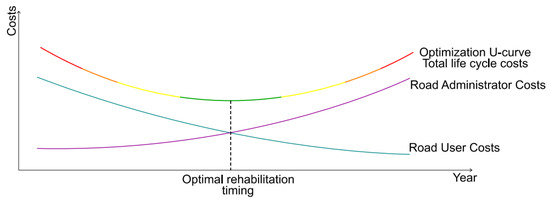
Figure 13.
The optimal rehabilitation timing.
Comprehensive rehabilitation programs incorporate both pavement rehabilitation and road modernization programs, including category and width modifications. Equations (15) and (16) enable the determination of budget requirements, specifically, the allocation of limited funding for road sections:
where TOb is the program action plan of rehabilitation actions on the road network, TSi is the value of the performance criterion of asset “i”, derived from the technical condition of the asset and its max. values (see Section 3), and, for the case of implementing rehabilitation technology TOi,s, TOi,s is a variant of rehabilitation technology s on an asset i, price (TOb,s) is the price of rehabilitation technology s on asset i; b is the budget limit for program i.
5. Discussion
Following the four research points outlined at the end of the previous chapter, we can make these additional observations:
- The practical example demonstrates that residual pavement life can be calculated in relation to traffic load and time horizon (years) using mathematical stress and deformation analysis of layered elastic half-space systems, FWD measurements of elastic deflection curves, and analytical back-calculation to determine the actual moduli of elasticity for the surface layer, subgrade, and base, combined with experimentally obtained fatigue characteristics of asphalt pavement materials. A key issue for further research is the relationship between fatigue and service life when comparing data from APT with real-world performance under actual outdoor climatic conditions.
- APT data, collected using precisely defined parameters and built-in measurement sensors with various scanners, enables mathematically derived degradation equations with high accuracy. However, since these functions were also developed from long-term road inventory measurements under real-world conditions, further research should refine them by incorporating climatic factors and pavement structure material characteristics.
- New pavement asset value calculation methods, incorporating well-defined structural life and unevenness deterioration parameters, have been applied in case studies and implemented in rehabilitation projects, yet these often fail to achieve the intended design life. Practical examples demonstrate that the achieved life extension is limited by permanent deformations caused by insufficient overlay thickness and substandard material quality.
- The case study highlights that service life extensions achieved through rehabilitation fall short of the designed service life due to permanent deformations caused by inadequate overlay thickness and material quality.
- The importance of well-defined degradation functions has been demonstrated through economic efficiency calculations, with their impact proving crucial for determining road user benefits. Consequently, optimal resource allocation and accurate funding requirements cannot be achieved without reliable degradation functions combined with proper pavement structure service life calculations.
To successfully implement these research findings in practice, road managers must establish the necessary framework for applying these complex methodologies. This requires three key actions: first, clearly defining both current and long-term requirements from society and road infrastructure users; second, developing a comprehensive road inventory system with regular asset condition monitoring and control protocols; and third, creating specialized material testing equipment and calculation methods to assess fatigue characteristics of common pavement materials, which are essential for determining bearing capacity and predicting structural life expectancy.
In relation to future research aimed at improving deterioration models, it is necessary to consider the ongoing evolution of pavement materials and technologies. As these advancements continue, models must be updated to reflect new forms of degradation. The increasing use of recycled constituents—such as reclaimed asphalt pavement, crumb rubber, plastic waste, and used cooking oil—alters the viscoelastic properties and aging characteristics of pavement materials, thereby influencing their long-term performance [67,68]. At the same time, the integration of autonomous repair technologies, including induction heating systems, microencapsulated rejuvenators, and vascular healing networks, is actively changing the progression of damage by enabling in-situ healing processes [69,70].
These developments introduce new material behaviors and damage mechanisms that conventional phenomenological models are not equipped to capture. Consequently, there is a growing need for next-generation deterioration frameworks that incorporate micromechanical interactions and account for the time-dependent evolution of pavement properties under realistic service conditions.
6. Conclusions
The pavement service life decision process presented in this paper was developed in response to road managers’ needs, as current standard decision-making methods, pavement management systems, and road asset valuation approaches failed to deliver sufficient results. Consequently, this new decision-making process was designed to maximize pavement service life through optimal financial planning. While building upon traditional methods, this comprehensive approach prioritizes structural life extension derived from structural life expectancy calculations and the resulting reinforcement thickness requirements. Additionally, it incorporates rehabilitation method designs based on degradation models, economic analyses, and project prioritization.
Implementing this methodology required extensive research in four critical areas:
- Residual Life Calculation Methodology: Developing techniques to compute pavement structure residual life using numerical stress analysis and deformation modeling in layered elastic half-space systems, combined with experimental measurements of rehabilitation materials’ fatigue parameters.
- Unevenness Deterioration Modeling: Establishing degradation models through data from newly constructed experimental facilities and mathematical models derived from 20 years of road inventory measurements.
- Pavement Asset Valuation Formulas: Creating computational frameworks that incorporate residual life and time-dependent user costs, with benefit calculations based on degradation models.
- Decision Process Implementation: Integrating these methods into a comprehensive model that quantifies how material quality, dimensional specifications, and structural life extension affect structural pavement condition value, while mathematically representing how unevenness degradation impacts pavement user value.
This study introduces a comprehensive and integrative decision-making model for pavement rehabilitation that uniquely combines structural life expectancy, serviceability deterioration, and asset value evaluation within a single framework. Unlike traditional pavement management approaches that often treat these components separately, the presented model quantifies their interdependence using analytical equations grounded in fatigue theory, pavement performance modeling, and cost–benefit principles.
Author Contributions
Conceptualization, Ľ.R., Š.Š. and J.M.; methodology, J.M. and Š.Š.; software, Ľ.R.; validation, M.K., Ľ.R. and J.M.; formal analysis, M.K. and Š.Š.; investigation, M.K. and Ľ.R.; resources, J.M.; data curation, M.K. and Ľ.R.; writing—original draft preparation, M.K. and J.M.; writing—review and editing, Ľ.R.; visualization, M.K.; supervision, J.M.; project administration, M.K.; funding acquisition, J.M. All authors have read and agreed to the published version of the manuscript.
Funding
This research was funded by the Slovak Research and Development Agency, grant number APVV-22-0040.
Institutional Review Board Statement
Not applicable.
Informed Consent Statement
Not applicable.
Data Availability Statement
Data is contained within the article.
Conflicts of Interest
The authors declare no conflicts of interest.
References
- Talvik, O.; Aavik, A. Use of FWD deflection basin parameters (SCI, BDI, BCI) for pavement condition assessment. Balt. J. Road Bridge Eng. 2009, 4, 196–202. [Google Scholar] [CrossRef]
- Mikolaj, J.; Remek, L.; Macula, M. Asphalt concrete overlay optimization based on pavement performance models. Adv. Mater. Sci. Eng. 2017, 2017, 6063508. [Google Scholar] [CrossRef]
- Choi, J.W.; Wu, R.; Pestana, J.M.; Harvey, J. New layer-moduli back-calculation method based on the constrained extended Kalman filter. J. Transp. Eng. 2010, 136, 20–30. [Google Scholar] [CrossRef]
- Zhang, X.; Otto, F.; Oeser, M. Pavement moduli back-calculation using artificial neural network and genetic algorithms. Constr. Build. Mater. 2021, 287, 123026. [Google Scholar] [CrossRef]
- Gerrard, C.M. Tables of Stresses, Strains and Displacements in Two-Layer Elastic Systems Under Various Traffic Loads; Australian Road Research Board: Port Melbourne, Australia, 1969. [Google Scholar]
- Gupta, P.K.; Walowit, J.A. Contact stresses between an elastic cylinder and a layered elastic solid. J. Lubr. Technol. 1974, 96, 389–395. [Google Scholar] [CrossRef]
- Perriot, A.; Barthel, E. Elastic contact to a coated half-space: Effective elastic modulus and real penetration. J. Mater. Res. 2004, 19, 600–608. [Google Scholar] [CrossRef]
- AASHTO. Mechanistic-Empirical Pavement Design Guide: A Manual of Practice, Interim ed.; American Association of State Highway and Transportation Officials: Washington, DC, USA, 2008; Available online: https://fenix.tecnico.ulisboa.pt/downloadFile/563568428712666/AASHTO08.pdf (accessed on 10 July 2025).
- Li, Q.; Xiao, D.X.; Wang, K.C.; Hall, K.D.; Qiu, Y. Mechanistic-empirical pavement design guide (MEPDG): A bird’s-eye view. J. Mod. Transp. 2011, 19, 114–133. [Google Scholar] [CrossRef]
- Oh, J.H.; Fernando, E.G.; Holzschuher, C.; Horhota, D. Comparison of resilient modulus values for Florida flexible mechanistic-empirical pavement design. Int. J. Pavement Eng. 2012, 13, 472–484. [Google Scholar] [CrossRef]
- Mikolaj, J.; Remek, L.; Kozel, M. Life cycle extension of a pavement structure. Commun.-Sci. Lett. Univ. Zilina 2016, 18, 83–89. [Google Scholar] [CrossRef]
- EN 12697-24; Bituminous Mixtures—Test Methods for Hot Mix Asphalt—Part 24: Resistance to Fatigue. European Committee for Standardization (CEN): Brussels, Belgium, 2018.
- Schlosser, F.; Sramekova, E.; Šrámek, J. Rheology, deformational properties and fatigue of the asphalt mixtures. Adv. Mater. Res. 2014, 875, 578–583. [Google Scholar] [CrossRef]
- Ferreira, A.; Picado-Santos, L.D.; Wu, Z.; Flintsch, G. Selection of pavement performance models for use in the Portuguese PMS. Int. J. Pavement Eng. 2011, 12, 87–97. [Google Scholar] [CrossRef]
- Jorge, D.; Ferreira, A. Road network pavement maintenance optimisation using the HDM-4 pavement performance prediction models. Int. J. Pavement Eng. 2012, 13, 39–51. [Google Scholar] [CrossRef]
- Gupta, A.; Kumar, P.; Rastogi, R. Critical review of flexible pavement performance models. KSCE J. Civ. Eng. 2014, 18, 142–148. [Google Scholar] [CrossRef]
- Wu, K. Development of PCI-Based Pavement Performance Model for Management of Road Infrastructure System; Arizona State University: Tempe, AZ, USA, 2015. [Google Scholar]
- El-Maaty, A.E.A. Temperature Change Implications for Flexible Pavement Performance and Life. Int. J. Transp. Eng. Technol. 2017, 3, 1–11. [Google Scholar] [CrossRef]
- Sramek, J.; Hodasova, K.; Juhas, M.; Pitonak, M.; Duris, L. Rutting Prediction Models in Holistic Concept to Sustainability of Semi-Rigid Pavements. Civ. Environ. Eng. 2022, 18, 200–208. [Google Scholar] [CrossRef]
- Liang, H.; Gong, H.; Cong, L.; Zhang, M.; Tao, Z.; Liu, S.; Shi, J. Automated Detection of Airfield Pavement Damages: An Efficient Light-Weight Algorithm. Int. J. Pavement Eng. 2023, 24, 2247135. [Google Scholar] [CrossRef]
- Buczyński, P.; Šrámek, J.; Mazurek, G. The Influence of Recycled Materials on Cold Mix with Foamed Bitumen Properties. Materials 2023, 16, 1208. [Google Scholar] [CrossRef]
- Tkach, S.V.; Kroviakov, S.O. The Effect of Different Types of Modifiers on the Properties of Bitumens and Asphalt Concrete Based on Them. Mod. Constr. Archit. 2025, 12, 102–113. [Google Scholar] [CrossRef]
- Mazurek, G.; Šrámek, J.; Buczyński, P. Composition Optimisation of Selected Waste Polymer-Modified Bitumen. Materials 2022, 15, 8714. [Google Scholar] [CrossRef]
- Mazurek, G.; Buczyński, P.; Iwański, M.; Podsiadło, M.; Pypeć, P.; Kowalczyk, A. Effects of the Mixing Process on the Rheological Properties of Waste PET-Modified Bitumen. Materials 2023, 16, 7271. [Google Scholar] [CrossRef] [PubMed]
- Brint, A.; Black, M. Improving Estimates of Asset Condition Using Historical Data. J. Oper. Res. Soc. 2014, 65, 242–251. [Google Scholar] [CrossRef]
- Migliaccio, G.C.; Bogus, S.M.; Cordova-Alvidrez, A.A. Continuous Quality Improvement Techniques for Data Collection in Asset Management Systems. J. Constr. Eng. Manag. 2014, 140, B4013008. [Google Scholar] [CrossRef]
- Susanna, A.; Crispino, M.; Giustozzi, F.; Toraldo, E. Deterioration Trends of Asphalt Pavement Friction and Roughness from Medium-Term Surveys on Major Italian Roads. Int. J. Pavement Res. Technol. 2017, 10, 421–433. [Google Scholar] [CrossRef]
- Kozel, M.; Remek, Ľ.; Ilovská, K.; Mazurek, G.; Buczyński, P. Integrating Tensometer Measurements, Elastic Half-Space Modeling, and Long-Term Pavement Performance Data into a Mechanistic–Empirical Pavement Performance Model. Appl. Sci. 2024, 14, 3880. [Google Scholar] [CrossRef]
- Kozel, M.; Remek, Ľ.; Ďurínová, M.; Šedivý, Š.; Šrámek, J.; Danišovič, P.; Hostačná, V. Economic Impact Analysis of the Application of Different Pavement Performance Models on First-Class Roads with Selected Repair Technology. Appl. Sci. 2021, 11, 10409. [Google Scholar] [CrossRef]
- Sedivy, S.; Mikulova, L.; Danisovic, P.; Sramek, J.; Remek, L.; Kozel, M. Long-Term Monitored Road Degradation Functions as a Tool to Increase Quality of Pavement Design. Appl. Sci. 2021, 11, 9839. [Google Scholar] [CrossRef]
- Nega, A.; Nikraz, H.; Herath, S.; Ghadimi, B. Distress identification, cost analysis and pavement temperature prediction for the long-term pavement performance for Western Australia. Int. J. Eng. Technol. 2015, 7, 267. [Google Scholar] [CrossRef]
- Li, Y.; Liu, L.; Xiao, F.; Sun, L. Effective temperature for predicting permanent deformation of asphalt pavement. Constr. Build. Mater. 2017, 156, 871–879. [Google Scholar] [CrossRef]
- Federal Highway Administration (FHWA). Asset Management Primer; U.S. Department of Transportation: Washington, DC, USA, 1999; p. 30.
- Cowe Falls, L.; Haas, R.; McNeil, S.; Tighe, S. Asset Management and Pavement Management: Using Common Elements to Maximize Overall Benefits. Transp. Res. Rec. 2001, 1769, 1–9. [Google Scholar] [CrossRef]
- Organisation for Economic Co-operation and Development (OECD). Asset Management for the Roads Sector; OECD Publishing: Paris, France, 2001; Available online: https://www.itf-oecd.org/sites/default/files/docs/01assete.pdf (accessed on 10 July 2025).
- European Union Road Federation. Road Asset Management—An ERF Position Paper for Maintaining and Improving a Sustainable and Efficient Road Network; ERF: Brussels, Belgium, 2014. [Google Scholar]
- ISO 55002:2018; Asset Management—Management Systems—Guidelines for the Application of ISO 55001. International Organization for Standardization (ISO): Geneva, Switzerland, 2018.
- ISO 55000:2014; Asset Management—Overview, Principles and Terminology. International Organization for Standardization (ISO): Geneva, Switzerland, 2014.
- Kokot, D. Common Framework for a European Life-Cycle Based Asset Management Approach for Transport Infrastructure Networks. Routes/Roads 2019, 2, 381. [Google Scholar]
- Highway Infrastructure Asset Management. HMEP Highways Maintenance Efficiency Programme: Guidance Document; Queen’s Printer and Controller of Her Majesty’s Stationery Office: London, UK, 2013; p. 119. Available online: https://councildecisions.bury.gov.uk/documents/s11441/Appendix%20E%20-%20HMEP%20Highway%20Infrastructure%20Asset%20Management%20Guidance.pdf (accessed on 10 July 2025).
- Haas, R.; Hudson, W.R. Pavement Asset Management; John Wiley & Sons: Hoboken, NJ, USA, 2015. [Google Scholar]
- AM4INFRA. Uniresearch. 2017. Available online: https://cordis.europa.eu/project/id/713793/results (accessed on 10 July 2025).
- Di Ciommo, F.; Shiftan, Y. Transport Equity Analysis. Transp. Rev. 2017, 37, 139–151. [Google Scholar] [CrossRef]
- Van Essen, H.; Van Wijngaarden, L.; Schroten, A.; Sutter, D.; Bieler, C.; Maffii, S.; El Beyrouty, K. Handbook on the External Costs of Transport; Version 2019, No. 18.4 K83.131; CE Delft: Delft, The Netherlands, 2019. [Google Scholar]
- Jafino, B.A.; Kwakkel, J.; Verbraeck, A. Transport Network Criticality Metrics: A Comparative Analysis and a Guideline for Selection. Transp. Rev. 2020, 40, 241–264. [Google Scholar] [CrossRef]
- Khurshid, M.B.; Irfan, M.; Labi, S. Optimal Performance Threshold Determination for Highway Asset Interventions: Analytical Framework and Application. J. Transp. Eng. 2011, 137, 128–139. [Google Scholar] [CrossRef]
- Mandapaka, V.; Basheer, I.; Sahasi, K.; Ullidtz, P.; Harvey, J.T.; Sivaneswaran, N. Mechanistic-Empirical and Life-Cycle Cost Analysis for Optimizing Flexible Pavement Maintenance and Rehabilitation. J. Transp. Eng. 2012, 138, 625–633. [Google Scholar] [CrossRef]
- State of California Department of Transportation Division of Maintenance Pavement Program. Life-Cycle Cost Analysis Procedures Manual. 2013. Available online: https://dot.ca.gov/-/media/dot-media/programs/maintenance/documents/office-of-concrete-pavement/life-cycle-cost-analysis/lcca-25ca-manual-final-aug-1-2013-v2-a11y.pdf (accessed on 10 July 2025).
- Santos, J.; Ferreira, A.; Flintsch, G. A Life Cycle Assessment Model for Pavement Management: Road Pavement Construction and Management in Portugal. Int. J. Pavement Eng. 2015, 16, 315–336. [Google Scholar] [CrossRef]
- Martin, T.; Choummanivong, L. The Benefits of Long-Term Pavement Performance (LTPP) Research to Funders. Transp. Res. Procedia 2016, 14, 2477–2486. [Google Scholar] [CrossRef]
- Wu, D.; Yuan, C.; Kumfer, W.; Liu, H. A Life-Cycle Optimization Model Using Semi-Markov Process for Highway Bridge Maintenance. Appl. Math. Model. 2017, 43, 45–60. [Google Scholar] [CrossRef]
- Mikolaj, J.; Remek, L. Material Structural and Economical Aspects of Life Cycle Extension of Asphalt Concrete Surfacing. In Pavement and Asset Management; CRC Press: Boca Raton, FL, USA, 2019; pp. 685–692. [Google Scholar] [CrossRef]
- Piryonesi, S.M.; El-Diraby, T.E. Data Analytics in Asset Management: Cost-Effective Prediction of the Pavement Condition Index. J. Infrastruct. Syst. 2020, 26, 04019036. [Google Scholar] [CrossRef]
- Sartori, D.; Catalano, G.; Genco, M.; Pancotti, C.; Sirtori, E.; Vignetti, S.; Del Bo, C. Guide to Cost–Benefit Analysis of Investment Projects: Economic Appraisal Tool for Cohesion Policy 2014–2020; European Commission: Brussels, Belgium, 2014. [Google Scholar]
- Meneses, S.; Ferreira, A. Flexible Pavement Maintenance Programming Considering the Minimisation of Maintenance and Rehabilitation Costs and the Maximisation of the Residual Value of Pavements. Int. J. Pavement Eng. 2015, 16, 571–586. [Google Scholar] [CrossRef]
- Saad, D.A.; Hegazy, T. Enhanced Benefit–Cost Analysis for Infrastructure Fund Allocation. Can. J. Civ. Eng. 2015, 42, 89–97. [Google Scholar] [CrossRef]
- Chen, W.; Zheng, M. Multi-Objective Optimization for Pavement Maintenance and Rehabilitation Decision-Making: A Critical Review and Future Directions. Autom. Constr. 2021, 130, 103840. [Google Scholar] [CrossRef]
- Grazianová, M.; Smetanková, J.; Ručinský, R.; Mésároš, P. Economic Benefits of Retrofitting Historic Buildings: A Review from the Perspective of LCA, LCC, and Cost Optimal. In Proceedings of the EAI International Conference on Management of Manufacturing Systems, Cham, Switzerland, 5–7 October 2024; Springer Nature: Cham, Switzerland, 2024; pp. 53–67. [Google Scholar] [CrossRef]
- American Association of State Highway and Transportation Officials (AASHTO). Defining Cross-Asset Decision Making: A Discussion Paper; TAM-ETG-2015-PDL-003; AASHTO: Washington, DC, USA, 2015; Available online: https://www.tam-portal.com/wp-content/uploads/sites/12/2016/01/Cross-Asset-Allocation.pdf (accessed on 10 July 2025).
- Nicolosi, V.; Augeri, M.G.; Soccodato, F. Multi-Objective Approaches to Cross-Asset Resource Allocation in Transportation Asset Management. Routes/Roads 2019, 2, 37–44. [Google Scholar]
- Priemus, H. The Infrastructure We Ride On. Decision Making in Transportation Investment. Transp. Rev. 2019, 39, 560–562. [Google Scholar] [CrossRef]
- National Academies of Sciences, Engineering, and Medicine. Case Studies in Cross-Asset, Multi-Objective Resource Allocation; The National Academies Press: Washington, DC, USA, 2020. [Google Scholar] [CrossRef]
- Abaza, K.A. Simplified Markovian-Based Pavement Management Model for Sustainable Long-Term Rehabilitation Planning. Road Mater. Pavement Des. 2023, 24, 850–865. [Google Scholar] [CrossRef]
- Mikolaj, J.; Remek, Ľ.; Kozel, M. Road Asset Value Calculation Based on Asset Performance, Community Benefits and Technical Condition. Sustainability 2022, 14, 4375. [Google Scholar] [CrossRef]
- Schlosser, F.; Mikolaj, J.; Zatkaliakova, V.; Sramek, J.; Durekova, D.; Remek, L. Deformation Properties and Fatigue of Bituminous Mixtures. Adv. Mater. Sci. Eng. 2013, 2013, 701764. [Google Scholar] [CrossRef]
- MDČR Ministerstvo Dopravy České Republiky. Navrhování Vozovek Pozemních Komunikací. TP170. 2006. Available online: https://pjpk.rsd.cz/data/USR_001_2_8_TP/TP_170_upraveny_dotisk.pdf (accessed on 10 July 2025).
- Wang, Z.; Pei, Q.; Li, K.; Wang, Z.; Huo, X.; Wang, Y.; Zhang, X.; Kong, S. Molecular Dynamics Simulation of the Rejuvenation Performance of Waste Cooking Oil with High Acid Value on Aged Asphalt. Molecules 2024, 29, 2830. [Google Scholar] [CrossRef] [PubMed]
- Xu, H.; Chen, A.; Wu, S.; Li, Y.; Li, J.; Zhu, Y.; Wu, J.; Zhou, Y.; Feng, J. Mechanism of asphalt concrete reinforced with industrially recycled steel slag from the perspectives of adhesion and skeleton. Constr. Build. Mater. 2024, 424, 135899. [Google Scholar] [CrossRef]
- Li, J.; Ji, X.P.; Fang, X.Z.; Hu, Y.L.; Hua, W.L.; Zhang, Z.M.; Shao, D.Y. Self-healing performance and prediction model of microcapsule asphalt. Constr. Build. Mater. 2022, 330, 127085. [Google Scholar] [CrossRef]
- Li, C.; Xiao, M.; Dong, J.; Ren, J.; Guo, X. Study on the factors affecting the self-healing performance of asphalt mixture and pavement based on fracture mechanics and calculation formula. Theor. Appl. Fract. Mech. 2023, 126, 103954. [Google Scholar] [CrossRef]
Disclaimer/Publisher’s Note: The statements, opinions and data contained in all publications are solely those of the individual author(s) and contributor(s) and not of MDPI and/or the editor(s). MDPI and/or the editor(s) disclaim responsibility for any injury to people or property resulting from any ideas, methods, instructions or products referred to in the content. |
© 2025 by the authors. Licensee MDPI, Basel, Switzerland. This article is an open access article distributed under the terms and conditions of the Creative Commons Attribution (CC BY) license (https://creativecommons.org/licenses/by/4.0/).