1. Introduction
Tree species recognition is a critical component of forest resource assessment, ecosystem monitoring, and precision agriculture [
1,
2]. Accurate classification provides essential data for analyzing vegetation structure and species distribution. It also supports biodiversity conservation and sustainable forest management [
3]. In orchard systems, species-level recognition enables site-specific management practices such as targeted irrigation, precise fertilization, and pest control, thereby enhancing yield and resource efficiency [
4]. However, traditional field-based approaches are labor-intensive, time-consuming, and costly, which limits their applicability for large-scale or high-frequency monitoring [
5].
With advances in remote sensing and artificial intelligence, unmanned aerial vehicles (UAVs) have become a widely adopted platform for large-scale and high-precision tree species identification in both forestry and agriculture [
6]. Compared with satellite or manned aerial platforms, UAVs offer higher spatial resolution, reduced cost, and greater operational flexibility, particularly in complex environments [
7]. They also enable frequent imaging that is less affected by cloud cover, while providing improved spatiotemporal consistency and geolocation accuracy. Owing to these advantages, UAVs have been extensively applied in forest health monitoring [
8], biodiversity assessment [
9], resource management [
10], and aboveground biomass estimation [
11]. In orchard scenarios, UAV imagery creates new opportunities for species-level recognition [
12]. Nonetheless, several challenges remain. The spatial heterogeneity and spectral similarity of tree canopies complicate classification. Dense planting leads to crown overlap and occlusion, which blur boundaries and reduce accuracy. In addition, variations in illumination and background clutter further weaken model robustness [
13,
14]. These issues underscore the necessity of developing specialized models capable of handling small objects, high inter-class similarity, and complex spatial structures.
To overcome these challenges, researchers have applied automatic image analysis in agricultural remote sensing by integrating multi-source data, such as hyperspectral and LiDAR, into machine learning approaches to improve classification accuracy [
15,
16]. For example, Wang B. et al. [
17] achieved a classification accuracy exceeding 78% using a data fusion strategy, demonstrating the feasibility of this method in orchard environments. Nonetheless, under dense canopies, pixel-level segmentation often struggles to detect small objects and delineate boundaries precisely, leading to omissions or inaccurate segmentation [
18].
In recent years, research attention has increasingly shifted toward deep learning-based instance-level object detection methods, which are well-suited to complex spatial layouts and fine-grained classification tasks. Convolutional neural networks (CNNs), owing to their strong spatial and semantic representation capacity, have been widely applied in remote sensing for image classification and detection. Current detection frameworks are typically divided into two-stage models (e.g., Faster R-CNN) and one-stage models (e.g., SSD, YOLO) [
19,
20,
21,
22]. Among them, the YOLO (You Only Look Once) family has emerged as a widely adopted solution for real-time detection because it achieves a favorable balance between accuracy and computational efficiency.
Recently developed YOLOv8, YOLOv9 and YOLOv10 have demonstrated competitive performance on general object detection benchmarks [
23,
24]. YOLOv8 introduced an anchor-free design and lightweight architecture, which improved training efficiency and inference speed; however, it suffered from reduced accuracy under densely overlapping tree crowns. YOLOv9 incorporated decoupled detection heads and advanced normalization techniques, yielding higher benchmark precision but showing unstable convergence and limited robustness in complex agricultural environments. YOLOv10 achieved a better balance between multi-task performance and efficiency, yet it still faced challenges in small-object detection and fine-grained category differentiation. Overall, these models were primarily designed for natural image datasets, and their transferability to agricultural remote sensing tasks remains insufficient.
To address these limitations, Ultralytics released YOLOv11 in 2024, introducing major architectural innovations such as the C3k2 module, Spatial Pyramid Pooling-Fast (SPPF), and the channel–spatial attention mechanism (C2PSA), which substantially enhanced feature extraction and detection efficiency [
25,
26]. Compared with its predecessors, YOLOv11 exhibited greater training stability and more precise boundary localization, positioning it as a suitable baseline for UAV-based orchard detection. Building on this foundation, several variants further confirmed its effectiveness in UAV scenarios. For instance, Lu et al. proposed MASFYOLO, which improved mAP@0.5 by 4.6% over YOLOv11s on VisDrone2019 at a lower computational cost [
27]; Dewangan and Srinivas developed LIGHTYOLOv11, a lightweight model optimized for UAV imagery [
28]. Zhong et al. introduced PSYOLO, reducing parameters by half while improving both accuracy and speed [
29]. Additional works, including RLRDYOLO [
30] and CFYOLO [
31], also enhanced YOLOv8/YOLOv11 for small-object UAV detection. Collectively, these studies demonstrate the promise of YOLOv11 for orchard applications. Nonetheless, its default configuration continues to face challenges in detecting small targets, handling severe crown overlap, and distinguishing subtle class boundaries in complex environments, highlighting the need for further improvement.
Comparable visual challenges have also been explored in other domains, such as medical image analysis. For example, the vSegNet model [
32], originally developed for medical image segmentation, integrates multi-scale feature fusion with structure-aware attention to enhance boundary precision under class imbalance and limited data. Although intended for a different application, its architectural principles offer valuable insights for small-object detection and inter-class differentiation in dense UAV imagery.
Building on these considerations, this study proposes YOLOv11-OAM, an enhanced one-stage detector tailored for orchard tree species recognition. The model extends the YOLOv11 framework with three innovations. First, Omni-Dimensional Dynamic Convolution (ODConv) [
33,
34] improves spatial adaptability under heterogeneous canopy structures. Second, Adaptive Spatial Feature Fusion (ASFF) [
35,
36] enables effective multi-scale semantic integration for densely distributed small objects. Third, Multi-Point Distance IoU (MPDIoU) [
37] provides a geometry-aware loss for refined localization, introducing a multi-anchor discrepancy measure that substantially improves fine-grained localization where traditional IoU metrics often fail due to blurred boundaries and scale variability.
In addition, a class-balanced data augmentation strategy is employed to mitigate category imbalance and enhance generalization. Taken together, these innovations establish a detection framework specifically designed for UAV orchard imagery, aimed at addressing spatial complexity, high inter-class similarity, and small-object detection challenges.
To promote reproducibility and further research, the full dataset, annotation files, and implementation code have been publicly released on Zenodo:
https://doi.org/10.5281/zenodo.15654967 (accessed on 13 June 2025).
2. Materials and Methods
2.1. Study Area
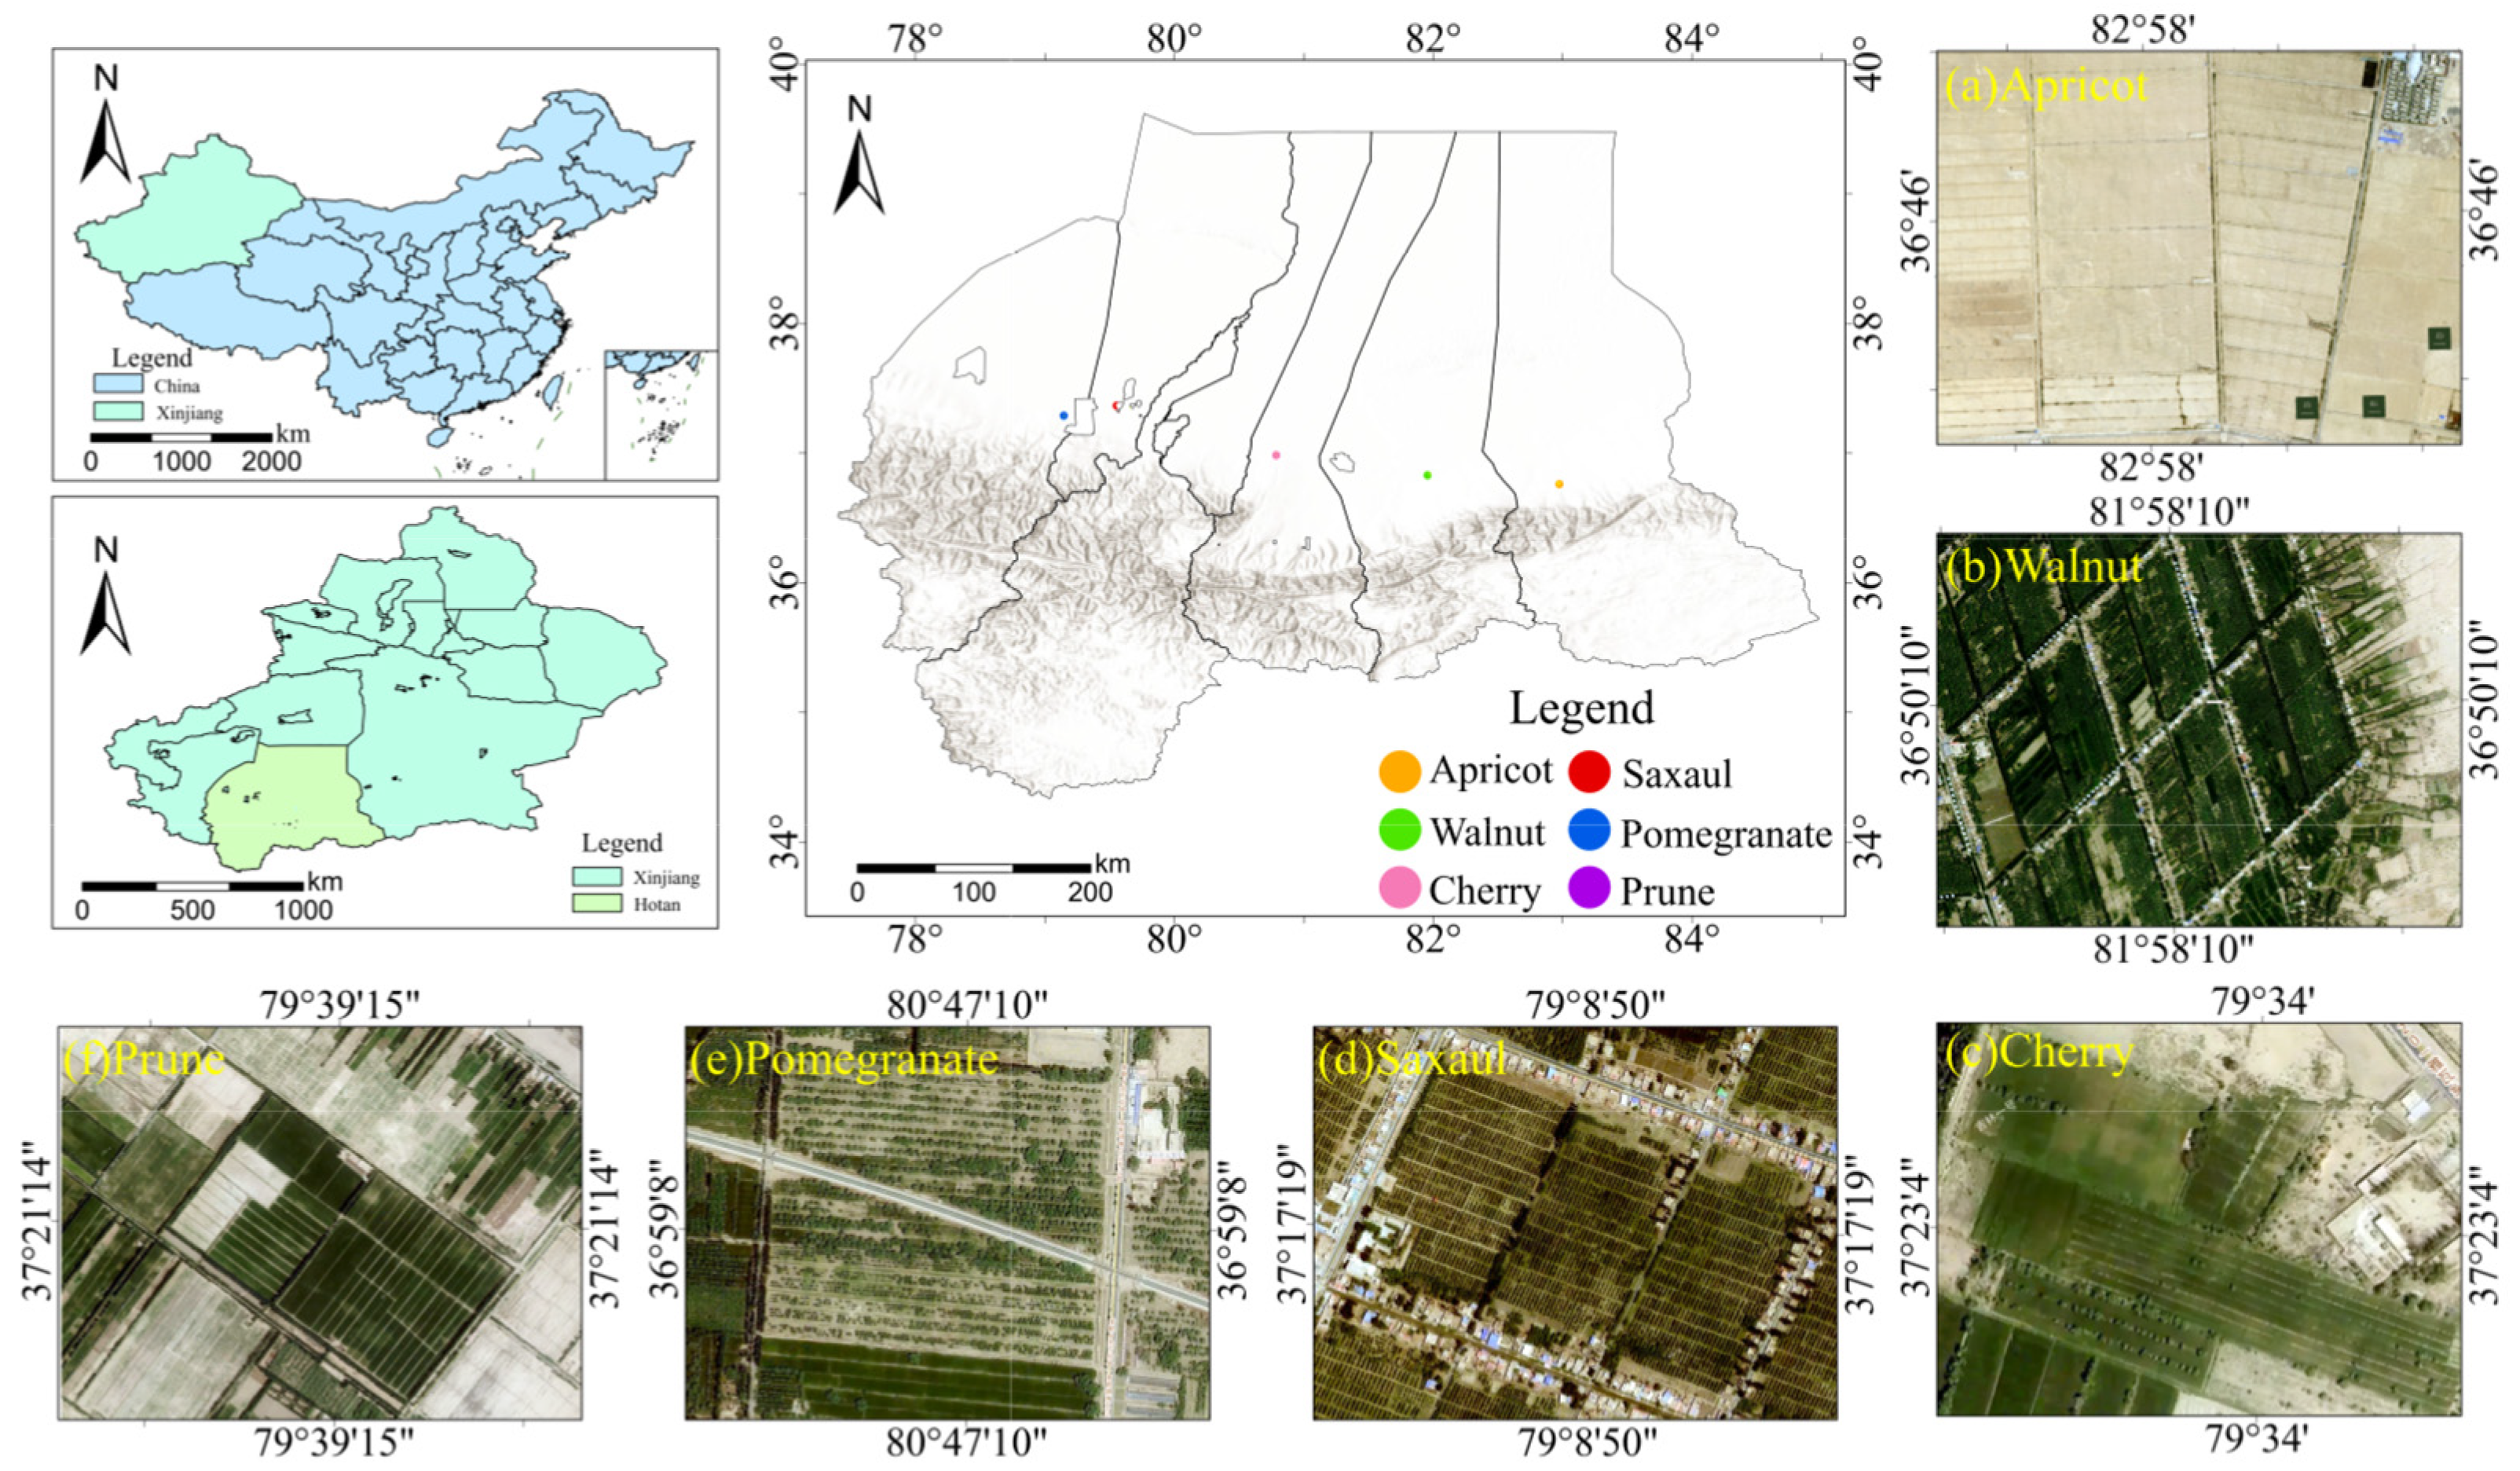
This study was conducted in the Hotan region, southern Xinjiang, China, located on the northern edge of the Taklamakan Desert. The area has a typical temperate arid climate, with extremely low annual precipitation, strong solar radiation, and agriculture that relies heavily on groundwater and artificial irrigation [
38].
Hotan is one of Xinjiang’s major fruit-producing regions, which cultivates diverse species including walnut, apricot, pomegranate, cherry, prune, and saxaul [
39]. Its ecological diversity and complex spatial patterns render it an ideal site for UAV-based tree species recognition experiments.
Figure 1 illustrates the geographic location of the study area and the sampling distribution of the six target species.
Table 1 provides a summary of orchard characteristics, including dominant species, planting density, and average canopy diameter.
2.2. Data Acquisition
UAV imagery was collected using a DJI Mavic 3E (DJI, Shenzhen, China) platform equipped with a 20 MP 4/3-inch CMOS sensor and a wide-angle mechanical-shutter camera. The survey was conducted from 15 to 25 October 2024, in four major orchard counties of Hotan Prefecture—Pishan, Minfeng, Cele, and Moyu. All flights were carried out between 12:00 and 14:00 local time under predominantly clear-sky conditions to ensure uniform illumination and minimize shadow artifacts.
The UAV followed a pre-planned flight path at a fixed altitude of 108.4 m and a ground speed of 8 m/s, with 75% forward and side overlap. The gimbal maintained a nadir orientation (82° field of view). Each image had a resolution of 5280 × 3956 pixels, corresponding to a ground sampling distance (GSD) of about 5 cm. Centimeter-level geolocation accuracy was achieved using Real-Time Kinematic (RTK) positioning.
The survey focused on six representative fruit tree species: walnut (Juglans regia), prune (Prunus domestica), apricot (Prunus armeniaca), pomegranate (Punica granatum), saxaul (Haloxylon ammodendron), and cherry (Prunus avium). Approximately 50,000 aerial images were acquired, covering three orchard types, namely regularly spaced plantations, irregularly clustered stands, and heterogeneous mixed-species zones.
All images were processed through aerial triangulation and orthorectification to generate high-resolution, geo-referenced orthophotos, which served as the basis for manual annotation, model training, and performance evaluation.
2.3. Dataset Construction and Augmentation
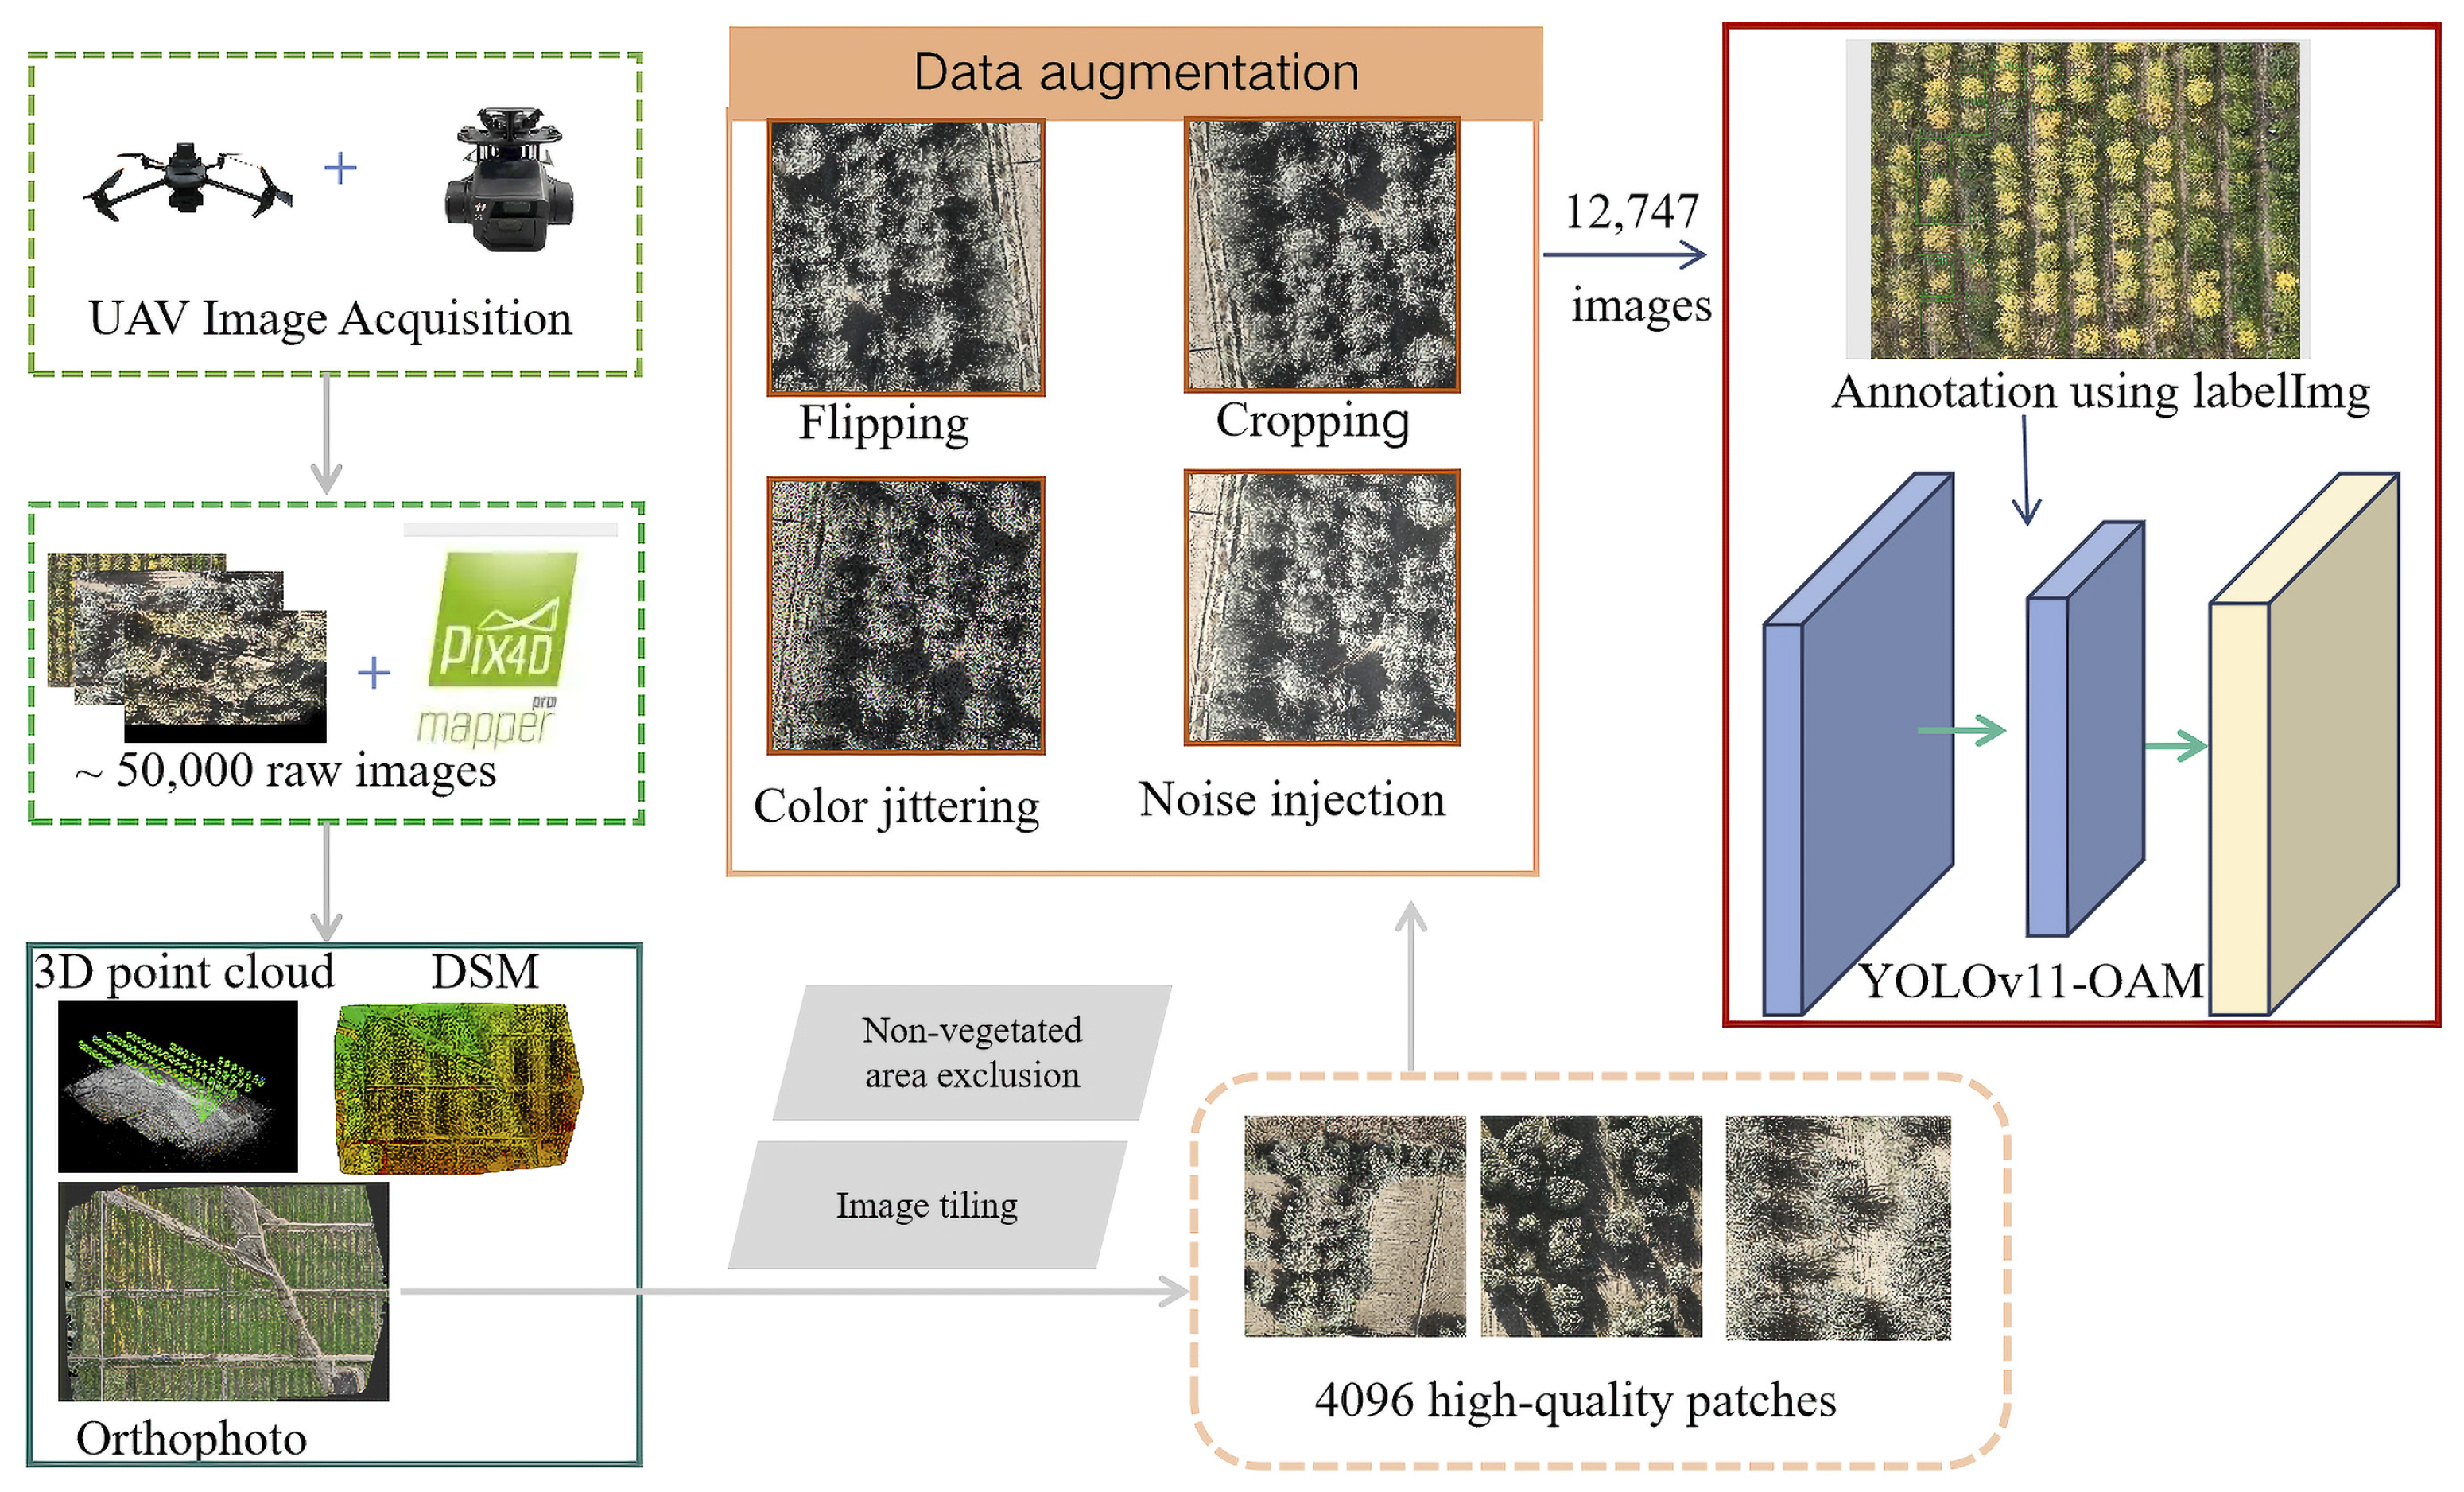
Approximately 50,000 UAV images were initially collected using the DJI Mavic 3E platform (DJI, Shenzhen, China)across multiple orchard environments. High-resolution orthophotos were generated with Pix4Dmapper (version 4.5.6, Pix4D SA, Prilly, Switzerland) and segmented into 1024 × 1024 pixel patches using a custom Python (Python 3.10.0) script. Each patch was manually inspected, and those containing non-vegetated elements such as field boundaries, cotton plots, or roads were discarded. A total of 4096 high-quality image tiles were retained for annotation.
Manual annotation followed the Pascal VOC standard [
40] and was performed with the open-source tool LabelImg (version 1.8.6) [
41]. Bounding boxes were drawn around individual tree crowns and labeled with the corresponding species. Annotation files were saved in XML format [
42], containing class labels, bounding box coordinates, and image metadata, and served as the ground truth for model training and evaluation.
To address class imbalance and expand the dataset, data augmentation was applied to the 4096 annotated tiles. For underrepresented classes, techniques such as flipping, random rotation, brightness adjustment [
43,
44], and scaling were applied to increase sample diversity. Specifically, random rotations of ±15°, ±30°, and ±45° were used, brightness levels were varied within ±20%, and scaling factors between 0.9 and 1.1 were applied to preserve object proportions while minimizing distortion. Horizontal and vertical flipping were each performed with a 50% probability.
The effectiveness of such class-specific augmentation is consistent with prior findings that class-balanced strategies can alleviate dataset imbalance and improve detection performance. For example, Maharana et al. [
44] reviewed augmentation techniques for imbalanced datasets and highlighted the role of targeted augmentation in improving minority-class representation, while Wu et al. [
43] demonstrated that class-wise augmentation significantly boosted detection accuracy in UAV fruit detection tasks.
As a result of this targeted augmentation strategy, the dataset expanded to 12,747 image tiles, substantially enhancing diversity and generalization, particularly for classes with limited original samples. The dataset was then randomly divided into training, validation, and test sets in an 8:1:1 ratio.
Figure 2 illustrates the complete data preparation pipeline, while
Table 2 reports dataset distribution statistics and
Table 3 details class-wise species composition.
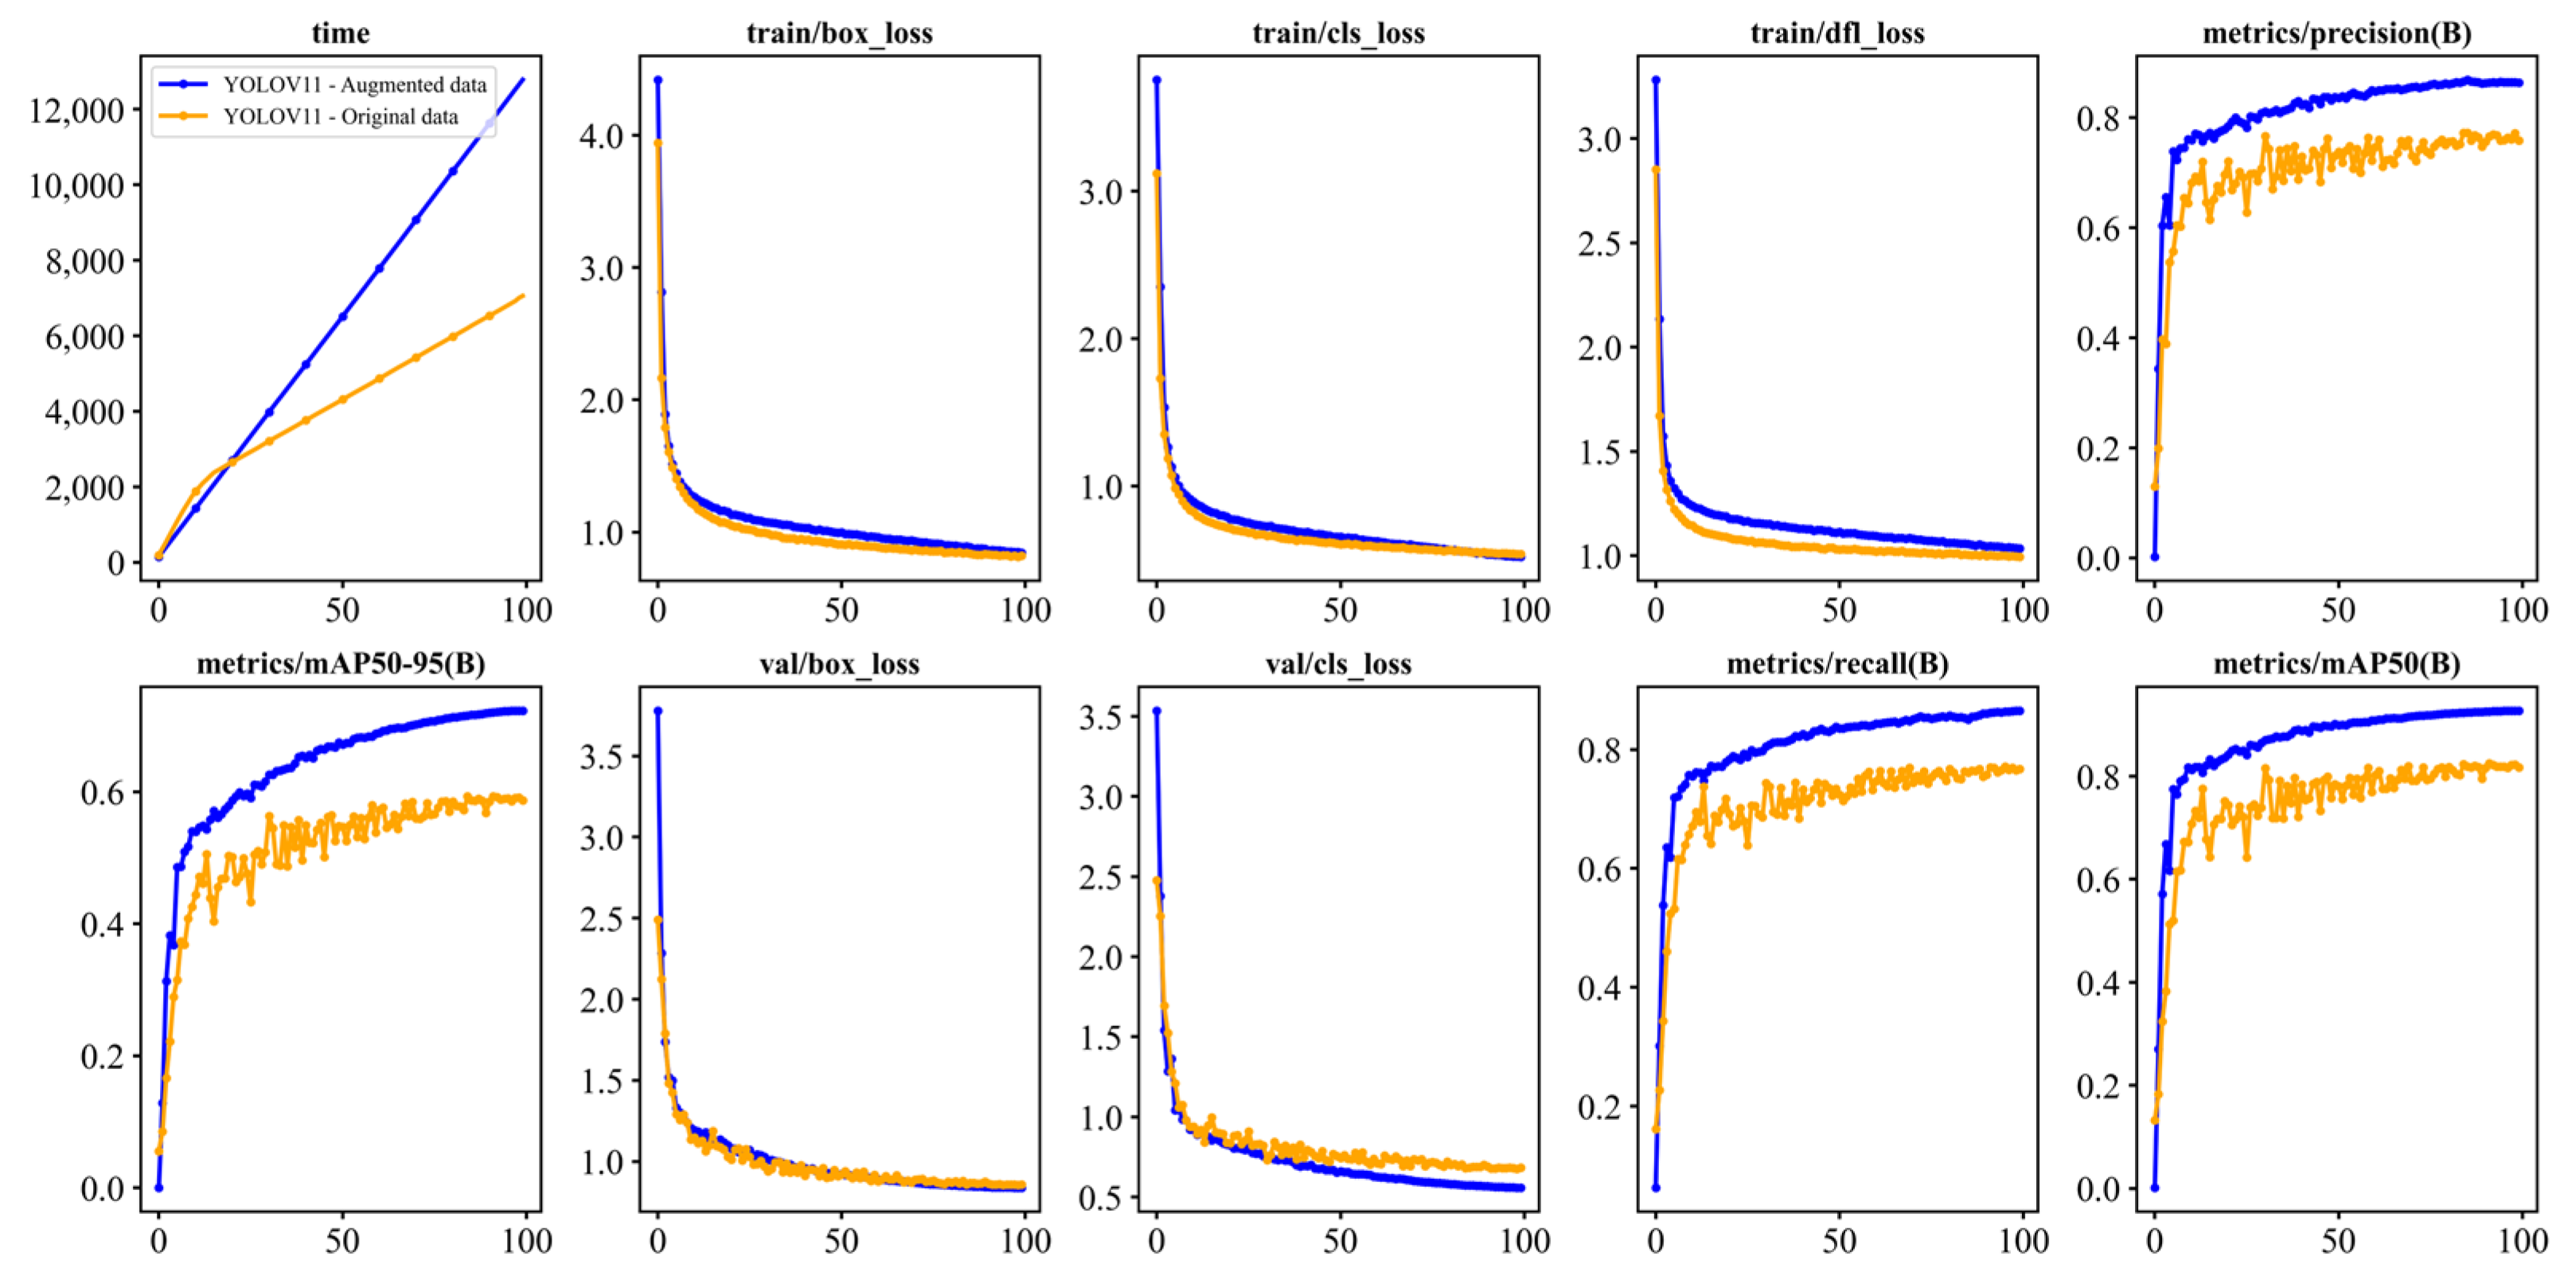
To evaluate the effectiveness of the augmentation strategy, a baseline YOLOv11 model was trained on both the original and augmented datasets. As shown in
Figure 3, the model trained with augmented data achieved faster convergence and consistently outperformed the baseline in terms of loss, precision, recall, and mean Average Precision (mAP).
Table 4 summarizes the augmentation ratio applied to each species. Four underrepresented classes—cherry, apricot, walnut, and saxaul—were increased by 400%, whereas prune and pomegranate were not augmented due to sufficient representation. This targeted augmentation approach helped balance the dataset and mitigate overfitting to dominant classes.
Although augmentation improved class balance, no additional methods—such as class-weighted loss functions, focal loss, or oversampling—were considered in this study. These techniques will be investigated in future work to further enhance model robustness under class-imbalanced conditions.
2.4. YOLOv11-OAM Architecture Overview
Tree species recognition in UAV imagery presents several challenges, including densely distributed objects, subtle morphological variations, and significant differences in object scale. In orchard environments, these difficulties are compounded by canopy overlap, high inter-species visual similarity, and background clutter, all of which contribute to reduced detection accuracy. These challenges call for models capable of precise localization and fine-grained semantic discrimination.
YOLO-based detectors are widely used in agricultural remote sensing due to their balance between speed and accuracy. However, mainstream versions (e.g., YOLOv5, YOLOv8, YOLOv11) are primarily optimized for general object detection and often underperform in specialized scenarios such as detecting small, overlapping tree crowns.
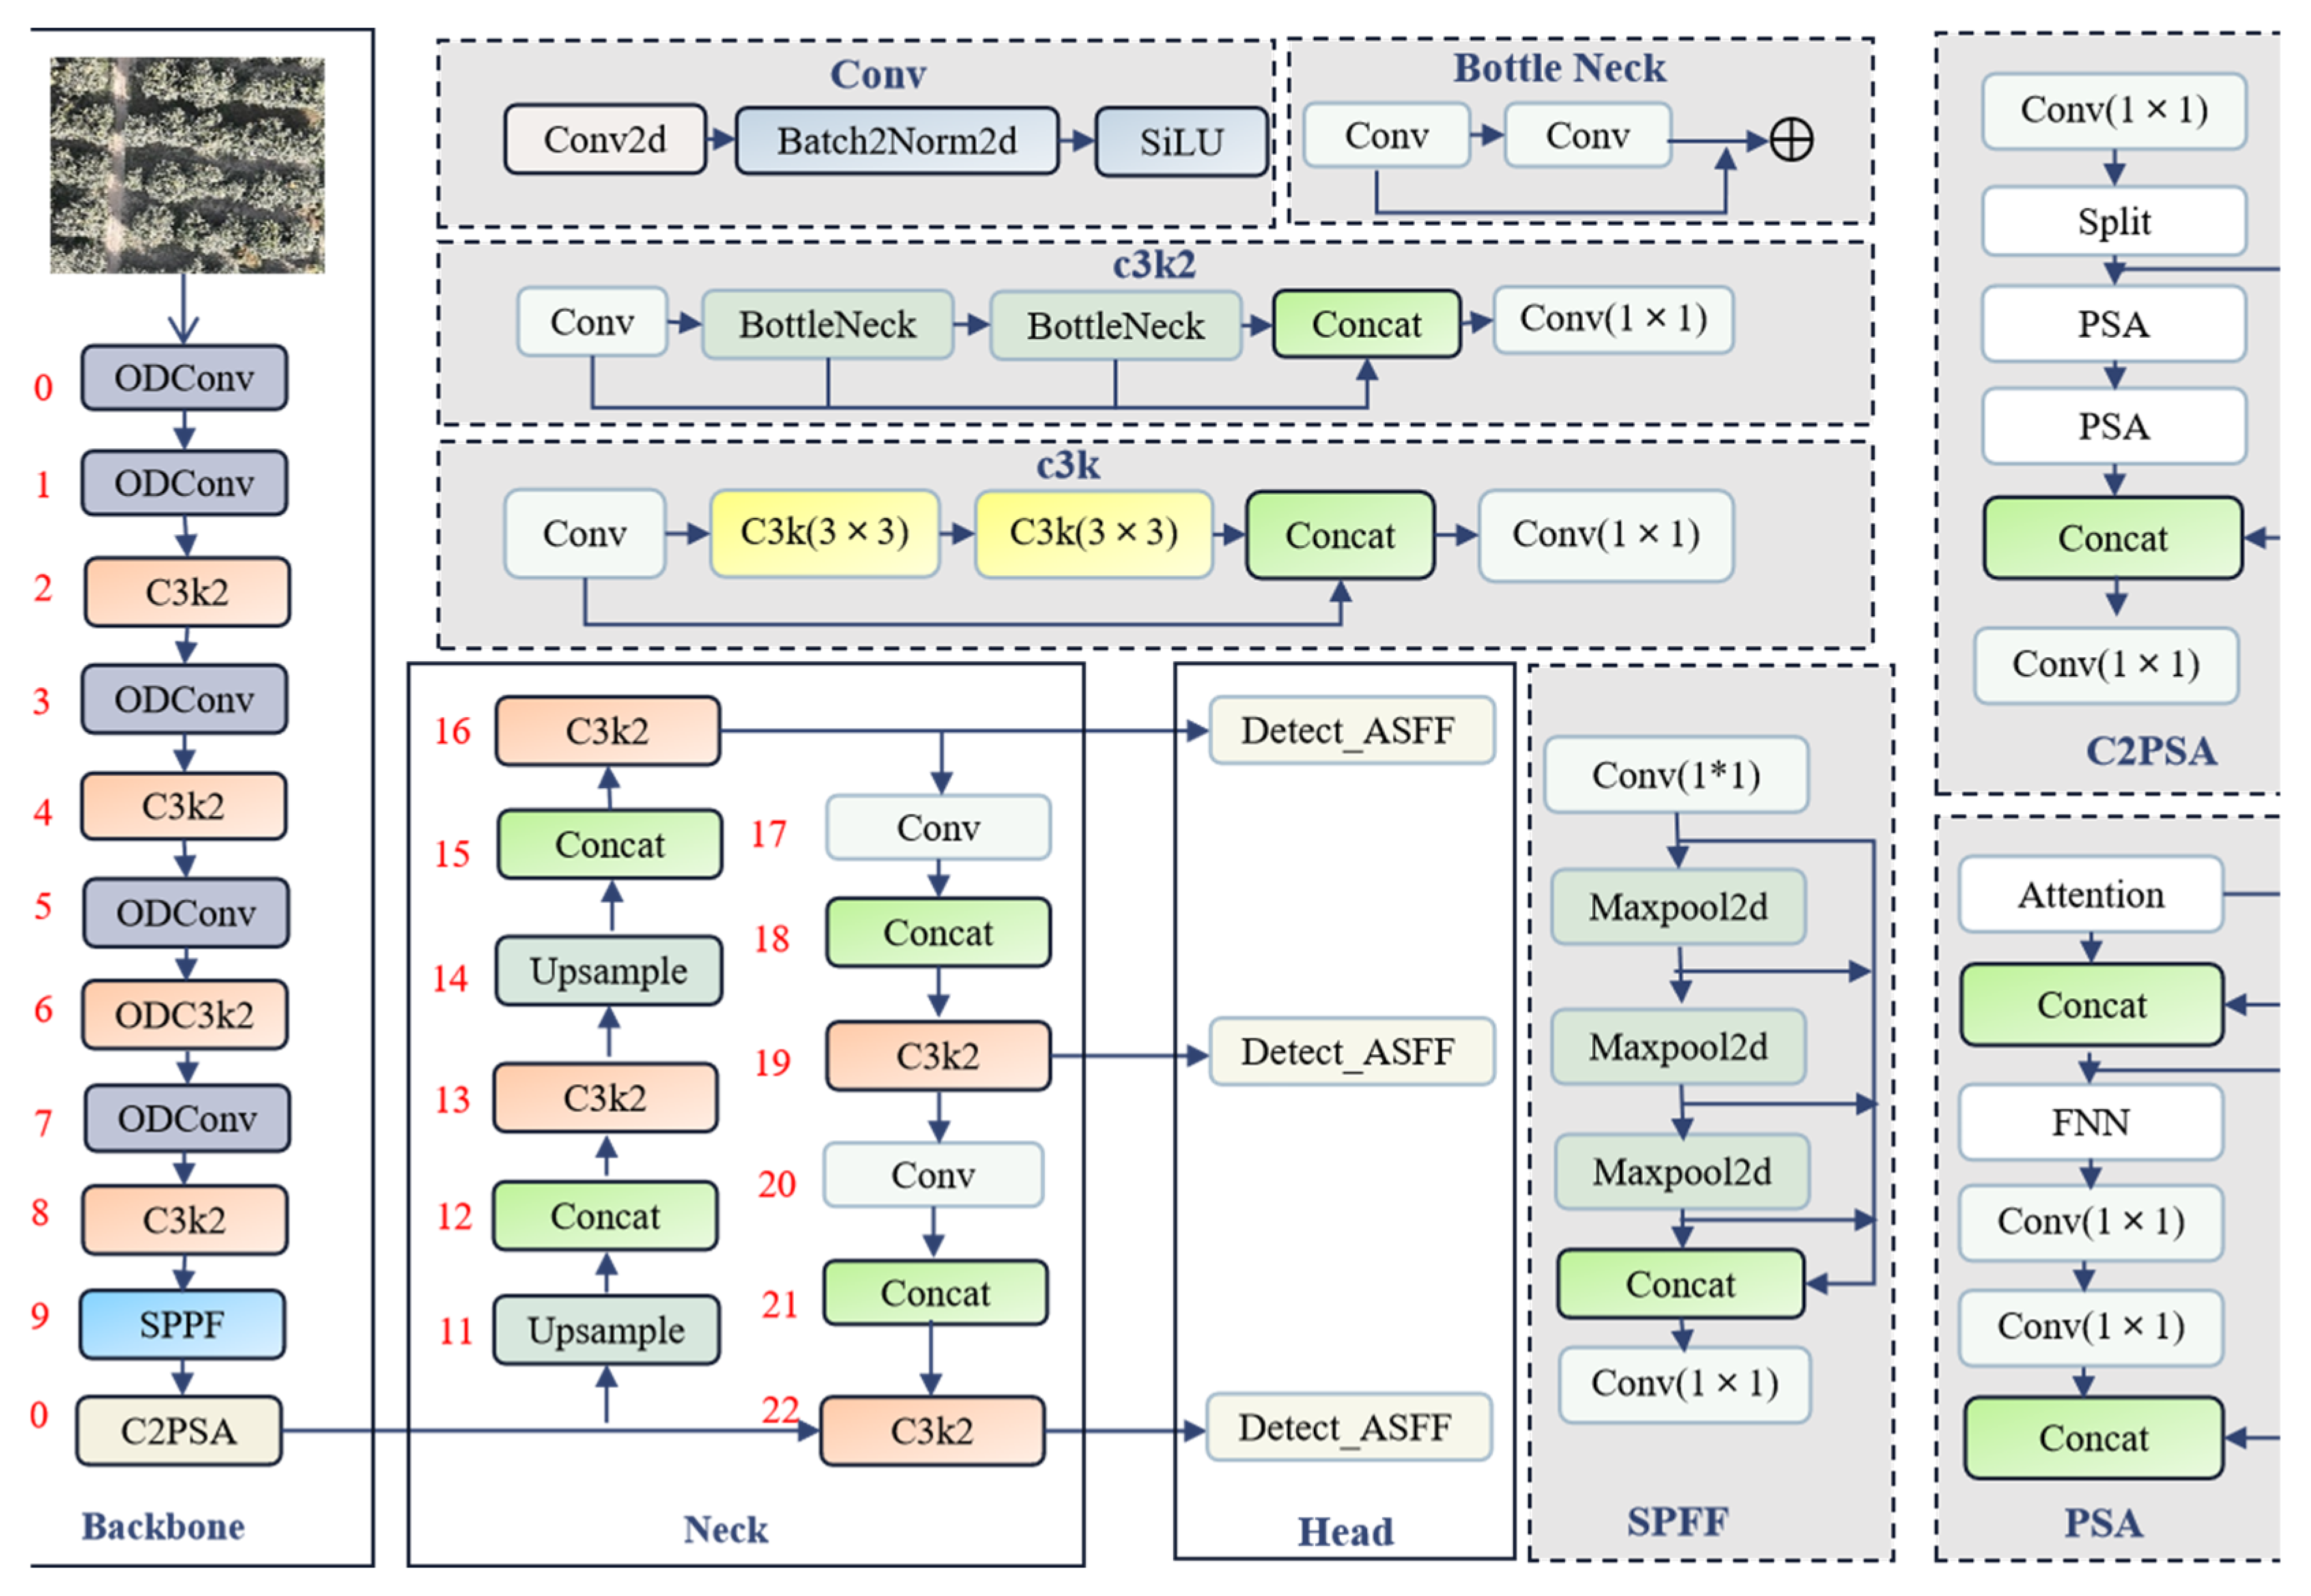
To overcome these limitations, we introduce YOLOv11-OAM, an enhanced one-stage detector that incorporates three key modules: (1) Omni-Dimensional Dynamic Convolution (ODConv) for adaptive, multi-axis feature extraction; (2) Adaptive Spatial Feature Fusion (Detect_ASFF) for dynamic, multi-scale feature integration; and (3) Multi-Point Distance IoU (MPDIoU) for geometry-aware bounding box regression under occlusion.
Together, these components improve detection robustness and fine-grained classification for densely distributed and visually similar tree species.
Figure 4 illustrates the integration of ODConv, Detect_ASFF, and MPDIoU into the YOLOv11 architecture.
2.4.1. ODConv Module
Omni-Dimensional Dynamic Convolution (ODConv) [
33,
34] is a dynamic convolution mechanism designed to improve the adaptability of feature extraction layers. Conventional convolutions use fixed kernels across all inputs, which limits their ability to capture diverse spatial patterns and object structures—particularly in UAV imagery with varying canopy textures and target densities. ODConv addresses this limitation by generating content-adaptive kernels along four dimensions: spatial position, input channel, output channel, and kernel index.
Unlike earlier dynamic convolutions such as CondConv and DyConv, which reweight kernels along a single dimension, ODConv applies attention across four orthogonal axes. In this way, it generates context-aware convolutional weights tailored to the input feature map. This enables the simultaneous capture of fine-grained local details and global semantic context.
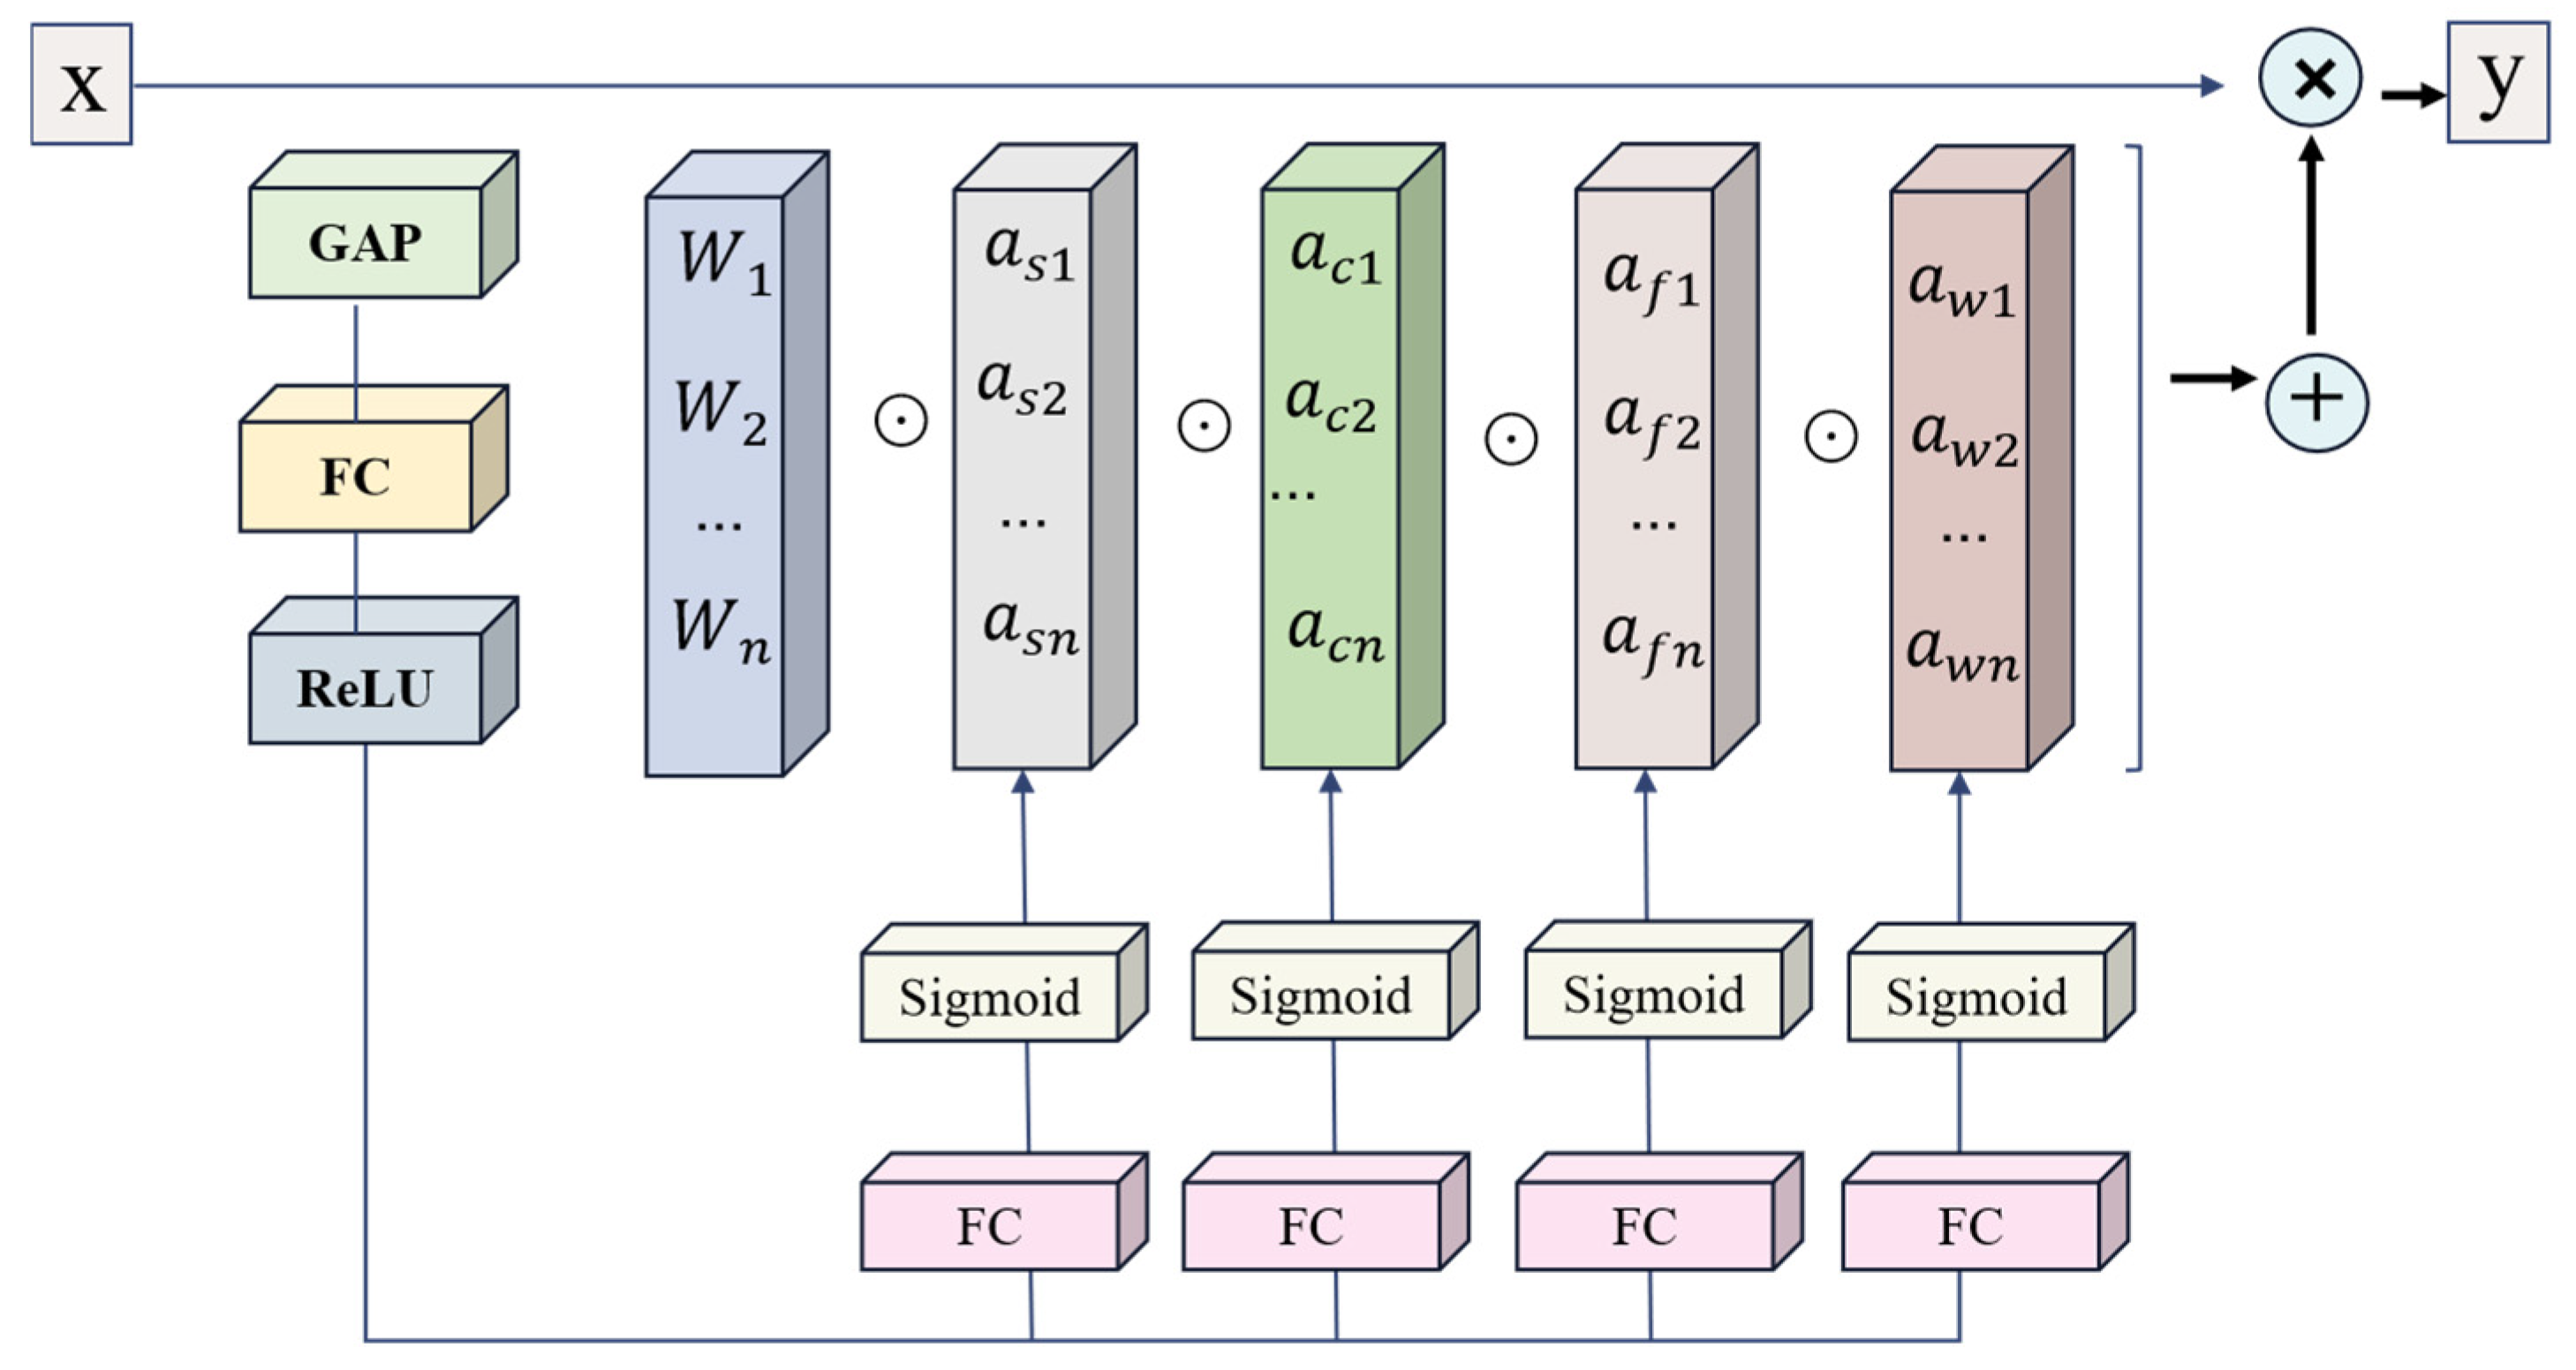
As illustrated in
Figure 5, ODConv first applies global average pooling to extract contextual information. Four parallel attention branches—channel, output channel, spatial, and kernel—then produce multi-dimensional attention weights. These weights are used to construct a dynamic convolutional kernel, which is subsequently applied through standard convolution to generate spatially adaptive feature maps.
In YOLOv11-OAM, ODConv modules are selectively integrated into the middle and deep stages of the backbone network, where high-level semantic and spatial features are extracted. By dynamically adapting convolutional behavior to local context, ODConv enhances the representation of irregular canopy structures, blurred object boundaries, and inter-class ambiguity—common challenges in UAV orchard imagery. Prior studies have likewise shown that dynamic convolution can improve detection robustness in remote sensing small-object tasks under dense and overlapping conditions [
45]. This integration therefore offers stronger capability for distinguishing morphologically similar species in complex orchard environments.
2.4.2. Detect_ASFF Module
Detect_ASFF [
35,
36], the core detection head of YOLOv11-OAM, plays a crucial role in improving multi-scale detection accuracy. It integrates the fifth-generation Adaptive Spatial Feature Fusion (ASFFv5) mechanism with Distribution Focal Loss (DFL), specifically designed to address challenges in UAV orchard imagery such as large target-scale variation and canopy overlap. By dynamically aggregating features across large, medium, and small detection branches, ASFF enhances the model’s ability to distinguish fine-grained categories and densely overlapping instances.
Unlike conventional approaches (e.g., fixed-weight fusion in FPNs), Detect_ASFF leverages pixel-level spatial attention and channel-adaptive weighting to achieve flexible, data-driven multi-scale fusion. As shown in
Figure 6, the proposed Detect_ASFF achieves adaptive spatial fusion compared with the traditional feature pyramid network (FPN). Feature maps from three scales are first aligned spatially using convolution, max pooling, or nearest-neighbor upsampling to ensure resolution consistency. Lightweight convolutional blocks then compute attention maps for each scale, which are concatenated and normalized via softmax to produce pixel-wise adaptive fusion weights. This design ensures fine-grained, context-aware feature blending, improving cross-scale semantic consistency and enhancing robustness for small or occluded targets.
Mathematically, the fused feature map at spatial location
or scale l is computed as
subject to
where
is the spatially aligned feature map at scale
i, and
are the normalized adaptive fusion weights.
After pixel-wise fusion, the resulting feature map is processed by a convolutional layer to adjust its channel dimensions for classification and regression tasks. The regression branch employs Distribution Focal Loss (DFL), which models bounding box coordinates as discrete probability distributions instead of scalar values. This formulation enables more accurate and continuous spatial localization through probabilistic expectation, enhancing precision for small or overlapping objects.
The forward pass of the Detect_ASFF module begins by fusing multi-scale features from three detection layers using ASFF. The fused output is processed by convolutional layers for simultaneous classification and bounding box regression. The regression branch employs Distribution Focal Loss (DFL) to model localization uncertainty before decoding the output into bounding box coordinates. Final predictions consist of concatenated bounding boxes and corresponding class probabilities for training and inference.
To enhance the precision of bounding box regression, the Distribution Focal Loss (DFL) models each coordinate as a discrete probability distribution over
predefined bins. The network predicts the probability
of the coordinate falling into the
bin, where
.
where
is the coordinate value corresponding to bin
.
The DFL is formulated as
where
is the predicted probability for the ground-truth bin,
is the one-hot encoded ground-truth label,
is a scaling factor, and
is the focusing factor.
This probabilistic formulation allows the model to capture uncertainty and spatial distribution in coordinate regression, yielding smoother gradients and improved localization performance, especially for small or occluded objects.
2.4.3. Multi-Point Distance Intersection over Union (MPDIoU) Loss Function
Accurate bounding box regression is critical for reliable object detection, particularly in UAV orchard imagery where tree crowns are densely packed, overlapping, and frequently occluded. Traditional IoU-based losses—such as GIoU, DIoU, and CIoU—primarily focus on overlap and center alignment but often lack geometric sensitivity for small or crowded targets.
To address this limitation, we employ Multi-Point Distance IoU (MPDIoU) [
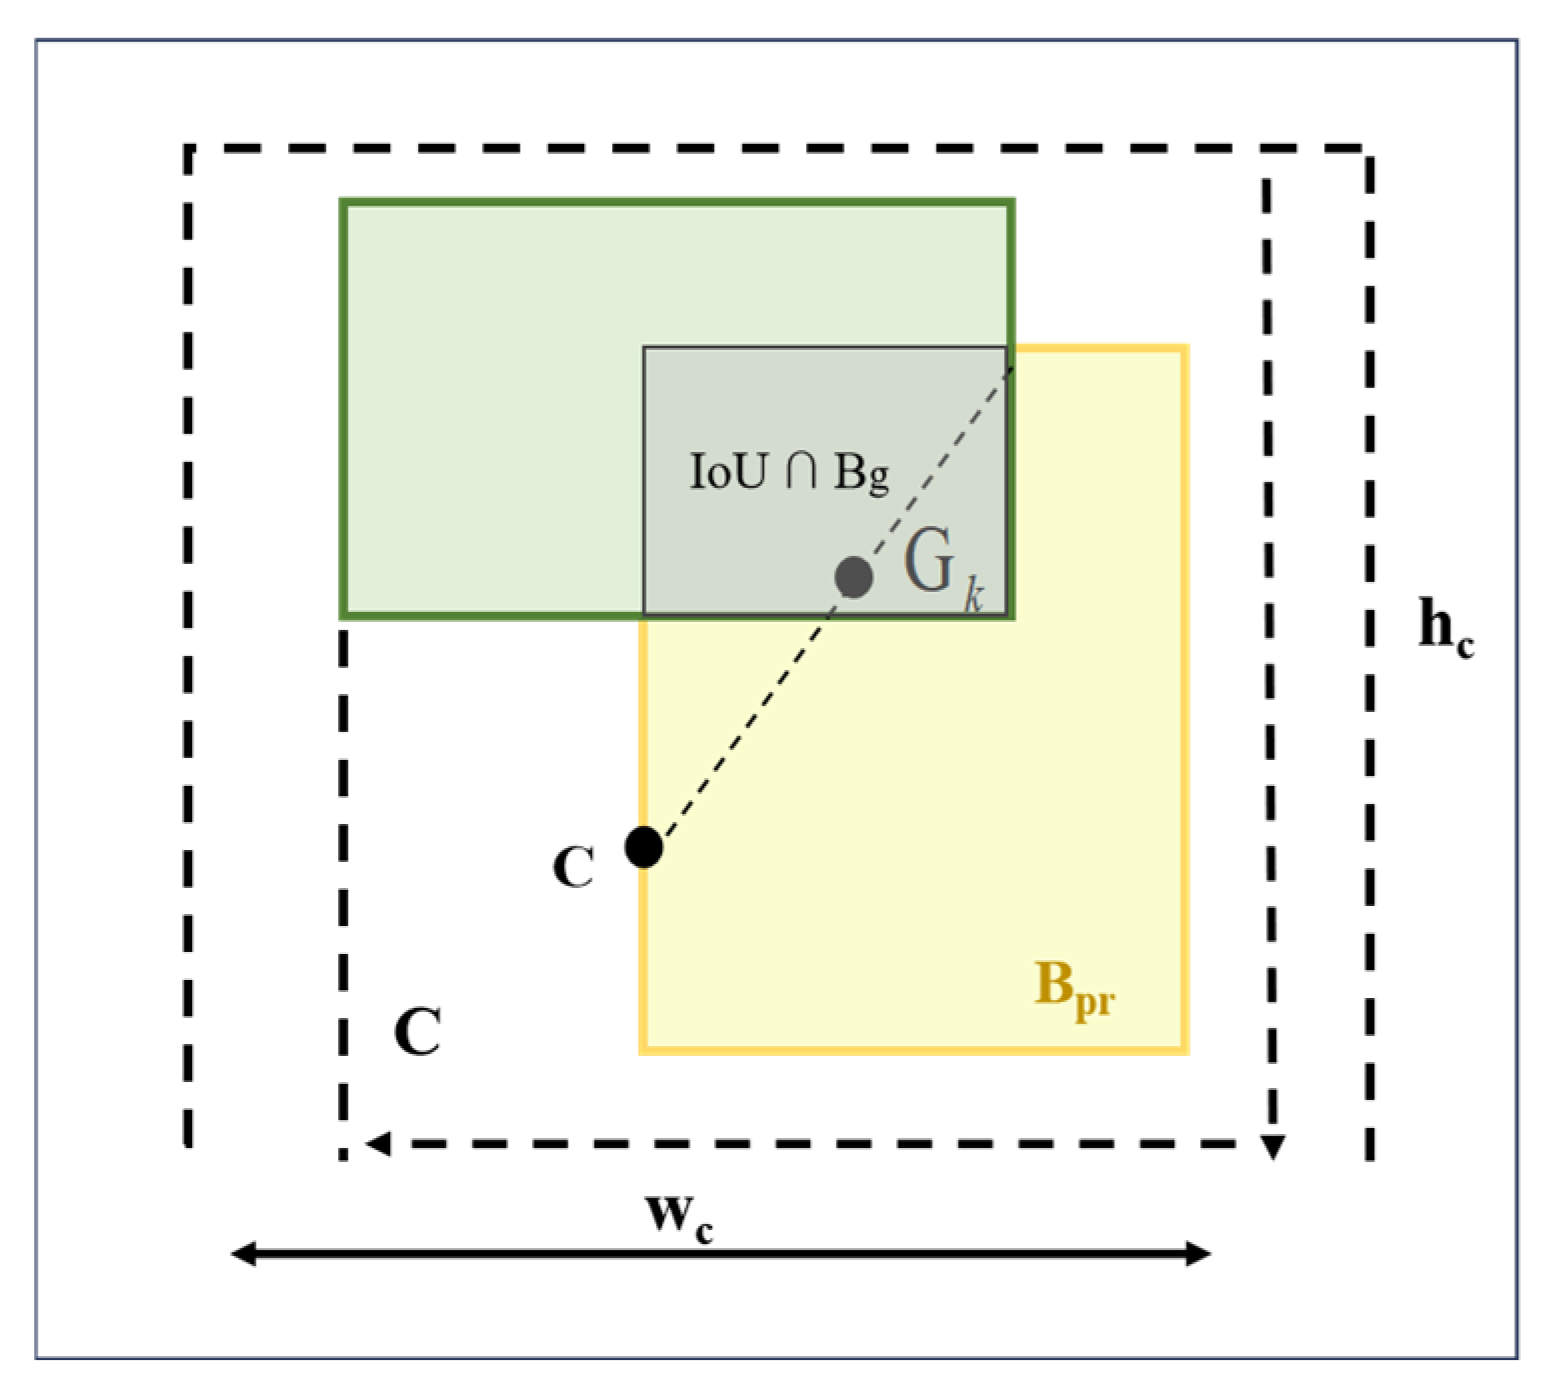
37] as the regression loss in the detection head. MPDIoU extends standard IoU by incorporating spatial misalignment penalties, computed via Euclidean distances between multiple reference points on predicted and ground-truth boxes. Nine key points are considered: the box center, four edge midpoints, and four corners.
Formally, let
and
denote the predicted and ground-truth bounding boxes, respectively, and
,
represent their
reference points. The MPDIoU loss is defined as
where
is the number of reference points,
is the diagonal length of the smallest enclosing box containing both
and
and
is the Euclidean distance.
This loss function provides more comprehensive geometric supervision by penalizing spatial misalignment across multiple points, which improves regression precision and convergence speed. Its normalization by the enclosing box diagonal length renders the loss scale-invariant, enhancing robustness to varying object sizes.
Figure 7 illustrates the MPDIoU bounding boxes, key reference points, and IoU overlap, clarifying the geometric relationships captured by the loss.
3. Experiments and Results
3.1. Experimental Setup and Training Parameters
All experiments were conducted on a Linux-based GPU server running Ubuntu, Python 3.10.0, and PyTorch 2.2.1. The hardware configuration included an NVIDIA GeForce RTX 4090 GPU (24 GB VRAM) with CUDA 12.1 (NVIDIA Corporation, Santa Clara, CA, USA), which provided sufficient computational capacity for large-scale deep learning tasks.
The model was trained for 100 epochs using the Adam optimizer with an initial learning rate of 0.01. A cosine annealing schedule without warm-up was adopted to ensure smooth convergence. Momentum and weight decay were set to 0.937 and 0.0001, respectively, to mitigate overfitting. The backbone network remained trainable to support end-to-end learning. Due to GPU memory constraints, the batch size was set to four. To improve training efficiency and reduce memory usage, PyTorch Automatic Mixed Precision (AMP) was enabled, allowing FP16 computation with dynamic loss scaling to maintain numerical stability.
3.2. Performance Evaluation Metrics of the Network Model
To comprehensively evaluate the performance of the proposed detector, we adopted standard metrics covering accuracy, robustness, and computational efficiency. During inference, the model was assessed using precision, recall, F1-score, and mean Average Precision (mAP). These metrics are defined as follows.
3.2.1. Precision
Precision is used to measure the proportion of true positive samples among all the samples predicted as positive by the model, reflecting the model’s ability to control false positive (FP) instances. The formula for calculating precision is
where
represents true positives, and
represents false positives.
3.2.2. Recall
Recall represents the proportion of actual positive samples successfully identified by the model, and it is a key metric for measuring false negatives (
). The formula for calculating recall is
3.2.3. F1-Score
The F1-score is the harmonic mean of precision and recall, providing a comprehensive measure of the balance between the model’s ability to detect positive samples and its control over false positives. It is defined as follows:
3.2.4. mAP (Mean Average Precision)
The mean Average Precision (mAP) is a standard metric for evaluating object detection models, reflecting the overall accuracy across all object classes. In this study, mAP is reported in two variants:
mAP@0.5: The average AP value for all categories when the Intersection over Union (IoU) threshold is set to 0.5.
mAP@0.5:0.95: The average mAP under the COCO evaluation standard, where IoU is evaluated from 0.5 to 0.95 with a 0.05 step, reflecting the model’s detection performance at varying levels of localization accuracy.
3.2.5. Statistical Significance Analysis
To ensure that improvements were not attributable to random variation, each model was trained three times with different random seeds, and results are reported as mean ± standard deviation. In addition, bootstrap resampling with 1000 iterations was applied to estimate 95% confidence intervals for mAP values. Pairwise comparisons with the YOLOv11 baseline were performed, and improvements were deemed statistically significant at p < 0.05. This evaluation design ensures both reproducibility and statistical reliability.
3.3. Experimental Results
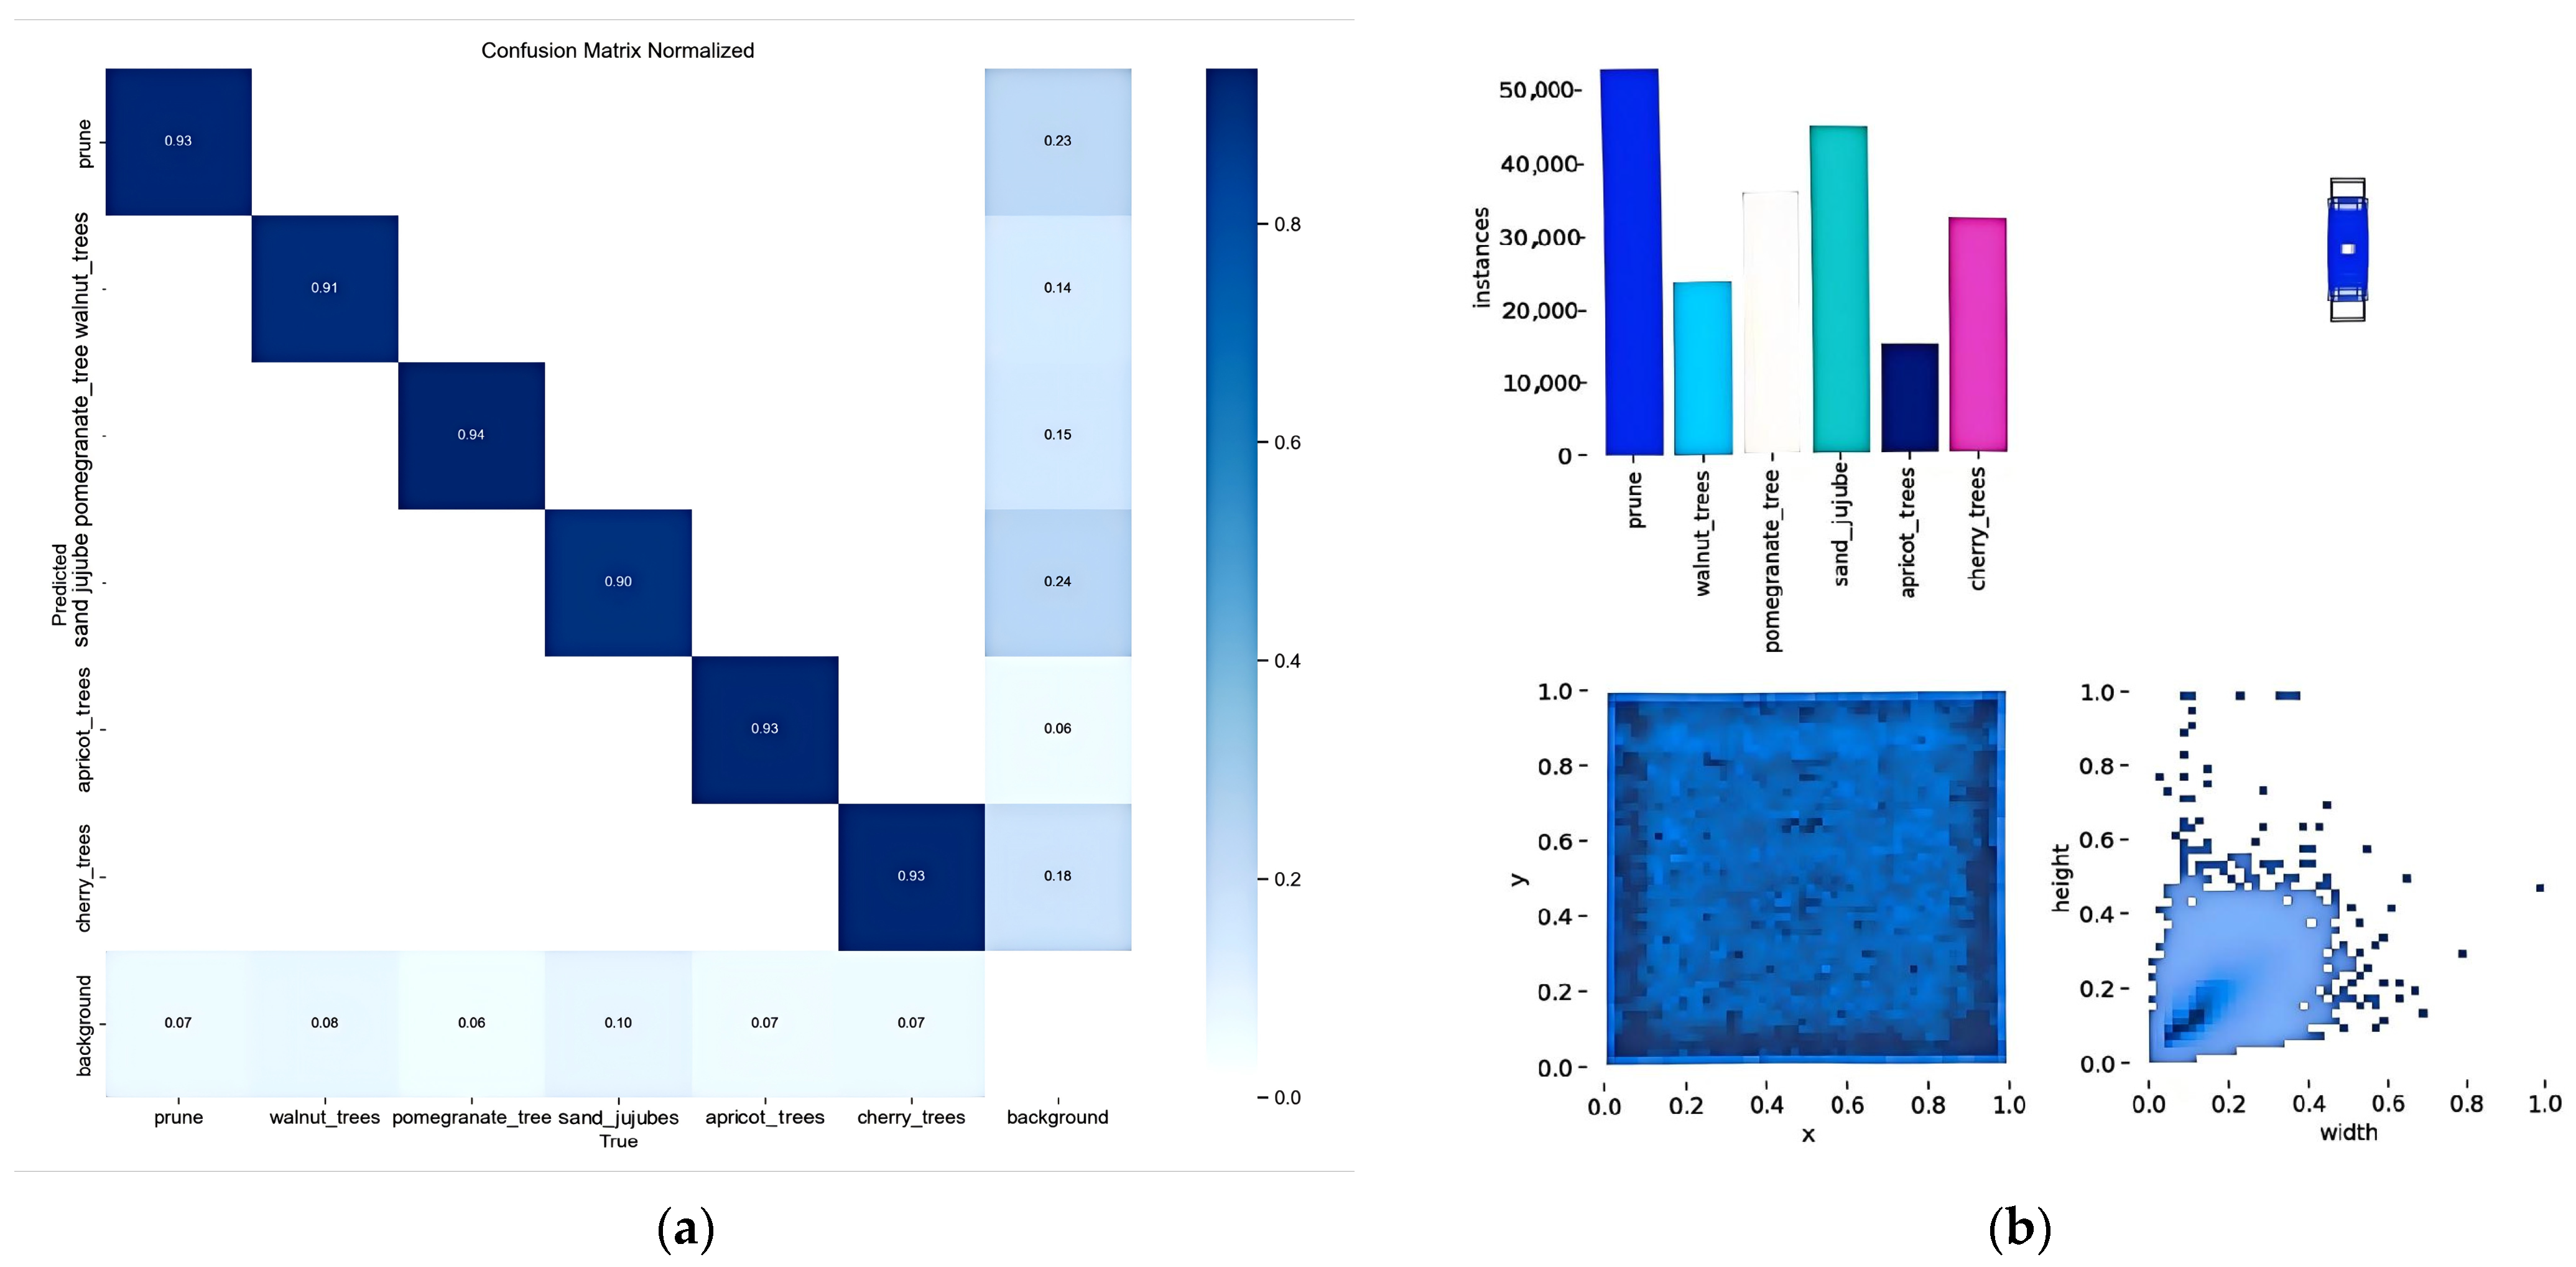
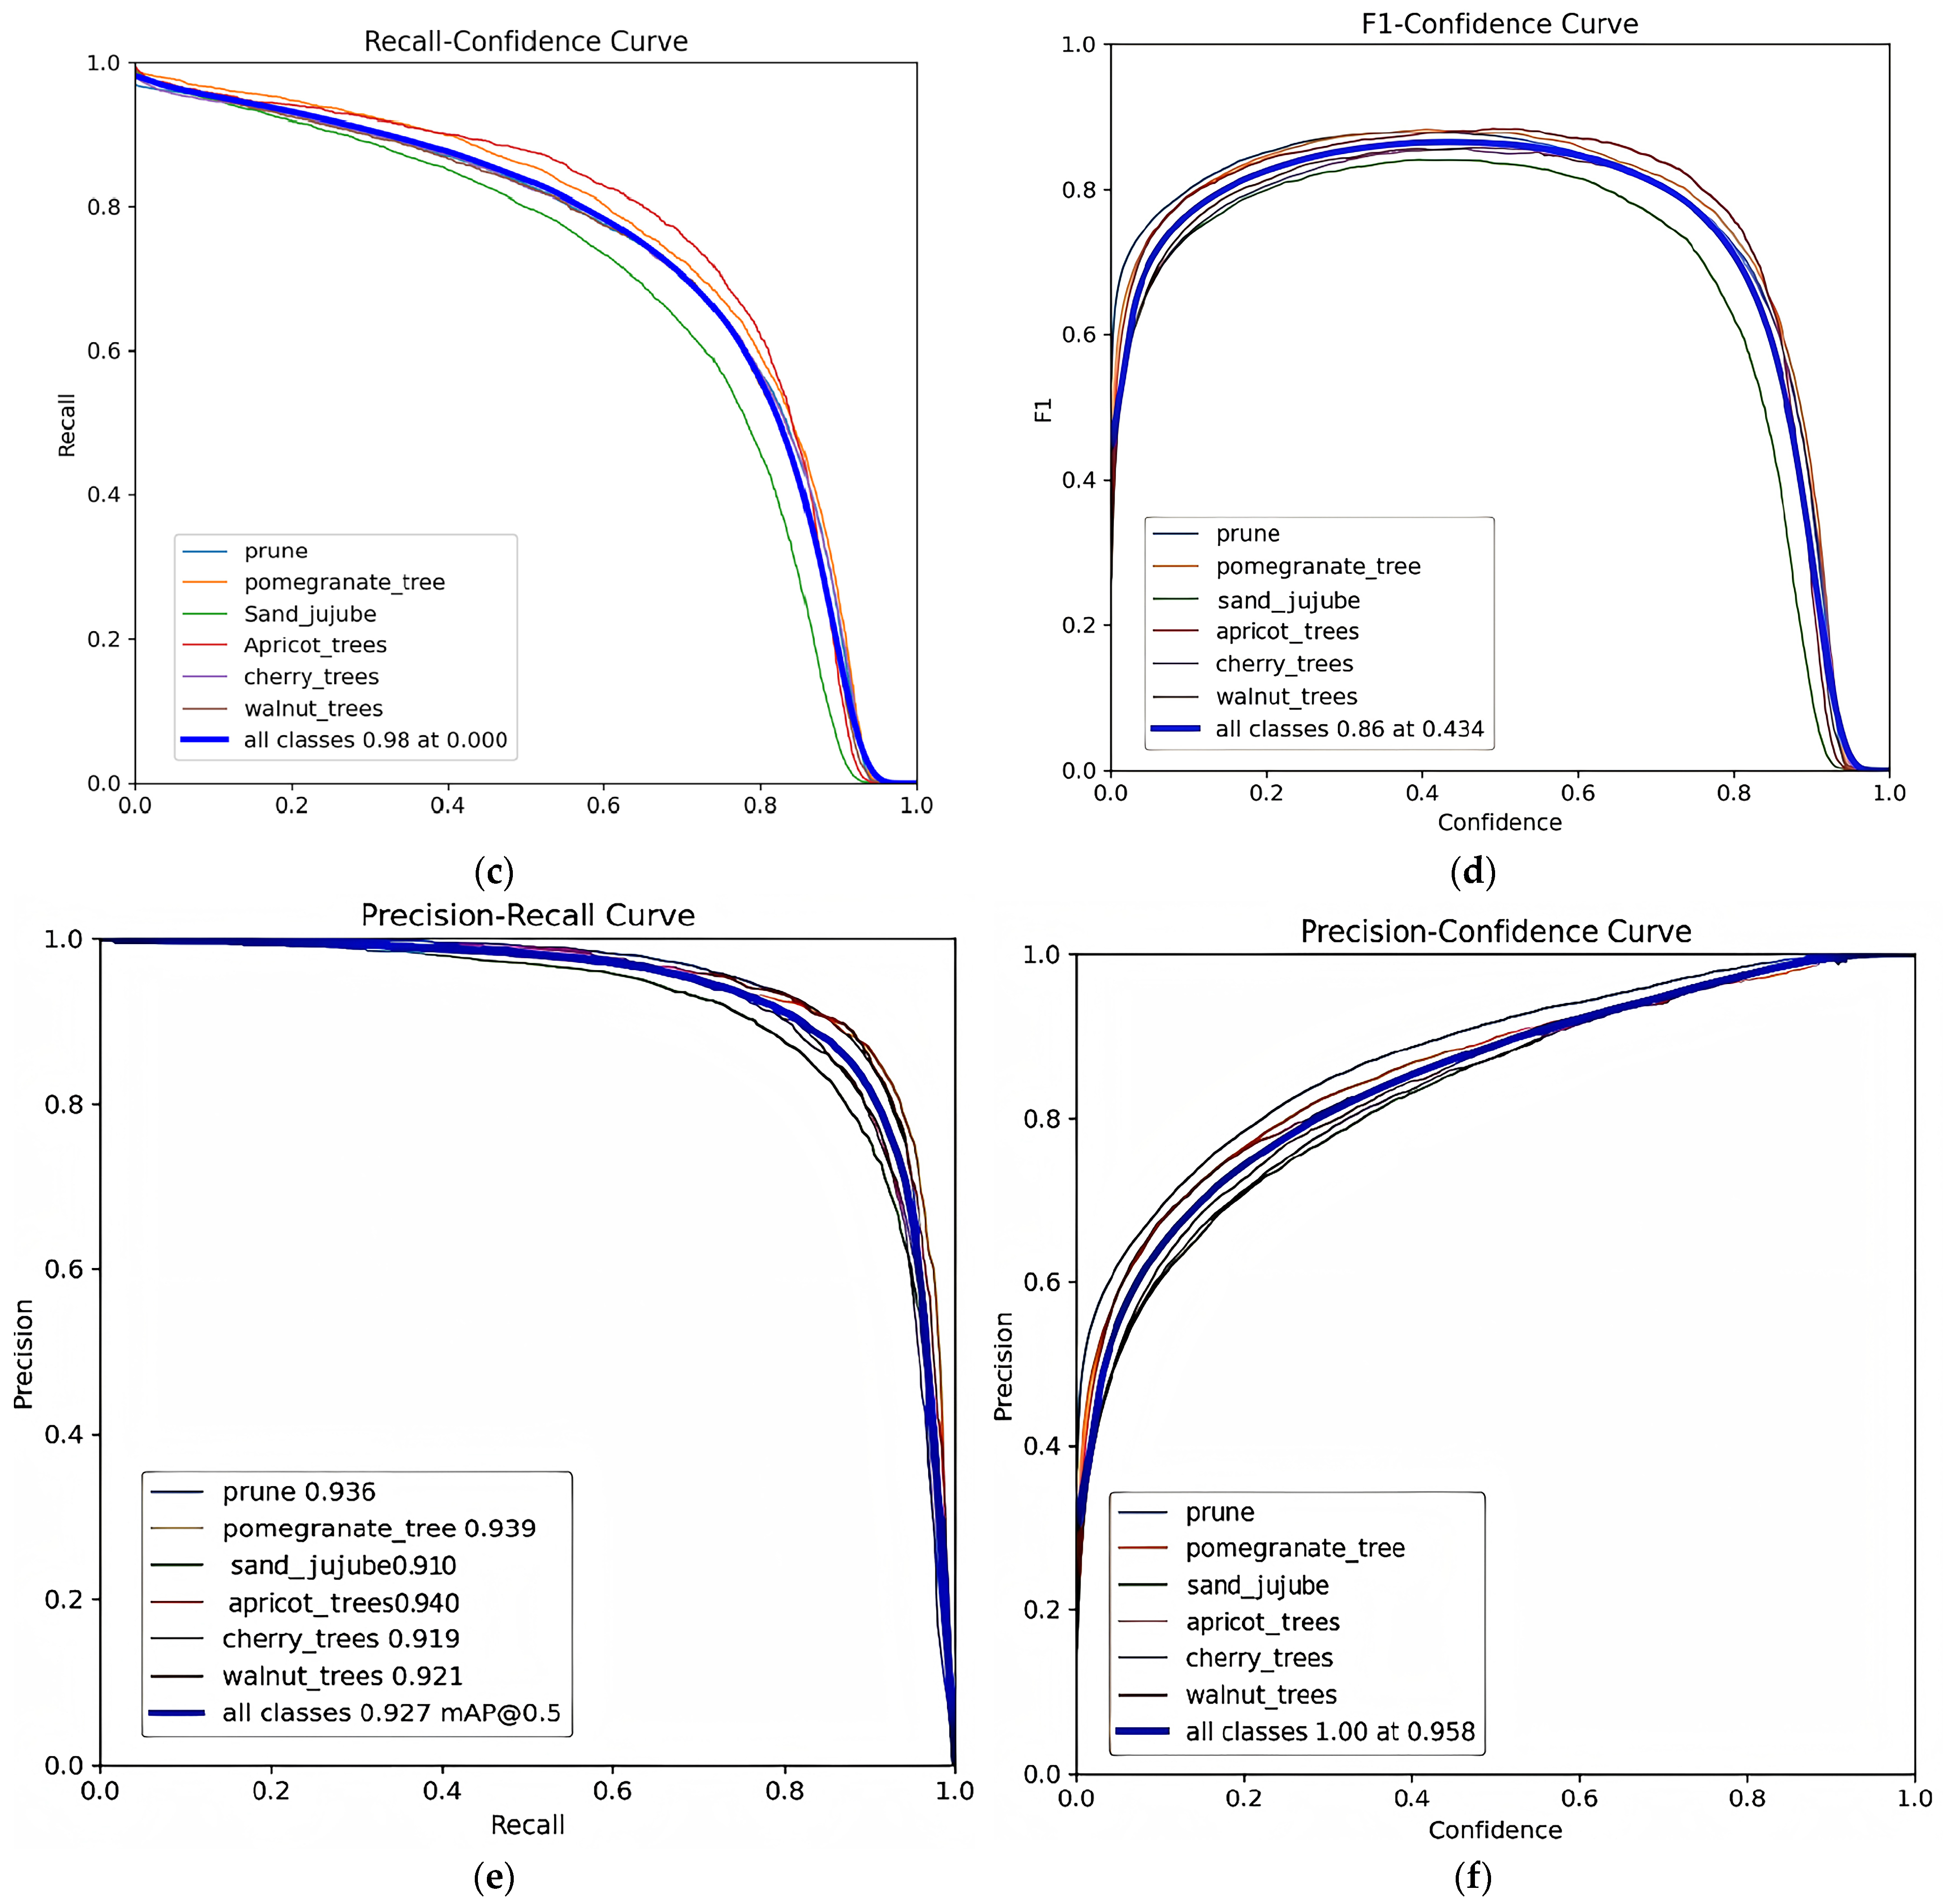
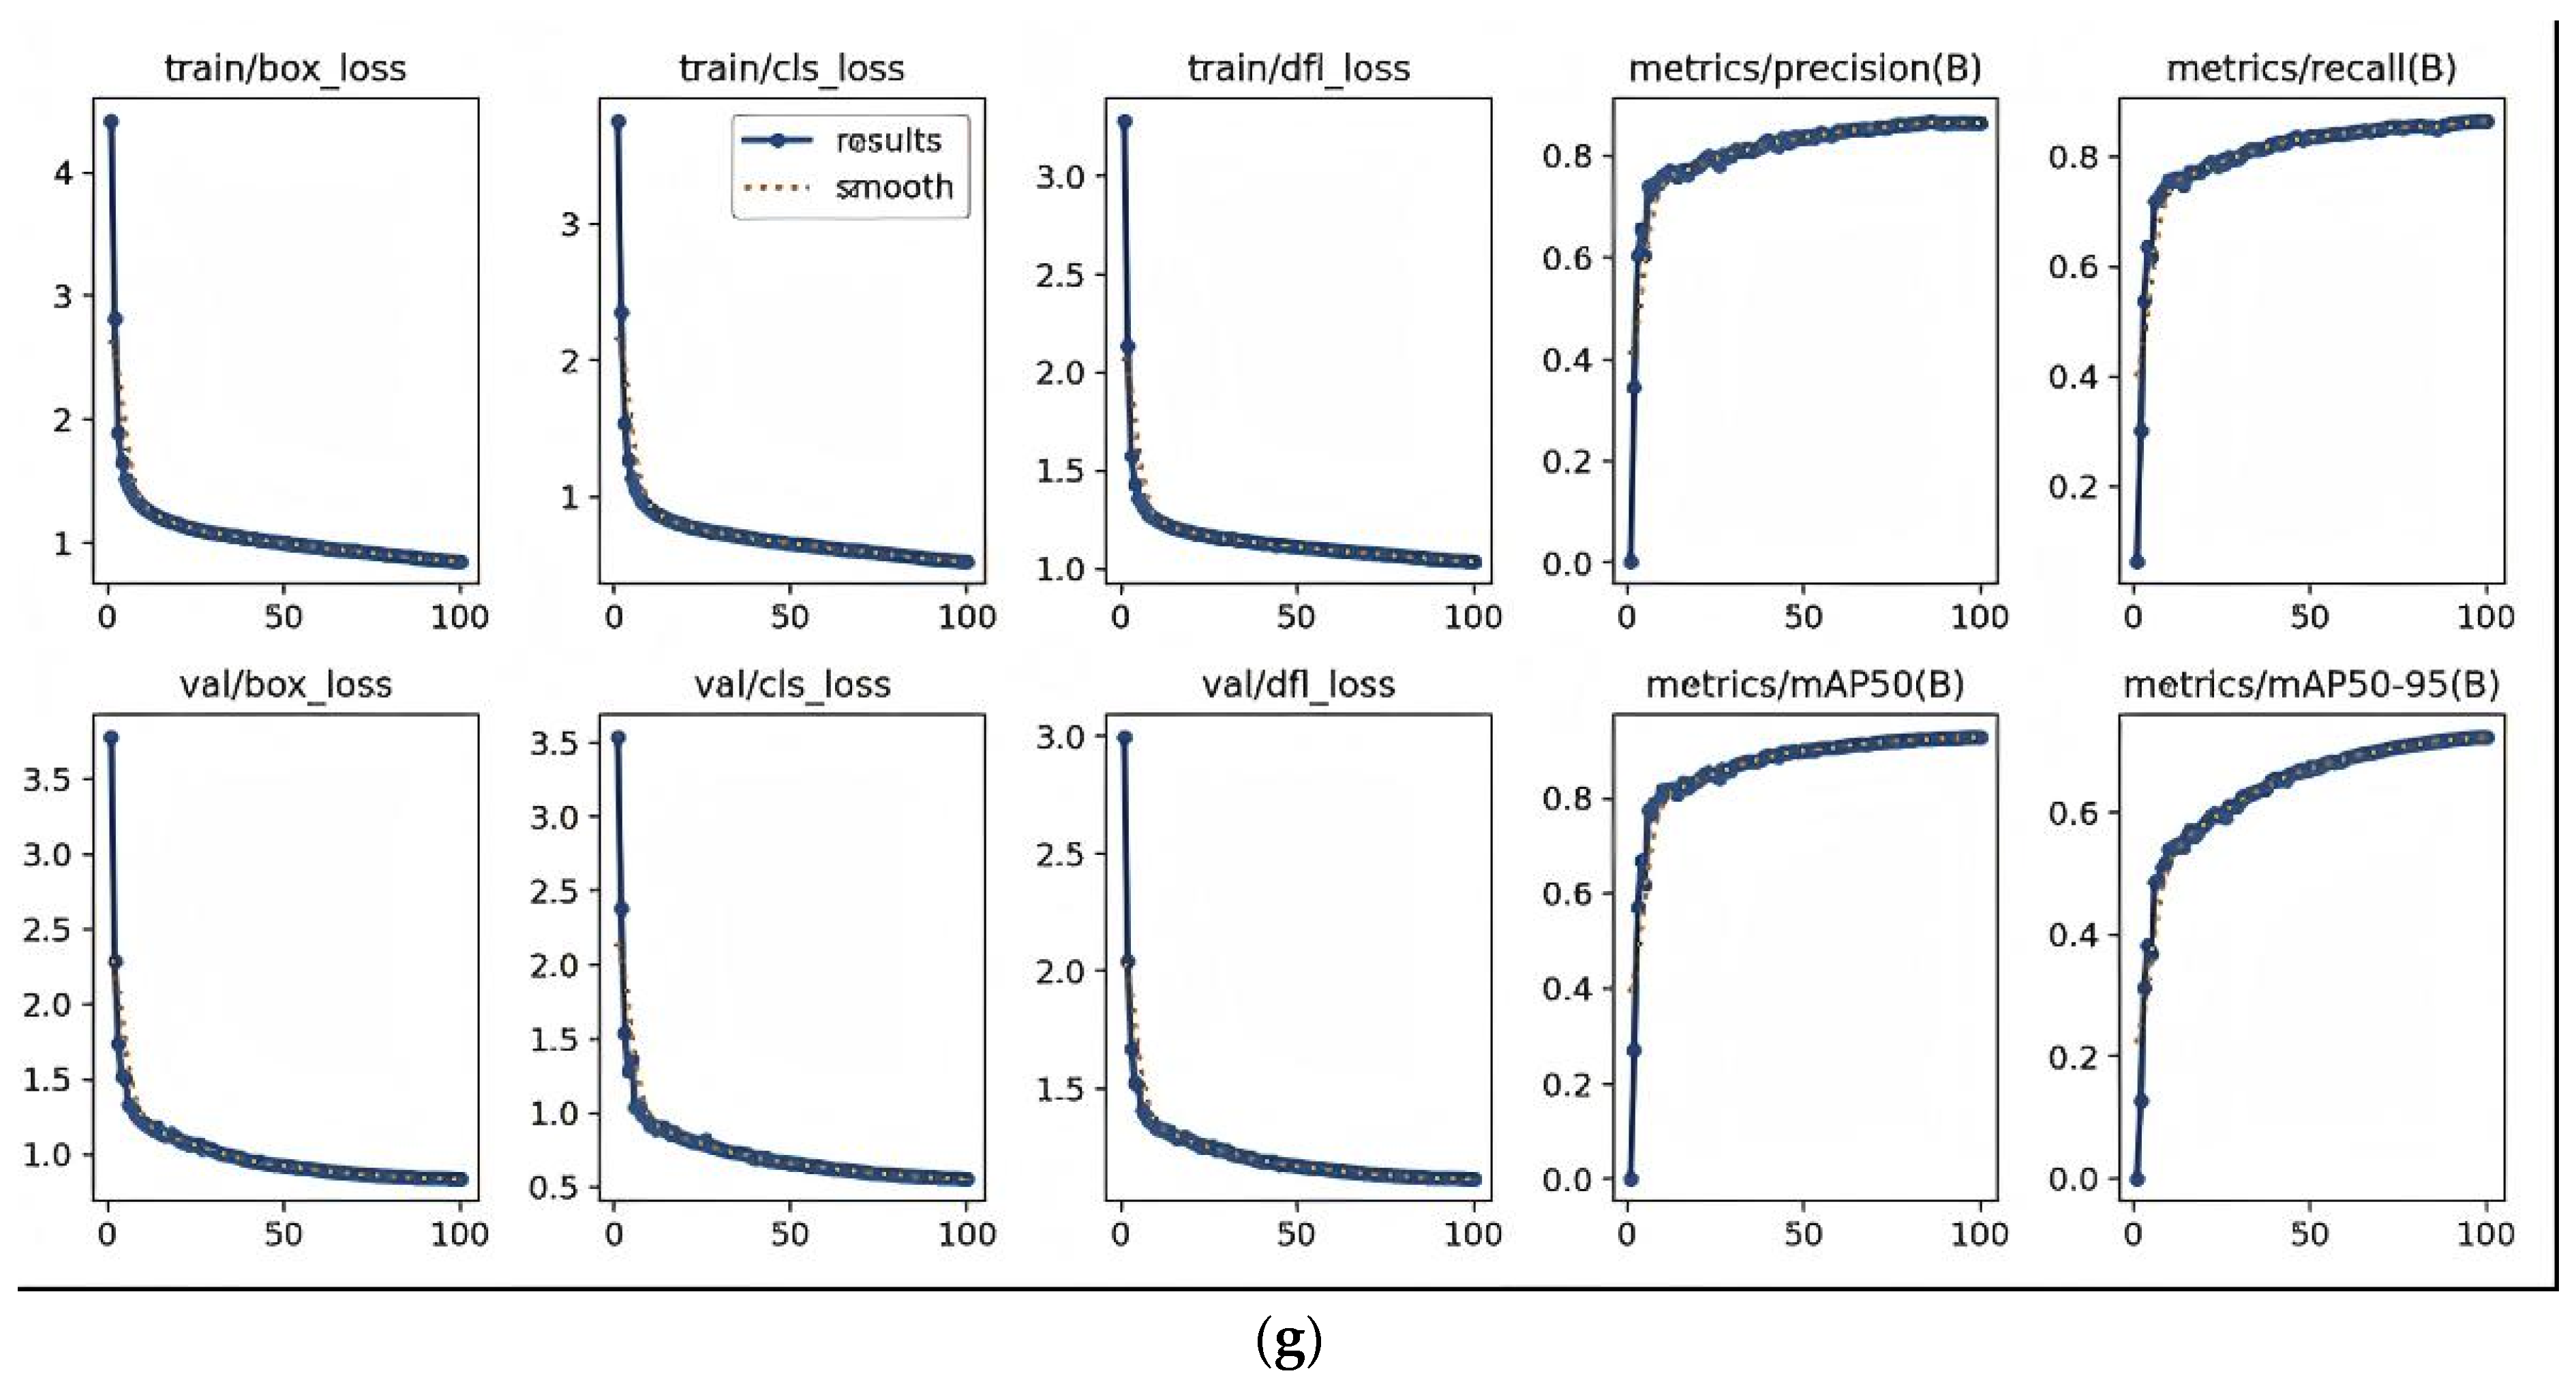
To comprehensively evaluate YOLOv11-OAM in UAV-based tree species recognition, we examined its classification accuracy, data distribution, robustness, and training convergence. These results are illustrated in
Figure 8.
As shown in
Figure 8a, most tree species were classified accurately, with Apricot, Pomegranate, and Prune achieving the highest precision. In contrast, Sand Jujube showed a higher false-negative rate due to blurred boundaries and crown overlap.
Figure 8b,c illustrate class frequency, spatial distribution, and bounding box aspect ratios, demonstrating that the dataset is well-structured and suitable for multi-scale learning.
Figure 8d–f show model performance under varying confidence thresholds. The model achieved its best F1-score (0.86) at a confidence threshold of 0.434. All curves remained smooth and stable, indicating strong discriminative ability and robustness. However, the PR curve for Sand Jujube dropped sharply, with about 25% of instances misclassified as background, resulting in an AP of only 91.0%.
As shown in
Figure 8g, both training and validation losses decreased rapidly during the first 50 epochs and then stabilized, while evaluation metrics improved steadily. The close alignment of training and validation curves indicates good convergence and generalization, with no evidence of overfitting.
To further evaluate model stability, we conducted three independent training runs with different random seeds. The results were consistent (mAP@0.5 = 93.15% ± 0.24; mAP@0.75 = 74.08% ± 0.31), indicating stable performance with low variance. In addition, bootstrap resampling with 1000 iterations was used to estimate 95% confidence intervals for the improvements over the YOLOv11 baseline. The analysis confirmed that the performance gains of YOLOv11-OAM were statistically significant (p < 0.05), confirming the robustness and reliability of the proposed method.
Table 5 reports the class-wise performance metrics, including precision, recall, mAP@0.5, and mAP@0.5:0.95. The results demonstrate strong performance for dominant species with abundant training samples. However, challenges persist for categories with ambiguous boundaries or high inter-class visual similarity, where performance remains comparatively lower.
These results confirm the effectiveness of integrating the three key components—ASFF, ODConv, and MPDIoU—into the detection architecture. ASFF enables adaptive feature aggregation across multiple spatial scales, improving resolution-sensitive representation. ODConv enhances the flexibility of convolutional operations by generating dynamic responses along spatial, channel, and kernel dimensions. MPDIoU introduces geometry-aware localization by penalizing spatial misalignment at multiple points between predicted and ground-truth boxes. Collectively, these modules substantially improve the model’s ability to detect small, densely distributed, and visually ambiguous tree species. Their contributions are further examined through ablation studies in
Section 3.4.
3.4. Ablation Study
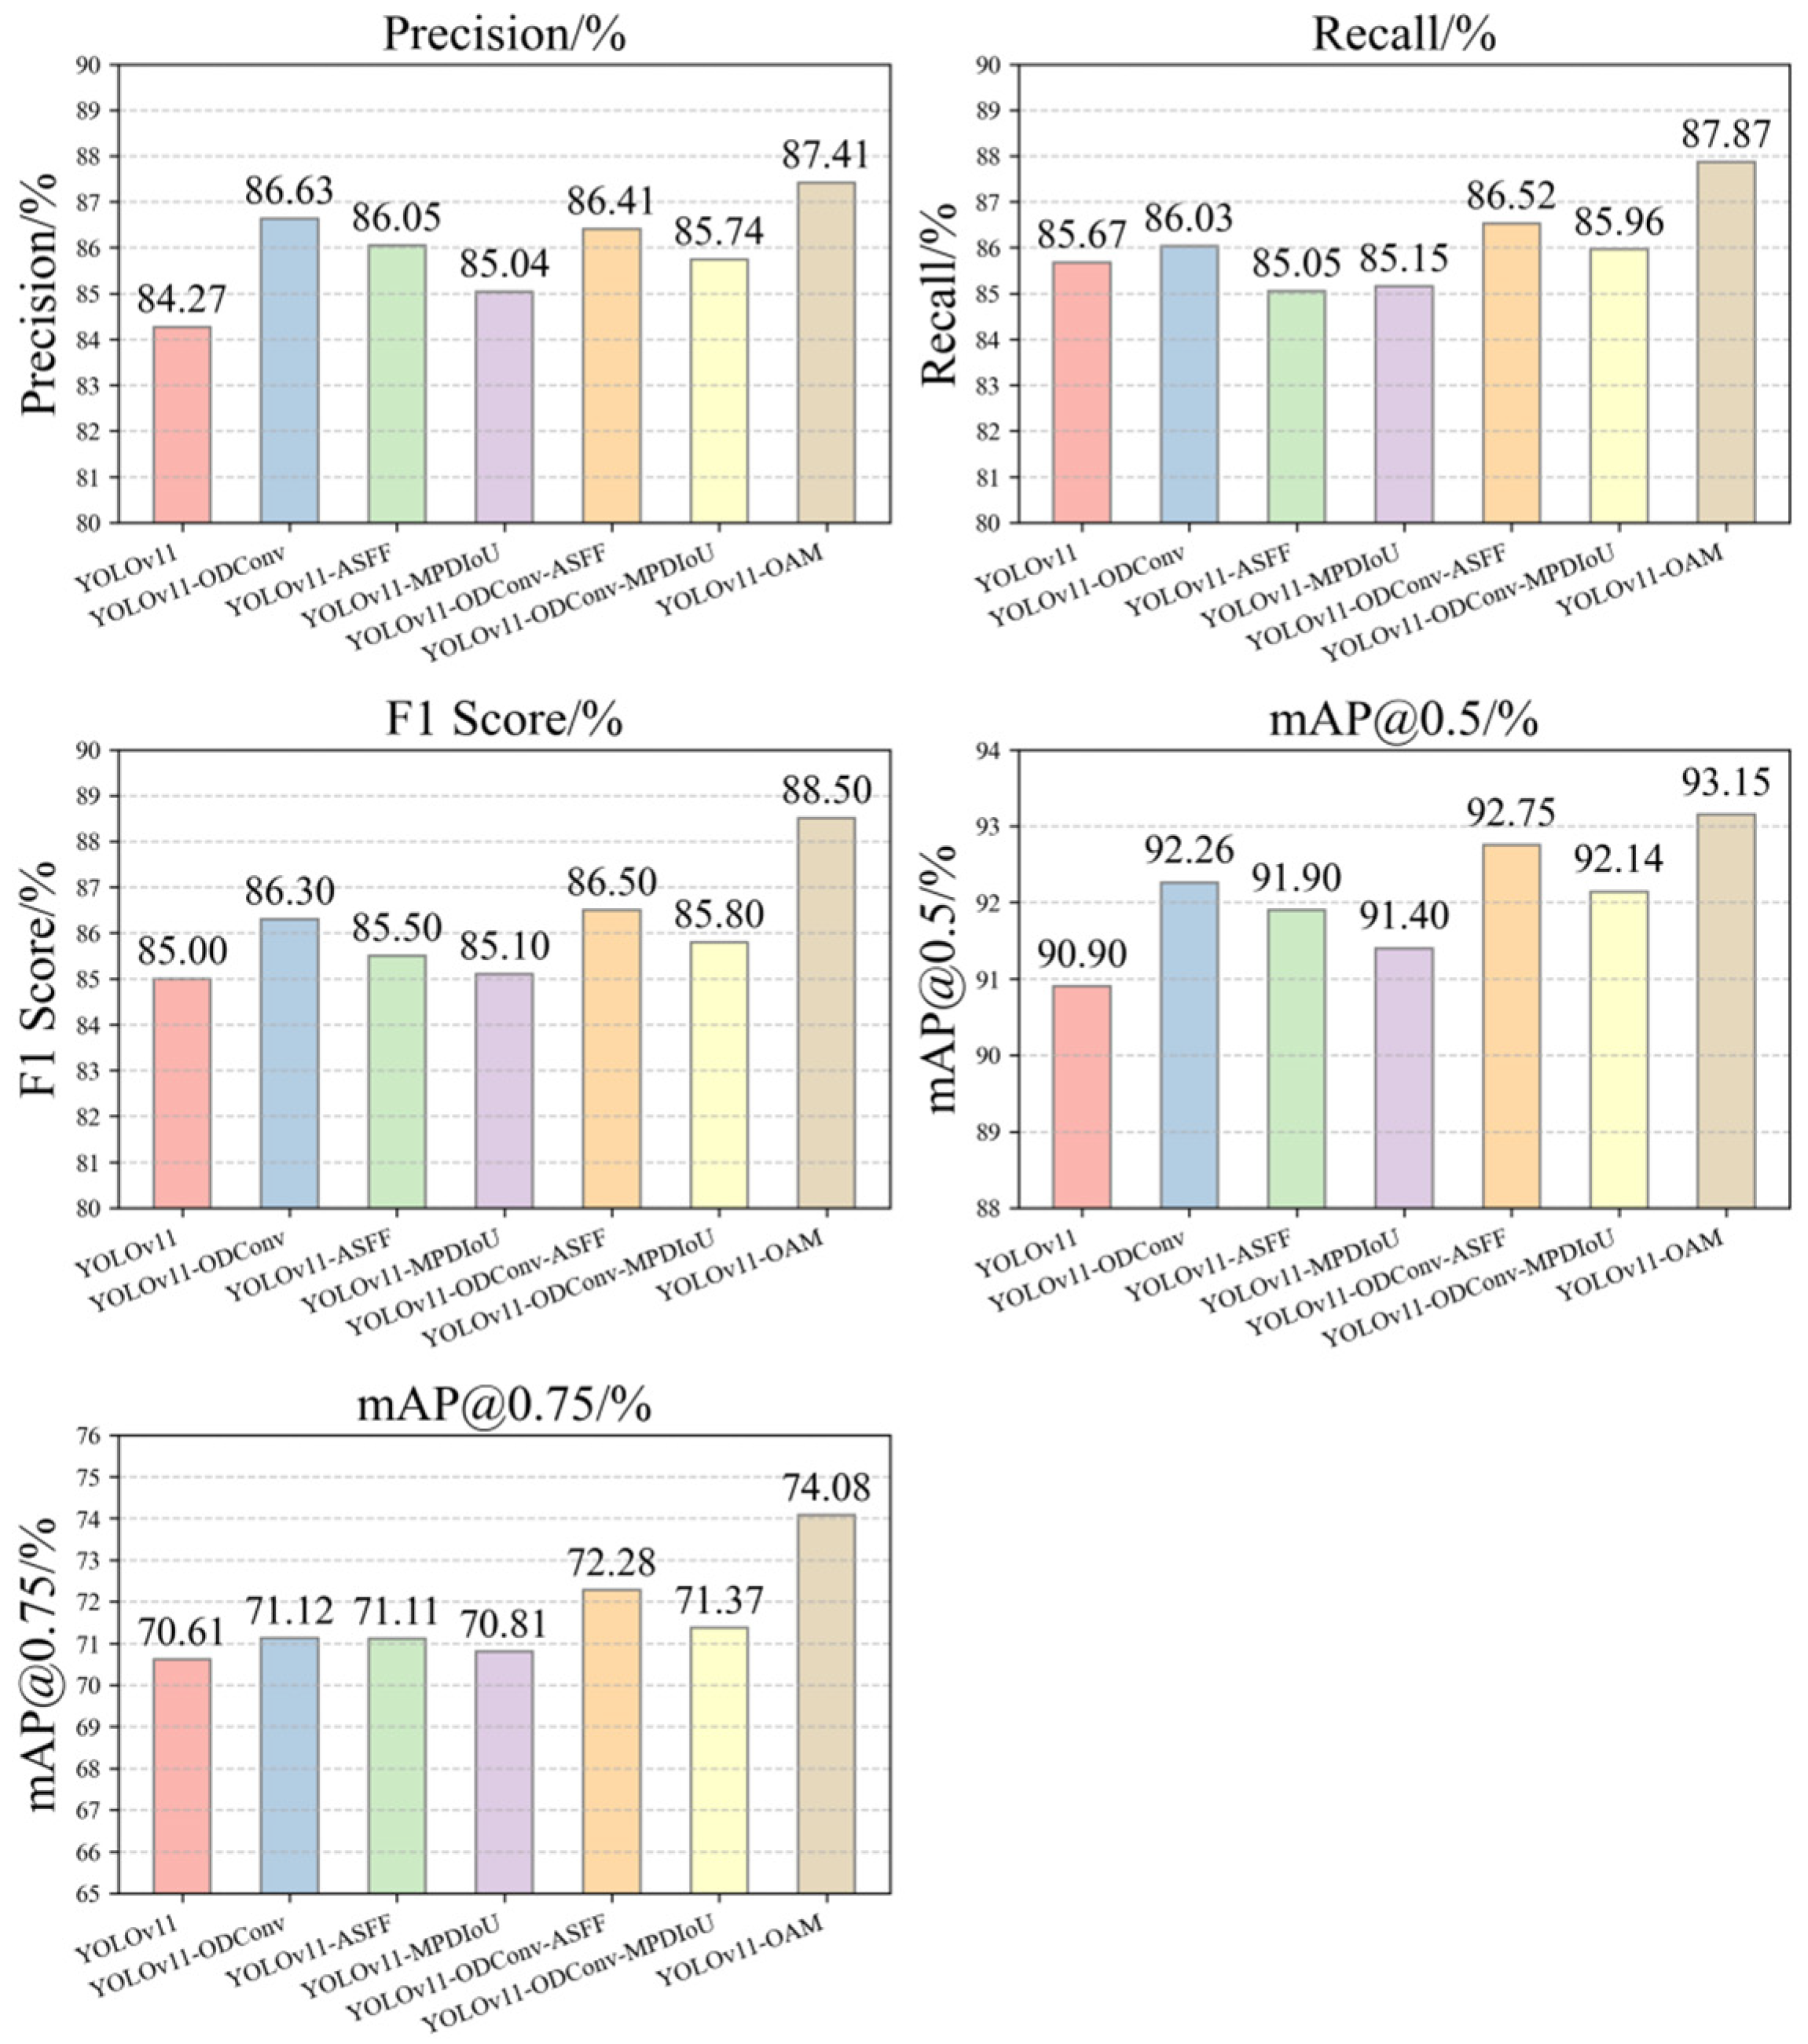
We performed a series of ablation experiments to evaluate the individual contributions of ODConv, ASFF, and MPDIoU to overall detection performance. Starting from the YOLOv11 baseline, each component was incrementally added and assessed on a six-class fruit tree dataset using standard metrics, including precision, recall, F1-score, mAP@0.5, and mAP@0.75. The results are summarized in
Table 6 and visualized in
Figure 9.
The YOLOv11-ODConv variant improved mAP@0.5 by 1.36% and mAP@0.75 by 0.51%, indicating that omni-dimensional dynamic convolution is effective for capturing fine-grained visual features. Incorporating ASFF further enhanced spatial feature alignment, yielding gains of 1.01% and 0.5% in mAP@0.5 and mAP@0.75, respectively. MPDIoU alone produced a modest improvement of +0.5% in mAP@0.5 but substantially strengthened localization accuracy and training stability, especially for small or visually ambiguous targets.
When integrated, the modules produced synergistic gains. The complete YOLOv11-OAM model achieved the highest performance, with mAP@0.5 = 93.15%, mAP@0.75 = 74.08%, and F1-score = 88.5%. These results demonstrate the complementary advantages of architectural enhancements and advanced loss functions, which together substantially improve overall detection performance.
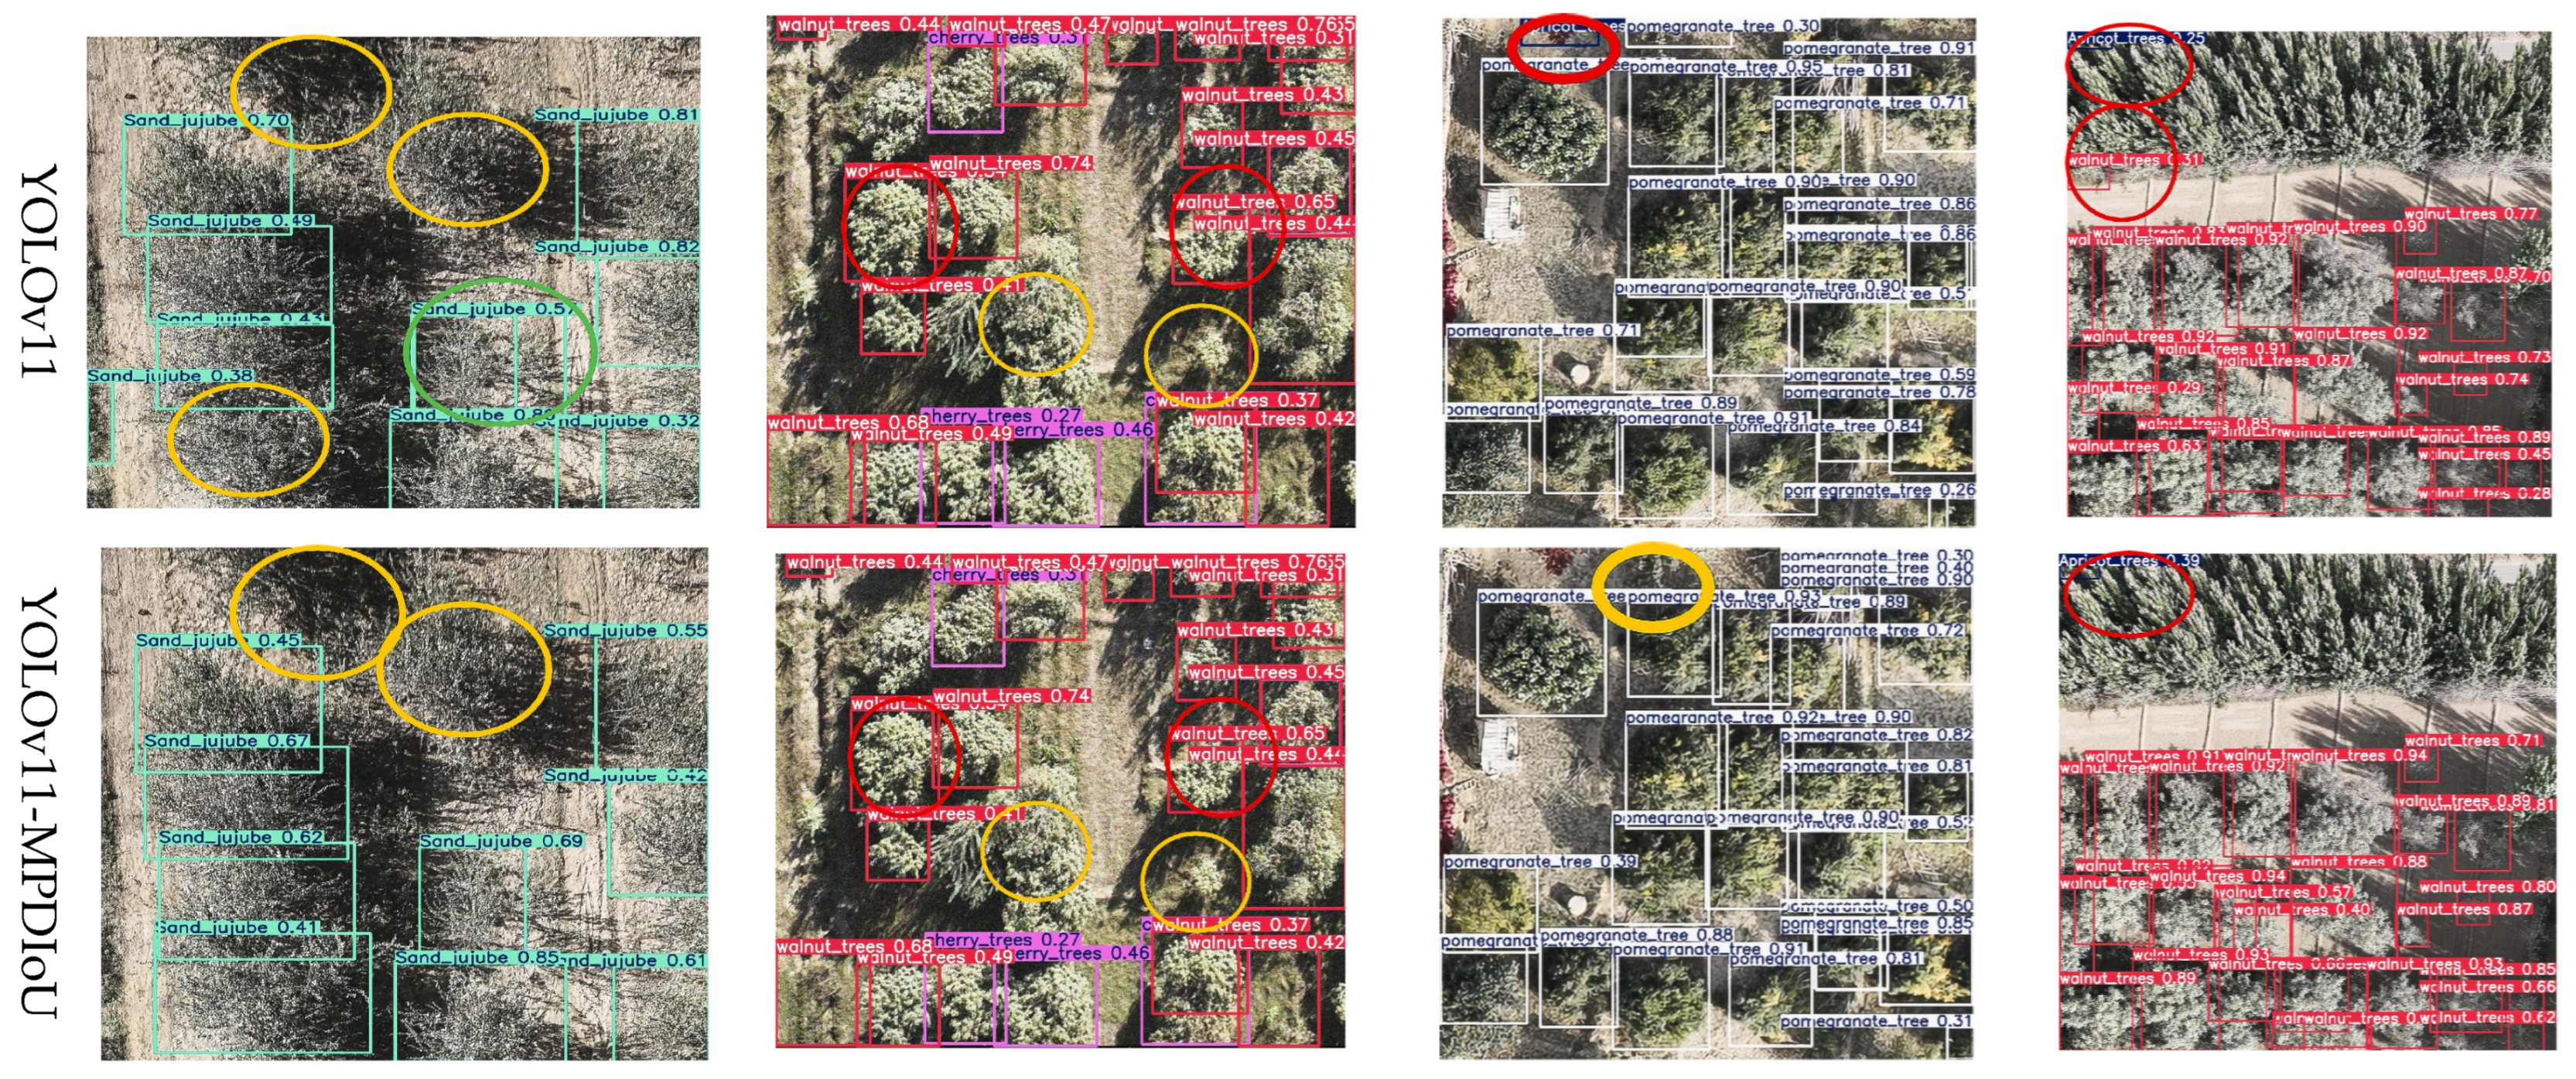
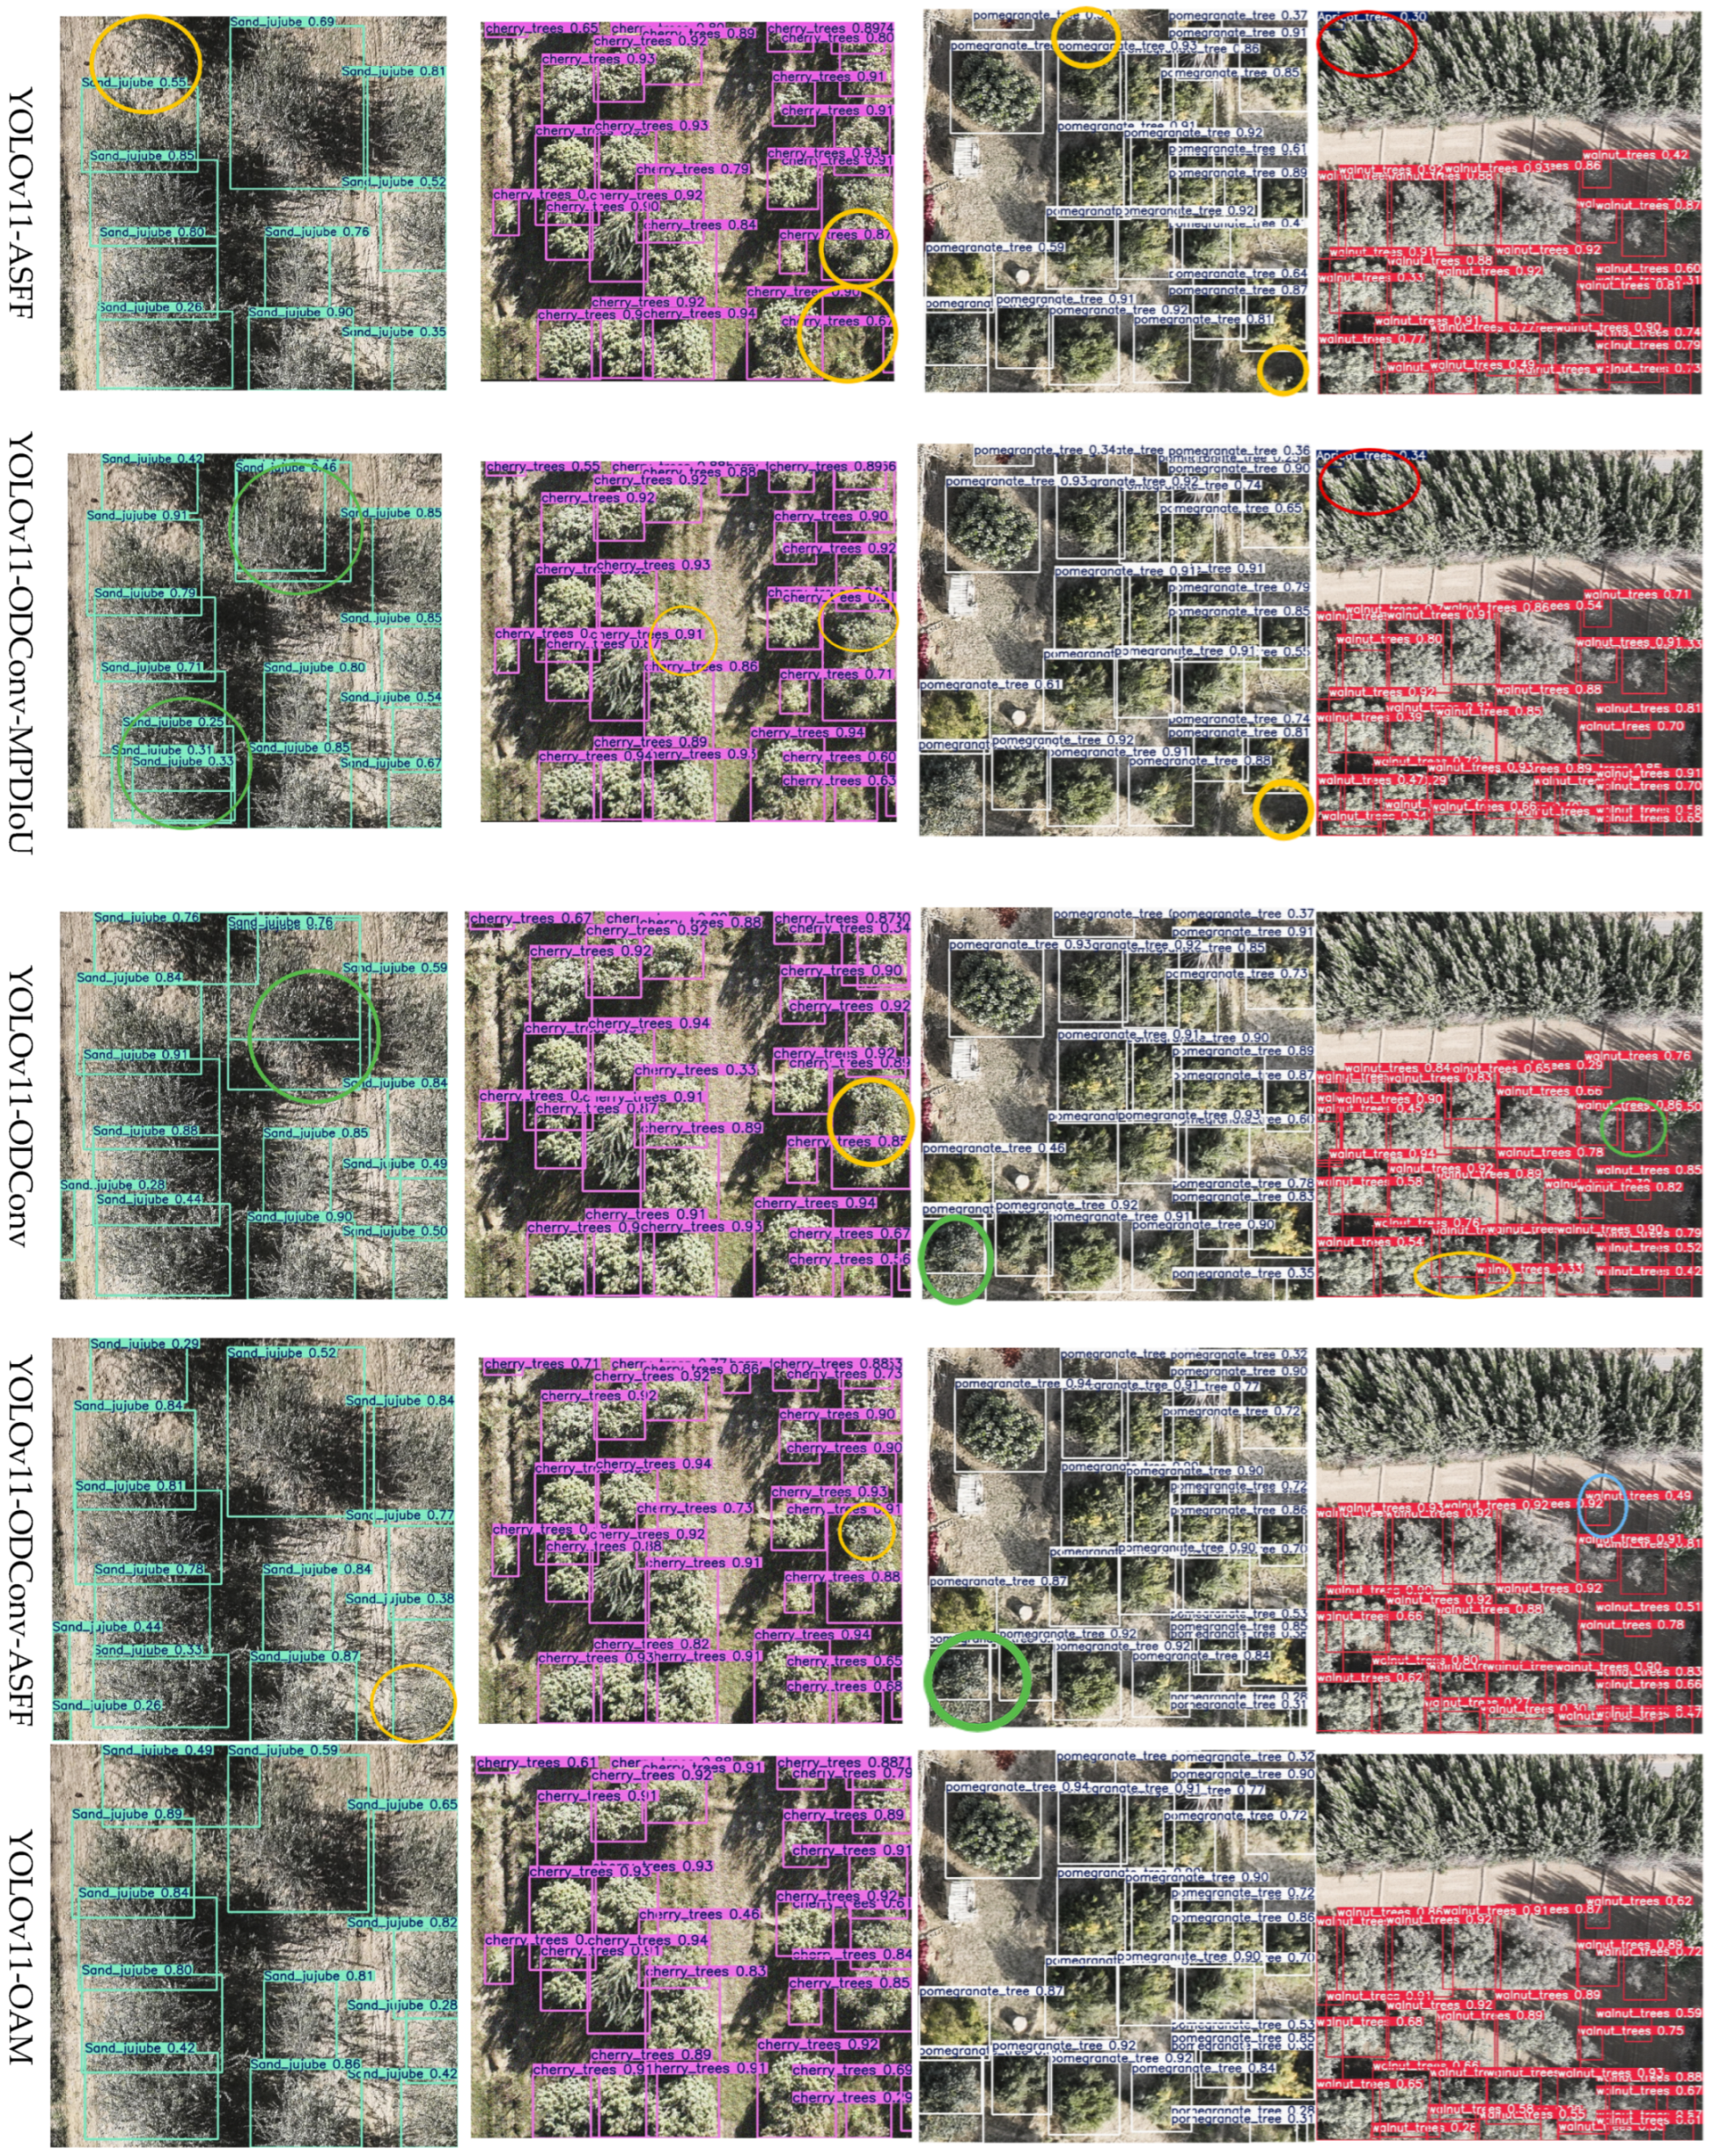
Figure 10 presents qualitative results on UAV imagery. The YOLOv11 baseline frequently produced false positives and misclassified morphologically similar species, such as incorrectly labeling non-walnut trees as walnut. ODConv alleviated these issues by enhancing feature discrimination, but redundant detections and weak boundary localization persisted. Adding Detect_ASFF reduced duplicate detections and improved boundary alignment, though minority classes still showed low-confidence predictions. MPDIoU further enhanced spatial localization and score calibration, leading to more reliable detection of small and occluded targets. Overall, the integrated YOLOv11-OAM model achieved the most balanced performance, accurately distinguishing fine-grained categories while maintaining stable confidence across all species.
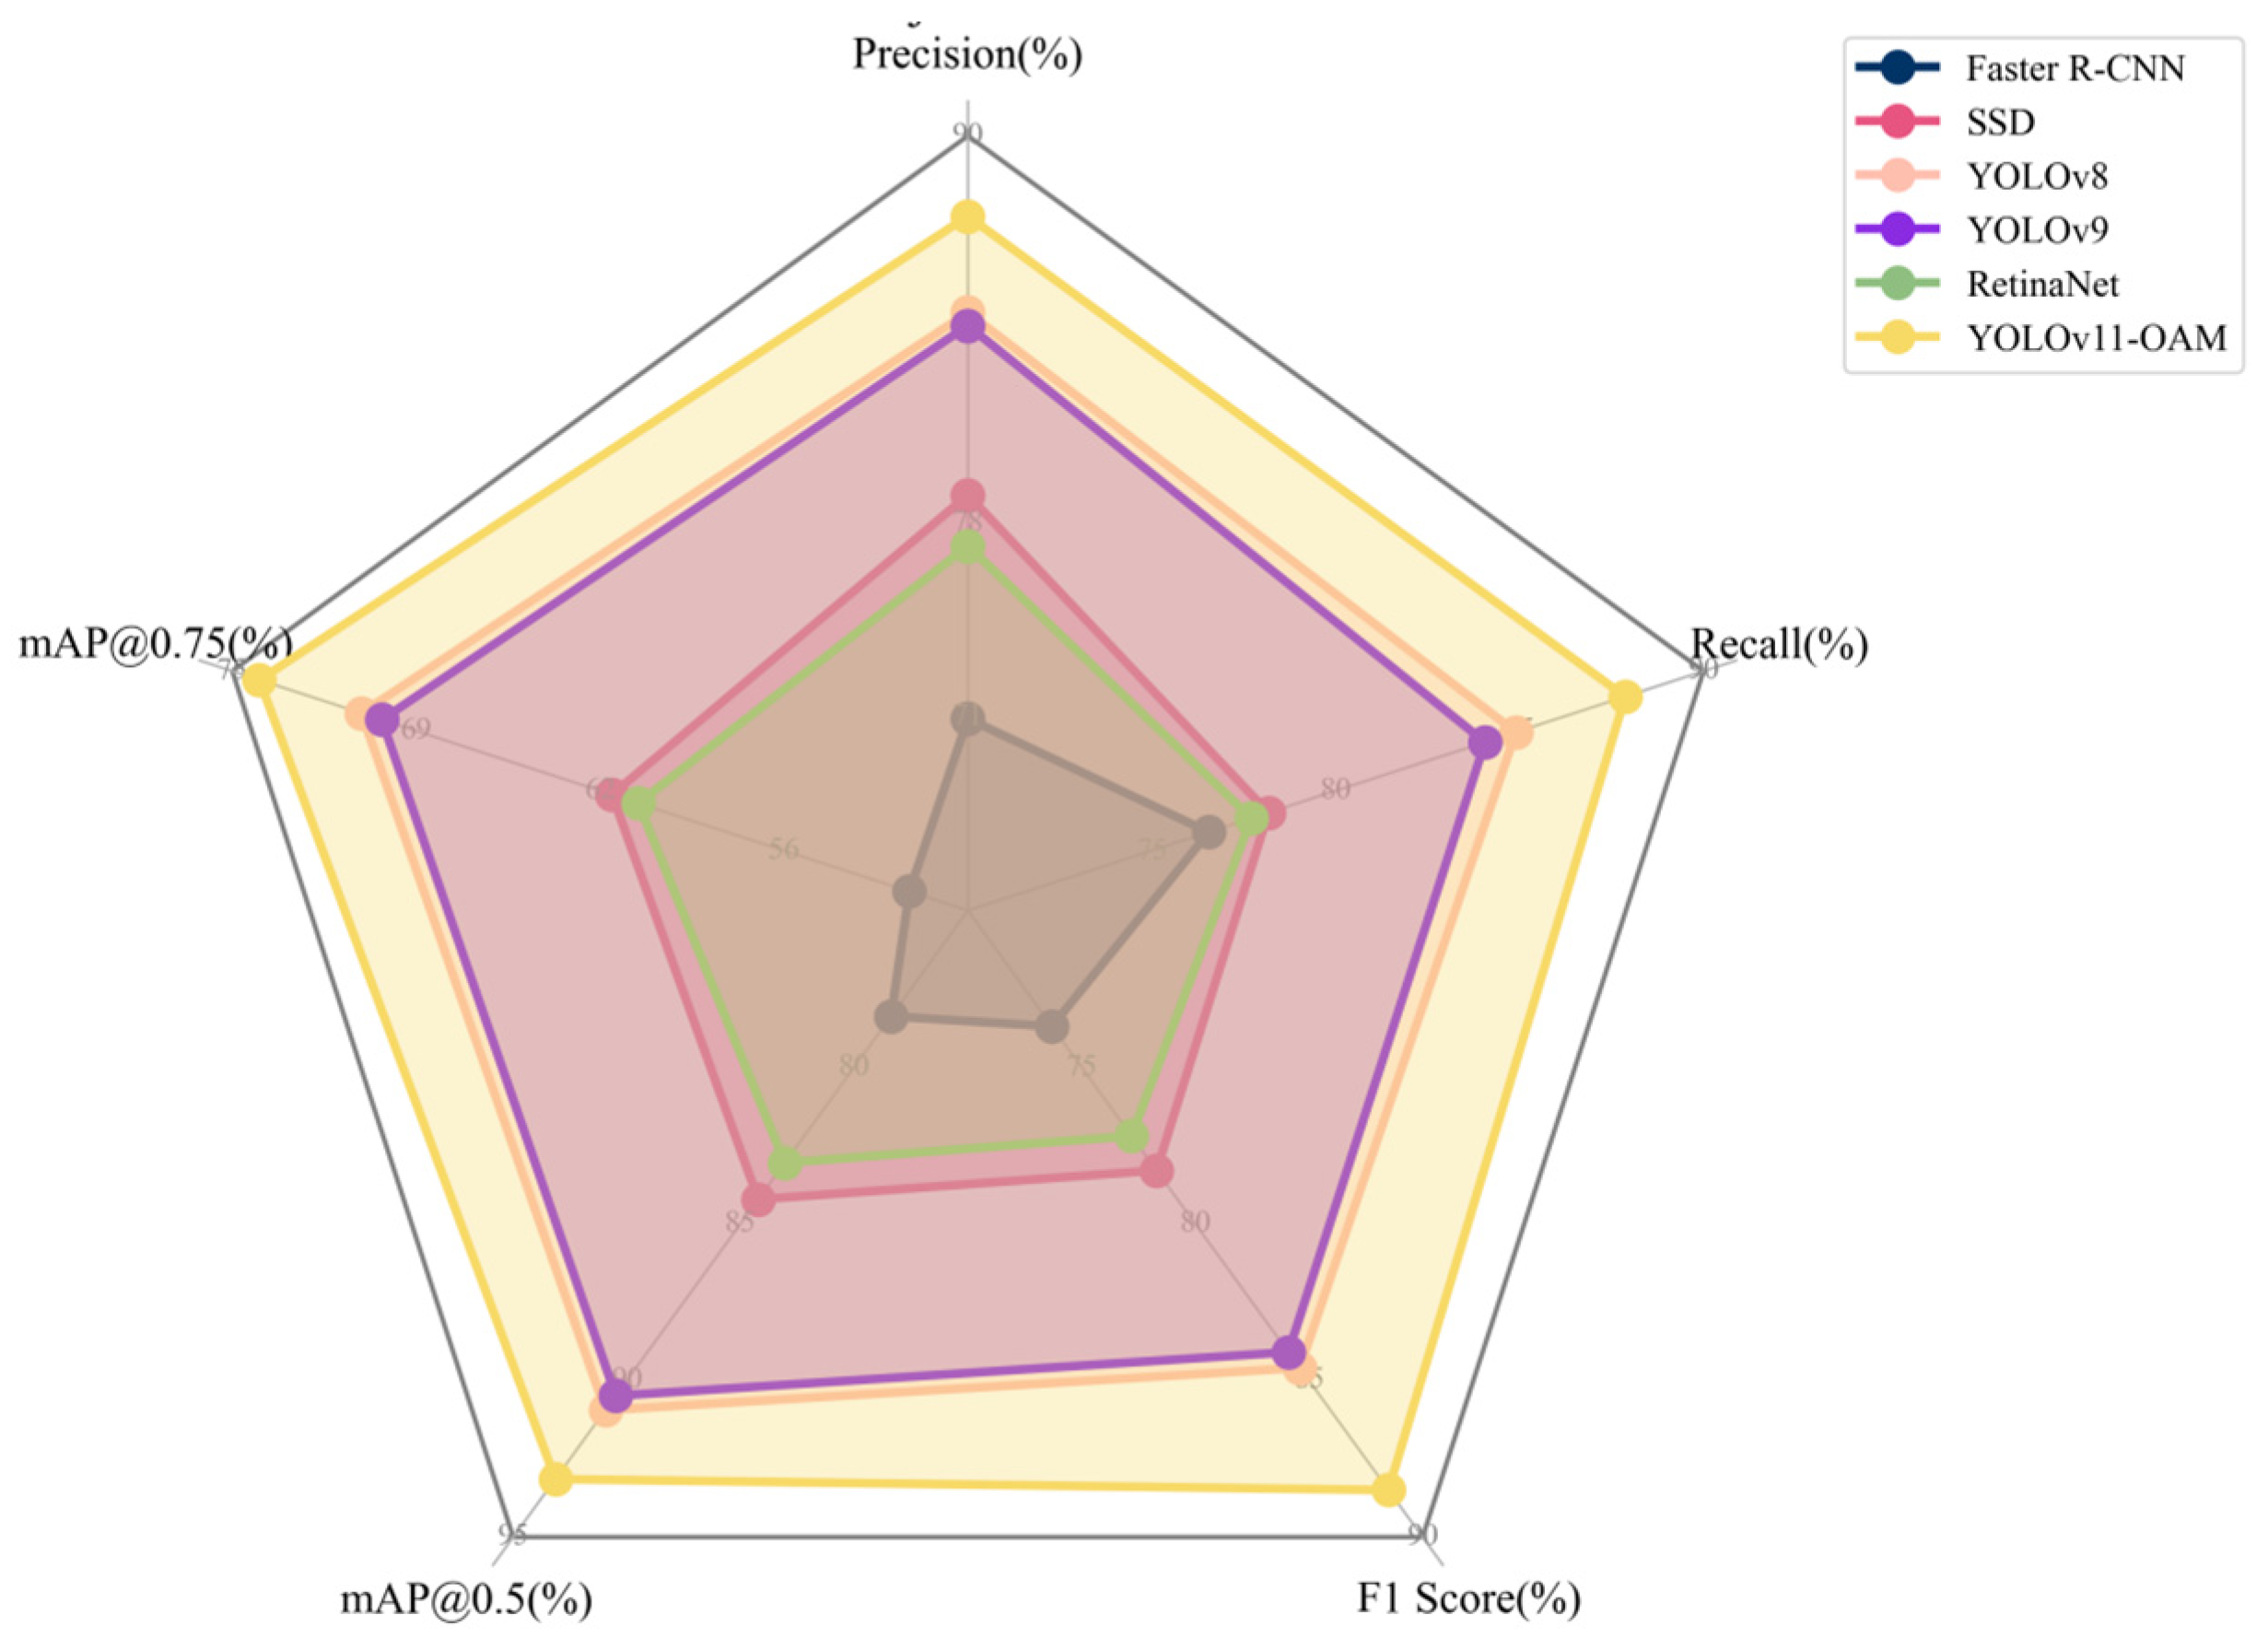
3.5. Comparison of Detection Performance with Other Models
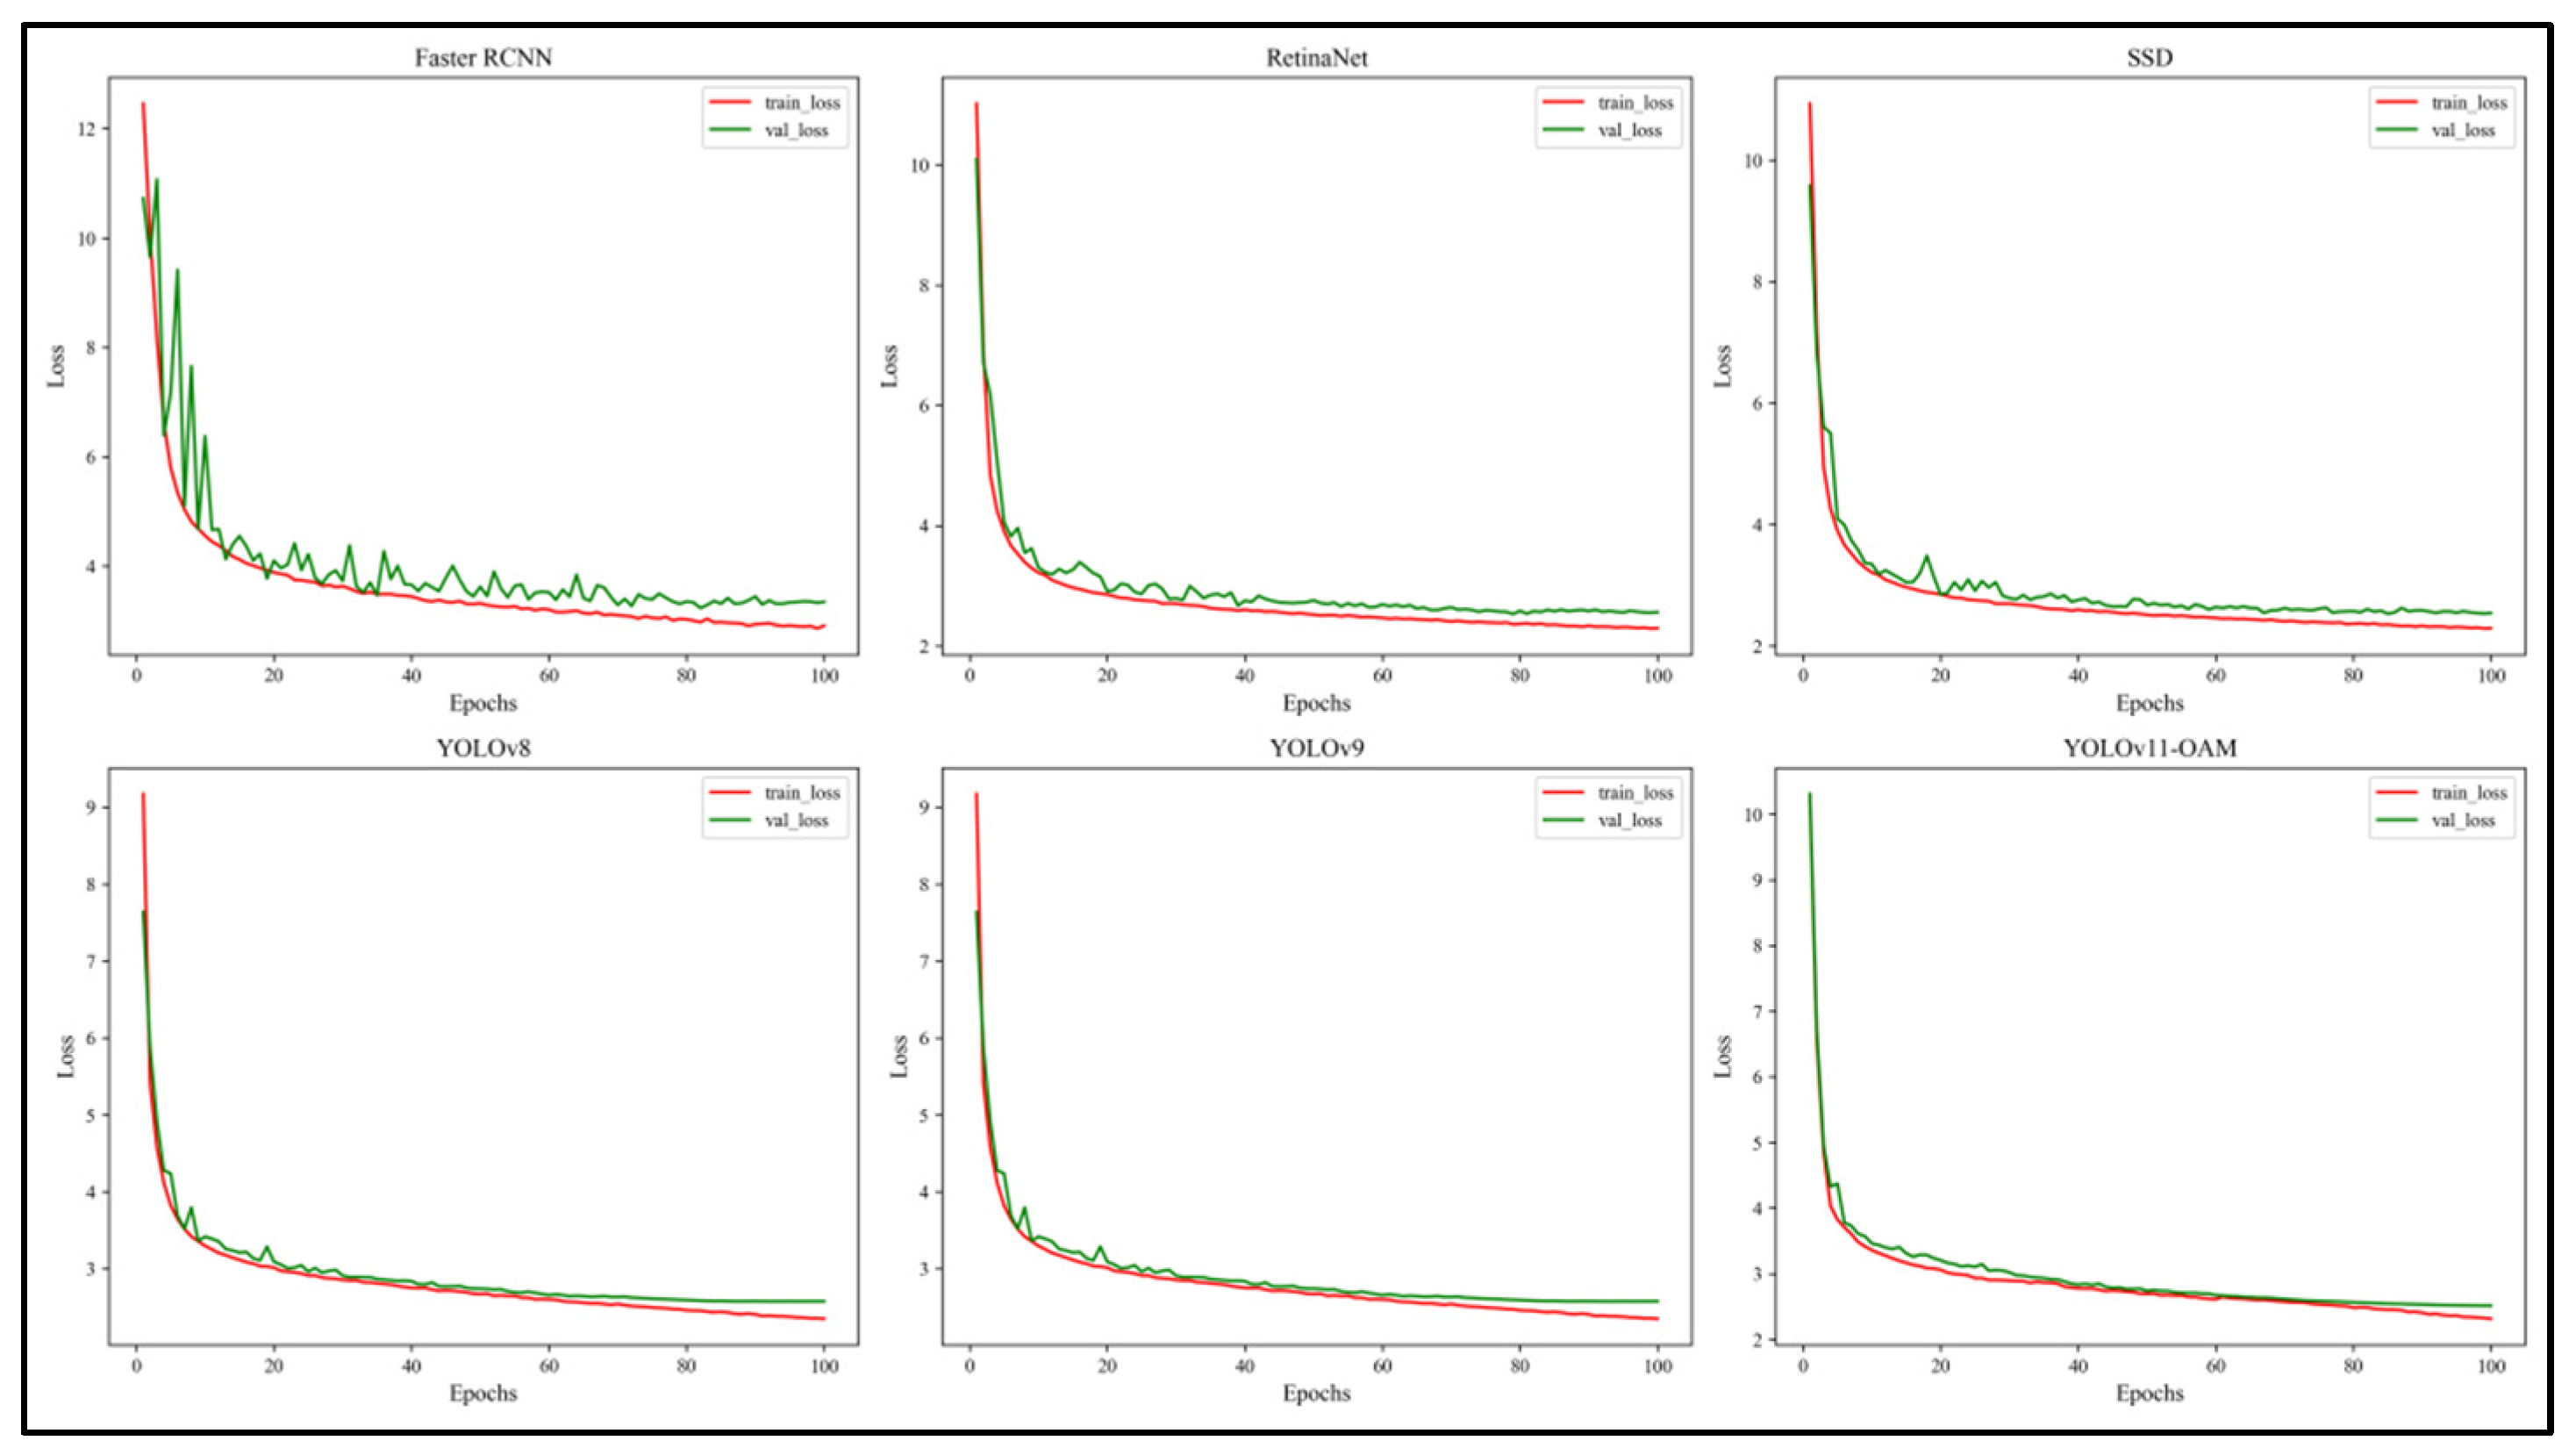
To evaluate detection effectiveness, YOLOv11-OAM was compared with five representative models: Faster R-CNN, SSD, RetinaNet, YOLOv8, and YOLOv9. All models were trained and tested on the six-class UAV fruit tree dataset and assessed using precision, recall, F1-score, mAP@0.5, and mAP@0.75. The results are presented in
Figure 11,
Figure 12 and
Figure 13 and
Table 7.
As shown in
Figure 11, YOLOv11-OAM achieved the highest overall accuracy, with mAP@0.75 of 74.08% and an F1-score of 88.5%, outperforming all baseline detectors. In contrast, Faster R-CNN performed the worst, achieving only 71.19% precision and 78.38% mAP@0.5, underscoring its limited suitability for dense orchard detection tasks.
Figure 12 illustrates training dynamics. YOLOv11-OAM converged rapidly with the lowest validation loss. In comparison, YOLOv8 and YOLOv9 displayed oscillations during training, SSD and RetinaNet converged more slowly with higher losses, and Faster R-CNN exhibited unstable convergence.
Table 7 further reports quantitative comparisons. YOLOv11-OAM ranked highest across all metrics (precision = 87.41%, recall = 87.87%, F1-score = 0.885, mAP@0.5 = 93.15%, mAP@0.75 = 74.08%). YOLOv8 and YOLOv9 followed, SSD and RetinaNet showed moderate performance, while Faster R-CNN consistently lagged behind.
The superior performance of YOLOv11-OAM can be attributed to the integration of ODConv, Detect_ASFF, and MPDIoU. These modules collectively strengthen spatial feature representation, refine localization, and maintain computational efficiency, enabling the model to achieve both high accuracy and real-time applicability in UAV-based orchard monitoring.
3.6. Computational Complexity and Inference Efficiency Analysis
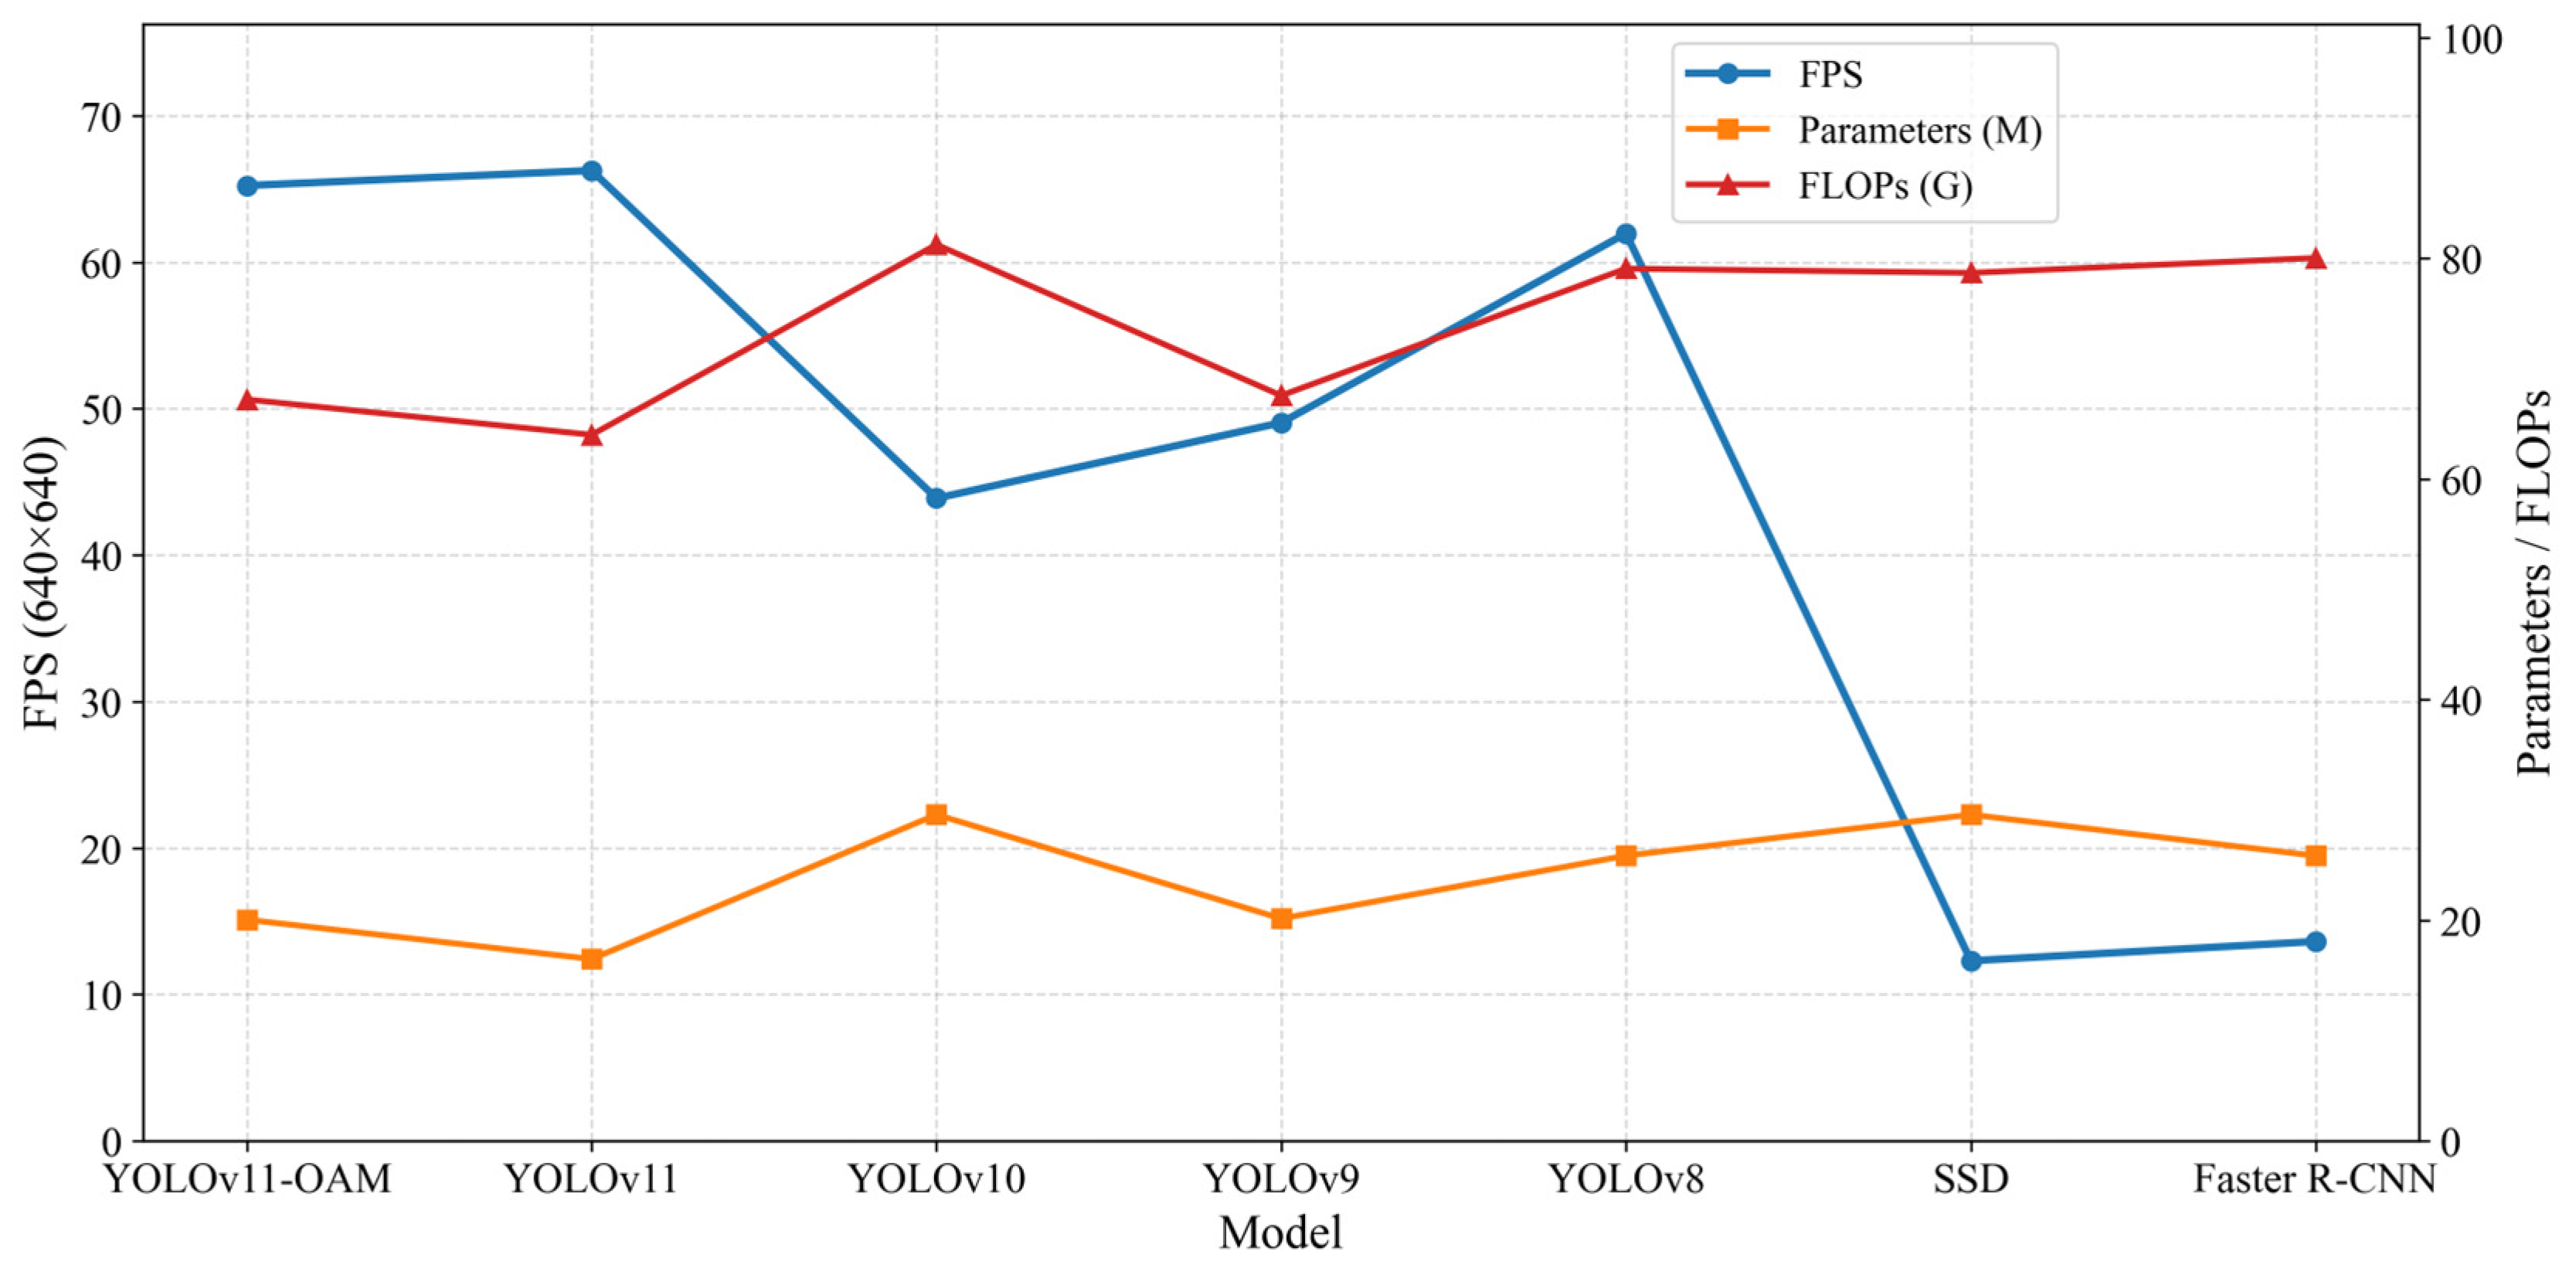
To assess the real-time deployment potential of the proposed model, we benchmarked the computational performance of seven object detection architectures—YOLOv11-OAM, YOLOv11, YOLOv10, YOLOv9, YOLOv8, SSD, and Faster R-CNN—on an NVIDIA RTX 4090 GPU with an input resolution of 1024 × 1024 using FP16 precision. Three key metrics were evaluated: parameter count (M), floating-point operations (GFLOPs), and inference speed measured in frames per second (FPS).
As shown in
Figure 13, YOLOv11-OAM achieved an inference speed of 65.23 FPS, with 20.06 million parameters and 67.21 GFLOPs. Although the model introduced slightly higher complexity compared with the baseline YOLOv11 (66.26 FPS, 16.49 M, 64.01 GFLOPs), its inference efficiency remained nearly unchanged. This demonstrates the computational lightweight nature of the ODConv, Detect_ASFF, and MPDIoU modules.
Among all compared models, YOLOv11-OAM offered the best balance between accuracy and efficiency. YOLOv8 and YOLOv9 achieved 61.96 FPS and 49.04 FPS, respectively, while YOLOv10 showed reduced efficiency (43.88 FPS) due to its larger parameter size. SSD and Faster R-CNN were significantly slower (<15 FPS), despite having similar or higher GFLOPs, underscoring their lower runtime efficiency.
3.7. Cross-Dataset Generalization Evaluation
To evaluate the cross-domain generalization ability of YOLOv11-OAM, we performed an external validation experiment using a publicly available tree species detection dataset from the Roboflow Universe platform. The dataset, collected and curated by user “andreas-sdfrn” (
https://universe.roboflow.com/andreas-sdfrn) (accessed on 19 July 2025). contains 3130 annotated instances of tropical tree species, including banana, coconut, mango, false ashoka, gulmohar, jackfruit, and mahogany. All annotations follow the YOLO format, providing bounding box coordinates and class labels.
Without any domain adaptation or fine-tuning, the YOLOv11-OAM model—trained solely on UAV imagery from southern Xinjiang—was directly evaluated on this heterogeneous dataset. It achieved an overall mAP of 0.902, precision of 0.909, recall of 0.902, and an F1-score of 0.819. Class-wise performance was also competitive, with APs of 0.904, 0.911, and 0.918 for coconut, mango, and mahogany, respectively. Notably, for banana trees, despite the limited number of samples (n = 156), the model maintained high detection accuracy (AP = 0.894, recall = 0.906).
These results underscore the robustness and transferability of YOLOv11-OAM when applied to out-of-distribution data featuring significant variations in species composition, imaging conditions, and environmental contexts. The model’s consistent performance across previously unseen categories highlights its potential for broader applications in forestry monitoring and smart agriculture systems. Similar cross-domain generalization has also been demonstrated in remote sensing scene classification. For instance, Akhtar et al. showed that a ResNet-50 model trained on one domain retained classification accuracies above 99% when applied to a different target domain without fine-tuning. Subsequent studies further indicate that domain adaptation techniques can enhance performance across heterogeneous forestry datasets [
46]. Our cross-dataset results align with these findings, reinforcing the feasibility of species-level generalization in UAV tree detection.
3.8. Limitations and Practical Implications
Although the YOLOv11-OAM model achieved strong overall performance, several limitations remain that warrant further research:
- (1)
Class-level confusion. The model exhibited persistent misclassification between morphologically similar species. For example, saxaul trees often showed relatively low recall due to their small canopy size, indistinct boundaries, and visual similarity to apricot or prune. These factors led to frequent confusion or missed detections, especially under conditions of crown overlap and variable illumination. Future work will explore the use of multimodal features, attention-based modules, and class-balanced loss functions to specifically mitigate such misclassification issues.
- (2)
Data modality limitations. The current study relies solely on UAV RGB imagery. While practical and cost-effective, this restricts the model’s ability to capture structural and spectral cues necessary for distinguishing visually similar or underrepresented classes. Incorporating multimodal data—such as hyperspectral imaging, LiDAR point clouds, or time-series UAV imagery—could provide complementary spatial, spectral, and structural features for fine-grained tree species discrimination.
- (3)
Deployment challenges. Although the proposed model achieved real-time inference (65+ FPS with ~20 M parameters on an RTX 4090 GPU), practical deployment on UAVs or edge devices remains constrained by hardware limitations, including memory, power consumption, and onboard computing capacity. Nevertheless, the lightweight design of YOLOv11-OAM suggests that with further optimization, real-time deployment on embedded GPUs (e.g., NVIDIA Jetson Orin or Nano) is feasible. In future work, model compression techniques such as pruning, quantization, and knowledge distillation will also be explored to further reduce computational cost while maintaining accuracy.
From a practical perspective, the YOLOv11-OAM framework is well-suited for UAV-based orchard monitoring and precision agriculture tasks, such as targeted irrigation, pruning, and pest management. Future research will address the above limitations by improving robustness to seasonal phenological changes, variable lighting conditions, and unseen orchard layouts.
4. Conclusions
This study presents a dedicated approach to addressing the challenges of tree species detection in high-resolution UAV-based remote sensing imagery. We propose YOLOv11-OAM, an enhanced object detection model that incorporates multiple architectural improvements. A specialized fruit tree dataset was constructed, and advanced augmentation techniques—including noise injection, random cropping, affine transformations, and flipping—were employed to enrich data diversity, reduce overfitting, and improve generalization.
Building upon the YOLOv11 framework, the proposed model introduces three key innovations. First, the ODConv module enhances spatial adaptability through omni-dimensional convolutional kernel modulation. Second, the Adaptive Spatial Feature Fusion (ASFF) mechanism enables effective multi-scale feature integration, thereby improving recognition accuracy across objects of varying sizes. Third, the MPDIoU loss function provides geometry-aware localization refinement, delivering more precise bounding box regression, particularly for small or visually ambiguous targets.
In summary, YOLOv11-OAM demonstrates high detection accuracy, stable training, and strong robustness in both small-object and multi-class detection tasks. The model offers a practical and efficient solution for UAV-assisted orchard monitoring and establishes a technical foundation for scalable applications in precision agriculture and intelligent forestry management.
Future Work
To further enhance the robustness, generalization, and practical deployment of the YOLOv11-OAM model, future research may pursue several key directions. First, ensemble learning strategies—particularly those guided by expert cognition—can improve stability under domain shifts and increase external validation accuracy. For instance, the work by Yang et al. [
47] demonstrates how cognition-driven ensemble deep learning can effectively improve generalizability in high-variance, small-sample environments. This approach provides valuable insights for developing more resilient tree species detection models tailored to real-world forestry applications.
Second, the incorporation of attention mechanisms or architectural refinements informed by expert knowledge may improve the model’s ability to address class imbalance and fine-grained visual variation, especially for underrepresented or morphologically similar species.
Third, expanding the data modalities beyond RGB imagery is a promising direction. Integrating hyperspectral and LiDAR data can provide richer spatial–spectral features and structural information, improving both classification accuracy and boundary localization in dense orchard or forest canopies. Recent multimodal studies have confirmed these advantages; for example, Wang et al. [
17] demonstrated that UAV-based hyperspectral and LiDAR fusion significantly improved tree species classification accuracy in forest plots, and Li et al. [
15] further highlighted the benefits of combining structural and spectral cues for fine-grained vegetation mapping. These findings substantiate our proposed future extension toward multimodal fusion.
Finally, optimizing the YOLOv11-OAM model for UAV and edge deployment is essential. Recent works such as Boddu and Mukherjee on quantized YOLOv4-Tiny deployment on Raspberry Pi 5 [
48], Ma et al. [
49] with LW-YOLOv8, and Zhong et al. [
29] with PS-YOLO demonstrate how lightweight YOLO variants can achieve efficient inference under resource constraints. Additionally, Humes et al. [
50] with Squeezed Edge YOLO showcases extreme compression and deployment on Jetson Nano. A broader survey by Geng et al. [
51] details the algorithm–hardware co-design strategies for safe and efficient model compression. Building on these advances, future work will explore pruning, quantization, and knowledge distillation for real-time YOLOv11-OAM deployment on embedded GPUs such as NVIDIA Jetson Orin or Nano.
Collectively, these directions aim to overcome current limitations and build upon the YOLOv11-OAM framework to support scalable, accurate, and adaptive monitoring solutions for precision agriculture and smart forestry.
