Article

Machine-Learning Insights from the Framingham Heart Study: Enhancing Cardiovascular Risk Prediction and Monitoring

1
Innovation Center for Semiconductor and Digital Future (ICSDF), Mie University, Tsu 514-8507, Japan
2
Department of Management Science and Technology, Graduate School of Engineering, Tohoku University, Sendai 982-0002, Japan
3
Diagnostic Radiology Department, Harada Academy Kagoshima College of Medical Technology, Kagoshima 891-0113, Japan
*
Author to whom correspondence should be addressed.
Appl. Sci. 2025, 15(15), 8671; https://doi.org/10.3390/app15158671
Submission received: 7 June 2025 / Revised: 30 July 2025 / Accepted: 1 August 2025 / Published: 5 August 2025
(This article belongs to the Special Issue Smart Healthcare: Techniques, Applications and Prospects)

Abstract

Monitoring cardiovascular health enables continuous and real-time risk assessment. This study utilized the Framingham Heart Study dataset to develop and evaluate machine-learning models for predicting mortality risk based on key cardiovascular parameters. Some machine-learning algorithms were applied to multiple machine-learning models. Among these, XGBoost achieved the highest predictive performance, each with an area under the curve (AUC) value of 0.83. Feature importance analysis revealed that coronary artery disease, glucose levels, and diastolic blood pressure (DIABP) were the most significant risk factors associated with mortality. The primary contribution of this research lies in its implications for public health and preventive medicine. By identifying key risk factors, it becomes possible to calculate individual and population-level risk scores and to design targeted early intervention strategies aimed at reducing cardiovascular-related mortality.

1. Introduction

Identifying predictors of cardiovascular disease (CVD) is essential for effective prevention and management strategies, especially given the increasing global burden of cardiovascular conditions [1,2,3,4,5,6]. Recent studies have emphasized not only traditional risk factors but also region-specific and socioeconomic determinants in developing countries [1], the role of muscular strength in overall cardiovascular health and mortality [2], and the presence of “known unknowns” in CVD risk prediction—factors that remain poorly understood despite large-scale research efforts [3]. Moreover, racially related disparities and early-life risk exposures have emerged as important considerations in comprehensive cardiovascular risk assessments [4,5]. These findings collectively highlight the multifactorial nature of CVD and the need for personalized, context-sensitive approaches to risk prediction [6]. Numerous population-based cohort studies and epidemiological investigations have extensively explored the established risk factors for CVD, such as hypertension, diabetes, dyslipidemia, smoking, and sedentary lifestyle [7,8,9,10,11,12,13,14]. For example, the Hispanic Community Health Study/Study of Latinos has provided valuable insights into ethnic-specific cardiovascular risk profiles [7], while research in South Africa has demonstrated the impact of coexisting conditions like HIV on heart rate variability and CVD risk [8]. Additional investigations have considered unique subgroups, including migrants [9], postmenopausal women [10], and individuals with atypical ECG markers such as fractionated QRS [11]. Several studies have also underscored the link between autonomic nervous system imbalance and cardiovascular risk through reduced heart rate variability (HRV), pointing to its potential as an early physiological marker [12,13,14]. It has been well established that factors such as smoking, hypertension, diabetes, and dyslipidemia contribute significantly to the development and progression of cardiovascular disease [15,16,17,18,19,20,21]. For instance, disorders of pregnancy have been associated with increased long-term cardiovascular risk in women [15], and social determinants like isolation or lack of support are now recognized as non-traditional yet potent contributors to poor cardiovascular outcomes [16]. Moreover, sex-specific differences in clinical presentation and biomarker profiles demand greater attention in both research and practice [17]. Lifestyle factors such as poor sleep and nutrition are also gaining recognition as modifiable risk factors that influence vascular health and autonomic regulation [18,20], while large-scale cohort studies such as the CARLA Study have begun integrating HRV metrics into routine cardiovascular risk assessments in the elderly population [19]. These findings reinforce the importance of a multifaceted approach to identifying at-risk individuals.
Furthermore, a study by Yuda et al. (2021) investigated the redundancy between different cardiovascular risk indicators derived from heart rate variability (HRV) and heart rate dynamics, using big data analytics from the ALLSTAR project [22]. Their findings highlighted that while multiple metrics may individually show predictive value, substantial redundancy exists among them, implying overlapping physiological information. This underscores the need for selecting non-redundant, orthogonal predictors in risk modeling to avoid inflated predictive performance due to collinearity. Such insights are critical as the field moves toward integrating high-dimensional physiological data into machine-learning frameworks for CVD prediction. Building on this, research is also progressing on heart rate-based indicators as valuable tools for cardiovascular risk stratification [23,24,25,26,27]. For instance, low HRV has been associated with increased post-myocardial infarction mortality, especially in the presence of depressive symptoms [23]. Randomized controlled trials have shown that structured interventions such as exercise and stress management can significantly improve cardiovascular risk profiles through autonomic modulation [24]. Moreover, complex heart rate dynamics—such as non-Gaussian distributions or fractal loss—have emerged as independent prognostic markers in patients with heart failure or depression [25,26]. More recently, machine-learning-based approaches utilizing cohort data like the Suita Study have demonstrated how advanced algorithms can integrate traditional and physiological predictors, including HRV, to enhance coronary heart disease prediction [27]. These studies point to the growing relevance of combining physiological signal processing with modern data science in cardiovascular risk assessment.
However, these previous studies primarily identified risk factors based on clinical measurements obtained during hospital visits, rather than data collected in everyday life. As a result, the practical application of these findings for continuous and real-time cardiovascular risk monitoring in daily settings has not yet been fully realized. There remains a need to explore how cardiovascular risk can be assessed more dynamically and flexibly outside traditional clinical environments.
The Framingham Heart Study (FHS) provides a valuable and historically significant resource for investigating cardiovascular disease (CVD) risk factors. Initiated in 1948 in Framingham, MA, USA, the study originally enrolled over 5000 participants and has since expanded to include their children and grandchildren, enabling intergenerational analysis of health data [28,29]. Its primary objective is to identify common and modifiable risk factors for CVD by collecting longitudinal data on clinical parameters, lifestyle behaviors, and biological measurements [28,30,31]. Over the decades, FHS has generated pivotal findings that have shaped global cardiovascular prevention guidelines, including the development of the widely used Framingham Risk Score for estimating 10-year CVD risk [30,31]. More recent extensions of the study have incorporated novel vascular measures [32], genetic data [29], machine-learning models for disease prediction [33], and social determinants of health such as educational mobility and aging trajectories [34]. Furthermore, FHS has played a crucial role in clarifying sex-specific CVD risks [35], establishing the relevance of composite health metrics like Life’s Essential 8 [36], and highlighting cross-cultural comparisons with other landmark studies [37]. These contributions collectively affirm the Framingham dataset’s continued relevance as a foundational tool in cardiovascular epidemiology and risk prediction research.
Several studies have already utilized the Framingham dataset to evaluate models for predicting cardiovascular-related mortality. For example, prior research includes comparative studies of machine-learning algorithms, Bayesian analyses that account for time-varying treatments and heterogeneity, evaluations of methods for imputing missing data, and multimodel data mining approaches for predicting heart failure [38,39,40,41]. Many of these studies have focused on improving the accuracy of risk prediction by addressing missing data using techniques such as multiple imputation and deep-learning-based approaches. While these studies have advanced cardiovascular risk stratification, there remains a need for further exploration of how key risk factors contribute to long-term outcomes in broader, non-clinical populations. Therefore, the objective of this study is to analyze the Framingham Heart Study dataset using various machine-learning approaches and identify cardiovascular risk factors with a strong predictive value for mortality. By leveraging comprehensive longitudinal data and applying modern analytical methods, this study aims to contribute to the development of more robust and interpretable predictive models. The contribution of this research lies in its practical application to personalized health management and preventive medicine.

2. Materials and Methods

2.1. Study Design and Population

This study utilized the Framingham Heart Study (FHS) dataset, a well-established longitudinal cohort study designed to identify risk factors for cardiovascular disease (CVD). The dataset includes comprehensive health data collected from multiple generations of participants, with long-term follow-up on cardiovascular events and mortality.
The Framingham dataset, which was collected to study risk factors for cardiovascular disease, was constructed as part of the Framingham Heart Study. Data from multiple cohorts is available and publicly available. This dataset is often used as training data for machine learning. The data is often organized as time series data with multiple measurements for each participant. Files are provided in the general format suitable for analysis and machine learning, CSV (Comma-Separated Values), which is generally a comma-separated text file format. In the dataset, one line represents the measurement data for one person, and the columns contain various measurement values. In the case of time series data, there are multiple lines with the same ID, and a variable indicating the measurement time is included. The Framingham Risk Score is used as a standard measure for assessing cardiovascular disease risk. It is provided to researchers under the appropriate license. As a characteristic of the data, some variables may contain missing values (NaN), so preprocessing is required. In addition, some variables are binary (e.g., smoking, diabetes), some are continuous (e.g., blood pressure, cholesterol levels), and there is a mixture of binary and continuous variables. Since the scale of each variable is different, standardization and normalization are recommended for machine-learning models. In this study, we implemented machine-learning models using Python (v 3.12), and utilizing Scikit-learn libraries, these models were developed and tuned to perform classification tasks relevant to cardiovascular risk prediction.

2.2. Data Collection

The dataset included 41 variables encompassing demographic information, clinical measurements, lifestyle factors, and cardiovascular outcomes. The key features used in this study were as follows (Table 1 and Table 2). The dependent variable is defined as the presence or absence of mortality risk (1 = Yes, 0 = No), and the machine-learning model treats it as a classification problem.
Among these variables, DEATH was used as the primary outcome variable, representing all-cause mortality. Independent variables included age, sex, blood pressure (SYSBP and DIABP), cholesterol levels (TOTCHOL, HDLC, and LDLC), glucose levels (GLUCOSE), smoking status (CURSMOKE and CIGPDAY), body mass index (BMI), diabetes status (DIABETES), and medication use (BPMEDS). Data preprocessing was conducted systematically to ensure the quality and consistency of the dataset before model training. One of the critical steps involved handling missing values using multiple imputation techniques. Instead of discarding incomplete records, which could introduce bias or reduce the sample size, we applied multiple imputation to estimate missing values based on observed data patterns. Specifically, we employed the Multivariate Imputation by Chained Equations (MICE) method, which iteratively predicts missing values for each variable using regression models trained on the available data. This approach preserves the underlying relationships between variables and minimizes the risk of bias introduced by missingness.
For continuous variables, standardization was performed to ensure comparability across different scales. Many machine-learning algorithms, particularly those based on gradient descent (e.g., logistic regression), are sensitive to differences in scale. To address this, we applied z-score normalization, where each continuous feature, X, was transformed using the following formula:
X = X μ σ
μ is the mean and σ is the standard deviation of the variable.
This transformation results in a mean of 0 and a standard deviation of 1, allowing all continuous features to contribute equally to the model without being dominated by variables with larger numerical ranges.
For categorical variables, appropriate encoding techniques were applied depending on the nature of the categories. Binary categorical variables (e.g., male/female, smoker/non-smoker) were transformed using label encoding, assigning 0 and 1 to each category. For nominal categorical variables with more than two categories (e.g., ethnicity, occupation), we used one-hot encoding, which converts each category into a separate binary column to avoid introducing ordinal relationships that do not exist. In cases where categorical variables had high cardinality (many unique values), we employed target encoding or frequency encoding to prevent excessive dimensionality, which could otherwise lead to overfitting.
After preprocessing, the dataset was split into training and testing sets using a stratified approach to maintain the proportion of outcomes across both sets. Stratification ensures that both the training and test sets contain similar distributions of the target variable, which is particularly important when dealing with imbalanced datasets, such as those involving mortality risk, following the methodology of previous studies [35,38,39].

2.3. Machine-Learning Analysis

To identify key risk factors associated with cardiovascular-related mortality and evaluate predictive performance, the following five machine-learning algorithms were applied:
  • XGBoost
    Gradient boosting algorithm known for its high predictive accuracy and ability to handle complex interactions between variables.
  • Random Forest
    Ensemble learning method that constructs multiple decision trees and outputs the mode of the classes (classification) or mean prediction (regression).
  • Logistic Regression
    Traditional statistical model used as a baseline for binary classification tasks.
  • Weighted Ensemble
    Combines multiple model predictions by assigning different weights based on each model’s performance.
  • LightGBM
    A fast, efficient gradient boosting framework that uses histogram-based algorithms and is optimized for speed and memory usage.
  • Neural Network
    A machine-learning model inspired by the human brain, capable of capturing complex non-linear relationships in the data.
  • Gradient Boosting
    An ensemble technique that builds models sequentially, where each new model corrects the errors of the previous ones.
  • k-Nearest Neighbors (kNN)
    A non-parametric method that classifies instances based on the majority label of their k closest neighbors in the feature space.
  • Support Vector Machine (SVM)
    A supervised learning algorithm that finds the optimal hyperplane to separate classes with maximum margin.
For machine-learning classification, the following papers were used as references: Rao et al. [42]. Each machine-learning model was trained using the designated training dataset, ensuring that the model learned patterns and relationships within the data while avoiding overfitting. The performance of each trained model was then rigorously evaluated on an independent test dataset, which was kept separate from the training data to provide an unbiased measure of generalization ability. To assess the predictive capability of the models, the area under the receiver operating characteristic curve (AUC-ROC) was selected as the primary evaluation metric. The AUC-ROC measures the model’s ability to distinguish between positive and negative outcomes across different decision thresholds, providing a comprehensive assessment of classification performance. Higher AUC values indicate better discrimination between cases and controls.
Additionally, feature importance analysis was conducted to determine the most influential predictors contributing to the model’s decision-making process. Depending on the model type, different approaches were used to evaluate feature importance. For tree-based models such as Random Forest and XGBoost, the importance scores were derived from measures like Gini impurity or gain-based attribution. For linear models such as logistic regression, feature coefficients were examined to assess the relative impact of each predictor variable on the outcome. As multiple models were used in this study, the importance of the features may differ for each algorithm. To optimize model performance, hyperparameter tuning was performed using a systematic grid search approach in combination with k-fold cross-validation. The grid search method involved testing multiple combinations of hyperparameters to identify the optimal settings for each model. During cross-validation, the training dataset was divided into k equal subsets, with the model trained on k-1 folds and validated on the remaining fold in an iterative process. This method reduced the risk of overfitting while ensuring robust hyperparameter selection. The best-performing hyperparameter set was then applied to train the final model. Once the optimal model configurations were determined, a final evaluation was conducted using the independent test set. This ensured that the reported performance metrics reflected the model’s true predictive capability without bias from the training or validation phases. By adhering to this structured methodology, we aimed to develop reliable, generalizable predictive models capable of accurately assessing mortality risk. In addition, to assess whether the differences in AUC between models were statistically significant, we performed a DeLong test and calculated p-values and confidence intervals.

2.4. Train Test Split and Value of k in the Cross Fold Validation

In this study, the entire dataset was split into training and testing subsets using an 80:20 ratio. To ensure balanced representation of the target variable—namely, the occurrence of cardiovascular disease (CVD)—stratified sampling was employed during the split. This method preserved the overall event rate across both sets, thereby maintaining consistency in class distributions. The event rate of CVD in the dataset was 24.93%, consisting of 2899 positive cases and 8728 negative cases. This results in a class imbalance ratio of approximately 1:3 (positive to negative), which presents a challenge for predictive modeling.
To mitigate the effects of this imbalance and enhance model robustness, we implemented k-fold cross-validation with k set to 5, in conjunction with grid search for hyperparameter tuning. This approach allowed the model to be trained and validated on different subsets of the training data, reducing overfitting and improving generalizability. Within the training data, we further evaluated model performance under two resampling strategies to address class imbalance:
Synthetic Minority Over-sampling Technique (SMOTE) was applied to synthetically increase the number of minority class samples.
Random under-sampling was performed to reduce the number of majority class instances.
Each strategy was tested independently to compare its effect on model performance. In addition to AUC-ROC, which remains the primary evaluation metric, we also calculated the Area Under the Precision–Recall Curve (AUPRC). AUPRC is particularly suited for imbalanced datasets, as it provides a more informative measure of model performance with respect to the minority class. This dual-metric evaluation ensures a comprehensive assessment of the classifiers’ discriminatory ability and practical utility.

3. Results

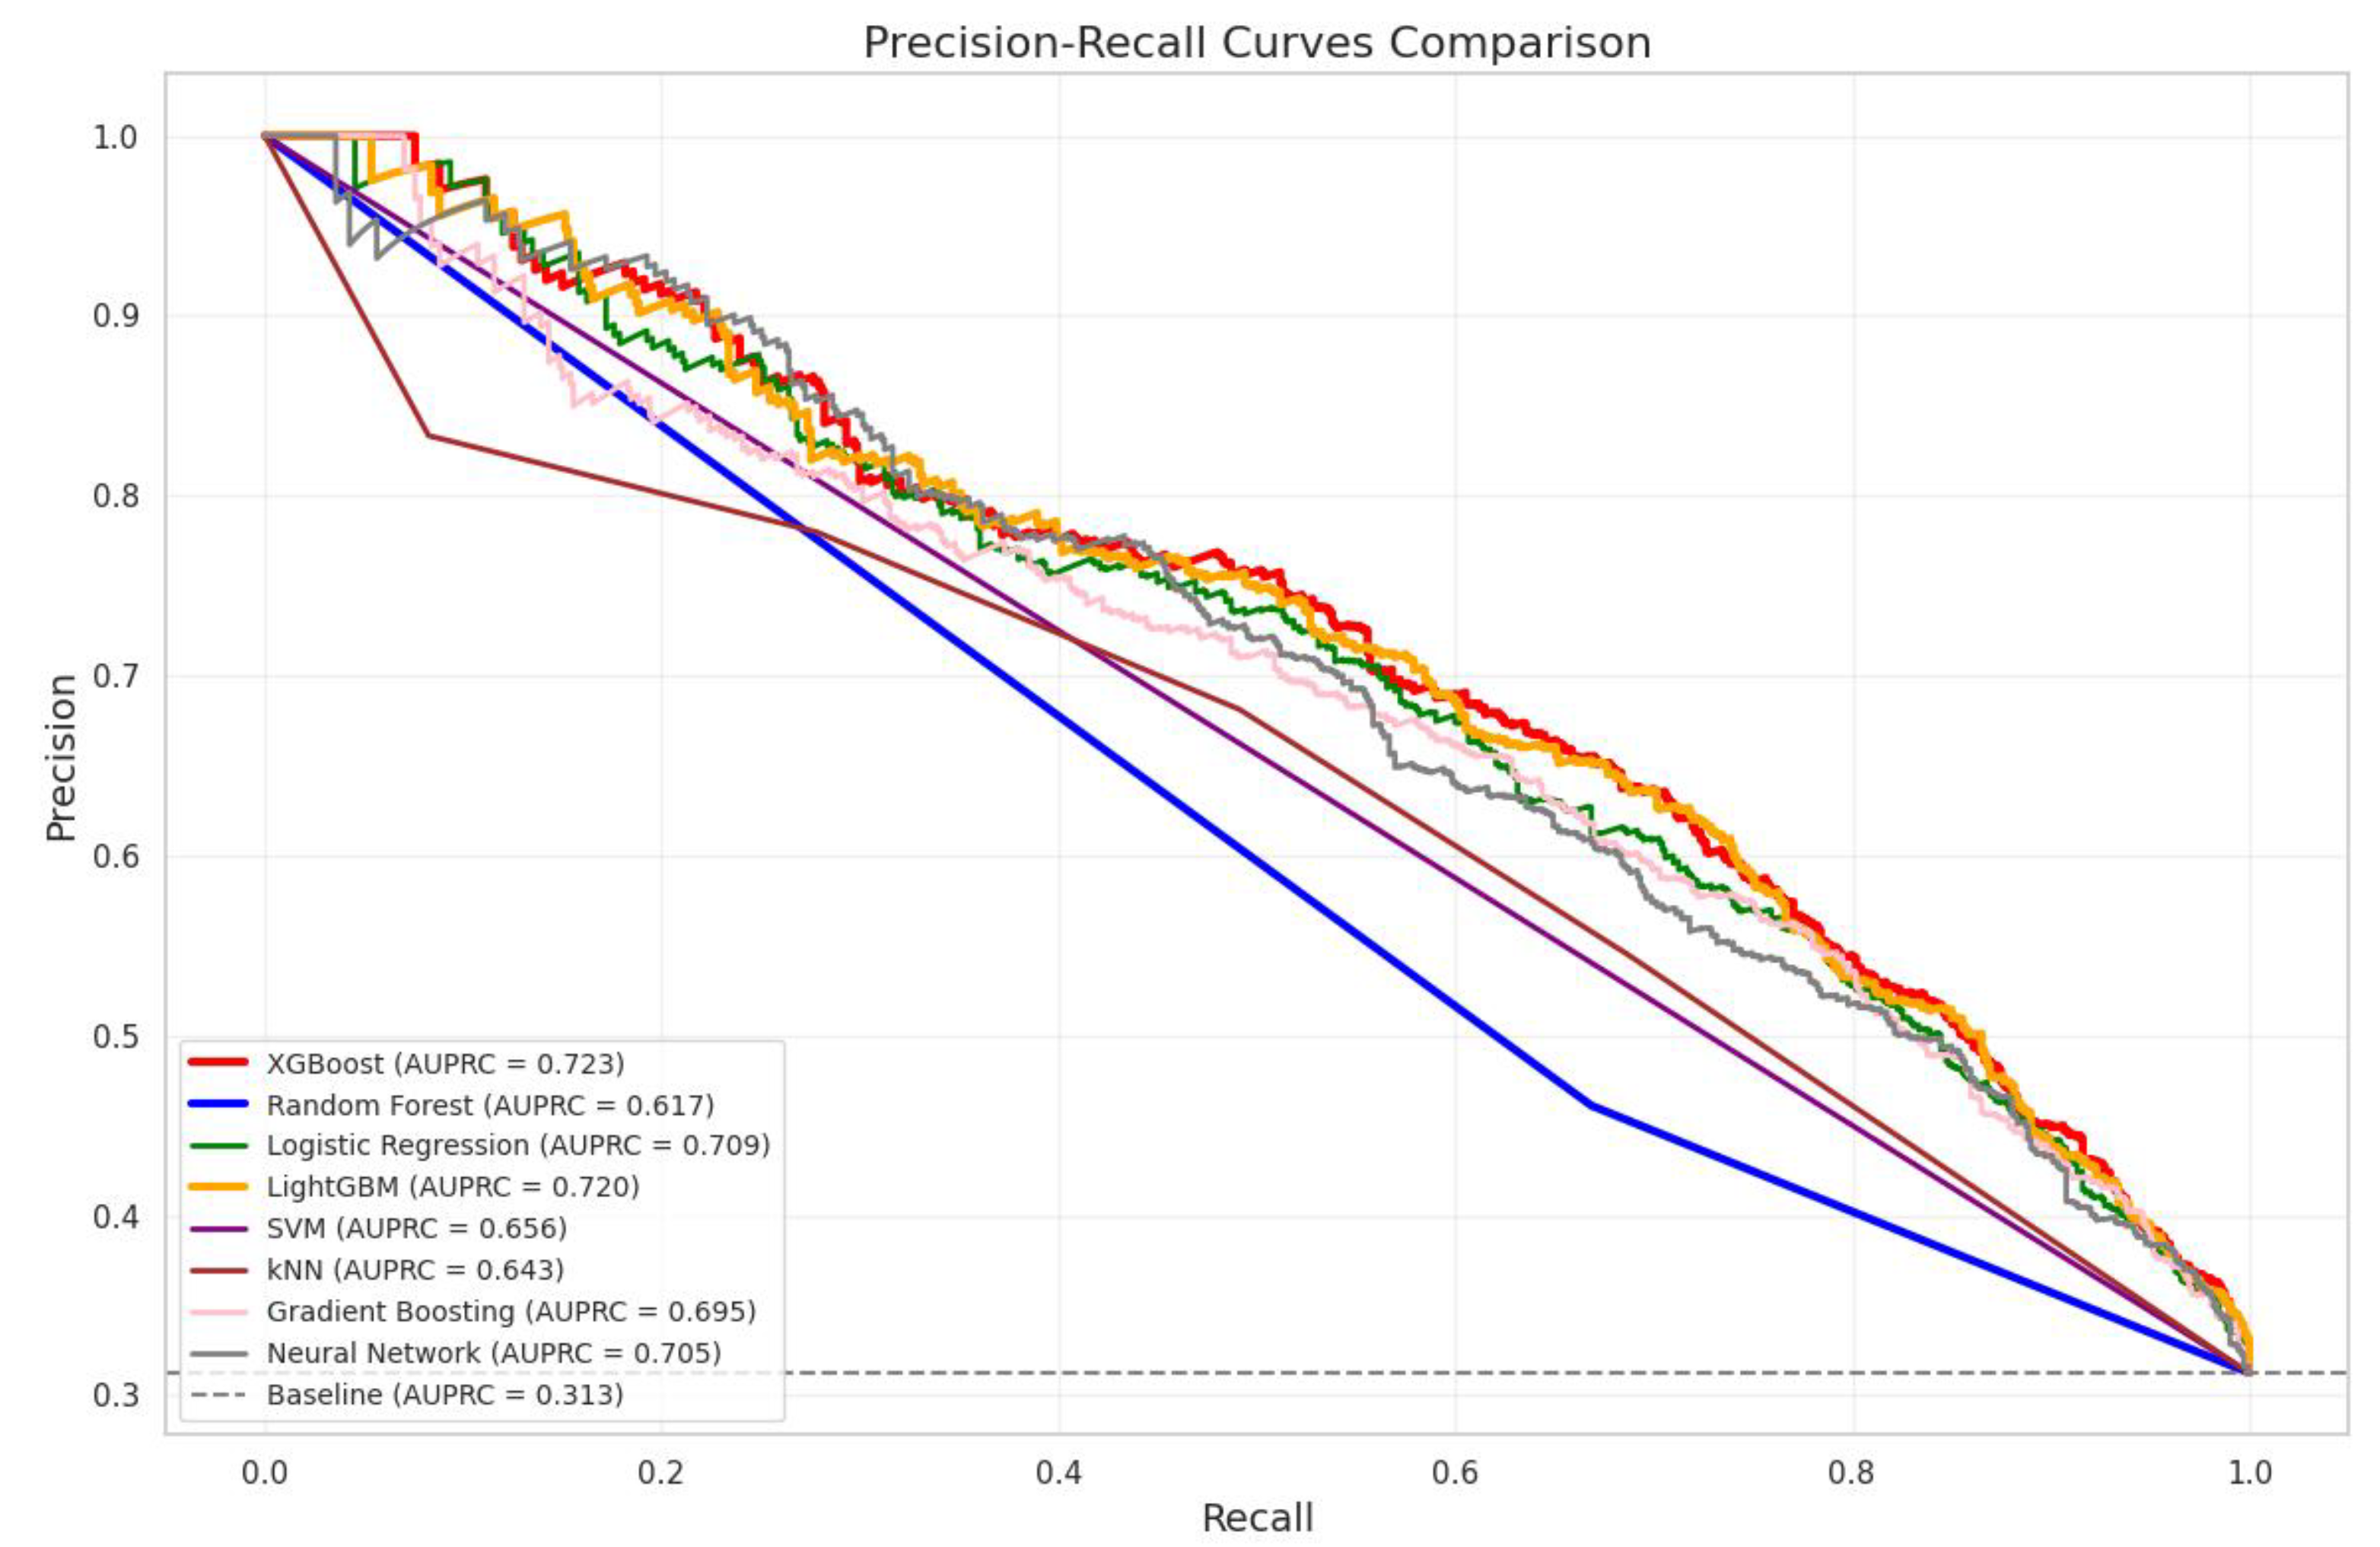
Among the machine-learning models used in the analysis, XGBoost demonstrated the highest performance in predicting mortality, with an area under the curve (AUC) value of 0.83 (Figure 1). Of the 15 parameters extracted from the Framingham dataset in this study, coronary artery disease (PREVCHD), blood glucose level (GLUCOSE), and diastolic blood pressure (DIABP) were identified as significant risk factors associated with increased mortality (Figure 2, Figure 3 and Figure 4, Table 3). Table 4 and Figure 5 highlights the XGBoost model’s superior performance, achieving an AUPRC of 0.7232, a significant 131.37% improvement over the baseline random classifier. This underscores its effectiveness in identifying positive instances while minimizing false positives compared to other models like LightGBM and Logistic Regression. The DeLong test was performed and the model comparison performance using the area under the receiver operating characteristic curve (AUC), 95% confidence intervals, and statistical significance tests are shown in Table 5. The DeLong test evaluates the significance of the difference in AUC and does not directly evaluate the difference in the overall shape of the ROC curve.
To further optimize the performance of the XGBoost model, which showed the highest predictive accuracy in our analysis, a hyperparameter tuning process was conducted using GridSearchCV. The key hyperparameter search space explored included the following:
  • n_estimators (number of trees): [50, 100, 200]
  • max_depth (maximum depth of trees): [3, 5, 7]
  • learning_rate (step size shrinkage): [0.01, 0.1, 0.2]
  • subsample (subsampling ratio of training instances): [0.7, 0.8, 0.9]
  • colsample_bytree (subsampling ratio of features): [0.7, 0.8, 0.9]
A five-fold cross-validation was employed to evaluate each hyperparameter combination, and the configuration yielding the highest AUC score was selected for the final model training.
The dataset used in this study was derived from the Framingham Heart Study, consisting of 11,627 instances and 39 variables. The outcome variable was the incidence of cardiovascular disease (CVD), with an event rate of 24.93%. The Framingham study is a large-scale longitudinal cohort study initiated in 1948, and the data used in our analysis included up to 24 years (8766 days) of follow-up for each subject.
It is noteworthy that the Random Forest (RF) and Support Vector Machine (SVM) models exhibited performance metrics of zero for precision, recall, F1-score, and sensitivity under the original, imbalanced dataset when evaluated using the default decision threshold (0.5). This occurred because these models, without adequate resampling or threshold adjustment, predominantly predicted the majority class (CVD = 0), completely failing to identify any positive cases (CVD = 1). Consequently, the number of true positives was zero, rendering all derived performance metrics undefined or zero.
Despite this, their respective AUC scores were 0.642 (RF) and 0.500 (SVM), indicating performance at or only marginally above random chance. These results underscore the critical importance of addressing class imbalance—through methods such as resampling or using appropriate evaluation metrics—when developing models on imbalanced clinical datasets.
The vertical axis shows true positive rate, and the horizontal axis shows false positive rate. The true positive rate (TPR) and false positive rate (FPR) are calculated for each cutoff point used to distinguish between survived and non-survived. These points are plotted on a graph, with the TPR on the vertical axis and the FPR on the horizontal axis, and are then connected by a line. The closer a point is to the top left corner—indicating a low false positive rate and a high true positive rate—the better the model’s performance. Similarly, a larger area under the curve (AUC) reflects a more effective discriminative marker.
The dataset shows a correlation matrix that has been cleaned using principal component analysis (PCA) for 15 factors in the dataset, such as gender and age. Various risk factors have been strongly associated with the onset of CVD and increased mortality. In the Framingham Heart Study (FHS), the variable “educ” represents years of education: 1 to 11 for elementary to high school (including dropouts), 12 for high school graduates, 13 to 15 for some college (including associate degrees), 16 for university graduates (bachelor’s degree), and 17 or more for graduate or professional education. This variable is used to analyze the relationship between educational level and health or cardiovascular disease risk. The correlation matrix is a matrix that shows the linear relationship between each variable and is generated using Pearson’s correlation coefficient. For each pair of variables, a correlation coefficient is calculated and the correlation coefficient ranges from −1 to 1, where 1 indicates a perfect positive correlation, −1 indicates a perfect negative correlation, and 0 indicates no correlation.
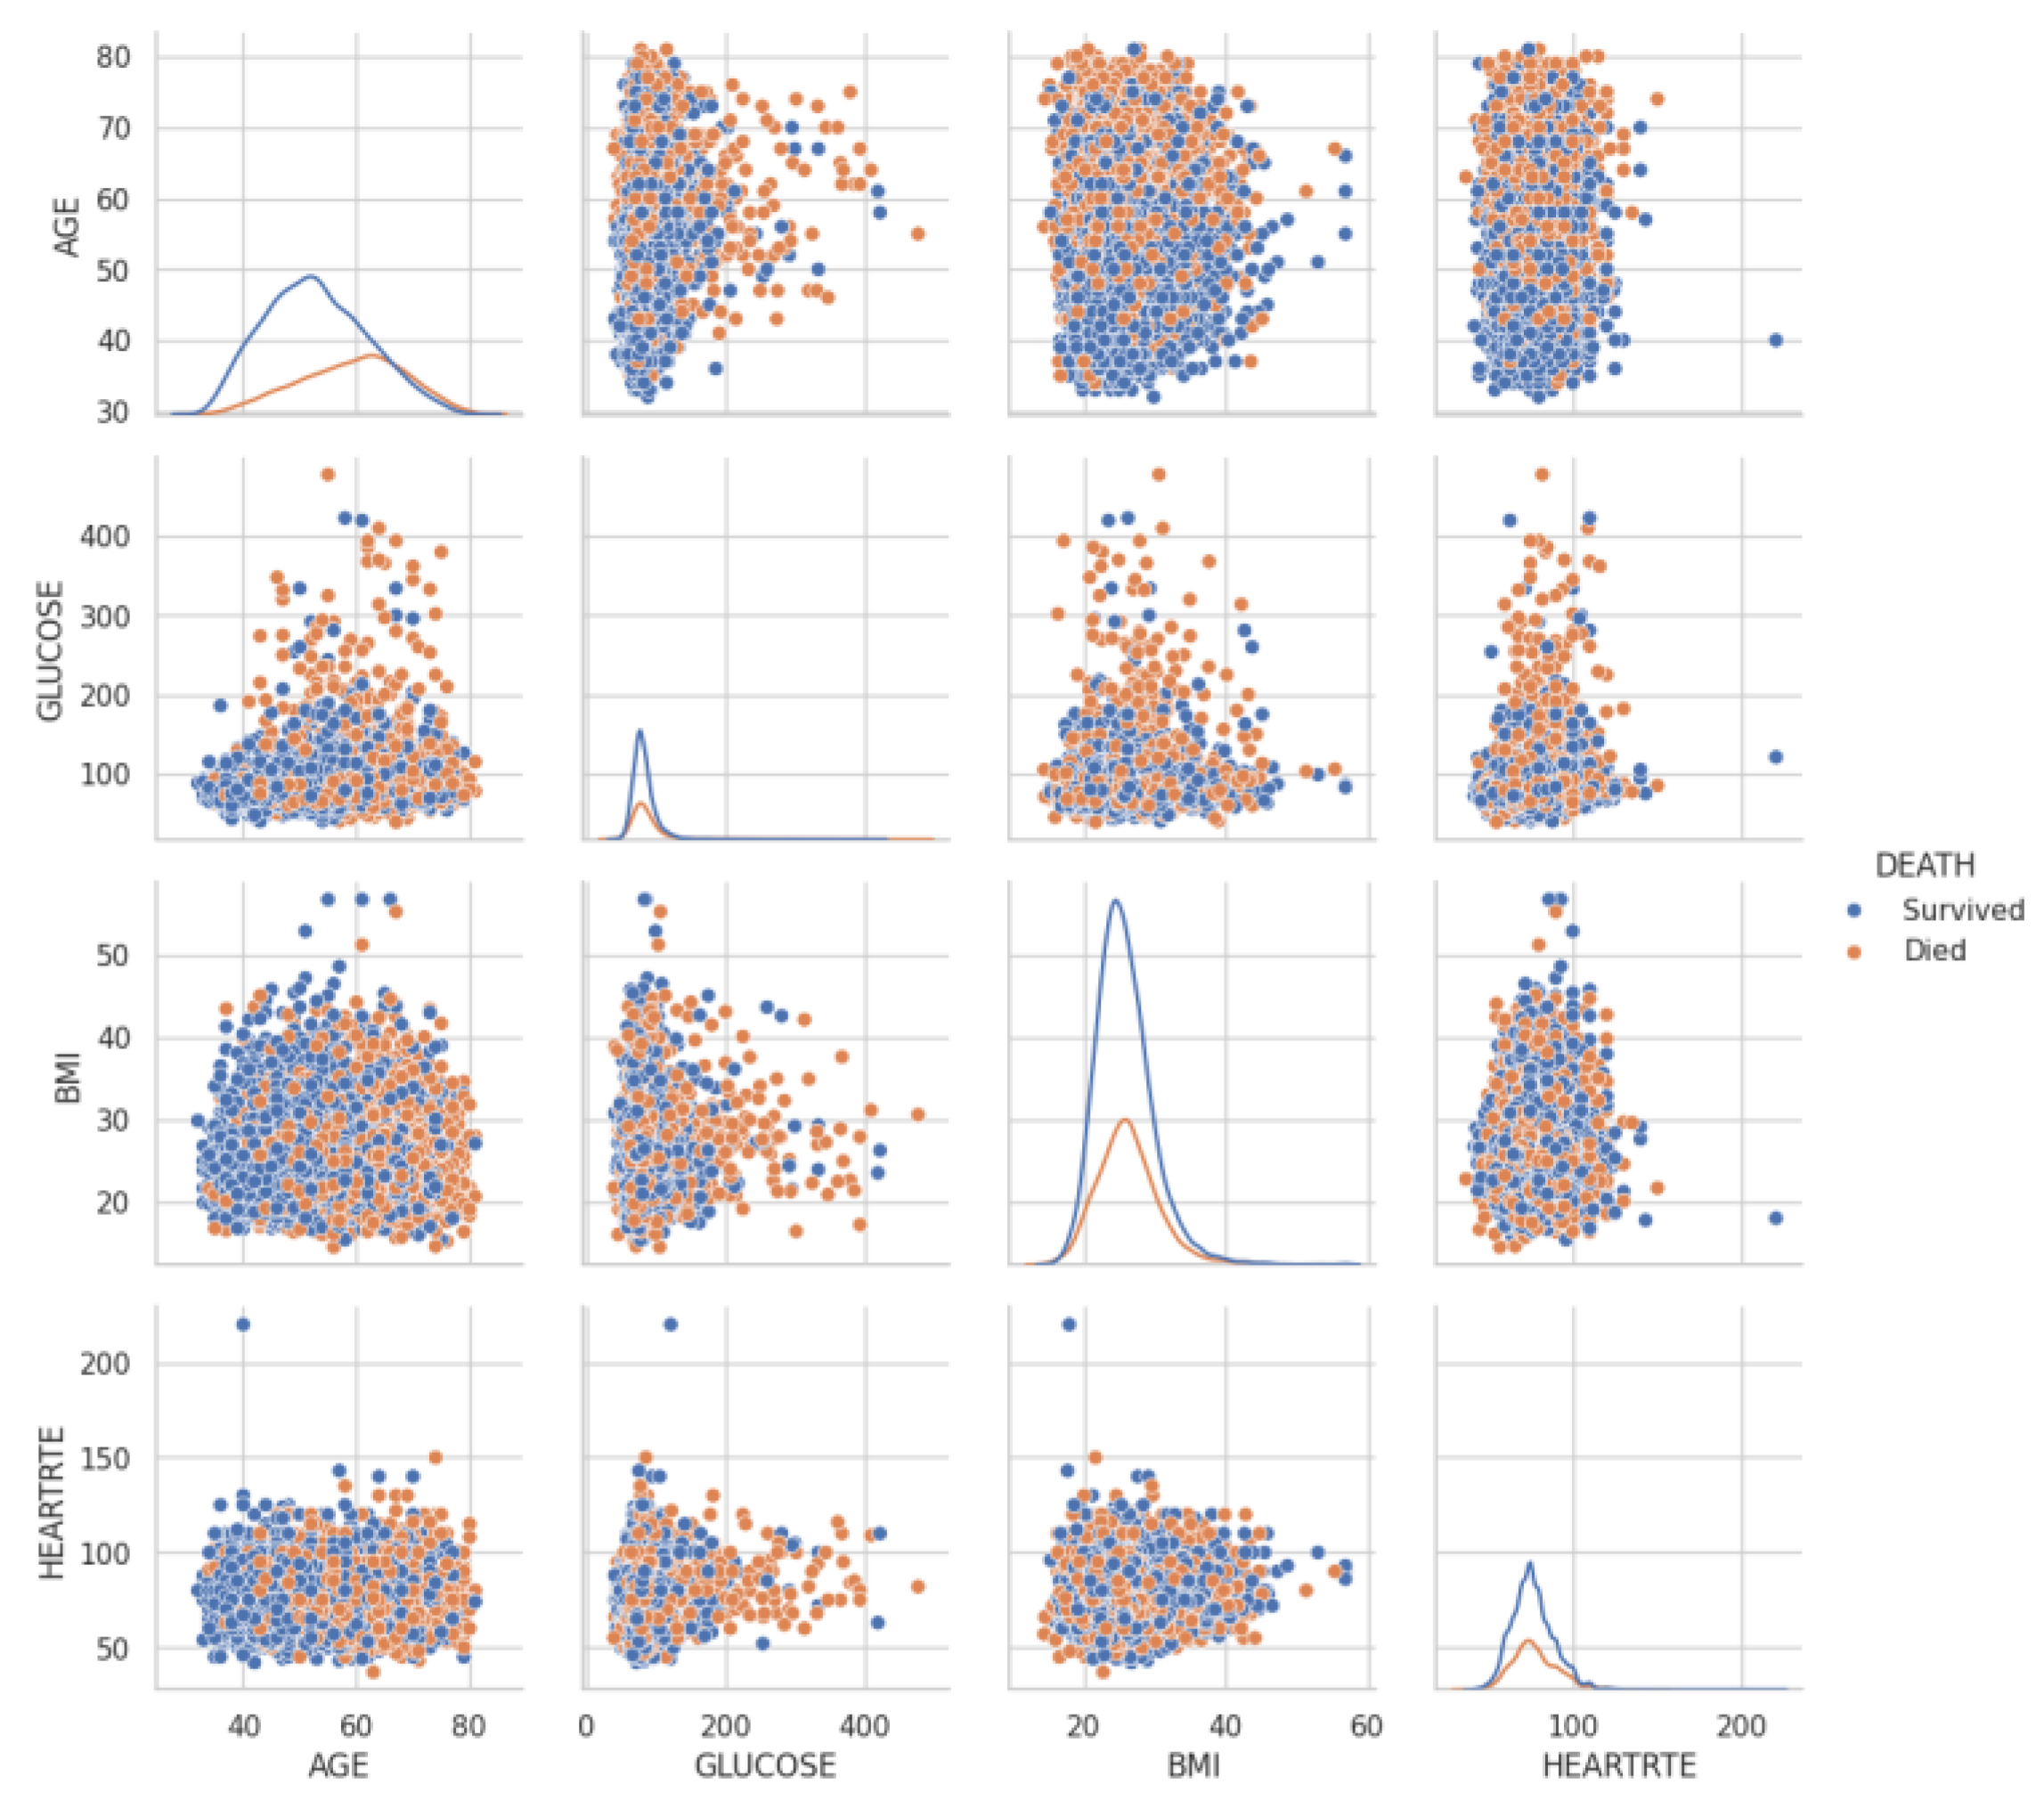
Survivors are shown in blue, non-survivors in orange. Age is an important factor analyzed in the Framingham dataset, but it has been shown to be closely associated with other physiological factors. The plots reveal that non-survivors tend to have higher glucose levels and BMI, as well as slightly elevated heart rates, compared to survivors. These trends suggest that metabolic and cardiovascular parameters interact with age to influence long-term survival outcomes, emphasizing the need for multidimensional risk assessment.
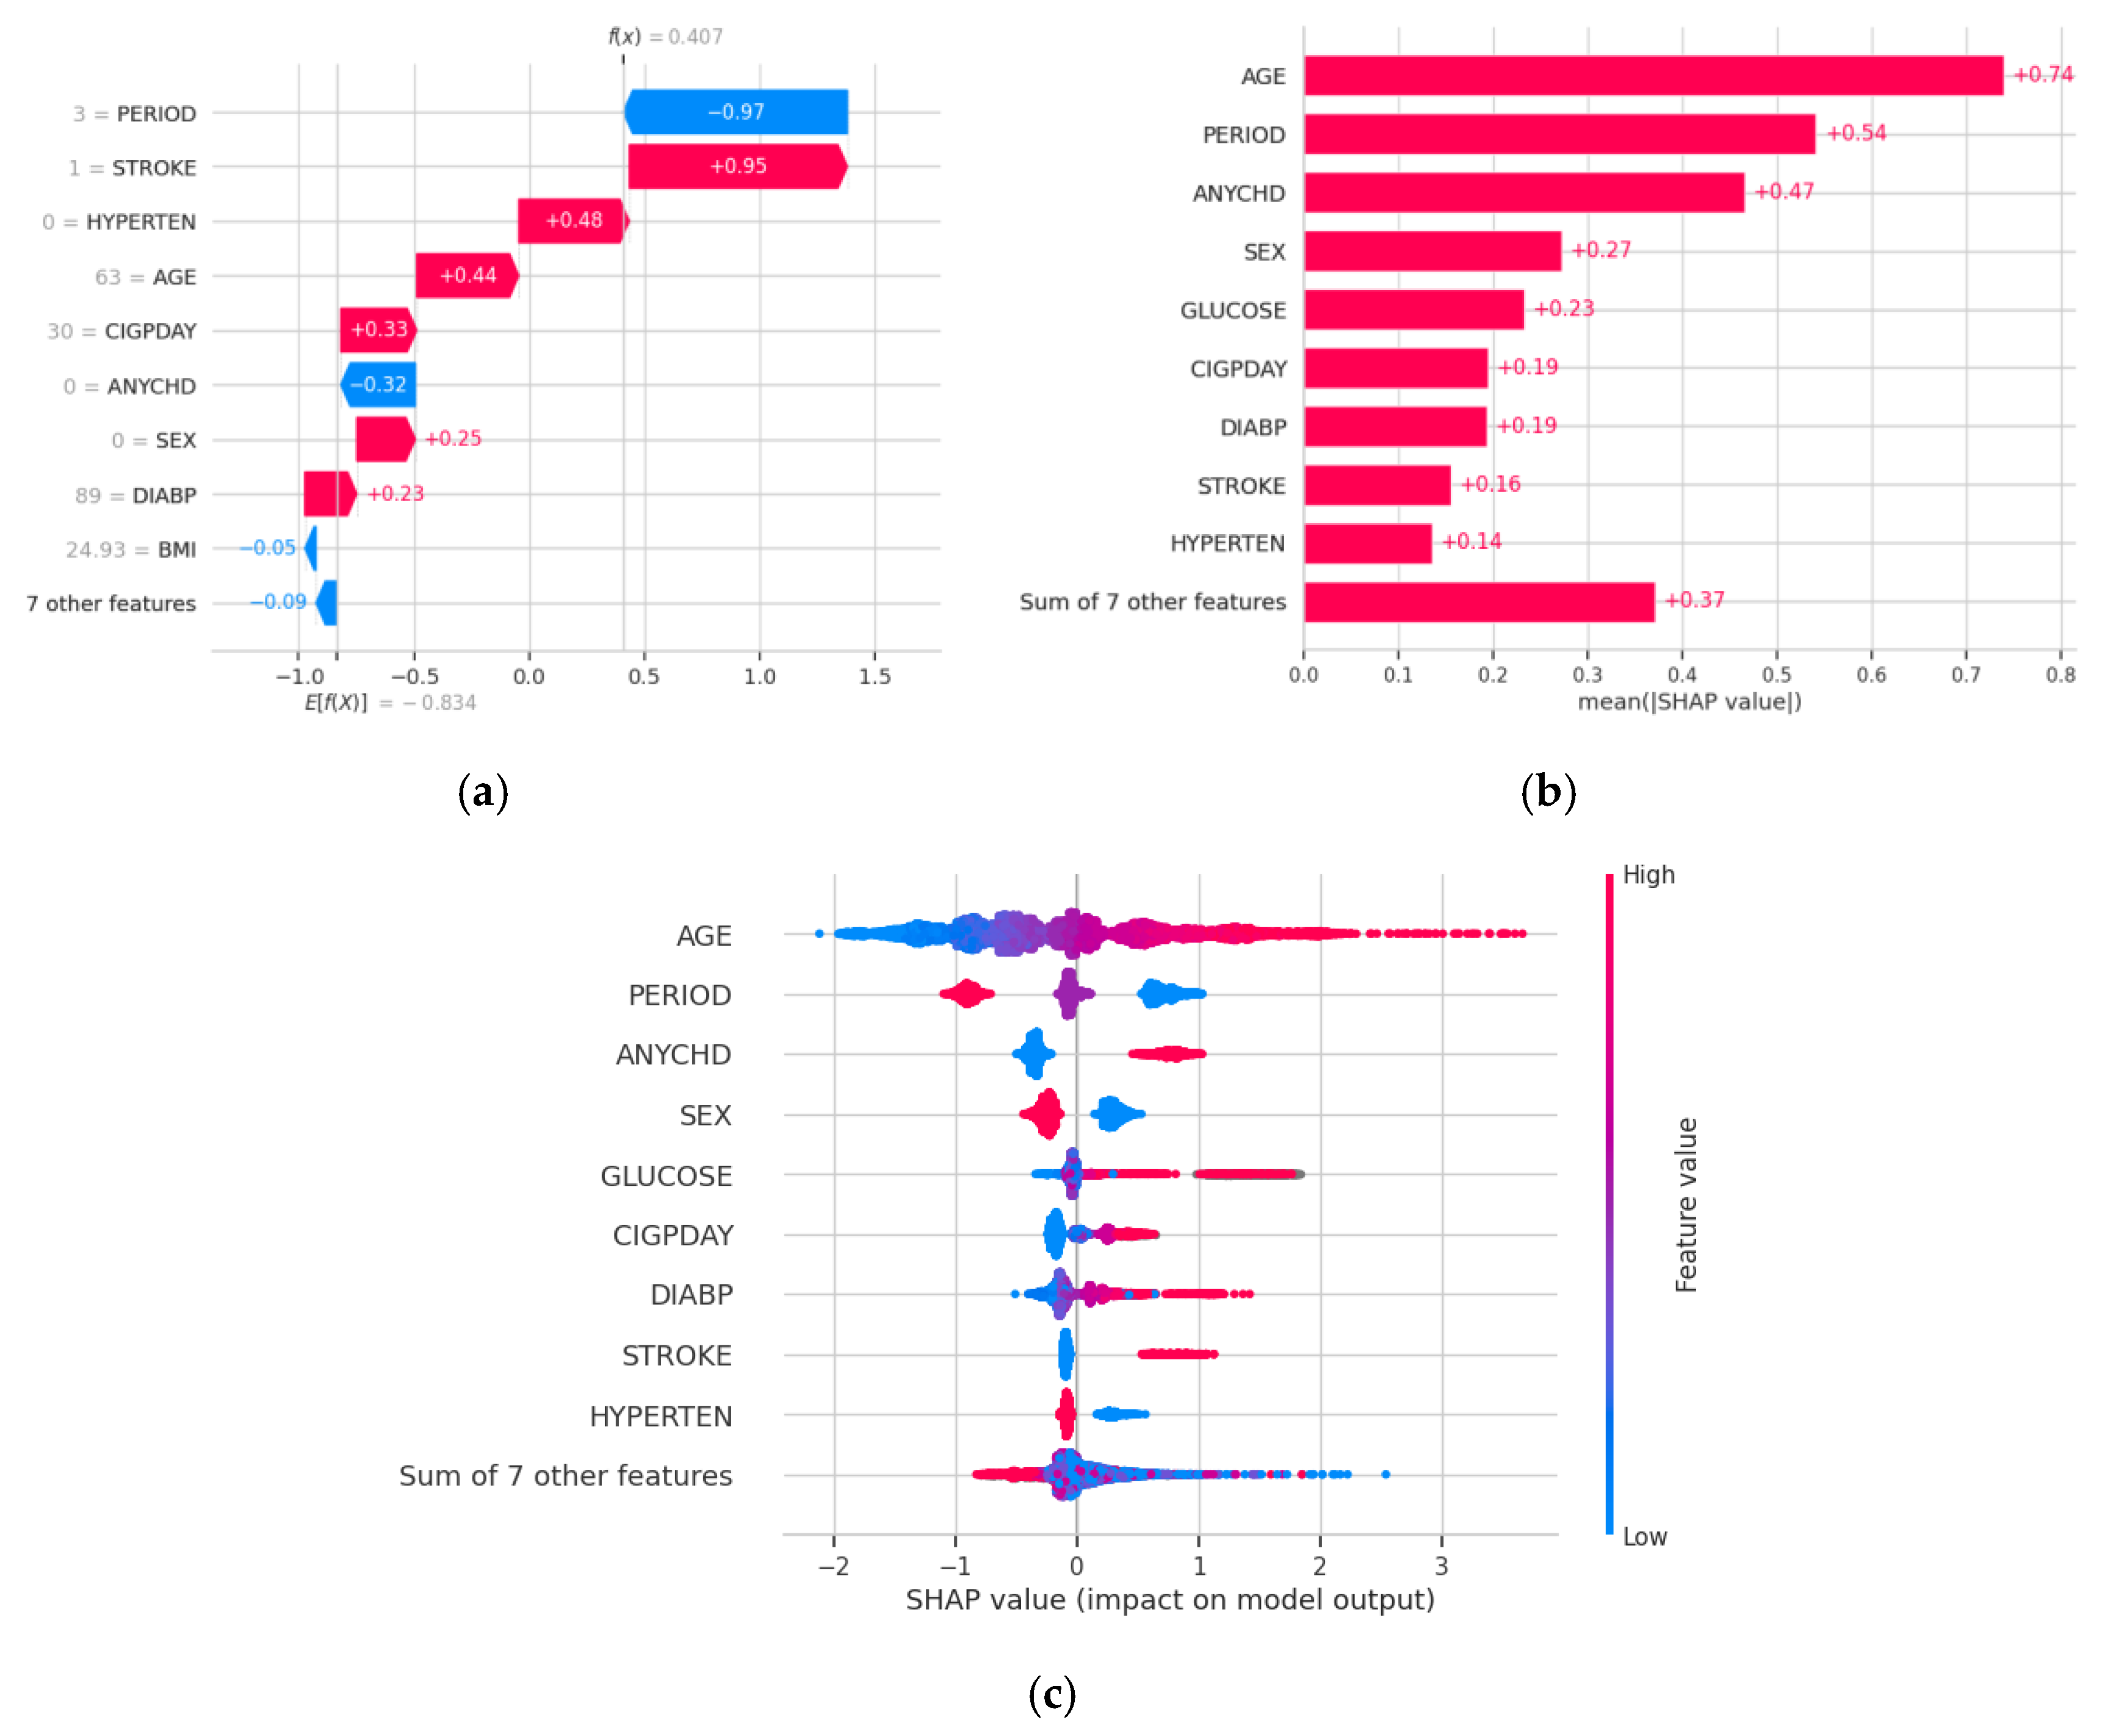
Figure 4 consists of three subfigures that collectively illustrate how individual features contribute to the prediction of mortality risk using the XGBoost (XGB) model, interpreted via SHAP (SHapley Additive exPlanations) values. Figure 4a shows a SHAP dependence plot, which visualizes how the value of a particular feature affects the SHAP value (i.e., the impact on model output), often in relation to another feature. This allows for the detection of interactions between variables and highlights non-linear relationships that the model has learned. Figure 4b presents a bar plot of the mean absolute SHAP values for each feature. This graph ranks the features in descending order of their overall importance, providing a straightforward way to identify which variables most strongly influence the model’s predictions across the entire dataset. Figure 4c is a SHAP summary plot, which shows the distribution of SHAP values for each feature across all samples. Each dot represents a single prediction (i.e., a subject), and the color gradient indicates the feature value (e.g., high or low). This plot allows for a comprehensive overview of both the importance and the direction of influence (positive or negative) of each feature. SHAP is a game–theoretic approach to explain the output of machine-learning models, particularly useful for tree-based models like XGBoost, which are often considered “black boxes.” SHAP assigns an importance value to each feature for a given prediction by calculating the average marginal contribution of that feature across all possible feature combinations. This method enables a detailed, interpretable breakdown of model decisions, allowing researchers and clinicians to understand why a specific prediction was made and which features had the greatest influence. Such interpretability is essential when applying machine-learning models in sensitive domains like healthcare, where trust and transparency are critical.
The reported results for Random Forest and SVM models, showing high accuracy (0.700) but zero values for precision, recall, F1 score, and sensitivity, are correct and commonly occur in imbalanced datasets. In this study, the target event (CVD) has a prevalence of approximately 25%, meaning that class 0 (non-CVD) dominates. If a model predicts all cases as class 0, it can achieve 70% accuracy simply by guessing the majority class. However, such a model completely fails to identify any true positives (CVD cases), resulting in zero recall, precision, and F1 score. Specificity is 1.0 because all negative cases are correctly identified. The AUC values of 0.642 and 0.500 indicate that, although the models fail to classify positive cases at a threshold of 0.5, their predicted probabilities still offer some (or random-level) discriminatory power. These results highlight the importance of addressing class imbalance through techniques like SMOTE, under-sampling, threshold tuning, or using class weights. Furthermore, relying solely on accuracy is misleading in imbalanced scenarios, and metrics such as AUC-ROC, AUPRC, and F1 score are more informative for performance evaluation.
Table 4 focuses on evaluating model performance using AUPRC (Area Under the Precision–Recall Curve), which is particularly relevant for imbalanced datasets. The purpose of Table 4 is to compare the core algorithms directly.
The Precision–Recall (PR) curve is a crucial visualization tool, especially when evaluating the performance of classification models on imbalanced datasets. Unlike the Receiver Operating Characteristic (ROC) curve, which can be overly optimistic on imbalanced data, the PR curve focuses on the positive class, providing a more insightful view of a model’s ability to identify positive instances while minimizing false positives. The PR curve plots Precision against Recall at various classification thresholds. Precision (Positive Predictive Value), measures the proportion of true positive predictions among all positive predictions made by the model. On the PR curve, the Y-axis represents precision, and the X-axis represents recall. A point closer to the top-right corner of the plot (higher precision and higher recall) indicates better performance. The Area Under the Precision–Recall Curve (AUPRC), also often referred to as Average Precision (AP), is a single scalar value that summarizes the performance of a model across all possible thresholds. The AUPRC calculates the weighted mean of precision values achieved at each threshold, where the weight is the increase in recall from the previous threshold. A higher AUPRC value indicates a better model. An AUPRC of 1.0 represents a perfect classifier that achieves 100% precision and 100% recall.
Table 5 presents the comparative performance of the benchmark model, XGBoost, against all other machine-learning models using the DeLong test, which statistically assesses differences between two ROC (Receiver Operating Characteristic) curves. Each row compares the AUC (Area Under the Curve) of XGBoost (AUC1) with that of another model (AUC2), along with the following: Δ AUC: the difference in AUC scores; Z: the Z-score from the DeLong test; p-value: the raw statistical significance; Adj. P: the adjusted p-value using Bonferroni correction to account for multiple comparisons; Effect Size: the magnitude of the difference between models, based on Δ AUC. Among the comparisons, XGBoost significantly outperformed Random Forest, kNN, Neural Network, SVM, and Logistic Regression. These differences were statistically significant (p < 0.001) and remained so even after adjusting for multiple testing. The largest performance gap was between XGBoost and Random Forest (Δ AUC = 0.3341) with a large effect size of 0.758, indicating that XGBoost is markedly better at distinguishing between positive and negative cases than Random Forest. The difference between XGBoost and LightGBM or Gradient Boosting was not statistically significant, suggesting that these models had a performance close to XGBoost. After Bonferroni correction, six out of ten comparisons remained significant, highlighting that XGBoost offers consistently superior performance across a variety of models. This comprehensive analysis strengthens the claim that XGBoost is the most reliable and robust model in this mortality risk prediction task, especially under class-imbalanced conditions.

4. Discussion

This study identified glucose levels and blood pressure—particularly diastolic pressure—as major predictors of cardiovascular mortality, reaffirming findings from previous research. Elevated glucose levels are strongly associated with increased cardiovascular risk through mechanisms involving diabetes and metabolic syndrome, while persistently high diastolic blood pressure contributes to vascular stress and the development of arteriosclerosis and heart failure. These results underscore the importance of accurate and, ideally, continuous monitoring of these physiological parameters. Recent advances in minimally invasive glucose monitoring using interstitial fluid [43] and non-invasive blood pressure estimation via optical sensors [44,45,46,47,48,49,50] have the potential to enhance individual-level risk monitoring outside clinical settings. These technologies enable dynamic assessment of cardiovascular health and support early interventions.
In this study, we directly compared the proposed machine-learning models with the classical Framingham Risk Score (FRS) using the Framingham Heart Study dataset. XGBoost achieved the highest AUC of 0.83, significantly outperforming FRS (AUC = 0.78) with a relative improvement of approximately 6.4%. This enhancement in discrimination indicates the potential clinical utility of machine-learning approaches in more accurately identifying individuals at high cardiovascular mortality risk, thereby enabling earlier and more targeted interventions.
However, several limitations must be acknowledged. First, the Framingham dataset, while well established, reflects a relatively homogeneous population—primarily middle-class white individuals in Massachusetts—limiting its applicability to broader, more diverse populations. While our models showed high predictive performance within the Framingham cohort, generalizability to demographically diverse populations remains a critical challenge. Previous studies, such as those using the Multi-Ethnic Study of Atherosclerosis (MESA) and the Jackson Heart Study, have demonstrated that machine-learning models trained on homogeneous data may underperform in different ethnic or socioeconomic groups. Future validation on independent cohorts with diverse demographics is essential to assess model robustness and ensure equitable cardiovascular risk prediction across populations.
Second, although sex-based differences in cardiovascular risk were not prominent in our reanalysis, gender bias remains an important consideration. Cardiovascular risk increases significantly in postmenopausal women due to hormonal changes—an aspect not fully captured in the Framingham dataset [51,52,53,54,55,56]. Moreover, some prior studies have shown that women may experience a higher relative risk of cardiovascular events from diabetes and hypertension compared to men.
Third, the analysis was limited to 15 parameters derived from the Framingham dataset, excluding potentially important factors such as inflammatory biomarkers, genetic predisposition, mental stress, and detailed lifestyle information (e.g., diet, physical activity, sleep). Integrating these factors—potentially via wearable biosensors—could substantially improve risk stratification and enable more personalized health management.
In conclusion, this study contributes to the growing body of research on AI-driven cardiovascular risk prediction by demonstrating the superiority of machine-learning models over traditional scoring systems like FRS. These findings support the use of such models in early detection, targeted intervention, and preventive public health strategies. With further validation and integration of diverse data sources, machine-learning approaches hold promise for advancing personalized cardiovascular care.

5. Conclusions

In this study, we used the Framingham dataset to apply five types of machine-learning models (XG Boost, Random Forest, Logistic Regression, Ensemble Learning, and Ensemble Stacking) and compared their accuracy in predicting the risk of death from heart disease. The results showed that XG Boost had the highest prediction performance (AUC = 0.83). Furthermore, among the 15 parameters extracted from the dataset, it was confirmed that coronary artery disease (PREVCHD), glucose level (GLUCOSE), and diastolic blood pressure (DIABP) were important factors strongly associated with the risk of death. The choice between continuous monitoring and regular home monitoring considers the possibility of intervention in specific risk groups. The significance of this study lies in the fact that it integrates existing knowledge using machine learning to explore the possibility of its application to health management and other areas.

Author Contributions

Conceptualization, E.Y.; methodology, E.Y. and I.K.; software, D.H.; validation, D.H.; formal analysis, D.H.; investigation, E.Y.; resources, D.H. and I.K.; data curation, E.Y.; writing—original draft preparation, E.Y.; writing—review and editing, E.Y.; visualization, D.H.; supervision, E.Y.; project administration, E.Y.; funding acquisition, E.Y. All authors have read and agreed to the published version of the manuscript.

Funding

This research received no external funding.

Institutional Review Board Statement

This study involves the analysis of open data. The open data does not contain personally identifiable information (such as addresses or names), and since it does not involve human subjects, ethical review board approval is not required.

Informed Consent Statement

In this study, informed consent is not required as the research involves the analysis of open data that does not contain personally identifiable information. The data used in this study is anonymized and does not pertain to human subjects directly, thus making the informed consent process unnecessary.

Data Availability Statement

The data used in this study is publicly available from Kaggle’s Framingham Heart Study dataset. The dataset can be accessed at the following URL: https://www.kaggle.com/datasets/ (accessed on 30 June 2025). The data is provided under the terms of the relevant license and can be freely accessed for research purposes.

Conflicts of Interest

The authors declare no conflicts of interest.

References

  1. Teo, K.K.; Rafiq, T. Cardiovascular Risk Factors and Prevention: A Perspective from Developing Countries. Can. J. Cardiol. 2021, 37, 733–743. [Google Scholar] [CrossRef]
  2. Lopez-Jaramillo, P.; Lopez-Lopez, J.P.; Tole, M.C.; Cohen, D.D. Muscular Strength in Risk Factors for Cardiovascular Disease and Mortality: A Narrative Review. Anatol. J. Cardiol. 2022, 26, 598–607. [Google Scholar] [CrossRef] [PubMed]
  3. Artola Arita, V.; Beigrezaei, S.; Franco, O.H. Risk Factors for Cardiovascular Disease: The Known Unknown. Eur. J. Prev. Cardiol. 2024, 31, e106–e107. [Google Scholar] [CrossRef]
  4. Miller, D.V.; Watson, K.E.; Wang, H.; Fyfe-Kirschner, B.; Heide, R.S.V. Racially Related Risk Factors for Cardiovascular Disease: Society for Cardiovascular Pathology Symposium 2022. Cardiovasc. Pathol. 2022, 61, 107470. [Google Scholar] [CrossRef]
  5. Saba, P.S.; Parodi, G.; Ganau, A. From Risk Factors to Clinical Disease: New Opportunities and Challenges for Cardiovascular Risk Prediction. J. Am. Coll. Cardiol. 2021, 77, 1436–1438. [Google Scholar] [CrossRef]
  6. Whelton, S.P.; Post, W.S. Importance of Traditional Cardiovascular Risk Factors for Identifying High-Risk Persons in Early Adulthood. Eur. Heart J. 2022, 43, 2901–2903. [Google Scholar] [CrossRef]
  7. Pirzada, A.; Cai, J.; Cordero, C.; Gallo, L.C.; Isasi, C.R.; Kunz, J.; Thyagaragan, B.; Wassertheil-Smoller, S.; Daviglus, M.L. Risk Factors for Cardiovascular Disease: Knowledge Gained from the Hispanic Community Health Study/Study of Latinos. Curr. Atheroscler. Rep. 2023, 25, 785–793. [Google Scholar] [CrossRef]
  8. Godijk, N.G.; Vos, A.G.; Jongen, V.W.; Moraba, R.; Tempelman, H.; Grobbee, D.E.; Coutinho, R.A.; Devillé, W.; Klipstein-Grobusch, K. Heart Rate Variability, HIV and the Risk of Cardiovascular Diseases in Rural South Africa. Glob. Heart 2020, 15, 17. [Google Scholar] [CrossRef]
  9. Rosenthal, T.; Touyz, R.M.; Oparil, S. Migrating Populations and Health: Risk Factors for Cardiovascular Disease and Metabolic Syndrome. Curr. Hypertens. Rep. 2022, 24, 325–340. [Google Scholar] [CrossRef] [PubMed]
  10. Quesada, O. Reproductive Risk Factors for Cardiovascular Disease in Women. Menopause 2023, 30, 1058–1060. [Google Scholar] [CrossRef] [PubMed]
  11. Hauer, R.N.W. The Fractionated QRS Complex for Cardiovascular Risk Assessment. Eur. Heart J. 2022, 43, 4192–4194. [Google Scholar] [CrossRef]
  12. Thayer, J.F.; Yamamoto, S.S.; Brosschot, J.F. The Relationship of Autonomic Imbalance, Heart Rate Variability and Cardio-vascular Disease Risk Factors. Int. J. Cardiol. 2010, 141, 122–131. [Google Scholar] [CrossRef] [PubMed]
  13. Wekenborg, M.K.; Künzel, R.G.; Rothe, N.; Penz, M.; Walther, A.; Kirschbaum, C.; Thayer, J.F.; Hill, L.K. Exhaustion and Car-diovascular Risk Factors: The Role of Vagally-Mediated Heart Rate Variability. Ann. Epidemiol. 2023, 87, S1047–S2797. [Google Scholar] [CrossRef] [PubMed]
  14. Malik, M. Heart Rate Variability. Curr. Opin. Cardiol. 1998, 13, 36–44. [Google Scholar] [CrossRef]
  15. Hutchesson, M.; Campbell, L.; Leonard, A.; Vincze, L.; Shrewsbury, V.; Collins, C.; Taylor, R. Disorders of Pregnancy and Cardiovascular Health Outcomes? A Systematic Review of Observational Studies. Pregnancy Hypertens. 2022, 27, 138–147. [Google Scholar] [CrossRef] [PubMed]
  16. Freak-Poli, R.; Phyo, A.Z.Z.; Hu, J.; Barker, S.F. Are Social Isolation, Lack of Social Support or Loneliness Risk Factors for Cardiovascular Disease in Australia and New Zealand? A Systematic Review and Meta-Analysis. Health Promot. J. Aust. 2022, 33, 278–315. [Google Scholar] [CrossRef]
  17. Bergami, M.; Scarpone, M.; Bugiardini, R.; Cenko, E.; Manfrini, O. Sex Beyond Cardiovascular Risk Factors and Clinical Biomarkers of Cardiovascular Disease. Rev. Cardiovasc. Med. 2022, 23, 19. [Google Scholar] [CrossRef]
  18. Kato, M. Diet- and Sleep-Based Approach for Cardiovascular Risk/Diseases. Nutrients 2023, 15, 3668. [Google Scholar] [CrossRef]
  19. Greiser, K.H.; Kluttig, A.; Schumann, B.; Kors, J.A.; Swenne, C.A.; Kuss, O.; Werdan, K.; Haerting, J. Cardiovascular Disease, Risk Factors and Heart Rate Variability in the Elderly General Population: De-sign and Objectives of the CARLA Study. BMC Cardiovasc. Disord. 2005, 5, 36. [Google Scholar] [CrossRef]
  20. Nakayama, N.; Miyachi, M.; Tamakoshi, K.; Morikawa, S.; Negi, K.; Watanabe, K.; Moriwaki, Y.; Hirai, M. Increased After-noon Step Count Increases Heart Rate Variability in Patients with Cardiovascular Risk Factors. J. Clin. Nurs. 2022, 31, 1636–1642. [Google Scholar] [CrossRef]
  21. Møller, A.L.; Andersson, C. Importance of Smoking Cessation for Cardiovascular Risk Reduction. Eur. Heart J. 2021, 42, 4154–4156. [Google Scholar] [CrossRef] [PubMed]
  22. Yuda, E.; Ueda, N.; Kisohara, M.; Hayano, J. Redundancy among risk predictors derived from heart rate variability and dynamics: ALLSTAR big data analysis. Ann. Noninvasive Electrocardiol. 2021, 26, e12790. [Google Scholar] [CrossRef] [PubMed]
  23. Carney, R.M.; Blumenthal, J.A.; Freedland, K.E.; Stein, P.K.; Howells, W.B.; Berkman, L.F.; Watkins, L.L.; Czajkowski, S.M.; Hayano, J.; Domitrovich, P.P.; et al. Low heart rate variability and the effect of depression on post-myocardial infarction mortality. Arch. Intern. Med. 2005, 165, 1486–1491. [Google Scholar] [CrossRef]
  24. Blumenthal, J.A.; Sherwood, A.; Babyak, M.A.; Watkins, L.L.; Waugh, R.; Georgiades, A.; Bacon, S.L.; Hayano, J.; Coleman, R.E.; Hinderliter, A. Effects of exercise and stress management training on markers of cardiovascular risk in patients with ischemic heart disease: A randomized controlled trial. JAMA 2005, 293, 1626–1634. [Google Scholar] [CrossRef] [PubMed]
  25. Kiyono, K.; Hayano, J.; Watanabe, E.; Struzik, Z.R.; Yamamoto, Y. Non-Gaussian heart rate as an independent predictor of mortality in patients with chronic heart failure. Heart Rhythm 2008, 5, 261–268. [Google Scholar] [CrossRef]
  26. Kojima, M.; Hayano, J.; Fukuta, H.; Sakata, S.; Mukai, S.; Ohte, N.; Seno, H.; Toriyama, T.; Kawahara, H.; Furukawa, T.A.; et al. Loss of fractal heart rate dynamics in depressive hemodialysis patients. Psychosom. Med. 2008, 70, 177–185. [Google Scholar] [CrossRef]
  27. Vu, T.; Kokubo, Y.; Inoue, M.; Yamamoto, M.; Mohsen, A.; Martin-Morales, A.; Dawadi, R.; Inoue, T.; Ting, T.J.; Yoshizaki, M.; et al. Unveiling Coronary Heart Disease Prediction through Machine Learning Techniques: Insights from the Suita Population-Based Cohort Study. Res. Sq. 2024, 2024, 1–10. [Google Scholar] [CrossRef]
  28. Mahmood, S.S.; Levy, D.; Vasan, R.S.; Wang, T.J. The Framingham Heart Study and the Epidemiology of Cardiovascular Disease: A Historical Perspective. Lancet 2014, 383, 999–1008. [Google Scholar] [CrossRef]
  29. Andersson, C.; Johnson, A.D.; Benjamin, E.J.; Levy, D.; Vasan, R.S. 70-Year Legacy of the Framingham Heart Study. Nat. Rev. Cardiol. 2019, 16, 687–698. [Google Scholar] [CrossRef]
  30. D’Agostino, R.B., Sr.; Vasan, R.S.; Pencina, M.J.; Wolf, P.A.; Cobain, M.; Massaro, J.M.; Kannel, W.B. General Cardiovascular Risk Profile for Use in Primary Care: The Framingham Heart Study. Circulation 2008, 117, 743–753. [Google Scholar] [CrossRef]
  31. Andersson, C.; Nayor, M.; Tsao, C.W.; Levy, D.; Vasan, R.S. Framingham Heart Study: JACC Focus Seminar, 1/8. J. Am. Coll. Cardiol. 2021, 77, 2680–2692. [Google Scholar] [CrossRef]
  32. Cooper, L.L.; Mitchell, G.F. Incorporation of Novel Vascular Measures into Clinical Management: Recent Insights from the Framingham Heart Study. Curr. Hypertens. Rep. 2019, 21, 19. [Google Scholar] [CrossRef] [PubMed]
  33. Ding, H.; Mandapati, A.; Hamel, A.P.; Karjadi, C.; Ang, T.F.A.; Xia, W.; Au, R.; Lin, H. Multimodal Machine Learning for 10-Year Dementia Risk Prediction: The Framingham Heart Study. J. Alzheimers Dis. 2023, 96, 277–286. [Google Scholar] [CrossRef] [PubMed]
  34. Graf, G.H.J.; Aiello, A.E.; Caspi, A.; Kothari, M.; Liu, H.; Moffitt, T.E.; Muennig, P.A.; Ryan, C.P.; Sugden, K.; Belsky, D.W. Educational Mobility, Pace of Aging, and Lifespan Among Participants in the Framingham Heart Study. JAMA Netw. Open 2024, 7, e240655. [Google Scholar] [CrossRef]
  35. Murabito, J.M. Women and Cardiovascular Disease: Contributions from the Framingham Heart Study. J. Am. Med. Womens Assoc. 1995, 50, 35–39, 55. [Google Scholar] [PubMed]
  36. Rempakos, A.; Prescott, B.; Mitchell, G.F.; Vasan, R.S.; Xanthakis, V. Association of Life’s Essential 8 with Cardiovascular Disease and Mortality: The Framingham Heart Study. J. Am. Heart Assoc. 2023, 12, e030764. [Google Scholar] [CrossRef]
  37. Cybulska, B.; Kłosiewicz-Latoszek, L. Landmark Studies in Coronary Heart Disease Epidemiology: The Framingham Heart Study after 70 Years and the Seven Countries Study after 60 Years. Kardiol. Pol. 2019, 77, 173–180. [Google Scholar] [CrossRef]
  38. Kahouadji, N. Comparison of Machine Learning Classification Algorithms and Application to the Framingham Heart Study. arXiv 2024, arXiv:2402.15005. [Google Scholar] [CrossRef]
  39. Keizer, S.; Zhan, Z.; Ramachandran, V.S.; van den Heuvel, E.R. Joint Modeling with Time-Dependent Treatment and Heteroskedasticity: Bayesian Analysis with Application to the Framingham Heart Study. arXiv 2019, arXiv:1912.06398. [Google Scholar]
  40. Psychogyios, K.; Ilias, L.; Askounis, D. Comparison of Missing Data Imputation Methods Using the Framingham Heart Study Dataset. In Proceedings of the Institute of Electrical and Electronics Engineers Conference, Seoul, Republic of Korea, 16–20 May 2022. [Google Scholar]
  41. Priyanka, H.U.; Vivek, R. Multi Model Data Mining Approach for Heart Failure Prediction. Int. J. Data Min. Knowl. Manag. Process 2016, 6, 31–39. [Google Scholar] [CrossRef]
  42. Rao, A.R.; Wang, H.; Gupta, C. Predictive Analysis for Optimizing Port Operations. Appl. Sci. 2025, 15, 2877. [Google Scholar] [CrossRef]
  43. Hayano, J.; Yamada, A.; Yoshida, Y.; Ueda, N.; Yuda, E. Spectral Structure and Nonlinear Dynamics Properties of Long-Term Interstitial Fluid Glucose. Int. J. Biosci. Biochem. Bioinform. 2020, 10, 137–143. [Google Scholar] [CrossRef]
  44. Schutte, A.E.; Kollias, A.; Stergiou, G.S. Blood Pressure and Its Variability: Classic and Novel Measurement Techniques. Nat. Rev. Cardiol. 2022, 19, 643–654. [Google Scholar] [CrossRef] [PubMed]
  45. Bradley, C.K.; Shimbo, D.; Colburn, D.A.; Pugliese, D.N.; Padwal, R.; Sia, S.K.; Anstey, D.E. Cuffless Blood Pressure Devices. Am. J. Hypertens. 2022, 35, 380–387. [Google Scholar] [CrossRef]
  46. Sagirova, Z.; Kuznetsova, N.; Gogiberidze, N.; Gognieva, D.; Suvorov, A.; Chomakhidze, P.; Omboni, S.; Saner, H.; Kopylov, P. Cuffless Blood Pressure Measurement Using a Smartphone-Case Based ECG Monitor with Photoplethysmography in Hypertensive Patients. Sensors 2021, 21, 3525. [Google Scholar] [CrossRef]
  47. Tamura, T.; Huang, M. Cuffless Blood Pressure Monitor for Home and Hospital Use. Sensors 2025, 25, 640. [Google Scholar] [CrossRef]
  48. Tamura, T.; Shimizu, S.; Nishimura, N.; Takeuchi, M. Long-Term Stability of Over-the-Counter Cuffless Blood Pressure Monitors: A Proposal. Health Technol. 2023, 13, 53–63. [Google Scholar] [CrossRef]
  49. Pandit, J.A.; Lores, E.; Batlle, D. Cuffless Blood Pressure Monitoring: Promises and Challenges. Clin. J. Am. Soc. Nephrol. 2020, 15, 1531–1538. [Google Scholar] [CrossRef]
  50. Gogiberidze, N.; Suvorov, A.; Sultygova, E.; Sagirova, Z.; Kuznetsova, N.; Gognieva, D.; Chomakhidze, P.; Frolov, V.; Bykova, A.; Mesitskaya, D.; et al. Practical Application of a New Cuffless Blood Pressure Measurement Method. Pathophysiology 2023, 30, 586–598. [Google Scholar] [CrossRef]
  51. Rajendran, A.; Minhas, A.S.; Kazzi, B.; Varma, B.; Choi, E.; Thakkar, A.; Michos, E.D. Sex-Specific Differences in Cardiovascular Risk Factors and Implications for Cardiovascular Disease Prevention in Women. Atherosclerosis 2023, 384, 117269. [Google Scholar] [CrossRef] [PubMed]
  52. Faulkner, J.L. Obesity-Associated Cardiovascular Risk in Women: Hypertension and Heart Failure. Clin. Sci. 2021, 135, 1523–1544. [Google Scholar] [CrossRef] [PubMed]
  53. Mehta, L.S.; Velarde, G.P.; Lewey, J.; Sharma, G.; Bond, R.M.; Navas-Acien, A.; Fretts, A.M.; Magwood, G.S.; Yang, E.; Blumenthal, R.S.; et al. Cardiovascular Disease Risk Factors in Women: The Impact of Race and Ethnicity: A Scientific Statement from the American Heart Association. Circulation 2023, 147, 1471–1487. [Google Scholar] [CrossRef]
  54. Kim, C. Management of Cardiovascular Risk in Perimenopausal Women with Diabetes. Diabetes Metab. J. 2021, 45, 492–501. [Google Scholar] [CrossRef]
  55. Brown, R.M.; Tamazi, S.; Weinberg, C.R.; Dwivedi, A.; Mieres, J.H. Racial Disparities in Cardiovascular Risk and Cardiovascular Care in Women. Curr. Cardiol. Rep. 2022, 24, 1197–1208. [Google Scholar] [CrossRef] [PubMed]
  56. Rodriguez de Morales, Y.A.; Abramson, B.L. Cardiovascular and Physiological Risk Factors in Women at Mid-Life and Beyond. Can. J. Physiol. Pharmacol. 2024, 102, 442–451. [Google Scholar] [CrossRef] [PubMed]
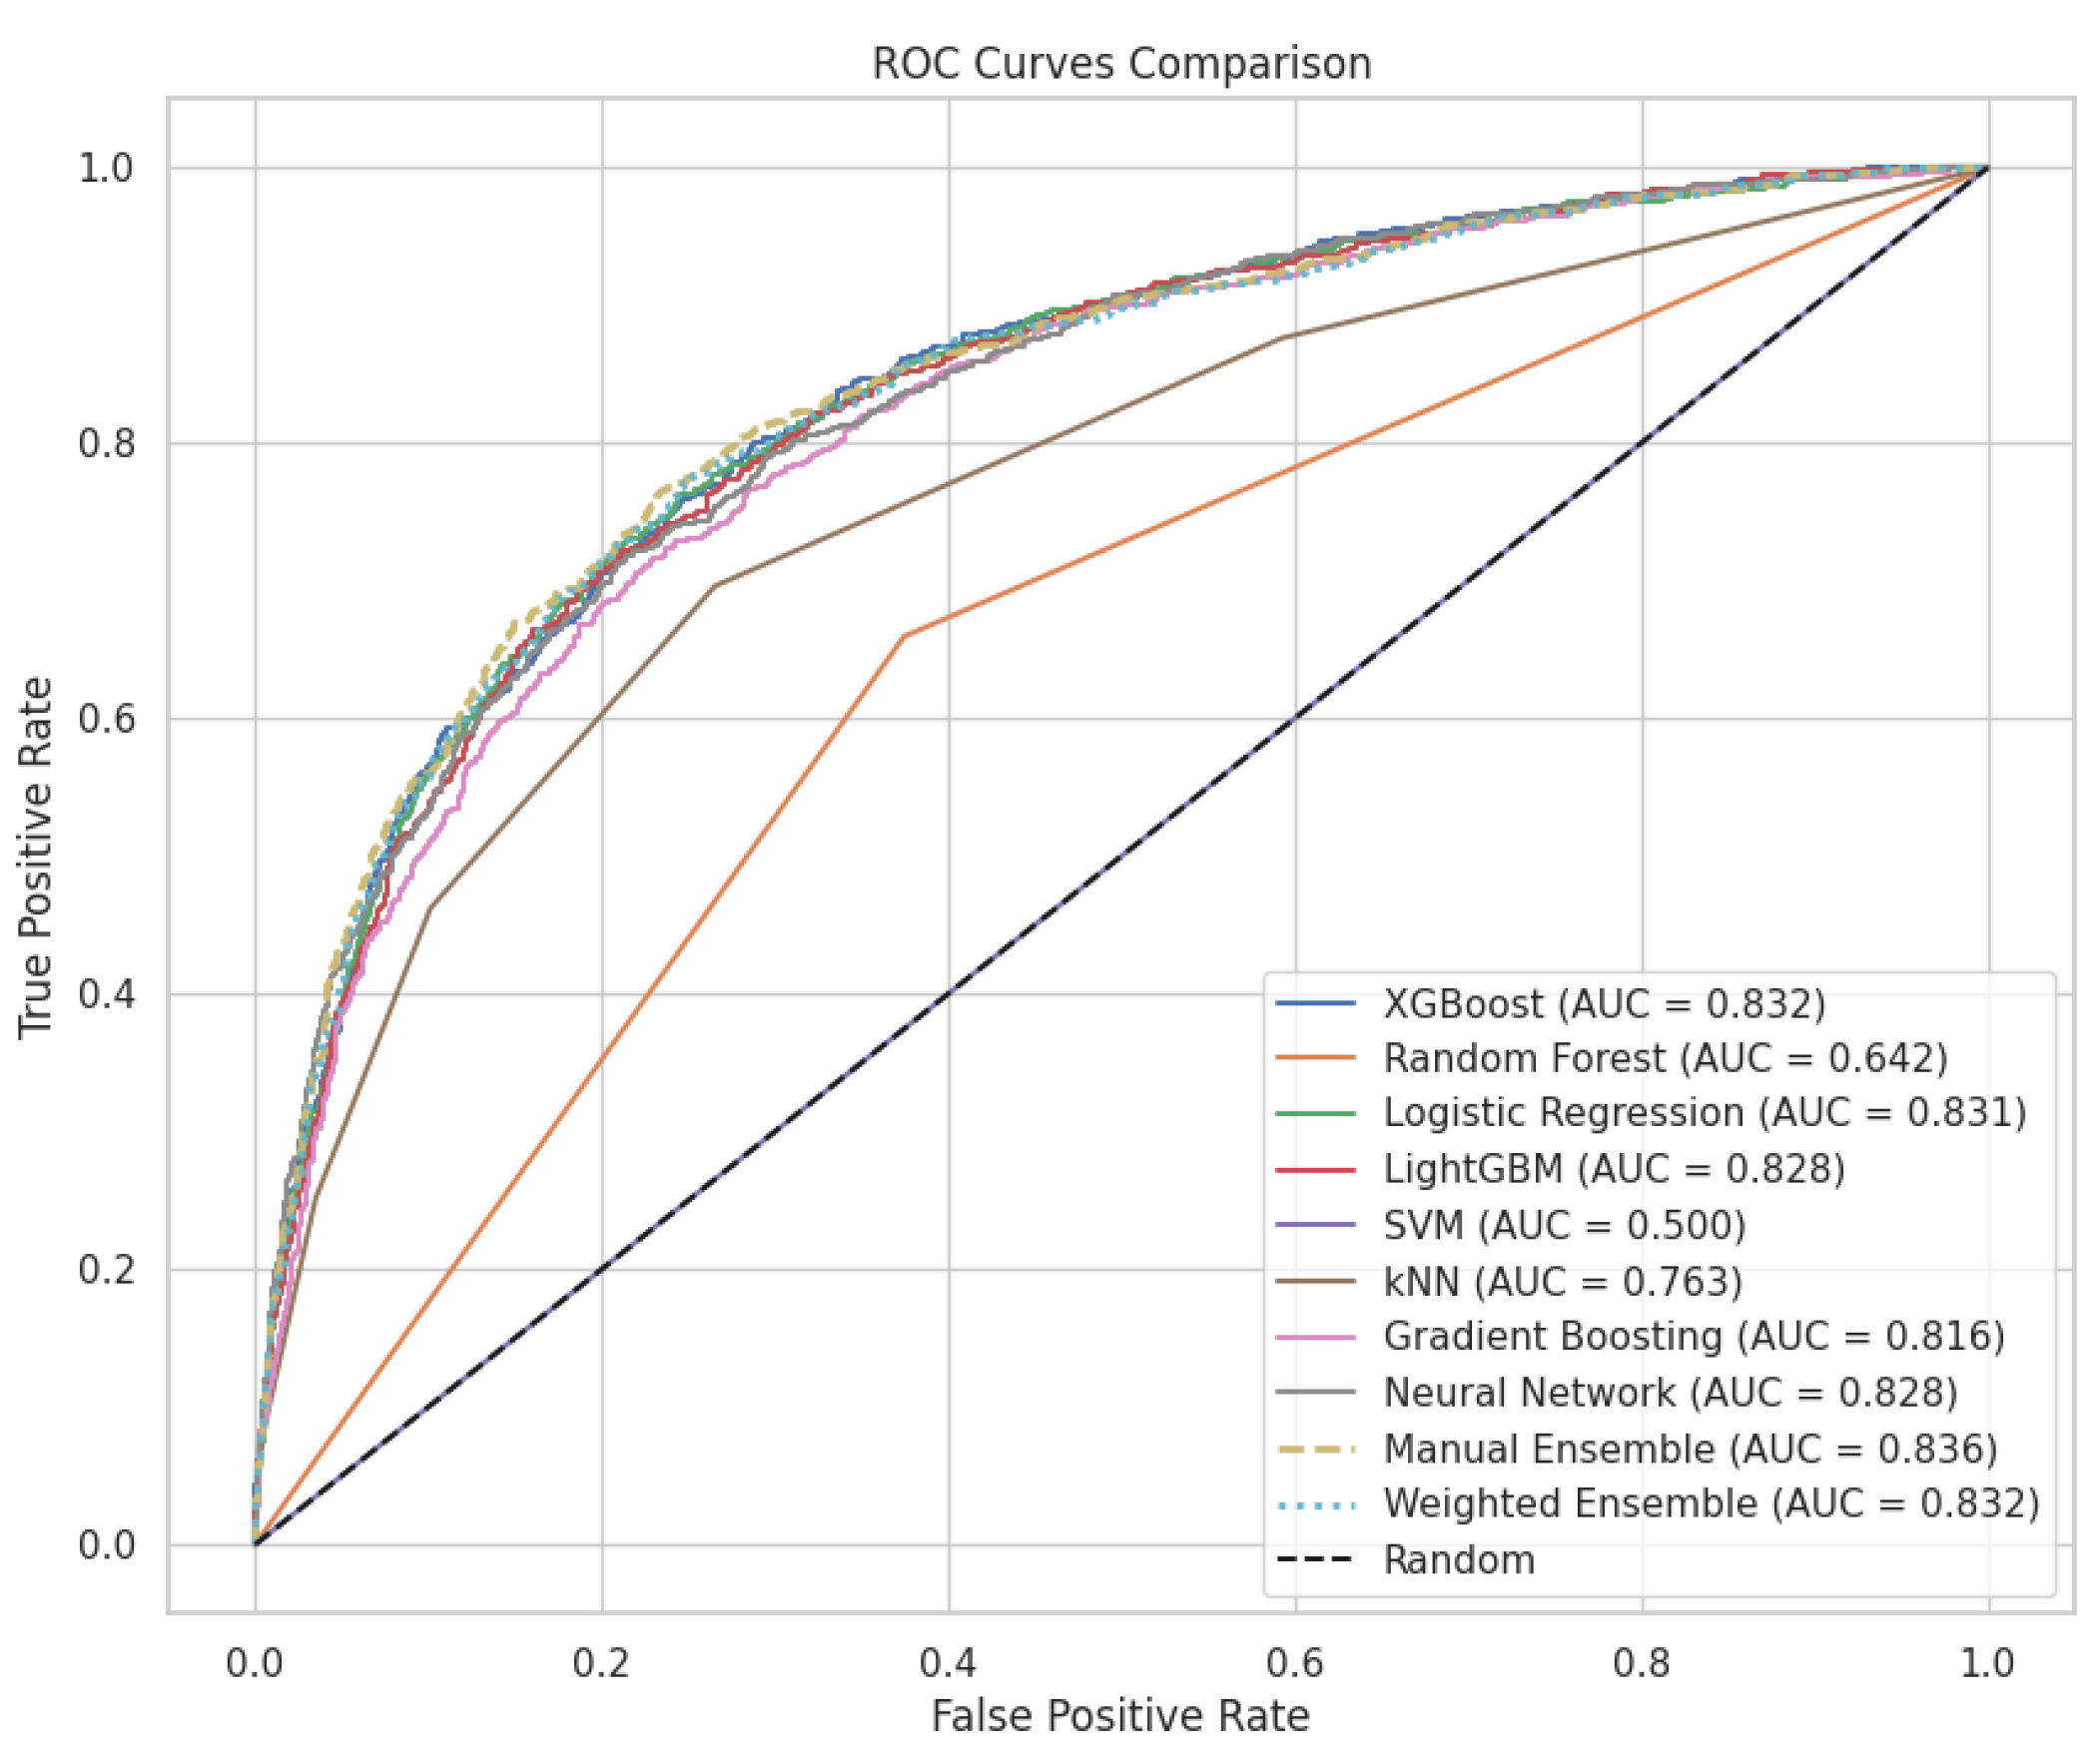
Figure 1. Receiver Operating Characteristics (ROC).
Applsci 15 08671 g001
Figure 2. Refined correlation plot.
Applsci 15 08671 g002
Figure 3. Plots of age, glucose, BMI, and heart rate for survived and non-survived.
Applsci 15 08671 g003
Figure 4. Predicting the risk of mortality for each factor.
Applsci 15 08671 g004
Figure 5. Precision, area under the recall curve, AUPRC.
Applsci 15 08671 g005
Table 1. Categories, descriptions, and notations for each variable in FHS.
CategoryVariable NameEnglish Description
Basic InformationRANDIDRandom ID for individual identification
SEXSex (1 = Male, 2 = Female)
AGEAge (years)
Health Status and Risk FactorsTOTCHOLTotal cholesterol (mg/dL)
SYSBPSystolic blood pressure (mmHg)
DIABPDiastolic blood pressure (mmHg)
CURSMOKECurrent smoking status (1 = Yes, 0 = No)
CIGPDAYCigarettes per day
BMIBody mass index (BMI, kg/m2)
DIABETESDiabetes (1 = Yes, 0 = No)
BPMEDSAntihypertensive medication (1 = Yes, 0 = No)
HEARTRTEHeart rate (bpm)
GLUCOSEGlucose level (mg/dL)
HDLCHigh-density lipoprotein cholesterol (mg/dL)
LDLCLow-density lipoprotein cholesterol (mg/dL)
Medical HistoryeducEducation level
PREVCHDPrevious coronary heart disease (1 = Yes, 0 = No)
PREVAPPrevious angina pectoris (1 = Yes, 0 = No)
PREVMIPrevious myocardial infarction (1 = Yes, 0 = No)
PREVSTRKPrevious stroke (1 = Yes, 0 = No)
PREVHYPPrevious hypertension (1 = Yes, 0 = No)
Event OccurrenceDEATHDeath (1 = Yes, 0 = No)
ANGINAAngina occurrence (1 = Yes, 0 = No)
HOSPMIHospitalization for myocardial infarction (1 = Yes, 0 = No)
MI_FCHDMyocardial infarction or coronary heart disease occurrence (1 = Yes, 0 = No)
ANYCHDAny coronary heart disease occurrence (1 = Yes, 0 = No)
STROKEStroke occurrence (1 = Yes, 0 = No)
CVDCardiovascular disease occurrence (1 = Yes, 0 = No)
HYPERTENHypertension occurrence (1 = Yes, 0 = No)
Follow-Up PeriodTIMEFollow-up period (months or years)
PERIODStudy period or phase
TIMEAPTime to angina occurrence
TIMEMITime to myocardial infarction occurrence
TIMEMIFCTime to myocardial infarction or coronary heart disease occurrence
TIMECHDTime to coronary heart disease occurrence
TIMESTRKTime to stroke occurrence
TIMECVDTime to cardiovascular disease occurrence
TIMEDTHTime to death
TIMEHYPTime to hypertension occurrence
Table 2. Missing rate of key variables (selected features).
ItemValue
Total missing cells20,075
Total number of cells453,453
Overall missing rate4.43%
VariableMissing Rate (%)Number of Missing Entries
GLUCOSE12.381440
BPMEDS5.10593
TOTCHOL3.52409
educ2.54295
CIGPDAY0.6879
BMI0.4552
HEARTRTE0.056
Although LDLC and HDLC each have a high missing rate of 73.97%, they were not selected as features in the model.
Table 3. Comparison of machine-learning model performance.
ModelAccuracyPrecisionRecallF1 ScoreSensitivitySpecificityAUC
Manual Ensemble0.7991060.7812500.4587160.5780350.4587160.9449630.835598
XGBoost0.8008260.7321710.5298170.6147700.5298170.9169530.832301
Weighted Ensemble0.7963540.7788840.4483940.5691410.4483940.9454550.832050
Logistic Regression0.7980740.7251180.5263760.6099670.5263760.9144960.830773
LightGBM0.7918820.7102360.5172020.5985400.5172020.9095820.827951
Neural Network0.7905060.6971510.5332570.6042880.5332570.9007370.827666
Gradient Boosting0.7829380.7081170.4701830.5651270.4701830.9169530.815959
kNN0.7678020.6617410.4621560.5442270.4621560.8987710.763361
Random Forest0.7000340.0000000.0000000.0000000.0000001.0000000.642478
SVM0.7000340.0000000.0000000.0000000.0000001.0000000.500000
Table 4. AUPRC (Area Under the Precision–Recall Curve) for each model.
ModelAUPRCImprovement Over Baseline (%)
Baseline (Random Classifier)0.3126
XGBoost0.7232131.37%
LightGBM0.7202130.44%
Logistic Regression0.7093126.95%
Neural Network0.7054125.69%
Gradient Boosting0.6950122.36%
SVM0.6563109.97%
kNN0.6433105.83%
Random Forest0.616697.28%
Table 5. Benchmark model (XGBoost) vs. all other models.
Model ComparisonAUC1 (95% CI)AUC2 (95% CI)Δ AUCZp-ValueAdj. PEffect Size
XGBoost vs. Random Forest0.834 (0.814–0.854)0.500 (0.480–0.520)0.334136.96<0.001 ***<0.001 ***0.758
XGBoost vs. kNN0.834 (0.814–0.854)0.766 (0.746–0.786)0.06838.45<0.001 ***<0.001 ***0.171
XGBoost vs. Neural Network0.834 (0.814–0.854)0.797 (0.777–0.817)0.03755.08<0.001 ***<0.001 ***0.097
XGBoost vs. SVM0.834 (0.814–0.854)0.815 (0.795–0.835)0.01913.36<0.001 ***0.018 *0.050
XGBoost vs. Logistic Regression0.834 (0.814–0.854)0.822 (0.802–0.842)0.01194.35<0.001 ***<0.001 ***0.032
XGBoost vs. LightGBM0.834 (0.814–0.854)0.831 (0.811–0.851)0.00321.770.0771.0000.009
XGBoost vs. Gradient Boosting0.834 (0.814–0.854)0.832 (0.812–0.852)0.00190.930.3521.0000.005
Asterisks (*) next to the results of statistical analysis indicate statistical significance. The number of asterisks corresponds to the p-value: *: p < 0.05, ***: p < 0.001.
Disclaimer/Publisher’s Note: The statements, opinions and data contained in all publications are solely those of the individual author(s) and contributor(s) and not of MDPI and/or the editor(s). MDPI and/or the editor(s) disclaim responsibility for any injury to people or property resulting from any ideas, methods, instructions or products referred to in the content.