Article

Self-Selected Comfortable Foot Position in Upright Standing: Correlation with Anthropometric Measurements and Comparison to Standardized Foot Position During Stabilometric Exam—An Observational Study

1
Department of Health Sciences, University of Basilicata, 85100 Potenza, Italy
2
Department of Advanced Biomedical Sciences, University of Naples Federico II, 80131 Naples, Italy
3
Department of Mental and Physical Health and Preventive Medicine, Section of Human Anatomy, University of Campania Luigi Vanvitelli, 80138 Naples, Italy
4
Movement Analysis Laboratory, IRCCS Istituto Ortopedico Rizzoli, 40136 Bologna, Italy
5
Department of Neurological and Rehabilitation Sciences, University Hospital San Giovanni di Dio and Ruggi d’Aragona, 84131 Salerno, Italy
6
Department of Electrical Engineering and Information Technology (DIETI), University of Naples Federico II, 80125 Naples, Italy
*
Author to whom correspondence should be addressed.
These authors contributed equally to this work.
Appl. Sci. 2025, 15(10), 5417; https://doi.org/10.3390/app15105417
Submission received: 12 March 2025 / Revised: 2 April 2025 / Accepted: 9 May 2025 / Published: 12 May 2025
(This article belongs to the Special Issue Smart Healthcare: Techniques, Applications and Prospects)

Abstract

:
Foot position affects postural stability during upright standing; however, conflicting indications have been reported for the ideal foot placement during stabilometric exams. The aims of this study were to evaluate (1) the correlation between anthropometric measurements (AMs) and between-feet measurements (BFMs) in self-selected comfortable foot position (SCFP) and (2) the effect of comfortable and standardized foot position (SFP) on plantar pressure and stabilometric parameters. Stabilometry was conducted on twenty healthy subjects in terms of SCFP and SFP. Correlation between AMs and BFMs in SCFP was investigated via Pearson’s analysis. Data variability was assessed using the coefficient of variation, and statistical differences between SCFP and SFP were evaluated via the Wilcoxon test. No correlation was found between AMs and BFMs. Subjects placed their feet nearly parallel in SCFP with a wider inter-heel distance. The variability of plantar pressure parameters was greater in SFP. A lower foot contact area on the right side and higher plantar pressures in the left midfoot region (p-value < 0.05) were found in SFP as compensatory foot adaptations. According to the present study, a comfortable foot position allows for the reduction in postural stability and plantar pressure parameter variability. This position may help improve statistical power when investigating statistical differences between conditions in stabilometry.

1. Introduction

Foot position is a key factor influencing postural stability, significantly impacting balance [1,2]. Postural stability is defined as the capacity of the Postural Control System to preserve balance and stabilize the orientation and position of body segments in space against gravity while providing continuous neuromuscular adaptations in response to sensory input from the internal body and the external environment [3,4].
The Postural Control System functions thanks to the integration of the complex network. This network facilitates the convergence of afferent information from peripheral receptors, including visual, stomatognathic, vestibular, and somatosensory inputs, onto the Central Nervous System (CNS) [5,6]. This dynamic neuromodulation between sensory inputs and motor outputs guarantees the maintenance of the center of pressure (CoP) within the foot support surface during both bipedal standing [7] and dynamic motor tasks, ensuring balance in even the most unstable conditions [8].
All information collected by the receptors located in muscles, tendons, and joints, called proprioceptors, provides feedback to the brain about the body’s position and movement [9]. Proprioception is known as the ability to perceive the position of joints and is a crucial factor for joint stability, balance, control, and coordination [10,11]. In particular, proprioceptive feedback from the feet provides essential information about body sway, especially in conditions of reduced or absent visual input [12,13]. In fact, previous studies [14,15,16] have reported a significant effect of foot position on stabilometric measurements during bipedal stance with closed eyes, whereas no significant variations were found with open eyes. Therefore, choosing the optimal foot placement can significantly aid in the interpretation of clinical and experimental balance control measurements [15]. In addition, a previous study [1] analyzed how the positioning of the feet and the anthropometry of the subject influence stabilometric parameters, while the correlation between anthropometric measurements and self-selected foot placement has yet to be investigated.
The impact of foot position on stabilometric parameters has commonly been investigated using pressure and force platforms [1,17,18,19]. During baropodometric exams, forced foot placement has often been used by several authors [17,18,19,20,21,22], controlling the inter-heel distance and the between-feet angle. Instead, in other studies, patients are allowed to self-select a comfortable foot position [1,15,23,24]. The variability of stabilometric parameters has been evaluated in the forced foot position compared to a comfortable one [15] or a closed parallel foot position (used in the Romberg test) [16]. The standardized foot position generally used in baropodometric exams takes 30 degrees as the between-feet angle and 3–5 cm as the inter-heel distance [19,22]. Since these authors reported conflicting points of view regarding the recommended foot position setup for baropodometric exams, there is a need to define the optimal foot placement to reduce variability in postural behavior [1,15,21].
As previously stated, visual receptors also play a crucial role in controlling upright posture, both statically and dynamically [5,7,25,26]. In addition, the effect of the visual target distance on postural adaptations, body oscillations, foot contact area, and load distribution has been extensively investigated [27,28]. In particular, according to a recent study by the same authors [5], a relatively near visual target, placed at approximately 0.7 m from the subject’s heels, seems to minimize variability of plantar pressure and stabilometric parameters compared to greater target distances, which can affect body weight distribution and center of pressure oscillations.
All the studies mentioned above reported that force and pressure plates are the gold standard instruments for assessing plantar pressure and postural control parameters.
In summary, different exam setups have been reported in the literature for the assessment of postural stability [15,17,19,22], revealing, in some instances, discrepancies and contradictions within the conclusions regarding the guidelines for the execution of the exam. Thus far, no agreement or recommendations have been reached on the optimal, more reliable foot position [29,30]. Moreover, to the best of our knowledge, no study has examined the effects of different foot placements on both plantar pressure and stabilometric parameters as well as their variability.
The aims of the present study are (I) to evaluate the correlation between subjects’ anthropometric measurements (AMs) and between-feet measurements (BFMs) in the self-selected comfortable foot position (SCFP) and (II) to assess the impact of comfortable and standardized foot positions on postural stability, plantar pressure parameters, and their variability when viewing a target placed at fixed distances from the heels.

2. Materials and Methods

2.1. Subject Population

A total of 20 young and healthy participants (12 male and 8 female; age = 20.8 ± 1.7 years; height: 172.0 ± 8.0 cm; weight = 67.1 ± 13.0 kg; BMI = 22.5 ± 3.2 kg/m2; dominant limb = right (20/20)) were recruited from the Functional Anatomy Laboratory of the University of Campania “L.Vanvitelli”, Naples. The dominant limb was identified by asking participants which leg they preferred to use to kick a ball with, following the method described in [31].
The inclusion criteria were as follows: age between 18 and 35 years, BMI less than 25 kg/m2; no pain; no surgeries within the past 6 months; no musculoskeletal injuries in the past 3 months; no history of dental surgery or implants; no use of prostheses or corrective orthoses; no neurological disorders or visual impairments; no skeletal deformities; and no cognitive impairments.
All individuals provided written informed consent prior to their involvement in the study.

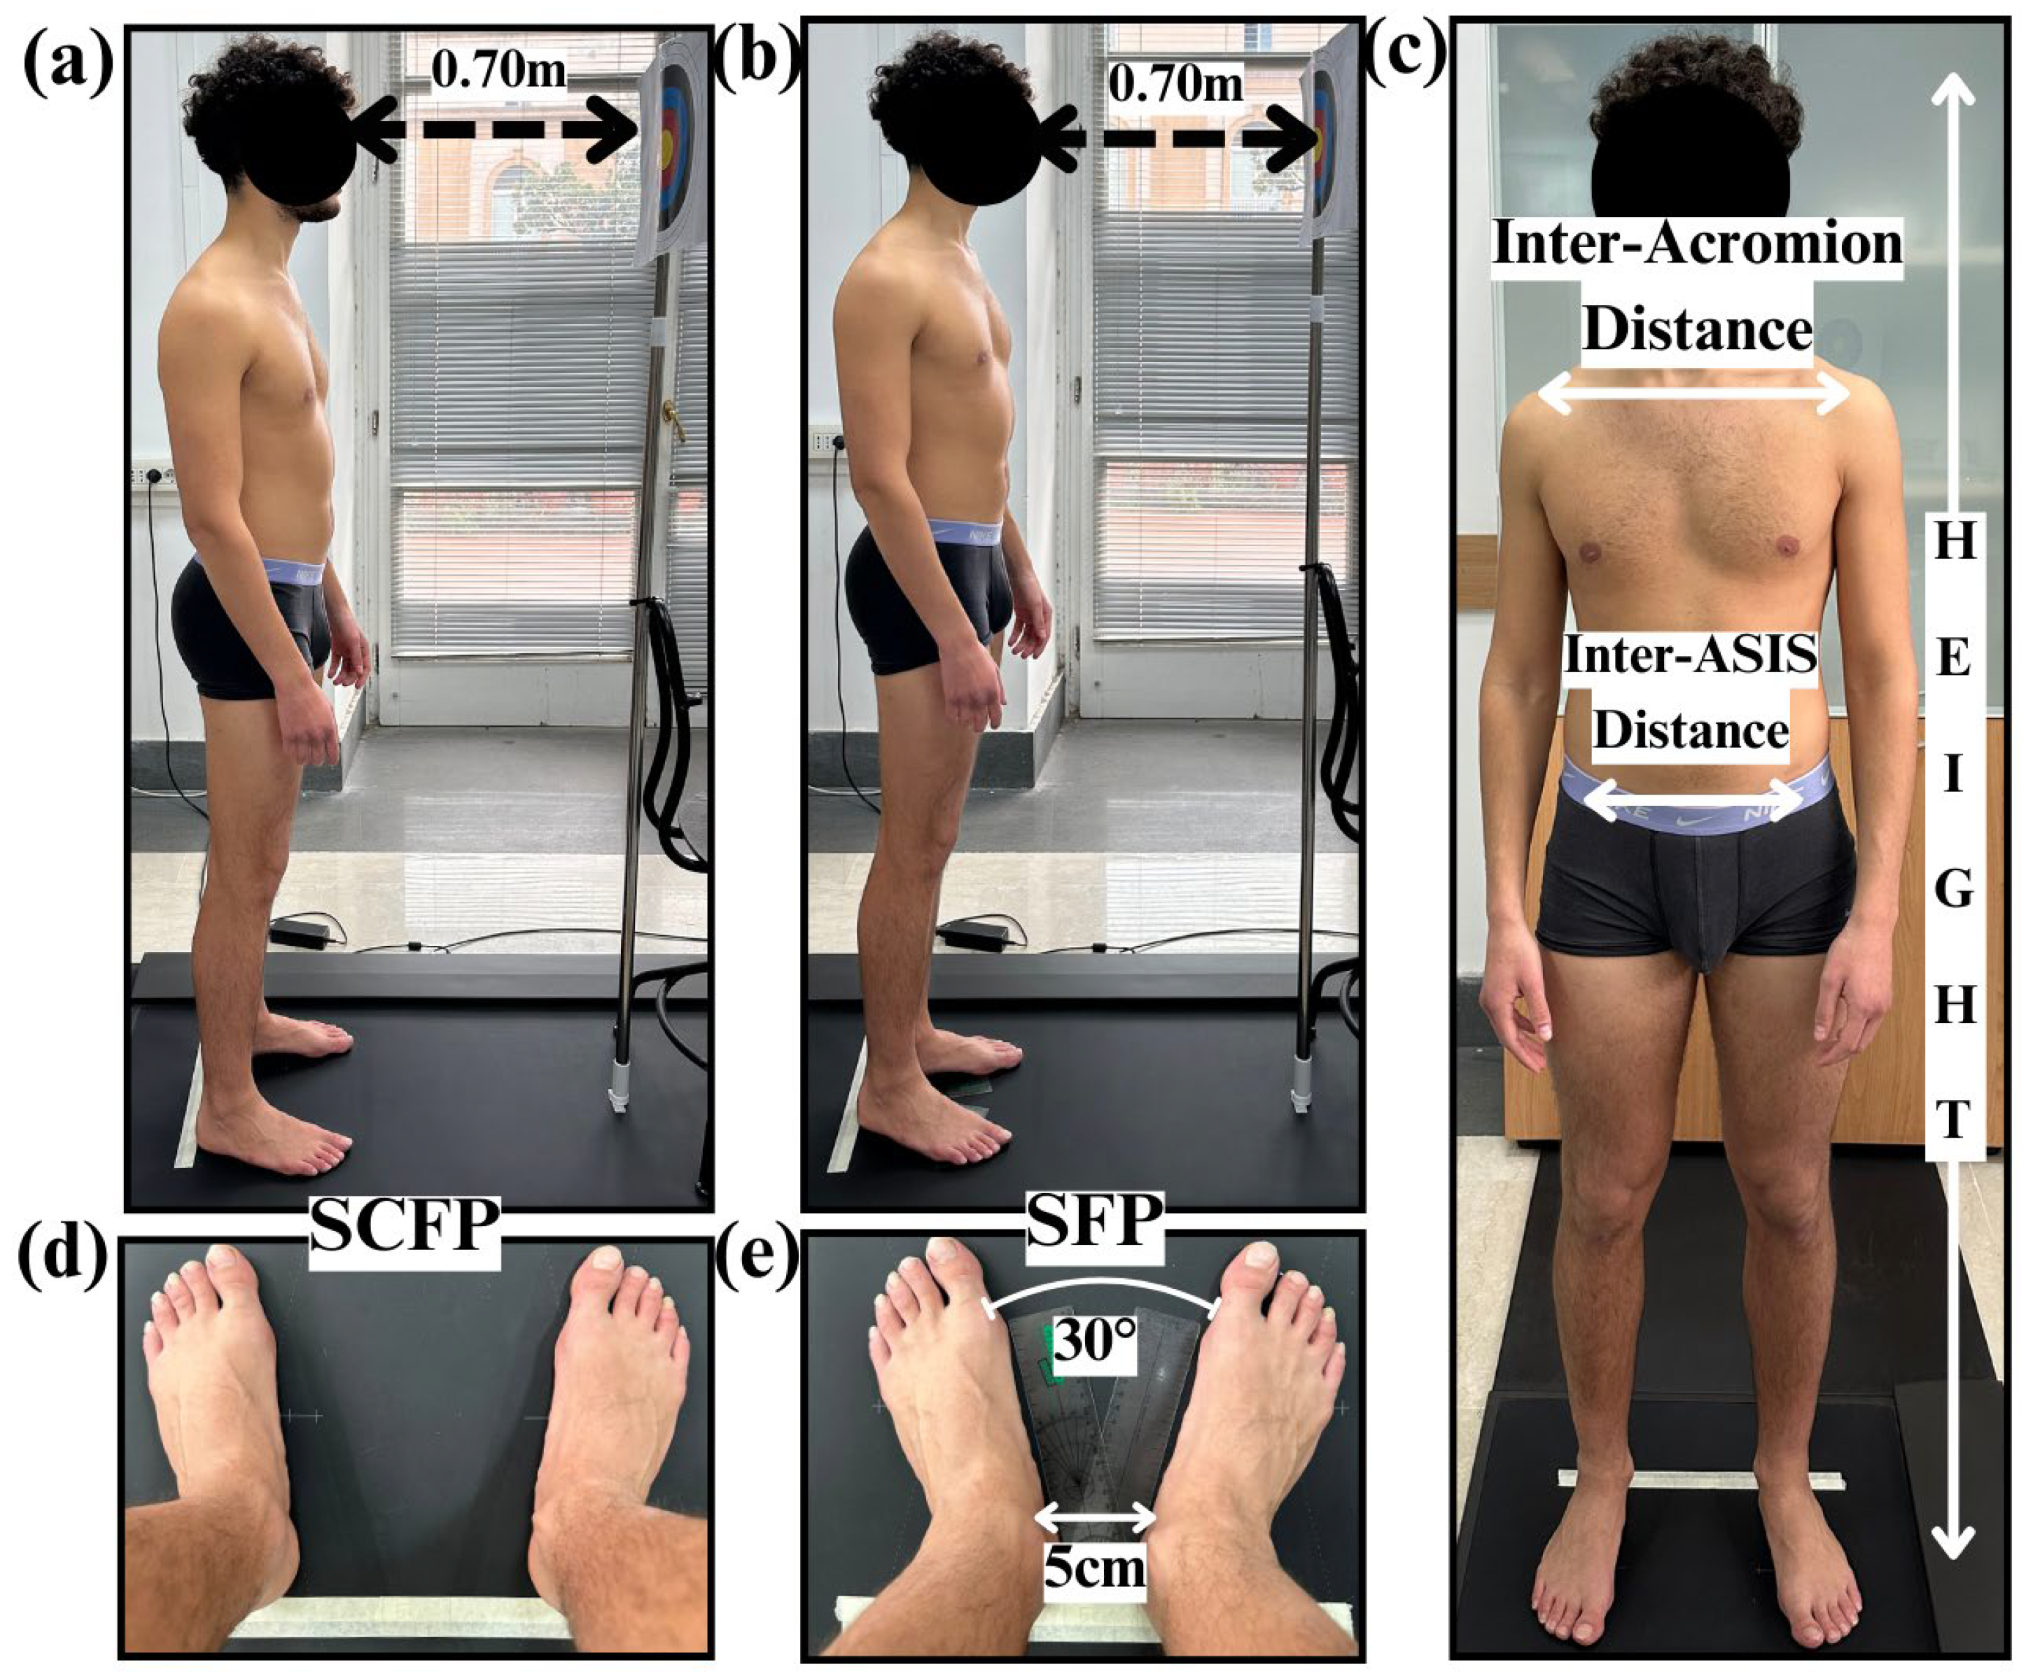
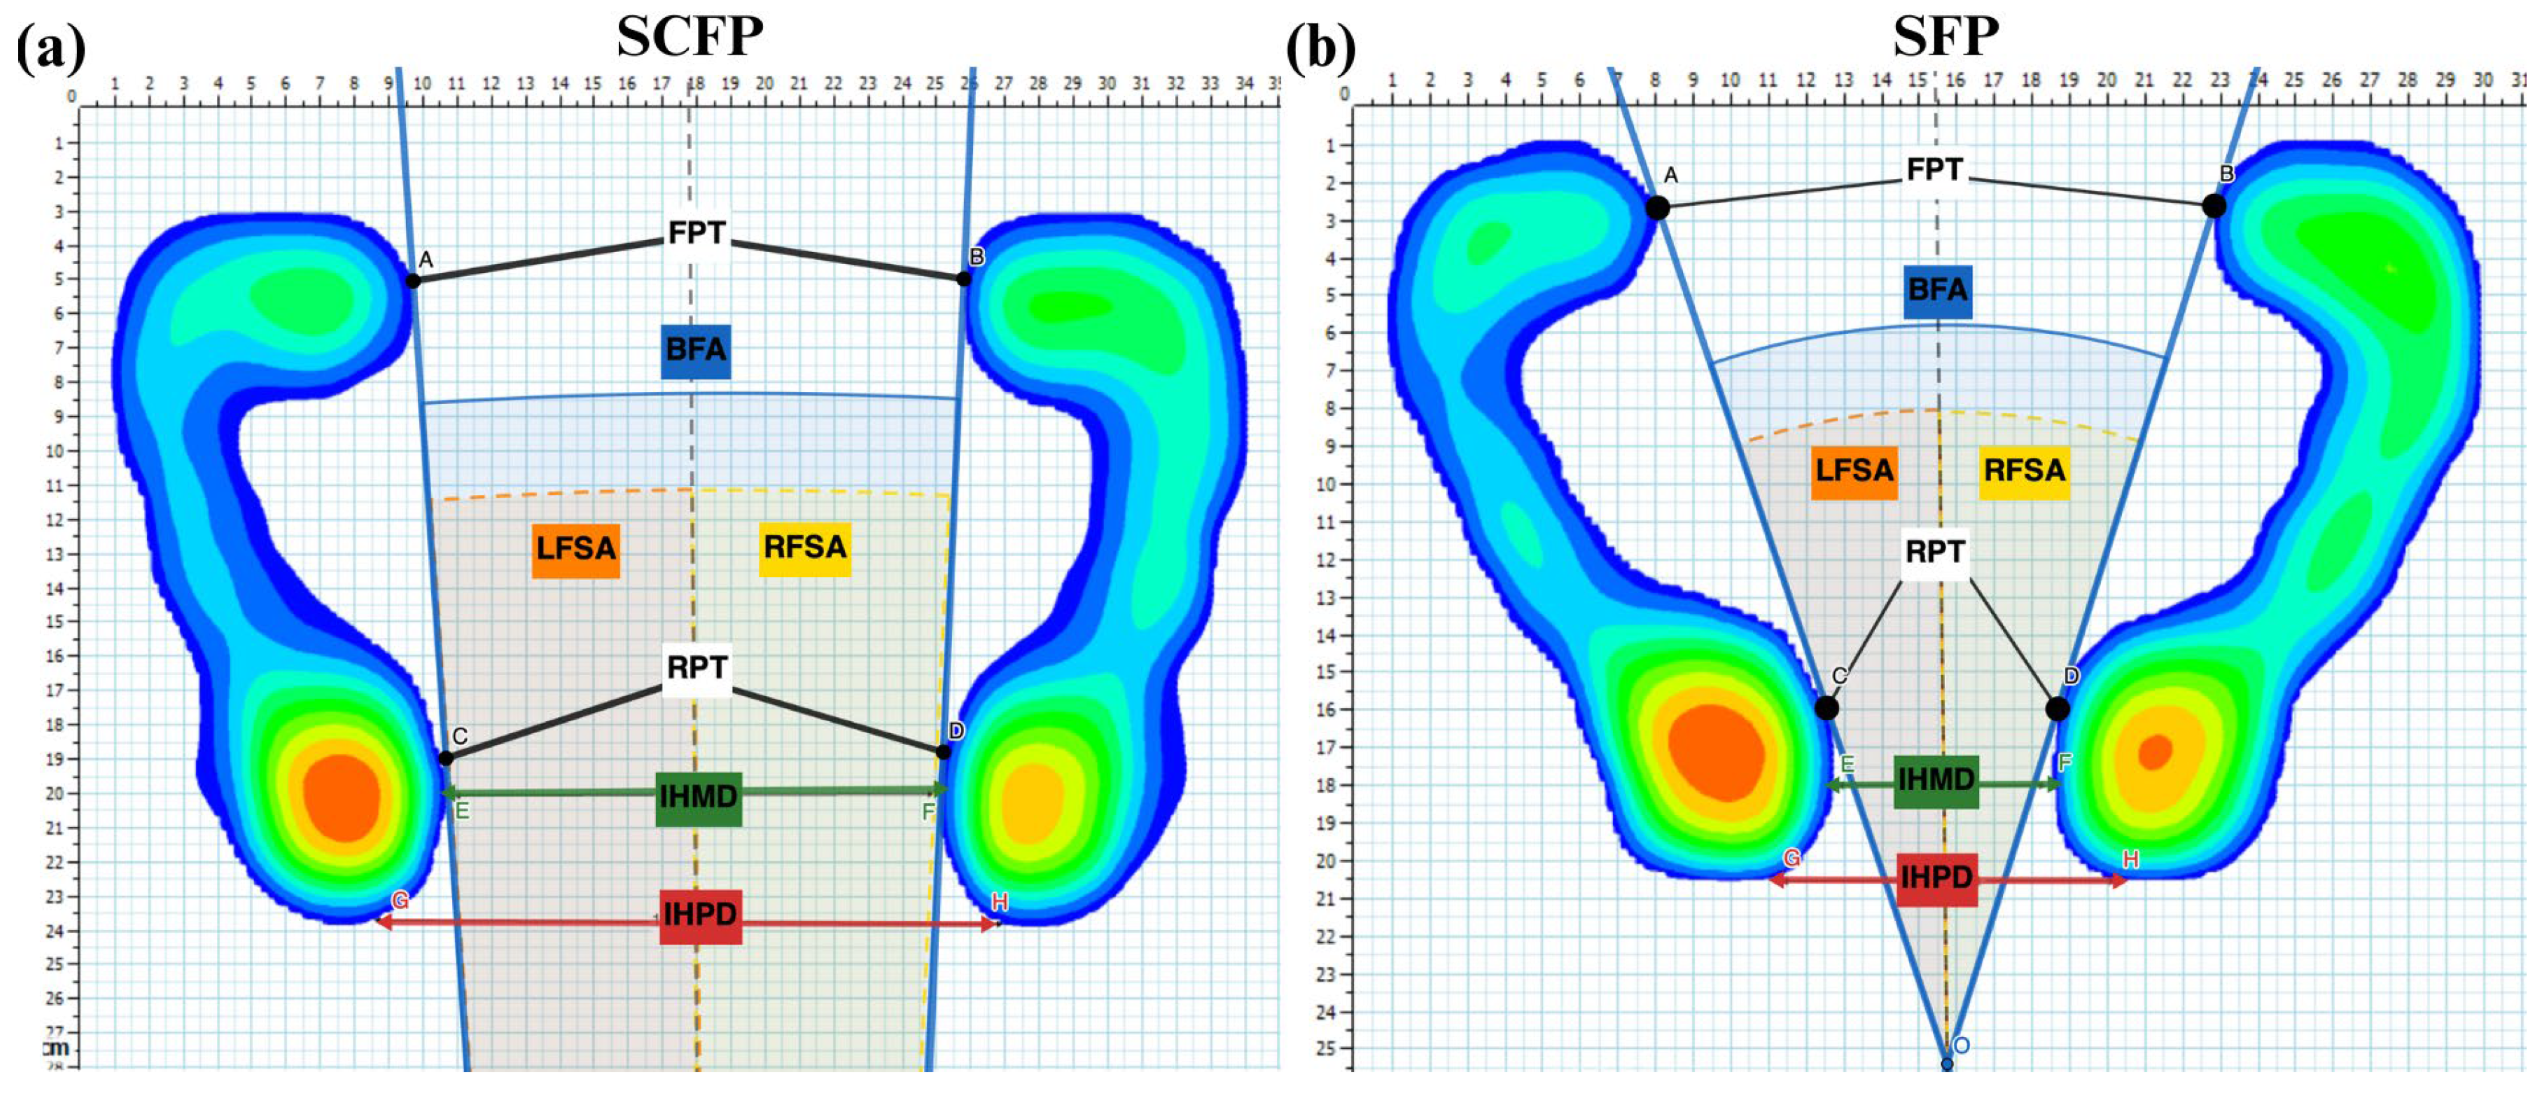
2.2. Experimental Protocol

An expert operator identified and marked anatomical landmarks in each participant to quantify the following AMs: the inter-Acromion and inter-Anterior Superior Iliac Spine (ASIS) distances (Figure 1c). Height was also recorded. Participants were then instructed to stand upright in a bipedal position, with their arms relaxed at their sides and their head in a neutral position, on a 200 × 50 cm pressure plate equipped with 10,000 sensors/m2 (P-Walk FM12050, BTS-Bioengineering, Milan, Italy); data were sampled at 50 Hz according to [29]. Six 30 s open-eye stabilometric examinations (three trials by two sessions) were performed for each subject. The first session was conducted with participants adopting an SCFP (Figure 1a,d) by instructing them to find a comfortable posture in accordance with [1,20]. The second session was conducted in a standardized foot position (SFP) (Figure 1b,e) according to international standardization criteria, which specified keeping the feet at a 30-degree angle and heels 5 cm apart [19].
In each session, participants were tested with a visual target placed 0.7 m from the heels. This distance was chosen since it is close to 0.4 m, which is the minimum distance required to avoid visual blur, and because it reduces the variability of postural stability parameters as reported in our previous study [5]. The visual target was an “arrow target” consisting of concentric colored circles with the largest diameter of approximately 30 cm in a white 29 × 43 cm rectangle. The target’s center was positioned at eye level for each participant, creating a 0-degree visual angle with the horizontal axis (Figure 1a,b).
Between each acquisition, participants maintained their foot position by sitting on a chair. To ensure optimal testing conditions, the exams were conducted in a quiet, well-lit room with a flat floor and white walls.

2.3. Data Acquisition and Statistical Analysis

Before each measurement, the pressure plates were calibrated according to the manufacturer’s instructions. A graphical representation of the plantar pressure images of both feet in the SCFP condition was exported in “PNG” format for each participant and then imported into the open-access GeoGebra tool [32]. This tool was used to calculate the following between-feet measurements (BFMs): Inter-Heels Medial (IHMD) and Posterior Distances (IHPD) [cm]; Right Foot Standing Angle (RFSA) [Deg]; Left Foot Standing Angle (LFSA) [Deg], and Between-Feet Angle (BFA) [Deg]. Regarding the calculation of IHMD and IHPD, reference was made to the millimeter scale shown in the image imported into the online tool. These parameters were calculated according to specific points identified on the foot outline (Figure 2). In particular, IHMD and IHPD were calculated as the distances between the most medial points of the left and right rearfoot and between the most posterior points of the left and right heel, respectively. In addition, points of tangency for the forefoot and rearfoot region were identified (Figure 2). The BFA was calculated as the angle between the two tangent lines on the medial region of the foot pressure images. RFSA and LFSA were calculated as the angles between each of the two tangent lines and the longitudinal axis between the feet (dashed gray line in Figure 2).
The following clinically relevant stabilometric and plantar pressure parameters, defined in our previous study [7], were exported from P-Walk software (G Studio 3.5.26.8): center-of-pressure sway area (CoPsa) [mm2], the ellipse containing the trajectory of the CoP recorded during the exam; Length Surface Function (LSF) [mm−1], defined as the ratio between distance covered by the CoP during the exam and CoPsa; center-of-pressure speed (CoP-speed) [mm/s]; total foot (Tf), rearfoot (Rf), midfoot (Mf), and forefoot (Ff) loads [%] (load parameters were normalized to body weight); mean and peak pressures (Pmean and Pmax) [KPa] at Rf, Mf, and Ff (mean pressure parameters were calculated as the ratio between weight and area for each region); foot contact area (FCA) [cm2], and arch index (AI) [%] that is calculated as the ratio between midfoot contact area and total foot contact area (without the toes). All plantar pressure parameters were calculated for both the left (l) and right (r) sides.
In addition, the coefficient of variation (CV) was calculated for all plantar pressure and stabilometric parameters across three trials for each condition of foot placement (SCFP and SFP) in order to assess their intra-subject variability.
The Shapiro–Wilk test was used to assess the normality of all AMs, BFMs, CVs, plantar pressure, and stabilometric parameters. According to the type of distribution (parametric or non-parametric), mean with standard deviation (SD) and range (minimum, maximum) or median with 25th–75th percentiles were used to report these values.
Firstly, a correlation analysis between AMs (height, inter-acromion and inter-ASIS distances) and BFMs (BFA, IHMD, and IHPD) was performed using Pearson’s coefficient with a 95% confidence interval. Afterward, the following statistical comparisons were implemented: the Wilcoxon signed rank test was used to compare RFSA and LFSA, the one-sample t-test to test the significant differences for between-feet measurements (BFA, IHMD, and IHPD) in two different foot positions (SCFP and SFP), and, finally, the Wilcoxon signed rank test to assess the effect of foot positions (SCFP and SFP) on CVs and on all plantar pressure and stabilometric parameters.
The statistical level of significance, α, was set at 0.05, and statistical analyses were performed using MATLAB (MathWorks R2018a) and R (4.3.2) [33].

3. Results

3.1. Correlation Between Anthropometric and Between-Feet Measurements in SCFP

Table 1 reports the Pearson correlation coefficients of each anthropometric measurement (height, inter-Acromion and inter-ASIS distances) and between-feet measurements (BFA, IHMD, and IHPD). The results showed no significant correlation.

3.2. Inter-Subject Comparison Between SCFP and SFP for Between-Feet Measurements (BFMs)

The Wilcoxon signed-rank test revealed no significant differences between the right foot standing angle (RFSA) and the left foot standing angle (LFSA).
The one-sample t-test revealed a significant effect of feet placement on between-feet parameters, as shown in Table 2. In particular, results showed that the between-feet angle (BFA) was significantly smaller, while the IHMD and IHPD were significantly larger in the SCFP compared to the SFP.

3.3. Intra-Subject (Inter-Trial) Variability of Stabilometric and Plantar Pressure Parameters in SCFP and SFP

Figure 3 shows the boxplots (median, 25th–75th percentiles) of the intra-subject coefficient of variation (CV) and their inter-subject distribution for each parameter. CVs are arranged in ascending order based on their median value.
The largest variability was found for CoPsa and LSF in both SCFP and SFP; in particular, these values showed a variability with 30% < median CV < 50% in the SCFP condition, while in SFP, with median CV > 50% (Figure 3). In both SCFP and SFP, a slightly higher variability (10% < median CV < 20%) was found for CP speed. Instead, the lowest variability (median CV < 10%) was observed for all plantar pressure parameters, and the only exception (slightly high variability with 10% < median CV < 20%) was found in SFP for Load, Pmean, and Pmax in Mf.

3.4. The Effect of the Foot Positions (SCFP and SFP) on CVs

Table 3 shows the distribution of CVs across all parameters and the effect of each foot placement condition. No significant differences in CVs of stabilometric parameters were found between the two foot positions, only a trend of their increase in SFP (Table 3). CVs of all plantar pressure parameters were significantly larger in SFP with respect to SCFP; the only exception was for the CV of right Pmean at Ff and Pmax at Tf and Rf bilaterally, showing no significant differences.

3.5. The Effect of Different Foot Positions (SCFP and SFP) on Stabilometric and Plantar Pressure Parameters

Table 4 shows the median values (25th and 75th percentiles) of stabilometric and plantar pressure parameters in two foot positions and their significant differences.
A statistically significant higher CP speed was observed in SCFP with respect to SFP. Regarding the plantar pressure parameters, SCFP showed significantly lower left Pmean at Tf, left Pmean and Pmax at Mf, and significantly higher right FCA and left Load at Ff compared to SFP.

4. Discussion

Maintaining balance in both static and dynamic conditions involves a complex interplay between biomechanical, neurological, and environmental factors. Despite previous studies reporting different setups of foot placement for the assessment of postural stability, no agreement or recommendations have been reached on the optimal and most reliable foot position yet [29,30], particularly, in terms of executing the exam with the recommended visual target distance [5]. This study aimed to assess the effect of self-selected comfortable (SCFP) and standardized foot position (SFP) on changes in stabilometric and plantar pressure parameters and on their variability during viewing a target, placed at 0.7 m from the subjects’ heels.
In terms of foot position, subjects showed no significant differences between the right foot standing angle (RFSA) and left foot standing angle (LFSA). There was a significant lower between-feet angle (BFA) and greater Inter-Heels Distances (IHMD and IHPD) in SCFP compared to SFP. Our findings seem to suggest that healthy subjects, when allowed to self-select a comfortable foot position, tend to place their feet nearly parallel and symmetrically aligned with respect to the midline and with a wider inter-heels distance, increasing the contact area between the feet (feet support surface) (Figure 1). This is in spite of a previous study [15] reporting a significant inter-subject variability in the positioning of the feet when subjects’ behavior is not constrained. In addition, Pearson’s analysis revealed that these between-feet measurements (BFMs) had no significant correlations with the anthropometric measurements (height; inter-ASIS and inter-Acromion distances) in SCFP, highlighting that the subjects’ choice of comfortable feet placement seems to be independent from their main anthropometric features. This evidence may indicate that the standardized foot position could be perceived as uncomfortable and restrictive by healthy subjects and unsuitable for stabilometric evaluation.
The analysis of variability further supports this hypothesis. In fact, the variability of center-of-pressure sway area (CoPsa) and length surface function (LSF) demonstrated an increasing trend in SFP compared to SCFP (Figure 3 and Table 3) despite the highest variability of stabilometric parameters in both SCFP and SFP (Figure 3). Instead, the same analysis of plantar pressure parameters confirmed their lowest variability, with coefficients of variation (CVs) below 10% in both foot positions, as previously demonstrated by [5,7,27,34]. In particular, significant lower CVs were observed in SCFP compared to SFP. All these findings confirm the greater reliability of plantar pressure parameters compared to stabilometric measures and demonstrate an increased response stability during comfortable foot positioning, corroborating prior research [5,7,27]. These results are in disagreement with observations by the authors of [15], where methodological limitations, including imprecise task instructions and inconsistent foot position across trials, likely contributed to reduced data reliability. Our results also disagree with another study [16] that reported lower variability in stabilometric parameters during the standardized foot position, compared to the closed parallel foot position (used in the Romberg test).
These findings seem to suggest that a comfortable foot placement and a nearby target distance [5,7,27] create optimal conditions for a more reliable evaluation of stabilometric and plantar pressure parameters.
Regarding the effect of foot placement on changes in plantar pressure and stabilometric parameters (Table 4), a significantly lower load was observed in the non-dominant forefoot with a lower total contact area in the dominant foot when the feet were forced in the standardized position. This finding may reveal the activation of a compensatory mechanism to maintain balance in the more unstable SFP condition. Additionally, increased mean and maximum pressures in the midfoot of the non-dominant side during SFP highlight and confirm the role of the midfoot in postural adaptation, probably due to its great sensitivity to tactile and vibration stimuli, as previously reported [5,26,35]. All these results regarding plantar pressure parameters underline easier postural control in a comfortable foot position while highlighting the need for the subject to regain stability by making adjustments in load distribution when foot placement is constrained.
On the contrary, regarding the stabilometric parameters, a significantly greater CoP speed was observed in SCFP compared to SFP (Table 4); however, this result should be read carefully considering the slightly high variability in both SCFP and SFP conditions (Figure 3).
Overall, these findings are supported by the results of our previous studies [5,7,27], which underscore the importance of considering both foot position and visual target distance during baropodometric exams to assess stabilometric and plantar pressure parameters. The imposition of a standardized foot position and a distant visual target can negatively impact balance and increase variability, particularly in plantar pressure parameters. All these findings have implications for future research and clinical practice. First, they suggest that the subjects’ self-selected comfortable foot placement does not seem to be related to their main anthropometric measurements and, second, a self-selected comfortable foot position with a nearby visual target (close to 0.7 cm) may provide more reliable and valid assessments, particularly for plantar pressures and body weight distributions.
This study is limited by its small sample size, a consequence of stringent inclusion criteria, particularly regarding visual and stomatognathic impairments, and right-side dominance, potentially restricting generalizability to left-dominant populations. Additionally, the absence of randomized trial order, while mitigated by adequate rest periods between trials, represents a further limitation.
Future research should explore the influence on postural control and plantar adaptations of other sensory inputs in depth, such as stomatognathic, vestibular, and somatosensory inputs. Moreover, other gold standard methods, such as 3D stereophotogrammetry and surface EMG, could be used to provide further biomechanical and neuromuscular insights on postural adaptations in different foot placement conditions.

5. Conclusions

This study revealed how healthy subjects tend to adopt a comfortable foot position during upright standing, characterized by feet placed nearly parallel to increase the feet’s support surface, which was not affected by anthropometric measurements such as height, inter-ASIS, and inter-Acromion distances. Instead, when a standardized foot position was imposed, an increase in variability in plantar pressure and stabilometric parameters was observed. Additionally, a decrease in the foot contact area of the dominant foot and compensatory increases in plantar pressures on the non-dominant side, mostly in the midfoot region, were observed.
These findings highlight the importance of allowing healthy subjects to choose a comfortable foot position, associated with a nearby visual target, to improve the reliability of baropodometric and stabilometric data used for clinical assessment and parameters, thereby improving statistical power when investigating differences between conditions in stabilometry.

Author Contributions

Conceptualization; P.D.B.; Data curation; P.D.B.; C.I.D.G.; A.F. and P.C.; Formal analysis; P.D.B.; C.I.D.G.; A.F. and P.C.; Investigation; P.D.B.; C.I.D.G.; A.F. and A.T.; Methodology; P.D.B.; C.I.D.G. and A.F.; Project administration; P.D.B.; P.A.; A.L. and A.D.L.; Supervision; P.D.B.; A.L. and A.D.L.; Writing—original draft; P.D.B.; C.I.D.G. and A.F.; Writing—review and editing; P.D.B.; C.I.D.G.; A.F.; P.C.; A.T.; P.A.; A.L. and A.D.L. All authors have read and agreed to the published version of the manuscript.

Funding

This research received no external funding.

Institutional Review Board Statement

Ethical review and approval were waived for this study by the Ethical Committee of the University of Campania “Luigi Vanvitelli” due to its classification as no-risk research for participants.

Informed Consent Statement

Informed consent was obtained from all subjects involved in the study.

Data Availability Statement

The data that support the findings of this study are available from the corresponding author upon reasonable request.

Acknowledgments

The authors thank Formisano Francesco and Formisano Luigi for their technical support.

Conflicts of Interest

The authors declare no conflicts of interest.

References

  1. Chiari, L.; Rocchi, L.; Cappello, A. Stabilometric parameters are affected by anthropometry and foot placement. Clin. Biomech. 2002, 17, 666–677. [Google Scholar] [CrossRef] [PubMed]
  2. Ivanenko, Y.; Gurfinkel, V.S. Human Postural Control. Front. Neurosci. 2018, 12, 171. [Google Scholar] [CrossRef] [PubMed]
  3. Horak, F.B. Postural orientation and equilibrium: What do we need to know about neural control of balance to prevent falls? Age Ageing 2006, 35 (Suppl. 2), ii7–ii11. [Google Scholar] [CrossRef] [PubMed]
  4. Massion, J. Postural control system. Curr. Opin. Neurobiol. 1994, 4, 877–887. [Google Scholar] [CrossRef]
  5. De Blasiis, P.; Fullin, A.; De Girolamo, C.I.; Amata, O.; Caravaggi, P.; Caravelli, S.; Mosca, M.; Lucariello, A. Posture and vision: How different distances of viewing target affect postural stability and plantar pressure parameters in healthy population. Heliyon 2024, 10, e39257. [Google Scholar] [CrossRef]
  6. Takakusaki, K. Functional Neuroanatomy for Posture and Gait Control. J. Mov. Disord. 2017, 10, 1–17. [Google Scholar] [CrossRef]
  7. De Blasiis, P.; Caravaggi, P.; Fullin, A.; Leardini, A.; Lucariello, A.; Perna, A.; Guerra, G.; De Luca, A. Postural stability and plantar pressure parameters in healthy subjects: Variability, correlation analysis and differences under open and closed eye conditions. Front. Bioeng. Biotechnol. 2023, 11, 1198120. [Google Scholar] [CrossRef]
  8. Moffa, S.; Perna, A.; Candela, G.; Cattolico, A.; Sellitto, C.; De Blasiis, P.; Guerra, G.; Tafuri, D.; Lucariello, A. Effects of Hoverboard on Balance in Young Soccer Athletes. J. Funct. Morphol. Kinesiol. 2020, 5, 60. [Google Scholar] [CrossRef]
  9. Tuthill, J.C.; Azim, E. Proprioception. Curr. Biol. 2018, 28, R194–R203. [Google Scholar] [CrossRef]
  10. Hillier, S.; Immink, M.; Thewlis, D. Assessing Proprioception: A Systematic Review of Possibilities. Neurorehabil. Neural Repair 2015, 29, 933–949. [Google Scholar] [CrossRef]
  11. Caravelli, S.; Bragonzoni, L.; Vocale, E.; Barone, G.; Vara, G.; Di Paolo, S.; Zinno, R.; Pinelli, E.; De Girolamo, C.I.; De Blasiis, P.; et al. Proprioception and Balance Control in Ankle Osteoarthritis and after Total Ankle Replacement: A Prospective Assessment. Appl. Sci. 2024, 14, 4781. [Google Scholar] [CrossRef]
  12. Goble, D.J.; Coxon, J.P.; Van Impe, A.; Geurts, M.; Van Hecke, W.; Sunaert, S.; Wenderoth, N.; Swinnen, S.P. The neural basis of central proprioceptive processing in older versus younger adults: An important sensory role for right putamen. Hum. Brain Mapp. 2012, 33, 895–908. [Google Scholar] [CrossRef] [PubMed]
  13. De Blasiis, P.; Fullin, A.; Caravaggi, P.; Lus, G.; Melone, M.A.; Sampaolo, S.; DE Luca, A.; Lucariello, A. Long-term effects of asymmetrical posture in boxing assessed by baropodometry. J. Sports Med. Phys. Fit. 2022, 62, 350–355. [Google Scholar] [CrossRef]
  14. Mehdikhani, M.; Khalaj, N.; Chung, T.Y.; Mazlan, M. The effect of feet position on standing balance in patients with diabetes. Proc. Inst. Mech. Eng. H 2014, 228, 819–823. [Google Scholar] [CrossRef]
  15. McIlroy, W.E.; Maki, B.E. Preferred placement of the feet during quiet stance: Development of a standardized foot placement for balance testing. Clin. Biomech. 1997, 12, 66–70. [Google Scholar] [CrossRef]
  16. Yamamoto, M.; Ishikawa, K.; Aoki, M.; Mizuta, K.; Ito, Y.; Asai, M.; Shojaku, H.; Yamanaka, T.; Fujimoto, C.; Murofushi, T.; et al. Japanese standard for clinical stabilometry assessment: Current status and future directions. Auris Nasus Larynx 2018, 45, 201–206. [Google Scholar] [CrossRef] [PubMed]
  17. Kirby, R.L.; Price, N.A.; MacLeod, D.A. The influence of foot position on standing balance. J. Biomech. 1987, 20, 423–427. [Google Scholar] [CrossRef]
  18. Mouzat, A.; Dabonneville, M.; Bertrand, P. The effect of feet position on orthostatic posture in a female sample group. Neurosci. Lett. 2004, 365, 79–82. [Google Scholar] [CrossRef]
  19. Scoppa, F. Clinical Stabilometry Standardization: Feet Position in the Static Stabilometric Assessment of Postural Stability. Acta Med. Mediterr. 2017, 33, 707–713. [Google Scholar] [CrossRef]
  20. Tarantola, J.; Nardone, A.; Tacchini, E.; Schieppati, M. Human stance stability improves with the repetition of the task: Effect of foot position and visual condition. Neurosci. Lett. 1997, 228, 75–78. [Google Scholar] [CrossRef]
  21. Hue, O.; Simoneau, M.; Marcotte, J.; Berrigan, F.; Doré, J.; Marceau, P.; Marceau, S.; Tremblay, A.; Teasdale, N. Body weight is a strong predictor of postural stability. Gait Posture 2007, 26, 32–38. [Google Scholar] [CrossRef] [PubMed]
  22. Rodríguez-Rubio, P.R.; Bagur-Calafat, C.; López-de-Celis, C.; Bueno-Gracía, E.; Cabanas-Valdés, R.; Herrera-Pedroviejo, E.; Girabent-Farrés, M. Validity and Reliability of the Satel 40 Hz Stabilometric Force Platform for Measuring Quiet Stance and Dynamic Standing Balance in Healthy Subjects. Int. J. Environ. Res. Public Health 2020, 17, 7733. [Google Scholar] [CrossRef] [PubMed]
  23. Quialheiro, A.; Maestri, T.; Zimermann, T.A.; Ziemann, R.M.d.S.; Silvestre, M.V.; Maio, J.M.B.; Xavier, A.J.; Villeneuve, P.; Salgado, A.S.I.; Viseux, F.J.F.; et al. Stabilometric analysis as a cognitive function predictor in adults over the age of 50: A cross-sectional study conducted in a Memory Clinic. J. Bodyw. Mov. Ther. 2021, 27, 640–646. [Google Scholar] [CrossRef] [PubMed]
  24. Martins, H.S.; Lüdtke, D.D.; César de Oliveira Araújo, J.; Cidral-Filho, F.J.; Inoue Salgado, A.S.; Viseux, F.; Martins, D.F. Effects of core strengthening on balance in university judo athletes. J. Bodyw. Mov. Ther. 2019, 23, 758–765. [Google Scholar] [CrossRef]
  25. Kapoula, Z.; Lê, T.-T. Effects of distance and gaze position on postural stability in young and old subjects. Exp. Brain Res. 2006, 173, 438–445. [Google Scholar] [CrossRef]
  26. Munafo, J.; Curry, C.; Wade, M.G.; Stoffregen, T.A. The distance of visual targets affects the spatial magnitude and multifractal scaling of standing body sway in younger and older adults. Exp. Brain Res. 2016, 234, 2721–2730. [Google Scholar] [CrossRef]
  27. Fullin, A.; Caravaggi, P.; Picerno, P.; Mosca, M.; Caravelli, S.; De Luca, A.; Lucariello, A.; De Blasiis, P. Variability of Postural Stability and Plantar Pressure Parameters in Healthy Subjects Evaluated by a Novel Pressure Plate. Int. J. Environ. Res. Public Health 2022, 19, 2913. [Google Scholar] [CrossRef]
  28. Rosário, J.L.P. A review of the utilization of baropodometry in postural assessment. J. Bodyw. Mov. Ther. 2014, 18, 215–219. [Google Scholar] [CrossRef]
  29. Scoppa, F.; Capra, R.; Gallamini, M.; Shiffer, R. Clinical stabilometry standardization: Basic definitions—Acquisition interval—Sampling frequency. Gait Posture 2013, 37, 290–292. [Google Scholar] [CrossRef]
  30. Ruhe, A.; Fejer, R.; Walker, B. The test-retest reliability of centre of pressure measures in bipedal static task conditions—A systematic review of the literature. Gait Posture 2010, 32, 436–445. [Google Scholar] [CrossRef]
  31. Ford, K.R.; Myer, G.D.; Smith, R.L.; Byrnes, R.N.; Dopirak, S.E.; Hewett, T.E. Use of an overhead goal alters vertical jump performance and biomechanics. J. Strength Cond. Res. 2005, 19, 394–399. [Google Scholar] [CrossRef] [PubMed]
  32. Hohenwarter, M.; Jones, K. Ways of linking geometry and algebra: The case of GeoGebra. Proc. Br. Soc. Res. Learn. Math. 2007, 27, 126–131. [Google Scholar]
  33. R: The R Project for Statistical Computing. Available online: https://www.r-project.org/ (accessed on 28 January 2025).
  34. Hébert-Losier, K.; Murray, L. Reliability of centre of pressure, plantar pressure, and plantar-flexion isometric strength measures: A systematic review. Gait Posture 2020, 75, 46–62. [Google Scholar] [CrossRef] [PubMed]
  35. Hennig, E.M.; Sterzing, T. Sensitivity mapping of the human foot: Thresholds at 30 skin locations. Foot Ankle Int. 2009, 30, 986–991. [Google Scholar] [CrossRef]
Figure 1. Graphical representation on the sagittal plane of a healthy young adult in upright posture in both SCFP (a) and SFP (b) with a target placed at 0.7 m from the heels. Representation of anthropometric measurements (height, inter-Acromion and inter-ASIS distances) on the frontal plane (c) and of the feet on a transversal plane in both SCFP (d) and SFP (e). Figure note: self-selected comfortable foot position (SCFP); standardized foot position (SFP); Anterior Superior Iliac Spine (ASIS).
Applsci 15 05417 g001
Figure 2. Graphical representation of the baropodometric exam and between-feet measurements (BFMs) implemented using baropodometric Software (BTS P-Walk FM12050, BTS-Bioengineering, Milan, Italy) in both self-selected comfortable foot position (SCFP; (a)) and standardized feet (SFP; (b)) positions. Identification of forefoot and rearfoot points of tangency; between-feet, left and right foot standing angles are represented in blue, orange, and yellow, respectively; Inter-Heels Medial and Posterior distances are represented in green and red using the GeoGebra (2024) online tool. Figure Note: forefoot points of tangency (FPT); between-feet angle (BFA); left foot standing angle (LFSA); right foot standing angle (RFSA); rearfoot points of tangency (RPT). The green line indicates Inter-Heels Medial Distance (IHMD), and the red line indicates Inter-Heels Posterior Distance (IHPD). Dashed gray line longitudinal axis between the feet; blue lines indicate tangent lines on the medial region of the feet.
Applsci 15 05417 g002
Figure 3. Boxplot of intra-subject coefficient of variation (CV) in percentage for all stabilometric and plantar pressure parameters, sorted in ascending order according to the median values (black segments), in SCFP (a) and SFP (b) conditions. Figure note: total foot (Tf), rearfoot (Rf), midfoot (Mf), forefoot (Ff), mean pressure (Pmean), maximum pressure (Pmax), foot contact area (FCA), arch index (AI), center of pressure (CoP), center-of-pressure sway area (CoPsa), center of pressure speed (CP speed), length surface function (LSF), self-selected comfortable foot position (SCFP), standardized foot position (SFP). The green, orange, and red dashed lines indicate the thresholds of 10%, 30%, and 50%, respectively.
Applsci 15 05417 g003
Table 1. Pearson correlation coefficients (R) with p-values and 95% confidence interval between anthropometric measurements (AMs) and between-feet measurements (BFMs) in SCFP. Variables are also reported as mean ± SD (min; max).
BFMs
Mean ± SD (Min; Max) Or Median
(25th–75th Percentiles)
AMs
Mean ± SD (min; max)
Height [cm] Inter-Acromion
Distance [cm]
Inter-ASIS
Distance [cm]
172.1 ± 7.6 (160; 183)34.5 ± 2.7 (29.0; 39.0)24.8 ± 2.6 (20.5; 29.5)
Pearson Correlation Coefficient R (p-Value)
[95% Confidence Interval]
BFA [Deg]12.2 (6.8; 16.4)0.369 (0.100)
[−0.075; 0.691]
0.373 (0.095)
[−0.070; 0.693]
0.281 (0.218)
[−0.172; 0.635]
IHMD [cm]15.1 ± 2.9 (8.0; 22.5)0.266 (0.244)
[−0.187; 0.626]
0.128 (0.581)
[−0.322; 0.530]
0.415 (0.061)
[−0.020; 0.718]
IHPD [cm]19.6 ± 3.1 (12.2; 26.9)0.238 (0.296)
[−0.215; 0.608]
0.110 (0.634)
[−0.337; 0.517]
0.273 (0.096)
[−0.070; 0.693]
Note: between-feet angle (BFA); anthropometric measurements (AMs); between-feet measurements (BFMs); Inter-Heels Medial Distance (IHMD); Inter-Heels Posterior Distance (IHPD); Anterior Superior Iliac Spine (ASIS); standard deviation (SD); minimum (Min); and maximum (Max).
Table 2. Significant difference in between-feet measurements (BFMs) between two feet placement conditions (SCFP and SFP) via one-sample t-test or non-parametric Wilcoxon signed rank test (level of significant α = 0.05).
BFMsFeet Placement Conditionp-Value
SCFP
Applsci 15 05417 i001
SFP
Applsci 15 05417 i002
Mean ± SD (Min; Max) or Median (25th–75th Percentiles)Standardized Value
BFA [Deg]12.2 (6.8; 16.4)30<0.001 *
IHMD [cm]15.1 ± 2.9 (8.0; 22.5)5<0.001 *
IHPD [cm]19.1 ± 3.1 (12.2; 26.9)9<0.001 *
Note: between-feet measurements (BFMs); self-selected comfortable foot position (SCFP), standardized foot position (SFP), between-feet angle (BFA); left foot standing angle (LFSA); right foot standing angle (RFSA); Inter-Heels Medial Distance (IHMD); Inter-Heels Posterior Distance (IHPD); baropodometric software (BS); standard deviation (SD), minimum (Min), and maximum (Max); between-feet measurements (BFMs). Significant differences are highlighted in bold and are indicated via “*”.
Table 3. Significant differences (level of significant α = 0.05) of plantar pressure and stabilometric parameters between each condition of foot position via the Wilcoxon signed rank test.
Coefficient of Variation (CV)LSSCFP (A)SFP (B)SCFP vs. SFP (A vs. B)
Median (25th–75th Percentiles)p-Value
Load Tf [%]l1.4 (1.1; 1.9)2.1 (1.0; 3.6)0.035 (B)
r1.0 (0.9; 1.7)1.8 (1.0; 2.6)0.041 (B)
Load Rf [%]l3.0 (2.3; 4.3)6.8 (2.5; 10.9)0.004 (B)
r2.70 (2.2; 3.6)4.8 (3.8; 7.8)0.006 (B)
Load Mf [%]l7.8 (4.2; 15.0)14.4 (7.9; 28.2)0.032 (B)
r4.5 (2.2; 17.0)16.5 (6.6; 28.7)0.001 (B)
Load Ff [%]l3.0 (1.8; 4.94)6.7 (4.2; 10.6)<0.001 (B)
r1.9 (1.5; 3.4)4.7 (2.9; 5.8)0.002 (B)
Pmean Tf [KPa]l4.1 (2.5; 5.0)5.8 (3.0; 11.3)0.041 (B)
r3.7 (2.8; 5.2)5.4 (3.2; 11.1)0.010 (B)
Pmean Rf [KPa]l4.9 (2.4; 8.2)8.1 (3.1; 15.2)0.027 (B)
r4.8 (3.0; 6.5)7.8 (4.3; 12.9)0.006 (B)
Pmean Mf [KPa]l4.7 (3.7; 7.9)10.9 (6.9; 16.7)0.002 (B)
r5.1 (3.8; 8.4)12.2 (8.1; 18.1)0.002 (B)
Pmean Ff [KPa]l3.2 (2.2; 3.9)6.9 (4.0; 8.9)<0.001 (B)
r2.8 (2.0; 5.3)4.3 (3.1; 10.0)0.052
Pmax Tf [KPa]l5.5 (3.5; 7.8)5.9 (4.2; 10.1)0.089
r5.7 (3.1; 7.6)5.8 (3.1; 12.9)0.160
Pmax Rf [KPa]l5.5 (3.5; 7.8)5.9 (4.2; 10.1)0.089
r5.7 (3.1; 7.6)5.8 (3.1; 12.9)0.160
Pmax Mf [KPa]l6.5 (5.7; 9.5)11.8 (6.1; 17.4)0.016 (B)
r5.8 (4.6; 14.2)15.1 (7.5; 19.8)0.035 (B)
Pmax Ff [KPa]l3.5 (1.9; 5.4)9.3 (6.9; 11.3)0.001 (B)
r4.1 (2.9; 7.3)6.5 (5.2; 10.5)0.027 (B)
FCA [cm2]l3.3 (2.3; 4.8)6.5 (2.4; 11.6)0.002 (B)
r3.1 (2.4; 4.7)5.4 (2.1; 8.2)0.025 (B)
AI [%]l8.3 (4.1; 14.9)13.9 (7.8; 28.6)0.032 (B)
r4.5 (3.2; 17.8)16.3 (6.7; 28.6)0.001 (B)
CoPsa [mm2] 42.8 (26.7; 58.1)54.1 (36.0; 67.7)0.060
CP speed [mm/s] 11.5 (8.2; 17.6)15.4 (10.0; 25.4)0.129
LSF [mm−1] 35.4 (30.4; 55.8)50.8 (39.7; 70.8)0.060
Note: Each condition is identified as follows: SCFP (A) and SFP (B). The letter in bold indicates the condition in which the significant increase was found. Limb side (LS); left (L); right (R); total foot (Tf); rearfoot (Rf); midfoot (Mf); forefooot (Ff); mean pressure (Pmean); maximum pressure (Pmax); foot contact area (FCA); arch index (AI); center of pressure (CoP); center-of-pressure sway area (CoPsa); center of pressure speed (CP speed); length surface function (LSF); self-selected comfortable foot position (SCFP); standardized foot position (SFP).
Table 4. Inter-subject median and percentiles (25%, 75%) of plantar pressure and stabilometric parameters; significant differences (level of significant α = 0.05) between the two different conditions of foot position (SCFP and SFP) via Wilcoxon signed rank test.
Plantar Pressure and Stabilometric ParameterLSSCFP (A)SFP (B)SCFP vs. SFP (A vs. B)
Median (25th–75th Percentiles)p-Value
Load Tf [%]l46.1 (44.8; 47.8)46.6 (44.8; 48.5)0.217
r53.9 (52.2; 55.2)53.4 (51.5; 55.2)0.217
Load Rf [%]l46.9 (45.0; 50.0)48.2 (46.6; 51.4)0.099
r42.7 (39.0; 46.1)43.7 (41.2; 45.9)0.131
Load Mf [%]l11.3 (4.8; 14.4)11.9 (4.2; 16.9)0.455
r13.3 (5.9; 18.9)12.4 (4.1; 18.4)0.332
Load Ff [%]l41.7 (38.7; 48.3)39.9 (35.6; 45.9)0.017 (A)
r44.0 (40.1; 47.5)43.9 (38.8; 47.8)0.181
Pmean Tf [KPa]l37.4 (33.7; 42.6)38.9 (33.4; 44.5)0.027 (B)
r38.0 (34.3; 42.1)39.2 (35.3; 43.6)0.205
Pmean Rf [KPa]l50.4 (44.6; 57.1)51.6 (45.2; 58.9)0.305
r49.6 (43.0; 57.8)51.3 (46.5; 56.5)0.274
Pmean Mf [KPa]l21.9 (17.9; 26.8)23.1 (19.9; 25.3)0.027 (B)
r21.5 (18.4; 24.2)22.4 (20.4; 24.4)0.181
Pmean Ff [KPa]l25.7 (22.1; 27.8)26.5 (23.5; 29.8)0.339
r31.2 (30.3; 33.8)31.5 (28.0; 33.8)0.322
Pmax Tf [KPa]l93.0 (80.7; 102.0)91.9 (81.7; 106.0)0.681
r91.3 (73.3; 106.7)92.0 (84.0; 102.3)0.896
Pmax Rf [KPa]l93.0 (80.7; 102.0)91.9 (81.7; 106.0)0.681
r91.2 (72.7; 106.7)92.0 (84.0; 102.3)0.896
Pmax Mf [KPa]l39.4 (30.7; 50.3)42.1 (30.7; 53.0)0.044 (B)
r39.9 (27.7; 50.3)41.5 (32.7; 53.7)0.198
Pmax Ff [KPa]l42.9 (36.3; 48.3)44.1 (35.0; 54.3)0.339
r53.9 (49.7; 57.7)56.2 (49.0; 60.3)0.054
FCA [mm2]l94.4 (82.0; 108.6)91.9 (77.7; 104.0)0.149
r108.3 (90.7; 127.7)103.3 (91.3; 121.6)0.032 (A)
AI [%]l11.3 (4.8; 14.4)11.9 (4.2; 16.9)0.394
r13.3 (5.9; 19.1)12.5 (4.1; 18.4)0.289
CoPsa [mm2] 38.1 (28.8; 47.9)38.2 (26.1; 51.0)0.931
CP speed [mm/s] 4.8 (4.2; 5.2)4.4 (3.5; 4.2)0.001 (A)
LSF [mm−1] 4.7 (4.2; 7.7)4.7 (2.6; 6.3)0.085
Note: Each condition is identified as follows: SCFP (A) and SFP (B). The letter in bold indicates the condition in which the significant increase was found. Limb side (LS); left (L); right (R); total foot (Tf); rearfoot (Rf); midfoot (Mf); forefoot (Ff); mean pressure (Pmean); maximum pressure (Pmax); foot contact area (FCA); arch index (AI); center of pressure (CoP); center-of-pressure sway area (CoPsa); center of pressure speed (CP speed); length surface function (LSF); self-selected comfortable foot position (SCFP); standardized foot position (SFP).
Disclaimer/Publisher’s Note: The statements, opinions and data contained in all publications are solely those of the individual author(s) and contributor(s) and not of MDPI and/or the editor(s). MDPI and/or the editor(s) disclaim responsibility for any injury to people or property resulting from any ideas, methods, instructions or products referred to in the content.

