Article

Scalable Chemical Vapor Deposition of Silicon Carbide Thin Films for Photonic Integrated Circuit Applications

Department of Nanoscale Science and Engineering, College of Nanotechnology, Science, and Engineering (CNSE), University at Albany (UAlbany), Albany, NY 12203, USA
*
Author to whom correspondence should be addressed.
Appl. Sci. 2025, 15(15), 8603; https://doi.org/10.3390/app15158603
Submission received: 9 July 2025 / Revised: 28 July 2025 / Accepted: 30 July 2025 / Published: 2 August 2025
(This article belongs to the Section Materials Science and Engineering)

Abstract

Highly integrable silicon carbide (SiC) has emerged as a promising platform for photonic integrated circuits (PICs), offering a comprehensive set of material and optical properties that are ideal for the integration of nonlinear devices and solid-state quantum defects. However, despite significant progress in nanofabrication technology, the development of SiC on an insulator (SiCOI)-based photonics faces challenges due to fabrication-induced material optical losses and complex processing steps. An alternative approach to mitigate these fabrication challenges is the direct deposition of amorphous SiC on an insulator (a-SiCOI). However, there is a lack of systematic studies aimed at producing high optical quality a-SiC thin films, and correspondingly, on evaluating and determining their optical properties in the telecom range. To this end, we have studied a single-source precursor, 1,3,5-trisilacyclohexane (TSCH, C3H12Si3), and chemical vapor deposition (CVD) processes for the deposition of SiC thin films in a low-temperature range (650–800 °C) on a multitude of different substrates. We have successfully demonstrated the fabrication of smooth, uniform, and stoichiometric a-SiCOI thin films of 20 nm to 600 nm with a highly controlled growth rate of ~0.5 Å/s and minimal surface roughness of ~5 Å. Spectroscopic ellipsometry and resonant micro-photoluminescence excitation spectroscopy and mapping reveal a high index of refraction (~2.7) and a minimal absorption coefficient (<200 cm−1) in the telecom C-band, demonstrating the high optical quality of the films. These findings establish a strong foundation for scalable production of high-quality a-SiCOI thin films, enabling their application in advanced chip-scale telecom PIC technologies.

1. Introduction

The advancement of photonic technologies is increasingly driven by the need for material platforms that enable the development of photonic integrated circuits (PICs) capable of manipulating light with high precision and efficiency at the nanoscale. Among the different materials being explored, silicon carbide (SiC) has emerged as a multifunctional material platform for photonic integrated devices and circuits (PICs), based on lithographically patterned waveguides. Its attributes, such as wide bandgap (2.4–3.2 eV), high refractive index (~2.6 at 1550 nm), relatively high electro-optic coefficient (Pockels effect) (~2 pm/V at 1550 nm), and high thermal conductivity (450 W/mK), make it particularly well-suited for devices such as waveguides, ring resonators, and Pockels modulators on insulator, and position it as a versatile candidate for next-generation PICs [1,2,3]. Efficient operation at telecom wavelengths, specifically around 1310 and 1550 nm, is essential for various PIC applications, particularly in telecommunications and quantum information science [4]. SiC suppresses two-photon absorption at telecom wavelengths due to its large direct bandgap [5], while its linear refractive index is high, and therefore, it can facilitate the fabrication of ultra-high confinement waveguides. Moreover, SiC is unique among photonic materials due to its ability to host optically active quantum defects [6,7,8]. SiC has a nearly negligible magnetic moment, which is essential for supporting single-photon emitters with reduced optical decoherence [9]. This feature enables a wide range of quantum photonic applications, including quantum sensing, quantum metrology, and quantum information processing [10,11,12,13]. SiC’s mechanical and chemical robustness further supports applications in high-temperature and harsh environments [14,15,16]. Notably, among its polytypes, cubic SiC (3C-SiC) is the only one that can be grown directly on silicon.
Current research on SiC for PICs primarily focuses on bulk SiC, heteroepitaxial 3C-SiC on silicon (Si) [17], homoepitaxial 4H-SiC [18], and the chemical vapor deposition of amorphous SiC (a-SiC) on Si [19]. These approaches have enabled the development of photonic devices based on suspended SiC structures, silicon carbide-on-insulator (SiCOI) thin films (e.g., 3C- and 4H-SiCOI) [20,21,22], and amorphous-SiCOI [23,24], each offering distinct advantages for integration and device performance. The SiCOI platform parallels the well-established silicon-on-insulator technology in silicon photonics, offering an industry-compatible fabrication route. In contrast to the limited photonic device architectures enabled by homoepitaxial 4H-SiC and direct 3C-SiC growth on Si, which face challenges such as a lattice mismatch of ~20% [25], SiCOI enables high-quality device fabrication through wafer bonding. This process involves flipping and transferring an epitaxially grown SiC layer onto a silicon dioxide-on-silicon substrate. Recent advances in wafer bonding [26], smart-cut, and thinning techniques have facilitated the production of high-quality 3C- and 4H-SiC on insulator (SiCOI) thin films [27,28], resulting in platforms suitable for PICs (e.g., high-Q optical cavities and efficient nonlinear optical devices). However, wafer bonding introduces challenges, including the need for precise wafer-thickness uniformity during thinning and planarization, as well as control of material optical losses introduced by ion-cutting processes, and layer-to-layer lattice alignment [29,30,31].
An alternative approach to mitigate the fabrication challenges associated with the SiCOI platform through the wafer bonding process is the direct deposition of amorphous SiC on an insulator (a-SiCOI) [23,24]. This method leverages CMOS-compatible fabrication techniques, such as plasma-enhanced chemical vapor deposition (PECVD) and inductively coupled plasma CVD (ICPCVD), which enables precise thickness control—an essential factor for wafer- and chip-scale PIC fabrication. However, there is a lack of systematic studies to produce high optical quality a-SiC thin films focusing on evaluating and determining their optical properties in the telecom band. Furthermore, while the a-SiCOI platform potentially offers a more straightforward fabrication process, its material optical losses, due to the inhomogeneity and disorder of the a-SiC materials (e.g., non-stoichiometric material, presence of homonuclear Si-Si, C-C bonds) and/or due to the presence of hydrogen-related bonds (e.g., Si-H or C-H), remain a substantial challenge. Furthermore, many studies on SiC films for photonics lack quantitative optical absorption data in the telecom range [24], despite its significant impact on propagation losses as seen in other materials such as silicon nitride (SiN) [32,33], and consequently on the suitability of these films for low-loss photonic device integration.
Overcoming these challenges requires control of film quality to mitigate material-related optical losses that affect the performance of photonic devices (e.g., waveguides, Kerr nonlinear devices). To this end, we present a materials-engineering-driven strategy for fabricating SiC thin films with precise thickness control, minimal surface roughness, and telecom-range optical absorption. This approach centers on the development of CVD processes for producing both amorphous (a-SiC) and crystalline (c-SiC) films, deposited using a single-source precursor, 1,3,5-trisilacyclohexane (TSCH, C3H12Si3) on a multitude of different substrates, including Si (e.g., Si (100) and Si (111)), and silicon dioxide-on-Si. This study has enabled the fabrication of fab-compatible, smooth, stoichiometric, and homogeneous SiCOI thin films (with a surface roughness of ~5 Å, hydrogen-free, and lacking homonuclear (e.g., Si-Si and C-C) bonds). Furthermore, optical measurements revealed a high refractive index of ~2.7 and a low absorption coefficient (e.g., <200 cm−1) at around 1550 nm, indicating the high optical quality of the resulting SiC thin films. Our CVD-deposited amorphous thin films can be fabricated with a growth rate of ~0.5 Å/s, allowing for a thickness control on the nm scale. Therefore, directly depositing a-SiC on an insulator, using our CVD-compatible chip-scale device fabrication process, can potentially eliminate the need for expensive and time-consuming bonding transfer methods, including material waste during the thinning process, for the fabrication of next-generation chip-scale SiC PIC components [24]. In this context, our fabrication can also be applied to integrate SiC waveguides on an erbium-implanted lithium niobate (LN) platform, enabling hybrid integrated photonics [30] for applications such as modulation and enhancement of Er3+ telecom emission in thin-film LN [34].

2. Materials and Methods

The CVD-grown SiC films (Figure 1) are produced in a thickness range of 20–600 nm, using a low deposition temperature (TD) range (650 °C ≤ TD ≤ 800 °C) in a hot-wall quartz tube CVD reactor (Figure 1A). The deposition employed a single-source precursor, 1,3,5-trisilacyclohexane (TSCH, C3H12Si3) [7,35]. Prior to deposition, Si (100), undoped (intrinsic) double-polished Si, and Si (111) substrates were cleaned in 1% diluted HF (DHF) for 10 min to remove native oxide from the surface. Additionally, in situ cleaning and passivation were performed at 800 °C for 30 min in a forming gas ambient (comprising 5% H2 and 95% Ar). In situ post-deposition annealing was performed using three different processes: annealing [A1] in forming gas at 850 °C; [A2] in Ar at 900 °C; and [A3] in forming gas at 1100 °C for 1 h. To optimize uniformity and minimize surface roughness, we have explored combinations of deposition temperatures and process pressures, targeting a surface-reaction-limited growth process where film growth is predominantly governed by the TD. In this growth process regime, achieved by reducing the pressure of the CVD system, a reduced flux and high diffusivity of the reactive species can be attained, thus yielding smoother, more conformal films with fewer defects. Conversely, the mass-transport-limited regime introduces undesirable flow-dependent effects that can degrade film quality (e.g., thickness variation, increased defectivity, and roughness) [36]. To this end, films deposited at TD ≥ 750 °C were grown at 200 mTorr (limited by our CVD pumping apparatus under the investigated conditions) with growth rates of 2–11 Å/s, while films grown at lower temperatures (TD ≤ 700 °C) required higher pressures, for example, 1.5 Torr for the 650 °C deposition temperature, and exhibited much lower growth rates (~0.5 Å/s) (Figure 1A). Furthermore, to optimize both deposition and post-deposition parameters for achieving high-quality SiC films, we have conducted extensive characterization using Fourier transform infrared spectroscopy (FTIR), X-ray photoelectron spectroscopy (XPS), and atomic force microscopy (AFM) (Figure 1B–E). Additionally, spectroscopic ellipsometry (SE) is employed to determine the optical properties of the films, specifically the index of refraction (n), extinction coefficient (k), and absorption coefficient (α), along with their spectral dispersion.
The films are modeled using a bilayer structure consisting of a SiC film on top of a c-Si or a SiO2/c-Si substrate. A discussion of the SE models in relation to our study is provided in the next section. To further study the absorption characteristics in the 1550 nm regime, we have performed resonant micro-photoluminescence excitation (PLE) spectroscopy and mapping using a tunable pulsed excitation laser and a time-gated detection system.

3. Results and Discussion

Synoptically, FTIR spectroscopy shows that SiC thin films deposited at TD ≤ 750 °C exhibit a strong peak at ~760 cm−1, shifting to ~780 cm−1 after A3 annealing—indicating Si–C bonding (Figure 1B). A3 annealing effectively transforms amorphous a-SiC into polycrystalline 3C-SiC, as confirmed by FTIR and high-resolution scanning transmission electron microscopy (HRSTEM) studies (Figure S1A). Additionally, XPS results agree well with the FTIR data across all samples. The Si 2p binding energy (~100.3 eV) matched with that of 3C- and 4H–SiC reference samples, confirming that the chemical bonding in the synthesized SiC thin films is Si–C (Figure 1C). The absence of peaks near ~98.5 eV and ~103 eV—corresponding to Si–Si and Si–O bonds, respectively—rules out the presence of silicon nanodomains or oxidation in the films [6,37]. The highly controlled growth rate yields exceptionally smooth surfaces, exhibiting a root-mean-square (RMS) roughness of ~5 Å for samples deposited at TD ≤ 700 °C, as measured by AFM (Figure 1D). However, increased surface roughness (~15 Å RMS) was observed in the A3-annealed samples compared to their as-deposited (AD) counterparts and for the 800 °C—grown thin films (Figure 1D,E).
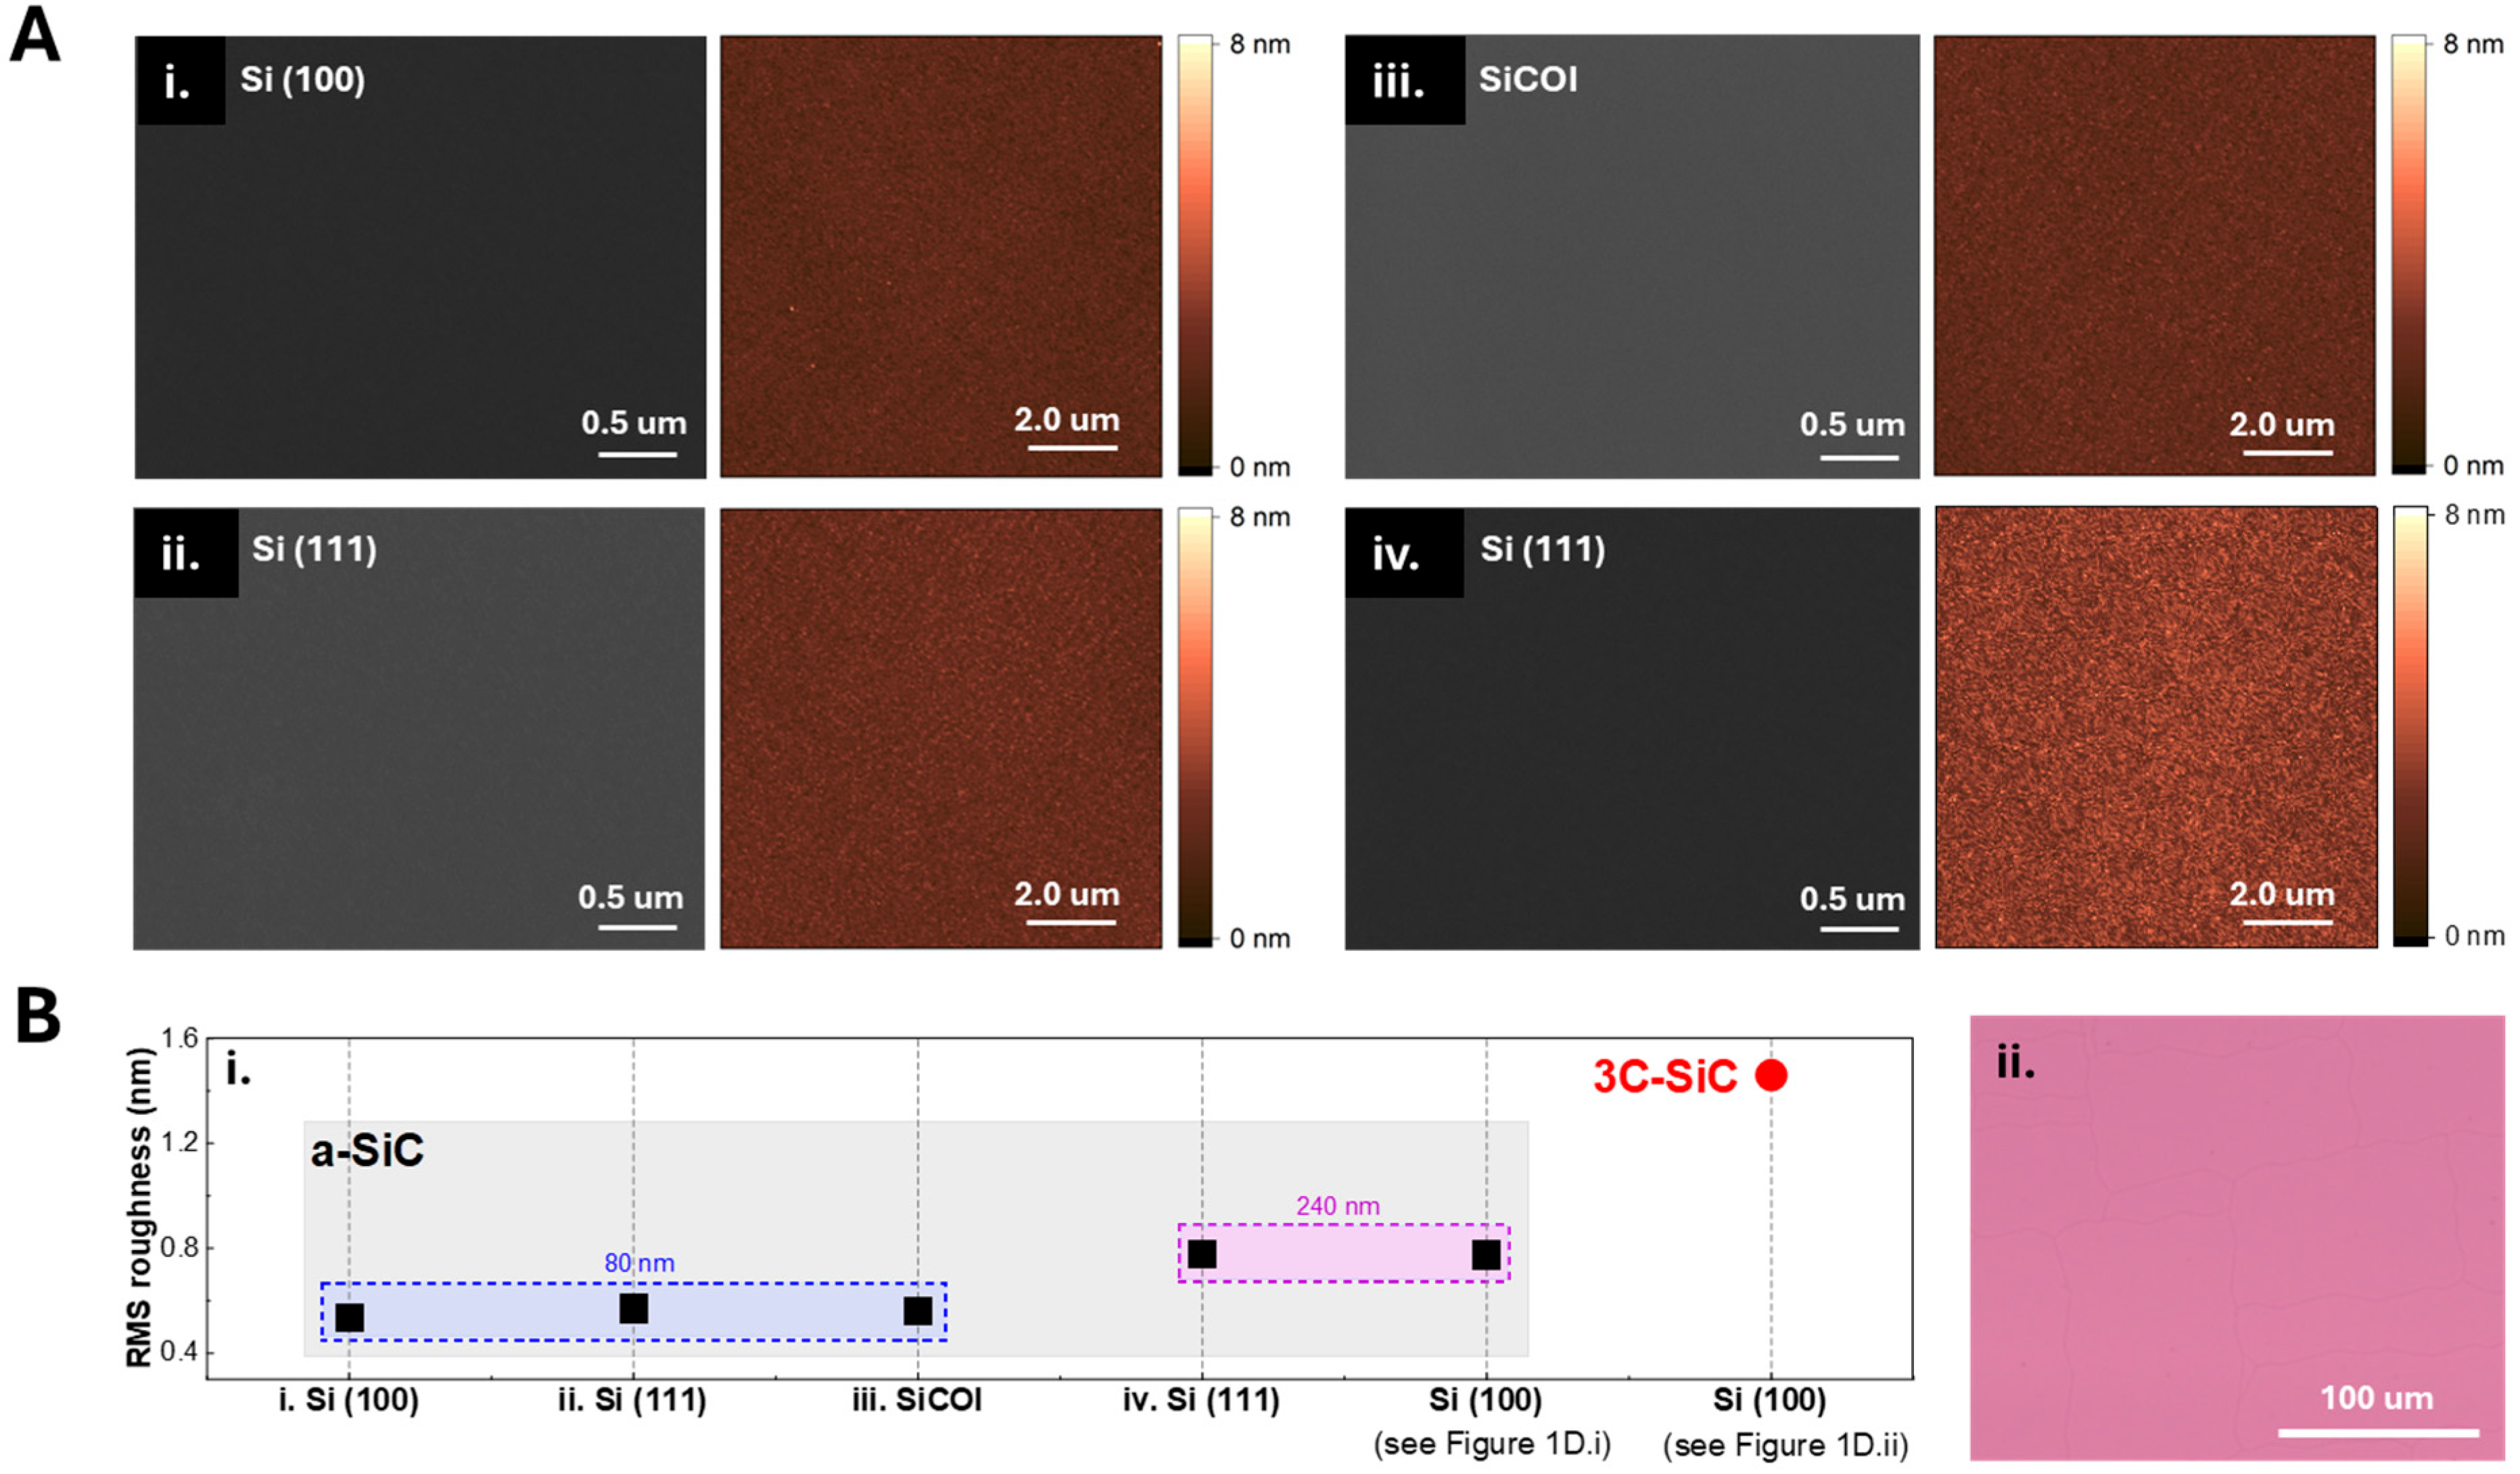
Additionally, we have used the same deposition parameters to grow films of various thicknesses on different substrates, including Si (111) and SiO2-on-Si (650 °C ≤ TD ≤ 700 °C). As shown in Figure 2A and summarized in Figure 2B, film uniformity and surface roughness remained consistent (5–8 Å) across Si (100), Si (111), and SiO2 substrates for similarly thick films, indicating no observable substrate dependence in surface roughness or morphology under the investigated processing conditions.
FTIR studies revealed a prominent absorption peak at ~760 cm−1 for SiC films deposited at TD ≤ 750 °C, and a shift to ~785 cm−1 for samples deposited at 800 °C, corresponding to Si–C stretching mode (Figure 3(Ai,Aii)) [6,38]. To quantify the relative contributions of amorphous and crystalline phases, we deconvoluted the FTIR spectra of the AD and annealed films using Gaussian (G) and/or Lorentzian (L) components, corresponding to amorphous and crystalline phases, respectively, and the degree of crystallinity was then estimated using the ratio L/(L + G) [6,38]. For example, the line shape of the Si–C stretching mode in the AD SiC thin films (TD ≤ 750 °C) was best fit with a Gaussian function characteristic of an amorphous phase with short-range structural order [6,38,39]. In this phase, bond lengths and angles are distributed randomly, as evidenced by the broad full width at half maximum (FWHM) of approximately 170 cm−1. After A2 annealing, however, the Si–C peak of the SiC films grown at 700 °C is best fit using a combination of Lorentzian and Gaussian functions, indicating approximately 50% crystallinity (Figure 3(Aiii)). In contrast, the line shape for the AD sample grown at 800 °C is well described by a Lorentzian function with a FWHM of approximately 80 cm−1, indicating a higher degree of medium-range order consistent with the onset of crystallinity (Figure 3(Aiv)) [40,41].
In the spectral range of 2000–2300 cm−1, a low-intensity absorption peak centered around 2080 cm−1 was detected in the 650 °C and 700 °C-deposited sample (Figure 3(Bi)). This is attributed to Si–H or Si–H2 stretching modes [38,42]. The intensity of this hydrogen-related peak decreased monotonically with increasing TD, becoming negligible at 800 °C. Furthermore, in situ post-deposition A2 annealing effectively removed residual hydrogen. FTIR also confirmed the absence of C–Hn absorption in the 2800–3100 cm−1 region for all samples within our investigated conditions (Figure 3(Bii)) [38,42]. Furthermore, hydrogen desorption upon in situ annealing leads to film densification and a corresponding reduction in thickness, as determined by SE and cross-sectional SEM analysis (Figure S1B). For example, the 650 °C-grown films showed a ~22% thickness reduction following A3 annealing.
To complement the FTIR findings, XPS depth profiling was conducted to assess the chemical environment of Si 2p, C 1s, and O 1s states. Binding energy shifts due to charging were corrected using the Ar 2p doublet reference peaks at ~242 eV and ~244 eV. For the AD film deposited at 800 °C, the Si:C atomic ratio was 50:50 with an experimental uncertainty of ~1% (Figure 3C). A decrease of ±1% in carbon content, approaching the XPS detection limit, was observed with decreasing TD from 800 °C to 650 °C.
Following the in situ post-deposition annealing processes, the Si–C stretching mode peak blue-shifted, while the Si-C bond area increased, as seen in Figure 3(Di,Dii). Our annealing studies revealed three significant changes in the FTIR absorption spectra that occur with increasing in situ annealing temperature: (1) a shift in peak position of the Si–C stretching mode toward ~790 cm−1 (Figure 3(Dii)); (2) a significant narrowing of the full width at half maximum (FWHM) of this Si-C mode (Figure 3(Diii)); and (3) an increase in film crystallinity (Figure 3(Div)). Specifically, A3 annealing led to complete crystallization, as indicated by an FWHM narrowing to ~46 cm−1—comparable to high-quality crystalline c-SiC [6,43]. These findings were further supported by HRTEM analysis of the A3-annealed films (Figure S1(Ai)), which revealed ring patterns with radii corresponding to the (111), (220), and (311) planes of the 3C–SiC phase [44]. The observed d-spacing value of ~2.56 Å, derived from HRTEM images of a single grain (Figure S1(Aii)), is also consistent with the (111) plane of 3C-SiC [6].
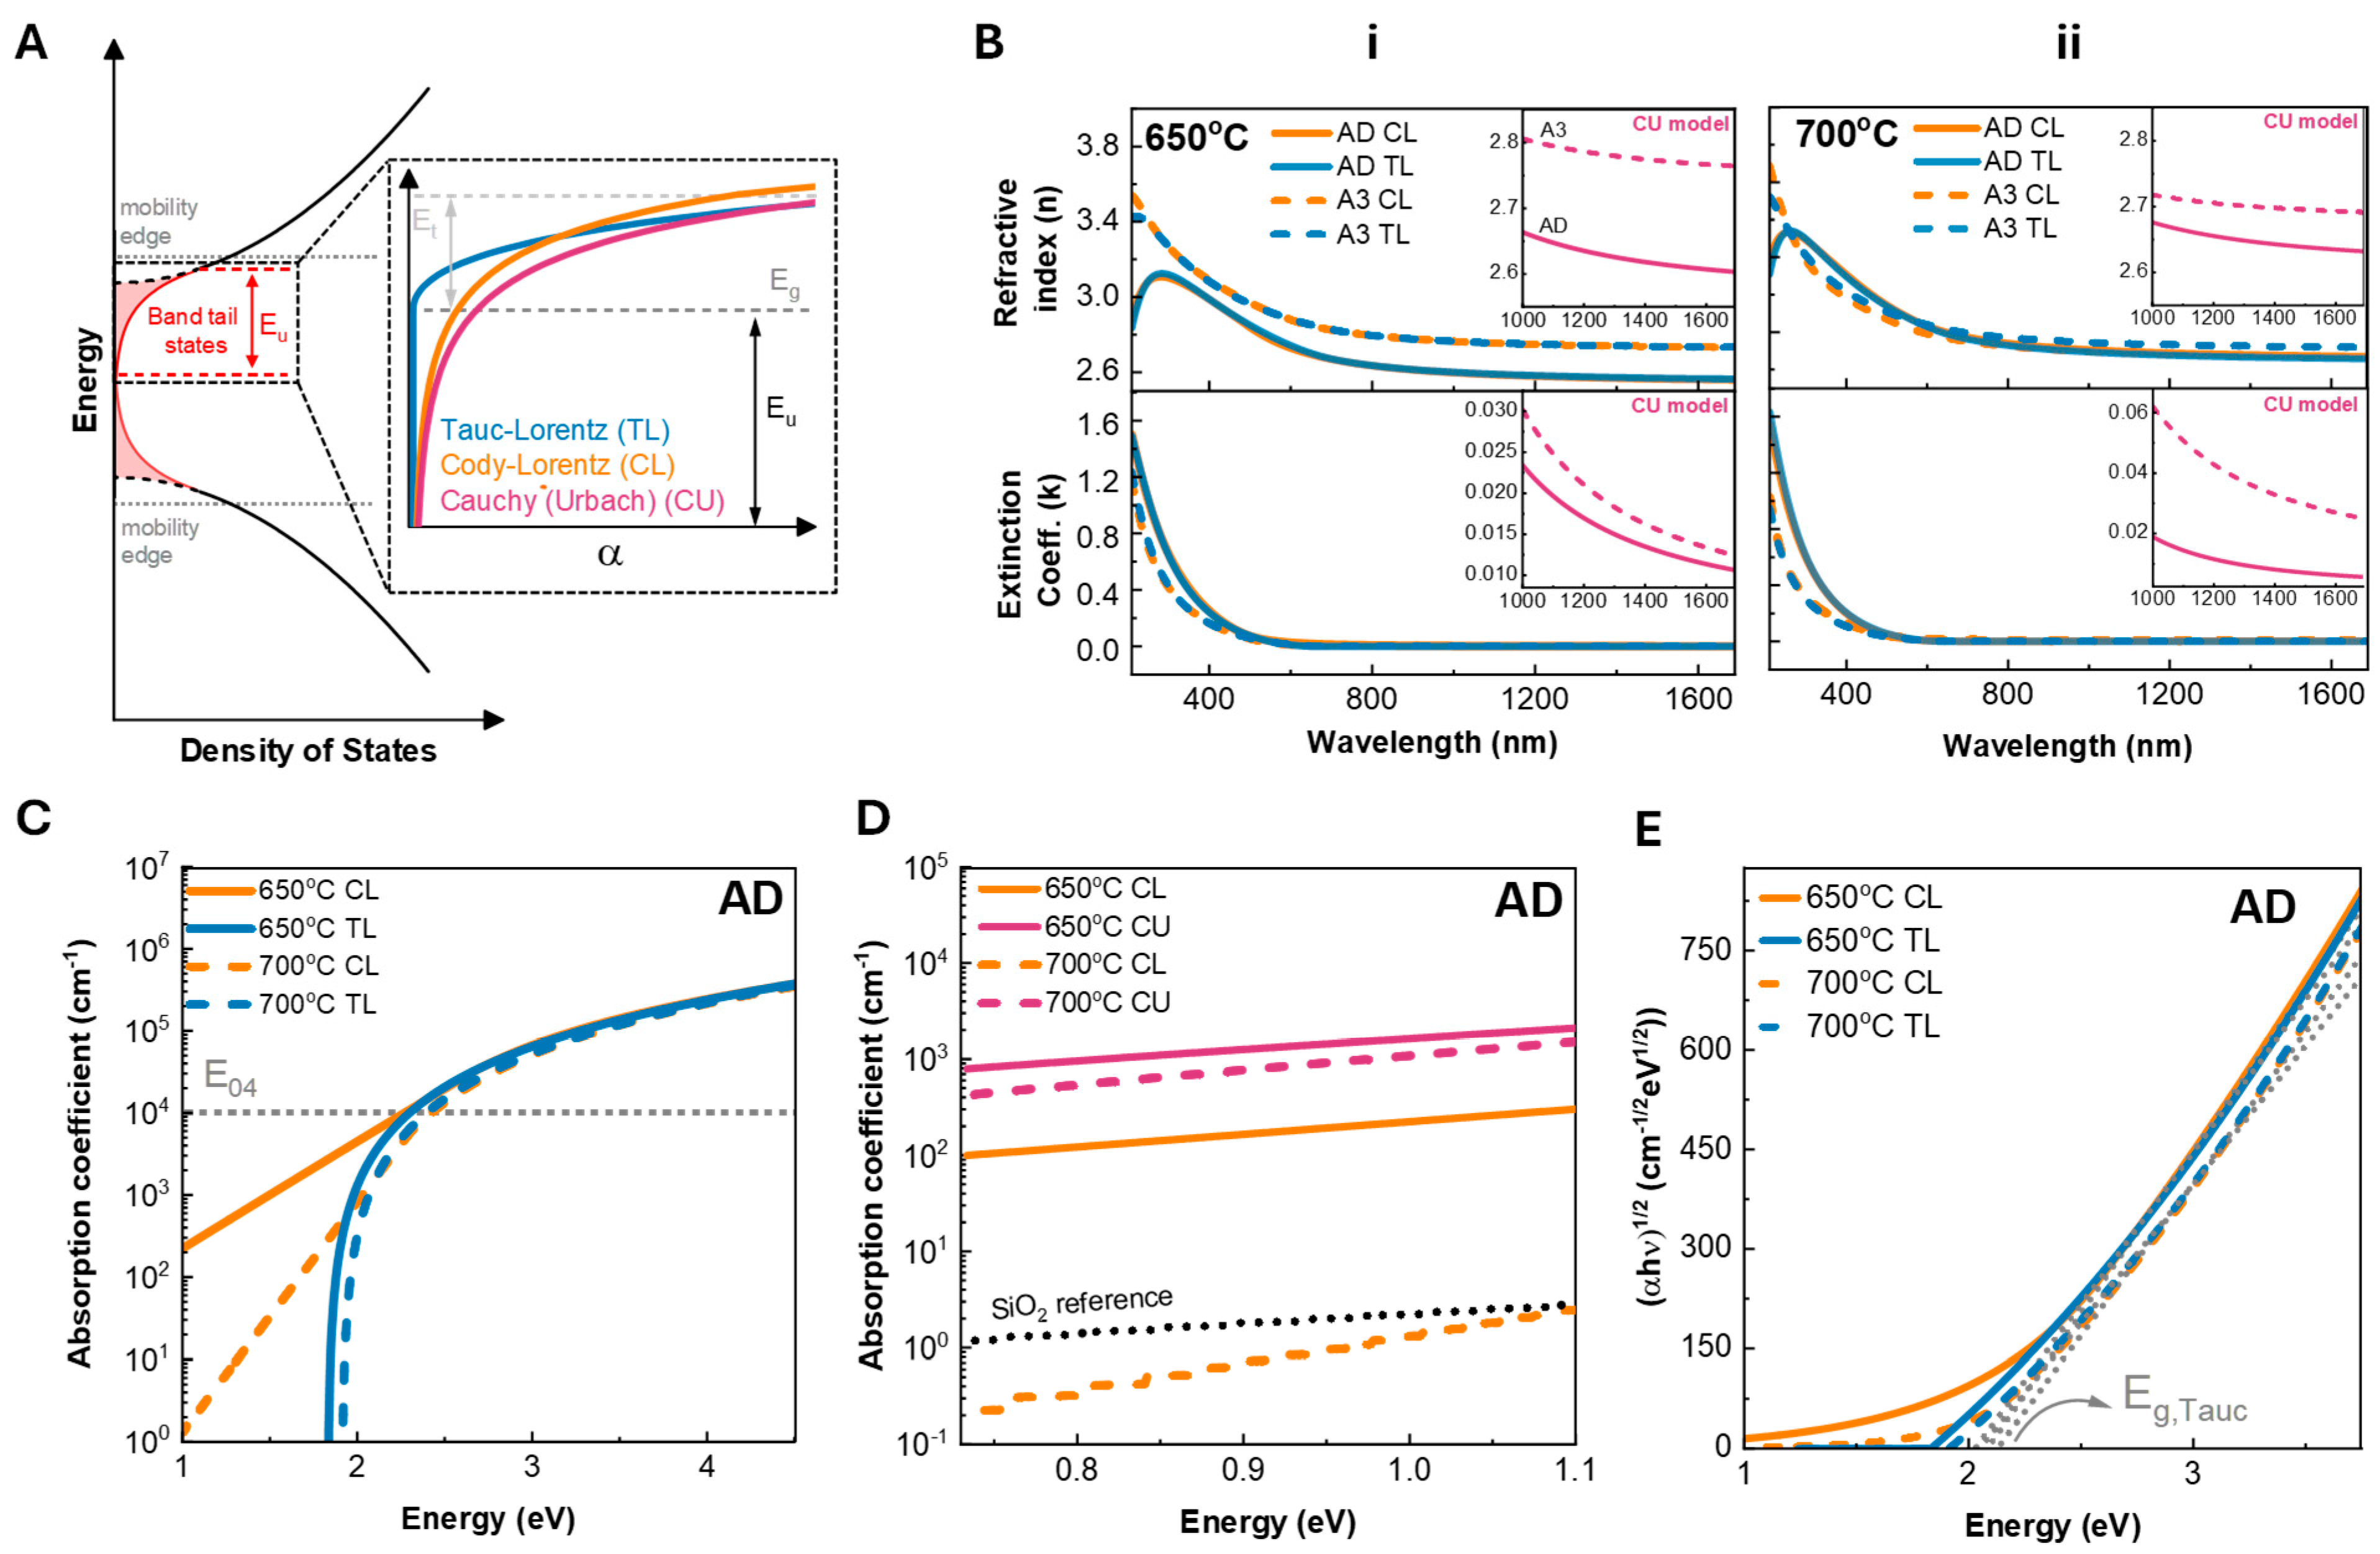
Considering the morphological requirements for photonics devices and the increased surface roughness of the thin films grown at TD ≥750 °C, we have primarily studied the optical properties of the 650 °C- and 700 °C-grown SiC thin films. SE was employed to extract the primary optical constants of the films, n and k. This technique is critical for evaluating the optical bandgap (Eg), and E04 gap, Urbach energy (Eu) associated with sub-bandgap defects and/or band tail states, and the absorption, α(λ) = 4πk/λ, in the NIR range. The E04 gap corresponds to the energy at which α is equal to 104 cm−1. Three fitting models have been employed: the Tauc-Lorentz (TL), the Cody-Lorentz (CL), and the Cauchy-Urbach (CU) model, focusing on evaluating and determining their optical properties in the near-infrared (NIR)—telecom range, as presented in Figure 4A. The Tauc-Lorentz model [45] combines Tauc’s formula T(E) [46] with a Lorentz oscillator function L(E) to describe the imaginary part of the dielectric function εi near and above the optical band (E > Eg):
ε i   E = A T E E g E 2 A 0 E 0 B E E 2 E 0 2 2 + B 2 E 2                     E > E g
ε i   E = T E L E ,                   E > E g
where AT is the Tauc’s coefficient, Eg is the optical bandgap; A0, E0, and B are the amplitude, resonance energy, and broadening factor of the Lorentz oscillator, respectively. The real part of the dielectric function εr, and thus the index of refraction, n, is obtained via Kramers-Kronig (K-K) transformation [47]. However, this model assumes zero absorption (εi = 0) for energies below the bandgap (E < Eg), which limits its accuracy in describing potential sub-bandgap absorption due to defects or band-tail states (blue line in Figure 4A) [48]. To address this, the Cody-Lorentz (CL) model [49,50] is an extension of the TL model developed to more accurately describe materials that exhibit sub-bandgap absorption (orange line in Figure 4A). For photon energies above a transition threshold energy Eg + Et, εi is expressed as the product of a variable band edge function G(E) and a Lorentz oscillator L(E):
ε i E = E E g 2 ( E E g ) 2 + E P 2 L E   =   G E L E ,     E > ( E g + E t )
where EP is a weighting factor introduced to differentiate between Cody absorption and Lorentz absorption behavior. For energies below Eg + Et, the CL model introduces an exponential Urbach tail to account for absorption at energies below the optical bandgap:
ε i E = E t G E t L E t E exp E E g E t E u ,                     E ( E g + E t )
where Eu is the Urbach width. Finally, the Cauchy-Urbach (CU) dispersion model [51] is used to describe the optical properties of the films in the NIR region (1000 nm to 1690 nm). In this model, the extinction coefficient, k, is described using an exponential Urbach tail (pink line in Figure 4A)
k λ = k 0 exp [ E E g E u ] ,  
where k0 is the absorption coefficient near the band edge. Additionally, n is described by:
n = A + B λ 2 ,
where A and B are fitting parameters, and λ is the wavelength. By leveraging three complementary models, we have accurately determined the range of critical optical properties of our deposited SiC thin films, specifically the absorption coefficient (α) in the telecom wavelength region (e.g., at 1550 nm). Mean square error (MSE) of the fitted models, along with the corresponding fitting parameters for each model, are provided in Tables S1 and S2. Figure 4B presents the n and k spectra of the AD and A3-annealed 650 °C and 700 °C depositions, respectively, based on the above-described fitting models. The n and k values at 500 nm and 1550 nm across all samples, processing conditions, and fitting models are summarized in Table 1, Tables S1 and S2. Across the visible region, both the TL and CL models yield consistent n values. For example, for 650 °C AD samples, the TL and CL models produced n values of 2.85 at 500 nm and 2.57 at 1550 nm (Figure 4(Bi)), with a measurement uncertainty of ±0.01. Following the A3 annealing, the refractive index increased to 2.97 and 2.73 at 500 nm and 1550 nm, respectively. In contrast, the 700 °C AD films exhibited higher n (~2.94 at 500 nm and ~2.67 at 1550 nm), which remained essentially unchanged after A3 annealing (Figure 4(Bii)). The insets of Figure 4(Bi,4Bii) demonstrate that refractive index values obtained from the Cauchy model closely match those derived from the TL and CL models in the near-infrared (NIR) region for the corresponding samples.
The refractive index, n, at optical frequencies, can be described by the Lorenz–Lorenz (L-L) equation [52]:
n 2 1 n 2 + 2 = N α e ( ω )   3 ε 0
where N is the concentration of dipoles (e.g., the number of atoms or molecules per m3), αe(ω) is the electronic polarizability, and ε0 is the permittivity of vacuum. Above 10 THz, only the electronic polarization, with resonant frequencies usually in the order of ~103 THz, survives and thus contributes to the dielectric constant. Equation (5) indicates that the concentration N, representing the number of atoms per unit volume (film density), can significantly affect the index of refraction of the SiC thin films. This approach is practically applied in porous low-dielectric-constant (low-k) materials used in microelectronics, in which by reducing the film density, the dielectric constant (index of refraction) is decreased [53,54]. In this context, the L-L relationship suggests that the observed increase in n in 650 °C-grown samples upon annealing is partly due to the observed thin-film thickness reduction (e.g., ~22% between the AD and A3 samples; see Figure S1B). The film densification observed for the sample deposited at 700 °C is lower (~17%) and does not lead to an observable change in the index of refraction, within the error associated with the SE measurements and fitting.
The values of k in the NIR region range from ~10−3 to 10−6 depending on the fitting model used (CL and CU) (Table 1), irrespective of the amorphous or crystalline phase of the films. These findings underscore that the extracted k values and corresponding absorption coefficients are highly model-dependent, as expected from the inherently model-based nature of SE. While these k values are low, those below ~10−3 fall below the sensitivity limits [55] of k values in this range from other studies may similarly reflect model-dependent limitations and should be accompanied by a clear disclaimer regarding the sensitivity limits of SE and the assumptions of the fitting model, as they may not reflect true material absorption.
Figure 4C presents the absorption coefficient values calculated from the TL and CL fits for the 650 °C and 700 °C AD films for photon energies ≥ 1 eV. The E04 gap is denoted by the gray dashed line. For energies above this point, both models show identical absorption coefficient values. Below E04, the TL-derived absorption coefficient values go to zero at the energy corresponding to Eg, as outlined in Equation (1a). Conversely, the CL models show non-zero absorption coefficient values extending from Eg into the NIR region. Nevertheless, both models produce nearly identical E04 and Eg values, with all extracted fitting parameters summarized in Table 1. Figure 4D highlights the absorption behavior in the NIR region (~0.7 eV–1.1 eV) for the 650 °C and 700 °C AD films, incorporating both the CL model and the corresponding CU fits discussed earlier. For reference, the fitting results for a pristine 25 nm thick reference SiO2 film — expected to be fully transparent below ~7 eV —are also included. All models reproduced the expected refractive index of ~1.48 for SiO2 at 1550 nm (Table S3) [56]. Absorption in this region in the SiC films is below ≤103 cm−1 in all cases. Significantly, the 700 °C sample consistently exhibits lower absorption coefficient values than the 650 °C sample across both models. In fact, the CL model yields near-zero α values (≤1 cm−1) for the 700 °C sample, comparable to those of the measured SiO2 reference.
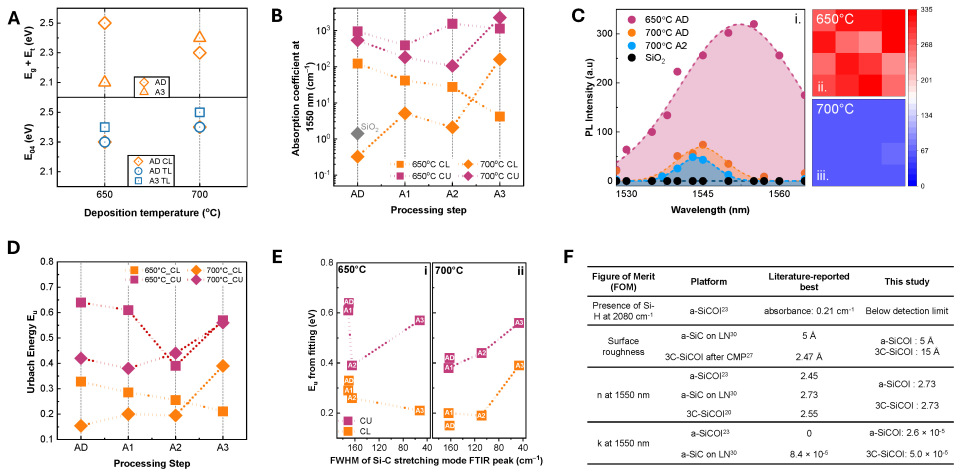
Tauc’s optical bandgap (Eg,Tauc) is determined from the absorption data using a linear fit in Tauc’s relation ( α E ) 1 / 2 = B E E g , T a u c , where E is the photon energy, B is the slope, and α is the absorption coefficient [57,58]. Figure 4E shows these plots for the 650 °C and 700 °C AD films based on the absorption data from both the CL and TL models. Each fit yielded consistent Eg,Tauc values of ~2.1 eV, which lie within the expected range for amorphous SiC 1.6–2 eV [59] and are slightly higher than the Eg values obtained directly from the SE models (1.8–2.0 eV, see Tables S1 and S2). Figure 5A presents these Eg + Et and E04 values from both TL and CL models for the 650 °C and 700 °C AD thin films before and after the sequential annealing to A3. Also shown are the Eg + Et values obtained from the CL fits for both samples, which align closely with the corresponding E04 values. Eg + Et in the CL model is associated with the transition into the band-to-band absorption region, and thus, related to E04 as the onset of strong absorption. In this context, Eg + Et may approximate the energy near the mobility edge (Figure 4A).
Figure 5B presents a comparative analysis of the absorption at 1550 nm for the AD and annealed 650 °C and 700 °C samples. For samples deposited at 650 °C, absorption values derived from the CL model monotonically decrease with increasing annealing steps, exhibiting an approximate 30-fold decrease following A3 annealing, from ~120 cm−1 for the AD to ~4 cm−1 for the A3 sample. The CU model analysis yields overall higher absorption, with α values of around 103 cm−1. This highlights what was previously mentioned, that k and, consequently, α, are dictated by the SE model-based analysis approach. Conversely, for the 700 °C SiC samples up to A2 annealing, α decreases (CU model), reaching values below 102 cm−1, comparable to the reference SiO2 sample, followed by a substantial increase in the A3-annealed samples (~2000 cm−1 for the CU model). For A1- and A2-annealed 700 °C SiC thin films, the analysis reveals absorption values below 200 cm−1 at telecom wavelengths, regardless of the model employed, demonstrating the high optical quality achieved. Figure 5(Ci) shows representative PLE spectra for the reference SiO2 sample and the 650 °C and 700 °C AD SiC films. The reference sample demonstrated zero PLE intensity, a critical finding that corroborates the absorption values obtained from SE analysis, regardless of the models (CL and CU) used.
Also, consistent with the higher absorption coefficient extracted from SE, the 650 °C film exhibited a substantially higher PLE intensity (~10 times higher integrated PLE intensity) compared to the 700 °C film, which exhibited overall minimal PLE. The 700 °C film subjected to A2 annealing showed a further decrease in PLE intensity, again aligning with SE-derived absorption trends. This trend was spatially uniform across the samples’ area, as shown in the corresponding intensity mappings of a 5 × 5 μm2 area in Figure 5(Cii,Ciii) for the 650 °C and 700 °C films, respectively.
Amorphous covalent materials typically exhibit two types of disorder: bond angle disorder, associated with the inherent variability of the atomic structure, and compositional disorder, related to deviation from the ideal coordination. In the case of stoichiometric a-SiC, the latter may be manifested with the presence of topological defects (e.g., undercoordinated C and Si defects), as well as of homonuclear and heteronuclear bonding configurations, such as Si-Si, C-C, C=C, Si-H, and C-H [60,61]. These bonding configurations may introduce defects and localized states within the optical gap, leading to enhanced optical absorption below the band edge, even in low concentrations (e.g., below the XPS and FTIR detection limit) (Figure S2i).
The Urbach energy Eu, extracted from both the CL and CU models, quantifies the exponential absorption tail below the band edge, which arises from disorder and/or defect-related states in the material, illustrated in the inset of Figure 4A. Figure 5D presents the extracted Eu energy values from the CL and CU fittings for the 650 °C and 700 °C samples as a function of annealing. Excluding the A3 annealing step, the AD and annealed SiC films grown at 700 °C generally exhibit lower Eu values than their 650 °C counterparts within each model. For instance, according to the CL model, the 700 °C samples exhibit Eu values of ~0.19 eV across the annealing sequence up to A2, compared to ~0.26 eV for the 650 °C sample. The CU model yields higher Eu values overall; however, a similar trend is observed, with the 700 °C consistently exhibiting lower Eu values than the 650 °C, and thus, lower disorder and/or defect density. In Figure 5E, we plot the extracted Eu values against the corresponding FWHM values of the Si-C stretching mode across the annealing sequence for both 650 °C and 700 °C samples. For both samples, the FWHM of the Si–C stretching mode is decreased by ~70% upon annealing, from ~165 cm−1 (AD samples) to ~48 cm−1 (A3-annealed samples), resulting in a substantial reduction in bond angle disorder. For the 650 °C samples, this decrease in FWHM coincides with a ~36% reduction in Eu, as determined by the CL model and an ~10% reduction based on the CU model. In contrast, for the 700 °C samples, the reduction in FWHM is accompanied by an increase in Eu. These results are consistent with previous studies, which have also shown that Eu is not correlated with bond-angle disorder [62].
These trends in optical properties are further supported by vibrational analysis of compositional disorder in our SiC films. The intensity of the Si-H stretching mode at ~2080 cm−1 is approximately 60% less intense in the AD 700 °C samples compared to their 650 °C analogs (Figure 3B). Additionally, this Si-H signal is no longer detectable in the A1-annealed 700 °C samples, whereas it remains present, albeit reduced, in the A1-annealed 650 °C samples. Furthermore, Raman measurements reveal that C-C bond-related signals near 1400 cm−1 are observed in the 650 °C films, a characteristic of compositional disorder, but are absent in the 700 °C films (Figure S2ii). These observations, along with the low α and Eu values in the AD and A2-annealed 700 °C SiC films, collectively indicate a lower density of sub-band edge states and minimal compositional disorder under our investigated conditions.
Figure 5F summarizes the figures of merit (FOMs) from this study with state-of-the-art values reported for SiC-based platforms fabricated using various deposition techniques (e.g., PECVD, ICPCVD) and on different substrates (e.g., Si, SiO2, LN). Our study demonstrates that, collectively under our investigated conditions, we have achieved improved values across key metrics: hydrogen content, surface roughness, optical absorption, and refractive index. Our A2-annealed 700 °C SiC thin films exhibit undetectable hydrogen-related bonds and extremely low surface roughness, minimal optical absorption, and refractive indices within the optimal range for photonic integration. This underscores not only the effectiveness of our materials-science engineering approach, but also the importance of comprehensive material characterization in the development of high-performance photonic devices.

4. Conclusions

In this work, we present a comprehensive study of the CVD process for SiC thin films using a single-source precursor, 1,3,5-trisilacyclohexane (TSCH). Our materials-engineering-driven approach targets key challenges that hinder the integration of SiC into photonic devices, both intrinsic material limitations—such as hydrogen incorporation, surface roughness, material disorder—and fabrication-related challenges, including precise thickness control, critical for integrating SiC into photonic devices. We achieved controlled deposition of SiC thin films on Si and SiO2-on-Si substrates at temperatures ≤700 °C, demonstrating smooth surfaces (~5 Å RMS roughness), precise thickness, undetectable hydrogen-related bonds, and extremely low optical absorption in the telecom range. Specifically, optical analysis using spectroscopic ellipsometry and three different fitting models—Tauc-Lorentz, Cody-Lorentz, and Cauchy-Urbach—consistently confirmed low absorption (<200 cm−1) at telecom wavelengths (~1550 nm), high refractive indices (~2.7), and E04 optical bandgap values of ~2.3 eV. However, we emphasize that the reported extinction coefficients and corresponding absorption values depend significantly on the SE models used and are inherently limited by the sensitivity of ellipsometry in probing extremely low k values. To this end, the trends in the SE absorption data were correlated with PLE measurements in the telecom C-band to probe absorption characteristics directly. Collectively, this work establishes a scalable and robust pathway for the hybrid and heterogeneous integration of CMOS-compatible SiC-based photonic devices, directly overcoming materials-related barriers to improved device performance.

Supplementary Materials

The following supporting information can be downloaded at: https://www.mdpi.com/article/10.3390/app15158603/s1, Figure S1: A.i. Selected area electron diffraction (SAED) patterns revealed similar results with concentric rings corresponding to the (111), (200), (220), and (311) planes of the c-SiC sample, respectively. A.ii. High-resolution transmission electron microscopy (HRTEM) yielded a d-spacing value of 2.56 Å, consistent with the (111) orientation of the 3C-SiC film B. Cross-SEM images showing the high-quality SiC/Si interface and uniformity of the a- and c-SiC (polycrystalline 3C-SiC) thin films deposited at 650 °C. The thickness measured from the images of AD (i) and A3 annealed (ii) samples indicates a densification of ~20% after annealing.; Table S1: Fitting parameters and SE results from three different models for the sample deposited at 650 °C; Table S2: Fitting parameters and SE results from three different models for the sample deposited at 700 °C; Table S3: SE results from three different models for the reference 25 nm SiO2 on Si sample; Figure S2: Raman spectrum of 650AD (i) and 700AD (ii), recorded using a 532 nm excitation laser (exposure time of 15 s, 15 accumulations) in a spectral range of 200–2000 cm−1. For the 650AD sample, a broad peak was observed around 1300–1500 cm−1, revealing the presence of C-C bonds in the film.

Author Contributions

Conceptualization, S.G.; methodology, S.G., S.D., and A.K.; investigation, S.D. (CVD fabrication, SE, FTIR, XPS, AFM, XRD, and HRTEM), A.K. (CVD fabrication, SE, and PLE), A.N. (AFM, SEM, and Raman), and S.G. (CVD fabrication, SE, FTIR, and PLE); writing—original draft preparation, S.D., A.K., and S.G.; writing—review and editing, S.D., A.K., and S.G.; supervision, S.G. All authors have read and agreed to the published version of the manuscript.

Funding

This research was funded by Gelest, a Group Company of the Mitsubishi Chemical Group. This material is also based upon work partially supported by the National Science Foundation under Grant No. 2138174-QuIC-TAQS. This work was also supported by the College of Nanotechnology, Science, and Engineering of the University (CNSE) at Albany and by the CATN2 (Center for Advanced Technology in Nanomaterials and Nanoelectronics) Matching Investment Program (MIP).

Institutional Review Board Statement

Not applicable.

Informed Consent Statement

Not applicable

Data Availability Statement

The original contributions presented in this study are included in the article and Supplementary Materials. Further inquiries can be directed to the corresponding author.

Acknowledgments

We acknowledge Sandra Schujman and Kevin Musick at the New York Center for Research, Economic Advancement, Technology, Engineering, and Science (NY CREATES) for the XPS and HRTEM measurements, respectively. We also acknowledge Nina Hong from J. A. Woollam Co., Inc. for her valuable input regarding the sensitivity of SE measurements and CompleteEASE software version 6.73.

Conflicts of Interest

The authors declare no conflicts of interest.

References

  1. Yi, A.; Wang, C.; Zhou, L.; Zhu, Y.; Zhang, S.; You, T.; Ou, X. Silicon carbide for integrated photonics. Appl. Phys. Rev. 2022, 9, 031302. [Google Scholar] [CrossRef]
  2. Castelletto, S.; Peruzzo, A.; Bonato, C.; Johnson, B.C.; Radulaski, M.; Ou, H.; Wrachtrup, J. Silicon carbide photonics bridging quantum technology. ACS Photonics 2022, 9, 1434–1457. [Google Scholar] [CrossRef]
  3. Ou, H.; Shi, X.; Lu, Y.; Kollmuss, M.; Steiner, J.; Tabouret, V.; Chaussende, D. Novel photonic applications of silicon carbide. Materials 2023, 16, 1014. [Google Scholar] [CrossRef] [PubMed]
  4. Yamamoto, Y.; Sasaki, M.; Takesue, H. Quantum information science and technology in Japan. Quantum Sci. Technol. 2019, 4, 020502. [Google Scholar] [CrossRef]
  5. De Leonardis, F.; Soref, R.A.; Passaro, V.M. Dispersion of nonresonant third-order nonlinearities in silicon carbide. Sci. Rep. 2017, 7, 40924. [Google Scholar] [CrossRef]
  6. Tabassum, N.; Kotha, M.; Kaushik, V.; Ford, B.; Dey, S.; Crawford, E.; Gallis, S. On-demand CMOS-compatible fabrication of ultrathin self-aligned SiC nanowire arrays. Nanomaterials 2018, 8, 906. [Google Scholar] [CrossRef]
  7. Tabassum, N.; Nikas, V.; Kaloyeros, A.E.; Kaushik, V.; Crawford, E.; Huang, M.; Gallis, S. Engineered telecom emission and controlled positioning of Er3+ enabled by SiC nanophotonic structures. Nanophotonics 2020, 9, 1425–1437. [Google Scholar] [CrossRef]
  8. Kaloyeros, A.E.; Gallis, S. Polarization-dependent photoluminescence properties of fab-compatible nanowire-based nanophotonic structures. Appl. Phys. Lett. 2022, 120, 231101. [Google Scholar] [CrossRef]
  9. Lohrmann, A.; Johnson, B.C.; McCallum, J.C.; Castelletto, S. A review on single photon sources in silicon carbide. Rep. Prog. Phys. 2017, 80, 034502. [Google Scholar] [CrossRef]
  10. Wang, J.; Zhou, Y.; Wang, Z.; Rasmita, A.; Yang, J.; Li, X.; Gao, W. Bright room temperature single photon source at telecom range in cubic silicon carbide. Nat. Commun. 2018, 9, 4106. [Google Scholar] [CrossRef]
  11. Tarasenko, S.A.; Poshakinskiy, A.V.; Simin, D.; Soltamov, V.A.; Mokhov, E.N.; Baranov, P.G.; Astakhov, G.V. Spin and optical properties of silicon vacancies in silicon carbide—A review. Phys. Status Solidi B 2018, 255, 1700258. [Google Scholar] [CrossRef]
  12. Castelletto, S.; Lew, C.T.; Lin, W.X.; Xu, J.S. Quantum systems in silicon carbide for sensing applications. Rep. Prog. Phys. 2023, 87, 014501. [Google Scholar] [CrossRef]
  13. Xu, J.S.; Li, C.F.; Guo, G.C. Silicon carbide based quantum networking. Fundam. Res. 2021, 1, 220–222. [Google Scholar] [CrossRef]
  14. Mahmoodi, M.; Ghazanfari, L. Fundamentals of Biomedical Applications of Biomorphic SiC; INTECH Open Access Publisher: Rijeka, Croatia, 2011. [Google Scholar]
  15. Gabriel, G.; Erill, I.; Caro, J.; Gómez, R.; Riera, D.; Villa, R.; Godignon, P. Manufacturing and full characterization of silicon carbide-based multi-sensor micro-probes for biomedical applications. Microelectron. J. 2007, 38, 406–415. [Google Scholar] [CrossRef]
  16. Myers, D.R. Silicon carbide resonant tuning fork for microsensing applications in high-temperature and high G-shock environments. J. Micro/Nanolithogr. MEMS MOEMS 2009, 8, 021116. [Google Scholar] [CrossRef]
  17. Lu, X.; Lee, J.Y.; Feng, P.X.L.; Lin, Q. High Q silicon carbide microdisk resonator. Appl. Phys. Lett. 2014, 104, 181103. [Google Scholar] [CrossRef]
  18. Zhao, L.X.; Yang, L.; Wu, H.W. High quality 4H-SiC homo-epitaxial wafer using the optimal C/Si ratio. J. Cryst. Growth 2020, 530, 125302. [Google Scholar] [CrossRef]
  19. Lee, J.Y.; Lu, X.; Lin, Q. High-Q silicon carbide photonic-crystal cavities. Appl. Phys. Lett. 2015, 106, 041106. [Google Scholar] [CrossRef]
  20. Li, J.; Zhang, Q.; Wang, J.; Poon, A.W. An integrated 3C-silicon carbide-on-insulator photonic platform for nonlinear and quantum light sources. Commun. Phys. 2024, 7, 125. [Google Scholar] [CrossRef]
  21. Powell, K.; Li, L.; Shams-Ansari, A.; Wang, J.; Meng, D.; Sinclair, N.; Deng, J.; Lončar, M.; Yi, X. Integrated silicon carbide electro-optic modulator. Nat. Commun. 2022, 13, 1851. [Google Scholar] [CrossRef]
  22. Lukin, D.M.; Dory, C.; Guidry, M.A.; Yang, K.Y.; Mishra, S.D.; Trivedi, R.; Vučković, J. 4H-silicon-carbide-on-insulator for integrated quantum and nonlinear photonics. Nat. Photonics 2020, 14, 330–334. [Google Scholar] [CrossRef]
  23. Xing, P.; Ma, D.; Ooi, K.J.; Choi, J.W.; Agarwal, A.M.; Tan, D. CMOS-compatible PECVD silicon carbide platform for linear and nonlinear optics. ACS Photonics 2019, 6, 1162–1167. [Google Scholar] [CrossRef]
  24. Lopez-Rodriguez, B.; Van Der Kolk, R.; Aggarwal, S.; Sharma, N.; Li, Z.; Van Der Plaats, D.; Zadeh, I.E. High-quality amorphous silicon carbide for hybrid photonic integration deposited at a low temperature. ACS Photonics 2023, 10, 3748–3754. [Google Scholar] [CrossRef] [PubMed]
  25. Pizzagalli, L.; Cicero, G.; Catellani, A. Theoretical investigations of a highly mismatched interface: SiC/Si (001). Phys. Rev. B 2003, 68, 195302. [Google Scholar] [CrossRef]
  26. Chen, C.; Chen, Y.; Fang, Z.; Ge, R.; Wu, J.; Chen, X. Hybrid material integration for active photonic applications. APL Photonics 2024, 9, 030901. [Google Scholar] [CrossRef]
  27. Fan, T.; Wu, X.; Eftekhar, A.A.; Bosi, M.; Moradinejad, H.; Woods, E.V.; Adibi, A. High-quality integrated microdisk resonators in the visible-to-near-infrared wavelength range on a 3C-silicon carbide-on-insulator platform. Opt. Lett. 2020, 45, 153–156. [Google Scholar] [CrossRef]
  28. Wang, C.; Li, J.; Yi, A.; Fang, Z.; Zhou, L.; Wang, Z.; Ou, X. Soliton formation and spectral translation into visible on CMOS-compatible 4H-silicon-carbide-on-insulator platform. Light Sci. Appl. 2022, 11, 341. [Google Scholar] [CrossRef]
  29. DeVault, C.T.; Deckoff-Jones, S.; Liu, Y.; Hammock, I.N.; Sullivan, S.E.; Dibos, A.; High, A.A. Silicon-on-silicon carbide platform for integrated photonics. Adv. Opt. Mater. 2024, 12, 2401101. [Google Scholar] [CrossRef]
  30. Li, Z.; Sharma, N.; Lopez-Rodriguez, B.; van der Kolk, R.; Scholte, T.; Voncken, H.; Zadeh, I.E. Heterogeneous integration of amorphous silicon carbide on thin film lithium niobate. APL Photonics 2025, 10, 010101. [Google Scholar] [CrossRef]
  31. Shekhar, S.; Bogaerts, W.; Chrostowski, L.; Bowers, J.E.; Hochberg, M.; Soref, R.; Shastri, B.J. Road mapping the next generation of silicon photonics. Nat. Commun. 2024, 15, 751. [Google Scholar] [CrossRef]
  32. Jin, W.; Yang, Q.F.; Chang, L.; Shen, B.; Wang, H.; Leal, M.A.; Wu, L.; Gao, M.; Feshali, A.; Paniccia, M.; et al. Hertz-Linewidth Semiconductor Lasers Using CMOS-Ready Ultra-High-Q Microresonators. Nat. Photonics 2021, 15, 346–353. [Google Scholar] [CrossRef]
  33. Pfeiffer, M.H.; Liu, J.; Raja, A.S.; Morais, T.; Ghadiani, B.; Kippenberg, T.J. Ultra-Smooth Silicon Nitride Waveguides Based on the Damascene Reflow Process: Fabrication and Loss Origins. Optica 2018, 5, 884–892. [Google Scholar] [CrossRef]
  34. Kaloyeros, A.; Dutta, S.; Gallis, S. Engineering and polarization properties of erbium-implanted lithium niobate films for integrated quantum applications. APL Mater. 2024, 12, 111101. [Google Scholar] [CrossRef]
  35. Kaloyeros, A.E.; Goff, J.; Arkles, B. Defect- and H-free stoichiometric silicon carbide by thermal CVD from the single source precursor trisilacyclohexane. Electron. Mater. 2022, 3, 27–40. [Google Scholar] [CrossRef]
  36. Bhaviripudi, S.; Jia, X.; Dresselhaus, M.S.; Kong, J. Role of kinetic factors in chemical vapor deposition synthesis of uniform large area graphene using copper catalyst. Nano Lett. 2010, 10, 4128–4133. [Google Scholar] [CrossRef]
  37. Chen, W.; Xie, X.N.; Xu, H.; Wee, A.T.S.; Loh, K.P. Atomic scale oxidation of silicon nanoclusters on silicon carbide surfaces. J. Phys. Chem. B 2003, 107, 11597–11603. [Google Scholar] [CrossRef]
  38. Gallis, S.; Nikas, V.; Huang, M.; Eisenbraun, E.; Kaloyeros, A.E. Comparative study of the effects of thermal treatment on the optical properties of hydrogenated amorphous silicon-oxycarbide. J. Appl. Phys. 2007, 102, 024302. [Google Scholar] [CrossRef]
  39. Foti, G. Silicon carbide: From amorphous to crystalline material. Appl. Surf. Sci. 2001, 184, 20–26. [Google Scholar] [CrossRef]
  40. Ishimaru, M.; Bae, I.T.; Hirotsu, Y.; Matsumura, S.; Sickafus, K.E. Structural relaxation of amorphous silicon carbide. Phys. Rev. Lett. 2002, 89, 055502. [Google Scholar] [CrossRef]
  41. Calcagno, L.; Musumeci, P.; Roccaforte, F.; Bongiorno, C.; Foti, G. Crystallisation mechanism of amorphous silicon carbide. Appl. Surf. Sci. 2001, 184, 123–127. [Google Scholar] [CrossRef]
  42. Tolstoy, V.P.; Chernyshova, I.; Skryshevsky, V.A. Handbook of Infrared Spectroscopy of Ultrathin Films; John Wiley & Sons: Hoboken, NJ, USA, 2003. [Google Scholar]
  43. Abdurazik, D. Fourier Transform Infrared Spectroscopy (FTIR) Analysis of Silicon Carbide Nanowires. Master’s Thesis, Ankara Üniversitesi, Ankara, Turkey, 2016. [Google Scholar]
  44. Huseynov, E.M. Investigation of the agglomeration and amorphous transformation effects of neutron irradiation on the nanocrystalline silicon carbide (3C-SiC) using TEM and SEM methods. Physical B 2017, 510, 99–103. [Google Scholar] [CrossRef]
  45. Di, M.; Bersch, E.; Diebold, A.C.; Consiglio, S.; Clark, R.D.; Leusink, G.J.; Kaack, T. Comparison of methods to determine bandgaps of ultrathin HfO2 films using spectroscopic ellipsometry. J. Vac. Sci. Technol. A 2011, 29, 041001. [Google Scholar] [CrossRef]
  46. Tauc, J.; Grigorovici, R.; Vancu, A. Optical properties and electronic structure of amorphous germanium. Phys. Status Solidi B 1966, 15, 627–637. [Google Scholar] [CrossRef]
  47. Diebold, A.C.; Antonelli, A.; Keller, N. Perspective: Optical measurement of feature dimensions and shapes by scatterometry. APL Mater. 2018, 6, 058201. [Google Scholar] [CrossRef]
  48. Kalas, B.; Zolnai, Z.; Sáfrán, G.; Serényi, M.; Agocs, E.; Lohner, T.; Petrik, P. Micro-combinatorial sampling of the optical properties of hydrogenated amorphous Si1−xGex for the entire range of compositions towards a database for optoelectronics. Sci. Rep. 2020, 10, 19266. [Google Scholar] [CrossRef]
  49. Ferlauto, A.S.; Ferreira, G.M.; Pearce, J.M.; Wronski, C.R.; Collins, R.W.; Deng, X.; Ganguly, G. Analytical model for the optical functions of amorphous semiconductors from the near-infrared to ultraviolet: Applications in thin film photovoltaics. J. Appl. Phys. 2002, 92, 2424–2436. [Google Scholar] [CrossRef]
  50. Liu, H.; Li, S.; Sun, P.; Yang, X.; Liu, D.; Ji, Y.; Cui, Y. Study on characterization method of optical constants of germanium thin films from absorption to transparent region. Mater. Sci. Semicond. Process. 2018, 83, 58–62. [Google Scholar] [CrossRef]
  51. Pavunny, S.P.; Thomas, R.; Katiyar, R.S. Cauchy-Urbach dielectric function modeling of amorphous high-k LaGdO3 films. ECS Trans. 2012, 45, 219–229. [Google Scholar] [CrossRef]
  52. Andreoli, F.; Gullans, M.J.; High, A.A.; Browaeys, A.; Chang, D.E. Maximum refractive index of an atomic medium. Phys. Rev. X 2021, 11, 011026. [Google Scholar] [CrossRef]
  53. Kim, H.K.; Shi, F.G. Refractive index of polycrystalline submicrometer polymer thin films: Thickness dependence. J. Mater. Sci. Mater. Electron. 2001, 12, 361–364. [Google Scholar] [CrossRef]
  54. Luusua, H.; Gädda, T.; Salunke, J.; Han, Z.; Kekkonen, H.; Rantala, J.; Liu, G. A design approach for ultra-low-k dielectric organosiloxane polymers. In Proceedings of the 2024 IEEE International Interconnect Technology Conference (IITC), San Jose, CA, USA, 3–6 June 2024; pp. 1–3. [Google Scholar]
  55. Fujiwara, H. Spectroscopic Ellipsometry: Principles and Applications; John Wiley & Sons: Hoboken, NJ, USA, 2007. [Google Scholar]
  56. Pliskin, W.A.; Esch, R.P. Refractive index of SiO2 films grown on silicon. J. Appl. Phys. 1965, 36, 2011–2013. [Google Scholar] [CrossRef]
  57. Klein, J.; Kampermann, L.; Mockenhaupt, B.; Behrens, M.; Strunk, J.; Bacher, G. Limitations of the Tauc plot method. Adv. Funct. Mater. 2023, 33, 2304523. [Google Scholar] [CrossRef]
  58. Zanatta, A.R. Revisiting the optical bandgap of semiconductors and the proposal of a unified methodology to its determination. Sci. Rep. 2019, 9, 11225. [Google Scholar] [CrossRef] [PubMed]
  59. Larruquert, J.I.; Pérez-Marín, A.P.; García-Cortés, S.; Rodríguez-de Marcos, L.; Aznárez, J.A.; Méndez, J.A. Self-consistent optical constants of SiC thin films. J. Opt. Soc. Am. A 2011, 28, 2340–2345. [Google Scholar] [CrossRef]
  60. Vedula, R.P.; Anderson, N.L.; Strachan, A. Effect of topological disorder on structural, mechanical, and electronic properties of amorphous silicon nitride: An atomistic study. Phys. Rev. B 2012, 85, 205209. [Google Scholar] [CrossRef]
  61. Nguyen-Tran, T.; Suendo, V.; Roca i Cabarrocas, P. Optical study of disorder and defects in hydrogenated amorphous silicon carbon alloys. Appl. Phys. Lett. 2005, 87, 011903. [Google Scholar] [CrossRef]
  62. Fanchini, G.; Tagliaferro, A. Disorder and Urbach energy in hydrogenated amorphous carbon: A phenomenological model. Appl. Phys. Lett. 2004, 85, 730–732. [Google Scholar] [CrossRef]
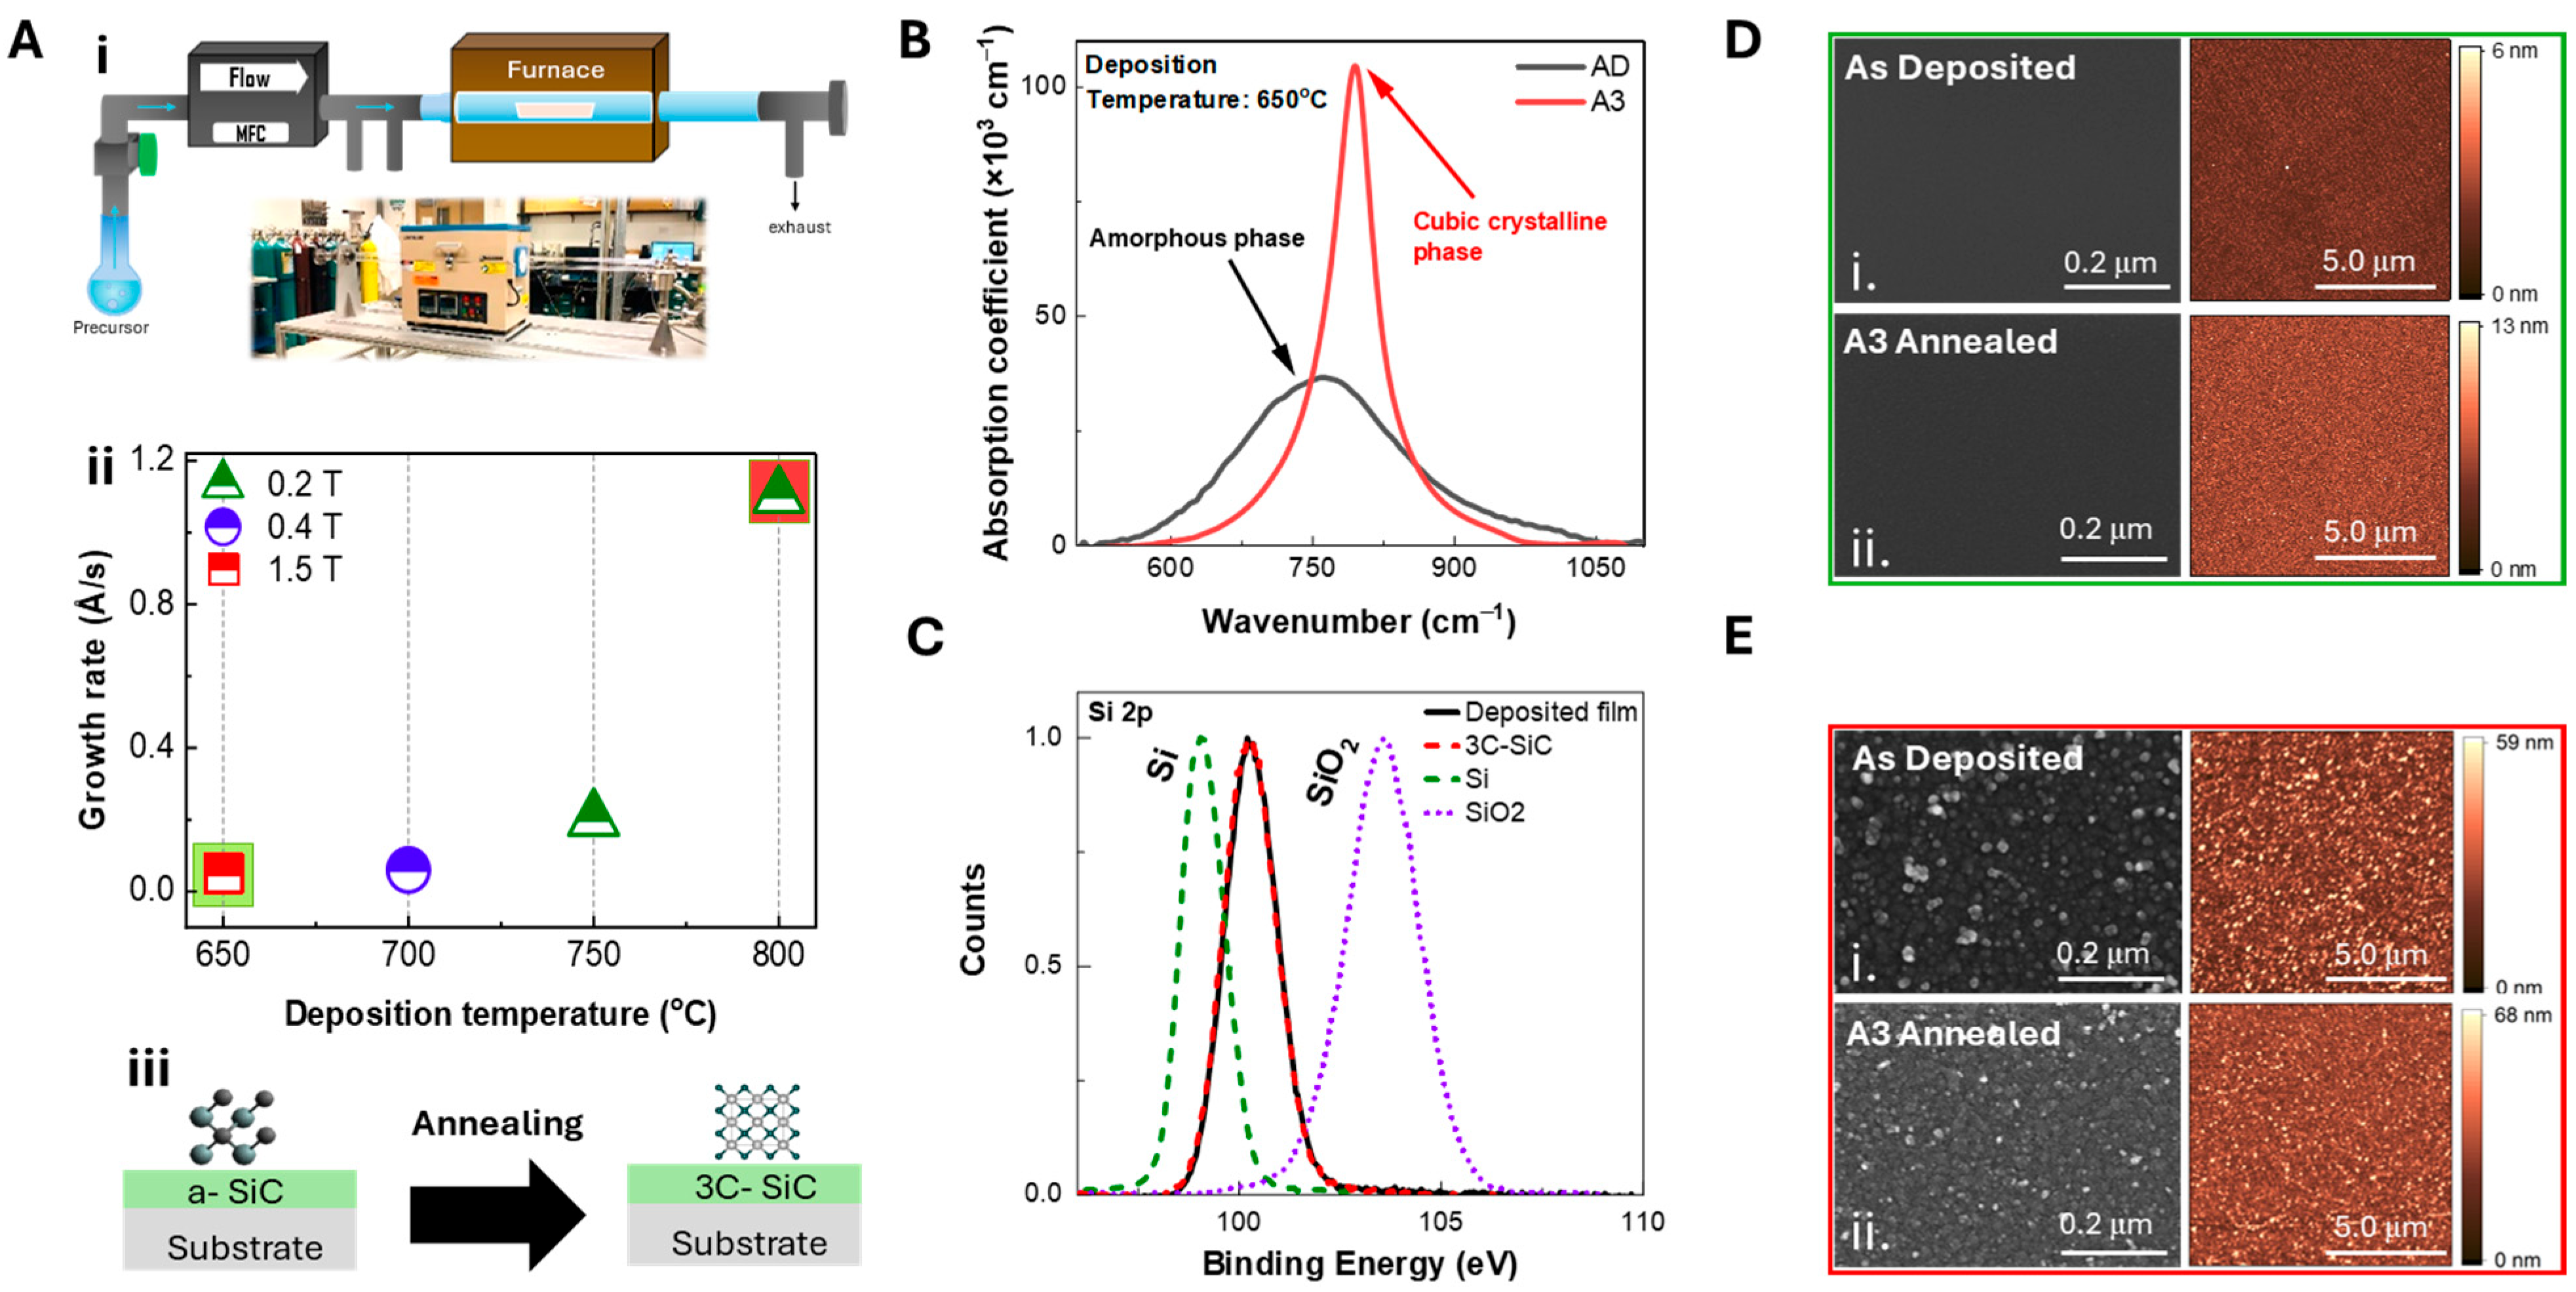
Figure 1. Chemical vapor deposition (CVD) system and characterization of film growth, composition, and morphology. (A) (i) Schematic of the custom hot-wall quartz tube CVD and annealing system. (ii) SiC film growth rate as a function of deposition temperature under process-specific pressures (0.2 T, 0.4 T, and 1.5 T). (iii) Thermal annealing transforms amorphous SiC (a-SiC) deposited at 650 °C (green) into cubic crystalline SiC (3C-SiC). (B) Evolution of the Si–C stretching mode FTIR peak from the AD to A3 annealing, reflecting changes in crystallinity and peak position. (C) XPS spectra of the Si 2p peak for the deposited SiC film (black) compared to reference spectra (3C-SiC (red dashed), Si (green dashed), and SiO2 (purple dotted)) showing a binding energy near ~100.3 eV that matches the 3C-SiC reference and confirms Si–C bonding. (D) SEM and AFM images of (i) AD and (ii) A3 annealed SiC films deposited at 650 °C, and (E) corresponding SEM and AFM analysis for (i) AD and (ii) A3 annealed films deposited at 800 °C.
Applsci 15 08603 g001
Figure 2. Surface morphology and substrate dependency of a-SiC films with different thicknesses: (A) SEM images and corresponding 2D AFM scans of films below 100 nm on Si (100), Si (111), and SiO2 substrates ((i)–(iii)), and films above 200 nm on Si (111) (iv). AFM scans highlight substrate-independent morphology variations. (B) (i) RMS roughness values for a-SiC films deposited on different substrates (Si (100), Si (111), SiO2) vary between ~5–8 Å, indicating minimal impact of substrate choice and thickness on the film quality. Transformation of a- to c-SiC after A3 annealing slightly increases the roughness to ~15 Å. All films were deposited at temperatures of 650 °C and 700 °C. (ii) Optical image of the sample deposited at 650 °C showing uniformity of the thickness of the film.
Applsci 15 08603 g002
Figure 3. FTIR compositional analysis of the films deposited at different temperatures. (A) Normalized absorption spectra of the Si–C stretching mode for (i) as-deposited and (ii) A3-annealed SiC samples grown at 650 °C and 800 °C, highlighting spectral shifts and intensity variations. Deconvolution of the Si–C absorption band for (iii) A2 annealed 700 °C sample applying Lorentz-Gaussian fit indicates the presence of both amorphous and crystalline phases, and (iv) A3 annealed sample using Lorentz fit indicates the cubic crystalline phase. (B) Quantitative presence of (i) Si–H (2000–2300 cm−1) and (ii) C-H bonds (2800–3100 cm−1) in A1- and A2-annealed SiC thin films. (C) XPS atomic concentrations for C1s and Si2p in as-deposited SiC films grown at 650 °C and 800 °C, showing stoichiometry. (D) Analysis of (i) Integrated Si–C bond area (700–815 cm−1), (ii) Si–C stretching mode peak position, (iii) full width at half maximum (FWHM), and (iv) percentage of crystallinity for as-deposited and annealed SiC thin films as a function of deposition and annealing conditions.
Applsci 15 08603 g003
Figure 4. Spectroscopic ellipsometry of the SiC films: (A) Schematic illustration of mobility edge, optical gap (Eg), and band-tail states (Eu) in the energy (E) vs. density of states (DOS) diagram. The adjacent energy vs. absorption (α) plot highlights the need for multiple models to describe absorption across different energy ranges. Inset: Comparison of model assumptions—while the Tauc-Lorentz (TL) model imposes zero absorption for E < Eg, the CL and CU models capture non-zero sub-gap absorption associated with Urbach tail transitions, with the CU model typically yielding a higher absorption near the optical bandgap. (B) Refractive index (n) and extinction coefficient (k) extracted from CL and TL fittings for AD and A3-annealed SiC films grown at (i) 650 °C and (ii) 700 °C, measured across the UV-Visible-NIR range. Inset: Data obtained from CU fitting. (C) Absorption coefficient in the energy range 1–3.75 eV, which is used to extract E04 values. (D) In the sub-bandgap Urbach tail region (0.7–1.1 eV), absorption is modeled using the CL and CU models. A standard 25 nm SiO2/Si reference sample is fitted by CU and CL models for reference. (E) Tauc’s plots with linear fits (dotted lines) used to extract Tauc’s optical gap (Eg,Tauc).
Applsci 15 08603 g004
Figure 5. Telecom absorption characteristics of SiC films. (A) Comparison between Eg + Et and E04 values extracted from the CL model and TL/CL models, respectively. (B) Absorption coefficient at 1550 nm calculated using the CL and CU models for all AD and annealed samples, which shows all absorption values are below ~103 cm−1. (C) (i) Resonant PLE spectra across the telecom C-band of the 650 °C AD, 700 °C AD, and 700 °C A2 SiC films, along with SiO2 as a reference. PLE intensities are consistent with SE-derived absorption trends. Intensity mappings over 5 × 5 μm2 regions for the (ii) 650 °C and (iii) 700 °C AD samples demonstrate spatial uniformity of the results. (D) Relative comparison of Eu extracted from the CU and CL models for AD and annealed samples. Symbol size reflects the associated error (10−4). (E) Correlation between Eu values and the FWHM of the Si-C peak (~790 cm−1) from FTIR analysis of (i) 650°C and (ii) 700°C SiC films. (F) Comparison of figures of merit (FOMs) from this work with the best reported values in the literature.
Applsci 15 08603 g005
Table 1. Summary analysis of AD and annealed samples deposited at 650 °C and 700 °C.
Deposition Temp.(°C)AnnealingModelTauc’s Optical Gap (eV)E04(eV)n @ 1550 nmk @ 1550 nmAbs. Coeff.@ 1550 nm (cm−1)
650ADTL2.02.32.5700
CL2.12.32.561.5 × 10−3121
CauchyNANA2.5611.8 × 10−3957
700TL2.12.42.6600
CL2.12.42.674.0 × 10−60
CauchyNANA2.596.6 × 10−3539
650A1TL2.12.42.6500
CL2.02.42.655.1 × 10−441
CauchyNANA2.654.8 × 10−3389
700 TL2.02.32.7600
CL2.12.32.766.3 × 10−55
CauchyNANA2.662.2 × 10−3182
650A2TL2.02.32.7300
CL2.02.32.733.4 × 10−427
CauchyNANA2.7219.1 × 10−31546
700TL2.02.32.7300
CL2.12.42.732.6 × 10−52
CauchyNANA2.581.3 × 10−3105
650A3TL2.02.42.7300
CL2.02.42.735.0 × 10−54
CauchyNANA2.7214.0 × 10−31135
700TL2.12.52.6900
CL2.02.42.681.9 × 10−3160
CauchyNANA2.6428.2 × 10−32200
Disclaimer/Publisher’s Note: The statements, opinions and data contained in all publications are solely those of the individual author(s) and contributor(s) and not of MDPI and/or the editor(s). MDPI and/or the editor(s) disclaim responsibility for any injury to people or property resulting from any ideas, methods, instructions or products referred to in the content.