Systematic Review

The Effects of Nutritional Education and School-Based Exercise Intervention Programs on Preschool and Primary School Children’s Cardiometabolic Biomarkers: A Systematic Review of Randomized Controlled Trials

by
Markel Rico-González
1,
Daniel González-Devesa
2,*,
Carlos D. Gómez-Carmona
3,4,5,* and
Adrián Moreno-Villanueva
5,6
1
Department of Didactics of Music, Plastic and Body Expression, University of the Basque Country (UPV-EHU), 48940 Leioa, Spain
2
Research Group on Physical Activity, Education, and Health (GIAFES), Catholic University of Ávila, 05005 Ávila, Spain
3
Research Group in Training, Physical Activity and Sports Performance (ENFYRED), Department of Music, Plastic and Body Expression, University of Zaragoza, 44003 Teruel, Spain
4
Research Group in Training Optimization and Sports Performance (GOERD), University of Extremadura, 10005 Caceres, Spain
5
BioVetMed & SportSci Research Group, University of Murcia, 30001 Murcia, Spain
6
Faculty of Health Science, University Isabel I, 09003 Burgos, Spain
*
Authors to whom correspondence should be addressed.
Appl. Sci. 2025, 15(15), 8564; https://doi.org/10.3390/app15158564 (registering DOI)
Submission received: 2 July 2025 / Revised: 29 July 2025 / Accepted: 31 July 2025 / Published: 1 August 2025
(This article belongs to the Special Issue Research of Sports Medicine and Health Care: Second Edition)

Abstract

Childhood obesity increases chronic disease risk, but no comprehensive synthesis has evaluated the impact of school-based combined nutrition education and physical activity interventions on cardiometabolic biomarkers in children aged 3 to 12 years. This systematic review was conducted in accordance with PRISMA guidelines and registered in PROSPERO (CRD420251085194). Five databases were systematically searched through June 2025. Twelve randomized controlled trials involving 18,231 children were included and assessed using the PEDro scale. Ten trials demonstrated significant improvements in at least one cardiometabolic biomarker. Blood pressure (8 studies) outcomes showed systolic reductions of 1.41–6.0 mmHg in six studies. Glucose metabolism (5 studies) improved in two studies with reductions of 0.20–0.22 mmol/L. Lipid profiles (7 studies) improved in three studies, including total cholesterol (−0.32 mmol/L). Insulin levels (5 studies) decreased significantly in two investigations. Anthropometric improvements included BMI and body fat. Physical activity increased by >45 min/week and dietary habits improved significantly. Programs with daily implementation (90-min sessions 4x/week), longer duration (≥12 months), family involvement (parent education), and curriculum integration (classroom lessons) showed superior effectiveness. Interventions targeting children with overweight/obesity demonstrated higher changes compared to the general population. However, methodological limitations included a lack of assessor blinding, absence of subject/therapist blinding, and inadequate retention rates. School-based interventions combining nutrition and physical activity can produce significant improvements in cardiometabolic biomarkers, supporting comprehensive, sustained multicomponent programs for early chronic disease prevention.

1. Introduction

Child and adolescent overweight and obesity constitute a rapidly escalating global public-health concern [1,2,3,4]. The World Health Organization estimates that, over the past three decades, the number of young people with excess body weight has more than doubled, and projections point to a continued rise [5]. Particularly alarming is the robust association between an elevated body-mass index (BMI) in childhood and the early onset of chronic diseases, type 2 diabetes, hypertension, dyslipidemia and cardiovascular disease, the effects of which persist into adulthood [6]. In addition, these consequences could be aggravated considering that up to 81% of children are inactive globally [7].
Accumulating evidence indicates that childhood adiposity predicts arterial stiffness, cardiac remodeling and subclinical atherosclerosis in later life, irrespective of subsequent changes in body weight [8,9]. Moreover, overweight sustained across the life course exerts a cumulative impact on adipokine secretion, inflammatory pathways and, potentially, endothelial function [10]. These findings highlight the urgent need for early preventive and therapeutic strategies that address not only body weight but also key cardiometabolic biomarkers, with the aim of altering the trajectory towards chronic disease before it becomes firmly established.
Adopting a physically active lifestyle in the early years is associated with a markedly higher likelihood of maintaining healthy behaviors in adulthood [11]. In this regard, the school environment represents an ideal setting for promoting healthy habits and preventing obesity, given the substantial amount of time children spend there during a particularly sensitive developmental stage [12,13]. School-based interventions commonly incorporate nutritional education and structured physical-activity programs [14,15,16].
With respect to nutrition, the extant literature supports the notion that a healthy dietary pattern exerts direct beneficial effects on various biomarkers in childhood [17,18]. Controlled trials have demonstrated significant reductions in total cholesterol, triglycerides and LDL concentrations [19,20]. Low-glycemic-load diets and appropriately balanced macronutrient distributions have also been linked to improved insulin sensitivity, especially in school-age children with elevated baseline insulin levels [21]. These effects are even more consistent when dietary counselling is initiated in early childhood and maintained throughout the primary-school years [22].
Regular physical exercise is regarded as one of the most effective adjuvant therapies for enhancing metabolic health in children with overweight or obesity [23,24,25,26]. A systematic review of 29 trials (n = 2195) showed that programs combining moderate-to-vigorous aerobic activity with resistance training significantly reduce body fat, increase VO2 max and foster a more favorable lipid profile in this population [27]. Such interventions also lower fasting insulin and the HOMA-IR index, indicating enhanced insulin sensitivity [28].
The extensive evidence supporting the benefits of physical-activity and nutritional interventions has spurred the development of multicomponent programs that integrate both elements. These interventions have yielded synergistic effects that surpass those achieved by single-component approaches in adolescents [29], adults [30] and older adults [31]. School initiatives that combine exercise and nutrition, involve parents and staff, and are grounded in theoretical frameworks have been shown to produce greater improvements in child health outcomes, including weight status [4]. Accordingly, school-based strategies that integrate daily movement and balanced nutrition emerge as essential tools for the early prevention of metabolic syndrome and other chronic conditions.
Previous systematic reviews have extensively documented the effects of school-based interventions on anthropometric and fitness outcomes, with a Cochrane review of 89 studies showing modest improvements in BMI z-scores and physical fitness through physical activity programs [32], and primary school intervention reviews demonstrating benefits for cardiovascular fitness and academic performance [33]. However, these reviews focused exclusively on physical activity interventions and anthropometric measures rather than cardiometabolic biomarkers that may provide more sensitive indicators of cardiometabolic changes before observable body composition changes occur. Furthermore, although both preschool (3–5 years) and primary school children (6–12 years) are commonly included in school-based interventions, these age groups may exhibit different physiological responses due to varying developmental stages and metabolic rates [34,35], yet limited research has systematically examined whether combined nutrition and physical activity interventions can produce significant changes in cardiometabolic biomarkers across these distinct developmental periods.
To our knowledge, no systematic review has exclusively synthesized randomized controlled trials (RCTs) that combine nutrition and exercise interventions and evaluate their impact on cardiometabolic biomarkers in children aged 3 to 12 years. Therefore, the objective of the present systematic review is to determine the effects of school-based physical-activity programs combined with nutritional education on cardiometabolic biomarkers in preschool and primary-school populations. This work aims to provide high-quality evidence to updated recommendations for the early prevention of cardiometabolic diseases and the promotion of healthy lifestyles from the earliest years of life.

2. Materials and Methods

2.1. Experimental Approach to the Problem

The present systematic review was conducted in accordance with the Preferred Reporting Items for Systematic Reviews and Meta-Analyses (PRISMA) guidelines [36] and adhered to established guidelines for conducting systematic reviews within the domain of sport sciences [37]. The review protocol was developed with the objective of ensuring comprehensive coverage of the relevant literature while maintaining methodological rigour. This systematic review was registered in PROSPERO: CRD420251085194.

2.2. Information Sources

The following bibliographic databases were consulted: Web of Sciences, PubMed, SPORTDiscus, ProQuest Central, and SCOPUS. The search encompassed all published literature prior to 10 June 2025, without language restrictions. The combination of databases was selected to ensure broad coverage of both medical and sports science literature.

2.3. Search Strategy

The PICO (Patient, Problem, or Population–Intervention or Exposure–Comparison, Control, or Comparator–Outcome[s]) framework was implemented in order to structure the search strategy and ensure systematic coverage of relevant literature. In the interest of maintaining transparency, the authors were not blinded to journal names or manuscript authors. The final search string was as follows:
(“early childhood” OR preschool OR kindergarten OR school* OR “primary education” OR “elementary education”) AND (Nutrient* OR nutrition OR food* OR DIET*) AND (exercise OR “Physical activity” OR “physical education” OR sport OR fitness OR aerobic OR movement) AND (program* OR intervention) AND (blood) AND (“randomized controlled trial*”)

2.4. Eligibility Criteria

The authors initiated the search string on databases and downloaded the title, authors’ names, journal, and date of all the articles that appeared in the search. Following the organisation of the Excel spreadsheet, the process of removing all duplicates was initiated, and the remaining articles were subjected to a rigorous evaluation to ascertain their eligibility. The specific inclusion and exclusion criteria used for study selection are detailed in Table 1.

2.5. Data Extraction

A standardised data extraction process was implemented using an Excel spreadsheet developed in accordance with the Cochrane Consumers and Communication Review Group’s data extraction template. The spreadsheet enabled a systematic evaluation of the inclusion and exclusion requirements for all the selected studies. The extraction process was conducted independently by two authors, with any disagreements being resolved through discussion until consensus was reached. A full record was kept of all articles that were not included, including the particular reasons for exclusion. The data were systematically recorded and stored in a spreadsheet.

2.6. Assessment of Study Methodology and Risk of Bias

The Physiotherapy Evidence Database (PEDro) scale was utilised to evaluate the methodological quality of pre-test post-test studies with experimental (EXP) and control (CON) groups that were randomly selected. The scale employs a range of 0 (low methodological quality) to 10 (high methodological quality) to score the internal study validity. The score that each section is awarded can range from 0 (“no”) to 1 (“yes”), depending on the quality obtained by each point. The quality of the studies were categorized according to the following cut-off points: excellent (9–10), good (6–8), fair (4–5), and poor (<3) [38]. The scale in question comprises ten items.
Additionally, the Risk of Bias 2.0 (RoB 2.0) tool was employed to provide a comprehensive assessment of bias across five key domains: randomization process, deviations from intended interventions, missing outcome data, measurement of the outcome, and selection of the reported result [39]. Each domain was evaluated and classified as “low risk,” “some concerns,” or “high risk” based on predefined criteria. Two authors conducted both PEDro and RoB 2.0 assessments (M.R.-G. and A.M.-V.), with disagreements resolved through discussion or consultation with a third author (C.D.G.-C.). The combination of both assessment tools provided a robust evaluation of study quality and internal validity, enabling a more comprehensive understanding of potential biases that could affect the reliability of the findings. Assessment of publication bias through funnel plots and Egger’s test was not conducted due to substantial methodological heterogeneity preventing formal meta-analysis.

3. Results

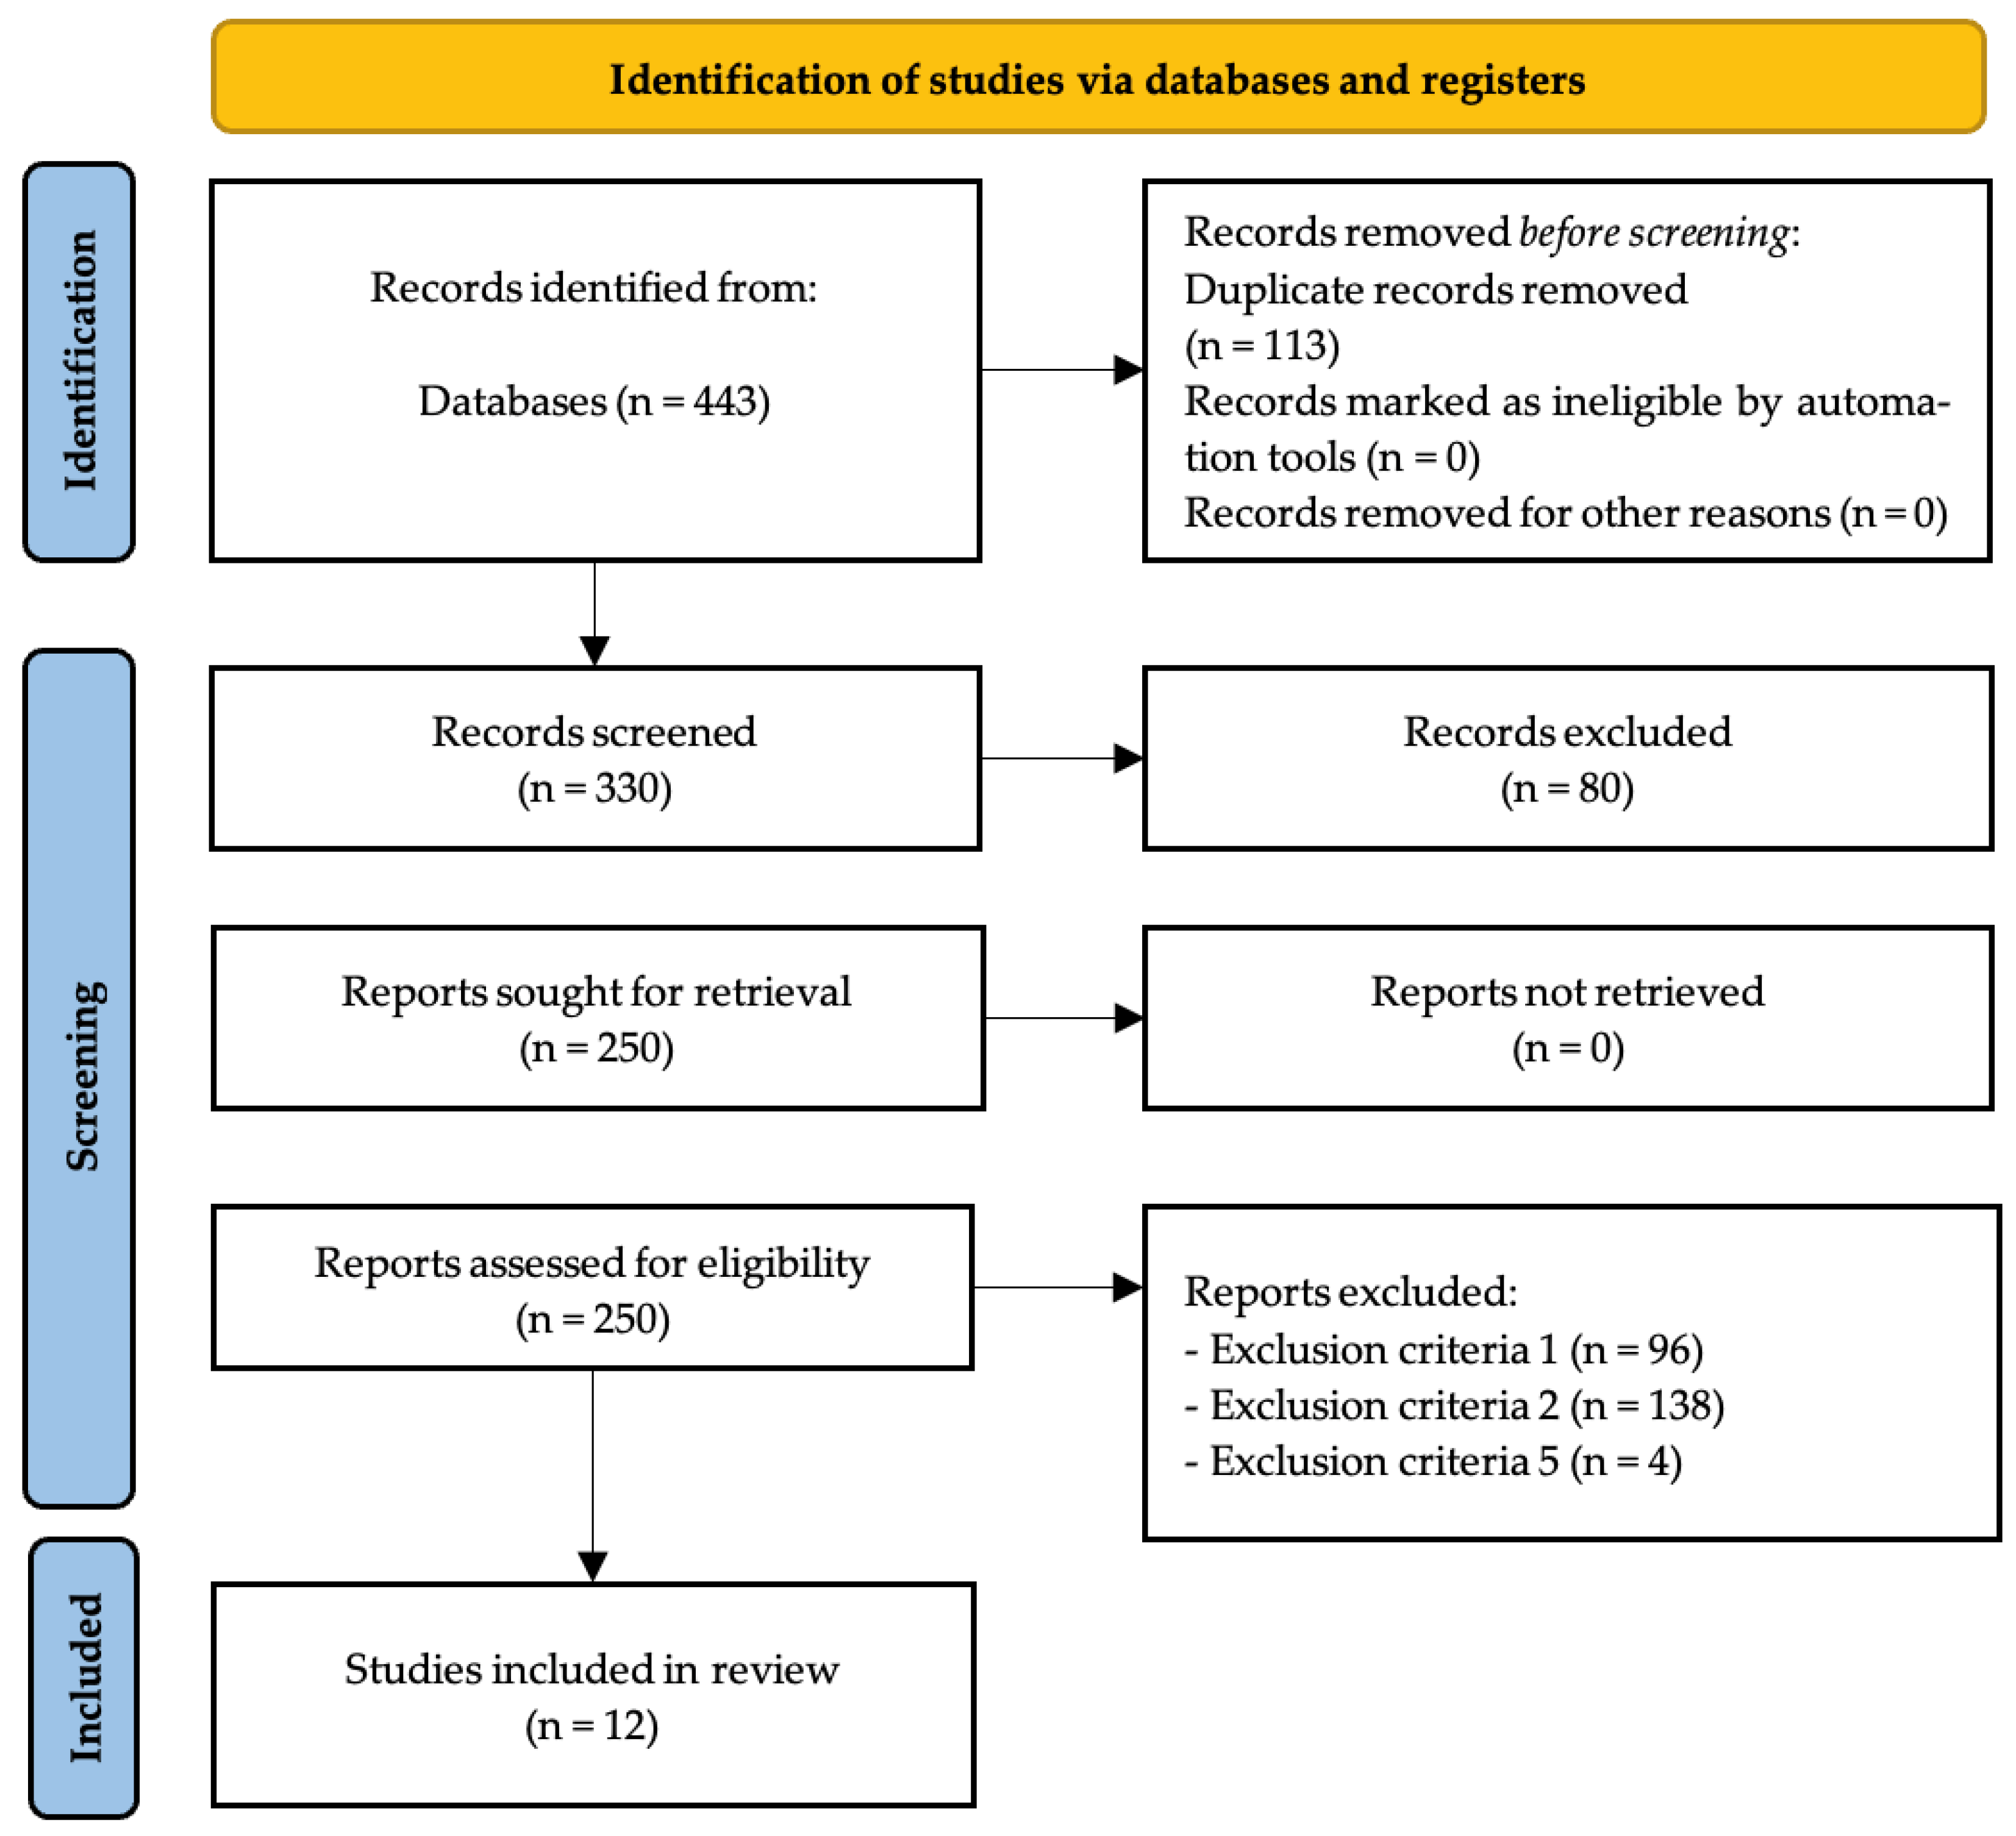
3.1. Study Selection and Inclusion Process

After analyzing all databases (WoS: 44; PubMed: 108; SPORTDiscus: 4; ProQuest Central: 10; SCOPUS: 277) the contents of 443 articles were checked, detecting, in the initial stage, 113 duplicate articles. After duplicate removal, 330 records remained for screening. Following title and abstract screening, 250 reports were sought for retrieval, with all 250 reports successfully retrieved. Full-text assessment for eligibility was conducted on these 250 reports, resulting in the exclusion of 238 reports by exclusion criteria number one (n = 96), exclusion criteria number two (n = 138) and exclusion criteria number five (n = 4). The remaining 12 articles [40,41,42,43,44,45,46,47,48,49,50,51] were included in the qualitative synthesis of the systematic review (Figure 1).

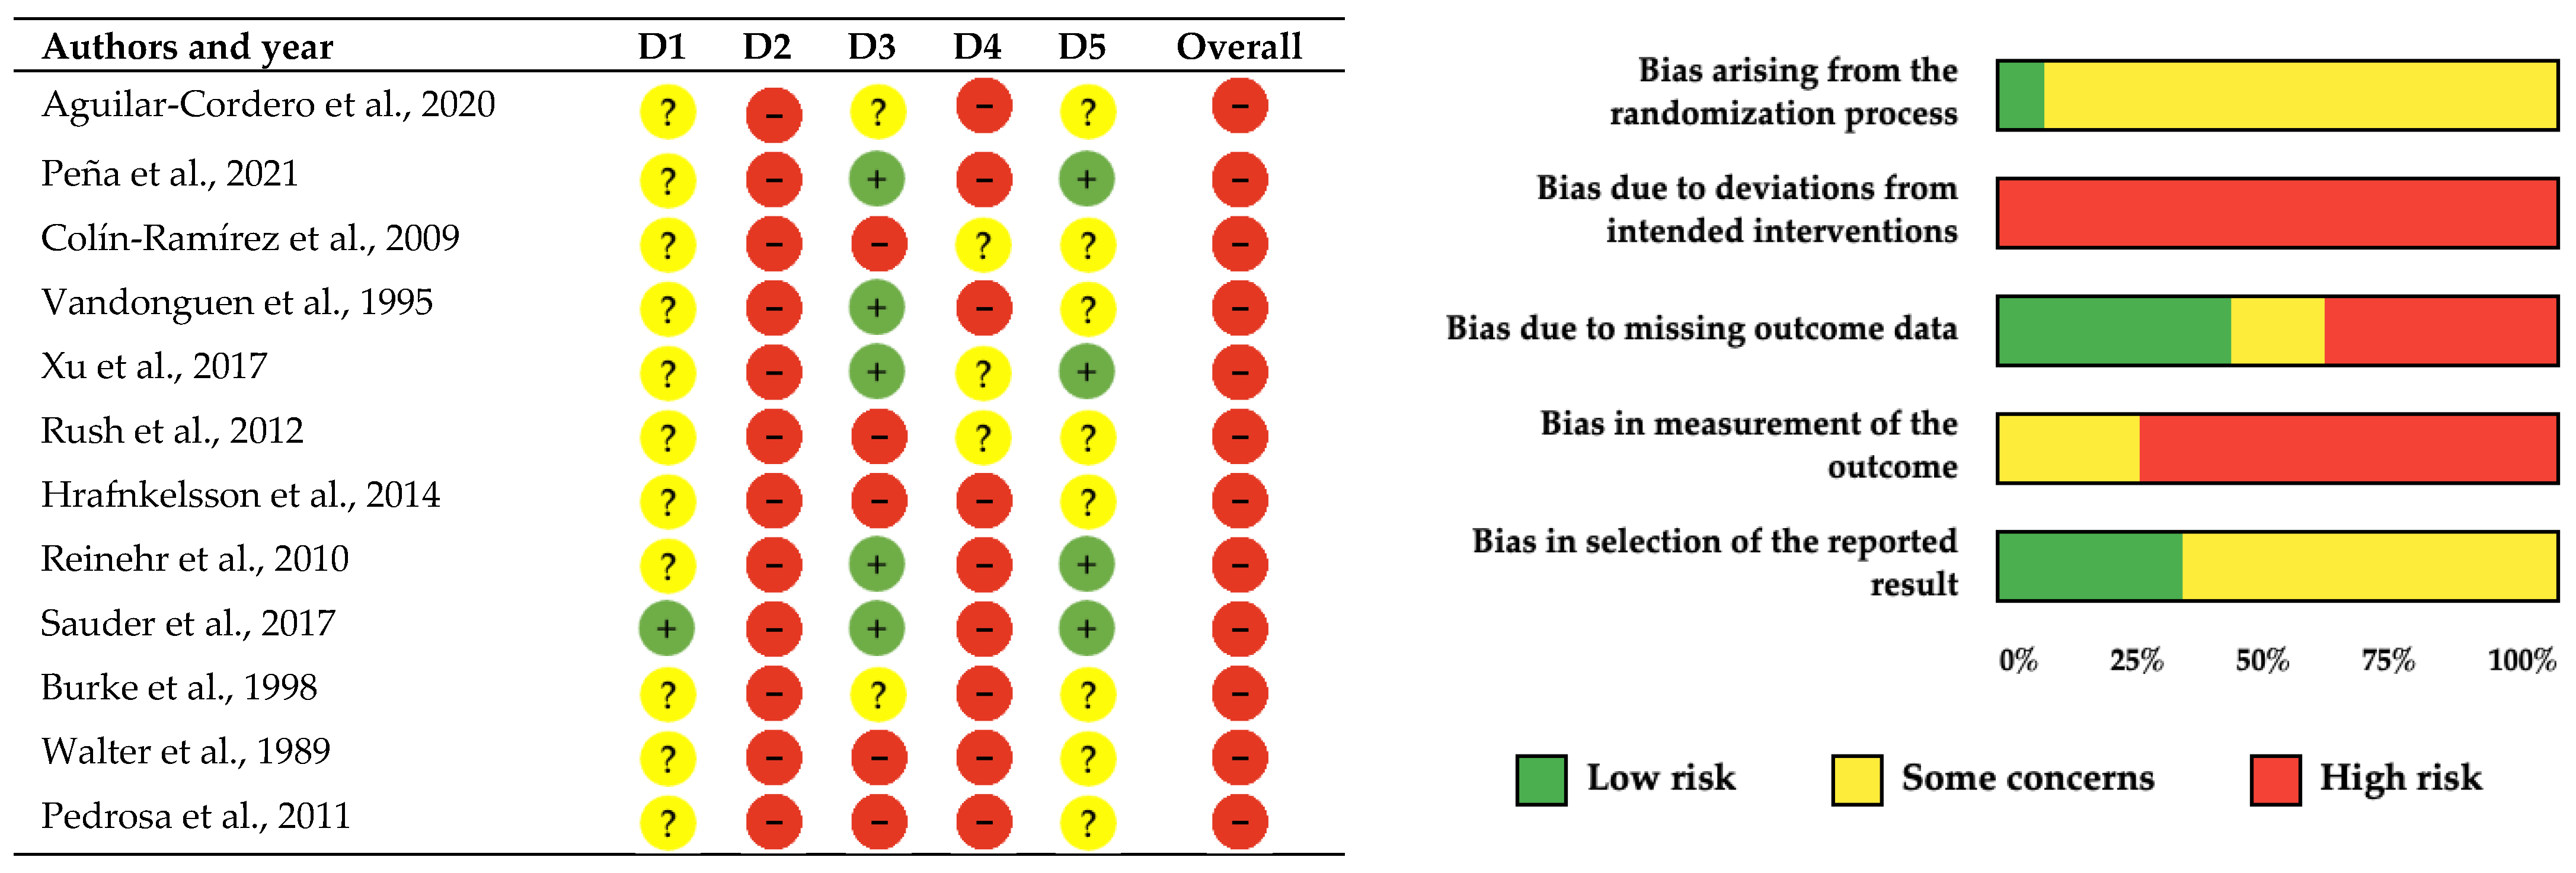
3.2. Methodological Quality and Risk of Bias Assessment

The methodological quality and risk of bias assessment of the 12 included studies was conducted using both the PEDro scale and the Cochrane Collaboration’s risk of bias tool to provide comprehensive evaluation of internal validity as suggested by recent methodological guidelines (Table 2, Figure 2). Both assessment frameworks revealed consistent patterns of methodological limitations across the evidence base. The PEDro scale evaluation showed generally satisfactory methodological quality, with five studies receiving good ratings (scores of 6–7/10) [41,43,45,48,50] and seven studies receiving fair ratings (scores of 4–5/10) [40,42,44,46,47,49,51]. The Cochrane assessment corroborated these findings, with adequate randomization procedures demonstrated in only one study (8%) [45], while eleven studies (92%) showed some concerns regarding randomization processes [40,41,42,43,44,45,47,48,49,50,51].
The most prominent methodological limitation identified by both assessment tools was the universal absence of participant and personnel blinding across all twelve studies [40,41,42,43,44,45,46,47,48,49,50,51], representing an inherent constraint of lifestyle interventions where blinding to nutritional education and physical activity programs is impossible. Assessor blinding presented more substantial concerns, being absent in nine studies (75%) [42,43,45,46,47,48,49,50,51], while only three studies achieved some concerns regarding outcome assessor blinding [40,41,44]. Incomplete outcome data showed mixed results with five studies achieving adequate handling [41,43,45,48,50], two studies showing concerns [46,47], and five studies presenting high risk [40,42,44,49,51]. These findings resulted in high overall risk of bias ratings for all included studies according to Cochrane criteria.
Despite these methodological limitations, the convergent findings from both assessment frameworks strengthen confidence in the evidence synthesis. The consistency of beneficial effects across multiple independent studies with similar risk profiles provides reasonable support for the robustness of conclusions. However, results should be interpreted with appropriate caution given the potential for performance and detection bias to influence reported outcomes, particularly recognizing that the inability to blind participants and personnel in lifestyle interventions may lead to overestimation of treatment effects. The dual assessment approach provides comprehensive evaluation of study quality while acknowledging the inherent methodological constraints of school-based intervention research.

3.3. Study Characteristics

3.3.1. Quantitative Synthesis

Ten of twelve included studies [40,41,43,44,45,46,47,48,50] reported statistically significant improvements in at least one outcome following combined nutrition and physical activity interventions. Blood pressure outcomes showed improvements in six of eight studies. Aguilar-Cordero et al. [47] found significant SBP and DBP reductions (SBP: 128 ± 9.19 vs. 124.69 ± 5.72 mmHg; DBP: 77.26 ± 7.67 vs. 72.77 ± 4.97 mmHg, p < 0.05) with hypertension prevalence decreasing from 85.7% to 16.3% versus increasing from 77.6% to 81.6% in controls. Reinehr et al. [50] observed inter-group differences of −6.0 mmHg for SBP and −4.0 mmHg for DBP. Peña et al. [48] demonstrated adjusted mean SBP difference of −1.41 mmHg (95% CI: −2.44 to −0.38). Rush et al. [44] found age-specific SBP improvements in 10–12-year group (intervention effect −0.23, 95% CI: −0.43, −0.02). Additional improvements were reported by Colín-Ramírez et al. [40] and Vandonguen et al. [43] in specific subgroups. Hrafnkelsson et al. [49] and Pedrosa et al. [51] found non-significant between-group differences.
Glucose metabolism markers were evaluated in five studies [41,45,49,50,51] with limited success. Only Xu et al. [41] reported significant inter-group glucose reduction of −0.20 mmol/L (95% CI: −0.24, −0.16, p < 0.05). Insulin levels were assessed in four studies [41,45,49,51], with no significant between-group differences found in any of the studies. Similarly, HOMA-IR was evaluated in three studies [45,49,51], with no statistically significant intervention effects reported. On the other hand, lipid profile outcomes showed improvements in three of seven studies. Xu et al. [41] reported total cholesterol reduction of −0.32 mmol/L (95% CI: −0.34, −0.30) but HDL decrease of −0.09 mmol/L. Walter et al. [42] achieved annual cholesterol decreases of −1.7 mg/dL (Westchester) and −1.0 mg/dL (Bronx) over 5–6 years. Burke et al. [46] and Vandonguen et al. [43] found improvements in specific subgroups. Hrafnkelsson et al. [49], Reinehr et al. [50], and Pedrosa et al. [51] observed no significant between-group changes.
Anthropometric measures demonstrated improvements in seven of twelve studies. Xu et al. [41] reported BMI reduction of −0.3 kg/m2 (95% CI: −0.4, −0.2), BMI z-score reduction of −0.14, body fat reduction of −0.8%, and waist circumference reduction of −0.5 cm. Reinehr et al. [50] found substantial differences including BMI reduction of −1.61 kg/m2, BMI-SDS of −0.31, and waist circumference reduction of −6.0 cm. Peña et al. [48] achieved BMI z-score improvement of −0.133 and BMI reduction of −0.42 kg/m2. Additional significant improvements were reported by Rush et al. [44], Aguilar-Cordero et al. [47], Sauder et al. [45], and Vandonguen et al. [43]. Five studies found no significant between-group differences [40,42,46,49,51].
Physical activity and fitness parameters improved in all six studies measuring these outcomes [40,41,43,45,46,49]. Xu et al. [41] reported +46.0 min/week physical activity increase. Sauder et al. [44] found improved PACER performance (+1.8 laps) and increased MVPA. Burke et al. [46], Vandonguen et al. [43], and Hrafnkelsson et al. [49] reported enhanced fitness measures, while Colín-Ramírez et al. [40] found increased physical activity attitudes. Finally, dietary and knowledge outcomes showed improvements in four studies [40,42,43,49]. Colín-Ramírez et al. [40] reported reduced energy intake, saturated fat, and sodium, plus increased nutrition knowledge. Walter et al. [42] found reduced total fat intake and increased knowledge scores in both populations. Vandonguen et al. [43] demonstrated fat reduction and increased fiber intake. Hrafnkelsson et al. [49] achieved significant fruit and vegetable intake increases (+47%). Walter et al. [42] additionally found 73.3% reduction in cigarette smoking initiation.

3.3.2. Qualitative Synthesis

Study design and population characteristics demonstrated substantial heterogeneity that directly influenced intervention effectiveness patterns. Six studies implemented longer interventions lasting ≥12 months [40,41,42,44,49,51], while five used 6–9 months [43,45,47,48,50] and one used 20 weeks [46], with sample sizes ranging from 61 [51] to 8573 participants [41] across ten countries. Studies with longer durations (≥12 months) [40,41,42,44,49,51] produced more consistent improvements across multiple biomarkers compared to shorter interventions (6–9 months) [43,45,47,48,50]. Intensity-based subgroup analysis showed that high-intensity interventions with ≥4 sessions per week [47,50] achieved larger effect sizes for anthropometric and blood pressure outcomes, while moderate-intensity approaches with daily brief activities [41,48] produced significant but smaller effects across larger populations. Short-duration, high-intensity interventions [47,50] were particularly effective in targeted populations, whereas longer-duration, moderate-intensity programs [41,42,44] showed sustained benefits in general school populations, suggesting that intervention design should match population characteristics and implementation capacity.
Population targeting strategies varied fundamentally between general school populations [40,41,42,43,44,48,49] and those specifically targeting overweight/obese children [45,47,50,51] or higher cardiovascular risk [46]. This population selection appeared intrinsically linked to intervention intensity, as targeted interventions consistently achieved larger effect sizes compared to population-based approaches that demonstrated smaller but significant improvements across large cohorts. The relationship between duration, population risk, and sample size revealed that longer studies with general populations [41,42,44] could achieve meaningful effects through sustained moderate-intensity approaches, while shorter studies required either high-intensity interventions in targeted populations [47,50] or innovative delivery methods in large cohorts [48] to demonstrate significant between-group differences.
Intervention intensity and family engagement strategies showed clear interdependent relationships with retention and outcome achievement. High-intensity interventions [47,50] featuring 90-min sessions 4×/week or weekly 1.5-h training plus intensive counseling achieved substantial improvements, while moderate-intensity approaches [41,48] with brief daily activities or gamification strategies showed significant but smaller effects, and low-intensity interventions [49] with progressive activities plus general education demonstrated limited between-group effects. These intensity patterns were consistently reinforced by family engagement levels, where studies with strong family components achieved markedly lower dropout rates of 5.3% [48], 9% [50], and 9.2% [47], compared to 16.8–43% in studies with limited family involvement [40,44,49]. Successful family engagement strategies including family sessions [47], parent education [42], home-based components [43], and motivational interviewing [45] appeared to amplify intervention intensity effects, suggesting that family involvement may serve as both a retention mechanism and an intervention enhancement strategy that extends program reach beyond individual participants.
Outcome measurement comprehensiveness and success patterns reflected the complex interplay between intervention scope, duration, and implementation quality. While all studies assessed anthropometric measures, specialized assessments including blood pressure (8 studies), lipids (7 studies), glucose (5 studies), fitness (6 studies), and dietary intake (4 studies) were more prevalent in longer, intensive interventions, suggesting that comprehensive programs warranted broader physiological monitoring. These measurement patterns aligned with success outcomes, where ten studies achieved statistical significance [40,41,43,44,45,46,47,48,50], while Hrafnkelsson et al. [49] showed non-significant differences despite dietary improvements, and Pedrosa et al. [51] unexpectedly found control group superiority in some measures. Success consistently correlated with three distinct but effective approaches: high intensity in targeted populations [45,47,50], comprehensive school-based approaches with strong family engagement [40,41,48], or long-term environmental modifications with sustained implementation [42,44,46]. This pattern suggests that intervention effectiveness depends not on any single component but on achieving sufficient intensity through multiple complementary strategies tailored to population characteristics and implementation contexts.
Finally, none of the included studies reported serious adverse events related to the combined nutrition and physical activity interventions. Minor adverse effects, when mentioned, were limited to occasional discomfort during blood sampling procedures and minimal psychosocial burden related to weight status awareness in targeted populations [45,50]. The overall safety profile of school-based multicomponent interventions appeared favorable across all age groups studied.
The characteristics of studies were extracted and clustered into Table 3.

4. Discussion

The escalating prevalence of child overweight and its associated cardiometabolic impacts has created a high demand for evidence-based prevention interventions in the critical early stages of life [5,6]. Though previous systematic reviews have been conducted to assess the impact of school-based interventions in anthropometric parameters, there has not been an in-depth consideration of how integrated nutrition and physical education programs affect cardiometabolic biomarkers in children 3 to 12 years of age. The major aim of this review was therefore to determine the impact of school-based physical and nutritional activity programs on hematologic and metabolic markers in preschool and primary school-going children. Twelve randomized controlled trials involving a total of 18,231 participants yield findings that multicomponent interventions with an integration of nutritional education and structured physical activity have the potential to significantly enhance key cardiometabolic biomarkers of status, namely consistency in glucose metabolism, lipid levels, and blood pressure levels. These findings are consistent with recent systematic reviews that have shown that school-based interventions for preventing obesity have modest but significant effects in lowering BMI and related factors [3,4,52].

4.1. Main Findings and Clinical Relevance

The present review provides strong evidence that shows interventions conducted in a school setting that include a mix of nutritional and physical activity interventions can have beneficial impacts on blood-derived cardiovascular and metabolic risk-associated biomarkers in children. The most reliably reported changes among the studies involved blood pressure outcomes, with six of eight studies demonstrating systolic reductions ranging from 1.41 to 6.0 mmHg [40,47,48]. Glucose metabolism improvements were limited, with only Xu et al. [41] reporting significant inter-group glucose reduction of 0.20 mmol/L (95% CI: −0.24, −0.16, p < 0.05), while the remaining four studies found no significant treatment effects [45,49,50,51]. This result has special relevance because even small improvements in glucose metabolism in childhood can have lasting effects over metabolic development into adult life [8,9]. However, insulin levels assessed in five studies [41,45,49,50,51] showed no significant between-group differences in any investigation, indicating limited effects on insulin sensitivity markers.
The improvements seen in lipid profiles between different studies are consistent with overall evidence suggesting that lifestyle changes in pediatric populations can result in beneficial impacts on cardiovascular disease risk factors [19,20,53]. Of the studies conducted, seven reported lipid profile assessments, with four studies showing improvements [41,42,43,46]. Additionally, Burke et al. [46] and Walter et al. [42] demonstrated significant reductions in both total cholesterol and LDL cholesterol, highlighting that comprehensive educational interventions can produce meaningful lipid profile improvements even without formally structured exercise protocols. These findings are in agreement with the results from a recent systematic review of Mediterranean dietary interventions in children and adolescents that showed similar beneficial effects on cardiometabolic biomarkers, thus supporting the efficacy of evidence-based dietary interventions in pediatric populations [19].
The outcomes of blood pressure were amongst the most consistently reported effects in numerous research studies and revealed significant reductions of systolic blood pressure in three investigations [40,47,48]. The clinical significance of these findings is extensive, given that childhood blood pressure elevation continues into adulthood and is a specific predictor of the probability of developing cardiovascular diseases [22]. Significant reductions were found in the studies of Aguilar-Cordero et al. [47], Peña et al. [48] and Reinehr et al. [50] suggest that early interventions may be particularly valuable in facilitating beneficial cardiovascular pathways prior to pathological changes establishing themselves.

4.2. Intervention Characteristics and Effectiveness

The analysis revealed that ten out of twelve studies demonstrated statistically significant improvements in at least one cardiometabolic biomarker [40,41,42,43,44,45,46,47,48,50], while two studies [49,51] showed favorable trends without reaching statistical significance. Programs with higher frequency and longer duration consistently produced larger improvements in biomarkers [41,42,43,47,50]. Those interventions that would work best included being done daily or almost daily, including structured physical activity components, involving thorough nutritional education, and being integrated into curricula at school and not solely performed as extracurricular activities. This supports the premise that continuous support and a positive environment are needed for sustainable behavioral modification [12,13]. Current meta-analyses have also reinforced that interventions of longer durations and increased intensities yield better results in terms of significant improvement in the status of children’s physical and mental well-being [4,28,54].
The level of intensity and organization of intervention components varied appreciably between the studies, with some using formalized exercise programs [41,43,47,50], while others promoted overall physical activity through educational programs [42,46,51]. Interestingly, several interventions without formally programmed exercise protocols showed substantial improvements in lipid profiles when the educational components were comprehensive and of longer duration [42,46]. Specifically, Walter et al. [42] achieved significant reductions in total cholesterol and LDL through a two-year classroom-based healthy eating curriculum, while Burke et al. [46] demonstrated similar lipid improvements through school-wide nutritional education integrated into weekly curriculum sessions. The nutritional components included education regarding the Mediterranean diet [19] and culturally adapted healthy eating programs [41,44,48], with more specific dietary advice linked to improved consistency of biomarker changes.
Family participation has been pinpointed as a key determinant of successful outcomes, as shown by the results of Xu et al. [41], Aguilar-Cordero et al. [47], Colin-Ramirez et al. [40], Rush et al. [44], Walter et al. [42] and Pedrosa et al. [51], where family-based promotions of physical activity led to significant improvements in cardiometabolic biomarkers, anthropometrics and healthy habits. This finding resonates with ecological models of health behavior, which stress the importance of engaging multiple levels of influence in order to achieve optimal health outcomes in children [4,55]. A systematic review of intervention studies on lifestyle changes among ethnic minority groups showed that family participation strongly increases intervention effectiveness, especially for cardio-metabolic outcomes [56]. The gamification approach used by Peña et al. [48] demonstrated that novel and interactive intervention designs can increase participant engagement and produce significant reductions in systolic blood pressure, thereby underlining that intervention development must address developmental appropriateness and acceptability in children.
Notably, interventions targeting children with overweight or obesity, as evidenced by the study by Reinehr et al. [50], showed substantially larger changes across multiple biomarkers when compared with samples from the general population. This study demonstrated significant improvements in blood pressure (SBP: −6.0 mmHg, DBP: −4.0 mmHg), anthropometrics, dietary intake and healthy habits, representing some of the largest effect sizes observed across all included studies. The finding is important in that it suggests both that general prevention is important but that targeted interventions in children at high risk can have greater physiological benefits and are perhaps a more efficient allocation of resources. The increased responsiveness to treatment in children with overweight could reflect greater baseline dysfunction and, therefore, higher potential for improvement.

4.3. Mechanistic Considerations

The significant improvements seen in cardiometabolic biomarkers are likely reflective of an interplay of physiological adaptations following the combination of nutritional and exercise interventions. Improvements in glucose metabolism, as reflected by the reduction in glucose levels in one study [41], represent a potential metabolic adaptation, though insulin sensitivity markers showed no significant between-group improvements across studies. Physical activity enhances glucose uptake by skeletal muscle via insulin-stimulated and insulin-independent mechanisms, which include GLUT4 translocation, while appropriate dietary changes can reduce glycemic load and improve postprandial glucose responses [21,23].
Changes in lipid profiles reported in various studies demonstrate the indirect and direct impact of changes in lifestyle. Exercise training increases the activity of lipoprotein lipase, promotes reverse cholesterol transport, and favorably alters the particle size distribution, while dietary changes may result in decreased intake of saturated fats with an increase in fiber intake [27,53,57]. The improvements in lipid profiles observed in four studies [41,42,43,46] suggest enhanced lipid metabolism, with total cholesterol reductions being the most consistent finding.
The reductions in blood pressure reported in six studies [40,43,44,47,48,50] can most likely be explained by improvements in endothelial function, reduced activity of the sympathetic nervous system, and enhanced vascular reactivity—changes that can quickly arise from lifestyle modification and that can particularly be pronounced in children because of their increased vascular plasticity [22]. Increased physical activity promotes production of nitric oxide and reduction of arterial stiffness, while dietary modification can impact vascular inflammation and sodium homeostasis. The anti-inflammatory effects of combination intervention can contribute to improvement in various categories of biomarkers in that chronic low-grade inflammation links to metabolic impairment and development of cardiovascular diseases.

4.4. Sex and Geographic Context Considerations

These studies suggest notable sex differentials in the intervention responses, which need consideration in the planning of subsequent programs. Female participants demonstrated larger improvements in the percentage reduction of overweight/obesity (20% in females versus 10% in males) and manifested sustained longer-term improvements in fitness [41,46]. Male participants, however, demonstrated larger acute responses in some variables, for example, larger reduction in body fat (−1.0% vs. −0.5%) and larger glucose improvements (−0.21 vs. −0.17 mmol/L) [41]. These sex-related patterns suggest that metabolic responses to multi-component nutrition plus physical activity interventions can differ in boys from those in girls at the developmental age of childhood, likely because of the difference in growth patterns, alterations in body composition, and hormonal responses in this crucial developmental life phase [41,43,46].
Interventions’ efficacy also was greatly influenced by geographical and socioeconomic variables, as reflected by nonurban schools achieving higher values for certain metrics compared to their counterparts in urban settings [44], while demographic differences between populations such as urban Bronx versus suburban Westchester revealed substantial variation in intervention effectiveness [42]. Cross-country comparisons revealed substantial variation in intervention effectiveness, with metabolic improvements being most pronounced in East Asian populations [41] compared to more modest effects in Northern European settings [49]. Southern European and targeted interventions in high-risk populations consistently demonstrated stronger cardiovascular benefits [47,50], while studies in diverse ethnic populations highlighted the importance of cultural adaptation, as evidenced by differential responses between indigenous and European populations in New Zealand [44] and successful culturally-tailored approaches in American Indian communities [45]. Notably, some European studies showed unexpected patterns with control groups outperforming interventions in certain measures [51], suggesting that intervention success may be influenced by baseline health status, cultural dietary patterns, and existing healthcare systems.
These findings highlight the importance of tailoring intervention tactics to local conditions suggest that future interventions should consider sex-responsive program elements and context-specific adaptations to maximize effectiveness across diverse populations. The observation that girls may maintain improvements better over time while boys show stronger acute responses could inform the timing and intensity of intervention components to optimize outcomes for both sexes.

4.5. Public Health Implications

The findings of this review have important policy and practice implications in the public health field. The effectiveness of interventions evaluated in school settings affirms that there is a need to include overall health promotion programs in school curricula as a population approach to preventing chronic disease. Schools are an appropriate setting for these interventions because of their broad reach, existing curriculum structure, and potential to intervene with children in formative development stages [12,13]. The evidence shows that investing in school-based health promotion has high long-term pay-offs in terms of healthcare expenditure savings and improvements in overall population health status.
The consistency of benefits seen across different demographic groups and geographic locations [40,41,43,44,45,46,47,48,50] suggests that these interventions have widespread applicability across different cultural and socioeconomic contexts. However, the variability in effect size seen across different studies reinforces the importance of ensuring high-quality implementation, sufficient intensity of interventions, and context sensitivity. The evidence supports a shift away from independent short-term health education courses toward more integrated and prolonged interventions that include both physical activity and nutrition components within the overall school setting, supported by policy guidelines that prefer multicomponent approaches over single-component approaches. This is further supported by recent Cochrane reviews, showing that combined interventions produce more consistent and larger effects than those with individual components alone [4,52,58].
The early institution of intervention is considered crucial, as supported by significant improvements observed in preschool children [47], which supports the concept of primordial prevention—intervening before risk factors appear. The fact that blood pressure and metabolic parameters can be favorably affected in children as young as 4–5 years old suggests that preventative initiatives must be started as early as possible within the school system. The importance of family involvement, as highlighted in a number of studies [40,41,42,44,47,51], indicates that effective interventions must include activities outside of schools to engage parents and caregivers through carefully coordinated school-family partnerships.
The effectiveness of innovative methods, including gamification [48], highlights the need for public health interventions to become scalable in their approach to meet contemporary youth expectations and desires. The differing results seen between the overall population and individuals in at-risk groups [50] highlight the need for universal as well as targeted intervention methods; while population-wide initiatives reap considerable benefits, it is appropriate to invest additional resources in already affected children. The targeted approach can potentially maximize resource allocation so that all children get at least a minimum intervention. Health disparities research has shown that well-organized interventions that are conducted in schools can reduce, as opposed to widen, health disparities and make them effective tools for improving equity in healthcare [59,60].

4.6. Limitations and Future Research Directions

A number of limitations have to be considered when integrating these findings. Substantial heterogeneity of intervention study design, duration, strength of intervention, and measure of outcome among the thirteen studies included in this review made it difficult to conduct formal meta-analyses. Methodological critique determined that many of these studies did not have adequate blinding of assessors and lacked statistical group comparisons. In addition, most of these studies utilized relatively short follow-up periods and hence did not allow for assessment of duration of these benefits. Publication bias could not be formally assessed due to methodological heterogeneity, though the high proportion of positive results (10/12 studies) may indicate potential publication bias.
Future research should highlight the importance of longitudinal follow-up studies to determine if early improvements in cardiometabolic biomarkers translate into lasting gains in health benefits and lower prevalence of chronic disease in adults. Properly powered research with standardized measures would make informative meta-analyses possible and help make more accurate estimates of effect sizes. There is a critical need for implementation science to clarify how effective interventions can be scaled and sustained in diverse learning settings. Finally, an examination of intervention dosage and cost-effectiveness would help with evidence-based program development and resource allocation plans [60,61]. Intervention research in pediatrics has recently emphasized the role of biomarker assessment due to their potential for providing more sensitive measurement of intervention effectiveness than anthropometric assessments alone [62].

5. Conclusions

This systematic review demonstrates that school-based interventions combining physical activity and nutrition education can produce significant improvements in blood-derived biomarkers among children aged 3 to 12 years. Twelve randomized controlled trials involving 18,231 children were analyzed, with ten studies demonstrating statistically significant improvements in at least one blood-derived biomarker. The most consistent benefits were observed for blood pressure outcomes, with six of eight studies showing systolic reductions ranging from 1.41 to 6.0 mmHg. Glucose metabolism improvements were limited, with only one study reporting significant inter-group glucose reduction (−0.20 mmol/L). Lipid profile improvements occurred in three of seven studies, including meaningful total cholesterol reductions. Insulin levels, assessed in five studies, showed no significant between-group differences in any investigation. Anthropometric improvements were demonstrated in seven of twelve studies, with consistent benefits for BMI, body fat, and waist circumference.
The most effective interventions featured daily implementation, longer durations (≥12 months), strong family involvement, and curriculum integration. Interventions specifically targeting children with overweight/obesity demonstrated substantially larger effect sizes compared to general population approaches. Programs with high intensity (≥4 sessions per week) achieved superior outcomes in targeted populations, while moderate-intensity approaches produced significant but smaller effects across larger cohorts. These findings support implementing: (1) comprehensive multicomponent programs integrated into regular school curricula rather than supplementary activities; (2) sustained family engagement through parent education and home-based components; (3) longer intervention durations (≥6 months) with adequate intensity; (4) innovative delivery methods including gamification to enhance engagement; (5) targeted high-intensity approaches for high-risk children alongside population-wide prevention; and (6) blood-derived biomarker assessment to provide sensitive monitoring of intervention effectiveness beyond traditional anthropometric measures.

Author Contributions

Conceptualization, M.R.-G. and D.G.-D.; methodology, M.R.-G. and C.D.G.-C.; validation, D.G.-D. and A.M.-V.; formal analysis, M.R.-G. and D.G.-D.; investigation, M.R.-G., D.G.-D., C.D.G.-C., and A.M.-V.; resources, C.D.G.-C. and A.M.-V.; data curation, M.R.-G. and D.G.-D.; writing—original draft preparation, M.R.-G., D.G.-D., C.D.G.-C. and A.M.-V.; writing—review and editing, M.R.-G., D.G.-D., C.D.G.-C. and A.M.-V.; visualization, M.R.-G. and C.D.G.-C.; supervision, C.D.G.-C. and A.M.-V.; project administration, M.R.-G. and C.D.G.-C. All authors have read and agreed to the published version of the manuscript.

Funding

This research received no external funding.

Institutional Review Board Statement

Ethical review and approval were waived for this study, as this systematic review analyzed only published summary data from studies that previously obtained their own ethical approvals. No primary participant data were accessed or reanalyzed.

Informed Consent Statement

Not applicable.

Conflicts of Interest

The authors declare no conflict of interest.

References

  1. Garrido-Miguel, M.; Cavero-Redondo, I.; Álvarez-Bueno, C.; Rodríguez-Artalejo, F.; Moreno, L.A.; Ruiz, J.R.; Ahrens, W.; Martínez-Vizcaíno, V. Prevalence and Trends of Overweight and Obesity in European Children from 1999 to 2016: A Systematic Review and Meta-Analysis. JAMA Pediatr. 2019, 173, e192430. [Google Scholar] [CrossRef]
  2. Zhang, X.; Liu, J.; Ni, Y.; Yi, C.; Fang, Y.; Ning, Q.; Shen, B.; Zhang, K.; Liu, Y.; Yang, L.; et al. Global Prevalence of Overweight and Obesity in Children and Adolescents: A Systematic Review and Meta-Analysis. JAMA Pediatr. 2024, 178, 800. [Google Scholar] [CrossRef]
  3. Bleich, S.N.; Vercammen, K.A.; Zatz, L.Y.; Frelier, J.M.; Ebbeling, C.B.; Peeters, A. Interventions to Prevent Global Childhood Overweight and Obesity: A Systematic Review. Lancet Diabetes Endocrinol. 2018, 6, 332–346. [Google Scholar] [CrossRef]
  4. Liu, Z.; Xu, H.-M.; Wen, L.-M.; Peng, Y.-Z.; Lin, L.-Z.; Zhou, S.; Li, W.-H.; Wang, H.-J. A Systematic Review and Meta-Analysis of the Overall Effects of School-Based Obesity Prevention Interventions and Effect Differences by Intervention Components. Int. J. Behav. Nutr. Phys. Act. 2019, 16, 95. [Google Scholar] [CrossRef]
  5. World Health Organization Obesity and Overweight. Available online: https://www.who.int/news-room/fact-sheets/detail/obesity-and-overweight (accessed on 1 July 2025).
  6. Juonala, M.; Magnussen, C.G.; Berenson, G.S.; Venn, A.; Burns, T.L.; Sabin, M.A.; Srinivasan, S.R.; Daniels, S.R.; Davis, P.H.; Chen, W.; et al. Childhood Adiposity, Adult Adiposity, and Cardiovascular Risk Factors. N. Engl. J. Med. 2011, 365, 1876–1885. [Google Scholar] [CrossRef]
  7. Takehara, K.; Togoobaatar, G.; Kikuchi, A.; Lkhagvasuren, G.; Lkhagvasuren, A.; Aoki, A.; Fukuie, T.; Shagdar, B.-E.; Suwabe, K.; Mikami, M.; et al. Exercise Intervention for Academic Achievement Among Children: A Randomized Controlled Trial. Pediatrics 2021, 148, e2021052808. [Google Scholar] [CrossRef]
  8. Fan, B.; Zhang, T.; Li, S.; Yan, Y.; Fan, L.; Bazzano, L.; He, J.; Chen, W. Differential Roles of Life-Course Cumulative Burden of Cardiovascular Risk Factors in Arterial Stiffness and Thickness. Can. J. Cardiol. 2022, 38, 1253–1262. [Google Scholar] [CrossRef] [PubMed]
  9. Ahmadizar, F.; Voortman, T. Arterial Stiffness in Childhood: A Predictor for Later Cardiovascular Disease? J. Cardiovasc. Risk 2018, 25, 100–102. [Google Scholar] [CrossRef]
  10. Murray, E.T.; Hardy, R.; Hughes, A.; Wills, A.; Sattar, N.; Deanfield, J.; Kuh, D.; Whincup, P. Overweight across the Life Course and Adipokines, Inflammatory and Endothelial Markers at Age 60–64 Years: Evidence from the 1946 Birth Cohort. Int. J. Obes. 2015, 39, 1010–1018. [Google Scholar] [CrossRef]
  11. Telama, R.; Yang, X.; Leskinen, E.; Kankaanpää, A.; Hirvensalo, M.; Tammelin, T.; Viikari, J.S.A.; Raitakari, O.T. Tracking of Physical Activity from Early Childhood through Youth into Adulthood. Med. Sci. Sports Exerc. 2014, 46, 955–962. [Google Scholar] [CrossRef]
  12. Tapia-Serrano, M.A.; Sevil-Serrano, J.; Sánchez-Oliva, D.; Vaquero-Solís, M.; Sánchez-Miguel, P.A. Effects of a School-Based Intervention on Physical Activity, Sleep Duration, Screen Time, and Diet in Children. Rev. Psicodidáct. Engl. Ed 2022, 27, 56–65. [Google Scholar] [CrossRef]
  13. Evans, C.E.L.; Christian, M.S.; Cleghorn, C.L.; Greenwood, D.C.; Cade, J.E. Systematic Review and Meta-Analysis of School-Based Interventions to Improve Daily Fruit and Vegetable Intake in Children Aged 5 to 12 y. Am. J. Clin. Nutr. 2012, 96, 889–901. [Google Scholar] [CrossRef]
  14. Nikooyeh, B.; Yari, Z.; Hariri, Z.; Baghdadi, G.; Yazdani, H.; Motlagh, M.E.; Neyestani, T.R. Which School-Based Interventions Work Better to Combat Obesity in Children? A Network Meta-Analysis. Syst. Rev. 2025, 14, 125. [Google Scholar] [CrossRef]
  15. Bustos, N.; Olivares, S.; Leyton, B.; Cano, M.; Albala, C. Impact of a School-Based Intervention on Nutritional Education and Physical Activity in Primary Public Schools in Chile (KIND) Programme Study Protocol: Cluster Randomised Controlled Trial. BMC Public Health 2016, 16, 1217. [Google Scholar] [CrossRef]
  16. Monsalves-Alvarez, M. Motor Skills and Nutritional Status Outcomes from a Physical Activity Intervention in Short Breaks on Preschool Children Conducted by Their Educators: A Pilot Study. Nutr. Hosp. 2015, 32, 1576–1581. [Google Scholar] [CrossRef] [PubMed]
  17. Hilger-Kolb, J.; Bosle, C.; Motoc, I.; Hoffmann, K. Associations between Dietary Factors and Obesity-Related Biomarkers in Healthy Children and Adolescents—A Systematic Review. Nutr. J. 2017, 16, 85. [Google Scholar] [CrossRef] [PubMed]
  18. Zafarmand, M.H.; Spanjer, M.; Nicolaou, M.; Wijnhoven, H.A.H.; van Schaik, B.D.C.; Uitterlinden, A.G.; Snieder, H.; Vrijkotte, T.G.M. Influence of Dietary Approaches to Stop Hypertension-Type Diet, Known Genetic Variants and Their Interplay on Blood Pressure in Early Childhood: ABCD Study. Hypertension 2020, 75, 59–70. [Google Scholar] [CrossRef] [PubMed]
  19. López-Gil, J.F.; García-Hermoso, A.; Martínez-González, M.Á.; Rodríguez-Artalejo, F. Mediterranean Diet and Cardiometabolic Biomarkers in Children and Adolescents: A Systematic Review and Meta-Analysis. JAMA Netw. Open 2024, 7, e2421976. [Google Scholar] [CrossRef]
  20. Obarzanek, E.; Kimm, S.Y.; Barton, B.A.; Van Horn, L.; Kwiterovich, P.O.; Simons-Morton, D.G.; Hunsberger, S.A.; Lasser, N.L.; Robson, A.M.; Franklin, F.A.; et al. Long-Term Safety and Efficacy of a Cholesterol-Lowering Diet in Children with Elevated Low-Density Lipoprotein Cholesterol: Seven-Year Results of the Dietary Intervention Study in Children (DISC). Pediatrics 2001, 107, 256–264. [Google Scholar] [CrossRef]
  21. Visuthranukul, C.; Sirimongkol, P.; Prachansuwan, A.; Pruksananonda, C.; Chomtho, S. Low-Glycemic Index Diet May Improve Insulin Sensitivity in Obese Children. Pediatr. Res. 2015, 78, 567–573. [Google Scholar] [CrossRef]
  22. Laitinen, T.T.; Nuotio, J.; Niinikoski, H.; Juonala, M.; Rovio, S.P.; Viikari, J.S.A.; Rönnemaa, T.; Magnussen, C.G.; Sabin, M.; Burgner, D.; et al. Attainment of Targets of the 20-Year Infancy-Onset Dietary Intervention and Blood Pressure Across Childhood and Young Adulthood: The Special Turku Coronary Risk Factor Intervention Project (STRIP). Hypertension 2020, 76, 1572–1579. [Google Scholar] [CrossRef]
  23. Wang, H.; Cheng, R.; Xie, L.; Hu, F. Comparative Efficacy of Exercise Training Modes on Systemic Metabolic Health in Adults with Overweight and Obesity: A Network Meta-Analysis of Randomized Controlled Trials. Front. Endocrinol. 2023, 14, 1294362. [Google Scholar] [CrossRef]
  24. Kelley, G.A.; Kelley, K.S.; Pate, R.R. Effects of Exercise on BMI Z-Score in Overweight and Obese Children and Adolescents: A Systematic Review with Meta-Analysis. BMC Pediatr. 2014, 14, 225. [Google Scholar] [CrossRef]
  25. Chen, L.; Liu, Q.; Xu, F.; Wang, F.; Luo, S.; An, X.; Chen, J.; Tang, N.; Jiang, X.; Liang, X. Effect of Physical Activity on Anxiety, Depression and Obesity Index in Children and Adolescents with Obesity: A Meta-Analysis. J. Affect. Disord. 2024, 354, 275–285. [Google Scholar] [CrossRef]
  26. Ameryoun, A.; Sanaeinasab, H.; Saffari, M.; Koenig, H.G. Impact of Game-Based Health Promotion Programs on Body Mass Index in Overweight/Obese Children and Adolescents: A Systematic Review and Meta-Analysis of Randomized Controlled Trials. Child. Obes. 2018, 14, 67–80. [Google Scholar] [CrossRef] [PubMed]
  27. Liu, X.; Li, Q.; Lu, F.; Zhu, D. Effects of Aerobic Exercise Combined with Resistance Training on Body Composition and Metabolic Health in Children and Adolescents with Overweight or Obesity: Systematic Review and Meta-Analysis. Front. Public Health 2024, 12, 1409660. [Google Scholar] [CrossRef]
  28. García-Hermoso, A.; López-Gil, J.F.; Izquierdo, M.; Ramírez-Vélez, R.; Ezzatvar, Y. Exercise and Insulin Resistance Markers in Children and Adolescents with Excess Weight: A Systematic Review and Network Meta-Analysis. JAMA Pediatr. 2023, 177, 1276–1284. [Google Scholar] [CrossRef]
  29. Jiménez-Peláez, C.C.; Fernández-Aparicio, Á.; Montero-Alonso, M.A.; González-Jiménez, E. Effect of Dietary and Physical Activity Interventions Combined with Psychological and Behavioral Strategies on Preventing Metabolic Syndrome in Adolescents with Obesity: A Meta-Analysis of Clinical Trials. Nutrients 2025, 17, 2051. [Google Scholar] [CrossRef] [PubMed]
  30. Wu, T.; Gao, X.; Chen, M.; van Dam, R.M. Long-Term Effectiveness of Diet-plus-Exercise Interventions vs. Diet-Only Interventions for Weight Loss: A Meta-Analysis. Obes. Rev. Off. J. Int. Assoc. Study Obes. 2009, 10, 313–323. [Google Scholar] [CrossRef] [PubMed]
  31. Racey, M.; Ali, M.U.; Sherifali, D.; Fitzpatrick-Lewis, D.; Lewis, R.; Jovkovic, M.; Gramlich, L.; Keller, H.; Holroyd-Leduc, J.; Giguère, A.; et al. Effectiveness of Nutrition Interventions and Combined Nutrition and Physical Activity Interventions in Older Adults with Frailty or Prefrailty: A Systematic Review and Meta-Analysis. CMAJ Open 2021, 9, E744–E756. [Google Scholar] [CrossRef]
  32. Neil-Sztramko, S.E.; Caldwell, H.; Dobbins, M. School-Based Physical Activity Programs for Promoting Physical Activity and Fitness in Children and Adolescents Aged 6 to 18. Cochrane Database Syst. Rev. 2021, 9, CD007651. [Google Scholar] [CrossRef]
  33. Rico-González, M. The Effect of Primary School-Based Physical Education Programs: A Systematic Review of Randomized Controlled Trials. J. Phys. Act. Health 2023, 20, 317–347. [Google Scholar] [CrossRef]
  34. Armstrong, N. Paediatric Exercise Physiology: Advances in Sport and Exercise, 1st ed.; Elsevier Health Sciences: Amsterdam, The Netherlands, 2006; ISBN 978-0-7020-3492-3. [Google Scholar]
  35. Gao, S.; Yang, L.; Li, Y.; Liu, S.; Zhang, H.; Arens, E.; Zhai, Y. Metabolic Rate in Children and Adolescents: Tabulate Values for Common Activities and Comparisons with Standards and Adult Values. Build. Environ. 2023, 244, 110804. [Google Scholar] [CrossRef]
  36. Page, M.J.; McKenzie, J.E.; Bossuyt, P.M.; Boutron, I.; Hoffmann, T.C.; Mulrow, C.D.; Shamseer, L.; Tetzlaff, J.M.; Akl, E.A.; Brennan, S.E.; et al. The PRISMA 2020 Statement: An Updated Guideline for Reporting Systematic Reviews. BMJ 2021, 372, n71. [Google Scholar] [CrossRef] [PubMed]
  37. Rico-González, M.; Pino-Ortega, J.; Clemente, F.M.; Los Arcos, A. Guidelines for Performing Systematic Reviews in Sports Science. Biol. Sport 2022, 39, 463–471. [Google Scholar] [CrossRef]
  38. Cashin, A.G.; McAuley, J.H. Clinimetrics: Physiotherapy Evidence Database (PEDro) Scale. J. Physiother. 2020, 66, 59. [Google Scholar] [CrossRef]
  39. Sterne, J.A.C.; Savović, J.; Page, M.J.; Elbers, R.G.; Blencowe, N.S.; Boutron, I.; Cates, C.J.; Cheng, H.-Y.; Corbett, M.S.; Eldridge, S.M.; et al. RoB 2: A Revised Tool for Assessing Risk of Bias in Randomised Trials. BMJ 2019, 366, l4898. [Google Scholar] [CrossRef]
  40. Colín Ramírez, E.; Castillo Martínez, L.; Orea Tejeda, A.; Vergara, A.; Villa, A.R. Efecto de una intervención escolar basada en actividad física y dieta para la prevención de factores de riesgo cardiovascular (RESCATE). Rev. Esp. Nutr. Comunitaria Span. J. Community Nutr. 2009, 15, 71–80. [Google Scholar]
  41. Xu, H.; Li, Y.; Zhang, Q.; Hu, X.; Liu, A.; Du, S.; Li, T.; Guo, H.; Li, Y.; Xu, G.; et al. Comprehensive School-Based Intervention to Control Overweight and Obesity in China: A Cluster Randomized Controlled Trial. Asia Pac. J. Clin. Nutr. 2017, 26, 1139–1151. [Google Scholar] [CrossRef] [PubMed]
  42. Walter, H.J. Primary Prevention of Chronic Disease among Children: The School-Based “Know Your Body” Intervention Trials. Health Educ. Q. 1989, 16, 201–214. [Google Scholar] [CrossRef]
  43. Vandongen, R.; Jenner, D.A.; Thompson, C.; Taggart, A.C.; Spickett, E.E.; Burke, V.; Beilin, L.J.; Milligan, R.A.; Dunbar, D.L. A Controlled Evaluation of a Fitness and Nutrition Intervention Program on Cardiovascular Health in 10-Year-Old to 12-Year-Old Children. Prev. Med. 1995, 24, 9–22. [Google Scholar] [CrossRef]
  44. Rush, E.; Reed, P.; McLennan, S.; Coppinger, T.; Simmons, D.; Graham, D. A School-Based Obesity Control Programme: Project Energize. Two-Year Outcomes. Br. J. Nutr. 2012, 107, 581–587. [Google Scholar] [CrossRef] [PubMed]
  45. Sauder, K.A.; Dabelea, D.; Bailey-Callahan, R.; Kanott Lambert, S.; Powell, J.; James, R.; Percy, C.; Jenks, B.F.; Testaverde, L.; Thomas, J.M.; et al. Targeting Risk Factors for Type 2 Diabetes in American Indian Youth: The Tribal Turning Point Pilot Study. Pediatr. Obes. 2018, 13, 321–329. [Google Scholar] [CrossRef]
  46. Burke, V.; Milligan, R.A.; Thompson, C.; Taggart, A.C.; Dunbar, D.L.; Spencer, M.J.; Medland, A.; Gracey, M.P.; Vandongen, R.; Beilin, L.J. A Controlled Trial of Health Promotion Programs in 11-Year-Olds Using Physical Activity “Enrichment” for Higher Risk Children. J. Pediatr. 1998, 132, 840–848. [Google Scholar] [CrossRef]
  47. Aguilar-Cordero, M.J.; Rodríguez-Blanque, R.; Leon-Ríos, X.; Expósito Ruiz, M.; García García, I.; Sánchez-López, A.M. Influence of Physical Activity on Blood Pressure in Children with Overweight/Obesity: A Randomized Clinical Trial. Am. J. Hypertens. 2020, 33, 131–136. [Google Scholar] [CrossRef]
  48. Peña, S.; Carranza, M.; Cuadrado, C.; Parra, D.C.; Villalobos Dintrans, P.; Castillo, C.; Cortinez-O’Ryan, A.; Espinoza, P.; Müller, V.; Rivera, C.; et al. Effectiveness of a Gamification Strategy to Prevent Childhood Obesity in Schools: A Cluster Controlled Trial. Obesity 2021, 29, 1825–1834. [Google Scholar] [CrossRef]
  49. Hrafnkelsson, H.; Magnusson, K.T.; Thorsdottir, I.; Johannsson, E.; Sigurdsson, E.L. Result of School-Based Intervention on Cardiovascular Risk Factors. Scand. J. Prim. Health Care 2014, 32, 149–155. [Google Scholar] [CrossRef]
  50. Reinehr, T.; Schaefer, A.; Winkel, K.; Finne, E.; Toschke, A.M.; Kolip, P. An Effective Lifestyle Intervention in Overweight Children: Findings from a Randomized Controlled Trial on “Obeldicks Light”. Clin. Nutr. 2010, 29, 331–336. [Google Scholar] [CrossRef]
  51. Pedrosa, C.; Oliveira, B.M.P.M.; Albuquerque, I.; Simões-Pereira, C.; Vaz-de-Almeida, M.D.; Correia, F. Metabolic Syndrome, Adipokines and Ghrelin in Overweight and Obese Schoolchildren: Results of a 1-Year Lifestyle Intervention Programme. Eur. J. Pediatr. 2011, 170, 483–492. [Google Scholar] [CrossRef] [PubMed]
  52. Brown, T.; Moore, T.H.; Hooper, L.; Gao, Y.; Zayegh, A.; Ijaz, S.; Elwenspoek, M.; Foxen, S.C.; Magee, L.; O’Malley, C.; et al. Interventions for Preventing Obesity in Children. Cochrane Database Syst. Rev. 2019, 7, CD001871. [Google Scholar] [CrossRef] [PubMed]
  53. Huang, Y.; Sulek, K.; Stinson, S.E.; Holm, L.A.; Kim, M.; Trost, K.; Hooshmand, K.; Lund, M.A.V.; Fonvig, C.E.; Juel, H.B.; et al. Lipid Profiling Identifies Modifiable Signatures of Cardiometabolic Risk in Children and Adolescents with Obesity. Nat. Med. 2025, 31, 294–305. [Google Scholar] [CrossRef]
  54. Poon, E.T.-C.; Sum, W.M.-K.; Lubans, D.; Wong, S.H.-S.; Ho, R.S.-T. High-Intensity Interval Training for Improving Cardiometabolic Health in Children and Adolescents: An Umbrella Review of Systematic Reviews. J. Sports Sci. 2024, 42, 2199–2215. [Google Scholar] [CrossRef]
  55. Ash, T.; Agaronov, A.; Young, T.; Aftosmes-Tobio, A.; Davison, K.K. Family-Based Childhood Obesity Prevention Interventions: A Systematic Review and Quantitative Content Analysis. Int. J. Behav. Nutr. Phys. Act. 2017, 14, 113. [Google Scholar] [CrossRef] [PubMed]
  56. Obita, G.; Alkhatib, A. Effectiveness of Lifestyle Nutrition and Physical Activity Interventions for Childhood Obesity and Associated Comorbidities among Children from Minority Ethnic Groups: A Systematic Review and Meta-Analysis. Nutrients 2023, 15, 2524. [Google Scholar] [CrossRef]
  57. Verma, R.; Bisen, P.S.; Bulló, M. Integrated Review of Cardiometabolic Biomarkers and Dietary Nutrients. J. Food Bioact. 2024, 27, 44–57. [Google Scholar] [CrossRef]
  58. Spiga, F.; Davies, A.L.; Tomlinson, E.; Moore, T.H.; Dawson, S.; Breheny, K.; Savović, J.; Gao, Y.; Phillips, S.M.; Hillier-Brown, F.; et al. Interventions to Prevent Obesity in Children Aged 5 to 11 Years Old. Cochrane Database Syst. Rev. 2024, 5, CD015328. [Google Scholar] [CrossRef] [PubMed]
  59. Palmer, J.C.; Davies, A.L.; Spiga, F.; Heitmann, B.L.; Jago, R.; Summerbell, C.D.; Higgins, J.P.T.; Inequity in Obesity Prevention Trialists Collaborative Group. Do the Effects of Interventions Aimed at the Prevention of Childhood Obesity Reduce Inequities? A Re-Analysis of Randomized Trial Data from Two Cochrane Reviews. EClinicalMedicine 2025, 81, 103130. [Google Scholar] [CrossRef] [PubMed]
  60. Klein, D.H.; Mohamoud, I.; Olanisa, O.O.; Parab, P.; Chaudhary, P.; Mukhtar, S.; Moradi, A.; Kodali, A.; Okoye, C.; Arcia Franchini, A.P. Impact of School-Based Interventions on Pediatric Obesity: A Systematic Review. Cureus 2023, 15, e43153. [Google Scholar] [CrossRef]
  61. Vilchis-Gil, J.; Klünder-Klünder, M.; Flores-Huerta, S. Effect on the Metabolic Biomarkers in Schoolchildren After a Comprehensive Intervention Using Electronic Media and In-Person Sessions to Change Lifestyles: Community Trial. J. Med. Internet Res. 2018, 20, e44. [Google Scholar] [CrossRef]
  62. Pratapwar, M.P.; Sheth, H.J.; Ravi, A.K.; Block, M.L.; Korber, K.A.; Kepsel, A.; Leimanis-Laurens, M.; Comstock, S.S. Use of Biomarkers in Nutrition Intervention Studies of Children: A Scoping Review. Nutrients 2024, 16, 3584. [Google Scholar] [CrossRef]
Figure 1. PRISMA flow diagram.
Applsci 15 08564 g001
Figure 2. Risk of bias assessment for included studies using the Cochrane Collaboration tool [40,41,42,43,44,45,46,47,48,49,50,51]. Each row represents one study, and each column represents a different bias domain. Green circles with “+” indicate low risk of bias, red circles with “−” indicate high risk of bias, and yellow circles with “?” indicate unclear risk of bias. Note. D1–Randomization Process: Bias arising from the randomization process, including allocation sequence generation and concealment; D2–Deviations from Intended Interventions: Bias due to deviations from intended interventions, including issues with blinding of participants and personnel; D3–Missing Outcome Data: Bias due to missing outcome data and how missing data were handled; D4–Measurement of Outcome: Bias in measurement of the outcome, including blinding of outcome assessors; D5–Selection of Reported Results: Bias in selection of the reported result, including selective outcome reporting.
Applsci 15 08564 g002
Table 1. Inclusion and exclusion criteria.
CriterionInclusionExclusionSearch Coherence
(1) PopulationPreschool and school-aged childrenChildren out of preschool or school age
Children under medical treatment
“early childhood” OR preschool OR kindergarten OR school* OR “primary education” OR “elementary education”
(2) Intervention or ExposureChildren in schools involved in a multifaceted (nutrition and exercise) intervention program (exercise should be in school)Children out of school doing physical activity program (nutrition intervention could be at home)
Children not involved in a multifaceted program
Children involved in programs with supplementation (e.g., vitamins)
Study protocols
(nutrient* OR nutrition OR food* OR DIET*) AND (exercise OR “Physical activity” OR “physical education” OR sport OR fitness OR aerobic OR movement) AND (program* OR intervention)
(3) Comparation---
(4) Outcome[s]Outcomes extracted from children`s blood analysisOutcomes not related to bloodblood
(5) DesignRandomized controlled trialNon randomized controlled trials“randomized controlled trial*”
(6) Other criteriaPeer-reviewed full-text studies published in original journal articles, without language restrictions.Non-peer reviewed journal articles.
Non original full-text studies (conference papers…).
* serves as an truncation operator to capture all word variations with the specified root term. For instance, “school” retrieves “schools,” “schooling,” “school-age,” “schoolchildren,” and related variations. This truncation technique is an standard practice in systematic database searching to ensure comprehensive retrieval of relevant literature while maintaining search precision and reproducibility, as recommended by established systematic review guidelines.
Table 2. Methodological assessment of the included studies (PEDro scale).
Colín-Ramírez et al., 2009 [40]Xu et al., 2017 [41]Walter et al., 1989 [42]Vandonguen et al., 1995 [43]Rush et al., 2012 [44]Sauder et al., 2017 [45]Burke et al., 1998 [46]Aguilar-Cordero et al., 2020 [47]Peña et al., 2021 [48]Hrafnkelsson et al., 2014 [49]Reinehr et al., 2010 [50]Pedrosa et al., 2011 [51]
Random allocation111111111111
Concealed allocation000001000000
Baseline comparability111111011111
Blinding of subjects000000000000
Blinding of therapists000000000000
Blinding of assessors110010000000
Adequate follow-up (>85%)010101111010
Intention-to-treat analysis010101001010
Between-group statistical comparisons111111111111
Point estimates and measures of variability for at least one key outcome111111111111
Score574657456464
Cut-off pointsFairGoodFairGoodFairGoodFairFairGoodFairGoodFair
Table 3. Main characteristics and findings about the effects of multifaceted intervention programs on children’s cardiometabolic biomarkers.
AuthorsSample Characteristics and DropoutsNutritionalInterventionPhysical ExerciseInterventionOutcomesMain Results
Aguilar-Cordero et al., 2020 [47]N = 98 (EG: 49; CG: 49)
Sex: 52 male, 46 female
Age: 10.43 ± 1.35 y
BMI: 28.28 ± 3.84 kg/m2
Weight: 65.60 ± 16.07 kg
Height: 1.50 ± 0.10 m
Country: Spain
Pathologies: Overweight/obesity
Dropouts: n = 10 (9.2%) IG: 5, CG: 5
Duration: 9 months
EG + CG: Theoretical-practical sessions on nutritional advice twice monthly for children and families.
Duration: 9 months
EG: Games-based PA program (90 min, 4 days/week, 9 months, 144 total sessions).
Activities: warm-up, main activity (games and sports with largely aerobic component), cool-down. Playful, non-competitive sessions.
CG: No physical exercise intervention
Blood pressure
SBP (mmHg)
DBP (mmHg)
SBP percentiles
DBP percentiles
Hypertension prevalence
Body composition
Body fat (%)
Intra-group (p < 0.05)
EG
↓ SBP (128 ± 9.19 vs. 124.69 ± 5.72 mmHg)
↓ DBP (77.26 ± 7.67 vs. 72.77 ± 4.97 mmHg)
↓ Body fat (41.91 ± 6.24 vs. 38.50 ± 6.62%);
↓ SBP percentiles (95.86 ± 6.50 vs. 79.71 ± 10.77);
↓ DBP percentiles (90.86 ± 7.65 vs. 76.92 ± 11.09)
↓ Hypertension prevalence (85.7% to 16.3%)
CG
↑ SBP (129.72 ± 12.78 vs. 131.16 ± 12.24 mmHg)
↑ DBP (77.00 ± 9.62 vs. 78.41 ± 8.70 mmHg)
↑ Body fat (38.64 ± 5.82 vs. 41.25 ± 4.93%)
↑ Hypertension prevalence (77.6% to 81.6%)
Inter-group (p < 0.05) EG vs. CG
↓ SBP ↓ DBP ↓ Body fat ↓ SBP percentiles ↓ DBP percentiles
↓ Hypertension prevalence
Peña et al., 2021 [48]N = 2197 (EG: 1544; CG: 653)
Sex: 1398 male, 799 female
Age: EG: 11.08 ± 0.75; CG: 11.15 ± 0.79 y
BMI: EG: 20.3 ± 3.6; CG: 20.7 ± 3.9 kg/m2
Weight: EG: 42.9 ± 10.0; CG: 44.0 ± 11.0 kg
Height: EG: 144.8 ± 7.7; CG: 145.3 ± 7.7 cm
Country: Chile
Pathologies: No.
Dropouts: n = 123 (5.3%) IG: 67, CG: 56
Duration: 7 months.
EG: Healthy Snacks Challenge: Points for bringing healthy snacks (NOVA classification-based scoring system), gamification strategy with leaderboards and rewards
CG: Standard education provision + access to online platform with educational materials
Duration: 7 months.
EG: Multicomponent gamification strategy: Steps Challenge 13,000 steps/day target, Healthy Activity Challenge by family-based activities with photo uploads, Structural rewards (climbing walls, sports infrastructure improvements)
CG: Standard curricula
Blood pressure
SBP (mmHg)
DBP (mmHg)
Body composition
Zbmi
BMI (kg/m2)
WC (cm)
Inter-group (7 months, p < 0.05) EG vs. CG
↓ SBP: adjusted mean difference −1.41 mmHg (95% CI: −2.44 to −0.38)
↓ BMI z-score: adjusted mean difference −0.133 (95% CI: −0.25 to −0.01)
↓ BMI: adjusted mean difference −0.42 kg/m2 (95% CI: −0.78 to −0.05)
Vandonguen et al., 1995 [43]N = 869 (F: 150; SN: 148; SN + HN: 119; HN: 161; F + SN: 149; CG: 126)
Sex: 423 males, 446 females
Age: 10–12 years old
BMI: Males: 18.0, Females: 17.8 kg/m2
Weight: NR
Height: NR
Country: Australia
Pathologies: No
Dropouts: 193 (15.5%)
Duration: 9 months.
EG: School nutrition (SN): 10 × 1-h lessons to improve knowledge, attitudes, and eating habits. Program guide and resources including videos.
School + home nutrition (SN + HN): School nutrition + home-based nutrition messages using comics delivered through schools. Educational material for children and parents.
Fitness + school nutrition (FIT + SN): Combined fitness and school nutrition interventions.
CG
Fitness (FIT)
Home nutrition only (HN)
Control (C): Standard school curricula
Duration: 9 months.
EG: Fitness (FIT): 6 × 30-min classroom sessions providing rational basis for activity programs. Physical fitness education with increasing intensity and duration.
Fitness + school nutrition (FIT + SN): Combined fitness and nutrition interventions.
CG
School nutrition (SN)
School + home nutrition (SN + HN)
Home nutrition only (HN),
Control (C): Standard school curricula
Blood pressure
SBP (mmHg)
DBP (mmHg)
Blood lipid
Total cholesterol (mmol/L)
Dietary intake
Total and saturated fat (%)
Polyunsaturated fat (%)
Monounsaturated fat (%)
Protein (%)
Fiber intake (g/day)
Sodium (g/day)
Energy (MJ/day)
Sugar (% energy)
Anthropometrics
BMI (kg/m2)
Triceps skinfold (mm)
Subscapular skinfold (mm)
Body fat (%)
Physical fitness
Leger score (laps)
Run time (min)
Inter-group (p < 0.05)
Dietary intake parameters
↓ Total fat (%): boys (FIT + SN)
↓ Saturated fat (%): girls (SN, SN + HN)
↑ Protein intake: boys (FIT + SN, SN, SN + HN)
↑ Fiber intake: Girls in FIT and SN + HN
↓ Sugar intake: Negative correlations in SN, SN + HN and FIT + SN.
Sodium intake: ↑ girls (FIT, FIT + SN, SN), ↓ boys (SN)
Blood pressure parameters
↓ DBP: Girls in fitness programs (FIT and FIT + SN)
Anthropometric parameters
↓ Triceps skinfold: boys and girls (FIT + SN)
Blood lipid parameters
↑ Total cholesterol: boys (FIT), girls (all groups).
Physical fitness parameters
↑ Leger score: FIT and FIT + SN.
↓ Run time: FIT and FIT + SN.
Colín-Ramírez et al., 2009 [40]N = 498 (EG: 245; CG: 253)
Sex: 52.9% male, 47.1% female
Age: 8–10 years, mean: 9.5 ± 0.7 years
BMI: NR
Weight: NR
Height: NR
Country: Mexico
Pathologies: No
Dropouts: n = 130 (20.7%) EG: 59; CG: 62
Duration: 12 months.
EG: Nutrition education classes (20–30 min/session) weekly for 10 weeks/year, fun activities, healthy talks for parents, homework assignments, menu suggestions and healthy snacks and lifestyle recommendations
CG: Standard school curricula
Duration: 12 months.
EG: Physical education classes (30 min/session) twice weekly, moderate to vigorous PA, exercise breaks during classes (2–10 min), benefits of exercise education
CG: Standard school curricula
Blood pressure
SBP (mmHg)
DBP (mmHg)
Dietary intake
Energy intake (kcal)
Fiber (g)
Carbohydrates (%)
Protein (%)
Total fat (%)
Saturated fat (%)
Monounsaturated fat (%)
Polyunsaturated fat (%)
Cholesterol (mg)
Calcium (mg)
Iron (mg)
Magnesium (mg)
Sodium (mg)
Potassium (mg)
Vitamin C (mg)
Folic acid (μg)
Healthy habits
Nutrition and health knowledge scores
PA attitudes
Intra-group (12 months, p < 0.05)
EG
↓ Energy intake (1895 ± 227 vs. 1827 ± 216 kcal)
↓ Fiber intake (6 ± 1 vs. 3 ± 1 g)
↓ Saturated fat (12 ± 2 vs. 11 ± 1%)
↓ Polyunsaturated fat (6 ± 1 vs. 8 ± 1%)
↓ Calcium (957 ± 131 vs. 914 ± 132 mg)
↓ Iron (12 ± 3 vs. 11 ± 2 mg)
↓ Magnesium (145 ± 22 vs. 134 ± 17 mg)
↓ Sodium (1631 ± 371 vs. 847 ± 292 mg)
↓ Potassium (2092 ± 316 vs. 1465 ± 326 mg)
↓ Vitamin C (80 ± 34 vs. 46 ± 42 mg)
↓ Folic acid (113 ± 27 vs. 98 ± 24 μg)
↑ Knowledge attitudes scores (46.2 to 49.7 points)
CG
↑ Energy intake (1998 ± 265 vs. 2298 ± 436 kcal)
↓ Fiber intake (6 ± 1 vs. 5 ± 2 g)
↑ Carbohydrates (50 ± 4 vs. 53 ± 5%)
↓ Protein (13 ± 1 vs. 12 ± 2%)
↓ Total fat (37 ± 3 vs. 36 ± 4%)
↓ Cholesterol (258 ± 93 vs. 234 ± 84 mg)
↑ Monounsaturated fat (12 ± 2 vs. 13 ± 2%)
↓ Polyunsaturated fat (6 ± 1 vs. 5 ± 2%)
↑ Calcium (1040 ± 161 vs. 1223 ± 265 mg)
↑ Iron (10 ± 2 vs. 13 ± 4 mg)
↓ Magnesium (131 ± 20 vs. 119 ± 39 mg)
↑ Sodium (1309 ± 440 vs. 1626 ± 544 mg)
↑ Potassium (1891 ± 400 vs. 2297 ± 662 mg)
Inter-group (12 months, p < 0.05)
Blood pressure parameters
↓ SBP: EG showed greater reduction in SBP to CG (adjusted for baseline obesity prevalence)
Cardiovascular risk factors prevalence
EG showed significant reduction in overall cardiovascular risk factors prevalence compared to CG, particularly in elevated saturated fat, abdominal fat and, overweight.
Rush et al., 2012 [44]N = 1352 (EG: 692; CG: 660)
Sex: 686 boys, 666 girls
Age: 5–7 years (926 children) and 10–12 years (426 children)
BMI: NR
Weight: NR
Height: NR
Country: New Zealand
Pathologies: No
Dropouts: 20% 5–7 y, 43% 10–12 y
Duration: 2 years
EG: Assigned an “Energizer” (trained nutrition and PA agent). Interventions: canteen makeovers removing pies/cookies, adding healthy options; healthy fundraising; curriculum-based nutrition material; weekly nutrition “nuggets” in newsletters; home-school link program with parent sessions; integrated nutrition lessons.
CG: Maintain school activity
Duration: 2 years
EG: Assigned an “Energizer” (trained nutrition and PA agent).
Interventions: modeling classes for fundamental movement skills, fitness activities, modified games; promotion of active transport, lunchtime games, bike days; student leadership training.
CG: Maintain school activity
Anthropometrics
BMI (standard deviation score, SDS)
% Body fat (SDS)
Blood pressure
SBP (SDS)
DBP (SDS)
Intra-group (p < 0.05)
5–7-year sample
EG: ↑ BMI (0.59) ↑ %BF (0.65) ↓ SBP (−0.38) ↑ DBP (0.90)
CG: ↑ BMI (0.60) ↑ %BF (0.79) ↓ SBP (−0.41) ↑ DBP (0.87)
10–12-year sample
EG: ↑ BMI (0.81) ↑ %BF(1.10) ↑ DBP (1.26)
CG: ↑ BMI (0.76) ↑ %BF (1.06) ↑ DBP (1.40)
Inter-group (p < 0.05) EG vs. CG
5–7-year age group
↓ %BF: intervention effect −0.14 (95% CI: −0.26, −0.01)
10–12-year age group
↓ SBP: intervention effect −0.23 (95% CI: −0.43, −0.02)
Xu et al., 2017 [41]N = 8573 (EG: 5343, CG: 4574)
Sex: 4205 females, 4368 males
Age: 9.0 ± 1.4 years
BMI: EG: 17.1 ± 3.2, CG: 7.0 ± 3.1 kg/m2
Weight: NR
Height: NR
Country: China
Pathologies: Childhood obesity focus
Dropouts: 1294 (13.1%) EG: 633, CG: 661
Duration: 12 months.
EG: Cartoon-style nutrition education handbook distributed to students, 6 nutrition lectures for students (minimum 40 min each), 2 lectures for parents, 4 lectures for teachers and health workers. Contents included healthy eating proportions, beverage and snack choices, reducing fast food consumption.
CG: Standard school curricula
Duration: 12 months.
EG: “Happy 10” program–classroom-based PA intervention, 10 min of moderate intensity, age- and space-appropriate PA twice daily at school. Activities included games, dance, rhythmic gymnastics. Average energy expenditure: 25.0–35.1 kcal per 10-min session.
CG: Standard school curricula
Anthropometrics
BMI (kg/m2)
Zbmi
Body fat (%)
WC (cm)
Overweight prevalence
Blood biomarkers
Glucose (mmol/L)
Insulin (mU/mL)
Total cholesterol (mmol/L)
Triglycerides (mmol/L) HDL cholesterol (mmol/L)
LDL cholesterol (mmol/L)
Physical activity level
PA time (minutes/week)
Healthy habits
Nutrition knowledge, attitudes, and practices scores
Intra-group (p < 0.05)
EG
↑ BMI (17.0 ± 3.3 vs. 17.6 ± 3.5 kg/m2)
↓ BMI z-scores (0.23 ± 1.37 vs. 0.12 ± 1.40)
↑ Body fat (26.9 ± 7.1 vs. 28.0 ± 7.0%)
↑ WC (57.9 ± 8.8 vs. 61.0 ± 9.9 cm)
↓ Glucose (4.58 ± 0.54 vs. 4.53 ± 0.43 mmol/L)
↓ Total cholesterol (4.24 ± 0.77 vs. 4.10 ± 0.79 mmol/L)
↑ PA time (815.9 ± 420.6 vs. 855.1 ± 405.6 min/week)
CG
↑ BMI (17.1 ± 3.2 vs. 17.9 ± 3.6 kg/m2)
↑ BMI z-scores (0.19 ± 1.30 vs. 0.22 ± 1.39)
↑ Body fat (26.8 ± 7.2 vs. 28.6 ± 6.8%)
↑ WC (57.5 ± 8.9 vs. 61.1 ± 10.1 cm)
↑ Glucose (4.53 ± 0.51 vs. 4.68 ± 0.49 mmol/L)
↑ Total cholesterol (4.00 ± 0.82 vs. 4.18 ± 0.74 mmol/L)
↑ Overweight/obesity prevalence (22.7% vs. 24.2%)
Inter-group (p < 0.05) EG vs. CG
↓ BMI: −0.3 kg/m2 (95% CI: −0.4, −0.2)
↓ BMI z-scores: −0.14 (95% CI: −0.18, −0.11)
↓ Body fat: −0.8% (95% CI: −0.9, −0.6)
↓ WC: −0.5 cm (95% CI: −0.6, −0.3)
↓ Glucose: −0.20 mmol/L (95% CI: −0.24, −0.16)
↓ Total cholesterol: −0.32 mmol/L (95% CI: −0.34, −0.30)
↓ HDL cholesterol: −0.09 mmol/L (95% CI: −0.11, −0.07)
↑ PA time: +46.0 min/week
Hrafnkelsson et al., 2014 [49]N = 267 (EG: 128; CG: 139)
Sex: NR
Age: 7.3 ± 0.3 years
BMI: NR
Weight: 26.3 ± 4.4 kg
Height: 127.0 ± 5.2 cm
Country: Iceland (Reykjavik)
Pathologies: No
Dropouts: 45 (16.8%) EG: 17, CG: 28
Duration: 2 years
EG: General nutrition education focusing on increasing fruit and vegetable intake, with educational material and homework assignments. Food-based dietary guidelines on fish, fish liver oil and milk intake. Parents, teachers, and school food service staff involved in intervention.
CG: Standard school curricula
Duration: 2 years
EG: Progressive PA program starting with approximately 30 min/day at study start, increasing to approximately 60 min/day in the second year. Teachers integrated PA into daily school routine using various strategies. Extra PE lesson per week introduced in autumn 2007 (discontinued in autumn 2008).
CG: Standard PA program at school
Blood pressure
SBP (mmHg)
DBP (mmHg)
Body composition
Body fat (%)
Weight (kg)
BMI (kg/m2)
Sum of five skinfolds (mm)
Metabolic markers
Total cholesterol (mmol/L)
HDL-cholesterol (mmol/L)
LDL-cholesterol (mmol/L)
Triglycerides (mmol/L)
Fasting glucose, (mmol/L)
HbA1c (%)
S-Insulin (mU/L)
Physical fitness
Fitness (watts/kg)
Dietary intake
Fruit and vegetable intake Fiber intake
Intra-group (p < 0.05)
EG
↑ Fruit and vegetable intake (+47%)
↑ Fiber intake (+17%)
CG
↓ Fruit and vegetable intake (−27%)
Inter-group (p < 0.05) EG vs. CG
Not observed
Reinehr et al., 2010 [50]N = 66 (EG: 34; CG: 32)
Sex: 28 male, 38 female
Age: 11.5 ± 1.6 years
BMI: 23.4 ± 1.5 kg/m2
Weight: NR
Height: NR
Country: Germany
Pathologies: Overweight (BMI >90th to <97th percentile)
Dropouts: 6 (9%) EG: 1; CG: 5
Duration: 6 months
EG: Nutritional course based on “Optimized mixed diet” with traffic-light system for food selection (30% fat, 15% protein, 55% carbohydrates including 5% sugar vs. typical German diet of 38% fat, 13% protein, 49% carbohydrates including 14% sugar). Six group sessions (1.5 h each) in intensive phase plus individual nutrition counseling sessions.
CG: No intervention
Duration: 6 months
IG: PA training once weekly (1.5 h per session) including ball games, jogging, trampoline jumping, dancing for girls, wrestling for boys, and instructions for daily life PA and reducing TV/computer time.
CG: No intervention
Blood pressure
SBP (mmHg)
DBP (mmHg)
Body composition
BMI-(SDS)
BMI (kg/m2)
WC (cm)
Triceps and Subscapular skinfold (cm)
Fat mass (%)
Lean body mass (kg)
Dietary intake
Energy intake (kcal/day) Fat (E%)
Protein (E%)
Carbohydrate (E%)
Sugar (E%)
Healthy habits
Sports activity (survey)
TV consumption (h/week) Computer use (h/week)
Intra-group (p < 0.05)
EG
↓ BMI-SDS (−0.26 ± 0.22)
↓ BMI (−0.85 ± 1.02 kg/m2)
↓ WC (−6 ± 8 cm)
↓ Triceps skinfold (−5 ± 7 cm)
↓ Subscapular skinfold (−4 ± 8 cm)
↓ Fat mass (−6 ± 8% skinfold; −2.7 ± 4.9% bioimpedance)
↑ Lean body mass (+6.0 ± 9.9 kg)
↓ SBP (−7 ± 4 mmHg)
↓ DBP (−6 ± 4 mmHg)
↓ Energy intake (1651 ± 433 vs. 1372 ± 341 kcal/day)
↓ Fat intake (35 ± 6 vs. 32 ± 5 E%)
↑ Protein intake (14 ± 2 vs. 16 ± 3 E%)
↓ Sugar intake (13 ± 5 vs. 9 ± 4 E%)
↑ Sports activity (2.6 ± 0.9 vs. 2.9 ± 0.9)
CG
↑ BMI (+0.76 ± 0.99 kg/m2)
Inter-group (p < 0.05) EG vs. CG
↓ BMI-SDS: −0.31 (CG: +0.05 ± 0.19; EG: −0.26 ± 0.22)
↓ BMI: −1.61 kg/m2 (CG: +0.76 ± 0.99; EG: −0.85 ± 1.02)
↓ WC: −6.0 cm (CG: 0.0 ± 1; EG: −6 ± 8)
↓ Triceps skinfold: −7.0 cm (CG: +2 ± 6; EG: −5 ± 7)
↓ Subscapular skinfold: −7.0 cm (CG: +3 ± 8; EG: −4 ± 8)
↓ Fat mass (skinfold): −8.6% (CG: +2.6 ± 7.8; EG: −6 ± 8)
↓ Fat mass (bioimpedance): −2.9 kg (CG: +0.2 ± 2.6; EG: −2.7 ± 4.6)
↓ SBP: −6.0 mmHg (CG: −1 ± 5; EG: −7 ± 4)
↓ DBP: −4.0 mmHg (CG: −2 ± 7; EG: −6 ± 4)
Sauder et al., 2017 [45]N = 62 (EG: 29; CG: 33)
Sex: 32 male, 30 female
Age: EG: 9.3 ± 1.0, CG: 9.1 ± 1.1 years
BMI: EG: 26.4 ± 4.7, CG: 26.1 ± 4.5 kg/m2 Weight: NR
Height: NR
Country: United States
Pathologies: Overweight/obese American Indian children (BMI ≥85th percentile)
Dropouts: n = 2
Duration: 8 months (4 months intensive + 4 months maintenance)
EG: Tribal Turning Point program with “5−2-1-0” messaging (≥5 servings fruits/vegetables, ≤2 h screen time, ≥1 h PA, 0 sugary beverages daily). Traffic Light Diet system for food selection. 10 group classes (2 h each) over 4 months + 2 booster classes in spring. Individual motivational interviewing sessions and resource toolbox.
CG: Three 1-h health and safety group sessions (bullying, drug/alcohol prevention, first aid, fire safety, bike safety) with healthy group meals.
Duration: 8 months
EG: PA component integrated into group classes (10–20 min per session). Optional 60-min “Kids Work-Out” before each session with games and activities. PA education and goal-setting.
CG: No structured PA intervention.
Blood pressure
SBP (mmHg)
DBP (mmHg)
Body composition
BMI (kg/m2)
Zbmi
WC (cm)
Metabolic markers Fasting insulin (uU/mL) Fasting glucose (mg/dL) HbA1c (%)
HOMA-IR
Healthy habits
PACER fitness test (laps) MVPA (30-min blocks) Screen time (30-min blocks)
PA self-efficacy
Dietary self-efficacy
Intra-group (p < 0.05)
IG
↓ BMI z-score (−0.17)
↑ PACER laps (+1.8)
↑ MVPA (+4.2)
↑ PA self-efficacy (+0.6)
CG:
↑ BMI (+1.0)
↑ WC (+3.7)
↑ PACER laps (+1.9)
↑ MVPA (+6.1)
Inter-group (p < 0.05) EG vs. CG
↓ BMI z-score: −0.18 (IG: −0.17 vs. CG: +0.01)
↓ WC: −2.5 cm (IG: +1.2 vs. CG: +3.7 cm)
Burke et al., 1998 [46]N = 800 (Distribution by groups: NR)
Sex: 409 male, 391 female
Age: 11 years old
BMI: 16.8 kg/m2 (lower risk boys), 21.1 kg/m2 (higher risk boys), 17.5 kg/m2 (lower risk girls), 19.2 kg/m2 (higher risk girls)
Weight: NR
Height: NR
Country: Australia
Pathologies: 29% identified as higher cardiovascular risk
Dropouts: 80
Duration: 2 school terms (20 weeks)
EG: Updated WASPAN nutrition program including comic books featuring space creatures learning human dietary habits, teachers’ handbook, home-based mission booklet, class activities, incentives, and recipe booklet. Focus on reducing fat, sugar, and salt intake while increasing fiber intake. 1 h per week nutrition classes.
CG: Standard school curriculum only
Duration: 2 school terms (20 weeks)
EG: Six classroom lessons plus innovative 20-min fitness sessions daily (4 sessions/week) using small group activities allowing for individual fitness levels. 37% sessions lasted 15 min, 55% lasted 20 min, 8% lasted 25 min.
CG: Standard school curriculum only
Blood pressure
SBP (mmHg)
DBP (mmHg)
Body composition
BMI (kg/m2)
Weight-for-height-for-age (WHA)
Subscapular skinfold (mm)
Triceps skinfold (mm) Body fat (%)
Metabolic markers
Total cholesterol (mmol/L)
Physical fitness
Leger shuttle run (laps)
1.6 km run time (min)
Healthy habits
Leisure-time PA (h/week)
Television watch (h/week)
Intake (sodium, fat, fiber)
Intra-group (p < 0.05)
All program groups
↑ Physical fitness in both boys and girls at WASPAN and enrichment schools
↑ BMI and WHA in boys at WASPAN schools only
Higher risk boys in enrichment schools
Greatest improvement in fitness ↓ Time for 1.6 km run
Inter-group (p < 0.05) EG vs. CG
↑ Shuttle run laps: Greatest improvement in higher risk boys in enrichment schools vs. other groups
↑ Fitness improvements in girls from program schools vs. controls
↓ Subscapular skinfolds: Girls in enrichment schools vs. other groups
↓ Triceps skinfolds: Enrichment vs. control groups
↓ Cholesterol: Higher risk girls and boys in enrichment schools
↓ Sodium intake: Both boys and girls in enrichment schools
↓ TV watching: Boys in enrichment schools
Walter et al., 1989 [42]N = 3388 (EG: 2075, CG: 1313)
Sex: 1725 males, 1663 females
Age: 8.9–9.1 years
BMI: NR
Weight: NR
Height: NR
Country: United States
Pathologies: No
Dropouts: Westchester: 911 (82.4%) participated at baseline, 593 (65.1%) eligible for 6-year analysis. Bronx: 1563 (68.5%) participated at baseline, 1036 (66.3%) qualified for 5-year analysis.
Duration: 5–6 years
EG: “Know Your Body” (KYB) curriculum focusing on “prudent diet” with daily total fat <30% calories, saturated fat <10% calories, total carbohydrate >55% calories, cholesterol <300 mg, sodium <2 g, decreased refined sugar, increased complex carbohydrates and fiber, maintain ideal body weight. Approximately 2 h per week throughout each school year. Parent education component included newsletters, curriculum activities, and evening seminars.
CG: Standard school curriculum only
Duration: 5–6 years
EG: Physical fitness component promoting regular endurance exercise program to supplement skill/strength exercises. Integrated into KYB curriculum (~2 h per week).
CG: Standard school curriculum only.
Blood pressure
SBP (mmHg)
DBP (mmHg)
Body composition
Ponderosity index (kg/m)
Triceps skinfold (mm)
Metabolic markers
Total cholesterol (mg/dL) HDL cholesterol (mg/dL)
Physical fitness
Recovery index (score)
Healthy habits
24-h dietary recall
(total fat %, saturated and polyunsaturated fat %, carbohydrate %, cholesterol and sodium in mg)
Knowledge test scores (prevention-related) Cigarette smoking initiation (biochemically verified)
Intra-group (p < 0.05)
Westchester EG
↓ Total cholesterol (−8.5 mg/dL or 5.1% net decline)
↓ Total fat intake (−3.6%)
↑ Total carbohydrate intake (+4.5%)
↑ Knowledge test scores (+22.6% net increase)
Bronx EG
↓ Total cholesterol (−5.0 mg/dL or 2.9% net decline)
↓ Saturated fat intake (−2.1%)
↑ Knowledge test scores (+18.8% net increase)
Inter-group (p < 0.05) EG vs. CG
Westchester
↓ Total cholesterol: −1.7 mg/dL per year (95% CI: −2.7 to −0.7)
↓ Total fat intake: −3.6% (95% CI: −7.1 to −0.1)
↑ Carbohydrate intake: +4.5% (95% CI: +0.1 to +8.9)
↑ Knowledge scores: +0.14 per year (95% CI: +0.06 to +0.22)
↓ Cigarette smoking initiation: 73.3% reduction (3.5% in intervention vs. 13.1% in control schools)
Bronx
↓ Total cholesterol: −1.0 mg/dL per year (95% CI: −2.3 to +0.3)
↓ Saturated fat intake: −2.1% (95% CI: −4.7 to +0.5)
↑ Knowledge scores: +0.12 per year (95% CI: +0.03 to +0.21)
Pedrosa et al., 2011 [51]N= 61 (EG: 42, CG: 19)
Sex: 27 male, 34 female
Age: 8.4–9.3 years
BMI: 22.4–22.6 kg/m2
Weight: 40.9–44.2 kg
Height: 134.1–137.5 cm
Country: Portugal
Pathologies: Overweight/obese children (≥85th BMI percentile), 51 obese (≥95th percentile), 10 overweight (85–95th percentile)
Dropouts: n = 22, EG: 16, CG: 6.
Duration: 1 year
EG: Individual healthy eating plan (~1800 kcal) prescribed and explained to children and parents. Nutritional counseling at follow-up visits (3, 6, and 12 months).
CG: Four group-based nutrition education sessions (60 min each) distributed over first semester, conducted by nutritionist. Children and parents participated together. Sessions covered childhood obesity, healthy eating habits, cooking methods, portion control, food labeling.
Duration: 1 year
EG: PA was encouraged and sedentary behaviors (TV watching, computer/video games) were discouraged. No structured exercise program described.
CG: No intervention.
Blood pressure
SBP (mmHg)
DBP (mmHg)
Body composition
Zbmi
WC (cm)
WC/height ratio
Metabolic markers
Fasting glucose (mmol/L) Insulin (pmol/L)
HOMA-IR
HDL cholesterol (mmol/L) Triglycerides (mmol/L)
Apolipoprotein A-I and B (g/L)
Adipokines and hormones Leptin (ng/mL)
Adiponectin (μg/mL)
Ghrelin (pg/mL)
C-reactive protein (mg/L)
Homocysteine (μmol/L)
MS prevalence
Using modified NCEP ATP III criteria
Intra-group (p < 0.05)
EG + CG (time effect)
↓ Zbmi: Significant decrease over time
↓ WC/height ratio: Significant decrease over time
↓ DBP: Improvement over time
↑ HDL cholesterol: Increase over time
↓ Triglycerides: Decrease over time
↑ Ghrelin: Increase over time
Inter-group (p < 0.05) EG vs. CG
↓ BMI z-score: Greater decrease in CG vs. EG (p = 0.042)
↓ WC/height ratio: Greater improvement in CG vs. EG (p = 0.042)
↑ HDL: Greater increase in CG vs. EG (p = 0.042)
↑ Ghrelin: Different behavior between groups–increased in CG while decreased in EG (p = 0.039)
Note. EG: Experimental group; CG: Control group; BMI: body mass index; SBP: systolic blood pressure; DBP: diastolic blood pressure; CI: confidence interval; HOMA-IR: homeostasis model assessment of insulin resistance; HDL: high-density lipoprotein; LDL: low-density lipoprotein; PA: physical activity; MVPA: moderate-to-vigorous physical activity; WC: waist circumference; Zbmi: BMI z-score standard deviation score; MS: metabolic syndrome; CRP: C-reactive protein; HbA1c: glycated hemoglobin; ↑ indicates increase; ↓ indicates decrease; NR: not reported.
Disclaimer/Publisher’s Note: The statements, opinions and data contained in all publications are solely those of the individual author(s) and contributor(s) and not of MDPI and/or the editor(s). MDPI and/or the editor(s) disclaim responsibility for any injury to people or property resulting from any ideas, methods, instructions or products referred to in the content.

