Article

Research on Oriented Object Detection in Aerial Images Based on Architecture Search with Decoupled Detection Heads

1
School of Computer Science and Technology, Zhejiang Sci-Tech University, Hangzhou 310018, China
2
Hangzhou Neptune Technology Co., Ltd., Zhejiang Sci-Tech University, Room 223-155, Building 11, Qiantang New District, Hangzhou 310018, China
*
Author to whom correspondence should be addressed.
Appl. Sci. 2025, 15(15), 8370; https://doi.org/10.3390/app15158370
Submission received: 19 June 2025 / Revised: 23 July 2025 / Accepted: 25 July 2025 / Published: 28 July 2025
(This article belongs to the Special Issue Innovative Applications of Artificial Intelligence in Engineering)

Abstract

Object detection in aerial images can provide great support in traffic planning, national defense reconnaissance, hydrographic surveys, infrastructure construction, and other fields. Objects in aerial images are characterized by small pixel–area ratios, dense arrangements between objects, and arbitrary inclination angles. In response to these characteristics and problems, we improved the feature extraction network Inception-ResNet using the Fast Architecture Search (FAS) module and proposed a one-stage anchor-free rotation object detector. The structure of the object detector is simple and only consists of convolution layers, which reduces the number of model parameters. At the same time, the label sampling strategy in the training process is optimized to resolve the problem of insufficient sampling. Finally, a decoupled object detection head is used to separate the bounding box regression task from the object classification task. The experimental results show that the proposed method achieves mean average precision (mAP) of 82.6%, 79.5%, and 89.1% on the DOTA1.0, DOTA1.5, and HRSC2016 datasets, respectively, and the detection speed reaches 24.4 FPS, which can meet the needs of real-time detection.

1. Introduction

Aerial image object detection involves analyzing images captured by satellites or drones to locate and classify specific targets, and is an important application in the field of computer vision.
With the continuous improvements in computing power, traditional image recognition algorithms relying on manual feature extraction are becoming increasingly inadequate for detecting targets in remote sensing images. Compared with traditional object detection methods, object detection based on convolutional neural networks is more robust and less affected by image lighting or resolution. This approach enhances detection efficiency and accuracy, enabling automated target detection in aerial images.
Many challenges are encountered in object detection using aerial images. For example, the pixels of targets that need to be detected in the image, such as cars and bridges, are relatively small, usually less than 20   P i x × 20   P i x , and they are often densely arranged, making identification difficult.
Since the use of horizontal object detection boxes causes adjacent targets to overlap during detection, it is difficult for general object detection models such as YOLO [1] and Faster-RCNN [2] to solve dense detection and skewed detection problems.
The dense oriented object detection system based on convolutional neural networks exhibits excellent recognition performance. Convolutional neural networks possess strong feature extraction capabilities, enabling the extraction of feature information from a large number of densely arranged targets and facilitating corresponding weight adjustments.
The main research contributions of this paper are as follows:
  • Feature fusion network design based on automated structure search
    The FAS module is incorporated into the Inception-ResNet feature extraction network for general object detection. This module enables automatic identification of optimal feature fusion paths, mitigating content loss in large-scale, dense rotated targets during multi-layer feature extraction and overcoming the limitations of manually designed fusion paths. Additionally, by designing the search space and search strategy, the proposed method resolves the issue of wide-ranging architecture search methods being infeasible on a single GPU.
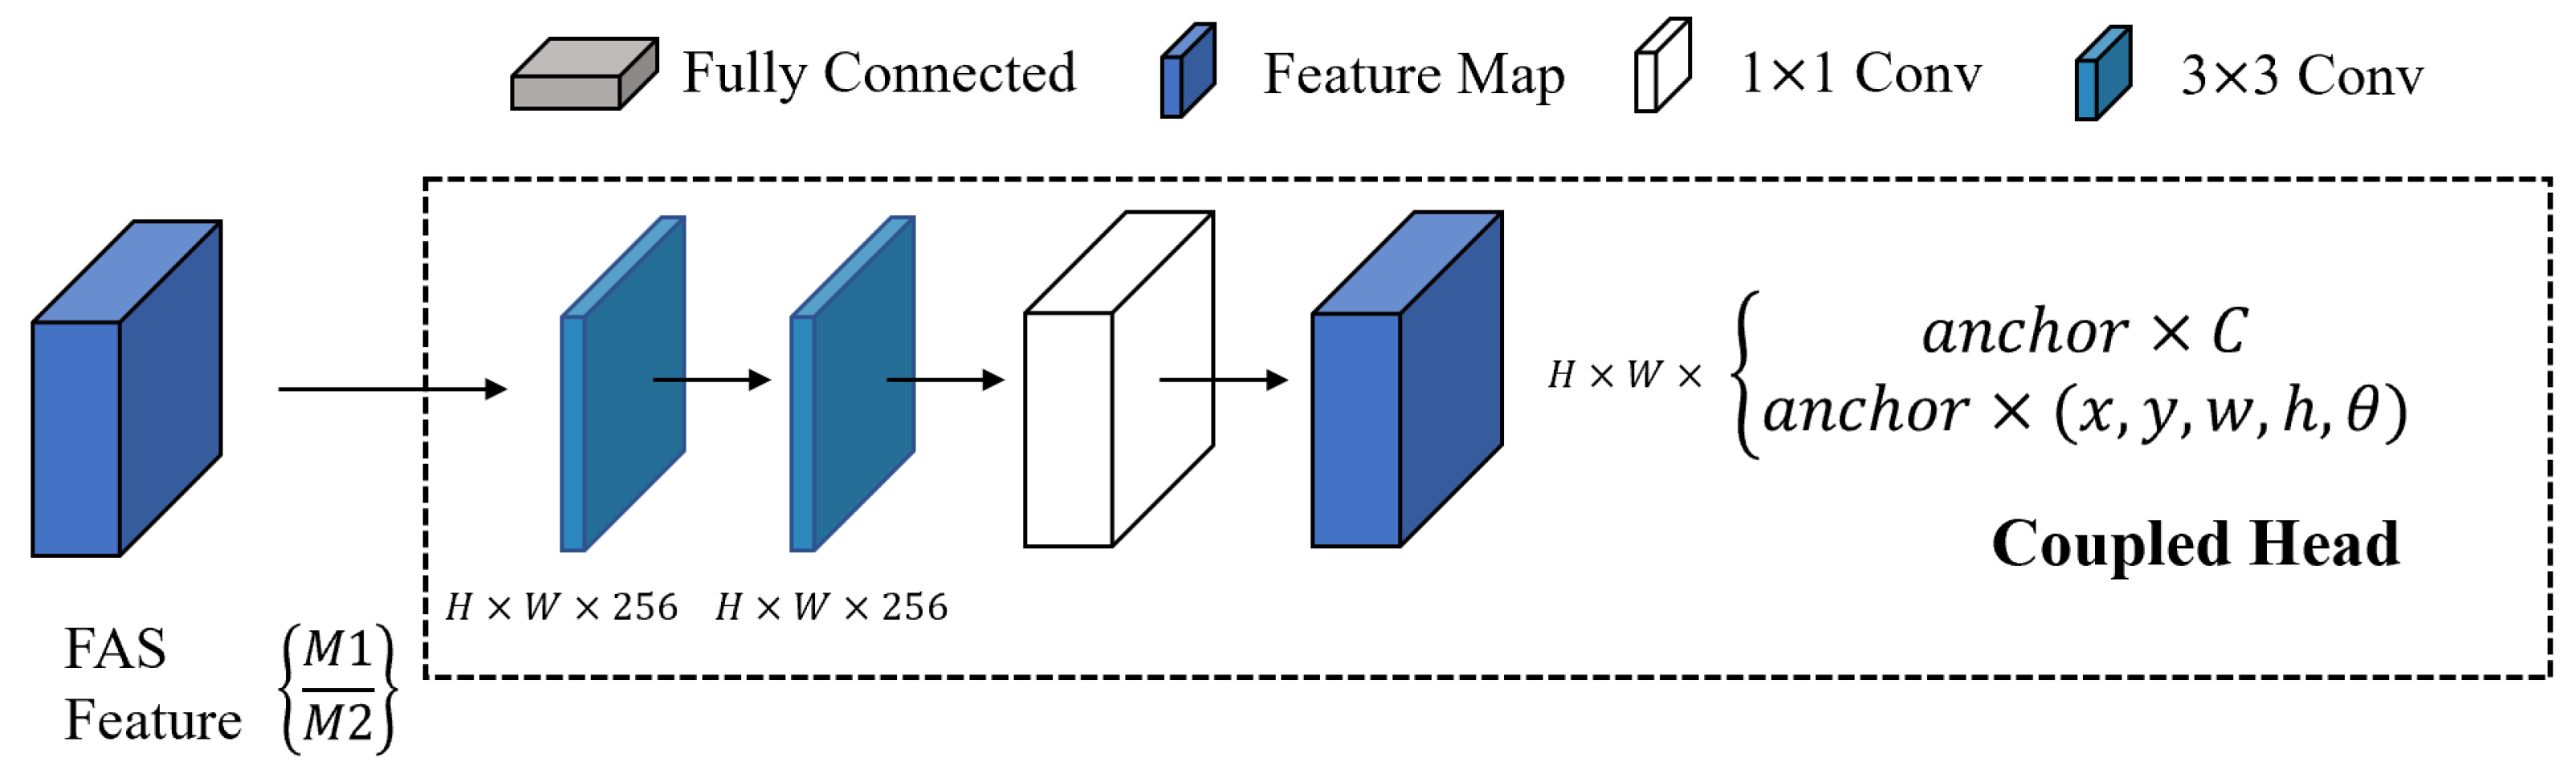
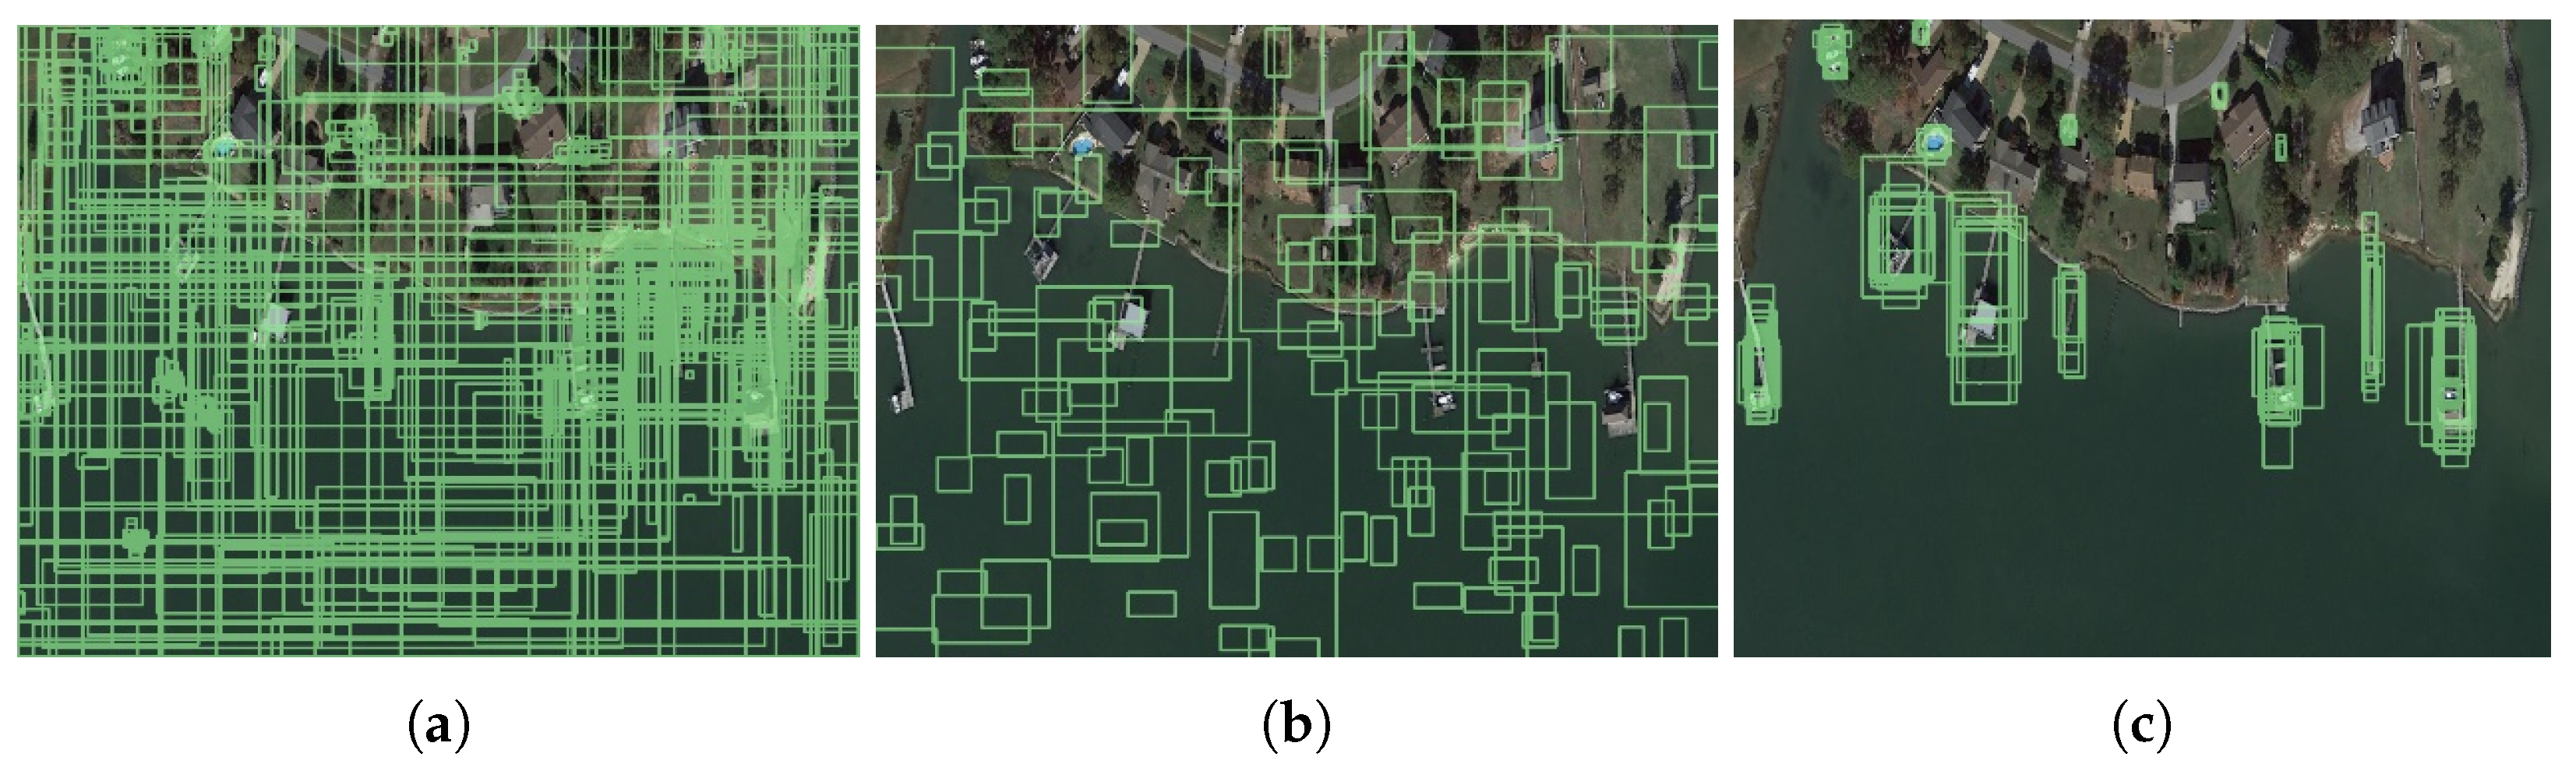
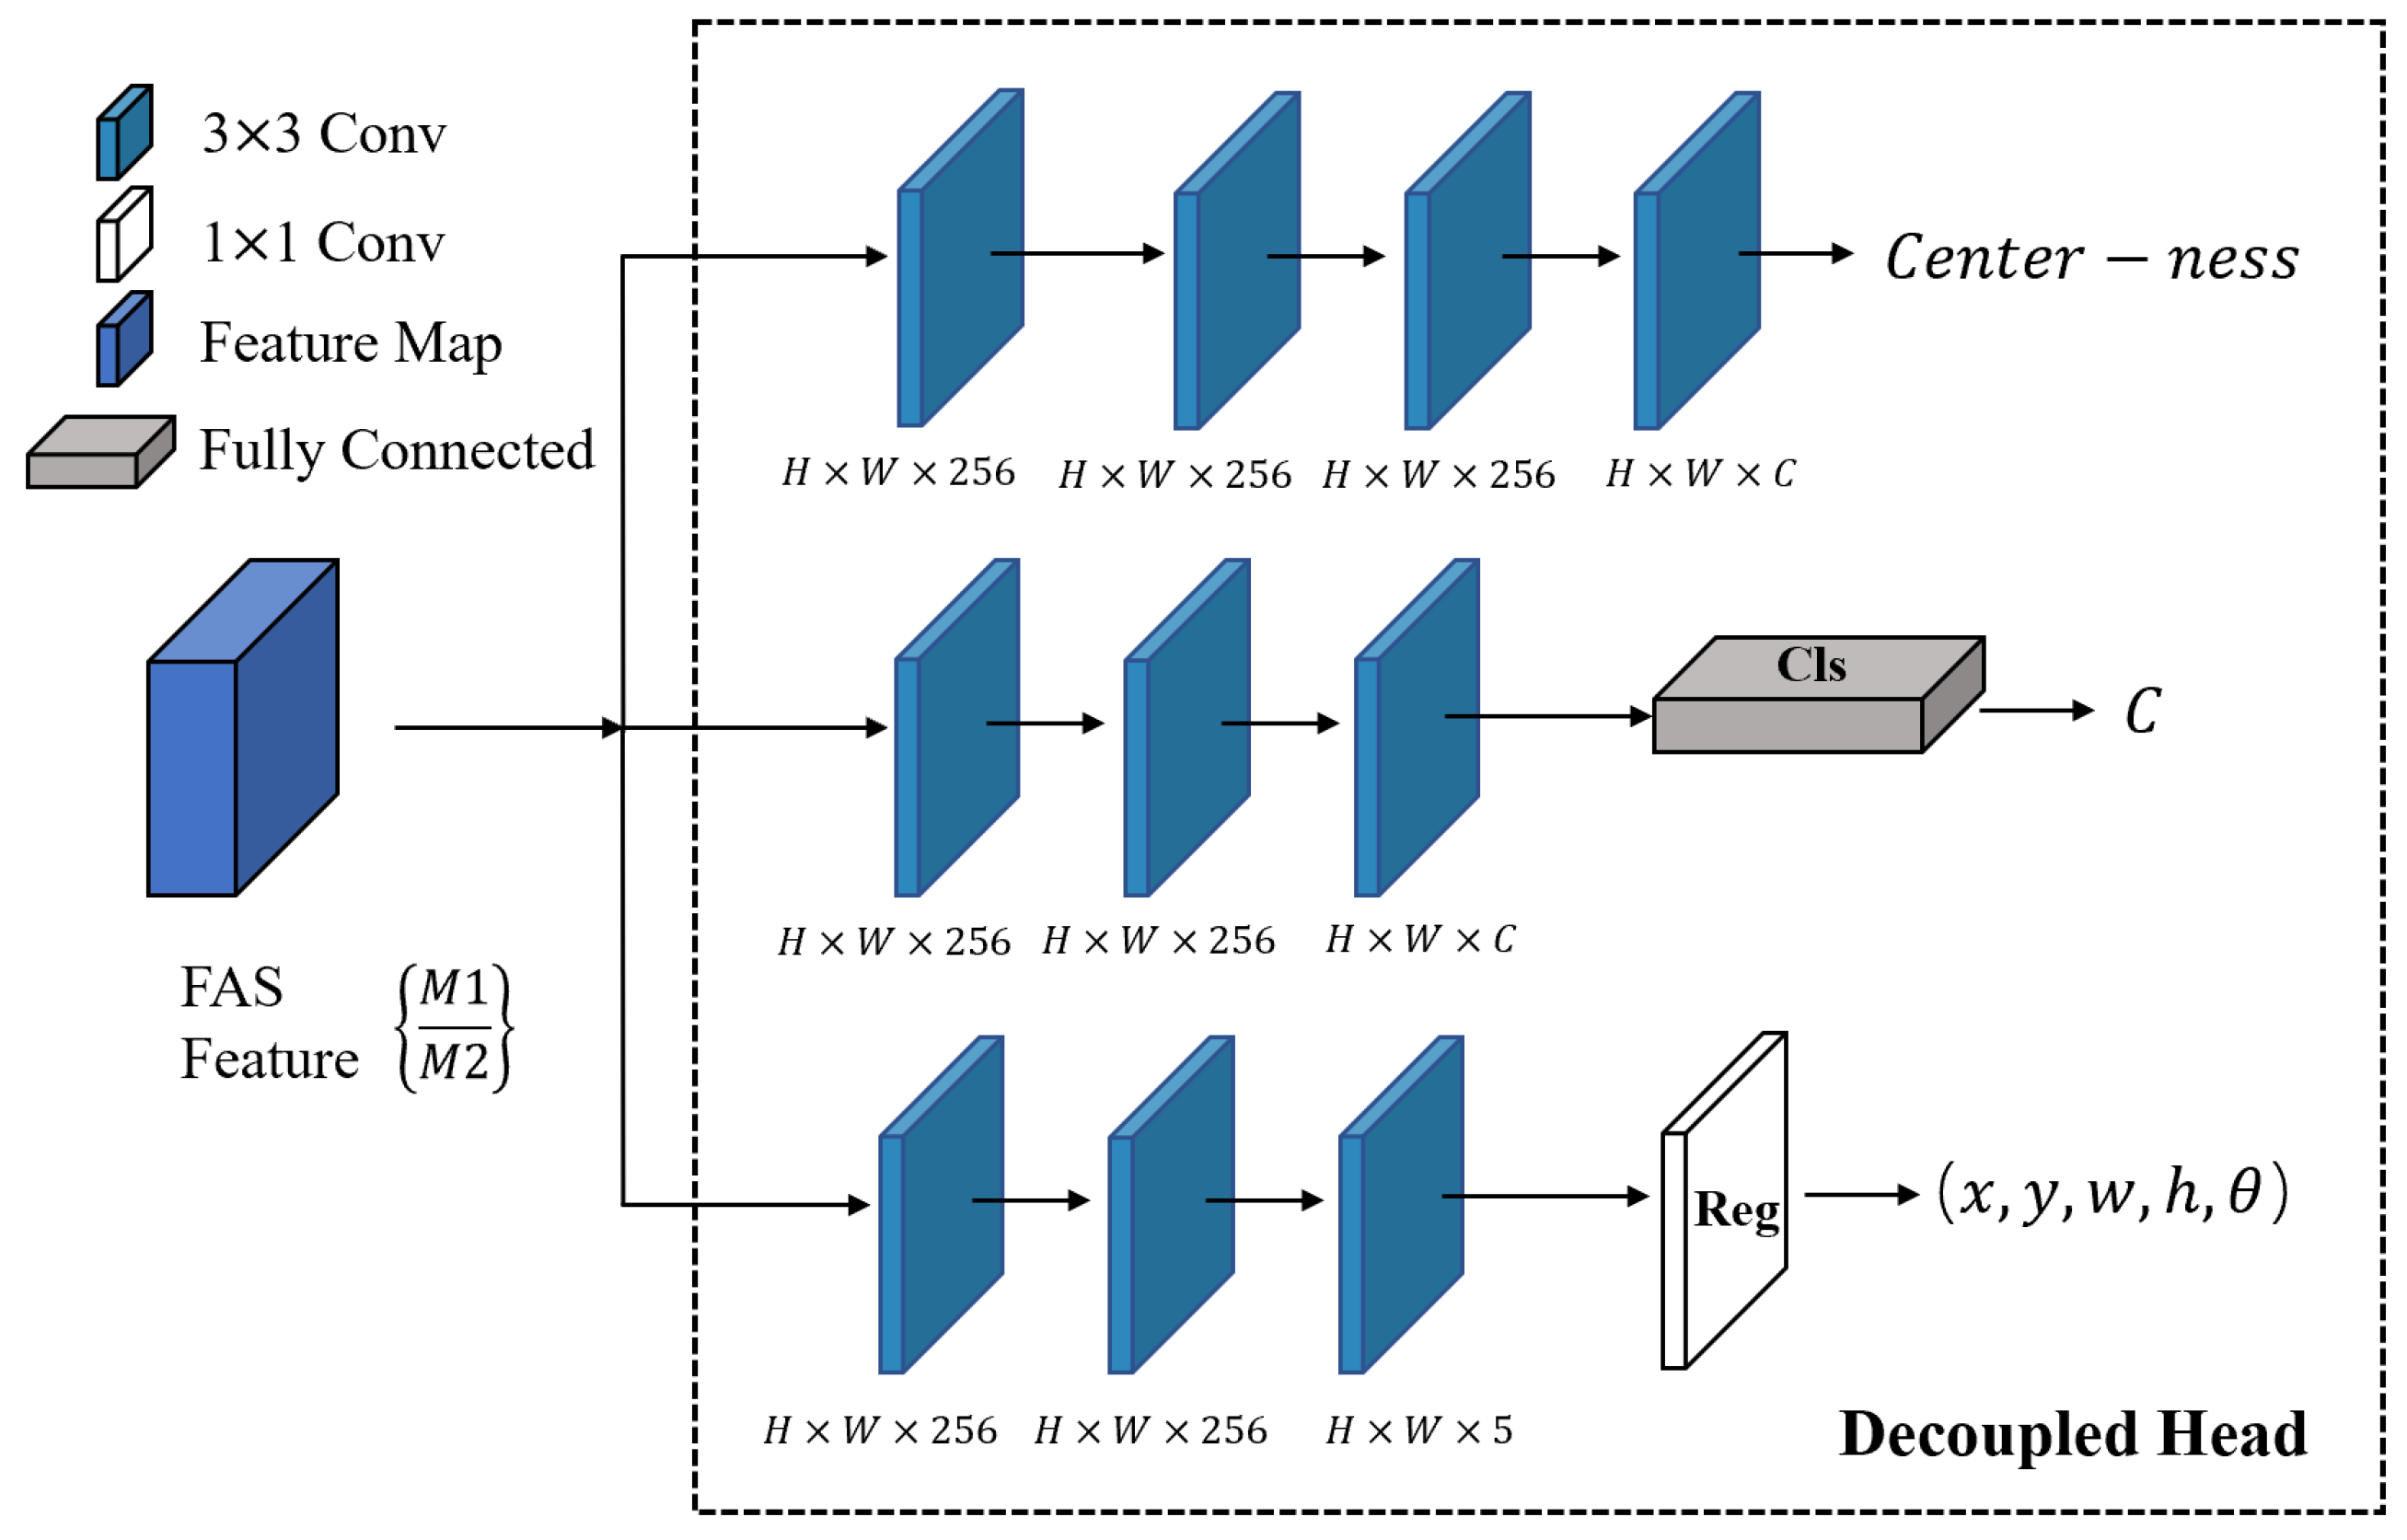
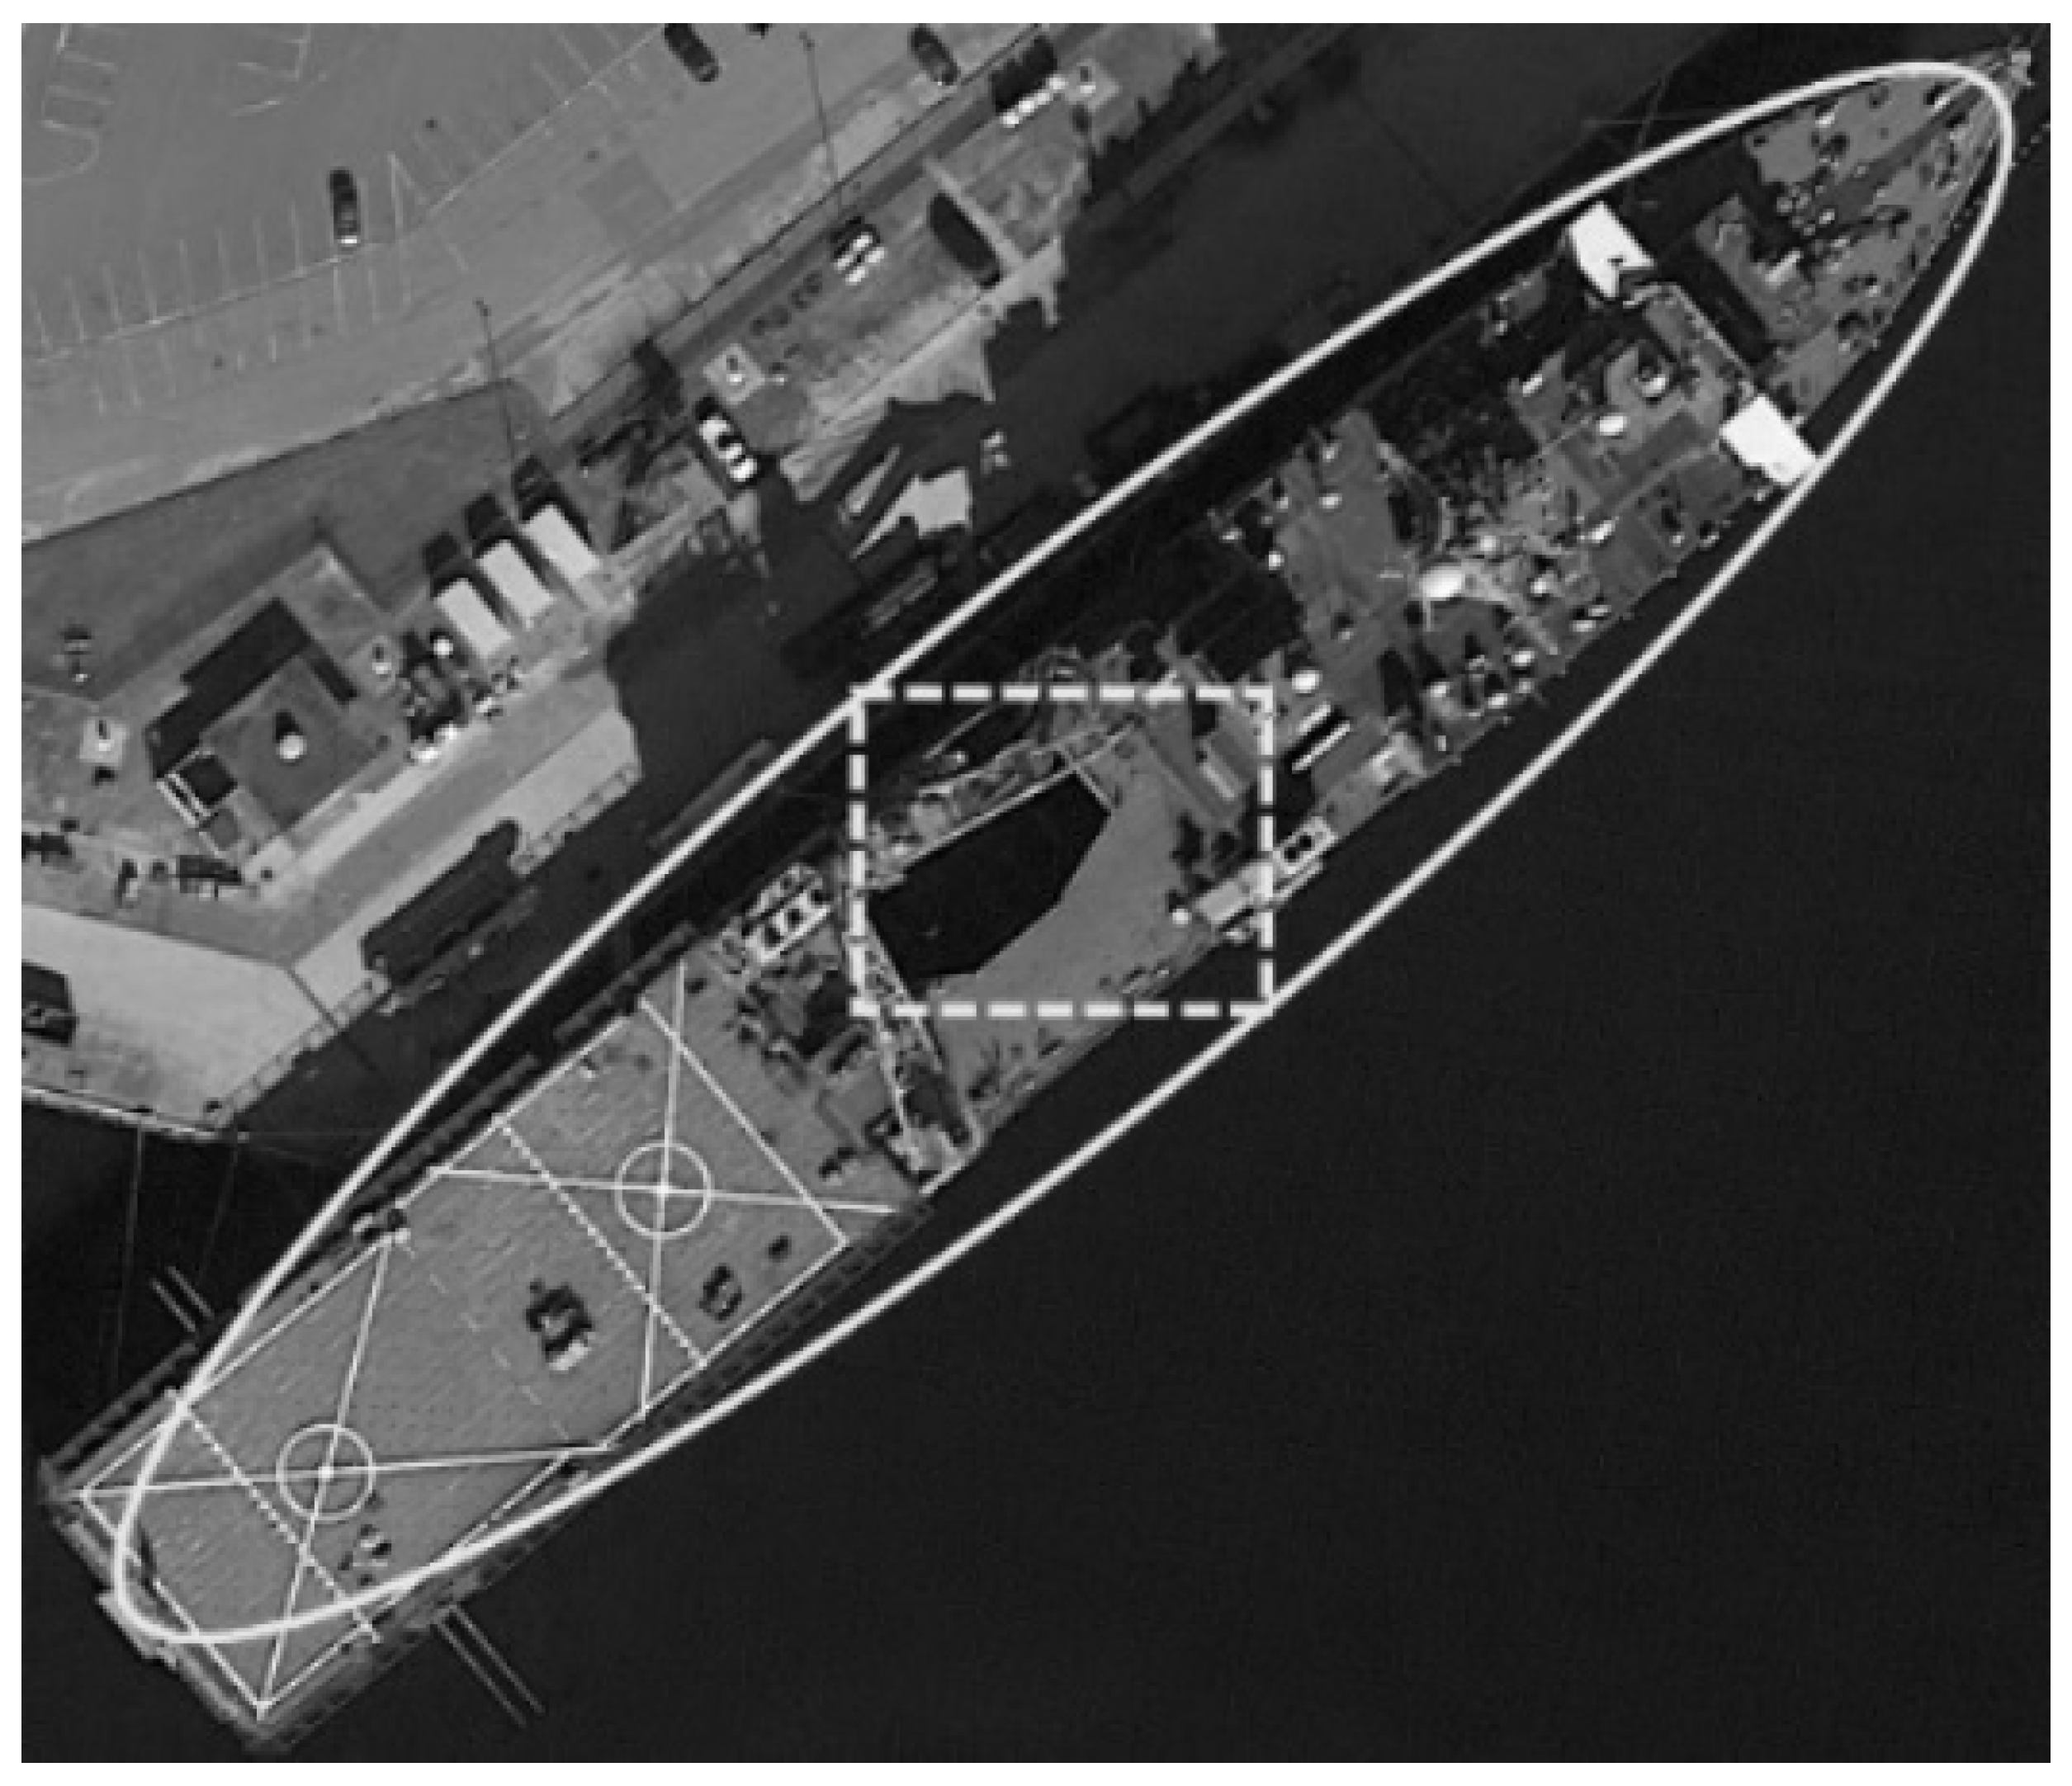
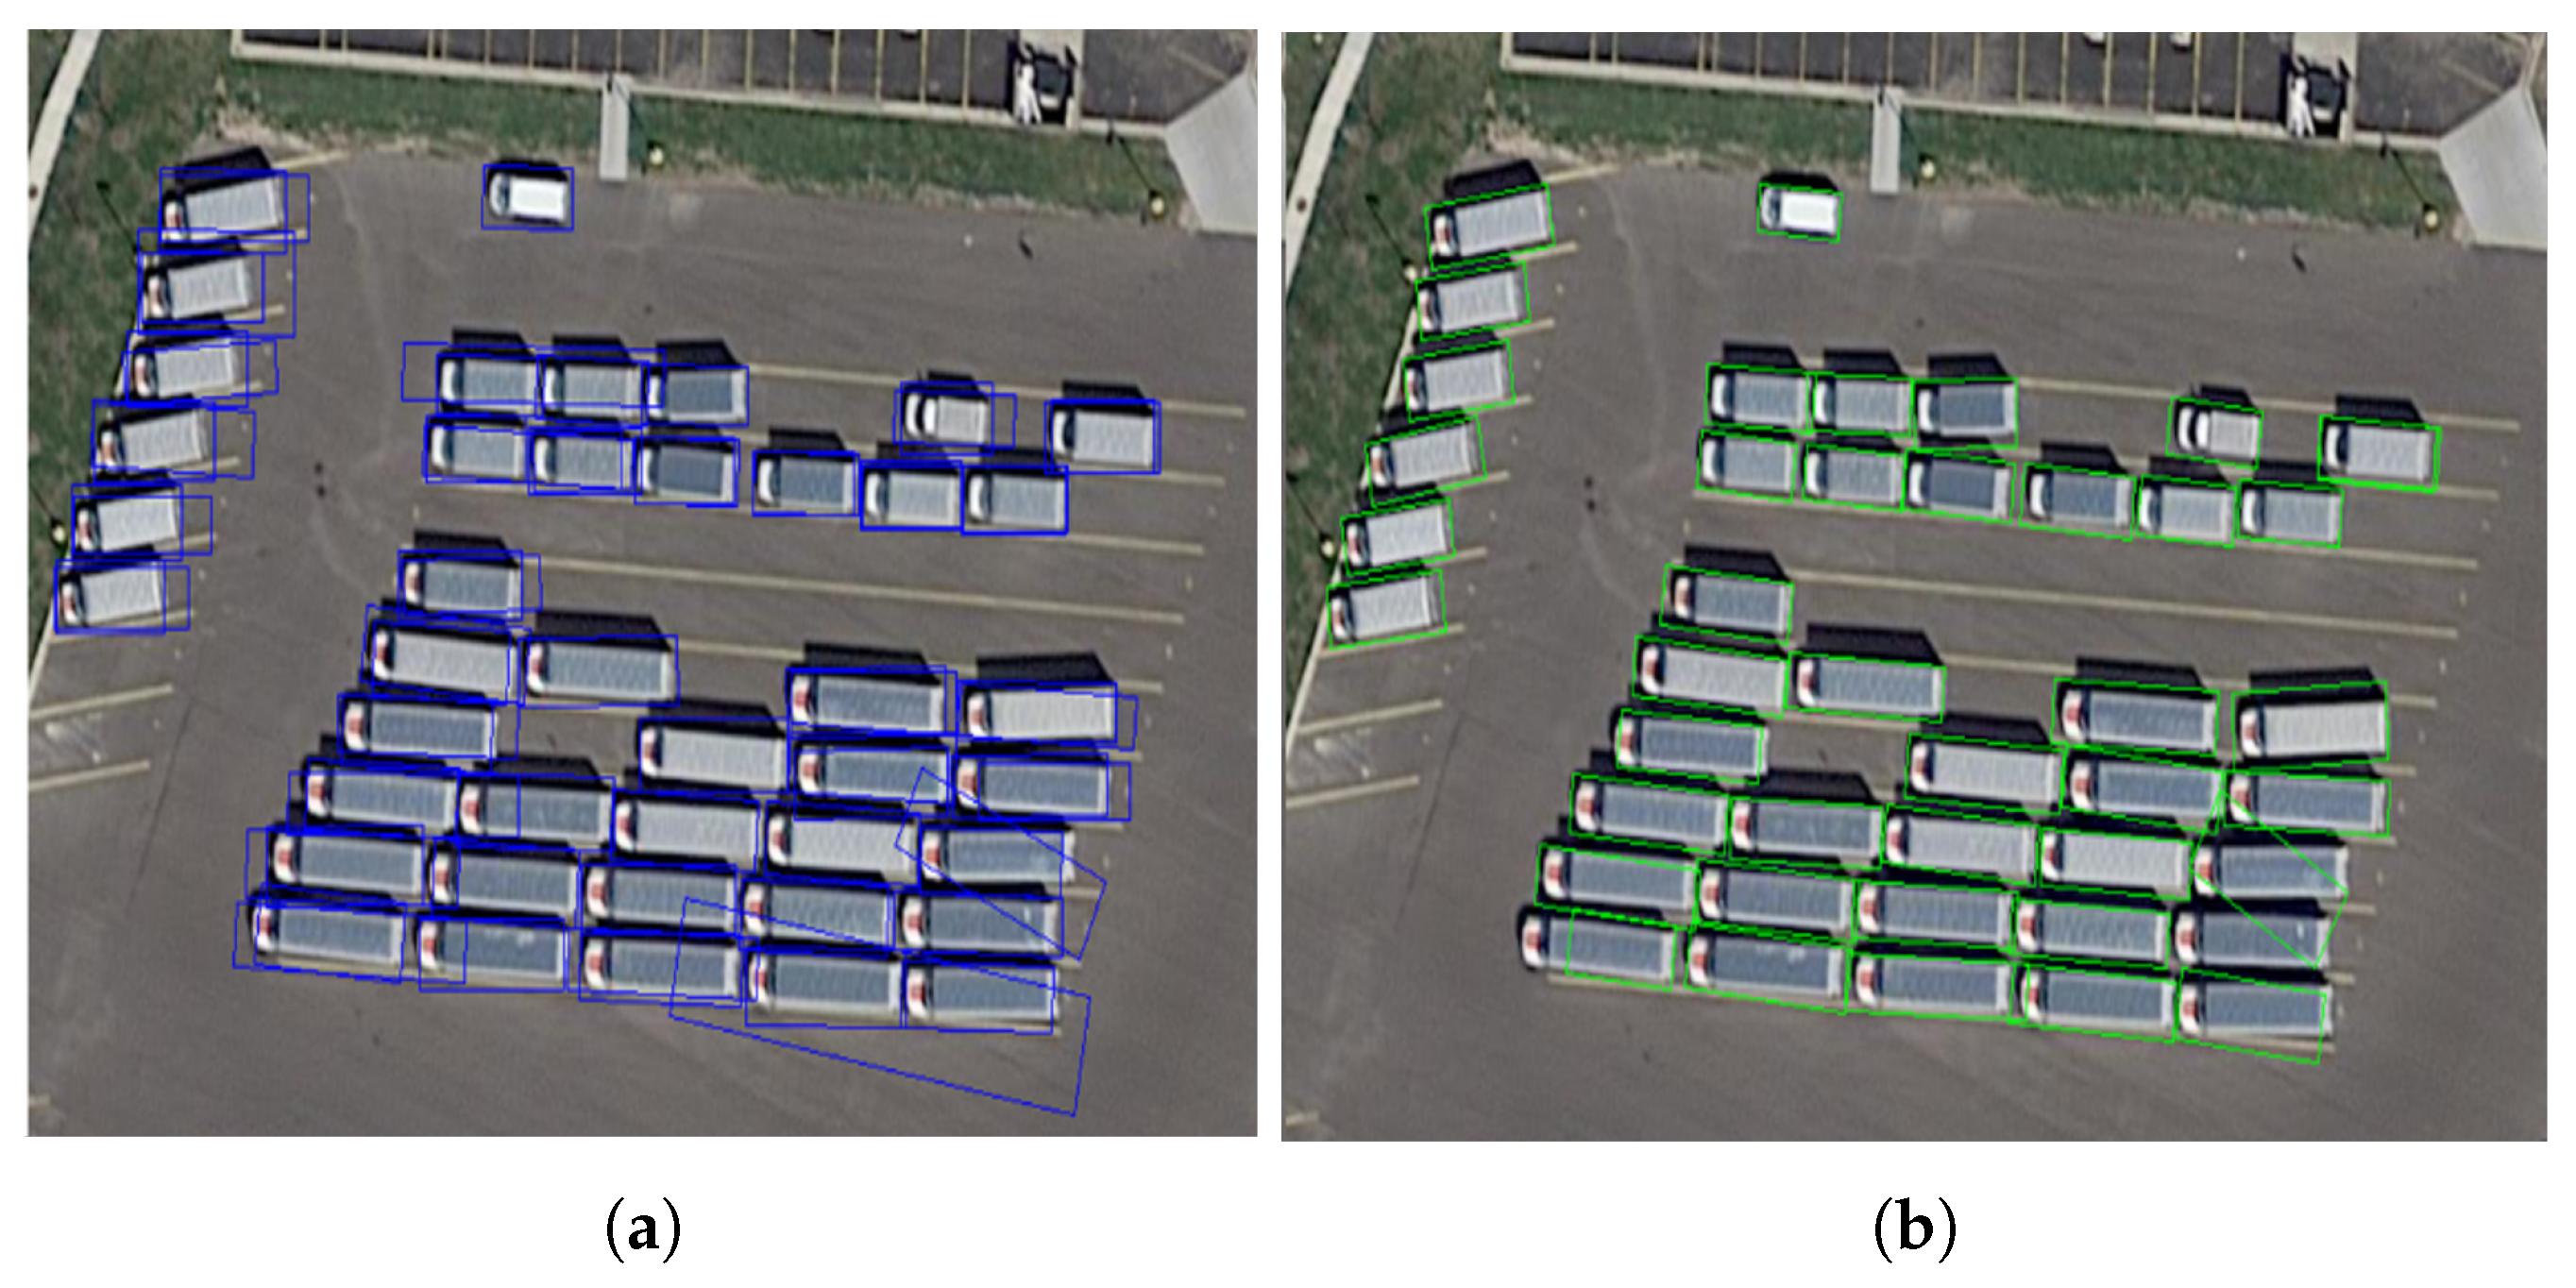
  • Design of an anchor-free decoupled detection head for oriented object detection
    For dense rotated targets, which are often non-horizontally arranged, traditional Region Proposal Network (RPN) approaches exhibit low detection efficiency and often include multiple targets within a single candidate box, resulting in poor performance. This paper proposes a decoupled detection head (DDH) without anchors, which decouples the processes of target bounding box regression and target classification. This allows different convolutional branches to learn distinct feature emphases. Furthermore, a centrality branch is introduced on top of the decoupling mechanism to enhance the precision of bounding box regression and improve recognition speed.
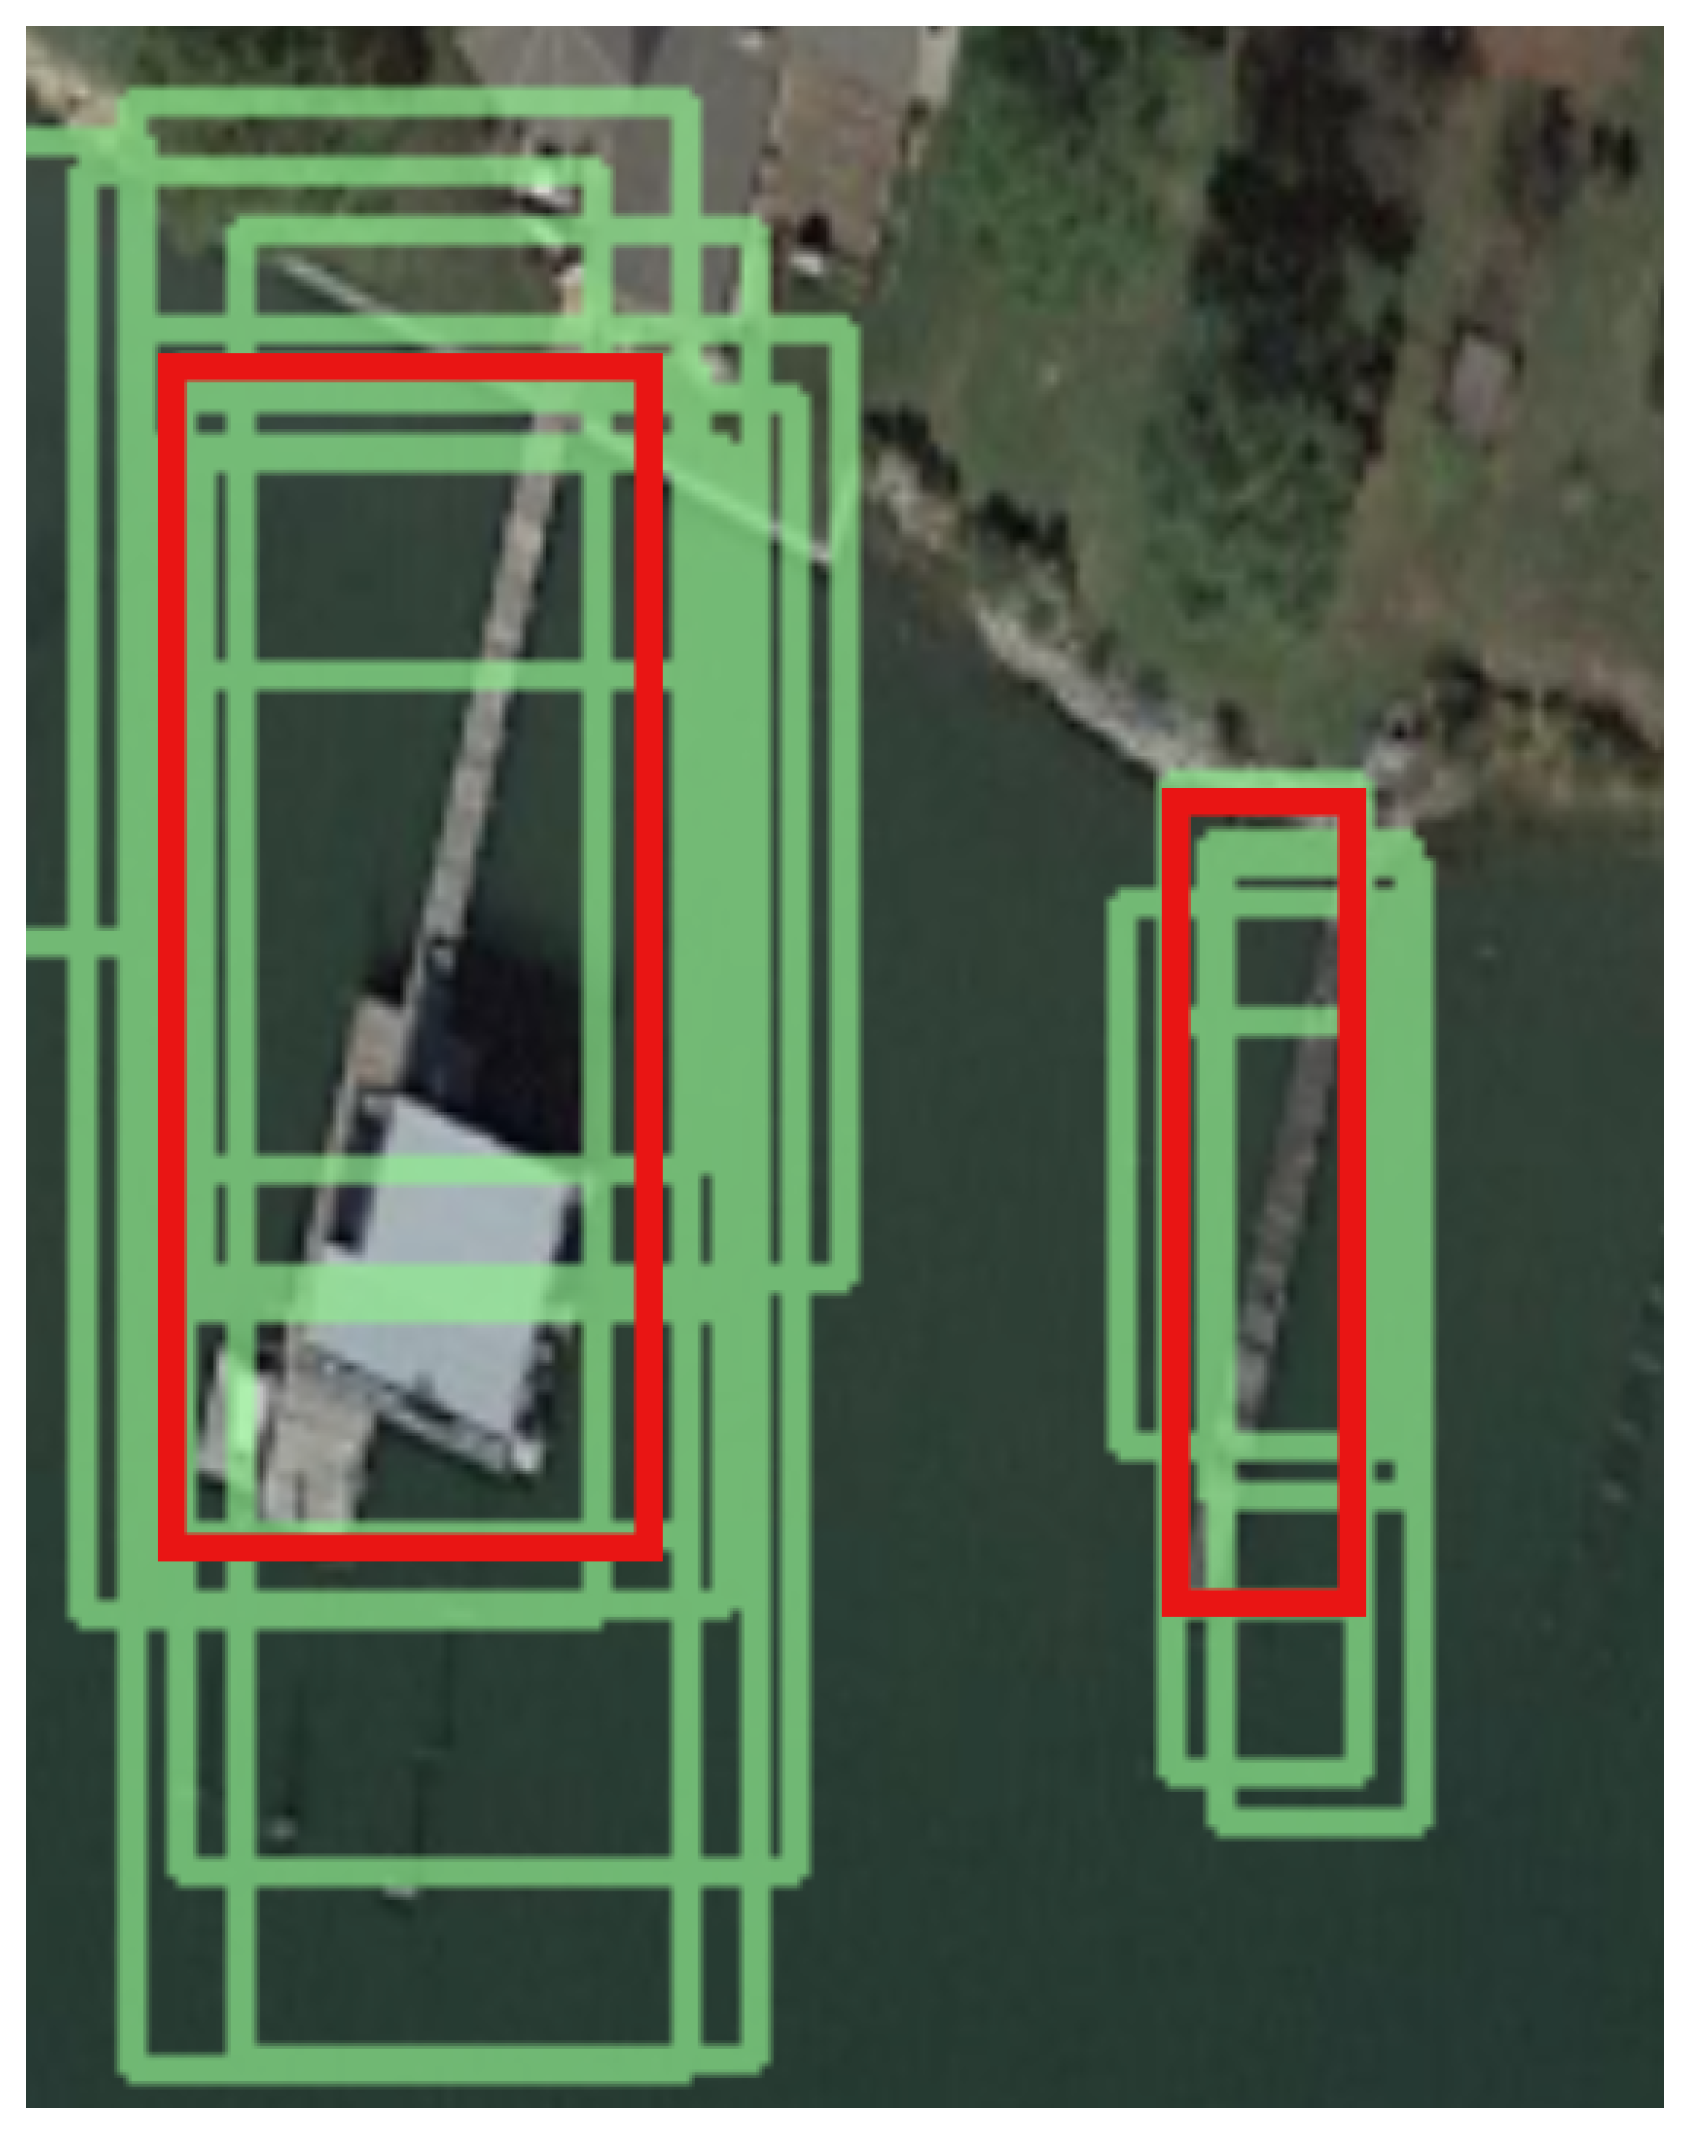
  • Ellipse center sampling method
    To address the issue of low sampling rates in horizontal center sampling for detecting rotated targets with large aspect ratios, this study proposes an improved ellipse center sampling (ECS) method. The ECS method increases the sampling area of rotated detection boxes, reducing the difficulty of network training and improving object detection accuracy. Additionally, it converts rotated rectangles into a distance representation based on an elliptical Gaussian distribution, resolving the challenge of computing gradients for intersection over union (IoU) loss at arbitrary angles. Experiments on the DOTA [3] and HRSC2016 [4] datasets validate the feasibility of the proposed method. Compared to improved second-order methods [5,6,7,8], the proposed approach not only employs an anchor-free detection head but also requires only convolutional layers due to internal decoupling, making it more easily deployable on most edge computing platforms.

2. Related Work

In object detection tasks, horizontal bounding boxes (HBBs) are typically used to detect targets and provide their categories.
Many excellent HBB framework algorithms have been proposed in recent years, including the YOLO series [1], R-CNN series [9], RetinaNet [10], and FCOS [11].
These methods have achieved good results in object detection tasks. Aerial image object detection faces many challenges such as arbitrary orientations, high target density, and a large resolution range.
It is difficult for existing HBB algorithms to detect aerial image targets effectively; therefore, the aerial image object detection task converts the HBB into a rotatable bounding box (oriented bounding box; OBB) by adding a rotation dimension.
Currently, oriented bounding box (OBB) methods are generally developed by improving upon HBB algorithms and can be categorized into two types: anchor-based [12] and anchor-free [13].
Anchor-based methods typically require manual anchor settings, which not only introduce additional hyperparameters and model parameters but also directly impact model performance. In contrast, anchor-free methods eliminate the need for manual anchor settings, reducing reliance on prior information and offering greater adaptability.
Neural Architecture Search (NAS) has been a hot topic in the field of deep learning in recent years for automatically designing efficient network structures; it is particularly suitable for scenarios that need to balance accuracy and computational complexity in aerial image target detection. The DAMO-YOLO [14] proposed by the Alibaba team uses MAE-NAS (Masked Autoencoder Neural Architecture Search) to optimize the detection backbone network while combining the extended neck structure and refined detection head design to further enhance the performance of real-time target detection. Additionally, Jing et al. [15] proposed BuildingNAS. Different from previous NAS methods, they employed a hierarchical search space and proposed the Single-Path Sampling strategy to eliminate excessive GPU memory consumption in the searching process, achieving a great efficiency–accuracy trade-off. Aharon et al. [16] proposed a YOLO-NAS model that utilizes Neural Architecture Search (NAS) techniques. It addresses the limitations of previous YOLO models by introducing features such as quantization-friendly basic modules and sophisticated training schemes. This greatly improves performance, especially in environments with limited computational resources.
Decoupling detection heads is another key research direction; this approach improves detection accuracy by separating classification and localization tasks. Pan et al. [17] utilized a multi-scale task-adaptive decoupled head (MTAD) with varied receptive fields, enhancing detection accuracy by leveraging multi-scale features and adaptively generating relevant features for classification and detection. Ren et al. [18] proposed a YOLO-SDH model, which utilizes a decoupled head that automatically adjusts the number of channels according to the model size, enhancing the network’s detection effect by separating the classification and regression tasks. Jin et al. [19] integrated a decoupled head into the YOLO head to untangle the classifiers and regressors, thereby accelerating network convergence and simultaneously improving network detection accuracy.
From the above literature, it can be seen that architecture search can significantly reduce the computational complexity so that the aerial image target detection task can be more efficient, while the decoupled detection head not only accelerates the network convergence speed but also improves the detection accuracy. Based on the above, this paper synthesizes the anchorless decoupled detection head and Fast Architecture Search techniques to provide a new solution for the aerial image detection task.

3. Design of FAS Structures

Due to the vast search space in automated search, each new structural connection in the generated subnetwork requires a considerable number of iterations, resulting in extremely high time complexity for the algorithm. For instance, training a NASNet (RL-based) model on the ImageNet dataset demands approximately 1800 PetaFLOPs of computational resources [20]. Given that a single RTX3090 GPU has a peak computational performance of 36 TFLOPs, this process would require around 600 GPUs operating for 4 days. Equivalently, a single GPU would take approximately 2400 days to identify the optimal architecture. Such an extensive training duration significantly hampers the reproducibility and deployment of this method, particularly in scenarios requiring rapid iteration and practical constraints. Therefore, practical automatic architecture search methods require manual restriction of the search space by defining a specific search space, allowing the machine to search all candidate networks within this space through bilevel optimization and weight sharing in a single pass. However, this poses challenges for memory optimization and is not suitable for small-scale single-GPU training. This study proposes the Fast Architecture Search (FAS) method, which introduces a one-stage anchor-free object detection network. Compared with anchor-based object detection networks, anchor-free object detection networks eliminate the anchor-matching step, thus significantly improving search efficiency and reducing memory consumption. Meanwhile, this study optimizes the NAS-FPN search space, which includes four feature fusion search methods: forward, bottom-up, top-down, and residual fusion search [21]. Nodes at the edge of the search space can either perform feature fusion with preceding nodes or employ residual connections to skip ahead and continue feature fusion.
If tensor dimension mismatch occurs during the fusion process, it can be automatically resolved by 1 × 1 convolution and 3 × 3 convolution for dimension matching [22].
Simultaneously, loss is calculated during each search to confirm the optimal feature fusion path. After optimization, a relatively superior feature fusion path can be found in just 3 GPU-days, making this method more easily applicable to practical projects.
Figure 1 illustrates the Fast Architecture Search space based on the feature pyramid, where dashed arrows represent all candidate feature fusion connections within the search space. The feature maps extracted from Inception-ResNet-SPP first undergo a fixed top-down feature fusion before entering the search space.

3.1. FAS Search Strategy

This study adopts a reinforcement learning-based (RL-based) search strategy for the FAS module, utilizing an LSTM-based controller to predict complete fusion paths.
Additionally, a progressive search strategy is employed, where the training data are randomly split into meta-training and meta-validation subsets.
To accelerate training, this study fixes the backbone network and caches its predicted outputs in memory. This approach decouples the training cost of individual architectures from the depth of the backbone network, thereby enabling the use of more complex backbone structures as feature extraction networks.
During training, this study also utilized the Polyak weight-averaging acceleration technique [23]. While average precision (AP) is typically the evaluation metric for object detection tasks, low AP values in the early stages of model training can make it difficult to distinguish the performance of different fusion paths, thus prolonging controller convergence. To accelerate training convergence in the early stages, this study uses the sum of negative losses as a reward, switching to AP as a reward in later stages.

3.2. Design of the FAS Search Space

In this study, the Fast Architecture Search (FAS) operates on a search tuple { ( x , y ) } , where x represents the input tensor of dimensions ( 3 × H × W ) and y is the output tensor from the object detection head.
The overall search network can be conceptually represented as g ( x ) y ^ . More specifically, the backbone network (Inception-ResNet-SPP), denoted as b, extracts feature tensors C from the input image x, expressed as b ( x ) C . The set of extracted feature tensors is C = { C 3 , C 4 , C 5 , C 6 } , where the resolution of each tensor C i is ( H i × W i ) = ( H / 2 i × W / 2 i ) .
These feature tensors C are then fed into the Feature Pyramid Network (FPN), denoted as f, to generate the output feature pyramid P = { P 3 , P 4 , P 5 , P 6 } , represented by f ( C ) = P . The FPN output tensor P has a size of ( ( K + 4 + 1 + 1 ) × H × W ) at each layer. The term ( K + 4 + 1 + 1 ) signifies the FPN’s input channels, comprising L K classification labels, four bounding box regression variables ( x , y , w , h ) , and one centrality factor, where L denotes the hierarchical index of the feature map and K denotes the label category.
Finally, the detection head, denoted as h, performs bounding box regression on the feature pyramid P to produce the final predicted results y, expressed as h ( P ) y . To prevent overfitting, the same object detection head is applied to all search instances.
Given that objects of different sizes require corresponding receptive fields, the selection and fusion of feature tensors C output by the backbone network are crucial for improving the search efficiency of the fusion path.
The weights in the backbone network utilize pre-trained weights from the COCO 2017 dataset, which are frozen during training, with no parameter updates. The optimal feature fusion path is searched for based on these pre-trained weights.
Given that f and h represent two distinct functions, this study defines two search spaces. A novel fundamental module with a completely new overall connection scheme is constructed based on the unique characteristics of the FPN structure, and its data output is configured. Simultaneously, to reduce computational complexity, the h function employs a sequential search space.
This study replaces the fusion unit structure with atomic operations and constructs a basic module b b . This module first randomly selects two layers, b 1 and b 2 , from a sampling pool at positions m 1 and m 2 . Then, it performs two corresponding operations, o p 1 and o p 2 , on them, respectively. Finally, the features from these two layers are merged into a single feature through a fusion operation.
Table 1 presents the operations. All convolutions utilize depthwise separable convolutions to reduce the GPU memory footprint. Furthermore, to match feature maps of different scales, 3 × 3 and 1 × 1 convolutions are employed for dimension matching. The merge module is used for fusion operations.
In the FPN, function f maps the feature vector C output by the backbone network to P. Therefore, in this section, the sampling pool M 0 is initialized with C.
The process of calling the basic module eight times through the FPN structure can be represented as f b b 1 f b b 2 f b b 8 f .
To enable weight sharing among all network layers, this section employs a simple rule to create global features: if there are isolated layers X t that are neither used for subsequent feature fusion { b b i f | i > t } nor belong to the last four layers (t < 5), then their elements are summed element-wise and merged with all output features, as shown in Equation (1).
P i * = P i + X i , i { 3 , 4 , 5 , 6 }

3.3. FAS Search Results

In the search experiments, Inception-ResNet101 with pre-trained weights is employed as the backbone network to reduce parameters and computational load. Through the experiments, the optimal feature fusion path was obtained, as shown in Figure 2. The output dimensions of the feature tensors { P 3 , P 4 , P 5 , P 6 } are 16 × 16 × 1024 , 32 × 32 × 512 , 64 × 64 × 256 , and 128 × 128 × 128 , respectively. As can be seen from Figure 2, the search controller utilized three fusion operations, cross-layer connections, 3 × 3 convolutions, and 5 × 5 convolutions, with a greater emphasis on 3 × 3 convolutional operations. This achieves a good trade-off between accuracy and the number of parameters.

3.4. Ablation Experiments and Analysis of Results

To demonstrate the effectiveness of the proposed FAS, in this section an ablation study is conducted on the DOTA dataset, and the experimental results are presented in Table 2. When evaluating with the DOTA dataset, the IOU was set to 0.7 to calculate the AP and mAP for each category. When evaluating with the SKU110K dataset, the IOU was set to 0.75 to calculate the mAP. Model 1 is an isolated Inception feature extraction network. Model 2 is an Inception-ResNet101 feature extraction network. Model 3 adds the SPP (Spatial Pyramid Pooling) structure based on model 2. Model 4 incorporates the FAS (Fast Architecture Search) module based on model 3.
In the experimental results, bold data indicates the highest value. As can be seen from Table 2, the mAP consistently improved on the DOTA1.0 dataset when using Inception and ResNet101 as the baseline networks and sequentially adding the SPP and FAS modules. Notably, the mAP increased most significantly, by 3%, after adding the FAS module. The addition of the SPP module resulted in a 1.8% mAP improvement, demonstrating the effectiveness of both SPP and FAS. Compared to model 3, model 4 showed varying degrees of improvement in 13 out of 15 categories, with only ‘ships’ and ‘tennis courts’ experiencing slight decreases of 1.1% and 0.5%, respectively. This indicates that model 4 effectively accounts for the characteristics of various targets and can efficiently and accurately handle the problem of dense small-object recognition and detection in complex scenes.

4. Design of Decoupled Detection Head for Elliptical Center Sampling

After feature extraction and fusion, the resulting feature maps are fed into the detection head for object recognition, which involves delineating object detection boxes and classifying the images within these boxes.
In object detection tasks, localization and classification have different focuses. Classification emphasizes the texture information of the target, as shown in Figure 3a, while localization focuses more on the edge information of the target, as shown in Figure 3b.
In the YOLO-series models, the classification and bounding box regression in the detection head share weights, utilizing the same set of feature maps for output.
To decouple the two tasks with different focuses, this paper proposes a decoupled object detection head. Leveraging the spatio-temporal sensitivity of fully connected layers [23], these are utilized for foreground class classification, while convolutional layers, which effectively learn the characteristics of the target foreground and background, are employed for bounding box regression. This ensures that the two tasks no longer share weights. Additionally, a centrality branch is introduced in the detection head to further reduce the difficulty of bounding box regression.
It is difficult for general object detection methods with four-dimensional detection heads to efficiently and accurately detect targets in dense rotated images due to their dense arrangement and arbitrary angles. The detection performance of horizontal detection heads is shown in Figure 4. It can be observed that for densely arranged small targets, detection fails when the tilt angle exceeds a certain threshold, making it impossible to detect closely spaced targets. Therefore, incorporating an additional rotation dimension is essential for improving the recognition accuracy of dense rotated images.

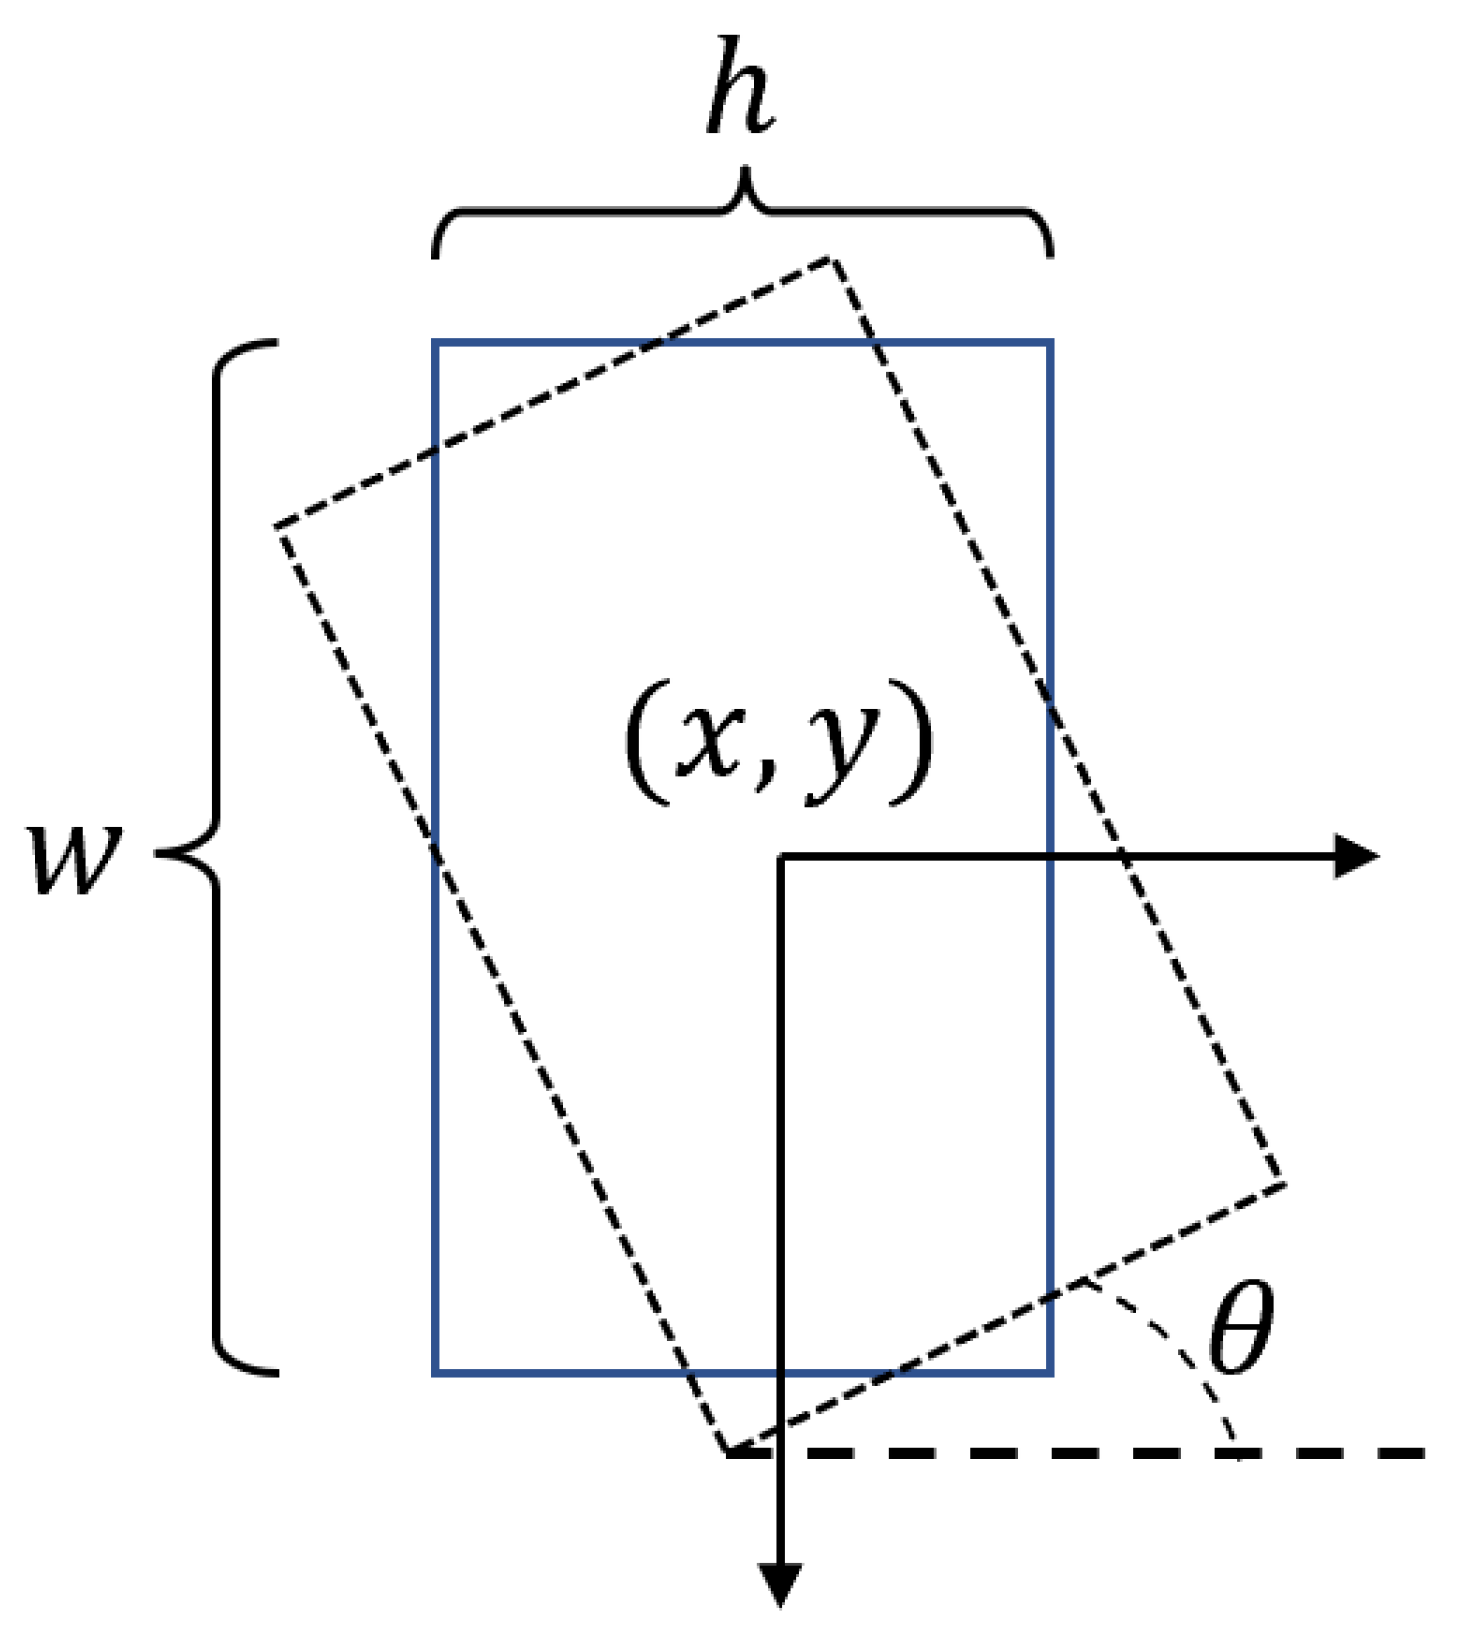
4.1. Implementation Method of the Oriented Object Detection Head

This study improves upon the one-stage horizontal detection head of the YOLO series [24] by incorporating a rotation dimension. The structure of the horizontal object detection head is shown in Figure 5. The FAS feature, which is the fused feature map extracted in Section 3, serves as the input, with ( x , y , w , h , θ ) representing the detection box position vector and c denoting the classification category vector.
First, a 3 × 3 convolutional kernel is applied to the input feature map to enhance its robustness. Then, a 1 × 1 convolutional kernel is used to convolve the feature map, generating a tensor with 18 dimensions [25]. Subsequently, the tensor is reshaped to a size of ( 15 , 15 , 18 ) through a Reshape operation. Finally, it is fed into a Softmax network for binary classification, separating the background from the foreground.
Since the generated anchors have relatively blurry boundaries, further bounding box regression is required. During bounding box regression, only the anchors classified as foreground by the Softmax function are selected for regression. A four-dimensional vector, typically represented as ( x , y , w , h ) , is used to define a box, where x and y denote the coordinates of the center point of the bounding box, and w and h represent the length and width of the bounding box, respectively. The regression process is illustrated in Figure 6.
The red box ( G T ) represents the target box, and the numerous green boxes ( A ) are the source boxes. The goal is to find a mapping from anchor box A to G T to obtain a detection box G that is very close to G T .
Assuming anchor A = ( P x , P y , P w , P h , ) , GT = ( G x , G y , G w , G h , ) ,
find a mapping F u n c such that F u n c ( A ) = G .
  • Panning the box:
    Δ x , Δ y = P w d x ( P ) , P h d y ( P ) G x = P w d x ( P ) + P x G y = P h d y ( P ) + P y
  • Scaling the box:
    ( S w , S h ) = ( exp ( d w ( P ) ) , exp ( d h ( P ) ) ) G w = P w exp ( d x ( P ) ) G h = P h exp ( d h ( P ) )
Based on Equations (2) and (3), it is necessary to regress the four values d x ( P ) , d y ( P ) , d w ( P ) , d h ( P ) . A linear regression model [26] is used for this process, where F u n c ( A ) = G represents the parameters to be learned. For the regression of these four variables, the offset ( t x , t y ) and scaling factors ( t w , t h ) from A to G T must first be calculated. Their calculation formulas are as follows:
t x = ( x x a ) / w a , t y = ( y y a ) / h a t w = log ( w / w a ) , t h = log ( h / h a )
The next step is to calculate the positional offsets ( t x * , t y * ) and scaling factors ( t w * , t h * ) between the predicted box and the label. Their calculation formulas are as follows:
t x * = ( x * x a ) / w a , t y * = ( x * y a ) / h a t w * = log ( w * / w a ) , t h * = ( h * / h a )
The regression process involves finding the optimal parameters K for the function F u n c . For the choice of loss function, this paper uses the smooth L1 loss function [27]. It is calculated using Equation 6.
L o s s = i N t * i W * T ϕ ( A i )
This completes the design of the horizontal object detection head. The regression process of the bounding box is illustrated in Figure 7: Figure 7a shows the initial anchor regions, Figure 7b demonstrates the effect after the removal of the first background anchor, and Figure 7c presents the boxes detected after the first regression.

4.2. Decoupled Detection Branch Design

The decoupled detection head comprises three branches. The first branch is the classification branch, which processes the feature map designated for classification through a fully connected layer to directly output a c-dimensional vector, representing the confidence scores for c classes within the detected box. The second branch is a five-dimensional vector for bounding box regression. It processes the feature map for bounding box regression through a convolutional layer to directly output the object’s positional information, predicting the detection box’s center coordinates, height, width, class, and rotation angle. The third branch is a one-dimensional vector that is used to output the object’s Center-ness score. Figure 8 illustrates the structure of the anchor-free decoupled detection head proposed in this section.
Due to the adoption of an anchor-free method, a large number of prediction bounding boxes with low intersections over unions (IOUs) were observed to be generated at locations far from the true target center during experiments. Therefore, a Center-ness branch is added to the detection head to suppress the generation of these low-quality-prediction bounding boxes. Its calculation method is shown in Equation (7). The representations of t , r , l , b are illustrated in Figure 9.
C e n t e r n e s s = min ( l , r ) max ( l , r ) × min ( t , b ) max ( t , b )
First, the bounding box regression mentioned above can provide a target’s 2D coordinates. However, horizontal detection boxes are limited by their inability to rotate. To address this problem, this paper extends the four-dimensional position vector ( x , y , w , h ) by adding an angle vector θ , resulting in a five-dimensional position vector ( x , y , w , h , θ ) . As shown in Figure 10, the goal of oriented object detection is achieved by regressing the variable θ . To implement a rotated bounding box regression in the object detection head, a rotation factor θ and the target’s height h and width w are added to the general smooth L1 loss function in this paper. Five parameters ( x , y , w , h , θ ) are used to represent arbitrarily oriented rectangles, with θ restricted to an acute angle within the range [ π / 2 , 0 ] . The formula for the rotated bounding box is given in Equation (8).
t x = ( x x a ) / w a , t y = ( y y a ) / h a t w = log ( w w a ) , t h = log ( h h a ) t θ = θ θ a
where x , y , w , h , θ represent the box’s center coordinates, width, height, and rotation angle, respectively. The multi-dimensional loss function is defined as follows:
L = λ 1 N n = 1 N t n j { x , y , w , h , θ } N L reg ( v n j , v n j ) + λ 2 N n = 1 N L cls ( p n , t n )
where N represents the number of anchors and t n represents the foreground hot encoding: t n = 1 for background and t n = 0 for foreground. v j denotes the predicted offset vector, while v j represents the target vector of G T . t n indicates the target’s label class, and P n is the class probability. The distribution of various categories is calculated using the sigmoid function. Hyperparameters λ 1 and λ 2 are manually adjusted as weights, with a default setting of 1. The classification loss L c l s and regression loss L r e g are implemented using Focal Loss [28].

4.3. Ellipse Center Sampling and Anchor-Free Implementation Approach

In the oriented object detection head, the positional offset of the object detection box is defined by Equation (10), the dimensional offset is defined by Equation (11), and the tilt-angle offset is defined by Equation (12).
o f f s e t x y = r e g x y × k × s
w h = ( r e l u ( r e g w h × k ) + 1 ) × s
θ = M o d ( r e g θ , 90 )
where r e g x y , r e g w h , and r e g θ represent the direct outputs of the final layer of the regression branch. k is a learnable adjustment parameter, and s is the downsampling factor of multi-level feature extraction. To align with the positive and negative sample assignment rules of YOLO, the anchor-free detection head selects only one positive sample for each object, namely, the object’s center point coordinates, while ignoring other predicted coordinates with higher confidence scores. To mitigate the positive–negative sample imbalance issue introduced by the anchor-free decoupled head, the central 3 × 3 region is typically designated as the positive sample region, also referred to as horizontal center point sampling in FCOS [29]. However, the rotated detection boxes used by FCOS, being non-horizontal rectangles, affect the sampling range. The short edges further reduce the number of sampling points for targets with large aspect ratios. The most intuitive center sampling should involve a rectangular region within a certain range around the target center, as shown by the dashed rectangle in Figure 11, but the short edges limit the range of rectangular center sampling. To mitigate these effects, this paper proposes an ellipse center sampling method based on a two-dimensional Gaussian distribution, as shown by the solid ellipse in Figure 11. Compared to the horizontal center sampling method, the ellipse center sampling method is better suited for rotated target detection, with the sampling region for targets with large aspect ratios being more concentrated by contracting the major axis. The two-dimensional Gaussian distribution [30] is defined using the parameters ( w , h , θ ) , as specified by Equation (13).
R θ = cos θ sin θ sin θ cos θ , ϵ θ = min ( w , h ) 12 w 2 0 0 h 2
where R θ is the rotation transformation matrix. Equation (14) defines the probability density of a two-dimensional Gaussian distribution [31] under general conditions. x represents the coordinates of the target detection box, with e as the natural constant, set to 2.7 in the experiments.
f ( x ) = 1 2.5 ϵ e 1 2 [ ( x μ ) T ϵ 1 ( x μ ) ]
When f ( x ) ( 0 , 1 ) , the elliptical contour of the two-dimensional Gaussian distribution can be represented as f ( x ) = c . The contour lines of the ellipse increase only as c decreases, with the effective range of c being [ c 0 , 1 ] . Considering the prevalence of small targets in dense rotated images, to prevent insufficient sampling due to a small sampling area, c 0 is set to 0.3 in this paper. The central sampling area of a target can be determined by f ( x ) c [32]. If f ( x ) is greater than c, the point x lies within the sampling region.

4.4. Loss Function Design

The losses used in this paper include classification, regression, and intersection over union (IoU) loss. The classification loss L c l s employs a cross-entropy loss function, while the regression loss L r e g uses the Kullback–Leibler divergence (KLD) loss function [33], defined by Equation (15). The KLD loss leverages the ellipse center sampling approach from Section 4.3 to convert a rotated rectangle ( C x , C y , w , h , θ ) into a distance representation of a two-dimensional elliptical Gaussian distribution ( μ , ϵ ) . This method addresses the inconsistency between model evaluation and loss, making it more suitable for measuring the distribution in rotated detection. Although the KLD loss is parametrically semi-coupled, the introduction of ϵ t 1 enables better optimization of the center point coordinate regression, leading to more accurate target detection coordinates.
L r e g = 1 2 ( μ p μ t ) T ϵ p 1 ( μ p μ t ) + 1 2 T r ( ϵ t 1 ϵ p ) + 1 2 l n | ϵ t | | ϵ p | 1
In the formulas, the subscripts p and t represent the model predictions and labels, respectively. Figure 12 demonstrates that the KLD loss function outperforms the smooth L1 loss function.

5. Experiments

5.1. Datasets

The proposed method is evaluated on the DOTA1.0, DOTA1.5, and HRSC2016 datasets. DOTA is a large-scale dataset for aerial target detection, with data collected from various sensors and platforms. DOTA1.0 includes 2806 large aerial images with sizes ranging from 800 × 800 to 4000 × 4000, containing 188,282 instances across 15 common categories: bridge (BR), ground track field (GTF), small vehicle (SV), large vehicle (LV), ship (SH), tennis court (TC), basketball court (BC), storage tank (ST), soccer field (SBF), roundabout (RA), harbor (HA), swimming pool (SP), and helicopter (HC). DOTA1.5 builds on DOTA1.0 by adding the container crane (CC) category and instances smaller than 10 pixels. DOTA1.5 contains 402,089 instances. Compared to DOTA1.0, DOTA1.5 is more challenging during training but also more stable.
In this paper, the training set and validation set are used for training, while the test set is used for testing. The multi-scale parameters for DOTA1.0 are 0.5 and 1.0 , and for DOTA1.5, they are 0.5 ,   1.0 , and 1.5 . During training, random flipping and random rotation parameter methods are also employed.
HRSC2016 is a challenging ship detection dataset with OBB annotations, containing 1061 aerial images with sizes ranging from 300 × 300 to 1500 × 900. It includes 436, 181, and 444 images in the training, validation, and test sets, respectively. We use the training and validation sets for training and the test set for testing. All images are resized to 640 × 640 without altering the aspect ratio. During training, random flipping and random rotation are employed.

5.2. Experiment Environment

  • CPU: Intel(R) Silver Xeon 2140B, 3.8 GHz(Intel, Shanghai, China): 8 cores 16 threads;
  • Memory: 32 GB DDR4 REG ECC 2400 MHz(Dell, Shantou, China);
  • GPU: NVIDIA TESLA V100×2 16 GB GBBR5(GIGABYTE, Shenzhen, China);
  • Operating system: Ubuntu 20.04 distribution.
    The software environment for this study’s comparison experiments was as follows:
  • CUDA 11.2 cuDNN 7.6.5;
  • Python 3.8;
  • Pytorch 1.12.0;
  • OpenCV 3.4.1.

5.3. Assessment of Indicators

This paper adopts mean average precision (mAP) as the evaluation metric for model performance, conducting a quantitative assessment. The mAP value is positively correlated with model performance. The mAP is obtained by calculating the mean of the average precision (AP) values for all categories in the dataset.

5.4. Hyperparameter Selection

In this subsection, we provide a comprehensive list of training hyperparameters. These hyperparameters govern the training of the backbone network (Inception-ResNet101), Feature Pyramid Network (FPN), FAS-FPN module, and the final detector.

5.4.1. Model Architecture

First, we determine the model architecture. The backbone is set to Inception-ResNet101, and the Feature Pyramid Network (FPN) uses a five-level structure (P2–P6). Head sharing is enabled with SHARE_HEADS = True. Additionally, the FAS-FPN module includes 7 layers (NUM_FAS_FPN = 7 ), 384 channels (FPN_CHANNEL = 384), and ReLU activation (USE_RELU = True).

5.4.2. Training Settings

Then, we identify the training settings. The total training iterations are 1,600,000 (20 epochs, 80,000 iterations per epoch, MAX_ITERATION = 20 × 80,000), with weights saved every 80,000 iterations (SAVE_WEIGHTS_INTE = 80,000). The batch size is 8 (BATCH_SIZE = 8), processing 118,000 images per epoch. The optimizer is SGD Momentum with a momentum of 0.9 and epsilon of 1 × 10 5 . The initial learning rate is 0.01 ( 5 × 10 4 × 2 × 1.25 × 8 × 1 ). The warmup phase spans 20,000 iterations (0.25 epochs, WARM_SETP = 20,000), with the learning rate increasing linearly to 0.01. The learning rate decay occurs at iterations 960,000, 1,280,000, and 1,600,000 (DECAY_STEP = [960,000, 1,280,000, 1,600,000]), corresponding to the 12th, 16th, and 20th epochs. Gradient clipping is disabled (GRADIENT_CLIPPING_BY_NORM = None, MUTILPY_BIAS_GRADIENT = None).

5.4.3. Loss Function Weights

Third, we determine the loss function weights. The RPN classification loss weight is set to 1.0, and the RPN regression loss weight is also 1.0. The RPN balancing factor is defined as σ = 3.0 (RPN_SIGMA = 3.0).

5.4.4. Learning Rate Scheduling

Finally, we identify the learning rate scheduling, as shown in Table 3.

5.4.5. All Hyperparameters

For comprehensive reference, Table 4 summarizes the hyperparameters for clarity and reproducibility.

5.5. Ablation Experiments

The ablation experiment results obtained based on the proposed FAS, DDH, and ECS methods are presented in Table 5. It can be observed from the table that, using Inception-ResNet101 as the baseline, the FAS module alone achieves a 78.6% mAP on the DOTA1.0 rotated-target detection task.
Based on FAS, adding the DDH or ECS module individually results in an improvement in mAP. Adding the DDH module alone increases the mAP by 1.5%, indicating that the decoupled detection head contributes to enhancing target detection accuracy; however, the FPS decreases by 1.3 frames, suggesting that the addition of a feature extraction branch in the decoupled method with non-shared weights increases the overall computational overhead of the network.
Adding the ECS module alone can increase mAP by 1.2% with almost no decrease in FPS. This indicates that the elliptical center sampling method improves model accuracy without increasing computational overhead, and that elliptical center sampling is superior to rectangular sampling in rotated-object detection tasks.
Simultaneously adding these two modules can increase mAP to 82.6%, while the FPS is 24.4 frames, a decrease of 1.4 frames compared to the baseline. This indicates that the decoupled detection head slightly increases the overall computational overhead of the model. However, the increase in mAP is more significant.
The results of the fusion experiment indicate that the ECS and DDH module optimize model accuracy from two perspectives, model structure and sampling method, resulting in a significant improvement in detection accuracy. Although the addition of the DDH module results in a more substantial increase in model accuracy, it also introduces a corresponding increase in computational overhead.
The three optimization methods proposed in this paper significantly improve upon the Inception-ResNet101 baseline model. Conversely, removing any of these modules individually leads to a decrease in model accuracy, thereby demonstrating the effectiveness of FAS, DDH, and ECS.

5.6. Generalization Experiments with Different Backbone Networks Using the Proposed Method

To validate the generalization ability of the proposed FAS, DDH, and ECS across different backbone networks, we conducted comparative experiments on the DOTA1.0, DOTA1.5, and HRSC2016 datasets, using the mAP and FPS as performance evaluation metrics. Specifically, mAP measures detection accuracy, while FPS reflects the model’s inference speed, which is critical for its practicality in edge device deployment. As the objective of this study is to achieve high-precision, low-latency oriented object detection, we prioritized optimizing inference speed during the training phase to lay a solid foundation for subsequent deployment.
From Table 6, it is evident that the proposed methods, when paired with different backbone networks, consistently achieve high detection accuracy. Notably, using ConvNext-XL as the backbone network yields the highest mAP across all three datasets (83.9% on DOTA1.0, 72.9% on DOTA1.5, and 89.3% on HRSC2016), demonstrating its strong representational capacity in significantly enhancing model performance. However, its inference speed of only 17.5 FPS falls considerably below the requirements for real-time detection, making it less suitable for scenarios with high real-time demands.
In contrast, Inception-ResNet101 achieves a favorable balance between accuracy and speed. It attains mAP values of 82.6%, 79.5%, and 89.1% on DOTA1.0, DOTA1.5, and HRSC2016, respectively, which are only slightly lower than ConvNext-XL, by 0.8%, 6.6%, and 0.2%. However, its inference speed reaches 24.4 FPS, the fastest among all the backbone networks. This indicates a well-balanced trade-off between feature extraction capability and network complexity, making it particularly suitable for edge device deployment. Compared to ResNet-152, Inception-ResNet101 not only improves inference speed by 7.3 FPS but also enhances mAP (by 14.8% on DOTA1.0 and 30.9% on HRSC2016), demonstrating its superior architectural design, which provides significant advantages in both accuracy and real-time performance.
Furthermore, under the YOLOv3 framework, using Inception-ResNet101 as the backbone network results in inference speeds comparable to ResNet-152. However, the former achieves significantly higher mAP across all three datasets, with a particularly notable improvement of over 30% on HRSC2016. This further demonstrates the superior adaptability of our proposed method in high-density, small-target detection scenarios.

5.7. Experiments on Speed and Accuracy of the Proposed Method Compared to Other Networks

The aforementioned experiments validated the excellent overall performance of the Inception-ResNet101 backbone network when combined with our proposed method. To further evaluate the effectiveness of the integrated FAS-DDH-ECS structure, we compared it with current mainstream oriented object detection methods on the DOTA and HRSC2016 datasets, with the results presented in Table 7. As shown in the table, although single-stage methods such as RetinaNet and ReDet hold a slight advantage in inference speed (22.4 FPS and 24.5 FPS, respectively), our method maintains a competitive speed (24.4 FPS) while significantly outperforming these methods in detection accuracy. It achieves the highest mAP values, of 82.6% and 79.5%, on DOTA1.0 and DOTA1.5, respectively, and also attains an mAP of 89.1% on HRSC2016, surpassing all compared models. It is noteworthy that our proposed method not only comprehensively surpasses traditional two-stage methods such as R2CNN, R3Det, and Oriented R-CNN in terms of accuracy but also achieves significant improvements in speed. For instance, compared to Oriented R-CNN, our method improves the mAP by 0.8%, 1.1%, and 2.9% on the respective datasets while increasing inference speed by 3.3 FPS. Compared to R3Det, the speed improvement reaches 12.4 FPS. Additionally, although S2A-Net achieves an mAP of 81.4% on DOTA1.0, its inference speed of only 2.0 FPS makes it unsuitable for real-time applications, highlighting the bottleneck of some high-accuracy models in engineering deployment. In summary, our method ensures high precision while maintaining inference efficiency, demonstrating excellent real-time detection capabilities and engineering adaptability.

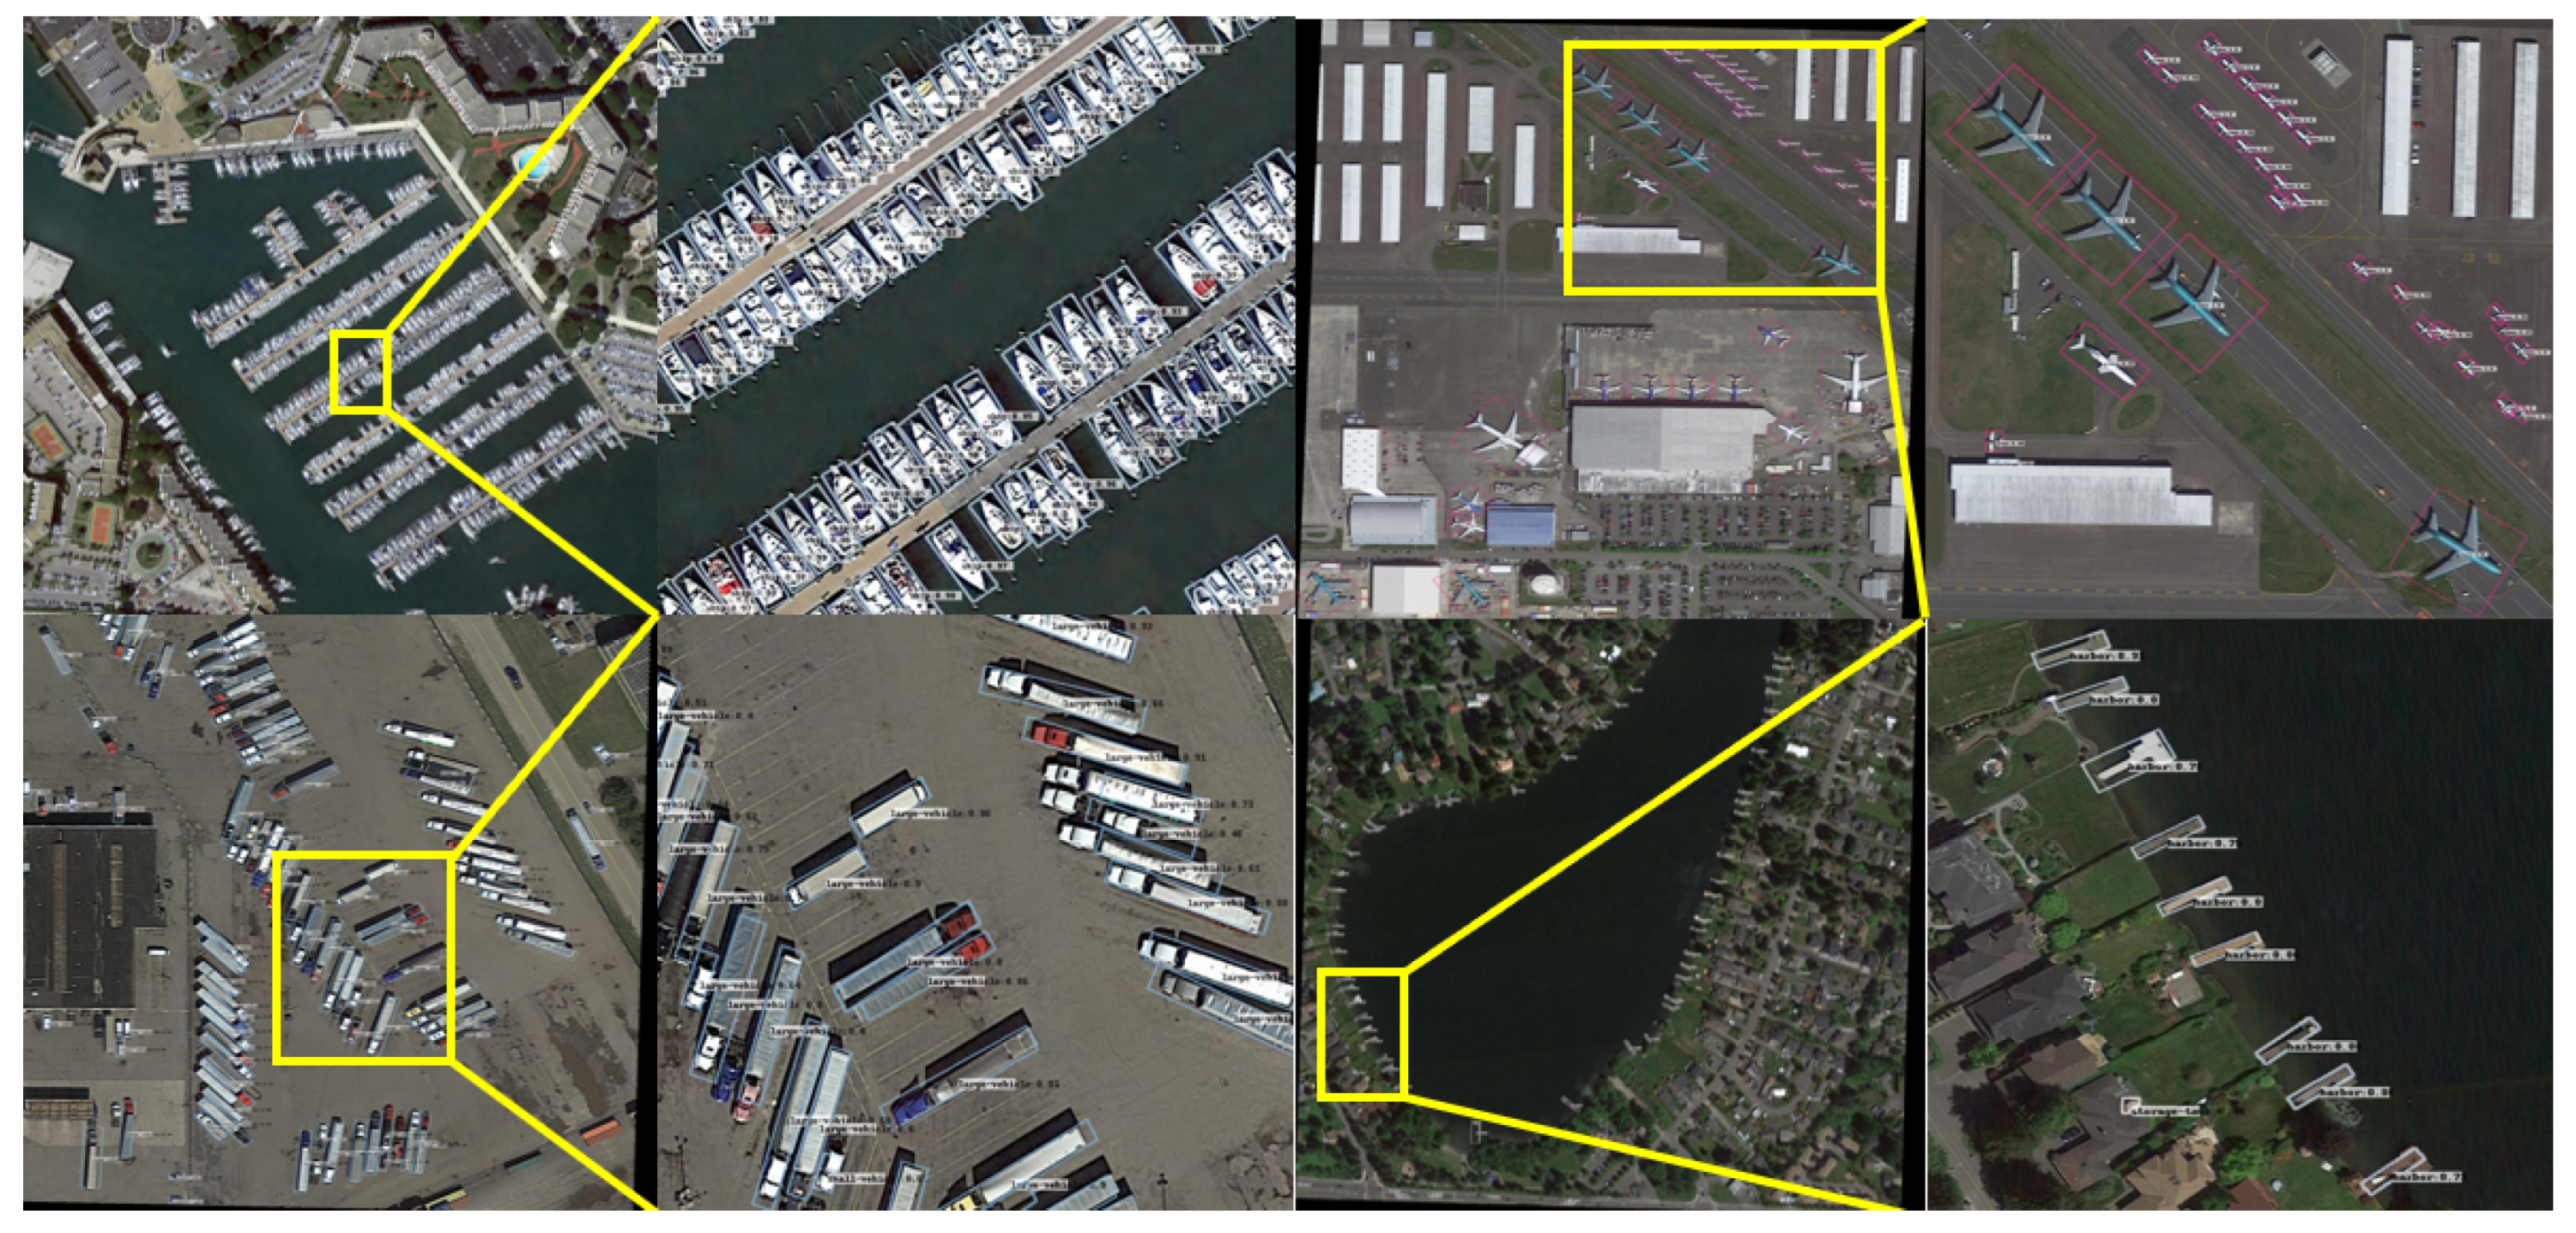
5.8. Experimental Effect

Detection on the DOTA dataset is shown in Figure 13. It can be seen that the method proposed in this paper can detect densely distributed targets and objects with large aspect ratios, demonstrating good robustness.

6. Conclusions

This study addresses the core challenges of small, densely arranged, and arbitrarily rotated objects in aerial images by proposing an anchor-free oriented object detection method based on architecture search. The method leverages the Feature Alignment Search (FAS) module to automatically optimize feature fusion paths, the decoupled detection head (DDH) to separate classification and regression tasks, and an improved ellipse center sampling (ECS) to mitigate sampling bias for targets with extreme aspect ratios. Experiments on the DOTA and HRSC2016 datasets achieve 75.2% and 89.1% mAP, respectively, with 21.7 FPS, significantly outperforming mainstream models. The proposed method offers advantages in lightweight design and real-time performance but is limited by complex Gaussian gradient computations and suboptimal small-object detection. In future work, we plan to design a differentiable IoU loss to simplify gradient computation and integrate Neural Architecture Search (NAS) to compress the model for improved inference speed. Additionally, FP16/INT8 quantization will be explored to enhance operational efficiency for edge deployment. Furthermore, the incorporation of Transformer-based feature extraction will be investigated to enhance the model’s rotation invariance.

Author Contributions

Conceptualization: Y.K. and W.S.; investigation: Y.K. and W.S.; data curation: Y.K. and W.S.; methodology: Y.K. and W.S.; validation: Y.K. and W.S.; writing—original draft preparation: B.Z. and Y.K.; writing—review and editing: W.S.; visualization: Y.K. and W.S.; supervision: Y.K. and W.S. All authors have read and agreed to the published version of the manuscript.

Funding

This research received no external funding.

Institutional Review Board Statement

Not applicable.

Informed Consent Statement

Not applicable.

Data Availability Statement

The data supporting the reported results in this study are openly available. The DOTA1.0 dataset is accessible at https://captain-whu.github.io/DOTA/dataset.html (accessed on 1 June 2025), the DOTA1.5 dataset is available at https://captain-whu.github.io/DOTA/dataset.html (accessed on 1 June 2025), and the HRSC2016 dataset can be found at https://ieee-dataport.org/documents/hrsc2016-0 (accessed on 1 June 2025).

Conflicts of Interest

Author Yuzhe Kang was employed by the company Hangzhou Neptune Technology. The remaining authors declare that the research was conducted in the absence of any commercial or financial relationships that could be construed as a potential conflict of interest.

References

  1. Redmon, J.; Divvala, S.; Girshick, R.; Farhadi, A. You Only Look Once: Unified, Real-Time Object Detection. arXiv 2015, arXiv:1506.02640. [Google Scholar] [CrossRef]
  2. Ren, S.; He, K.; Girshick, R.; Sun, J. Faster R-CNN: Towards Real-Time Object Detection with Region Proposal Networks. arXiv 2015, arXiv:1506.01497. [Google Scholar] [CrossRef]
  3. Ding, J.; Xue, N.; Xia, G.S.; Bai, X.; Yang, W.; Yang, M.Y.; Belongie, S.; Luo, J.; Datcu, M.; Pelillo, M.; et al. Object detection in aerial images: A large-scale benchmark and challenges. IEEE Trans. Pattern Anal. Mach. Intell. 2021, 44, 7778–7796. [Google Scholar] [CrossRef] [PubMed]
  4. Liu, Z.; Yuan, L.; Weng, L.; Yang, Y. A high resolution optical satellite image dataset for ship recognition and some new baselines. In Proceedings of the International Conference on Pattern Recognition Applications and Methods, Porto, Portugal, 24–26 February 2017; SciTePress: Setubal, Portugal, 2017; Volume 2, pp. 324–331. [Google Scholar]
  5. Ge, Z.; Liu, S.; Wang, F.; Li, Z.; Sun, J. YOLOX: Exceeding YOLO Series in 2021. arXiv 2021. [Google Scholar] [CrossRef]
  6. Girshick, R.; Donahue, J.; Darrell, T.; Malik, J. Rich feature hierarchies for accurate object detection and semantic segmentation. In Proceedings of the IEEE Conference on Computer Vision and Pattern Recognition, Columbus, OH, USA, 23–28 June 2014; pp. 580–587. [Google Scholar]
  7. Girshick, R. Fast R-CNN. In Proceedings of the 2015 IEEE International Conference on Computer Vision (ICCV), ICCV ’15, Santiago, Chile, 7–13 December 2015; pp. 1440–1448. [Google Scholar] [CrossRef]
  8. Zhang, L.; Lin, L.; Liang, X.; He, K. Is faster R-CNN doing well for pedestrian detection? In Proceedings of the Computer Vision–ECCV 2016: 14th European Conference, Amsterdam, The Netherlands, 11–14 October 2016; Proceedings, Part II 14. Springer: Amsterdam, The Netherlands, 2016; pp. 443–457. [Google Scholar]
  9. Cheng, B.; Wei, Y.; Shi, H.; Feris, R.; Xiong, J.; Huang, T. Revisiting rcnn: On awakening the classification power of faster rcnn. In Proceedings of the European Conference on Computer Vision (ECCV), Munich, Germany, 8–14 September 2018; pp. 453–468. [Google Scholar]
  10. Lin, T.Y.; Goyal, P.; Girshick, R.; He, K.; Dollár, P. Focal loss for dense object detection. In Proceedings of the IEEE International Conference on Computer Vision, Venice, Italy, 22–29 October 2017; pp. 2980–2988. [Google Scholar]
  11. Tian, Z.; Shen, C.; Chen, H.; He, T. Fcos: Fully convolutional one-stage object detection. In Proceedings of the IEEE/CVF International Conference on Computer Vision, Seoul, Republic of Korea, 27 October–2 November 2019; pp. 9627–9636. [Google Scholar]
  12. Zhang, R.; Hang, S.; Sun, Z.; Nie, F.; Wang, R.; Li, X. Anchor-based fast spectral ensemble clustering. Inf. Fusion 2025, 113, 102587. [Google Scholar] [CrossRef]
  13. Chu, Q.; Li, S.; Chen, G.; Li, K.; Li, X. Adversarial alignment for source free object detection. In Proceedings of the AAAI Conference on Artificial Intelligence, Washington, DC, USA, 7–14 February 2023; Volume 37, pp. 452–460. [Google Scholar]
  14. Xu, X.; Jiang, Y.; Chen, W.; Huang, Y.; Zhang, Y.; Sun, X. Damo-yolo: A report on real-time object detection design. arXiv 2022, arXiv:2211.15444. [Google Scholar]
  15. Jing, W.; Lin, J.; Wang, H. Building NAS: Automatic designation of efficient neural architectures for building extraction in high-resolution aerial images. Image Vis. Comput. 2020, 103, 104025. [Google Scholar] [CrossRef]
  16. Aharon, S.; Louis-Dupont; Masad, O.; Yurkova, K.; Fridman, L.; Lkdci; Khvedchenya, E.; Rubin, R.; Bagrov, N.; Tymchenko, B.; et al. Super-Gradients. 2021. Available online: https://zenodo.org/records/7789328 (accessed on 26 July 2025).
  17. Pan, M.; Xia, W.; Yu, H.; Hu, X.; Cai, W.; Shi, J. Vehicle Detection in UAV Images via Background Suppression Pyramid Network and Multi-Scale Task Adaptive Decoupled Head. Remote Sens. 2023, 15, 5698. [Google Scholar] [CrossRef]
  18. Ren, Z.; Yao, K.; Sheng, S.; Wang, B.; Lang, X.; Wan, D.; Fu, W. YOLO-SDH: Improved YOLOv5 using scaled decoupled head for object detection. Int. J. Mach. Learn. Cybern. 2024, 16, 1643–1660. [Google Scholar] [CrossRef]
  19. Ma, J.; Fu, D.; Wang, D.; Li, Y. A Decoupled Head and Multiscale Coordinate Convolution Detection Method for Ship Targets in Optical Remote Sensing Images. IEEE Access 2024, 12, 59831–59841. [Google Scholar] [CrossRef]
  20. Katz, M.L.; Karnesis, N.; Korsakova, N.; Gair, J.R.; Stergioulas, N. Efficient GPU-accelerated multisource global fit pipeline for LISA data analysis. Phys. Rev. D 2025, 111, 024060. [Google Scholar] [CrossRef]
  21. Li, P.; Chen, J.; Lin, B.; Xu, X. Residual spatial fusion network for RGB-thermal semantic segmentation. Neurocomputing 2024, 595, 127913. [Google Scholar] [CrossRef]
  22. Shit, S.; Roy, B.; Das, D.K.; Ray, D.N. Single Encoder and Decoder-Based Transformer Fusion with Deep Residual Attention for Restoration of Degraded Images and Clear Visualization in Adverse Weather Conditions. Arab. J. Sci. Eng. 2024, 49, 4229–4242. [Google Scholar] [CrossRef]
  23. Savaştaer, E.F.; Çelik, B.; Çelik, M.E. Automatic detection of developmental stages of molar teeth with deep learning. BMC Oral Health 2025, 25, 465. [Google Scholar] [CrossRef]
  24. Chen, Y.; Yuan, X.; Wang, J.; Wu, R.; Li, X.; Hou, Q.; Cheng, M.M. YOLO-MS: Rethinking multi-scale representation learning for real-time object detection. IEEE Trans. Pattern Anal. Mach. Intell. 2025, 47, 4240–4252. [Google Scholar] [CrossRef] [PubMed]
  25. Liu, Y.; Liu, Y.; Guo, X.; Ling, X.; Geng, Q. Metal surface defect detection using SLF-YOLO enhanced YOLOv8 model. Sci. Rep. 2025, 15, 11105. [Google Scholar] [CrossRef] [PubMed]
  26. Choi, J.Y.; Han, J.M. Deep learning (Fast R-CNN)-based evaluation of rail surface defects. Appl. Sci. 2024, 14, 1874. [Google Scholar] [CrossRef]
  27. Chaudhuri, A. Smart traffic management of vehicles using faster R-CNN based deep learning method. Sci. Rep. 2024, 14, 10357. [Google Scholar] [CrossRef]
  28. Li, W.; Liu, D.; Li, Y.; Hou, M.; Liu, J.; Zhao, Z.; Guo, A.; Zhao, H.; Deng, W. Fault diagnosis using variational autoencoder GAN and focal loss CNN under unbalanced data. Struct. Health Monit. 2025, 24, 1859–1872. [Google Scholar] [CrossRef]
  29. Zhang, G.; Yu, W.; Hou, R. Mfil-fcos: A multi-scale fusion and interactive learning method for 2d object detection and remote sensing image detection. Remote Sens. 2024, 16, 936. [Google Scholar] [CrossRef]
  30. Yang, J.; Zhou, K.; Li, Y.; Liu, Z. Generalized out-of-distribution detection: A survey. Int. J. Comput. Vis. 2024, 132, 5635–5662. [Google Scholar] [CrossRef]
  31. Liu, C.; Gao, G.; Huang, Z.; Hu, Z.; Liu, Q.; Wang, Y. Yolc: You only look clusters for tiny object detection in aerial images. IEEE Trans. Intell. Transp. Syst. 2024, 25, 13863–13875. [Google Scholar] [CrossRef]
  32. Hao, M.; Zhang, Z.; Li, L.; Dong, K.; Cheng, L.; Tiwari, P.; Ning, X. Coarse to fine-based image–point cloud fusion network for 3D object detection. Inf. Fusion 2024, 112, 102551. [Google Scholar] [CrossRef]
  33. Zhou, Z.; Zhu, Y. KLDet: Detecting tiny objects in remote sensing images via kullback-leibler divergence. IEEE Trans. Geosci. Remote Sens. 2024, 62, 4703316. [Google Scholar] [CrossRef]
  34. Yu, W.; Zhou, P.; Yan, S.; Wang, X. Inceptionnext: When inception meets convnext. In Proceedings of the IEEE/CVF Conference on Computer Vision and Pattern Recognition, Seattle, WA, USA, 16–22 June 2024; pp. 5672–5683. [Google Scholar]
  35. Chen, X.; Li, H.; Wu, Q.; Meng, F.; Qiu, H. Bal-R 2 CNN: High quality recurrent object detection with balance optimization. IEEE Trans. Multimed. 2021, 24, 1558–1569. [Google Scholar] [CrossRef]
  36. Han, J.; Ding, J.; Xue, N.; Xia, G.S. Redet: A rotation-equivariant detector for aerial object detection. In Proceedings of the IEEE/CVF Conference on Computer Vision and Pattern Recognition, Nashville, TN, USA, 20–25 June 2021; pp. 2786–2795. [Google Scholar]
  37. Yang, X.; Yan, J.; Feng, Z.; He, T. R3det: Refined single-stage detector with feature refinement for rotating object. In Proceedings of the AAAI Conference on Artificial Intelligence, Virtual, 2–9 February 2021; Volume 35, pp. 3163–3171. [Google Scholar]
  38. Guo, J.; Hao, J.; Mou, L.; Hao, H.; Zhang, J.; Zhao, Y. S2A-Net: Retinal structure segmentation in OCTA images through a spatially self-aware multitask network. Biomed. Signal Process. Control 2025, 110, 108003. [Google Scholar] [CrossRef]
  39. Das, A.; Singh, A.; Nishant; Prakash, S. CapsuleNet: A Deep Learning Model To Classify GI Diseases Using EfficientNet-b7. arXiv 2024. [Google Scholar] [CrossRef]
Figure 1. Structure of the FAS model based on feature pyramid.
Applsci 15 08370 g001
Figure 2. A merge path obtained by FAS, which achieves a good trade-off between accuracy and the number of parameters.
Applsci 15 08370 g002
Figure 3. Difference between categorical and locational feature maps: (a) Texture information feature map. (b) Edge information feature map.
Applsci 15 08370 g003
Figure 4. The four-dimensional horizontal detection head’s performance degrades when the tilt angle surpasses a specific threshold, rendering it unable to detect closely spaced targets.
Applsci 15 08370 g004
Figure 5. Structure diagram of the horizontal object detection with added rotational dimension.
Applsci 15 08370 g005
Figure 6. Bounding box regression process.
Applsci 15 08370 g006
Figure 7. Horizontal object detection regression process diagram: (a) initial anchor; (b) removal of the background anchor; and (c) after regression.
Applsci 15 08370 g007
Figure 8. Decoupled object detection head architecture.
Applsci 15 08370 g008
Figure 9. Center-ness calculation representation.
Applsci 15 08370 g009
Figure 10. Oriented object detection box representation.
Applsci 15 08370 g010
Figure 11. Elliptic center sampling.
Applsci 15 08370 g011
Figure 12. The bounding box regression effect of two loss functions, demonstrating that the KLD outperforms the smooth L1. (a) Smooth L1 loss function; (b) KLD loss function.
Applsci 15 08370 g012
Figure 13. The experimental effect that demonstrates the method proposed in this paper can detect densely distributed targets and objects with large aspect ratios.
Applsci 15 08370 g013
Table 1. Search space operation table.
mOperation
0Separable convolution 3 × 3
1Separable convolution 3 × 3 dilation rate = 3
2Separable convolution 3 × 3 dilation rate = 6
3Crosslink
4Transformable convolution 3 × 3
Table 2. Ablation study results on the DOTA1.0 dataset.
ModelModel 1Model 2Model 3Model 4
AP@IOU = 0.7 (%)
Inception
ResNet101-
SPP--
FAS---
Plane88.689.689.790.5
Baseball diamond76.885.285.387.1
Bridge54.657.562.462.5
Ground track field69.270.574.282.1
Small vehicle78.171.777.678.5
Large vehicle77.777.681.182.7
Ship8778.188.387.2
Tennis court919191.591
Basketball court8485.183.688.7
Storage tank83.685.586.187.2
Soccer ball field58.767.568.869.6
Roundabout65.761.667.668.9
Harbor75.876.182.685.6
Swimming pool70.77981.182
Helicopter59.462.966.173.2
mAP (%)74.876.27881
Note: √ indicates that the component is used, - indicates that the component is not used, and bold values indicate the performance of the best model in each scenario.
Table 3. Learning rate scheduling strategy.
Training PhaseIteration RangeDescriptionLearning Rate
Warm-up0–20,000Warm-up phaseLinearly increases to 0.01
Main Training20,000–960,000Initial learning rate0.01
First Decay960,000–1,280,000First decay phase × 0.1 (0.001)
Second Decay1,280,000–1,600,000Second decay phase × 0.1 (0.0001)
Table 4. Training hyperparameters for FAS and final detector training.
ParameterValue
Maximum Iterations1,600,000 (20 epochs, 80,000 per epoch)
Images per Epoch118,000
Batch Size8
GPU Count2
OptimizerSGD Momentum (momentum=0.9, epsilon= 1 × 10 5 )
Initial Learning Rate0.01 ( 5 × 10 4 × 2 × 1.25 × 8 × 1 )
Warmup Iterations20,000 (0.25 epochs)
Learning Rate Decay Steps960,000, 1,280,000, 1,600,000
Learning Rate Decay Factor0.1 (0.01 → 0.001 → 0.0001)
RPN Classification Loss Weight1.0
RPN Regression Loss Weight1.0
RPN Balancing Factor σ 3.0
SHARE_HEADSTrue
GRADIENT_CLIPPING_BY_NORMNone
MUTILPY_BIAS_GRADIENTNone
FAS-FPN Layers7
FAS-FPN Channels384
FAS-FPN ActivationReLU
Gradient ClippingNot enabled
Table 5. Ablation experiments of the proposed method on DOTA dataset.
FASDDHECSmAP/%FPS/Frame
---73.226.2
--78.625.8
-80.124.5
-79.825.5
82.624.4
Note: √ indicates that the component is used, - indicates that the component is not used.
Table 6. Performance of different backbone networks using the method proposed in this paper.
ModelBFLOPS/sDOTA1.0 mAP/%DOTA1.5 mAP/%HRSC2016 mAP/%FPS/Frame
ResNet-50197.165.563.652.123.6
ResNet-152243.067.868.958.217.1
ConvNext-XL [34]249.083.972.989.317.5
Inception-ResNet101204.082.679.589.124.4
Table 7. Comparison of experimental results between the proposed method and mainstream dense rotated-image object detection models.
ModelBackboneDOTA1.0 mAP/%DOTA1.5 mAP/%HRSC2016 mAP/%FPS/Frames Change
R2CNN [35]ResNet10172.367.579.55.5
RetinaNetResNet10177.468.786.322.4
ReDet [36]Darknet5378.672.782.124.5
R3Det [37]ResNet10179.873.483.512.0
FCOSResNet10180.374.190.317.5
S2A-Net [38]ResNet10181.476.381.22.0
EfficientNet-B7 [39]ResNet10162.153.280.712.8
Oriented R-CNNResNet10181.878.486.221.1
OursFAS-Inception-ResNet10182.679.589.124.4
Disclaimer/Publisher’s Note: The statements, opinions and data contained in all publications are solely those of the individual author(s) and contributor(s) and not of MDPI and/or the editor(s). MDPI and/or the editor(s) disclaim responsibility for any injury to people or property resulting from any ideas, methods, instructions or products referred to in the content.

