Article

Ultrasonic Nondestructive Testing Image Enhancement Model Based on Super-Resolution Imaging

by
Jinxuan Zhu
1,*,
Guoyou Wang
2,
Kang Luo
1 and
Xinfang Zhang
1
1
School of Mechanical Science and Engineering, Huazhong University of Science and Technology, Wuhan 430074, China
2
School of Automation and Artificial Intelligence, Huazhong University of Science and Technology, Wuhan 430074, China
*
Author to whom correspondence should be addressed.
Appl. Sci. 2025, 15(15), 8339; https://doi.org/10.3390/app15158339
Submission received: 27 June 2025 / Revised: 20 July 2025 / Accepted: 22 July 2025 / Published: 26 July 2025

Abstract

Ultrasonic nondestructive testing has been widely used in various industries due to its simple operation and harmlessness for the object to be detected. However, due to the mechanism of ultrasonic image generation, the generated ultrasonic images often have low resolution, which greatly affects the final detection results. How to improve the resolution of ultrasonic images has become the key to improving the accuracy of defect detection. Therefore, this paper proposes an ultrasonic super-resolution model based on up- and down-sampling layers and multi-layer residual networks combined with Charbonnier loss function. The degradation features of the image are learned through up- and down-sampling layers, and the intrinsic features of the image are learned through multi-layer residual networks, so that all the feature information of the image is fully learned. The Charbonnier loss function accelerates the convergence of the model. Experimental results show that the model proposed in this paper outperforms the common model performance.

1. Introduction

Ultrasonic nondestructive testing has been widely used in industry due to its various advantages. However, with the increasing requirements for nondestructive testing accuracy, low-resolution ultrasonic images can easily lead to defect recognition errors. How to improve the resolution of ultrasonic images has become a key issue restricting the development of the nondestructive testing industry. Therefore, this paper proposes an ultrasonic nondestructive testing image super-resolution model consisting of up- and down-sampling layers and a deep residual network and uses the Charbonnier loss function to adjust the model performance. The model learns the degradation features of the image through the up- and down-sampling layers and learns the intrinsic features of the image through the deep residual network so as to learn the feature information of the image more completely. The Charbonnier loss function can better converge the model, thereby completing the image super-resolution task. The experimental results on the ultrasonic image data set also verify the effectiveness of the model, which is superior to other models in terms of peak symbol noise ratio (PSNR) and structural similarity index measure (SSIM) indicators.
Laser ultrasonic technology is an emerging technology in the field of nondestructive testing. Its basic principle is to focus the laser on the surface of the material, so that the material generates heat, strain, and stress fields on the surface of the material, and then generates ultrasonic waves inside the object. Due to its advantages such as non-contact, no coupling agent, high precision, and no damage, it has been rapidly developed and applied in ultrasonic nondestructive testing. With the development of nondestructive testing, higher requirements are placed on the quality of ultrasonic images. High-resolution detection images have become the key to improving detection accuracy. However, due to the imaging mechanism of ultrasonic images, the resolution of ultrasonic images is often low, which brings great difficulties to the task of nondestructive testing. Therefore, improving the resolution of ultrasonic images will play a vital role in the development of nondestructive testing, which is also the key to promoting the development of nondestructive testing.
Super-resolution imaging is a widely used computational imaging technology, which is used to explore and restore high-resolution (HR) images from low-resolution (LR) images in order to improve the accuracy of image detail description. High-resolution images will greatly increase the accuracy of nondestructive testing work. Research has shown that it is feasible to achieve super-resolution imaging [1] by enhancing the hardware to break through the diffraction limit. For example, hyperlens-based ultrasound transducers have been developed to achieve super-resolution imaging of ultrasound echoes. Hyperlens technology [2,3,4] has been proven to have great potential, but its application value in practical industrial nondestructive testing remains to be studied due to the complexity in the design and fabrication of metamaterial-based hyperlens. On the other hand, studies have shown that super-resolution enhancement of ultrasound imaging can be performed by computational methods, such as the multiple signal classification algorithm combined with time reversal, which is called TR-MUSIC [5,6]. The advantage of TR-MUSIC is that it can be perfectly combined with the array information of phased array ultrasound, without modifying the phased array ultrasound system. Fan et al. [7] discussed the application of two computational methods based on TR-MUSIC and its phase-coherent form (PC-MUSIC) in the super-resolution of nondestructive testing of solid processing. However, the TR-MUSIC method is easily affected by noise and its imaging effect is poor when the noise is large.
This paper mainly focuses on learning-based super-resolution methods. Kanade and Baker [8] first proposed a learning-based super-resolution method and proved that the results of image reconstruction are significantly better than reconstruction-based algorithms. Freeman et al. [9] constructed a Markov Random Field to learn the correlation between HR and LR images. Yang et al. [10] learn the sparse representation of images based on the principle of compressed sensing and prove the effectiveness of sparsity as prior knowledge for super-resolution problems. Wu et al. [11] used a method based on compressed sensing to construct a model for super-resolution nondestructive detection imaging of uncooled infrared sensors. It generates super-resolution infrared phase images by learning sparse representations of LR images and sparse dictionaries in HR images. Mario et al. [12] proposed a method based on super-resolution photoactivated infrared imaging for the measurement of spatially resolved thermal conductivity.
Deep learning is a computing method that has developed rapidly in recent years. It learns the mapping relationship between input and target values through various network structures. With its powerful fitting ability, deep learning has achieved great success in various applications, such as equipment fault diagnosis [13,14] and ground-penetrating radar image enhancement [15]. Sergio et al. [16] summarized the application status and future development trend of deep learning in the field of nondestructive testing. Image super-resolution is an important application direction of deep learning and it is also developing rapidly. SRCNN [17] is the first deep learning-based single-image super-resolution model. EDSR [18] introduces the ResNet [19] structure into the model to reduce the risk of model overfitting. The model has shown a good level in the field of image super-resolution imaging. The DBPN [20] model uses up- and down-sampling layers to extract the relationship between LR and HR and achieves good results. MZSR [21] combines zero-shot learning and meta-transformation learning to reduce the inference time of the test. With the proposal of the Transformer model [22], corresponding super-resolution models have also emerged in large numbers, such as RCAN [23], ENLCA [24], etc. Super-resolution technology based on deep learning has also made good progress in the field of nondestructive testing. Song et al. [25] proposed a new super-resolution method for detecting small subwavelength defects. The model uses two networks. The first network is to determine the location of the defect area and the second network is to detect the subwavelength details of the defect. Cheng et al. [26] proposed a defect-aware generative adversarial network model for super-resolution and defect detection of images after thermal infrared imaging, which improved the visibility of defects and the accuracy of detection. Mei et al. [27] constructed a visual geometric group-UNet (VGG-UNet) model to optimize the ultrasound imaging image and the model can improve the resolution of the reconstructed ultrasound image. Zhang et al. [28] proposed a multi-layer deep learning network for super-resolution reconstruction of phased array ultrasonic images. The ultrasonic images reconstructed by the network have improved the calculation accuracy of defect center distance and defect area calculation accuracy. Although super-resolution technology based on deep learning has achieved good results in the field of nondestructive testing, to the authors’ best knowledge, super-resolution imaging based on deep learning has not been studied in the field of laser ultrasonic nondestructive testing.
In view of the above conclusions, we propose a deep learning-based ultrasound image super-resolution model for data augmentation of laser ultrasound images. It is a general image data enhancement model that can be applied to various image super-resolution applications. Specifically, our proposed image super-resolution model is a novel method for hierarchical, multi-scale feature learning. It has two main structural forms: the first structure is the up- and down-sampling layer used to learn the degradation features from high-resolution images to low-resolution images and the second structural is the residual layer used to learn the basic features of the image.
The proposed model provides the following unique advantages:
(1)
The deep learning super-resolution model is applied to the field of laser ultrasound image signal enhancement, providing a new solution for enhancing laser ultrasound images.
(2)
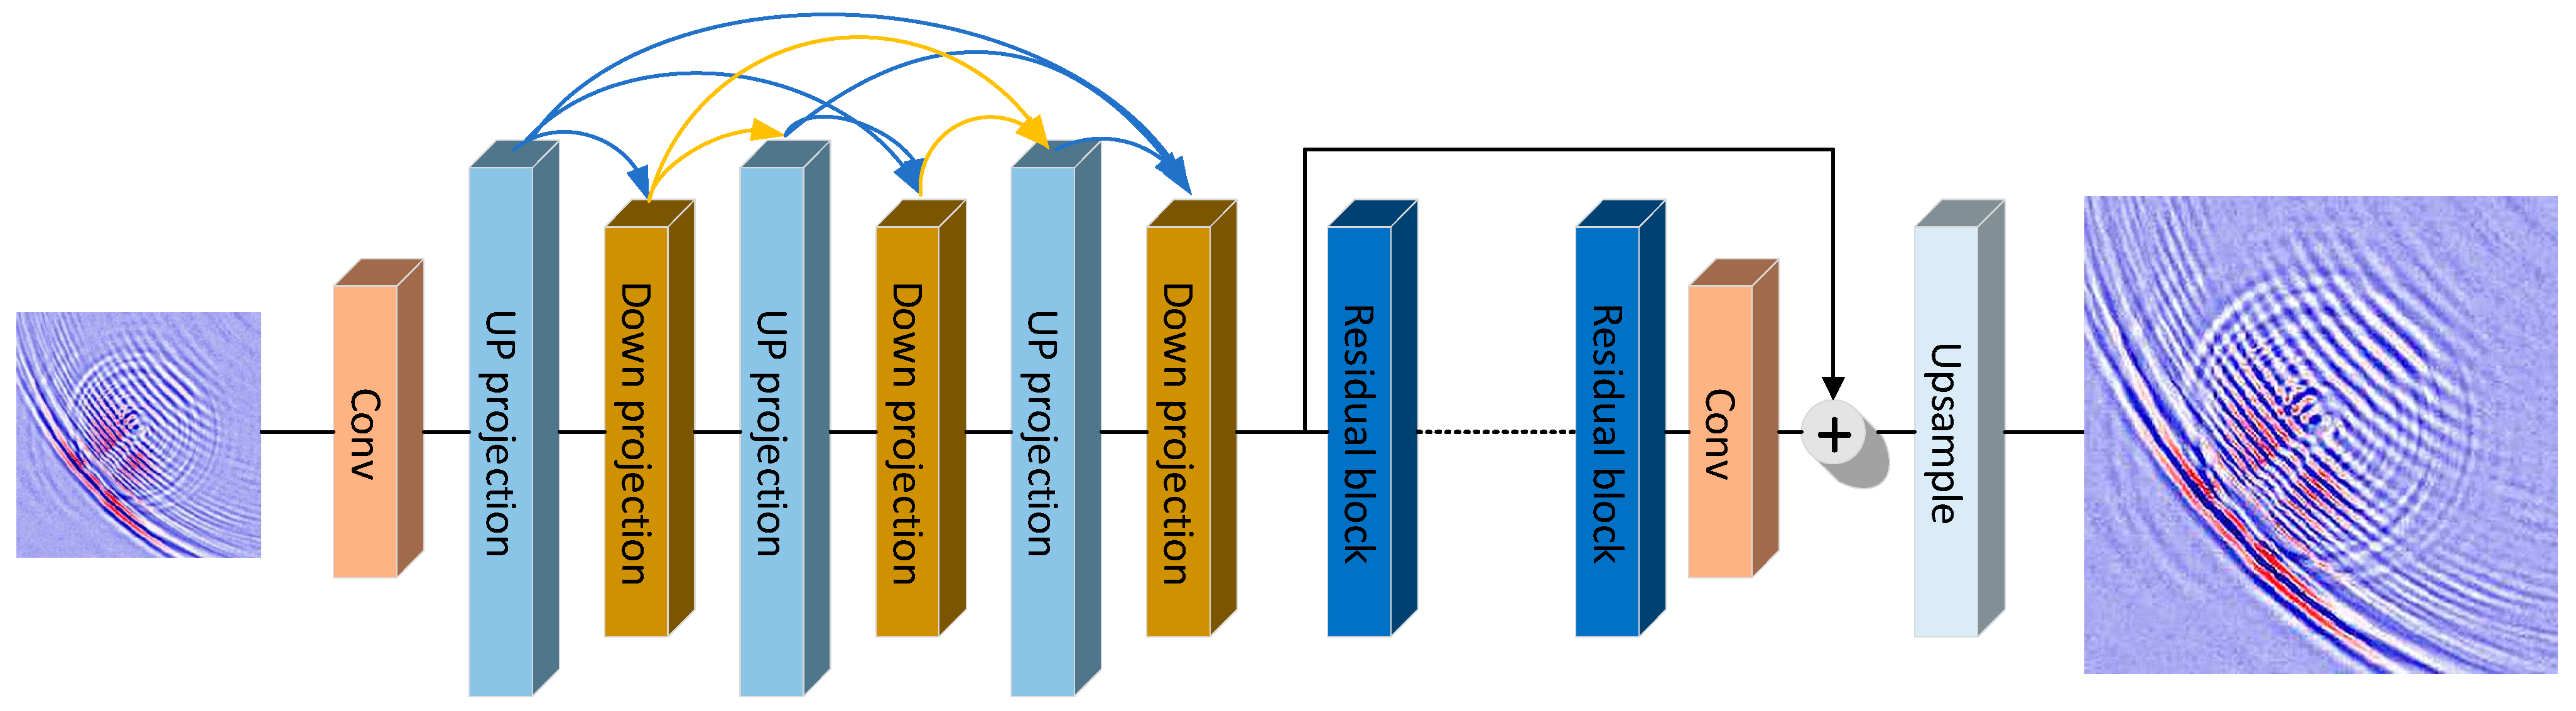
A new end-to-end ultrasonic image super-resolution model is proposed, which combines up and down projection layers, deep residual network, and Charbonnier loss to solve the problem of ultrasonic image super-resolution data enhancement. The model does not require manual feature extraction or annotation of ultrasound images based on a large amount of prior knowledge.
(3)
Super-resolution data enhancement of ultrasound images can be directly realized without any modification to the existing laser ultrasound equipment. Compared with the existing method of increasing image resolution through hardware, the cost of industrial applications is reduced.
(4)
The model was compared with the classic super-resolution imaging model in the actual ultrasonic nondestructive testing data set under the indicators of peak signal-to-noise ratio (PSNR) and structural similarity index measurement (SSIM). The model showed better imaging results and provided a better detection signal for subsequent defect identification.

2. Theory and Method

2.1. Degradation Model

Before solving the problem of laser ultrasound super-resolution, it is more important to clearly understand the degradation model of the image. The degradation model of an image can be given by
I L R = ( I H R s ) k + n
where s is the downsampler, is the convolution operation, k is the blur kernel, and n is the noise. Below we provide a brief discussion of these parameters.
Downsampler. As far as the author knows, the existing downsamplers are divided into two categories: one is the direct downsampler [29] and the other is the bicubic downsampler [30]. In this paper, we use a bicubic downsampler without considering the noise and the blur kernel is k . It should be noted that the blur kernel and noise in the general degradation model vary and the downsampler is assumed to be fixed.
Blur kernel. The more common known blur kernel in the model is the isotropic Gaussian blur kernel [31], and the anisotropic Gaussian blur kernel [32] is also used in some models. However, in practical applications, the blur kernel of the image is complex and changeable. We cannot use a hypothetical model to represent the blur kernel. If we assume that the blur kernel is smoother than the actual blur kernel, the generated high-resolution image will be excessively blurred. If the assumed blur kernel is sharper than the actual blur kernel, high-frequency artifacts will appear in the generated high-resolution image.
Noise. In practical applications, LR images are usually accompanied by noise. The most direct way to solve this problem is to pre-denoise the image before performing super-resolution on the LR image, but such an operation will lose some detailed features of the image and reduce the image quality after super-resolution. Therefore, it is a very good choice to hand over the noise and the blur kernel to the network for learning.
How to accurately learn the degraded features and noise features of images is recognized as a key factor for image super-resolution. We learn the degradation information from the HR image to the LR image through the up and down projection layers and use a multi-layer residual network to learn the basic features and the noise information of the LR image. We use such a network framework to achieve the effect of considering both image degradation information and noise information in a model.

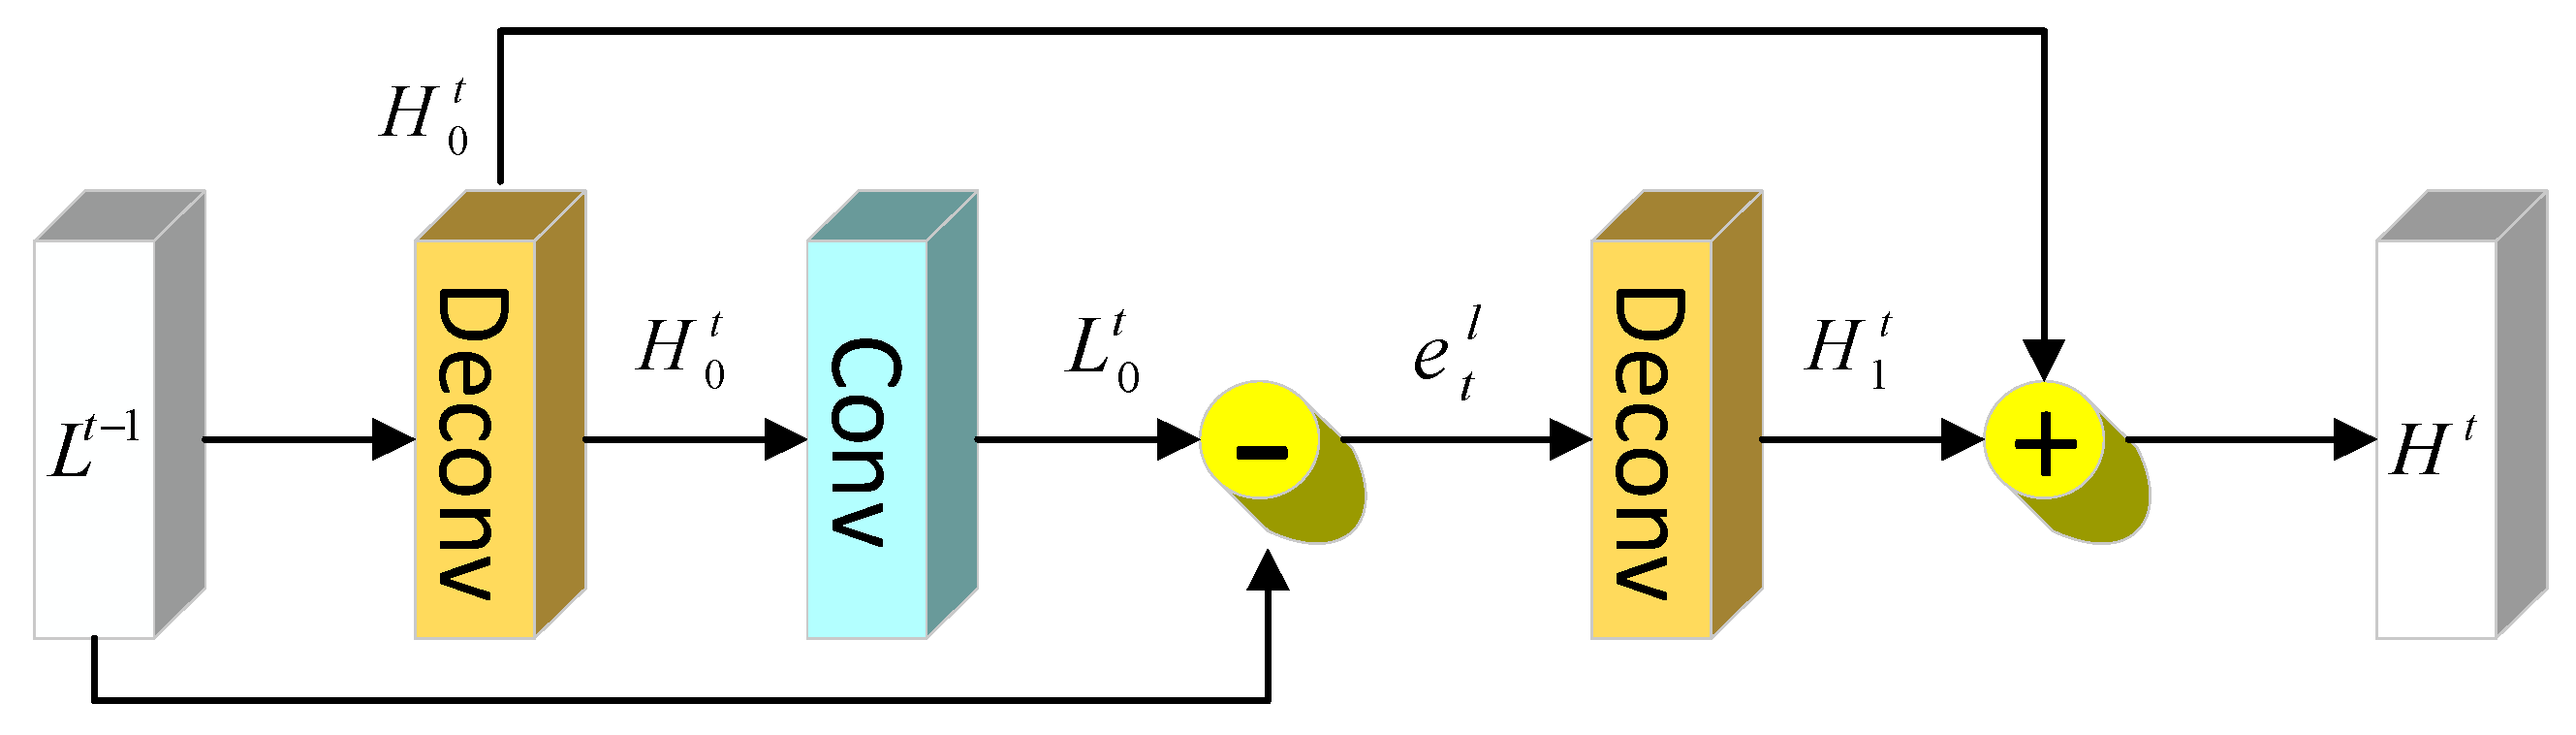
2.2. Up and Down Projection Block
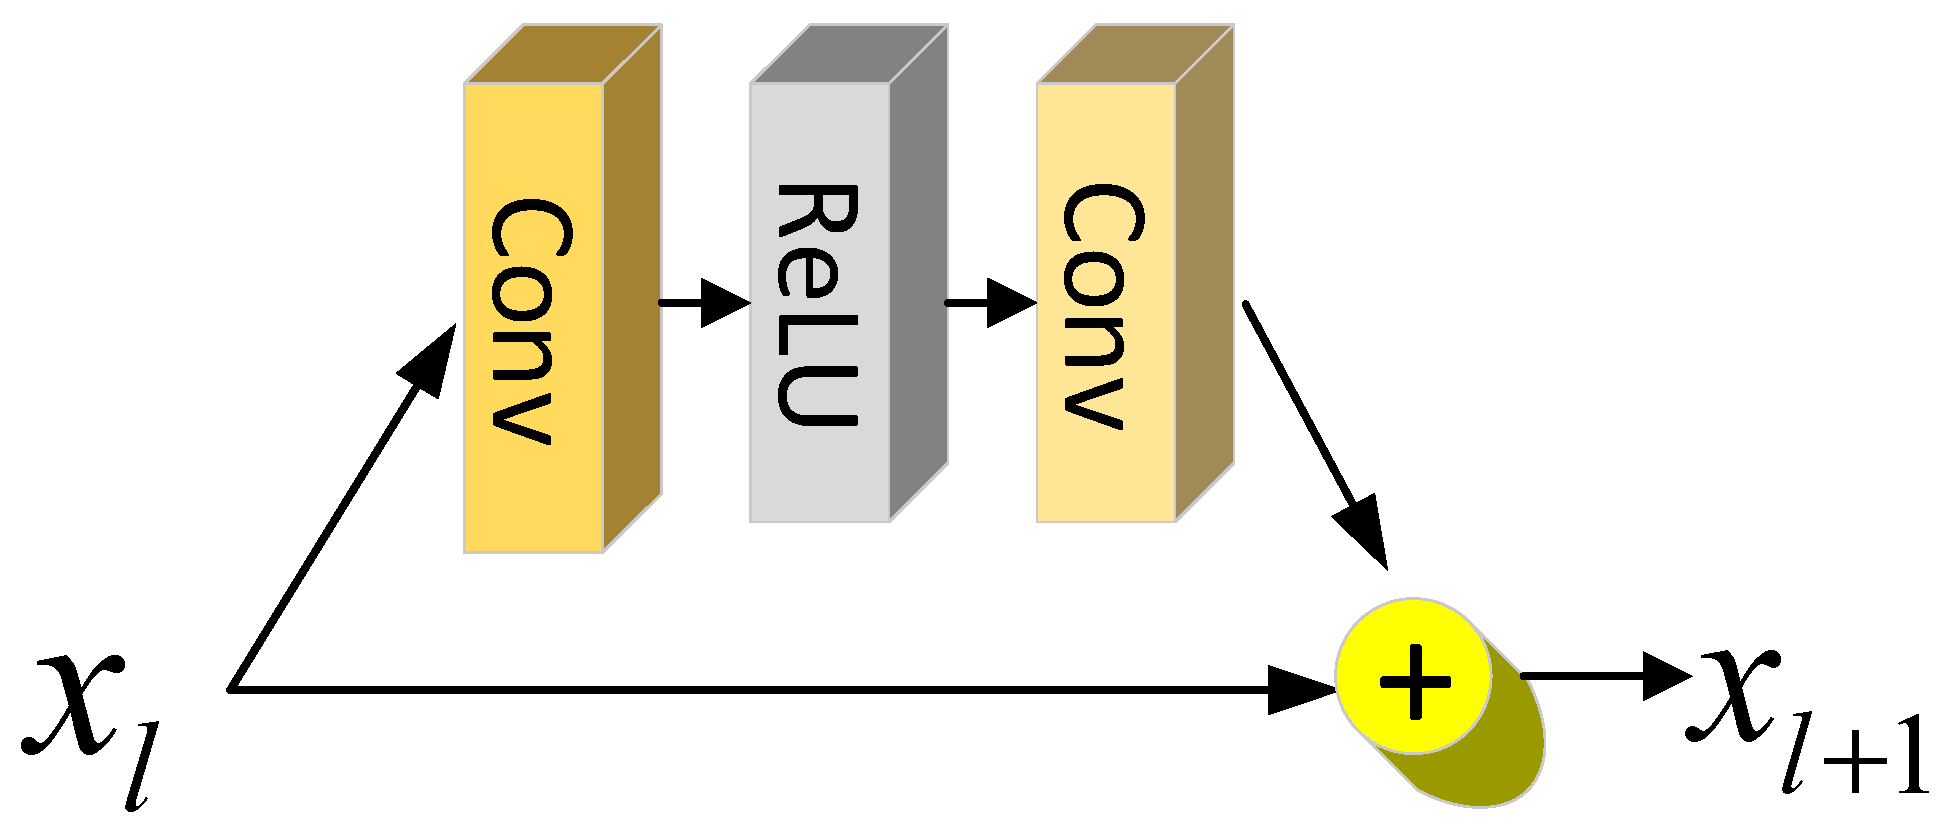
Our model adopts the network structure of up and lower projection block, which is to allow the model to learn the degraded features between HR images and LR images. Up projection layer unit definition:
scale   up :   H 0 t = ( L t 1 p t ) s
scale   down :   L 0 t = ( H 0 t g t ) s
residual :   e t l = L 0 t L t 1
scale   residual   up :   H 1 t = ( e t l q t ) s
scale   residual   down :   H t = H 0 t + H 1 t
where is the convolution operator, s and s are the up- and down-sampling operators, respectively. The LR map L t 1 calculated by the previous layer is projected as input to the HR map H 0 t , and e t l is the residual between the observed LR map L t 1 and the reconstructed L 0 t . e t l is re-projected to the HR map H 1 t and the final output bits of the unit are the sum of H 0 t and H 1 t . The network structure is shown in Figure 1.
The lower projection unit layer is very similar to the upper projection unit layer. But its input is the HR map of the previous layer and the output result is the HR map, as shown in Figure 2. Up projection layer unit definition:
scale   down :   L 0 t = ( H t g t ) s
scale   up :   H 0 t = ( L 0 t p t ) s
residual :   e t l = L 0 t L t 1
scale   residual   down :   L 1 t = ( e t h g t ) s
output   feature   map :   L t = L 0 t + L 1 t
We adopt a multi-layer alternate up and down projection layer structure so that the network can accurately learn the degraded features of the image through multi-layer correction.

2.3. Residual Block

Since its introduction, the residual network has shown good performance in various computer vision tasks. Normalization layers usually appear in residual blocks, which can speed up the training of the model and prevent the model from overfitting. However, if a normalization layer is used in super-resolution imaging tasks, the pixel-level features of the image may be missing, but the pixel-level features are critical to the final result of super-resolution imaging. Therefore, the residual network used in this paper does not contain a normalization layer. It consists of two 3 × 3 convolutional layers and a ReLU activation function layer, as shown in Figure 3.

2.4. Charbonnier Loss

In image super-resolution tasks, the loss function can help the model optimize parameters. The most common loss functions are pixel-level loss L1 loss and L2 loss. L2 penalizes larger errors more, but is less sensitive to smaller errors. In practical applications, L1 loss is better than L2 loss in terms of performance and convergence. However, pixel-level loss usually causes the generated super-resolution image to ignore some high-frequency detail information, making the image too smooth and poor in human perception. We use Charbonnier loss to build our model. The advantage of Charbonnier loss is that it can better handle outliers and reduce artifacts, thereby improving the imaging quality of super-resolution. The formula of Charbonnier loss is as follows:
C h a r b o n n i e r _ L o s s ( y , y ¯ ) = 1 N i = 1 N ρ ( y y ¯ )
ρ ( x ) = ( x 2 + ε 2 )
where N is the number of training samples in each batch, y is the actual HR image, y ¯ is the HR image generated by super-resolution, and ε is a constant; we set it as 1 × 10⁻³.

2.5. Laser Ultrasound Super-Resolution Network

Some of the existing super-resolution models consider learning the degenerated features from HR to LR and some consider learning the basic features of LR. However, there is no model that learns both the degraded features of the image and the basic features of the image. We feel that the degraded features of the image are equally important as the basic features. Therefore, in order to make the imaging effect of laser ultrasound images better after super-resolution, the model used in this paper can learn these two features of laser ultrasound images at the same time. The model has two main structures. The first part is multi-layer up and down projection layers. To learn the degradation features from HR to LR, the second part is a multi-layer residual layer to learn the basic features of the image. The structure of laser ultrasound super-resolution network is shown in Figure 4.
First, our model uses a 3 × 3 convolutional layer to extract the required feature depth and then allows the model to learn the degraded features of the image through multiple layers of up and down projection layers. It then fully learns the basic features of the image through multiple layers of residual blocks. Finally, the super-resolution imaging of the laser ultrasound image is completed through the sub-pixel up-sampling layer.
As mentioned above, residual networks have achieved great success in various tasks. We combine it with up and down projection layers and demonstrate a powerful super-resolution imaging capability of laser-ultrasound images. Figure 5 is a flowchart of the super-resolution method in this paper, and the detailed process is as follows:
(1)
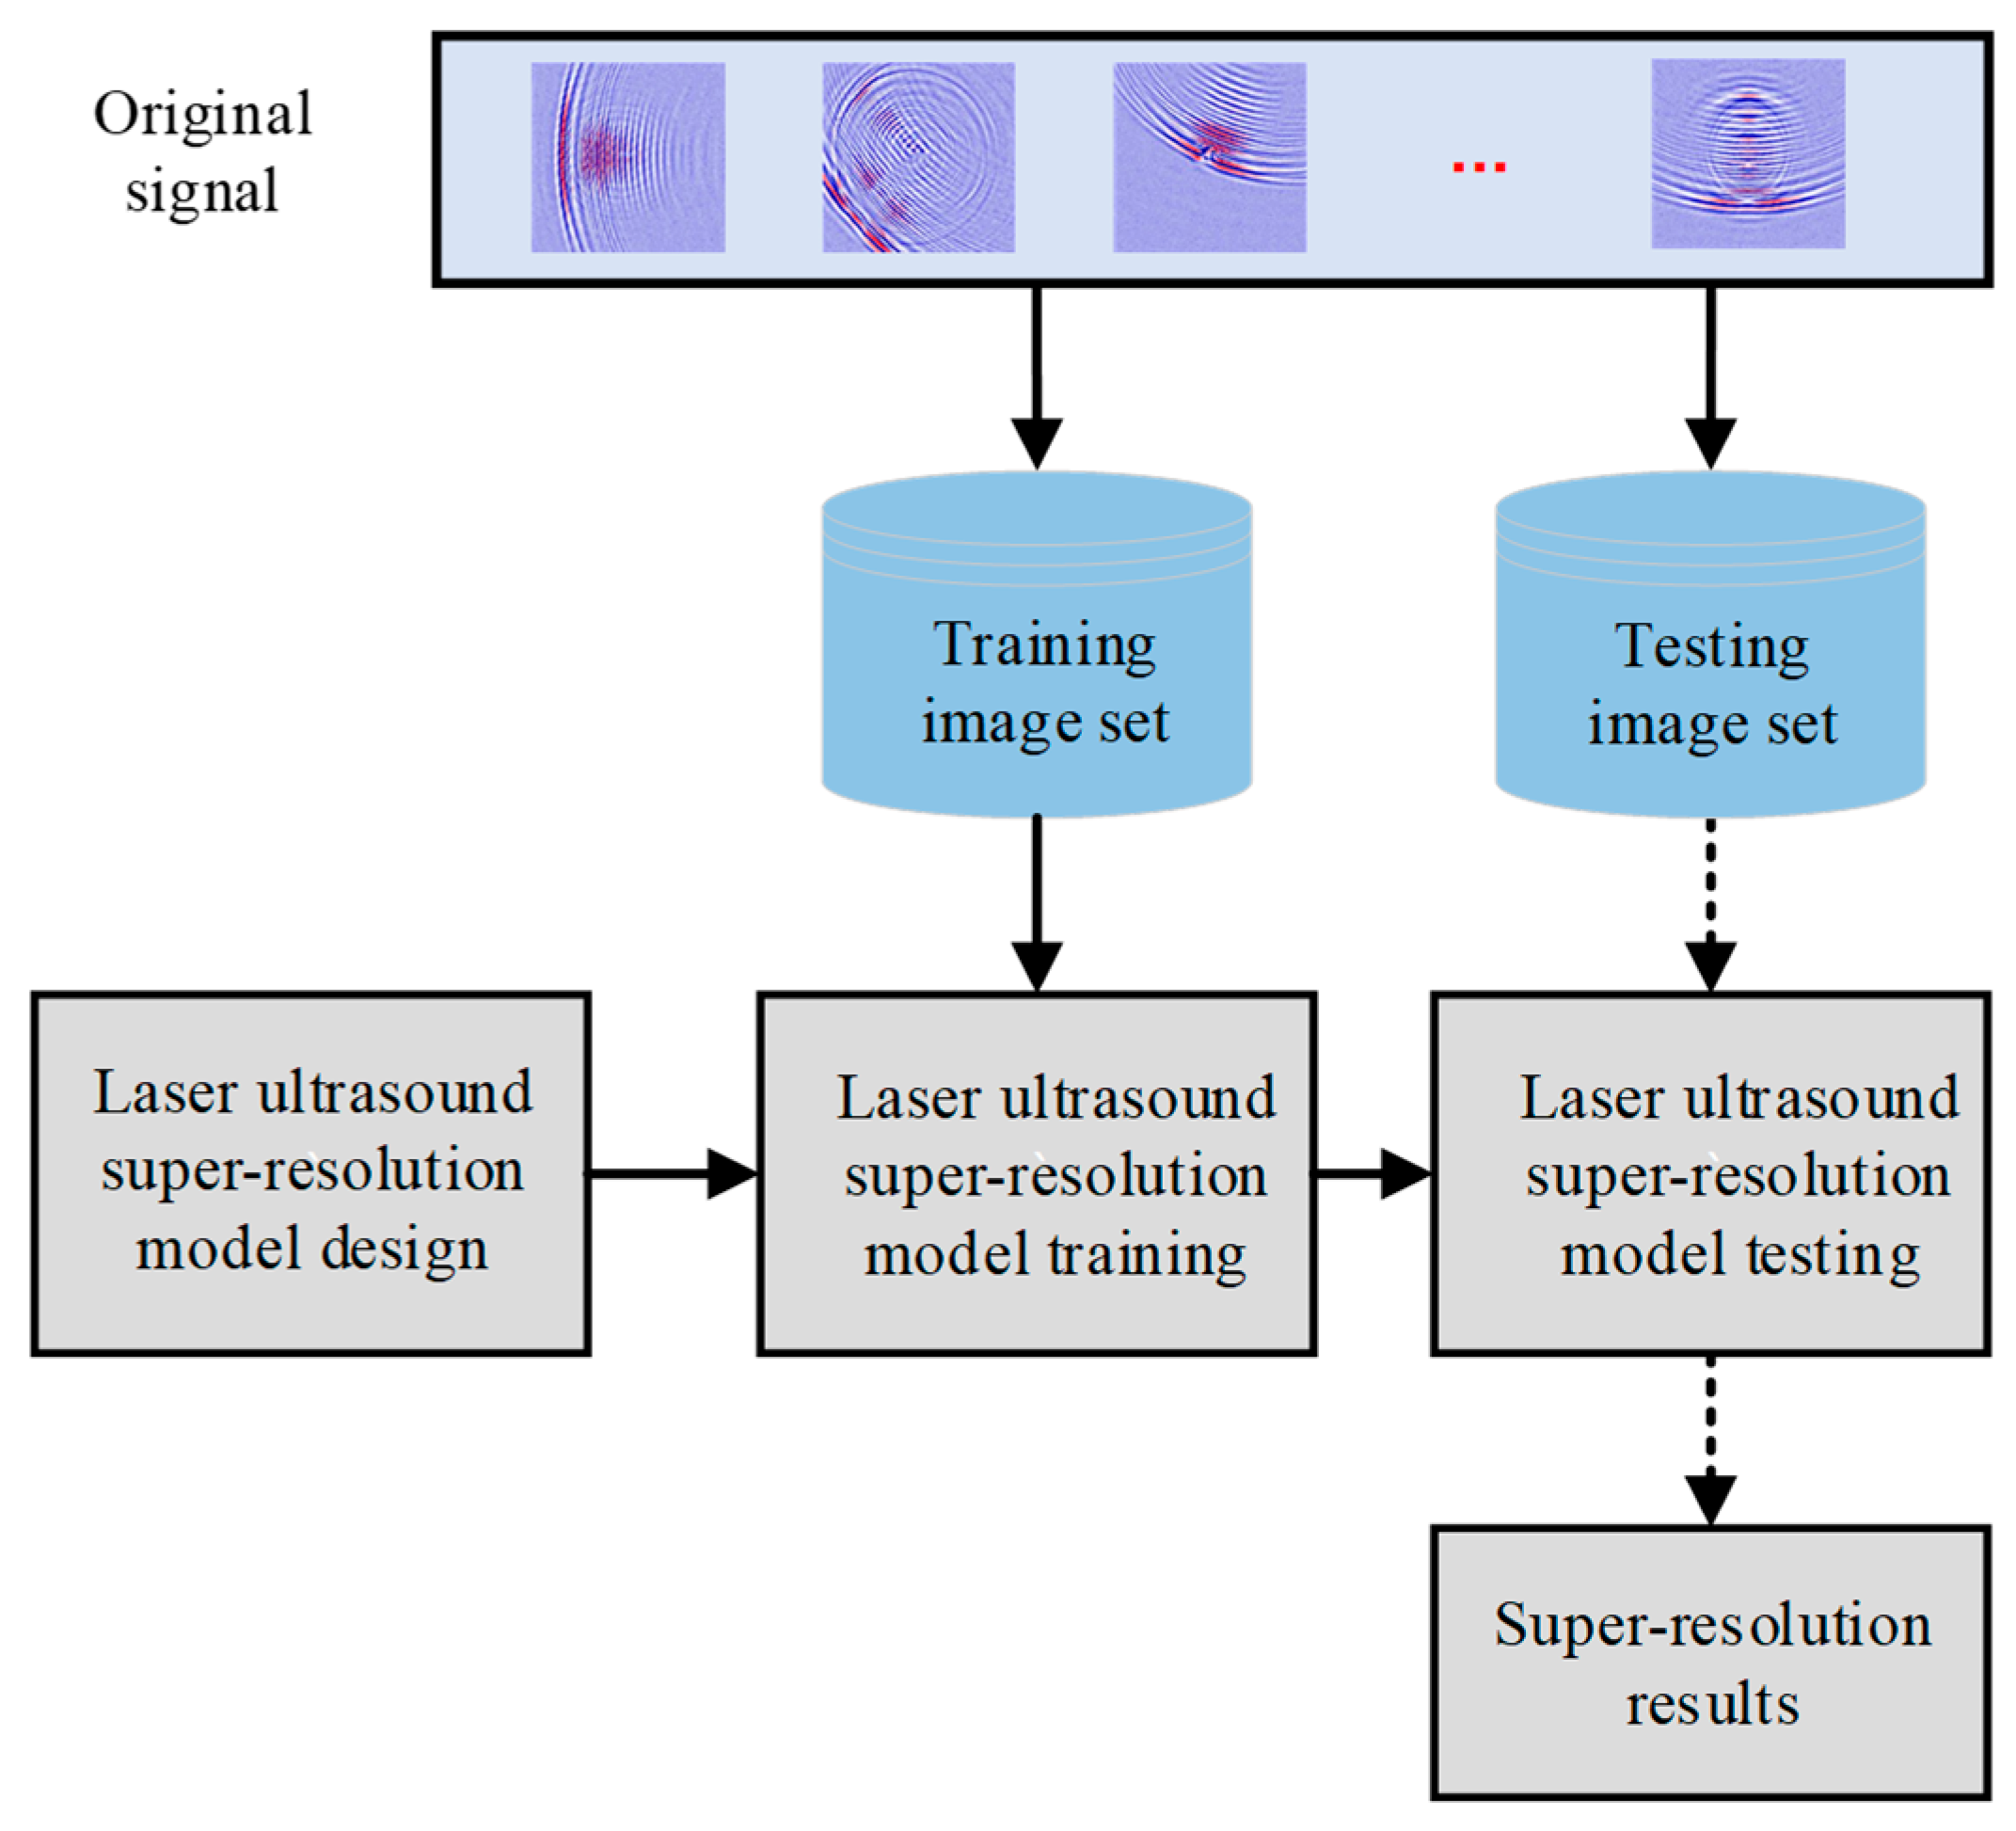
The laser ultrasound image data set is acquired through the material under test by laser ultrasound equipment.
(2)
The data set is divided into two parts according to a certain ratio. The first part is used to train the super-resolution model, which is called the training set, and the other part is called the test set to test the performance of the model.
(3)
Ultrasound super-resolution model design.
(4)
Use the training set to train the ultrasound super-resolution model until a satisfactory result is obtained.
(5)
Input the test set into the trained super-resolution model to realize super-resolution imaging of laser ultrasound.
(6)
Output super-resolution results.
In addition, we use a residual scale factor of 0.1, and the final result is compressed to 0–255, which is beneficial to imaging output.

3. Experiments

3.1. Experimental Setup and Test Specimens

The experimental data of laser ultrasound is obtained through the more representative “USimgAIST” [33] data set. The experimental system uses a pulsed laser to scan the material to generate ultrasonic waves. A receiving sensor is installed on the tested material to obtain the ultrasonic propagation signal. The laser ultrasound system is shown in Figure 6 below, and the relevant main components are marked in the comments picture.
In laser ultrasonic nondestructive testing, the type, shape, size, and depth of defects are the variable factors of detection. Therefore, a batch of stainless-steel plates with different defects were prepared in the experiment and their uniform size was 3 mm in thickness and 100 mm × 100 mm in size. These defect samples can be divided into two categories: drilled holes with a diameter of 1 mm–5 mm and slits with lengths ranging from 3 mm to 10 mm. Table 1 gives the details of the samples.
The experiment also prepared an undamaged stainless-steel plate as a comparative experiment. To better explain the robustness of the system, let the transducer vary the incident angle from 0 to 90 at 22.5-degree intervals. A total of 7004 laser ultrasound images were collected in the experiment. They were divided into 3615 non-defective images and 3389 defective images. In order to ensure the simplicity and accuracy of the experiment, we randomly selected 1954 pictures as the training set and testing set of the model. We used 80% of the total data set as training set and the remaining 20% as test set.

3.2. Quantitative Evaluation Metrics

In order to objectively evaluate the quality of the generated HR images, two commonly used indicators, peak signal-to-noise ratio (PSNR) and structural similarity index measure (SSIM), are used.

3.2.1. Peak Signal-to-Noise Ratio (PSNR)

PSNR is the ratio of the maximum possible value of an image to the corrupting noise that represents image quality, usually expressed on a logarithmic decibel scale. The formula for PSNR is defined as follows:
P S N R ( x , y )   =   20 log 10 ( 255 M S E ( x , y ) )
where MSE is the mean square error between the standard HR image x and the HR image y generated by the model, and the higher the PSNR value, the better the quality of the generated image.

3.2.2. Structural Similarity Index Measure (SSIM)

SSIM is a commonly used perceptual metric to quantify image quality by comparing the structure of generated and real images. The formula for SSIM is defined as follows:
S S I M ( x , y ) = ( 2 μ x μ y + c 1 ) ( 2 σ x y + c 2 ) ( μ x 2 + μ y 2 + c 1 ) ( σ x 2 + σ y 2 + c 2 )
where μ x and μ y represent the average of all pixel values in the real HR image x and the generated HR image y . Among them, σ x 2 and σ y 2 represent the variance of x and y , and σ x y represents the covariance between x and y . c 1 = ( k 1 L ) 2 and c 2 = ( k 2 L ) 2 are two constants, the default value is k 1 = 0.01 , k 2 = 0.03 , and L is the range of pixel values.
The value of SSIM is between −1 and 1. When the value of SSIM is closer to 1, it means that the two images are about the same and the quality of the generated image is better.

4. Results and Discussion

In this paper, we will use the experimental equipment shown in Figure 6 to verify the model, reconstruct the image using the most conventional two-fold super-resolution reconstruction method, and use the classic super-resolution models (EDSR [18], DBPN [20], MZSR [21]) for comparison. These models have shown good performance in super-resolution imaging of general image data sets, so we choose these models to compare with the models in this paper. PSNR and SSIM are used as the evaluation criteria for the model. The experimental results are shown in Table 2 below. All experiments were conducted using Pytorch 1.13.0, Pycharm 2024 on NVIDIA RTX 2060 super.
From Table 2, we can see that the proposed model has a good advantage in ultrasonic image super-resolution and is significantly better than other models in terms of PSNR and SSIM indicators. The model has a good advantage in ultrasonic image super-resolution and such high-resolution images provide a good raw data basis for the final defect detection.
In order to test the model more intuitively, this paper selects more typical images as the standard for comparative experiments and enlarges the details in the same image for easy observation. The final experimental results are shown in Figure 7, Figure 8, Figure 9 and Figure 10 below. Because there are two kinds of defects in the whole data, we used images of two types of defects (holes and slits) to demonstrate the results.
From Figure 7 and Figure 10, we can see that in terms of the overall image, the model can perform the super-resolution imaging task very well. Figure 8 and Figure 10 show the reconstruction results of each model. The enlarged image on the left is the area in the red frame of the original image. From Figure 8 and Figure 10, we can see that for the local area in the HR image, the model results of this paper are more realistic in detail boundary processing, the boundaries are clearer, and there is no granular performance in image coherence. It is also significantly better than the existing model in qualitative analysis and shows good model performance in ultrasound super-resolution imaging tasks.
Through the above qualitative and quantitative analysis, it can be concluded that the model is superior to EDSR, DBPN, and MZSR models in terms of PSNR and SSIM indicators and also shows relatively superior performance in qualitative visual indicators, proving that the super-resolution model using up- and down-sampling layers and multi-layer residual networks is effective. This model can handle ultrasound super-resolution imaging problems well.

5. Conclusions and Future Work

Aiming at the problem of insufficient imaging resolution of existing ultrasonic images, an ultrasonic super-resolution imaging model based on up-sampling and down-sampling layers and multi-layer residual networks is proposed. The model can effectively perform super-resolution imaging of ultrasonic images. It does not require any modification of laser ultrasonic hardware equipment and does not require a priori knowledge to manually annotate ultrasonic images. It has strong adaptability and can better adapt to various environments. Because the feature extraction of the super-resolution model in this paper is automatically completed by the model, there is no need to manually extract features, which makes the model more adaptable. At the same time, for different ultrasound detection equipment, there is no need to modify the hardware of the laser ultrasound equipment, which makes the model better adaptable to the needs of various environments. Through the analysis of actual ultrasonic images, the results show that the model is better than the existing model and has a good effect on improving the resolution of ultrasonic images. From the evaluation indicators introduced in Table 2, we can see that compared with the traditional model, the model in this paper has improved by 3–5 in PSNR and 0.03–0.07 in SSIM. Future research will focus on the ultra-high resolution of ultrasonic images and the resolution improvement of ultrasonic images with strong noise.

Author Contributions

Conceptualization, J.Z.; Methodology, J.Z.; Software, J.Z.; Validation, J.Z.; Formal analysis, J.Z.; Resources, G.W.; Data curation, G.W.; Writing—original draft, G.W.; Visualization, K.L.; Supervision, K.L. and X.Z.; Project administration, X.Z.; Funding acquisition, X.Z. All authors have read and agreed to the published version of the manuscript.

Funding

This research received no external funding.

Institutional Review Board Statement

Not applicable.

Informed Consent Statement

Not applicable.

Data Availability Statement

The raw data supporting the conclusions of this article will be made available by the authors on request.

Conflicts of Interest

The authors declare no conflict of interest.

References

  1. Lima, E.B.; Santos, V.H.; Baggio, A.L.; Lopes, J.H.; Leão-Neto, J.P.; Silva, G.T. An image formation model for ultrasound superresolution using a polymer ball lens. Appl. Acoust. 2020, 170, 107494. [Google Scholar] [CrossRef]
  2. Amireddy, K.K.; Balasubramaniam, K.; Rajagopal, P. Holey-structured metamaterial lens for subwavelength resolution in ultrasonic characterization of metallic components. Appl. Phys. Lett. 2016, 108, 224101. [Google Scholar] [CrossRef]
  3. Lu, D.; Liu, Z. Hyperlenses and metalenses for far-field super-resolution imaging. Nat. Commun. 2012, 3, 1205. [Google Scholar] [CrossRef] [PubMed]
  4. Zhu, J.; Christensen, J.; Jung, J.; Martin-Moreno, L.; Yin, X.; Fok, L.; Zhang, X.; Garcia-Vidal, F.J. A holey-structured metamaterial for acoustic deep-subwavelength imaging. Nat. Phys. 2011, 7, 52–55. [Google Scholar] [CrossRef]
  5. Labyed, Y.; Huang, L. Ultrasound time-reversal MUSIC imaging with diffraction and attenuation compensation. IEEE Trans. Ultrason. Ferroelectr. Freq. Control 2012, 59, 2186–2200. [Google Scholar] [CrossRef] [PubMed]
  6. He, J.; Yuan, F.-G. Lamb wave-based subwavelength damage imaging using the DORT-MUSIC technique in metallic plates. Struct. Health Monit. 2016, 15, 65–80. [Google Scholar] [CrossRef]
  7. Fan, C.; Yang, L.; Zhao, Y. Ultrasonic multi-frequency time-reversal-based imaging of extended targets. NDT E Int. 2020, 113, 102276. [Google Scholar] [CrossRef]
  8. Baker, S.; Kanade, T. Limits on super-resolution and how to break them. IEEE Trans. Pattern Anal. Mach. Intell. 2002, 24, 1167–1183. [Google Scholar] [CrossRef]
  9. Freeman, W.T.; Jones, T.R.; Pasztor, E.C. Example-based super-resolution. IEEE Comput. Graph. Appl. 2002, 22, 56–65. [Google Scholar] [CrossRef]
  10. Yang, J.; Wright, J.; Huang, T.; Ma, Y. Image super-resolution as sparse representation of raw image patches. In Proceedings of the 2008 IEEE Conference on Computer Vision and Pattern Recognition, Anchorage, AK, USA, 23–28 June 2008; pp. 1–8. [Google Scholar]
  11. Wu, X.; Zhou, B.; Huang, F.; Lin, P.; Cao, R. Super-Resolution Thermal Imaging Using Uncooled Infrared Sensors for Non-Destructive Testing of Adhesively Bonded Joints. IEEE Sens. J. 2022, 22, 14415–14423. [Google Scholar] [CrossRef]
  12. Marini, M.; Bouzin, M.; Sironi, L.; D’Alfonso, L.; Colombo, R.; Di Martino, D.; Gorini, G.; Collini, M.; Chirico, G. A novel method for spatially-resolved thermal conductivity measurement by super-resolution photo-activated infrared imaging. Mater. Today Phys. 2021, 18, 100375. [Google Scholar] [CrossRef]
  13. Liang, P.; Wang, B.; Jiang, G.; Li, N.; Zhang, L. Unsupervised fault diagnosis of wind turbine bearing via a deep residual deformable convolution network based on subdomain adaptation under time-varying speeds. Eng. Appl. Artif. Intell. 2023, 118, 105656. [Google Scholar] [CrossRef]
  14. Liang, P.; Wang, W.; Yuan, X.; Liu, S.; Zhang, L.; Cheng, Y. Intelligent fault diagnosis of rolling bearing based on wavelet transform and improved ResNet under noisy labels and environment. Eng. Appl. Artif. Intell. 2022, 115, 105269. [Google Scholar] [CrossRef]
  15. Kang, M.-S.; An, Y.-K. Frequency–wavenumber analysis of deep learning-based super resolution 3D GPR images. Remote. Sens. 2020, 12, 3056. [Google Scholar] [CrossRef]
  16. Cantero-Chinchilla, S.; Wilcox, P.D.; Croxford, A.J. Deep learning in automated ultrasonic NDE–developments, axioms and opportunities. NDT E Int. 2022, 131, 102703. [Google Scholar] [CrossRef]
  17. Dong, C.; Loy, C.C.; He, K.; Tang, X. Learning a deep convolutional network for image super-resolution. In Computer Vision–ECCV 2014: 13th European Conference, Zurich, Switzerland, 6–12 September 2014; Proceedings, Part IV 13; Springer International Publishing: Berlin/Heidelberg, Germany, 2014. [Google Scholar]
  18. Lim, B.; Son, S.; Kim, H.; Nah, S.; Mu Lee, K. Enhanced deep residual networks for single image super-resolution. In Proceedings of the IEEE Conference on Computer Vision and Pattern Recognition Workshops, Honolulu, HI, USA, 21–26 July 2017. [Google Scholar]
  19. He, K.; Zhang, X.; Ren, S.; Sun, J. Deep residual learning for image recognition. In Proceedings of the IEEE Conference on Computer Vision and Pattern Recognition, Las Vegas, NV, USA, 27–30 June 2016. [Google Scholar]
  20. Haris, M.; Shakhnarovich, G.; Ukita, N. Deep back-projection networks for super-resolution. In Proceedings of the IEEE Conference on Computer Vision and Pattern Recognition, Salt Lake City, UT, USA, 18–23 June 2018. [Google Scholar]
  21. Soh, J.W.; Cho, S.; Cho, N.I. Meta-transfer learning for zero-shot super-resolution. In Proceedings of the IEEE/CVF Conference on Computer Vision and Pattern Recognition, Seattle, WA, USA, 13–19 June 2020. [Google Scholar]
  22. Vaswani, A.; Shazeer, N.; Parmar, N.; Uszkoreit, J.; Jones, L.; Gomez, A.N.; Kaiser, Ł.; Polosukhin, I. Attention is all you need. Adv. Neural Inf. Process. Syst. 2017, 30. [Google Scholar]
  23. Zhang, Y.; Li, K.; Li, K.; Wang, L.; Zhong, B.; Fu, Y. Image super-resolution using very deep residual channel attention networks. In Proceedings of the European Conference on Computer Vision (ECCV), Munich, Germany, 8–14 September 2018. [Google Scholar]
  24. Xia, B.; Hang, Y.; Tian, Y.; Yang, W.; Liao, Q.; Zhou, J. Efficient non-local contrastive attention for image super-resolution. Proc. AAAI Conf. Artif. Intell. 2022, 36, 2759–2767. [Google Scholar] [CrossRef]
  25. Song, H.; Yang, Y. Super-resolution visualization of subwavelength defects via deep learning-enhanced ultrasonic beamforming: A proof-of-principle study. NDT E Int. 2020, 116, 102344. [Google Scholar] [CrossRef]
  26. Cheng, L.; Kersemans, M. Dual-IRT-GAN: A defect-aware deep adversarial network to perform super-resolution tasks in infrared thermographic inspection. Compos. Part B Eng. 2022, 247, 110309. [Google Scholar] [CrossRef]
  27. Mei, Y.; Jin, H.; Yu, B.; Wu, E.; Yang, K. Visual geometry group-UNet: Deep learning ultrasonic image reconstruction for curved parts. J. Acoust. Soc. Am. 2021, 149, 2997–3009. [Google Scholar] [CrossRef] [PubMed]
  28. Zhang, W.; Chai, X.; Zhu, W.; Zheng, S.; Fan, G.; Li, Z.; Zhang, H.; Zhang, H. Super-resolution reconstruction of ultrasonic Lamb wave TFM image via deep learning. Meas. Sci. Technol. 2023, 34, 055406. [Google Scholar] [CrossRef]
  29. Zhang, K.; Zhou, X.; Zhang, H.; Zuo, W. Revisiting single image super-resolution under internet environment: Blur kernels and reconstruction algorithms. In Advances in Multimedia Information Processing—PCM 2015: 16th Pacific-Rim Conference on Multimedia, Gwangju, South Korea, 16–18 September 2015; Proceedings, Part I 16; Springer International Publishing: Berlin/Heidelberg, Germany, 2015. [Google Scholar]
  30. Timofte, R.; De Smet, V.; Van Gool, L. A+: Adjusted anchored neighborhood regression for fast super-resolution. In Computer Vision—ACCV 2014: 12th Asian Conference on Computer Vision, Singapore, 1–5 November 2014; Revised Selected Papers, Part IV 12; Springer International Publishing: Berlin/Heidelberg, Germany, 2015. [Google Scholar]
  31. Yang, C.Y.; Ma, C.; Yang, M.H. Single-image super-resolution: A benchmark. In Computer Vision–ECCV 2014: 13th European Conference, Zurich, Switzerland, 6–12 September 2014; Proceedings, Part IV 13; Springer International Publishing: Berlin/Heidelberg, Germany, 2014. [Google Scholar]
  32. Riegler, G.; Schulter, S.; Ruther, M.; Bischof, H. Conditioned regression models for non-blind single image super-resolution. In Proceedings of the IEEE International Conference on Computer Vision, Santiago, Chile, 7–13 December 2015. [Google Scholar]
  33. Ye, J.; Toyama, N. Benchmarking deep learning models for automatic ultrasonic imaging inspection. IEEE Access 2021, 9, 36986–36994. [Google Scholar] [CrossRef]
Figure 1. Up projection layer unit.
Applsci 15 08339 g001
Figure 2. Down projection layer unit.
Applsci 15 08339 g002
Figure 3. Residual block.
Applsci 15 08339 g003
Figure 4. Laser ultrasound super-resolution network.
Applsci 15 08339 g004
Figure 5. Flowchart of laser ultrasound super-resolution.
Applsci 15 08339 g005
Figure 6. Laser ultrasound imaging system.
Applsci 15 08339 g006
Figure 7. Complete picture of the processing results for each model for the hole defect.
Applsci 15 08339 g007
Figure 8. A local magnified image of the defective part of the hole defect.
Applsci 15 08339 g008
Figure 9. Processing results of each model. Complete picture of the processing results for each model for the slit defect.
Applsci 15 08339 g009
Figure 10. A local magnified image of the defective part of the slit defect.
Applsci 15 08339 g010
Table 1. Details of various samples prepared.
SpecimenFlaw TypeDepthTransducer SideDefect Size (mm)
1–3HolePenetratedFront1/3/5
4–6Hole1.5 mmFront1/3/5
7–9Hole1.5 mmBack1/3/5
10–11SlitPenetratedFront5/10
12–14Slit1.5 mmFront3/5/10
15–17Slit1.5 mmBack3/5/10
Table 2. Results of each model.
MethodsPSNRSSIM
EDSR29.3710.903
DBPN30.6810.924
MZSR27.6630.877
Ours33.1220.955
Disclaimer/Publisher’s Note: The statements, opinions and data contained in all publications are solely those of the individual author(s) and contributor(s) and not of MDPI and/or the editor(s). MDPI and/or the editor(s) disclaim responsibility for any injury to people or property resulting from any ideas, methods, instructions or products referred to in the content.

