Article

Comparative Analysis of Fracture Mechanics Parameters for Wrought and SLM-Produced Ti-6Al-7Nb Alloy

1
Mechanical Engineering Faculty in Slavonski Brod, University of Slavonski Brod, Trg I. B. Mazuranic 2, 35000 Slavonski Brod, Croatia
2
Faculty of Mechanical Engineering, University of Ljubljana, Smetanova ulica 17, 2000 Maribor, Slovenia
*
Author to whom correspondence should be addressed.
Appl. Sci. 2025, 15(15), 8308; https://doi.org/10.3390/app15158308
Submission received: 19 June 2025 / Revised: 19 July 2025 / Accepted: 19 July 2025 / Published: 25 July 2025
(This article belongs to the Special Issue Application of Fracture Mechanics in Structures)

Abstract

Featured Application

The featured application of this research lies in enabling engineers to predict service life through crack growth curves derived from Paris’ law parameters. The comparative analysis of ΔKth values and fracture toughness data for two production processes of Ti-6Al-7Nb guides the process selection for load-bearing implants. The quantified crack growth rates allow computational modeling of cycles-to-failure under stresses, critical for fatigue life assessments.

Abstract

The research presented in this paper is based on the need for personalized medical implants, whose serial production is impossible, so the need for production process adjustments is inevitable. Conventional production technologies usually set geometrical limitations and generate a lot of waste material, which leads to great expenses, especially when the material used for production is an expensive Ti alloy. Additive technologies offer the possibility to produce a product almost without waste material and geometrical limitations. Nevertheless, the methods developed for additive production using metal powder are not significantly used in biomedicine because there is insufficient data published regarding the properties of additively produced parts, especially from the fatigue and fracture standpoint. The aim of this research is the experimental determination of fracture mechanics properties of additively produced parts and their comparison with the properties of parts produced by conventional technologies. Drawing is the first production process in the comparison, and the second one is selective laser melting (SLM). The Ti-alloy Ti-6Al-7Nb, used for medical implants, was selected for this research. Experimental testing was performed in order to determine ΔKth fracture mechanics parameters and resistance curves according to ASTM E1820. Test specimen dimensioning and the experiments were carried out according to the respective standards. For the drawn test specimen, the value obtained was ΔKth = 3.84 MPam0.5, and the fracture toughness was Kc = 84 MPam0.5, while for SLM produced test specimens the values were ΔKth = 4.53 MPam0.5, and Kc = 21.9 MPam0.5.

1. Introduction

Additive manufacturing (AM) has become very interesting due to its advantages compared to conventional technologies. It has found its place in various fields of industry. Biomedicine is a field whose development is supported by technology. The increasing need for patient-specific biomedical implants has driven rapid advancements in both conventional and additive manufacturing of titanium alloys, with Ti-6Al-7Nb being recognized for its biocompatibility [1], corrosion resistance, and mechanical strength, making it a preferred material for orthopedic and dental applications [2,3,4,5]. It is an alloy consisting of an α and β phase, where the α phase is a hexagonal close packed structure providing strength and corrosion resistance, and the β phase is a body-centered cubic structure which contributes to improved ductility. When produced as an α+β alloy by conventional production processes, it has good overall mechanical properties [6] with a Young’s elasticity modulus E = 110,000 MPa, and a tensile strength Rm = 1050 MPa. In addition to their mechanical strength and biocompatibility, Ti-6Al-7Nb alloys exhibit favorable tribological properties, making them suitable for load-bearing biomedical implants such as hip prostheses [7]. The Ti-6Al-7Nb alloy emerged as a commercially available alternative to Ti-6Al-4V due to concerns about the potential carcinogenicity of vanadium [8]. Recent developments in additive manufacturing have enabled sophisticated lattice structures that address fundamental limitations of conventional solid titanium implants [9], which provide solutions to osseointegration challenges and mechanical property mismatch between the implant and bone tissue. There is a significant stiffness mismatch between conventional titanium alloys and human bone, as the Ti-alloys exhibit a Young’s modulus of approximately 110 GPa, at least three times higher than cortical bone (10–29 GPa) and substantially greater than trabecular bone (0.8–5 GPa) [9]. This mechanical disparity leads to stress shielding phenomena, where implants carry disproportionate loads, resulting in inadequate stress levels in surrounding bone. Research demonstrates that lattice structures can reduce the elastic modulus from over 100 GPa to 6–28 GPa [1]. Recent research in additive manufacturing emphasizes the development of new materials to address the growing need for advanced alloy design and process optimization. This is particularly important for SLM, where controlling fracture behavior remains a significant challenge. Efforts are increasingly focused on designing alloys and refining processing methods to improve the mechanical reliability and fracture resistance of SLM-produced parts [10].
Conventional processing techniques such as drawing remain the standard for mechanical reliability and ductility but are limited in design by geometry and produce significant material waste, which is particularly problematic for complex implant geometries and high-cost materials [11]. Additive manufacturing, especially SLM, a production process which uses a laser beam to melt the metal powder [12], has emerged as an alternative, enabling the freedom of design and production of customized implants with minimal waste [5,13]. However, concerns still exist regarding the fatigue and fracture performance of SLM-produced Ti-6Al-7Nb due to its well-known porosity [1,14], heterogenous microstructure, and residual stresses, which can significantly affect the durability of the produced components [3,4,15]. The main research hypothesis of this study is that the fracture mechanics parameters, specifically threshold stress intensity factor, fracture toughness, and crack growth behavior of the Ti-6Al-7Nb alloy, differ significantly between specimens produced by conventional production process and those produced by SLM.
Recent studies have demonstrated that SLM components exhibit higher crack growth rates and lower fracture toughness compared to their conventionally processed counterparts, primarily due to the presence of large grains and α’ martensite plates that promote crack initiation and propagation [3,4]. Comparative investigations of SLM-produced and drawn Ti-6Al-7Nb report that while ultimate tensile strength and hardness can be similar across production technologies, fatigue life and fracture resistance are significantly impacted by internal defects and grain structure, with wrought alloys displaying more predictable and superior crack propagation resistance, as well as more stable mechanical performance [2,3,4]. This shows the importance of obtaining comparable fracture mechanics data, including threshold stress intensity factors, growth curves, and resistance curves, for both production processes.
Developments in AM have enabled the understanding of fracture mechanics in metallic materials regarding the role of microstructural features in crack propagation behavior [16], demonstrating that high-strength submicron precipitates in additively manufactured aluminum alloys can significantly influence fracture performance through their obstructive effect on crack propagation. That study revealed that submicron Al7Cu4Ni precipitates with high bonding strength can withstand concentrated stress while maintaining structural integrity during alloy fracture, leading to a transformation from intergranular to intragranular fracture modes. This provides the insight that manufacturing process parameters should be optimized to achieve desired precipitate structures that will enhance the balance between strength and ductility.
Despite recent progress, there remains a lack of experimentally obtained data to support the design of load-bearing implants, particularly regarding the prediction of service life under cyclic loading, which is critical for any application. This study addresses this gap by experimentally determining and comparing key fracture mechanics parameters for Ti-6Al-7Nb fabricated by drawing and SLM, thereby providing essential data to guide material selection and engineering design of the biomedical implants and supporting the development of computational models to predict cycles-to-failure [2,3,4].

2. Materials and Methods

This paper presents results of experiments conducted to obtain the values of fracture mechanics parameters. Values obtained are threshold stress intensity factors, fracture toughness, and resistance curves. As mentioned earlier, experiments have been conducted on test specimens produced by two different production technologies. Test specimens representing conventional technologies were made from drawn rod of a 12 mm diameter procured from Dentaurum GmbH, and those representing selective laser melting used Ti-6Al-7Nb metal powder procured from TLS Technik Spezialpulver. Chemical composition of the drawn rod was confirmed with the inspection certificate delivered by the manufacturer, while for the SLM-produced specimens, an Olympus Innov-X Delta element analyzer was used, and the measurement confirmed the composition of the Ti-6Al-7Nb alloy. Production of the test specimens made from drawn rod was carried out on a standard turning and milling machine, while for SLM-produced specimen an MCP Realizer II SLM-250 machine was used, produced by MCP-HEK. The powder was prepared via gas atomization, during which molten metal is dispersed into spherical particles with diameters between 20 and 63 µm. The production process takes place in a protective atmosphere inside a working chamber filled with argon to a level that ensures an oxygen content of less than 0.8%. The process parameters used for production of the test specimens were as follows: laser power 160 W, laser scanning speed 400 mm/s, layer thickness 0.05 mm, and hatch distance 0.12 mm.

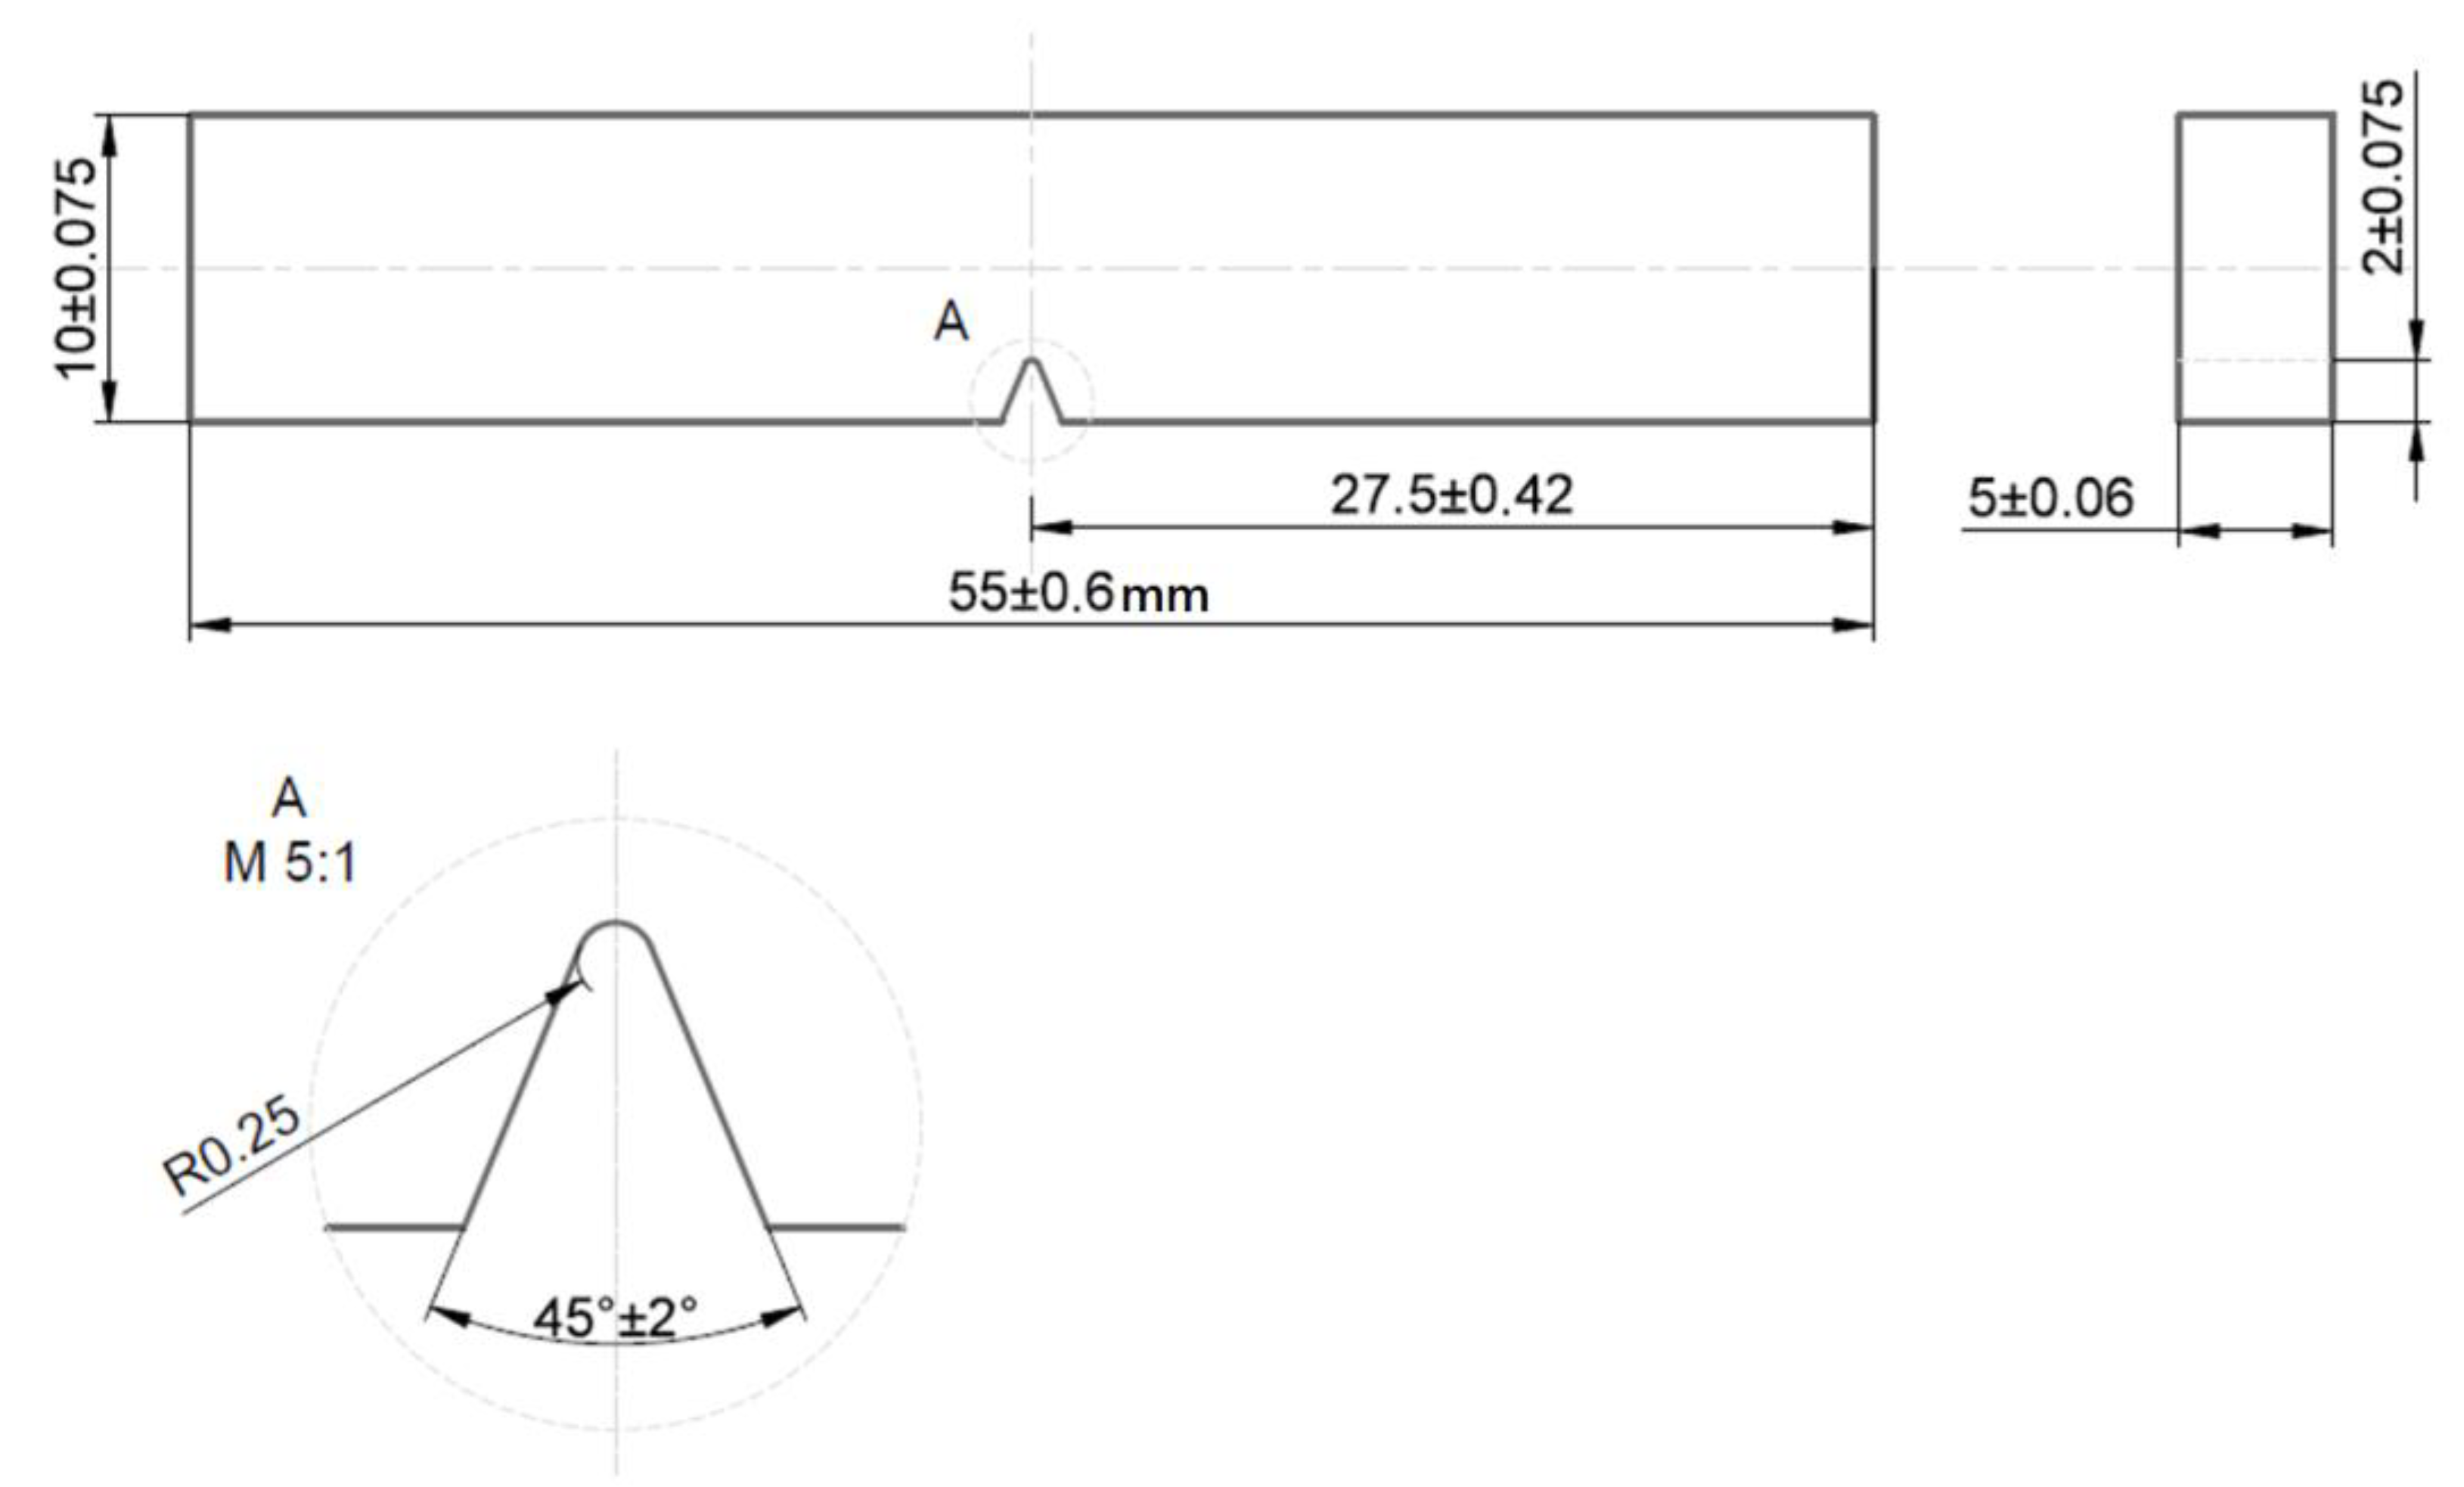
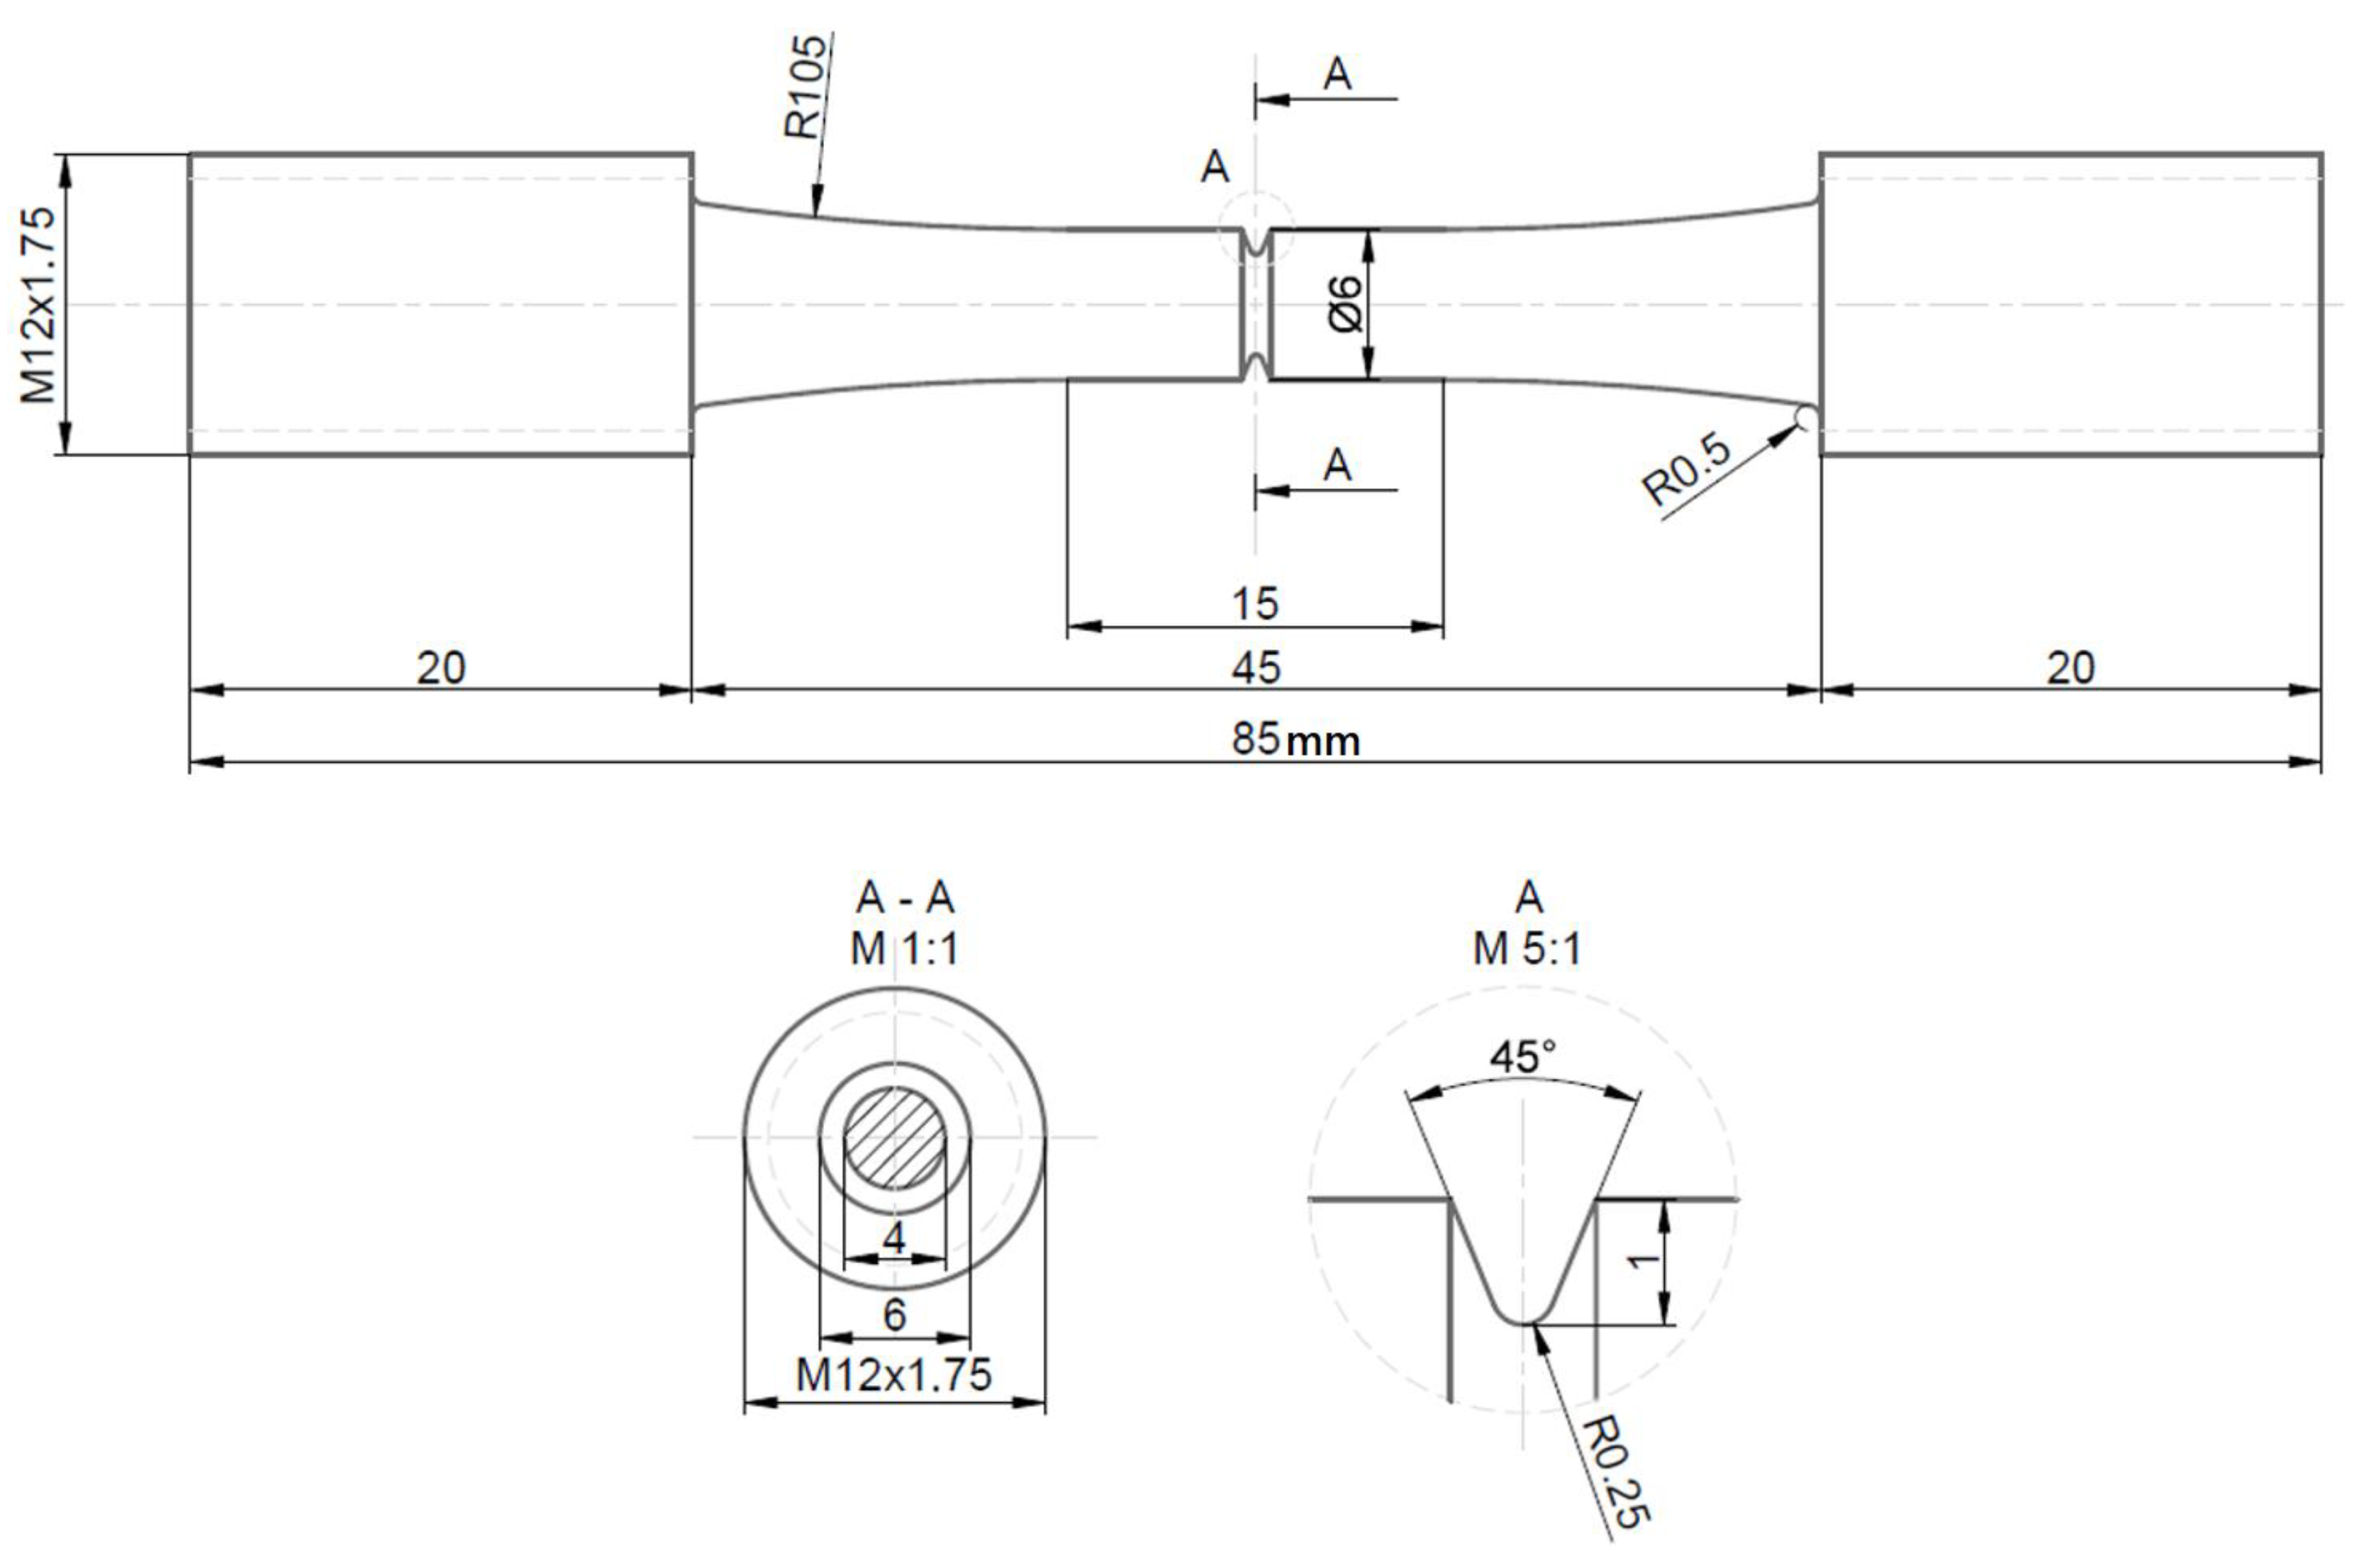
2.1. Test Specimen Geometry Determination

The dimensions of the specimens for threshold stress intensity factor determination were taken according to the ISO 148-1:2009 standard [17]. The standard distinguishes two types of notches for the specimen, U and V notches. The U notch is intended for testing brittle materials, while the V notch is for tough materials. Since titanium alloys are generally tough, the V-type notch was selected. The same notch type was used on test specimens made by both production processes to ensure comparability between production processes. The standard defines the specimen dimensions as length L = 55 mm, height H = 10 mm, and width W = 10 mm. Length and height values are fixed, while the standard allows three additional width sizes for reduced cross-sections: 7.5 mm, 5 mm, and 2.5 mm. As previously mentioned, the specimen dimensions in this research were limited by the diameter of the drawn rod, so the largest feasible width was 5 mm. Therefore, the dimensions of the specimens were length L = 55 mm, height H = 10 mm, and width W = 5 mm. The specimen with the indicated dimensions and tolerances is shown in Figure 1.
For the fracture toughness determination, a three-point bending test is required, for which the same test specimen was used with knives subsequently glued on to hold the crack mouth opening displacement (CMOD) measuring instrument. The height of the knife glued to the specimen was 2 mm. The dimensions of this specimen with the knife positions are shown in Figure 2.
In addition to the test specimens described above, round specimens for fracture toughness testing were also used and dimensioned according to ASTM E466-96 [18]. Those specimens were prepared for fracture toughness testing by subsequently machining the ring-shaped notch shown as detail A in Figure 3, which shows a cylindrical specimen for experimental fracture toughness testing.

2.2. Crack Growth Curve Determination Procedure

The value representing the crack propagation threshold, which determines whether a crack formed under cyclic loading will continue to propagate until final fracture, is called the threshold stress intensity factor range, and can be calculated according to the expression
K t h = K m a x K m i n = σ Y π a 0 ,
where Kmax and Kmin are maximal and minimal stress intensity factors, respectively, Y is a dimensionless constant that depends on geometry and mode of loading, a 0 is the initial crack length, and
σ = σ m a x σ m i n = 2 σ a .
In Expression (2), σmax and σmin are the maximal and minimal stress, respectively, and σa is the stress amplitude. If the value of ΔK exceeds ΔKth, crack propagation will begin. Experimental determination of ΔKth involves measuring crack growth rate per cycle da/dN as a function of ΔK, typically plotted in logarithmic coordinates as shown on schematic plot in Figure 4.
Crack propagation is initially accelerated, which is visible in region I, and then it transitions into a phase of stable growth (region II) and finally enters the phase of critical crack propagation leading to accelerated fracture (region III). The initial value of region I corresponds to the threshold stress intensity factor range ΔKth. The critical value of the stress intensity factor range ΔKc, at which final fracture occurs (da/dN → ∞), represents the critical value calculated according to Equation (3):
K c = K c K m i n = σ Y π a c ,
where Kc is the critical value of the stress intensity factor, known as fracture toughness. This value represents one of the most important constants in fracture mechanics. From the above relation, the critical crack length ac at the moment of fracture can be calculated for a known fracture toughness, and vice versa. In region II, the crack growth rate increases linearly and can be described by the equation
d a d N = C K m ,
which, in logarithmic coordinates, represents a straight line with a slope coefficient m. This relationship is known as Paris’ law, in which C and m are material constants determined experimentally. This is the law most used in engineering practice to determine the remaining service life of machine and structural elements, based on the measured crack length or the allowable crack length for the predicted service life. By integrating Paris’ law, the service life until fracture can be expressed in terms of the number of cycles to failure, as described in the standard fracture mechanics literature [19,20,21,22].
The stress intensity factor threshold values and the crack growth curve was determined experimentally for the Ti-6Al-7Nb alloy produced by both production processes. The devices used for this experiment were Rumul Cracktronic (Russenberger Prüfmaschinen AG, Neuhausen am Rheinfall, Switzerland), a resonant testing machine for dynamic bending load applications with testing frequences range from 40 to 300 Hz, and Rumul Fractomat, a crack length measuring device for tests in fatigue and fracture mechanics, which enable monitoring of the crack growth. For this type of testing, rectangular test specimens described above were used. Crack growth was monitored on one side of the specimen where the measuring tape was positioned as presented in Figure 5.
Using the Rumul Cracktronic device, the range of stress intensity factors (ΔK) for dynamic loading of the test specimen was defined. This range was software-controlled via the bending moment range (ΔM) and the mean bending moment (Mm). Initial moment values applied to the specimen were defined and then reduced during crack growth. The ratio of the minimum to maximum moment, which represents the stress ratio, was held constant at R = 0.1. The frequency was also held constant at approx. 72 Hz. As the bending moment decreases, crack growth slows down. Crack growth was tracked via measurement tape, while recording the number of load cycles, stress intensity factor range, total crack depth, bending moment range, mean bending moment, and frequency. ΔKth was determined by measuring crack depth increment over a specific number of cycles. When the crack growth for a given ΔK is less than 0.001 mm per 1,000,000 cycles, that ΔK value is defined as the threshold stress intensity factor range (ΔKth), representing the maximum load a component can withstand without crack propagation. Significant parameters recorded during this experiment are presented in Table 1 for test specimens made from drawn rod and in Table 2 for test specimens produced by SLM.
After threshold stress intensity factor determination, the first and the second region of the crack growth curve was determined experimentally as well. When determining the crack growth curve, the approach is opposite to that used for determining ΔKth. The initial ΔK value is slightly higher than ΔKth and increases during crack growth. The time required for this phase of testing is shorter compared to determining ΔKth because during the first phase, the load for each subsequent step is lower than the previous one. Since a plastic zone forms in front of the crack through which it must propagate, reducing the load on the first part of the experiment results in a higher number of cycles required for crack propagation, which means more required time to conduct the experiment.

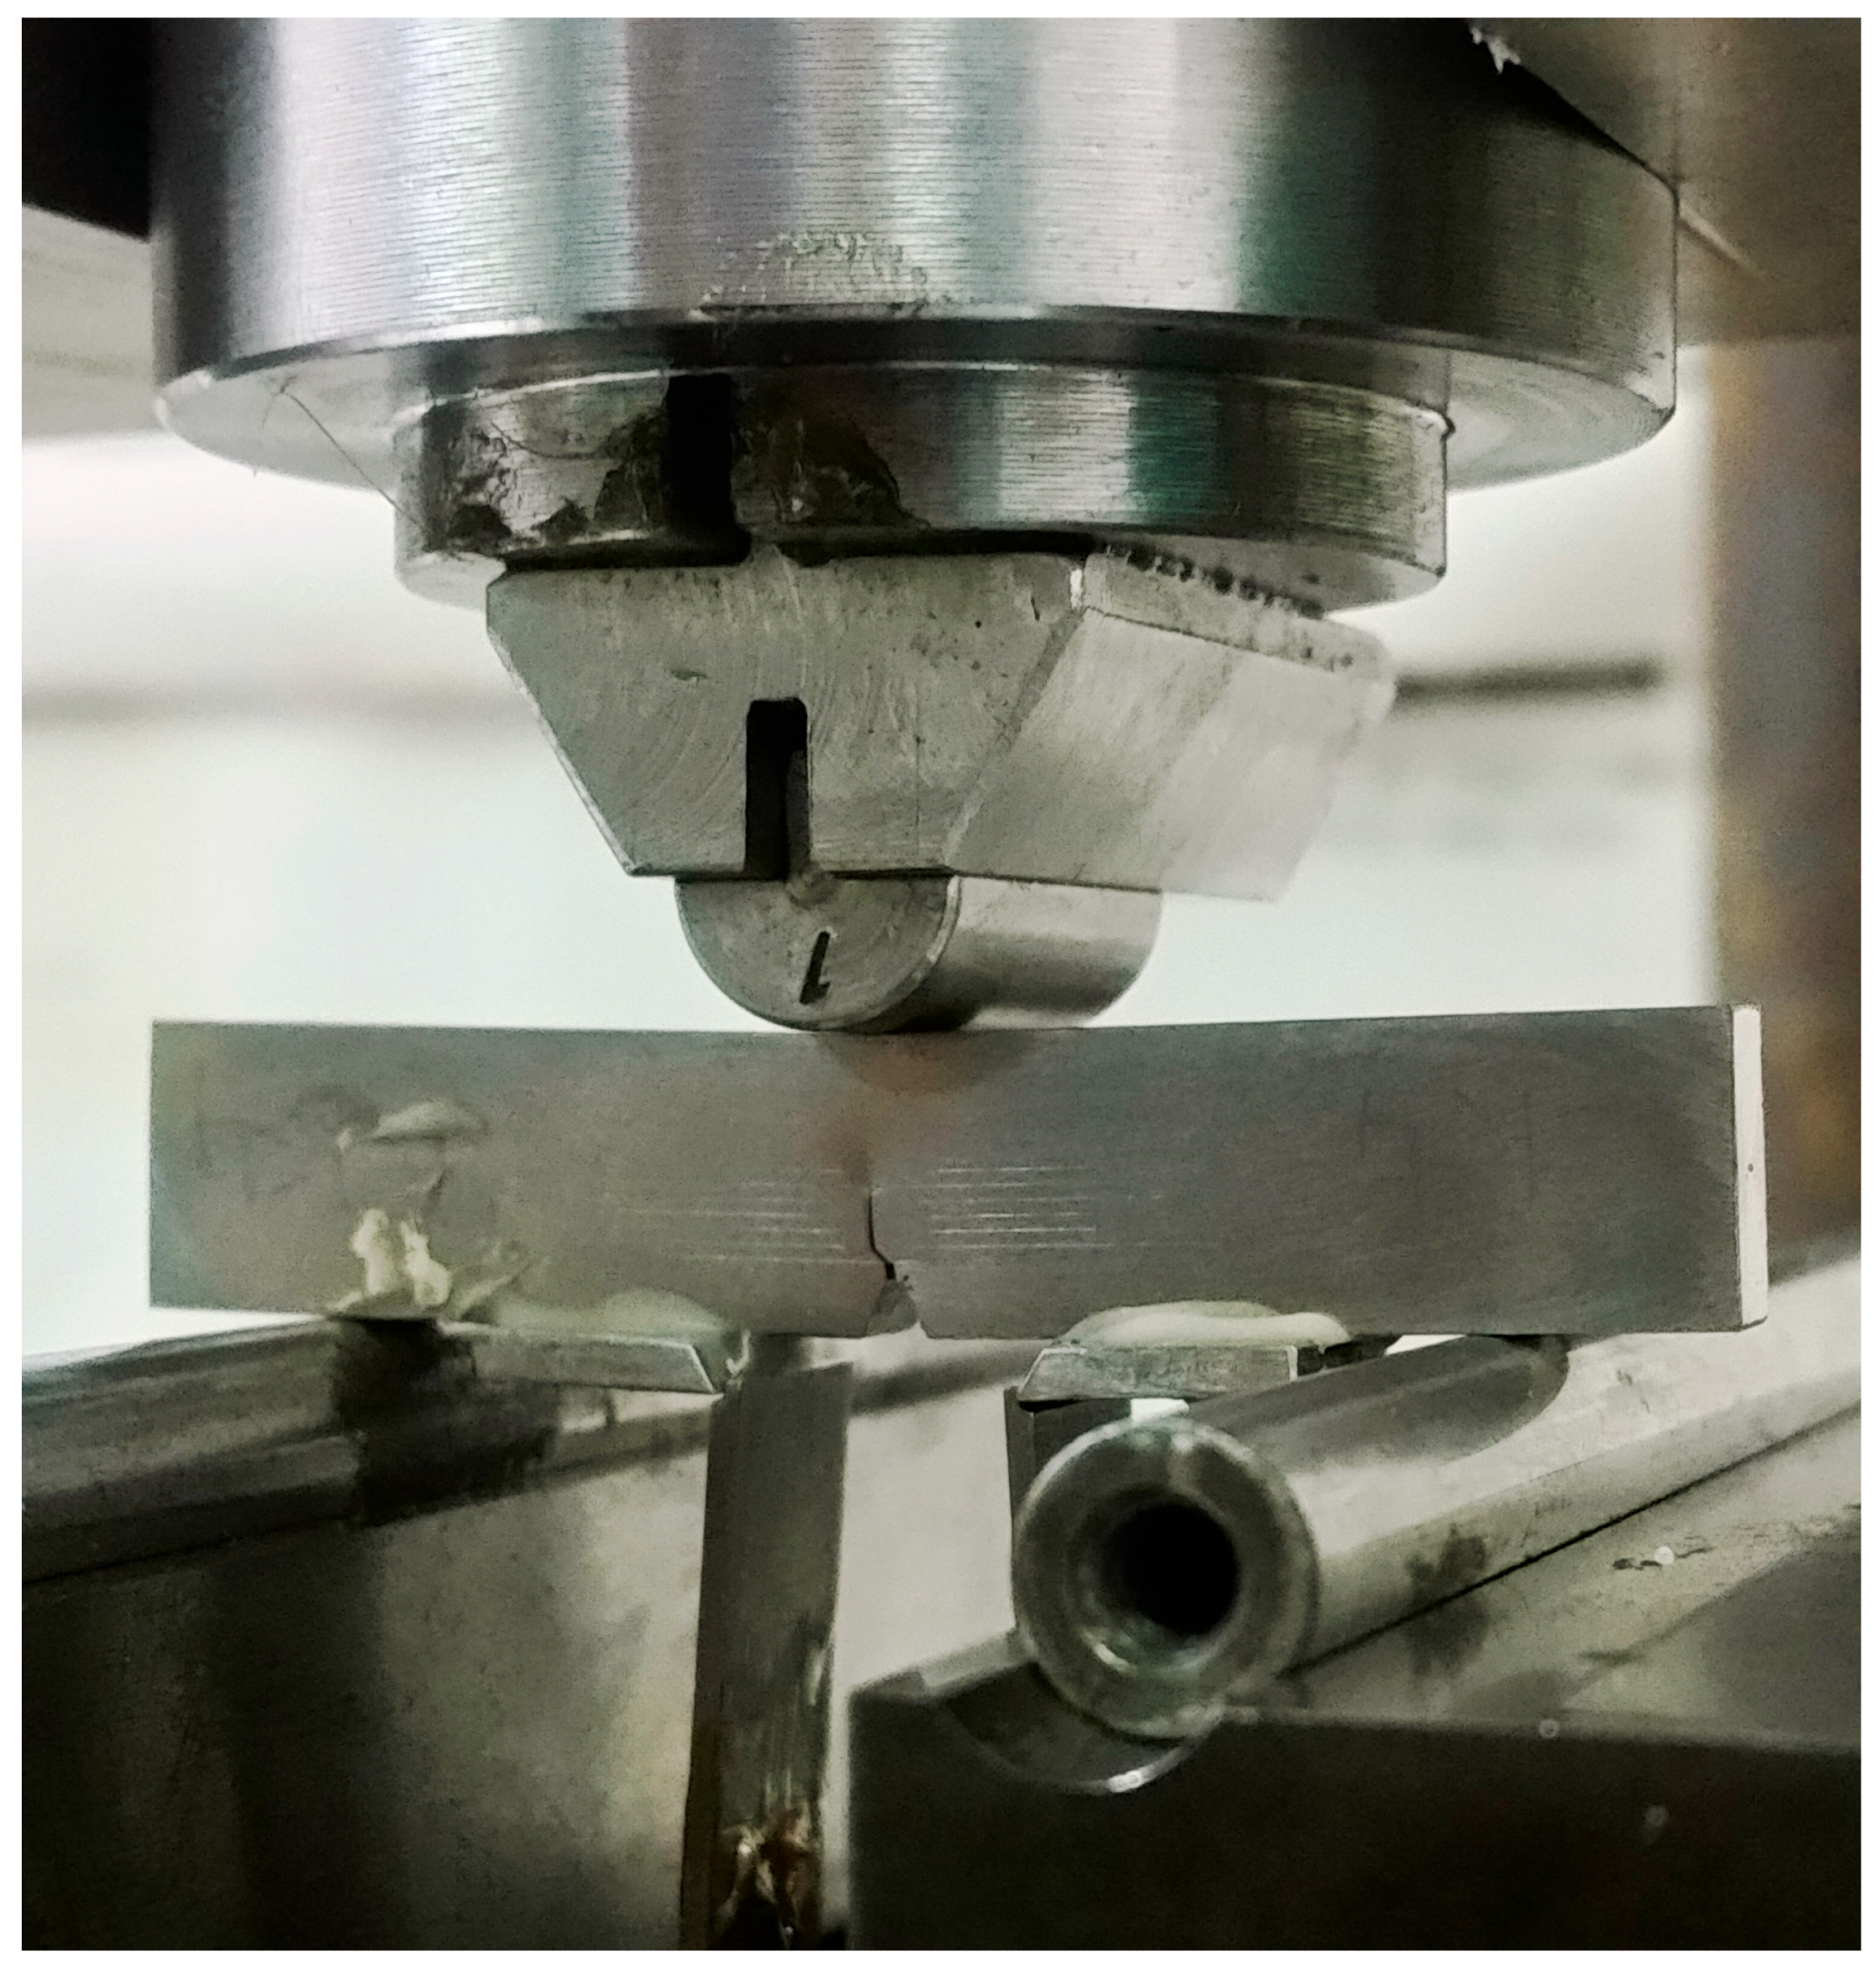
2.3. Fracture Toughness and Resistance Curves Determination Procedure

Above-mentioned rectangular test specimens were used for determination of fracture toughness and resistance curves as well. This experiment was conducted according to [23]. To achieve faster crack initiation, a straight notch was cut using wire saw K.D. Unipress Saw WS-22. Measuring scale was drawn on both polished sides of test specimens in the crack growth direction to enable easier monitoring of crack growth. Two microscope cameras were used for monitoring and measuring crack growth on both sides of the specimen as presented in Figure 6 and Figure 7, and the mean crack growth value was calculated.
Specimen loading in this experiment consisted of three steps: initial fatigue loading, stable crack growth, and final fatigue loading of the specimen. Fatigue loading prior to and after stable crack growth was performed using Rumul Cracktronic device. Maximal bending moment was defined for first fatigue loading using the criterion that the ratio of maximal stress intensity factor to elasticity modulus Kmax/E must not exceed 1.5 × 10⁻⁴ m0.5 [24]. After the first loading step, knives for CMOD gauge were glued on the notched side of test specimens, as presented earlier, and a stable crack growth step was performed. For this step, universal testing machine Instron 1255 was used. The test specimen was positioned for a three-point bending test, as presented in Figure 8. Measurement scale on the test specimen was used to allow crack growth monitoring and measurement. Each line on the scale represents 0.5 mm difference from the adjacent line, with the first line on the bottom starting at 2.5 mm from the bottom of the specimen.
The crack mouth opening displacement extensometer was calibrated and mounted onto pre-glued knives to measure the CMOD. The load increased continuously until the maximum force value was reached, at which point loading stopped and unloading began, representing the final part of this step of the experiment. This process ensures that the data is recorded during stable crack growth. The purpose of this experiment was to determine the force vs. crack mouth opening displacement (F-CMOD) and force vs. load line displacement (F-LLD) relationships, which serve as input data for determination of resistance curves.
Following the first fatigue phase and stable crack growth, the third and final part of the experiment involved a second fatigue loading of the test specimen. This phase continued until the specimen fractured. The aim was to clearly identify the fracture surface area associated with stable crack growth and simplify the measurement of its dimension. The fracture surface from stable crack growth differs visually from the fatigue-induced crack growth zone. Consequently, the stable crack growth region is distinctly visible between two fatigue crack zones, as presented in Figure 9a. This distinction is critical, as standardized protocols require fracture surface measurements at nine precise locations along the upper and lower boundaries, i.e., the start and end lines of stable crack growth region. The schematic view of the measurement points is presented in Figure 9b.
As previously mentioned, the primary result of this experiment is a series of data representing the relationship between force and displacement in terms of crack mouth opening displacement or load line displacement, i.e., the F–CMOD and F–LLD diagrams. In addition to this data, measurements of the fracture surface and monitoring of crack propagation provided information on the depths of the fatigue crack and the dimensions of the stable crack growth zone. All of the aforementioned data serve as input for the calculation procedure and construction of the resistance curves according to [23].
Aside from rectangular test specimens, cylindrical test specimen with ring-shaped notch was also used for fracture toughness measurement according to [25]. The fracture surfaces of the specimens produced by both production processes were observed using a microscope at 20x magnification, and the outer diameters as well as the notch root diameters after fractures were measured, as presented in Figure 10.
According to Expression (5) [25],
K I = 0.526 · F D d 2 ,
where
  • KI—stress intensity factor, MPam0.5
  • D—test specimen outer diameter, m
  • d—diameter of the test specimen notch root after failure, mm
  • F—tensile force applied to test specimen, N,
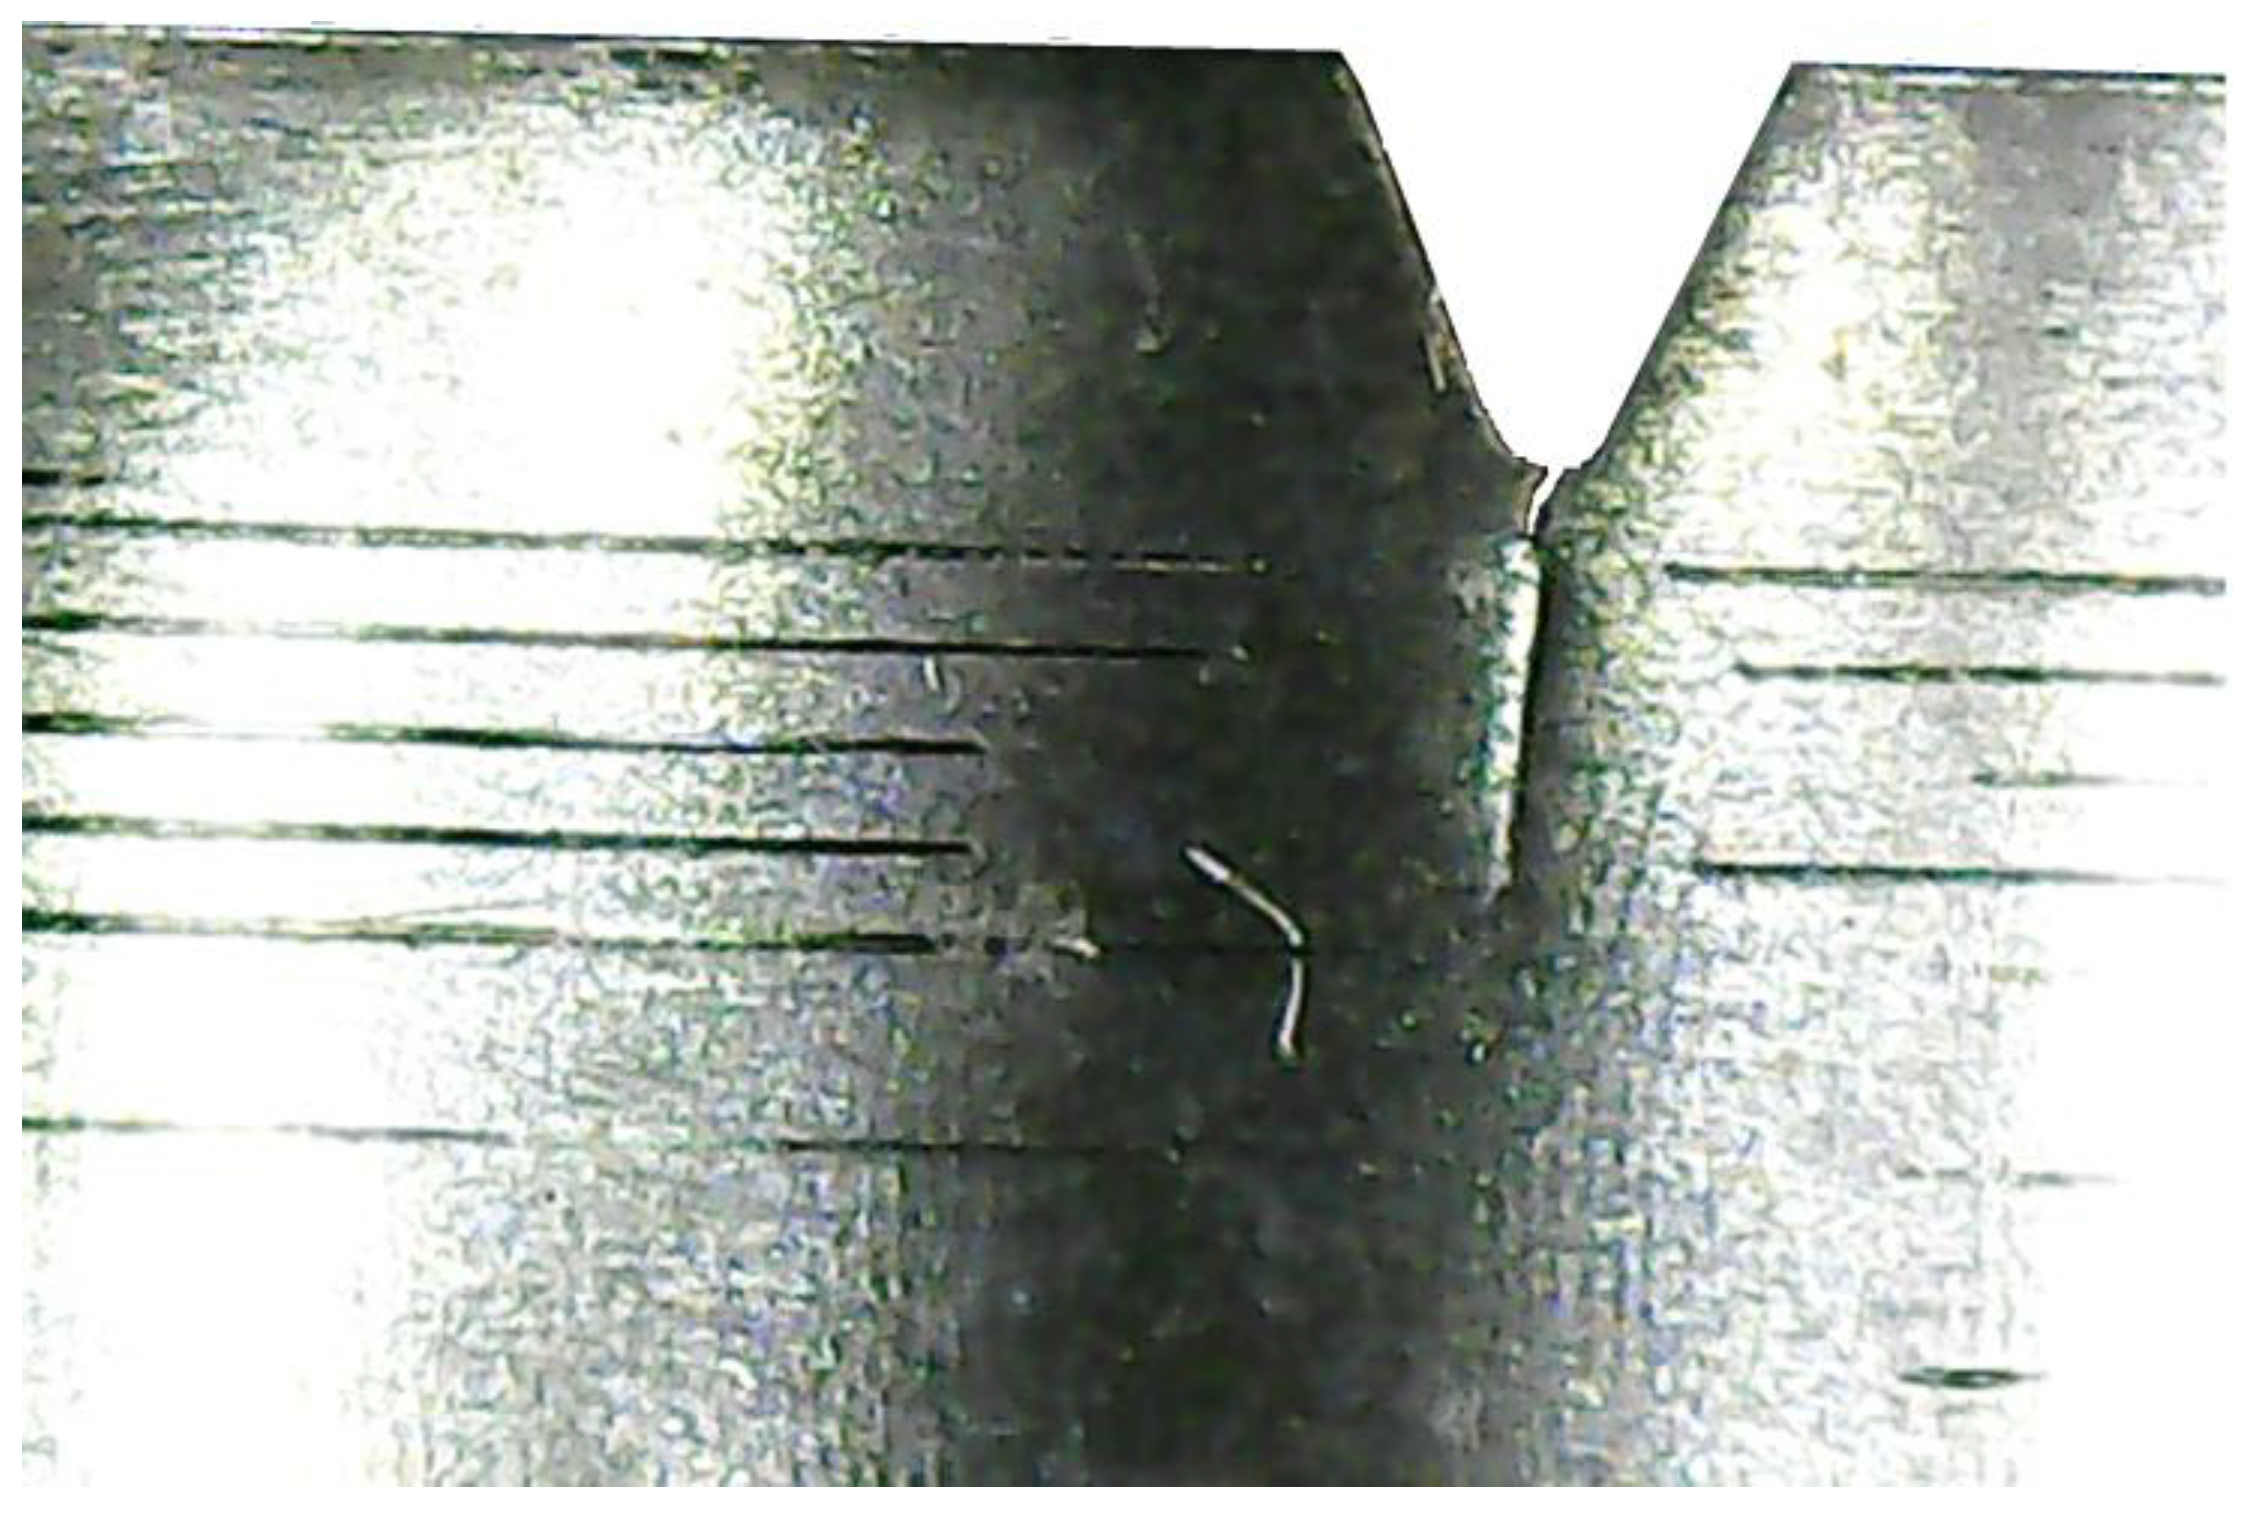
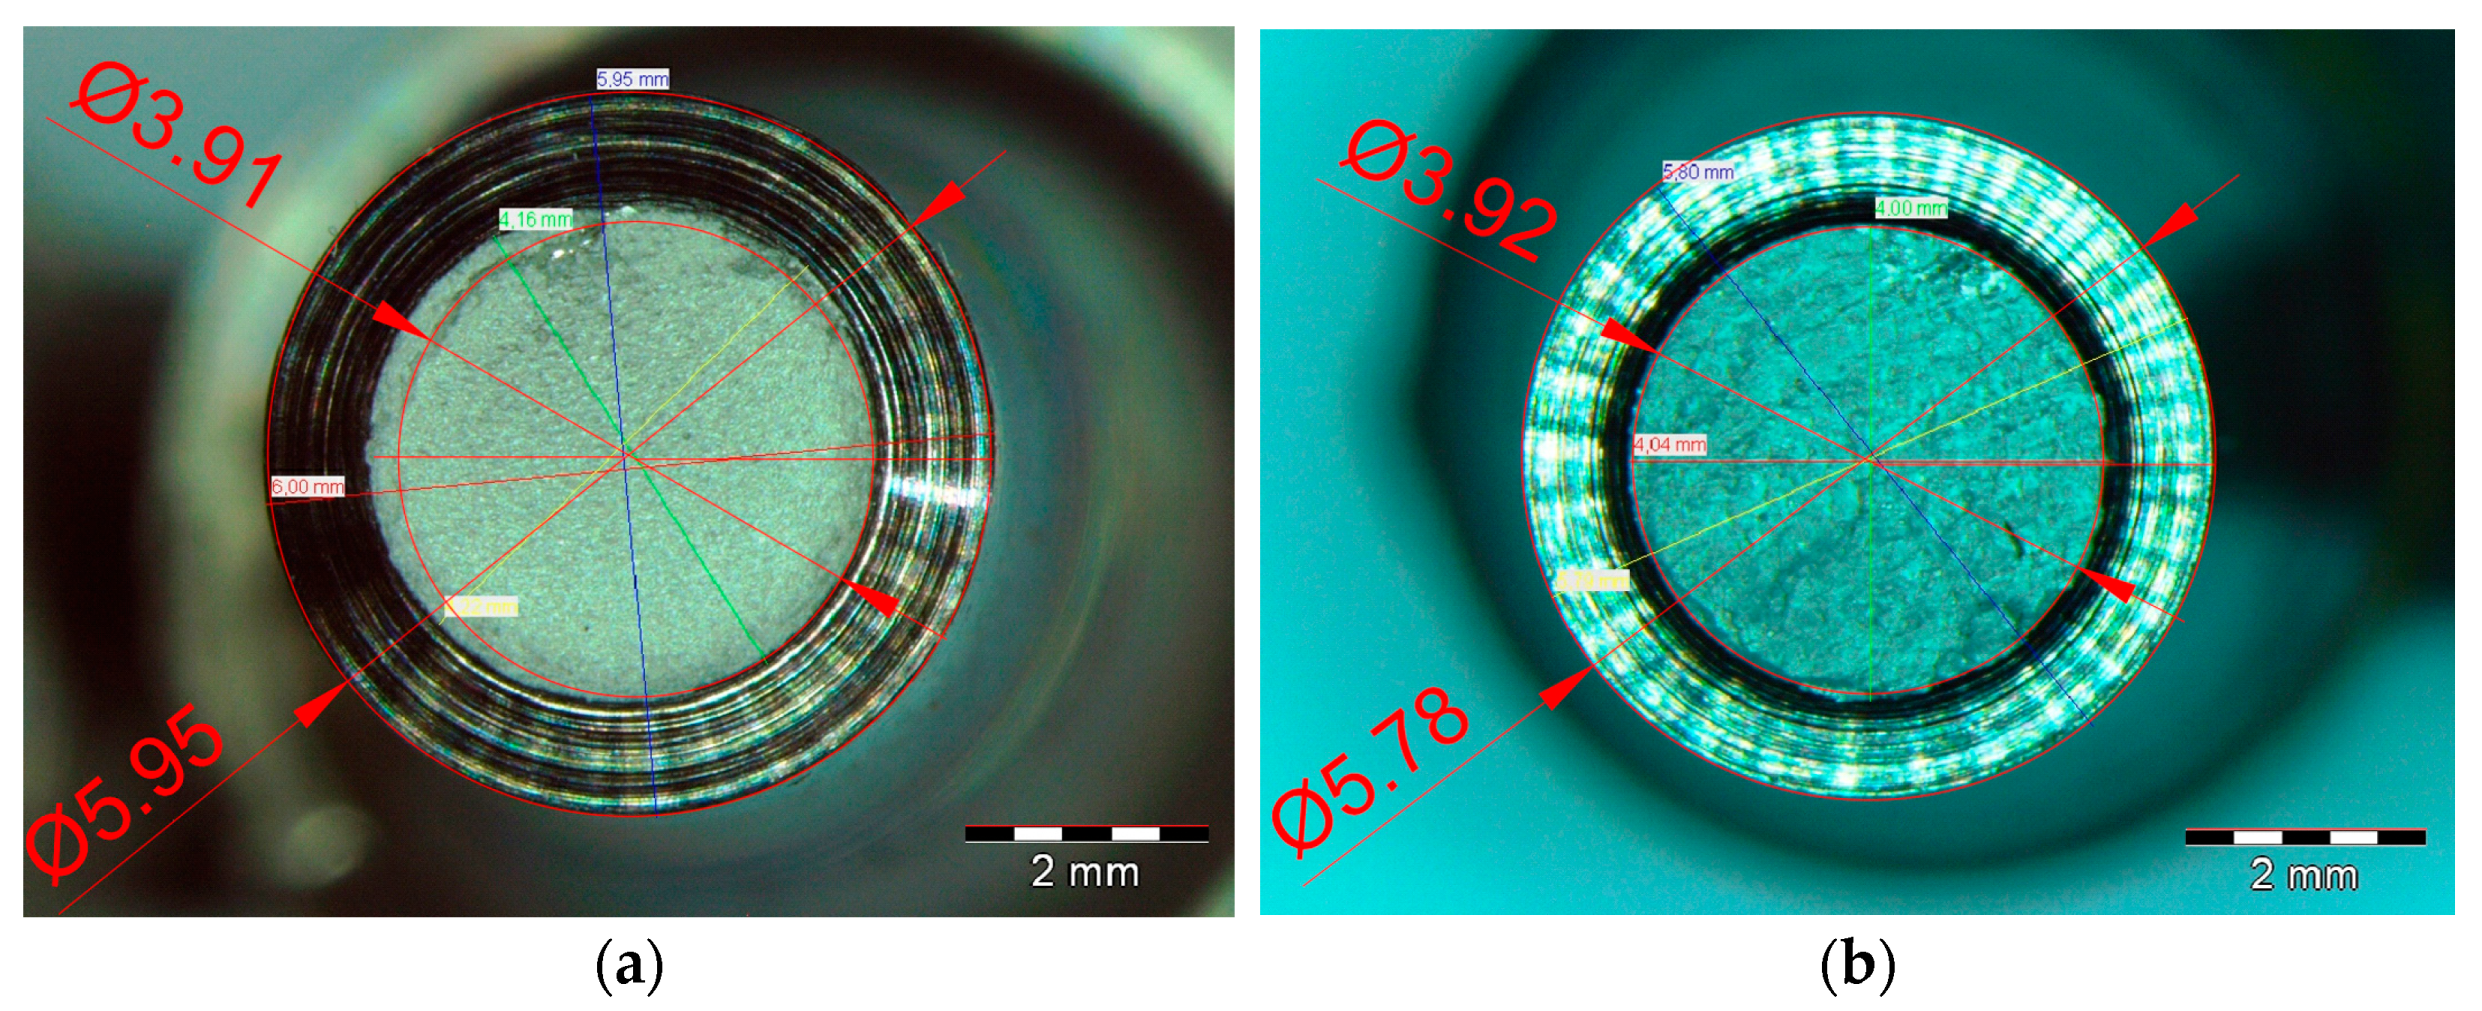
  • using the maximum force applied to the test specimen, it is possible to calculate the fracture toughness value of the material, i.e., for F = Fmax, KI = Kc. This experiment was performed on Instron 1255 universal testing machine. The fracture surfaces of the specimens were observed using a microscope at 20× magnification, and the notch root diameters were measured after fracture, as presented in the Results section.

2.4. Experimental Limitations

This study used a small sample size per production process, which limits statistical strength. One test specimen was used per test, per production process, except for fracture toughness value determination according to ASTM E1820 [23], where two drawn specimens were used. Additionally, SLM specimens were tested without post-processing. These factors may impact the applicability and reproducibility of the results, and future work must include more samples and post-processing steps.

3. Results

The following paragraphs present the results obtained from the experimental testing procedures described in the previous section. All values reported in this chapter correspond to specimens produced using both manufacturing processes.

3.1. Threshold Stress Intensity Factor

For test specimens produced from the drawn rod, the starting bending moment range was set at ΔM = 20.61 Nm, with a medium bending moment value of Mm = 12.6 Nm, and ending with ΔM = 2.58 Nm, with Mm = 1.58 Nm. The measured crack growth was 1.774 mm. The threshold stress intensity factor was measured to be ΔKth = 3.84 MPam0.5. For the SLM-produced test specimen, the starting bending moment range was ΔM = 13.79 Nm, with Mm = 8.43 Nm, while the ending was ΔM = 3.85 Nm, with Mm = 2.35 Nm, with a crack growth of 0.872 mm. The threshold stress intensity factor was measured to be ΔKth = 4.53 MPam0.5. The curves representing the first part of a typical crack growth curve for Ti-6Al-7Nb are drawn and presented in Figure 11.
The second part of the crack growth curve is defined by Equation (4), as mentioned in Section 3. Using experimental data, the values C and m are determined, and the relations can be written as follows:
d a d N = 8.555 · 10 14   K 5.077   m c y c l e
for the test specimen produced from a drawn rod, with R2 = 0.9629, and
d a d N = 7.199 · 10 12   K 4.6   m c y c l e
for the SLM-produced test specimen, with R2 = 0.8948.
This study reveals manufacturing-driven disparities in Paris’ law parameters. The lower factor C = 8.555 × 10⁻¹⁴ of the alloy produced by drawing and its higher exponent m = 5.077 reflect its homogeneous microstructure, which resists early crack propagation but becomes highly sensitive to stress intensity increases. In contrast, the SLM-produced alloy exhibits a C value that is two orders of magnitude greater due to a known porosity issue, accelerating low-ΔK growth, while its reduced exponent means that cracks are less sensitive to increases in ΔK compared to the drawn alloy. This is consistent with observed R-curve behavior in additively manufactured metals, where internal defects can paradoxically increase fracture toughness at high ΔK values by approximately 15–20% [26]. Regime-specific analyses show higher growth rates across a large range of ΔK values (0.1–30 MPam0.5) for the SLM-produced alloy, with 250× faster propagation at ΔK = 0.1 MPam0.5 and 16× faster rates at ΔK = 30 MPam0.5, though the drawn rod’s steeper curve indicates greater high-stress vulnerability. These findings show that the drawn rod suits high-cycle fatigue applications requiring threshold performance, while SLM’s geometric flexibility benefits complex parts (e.g., biomedical implants).

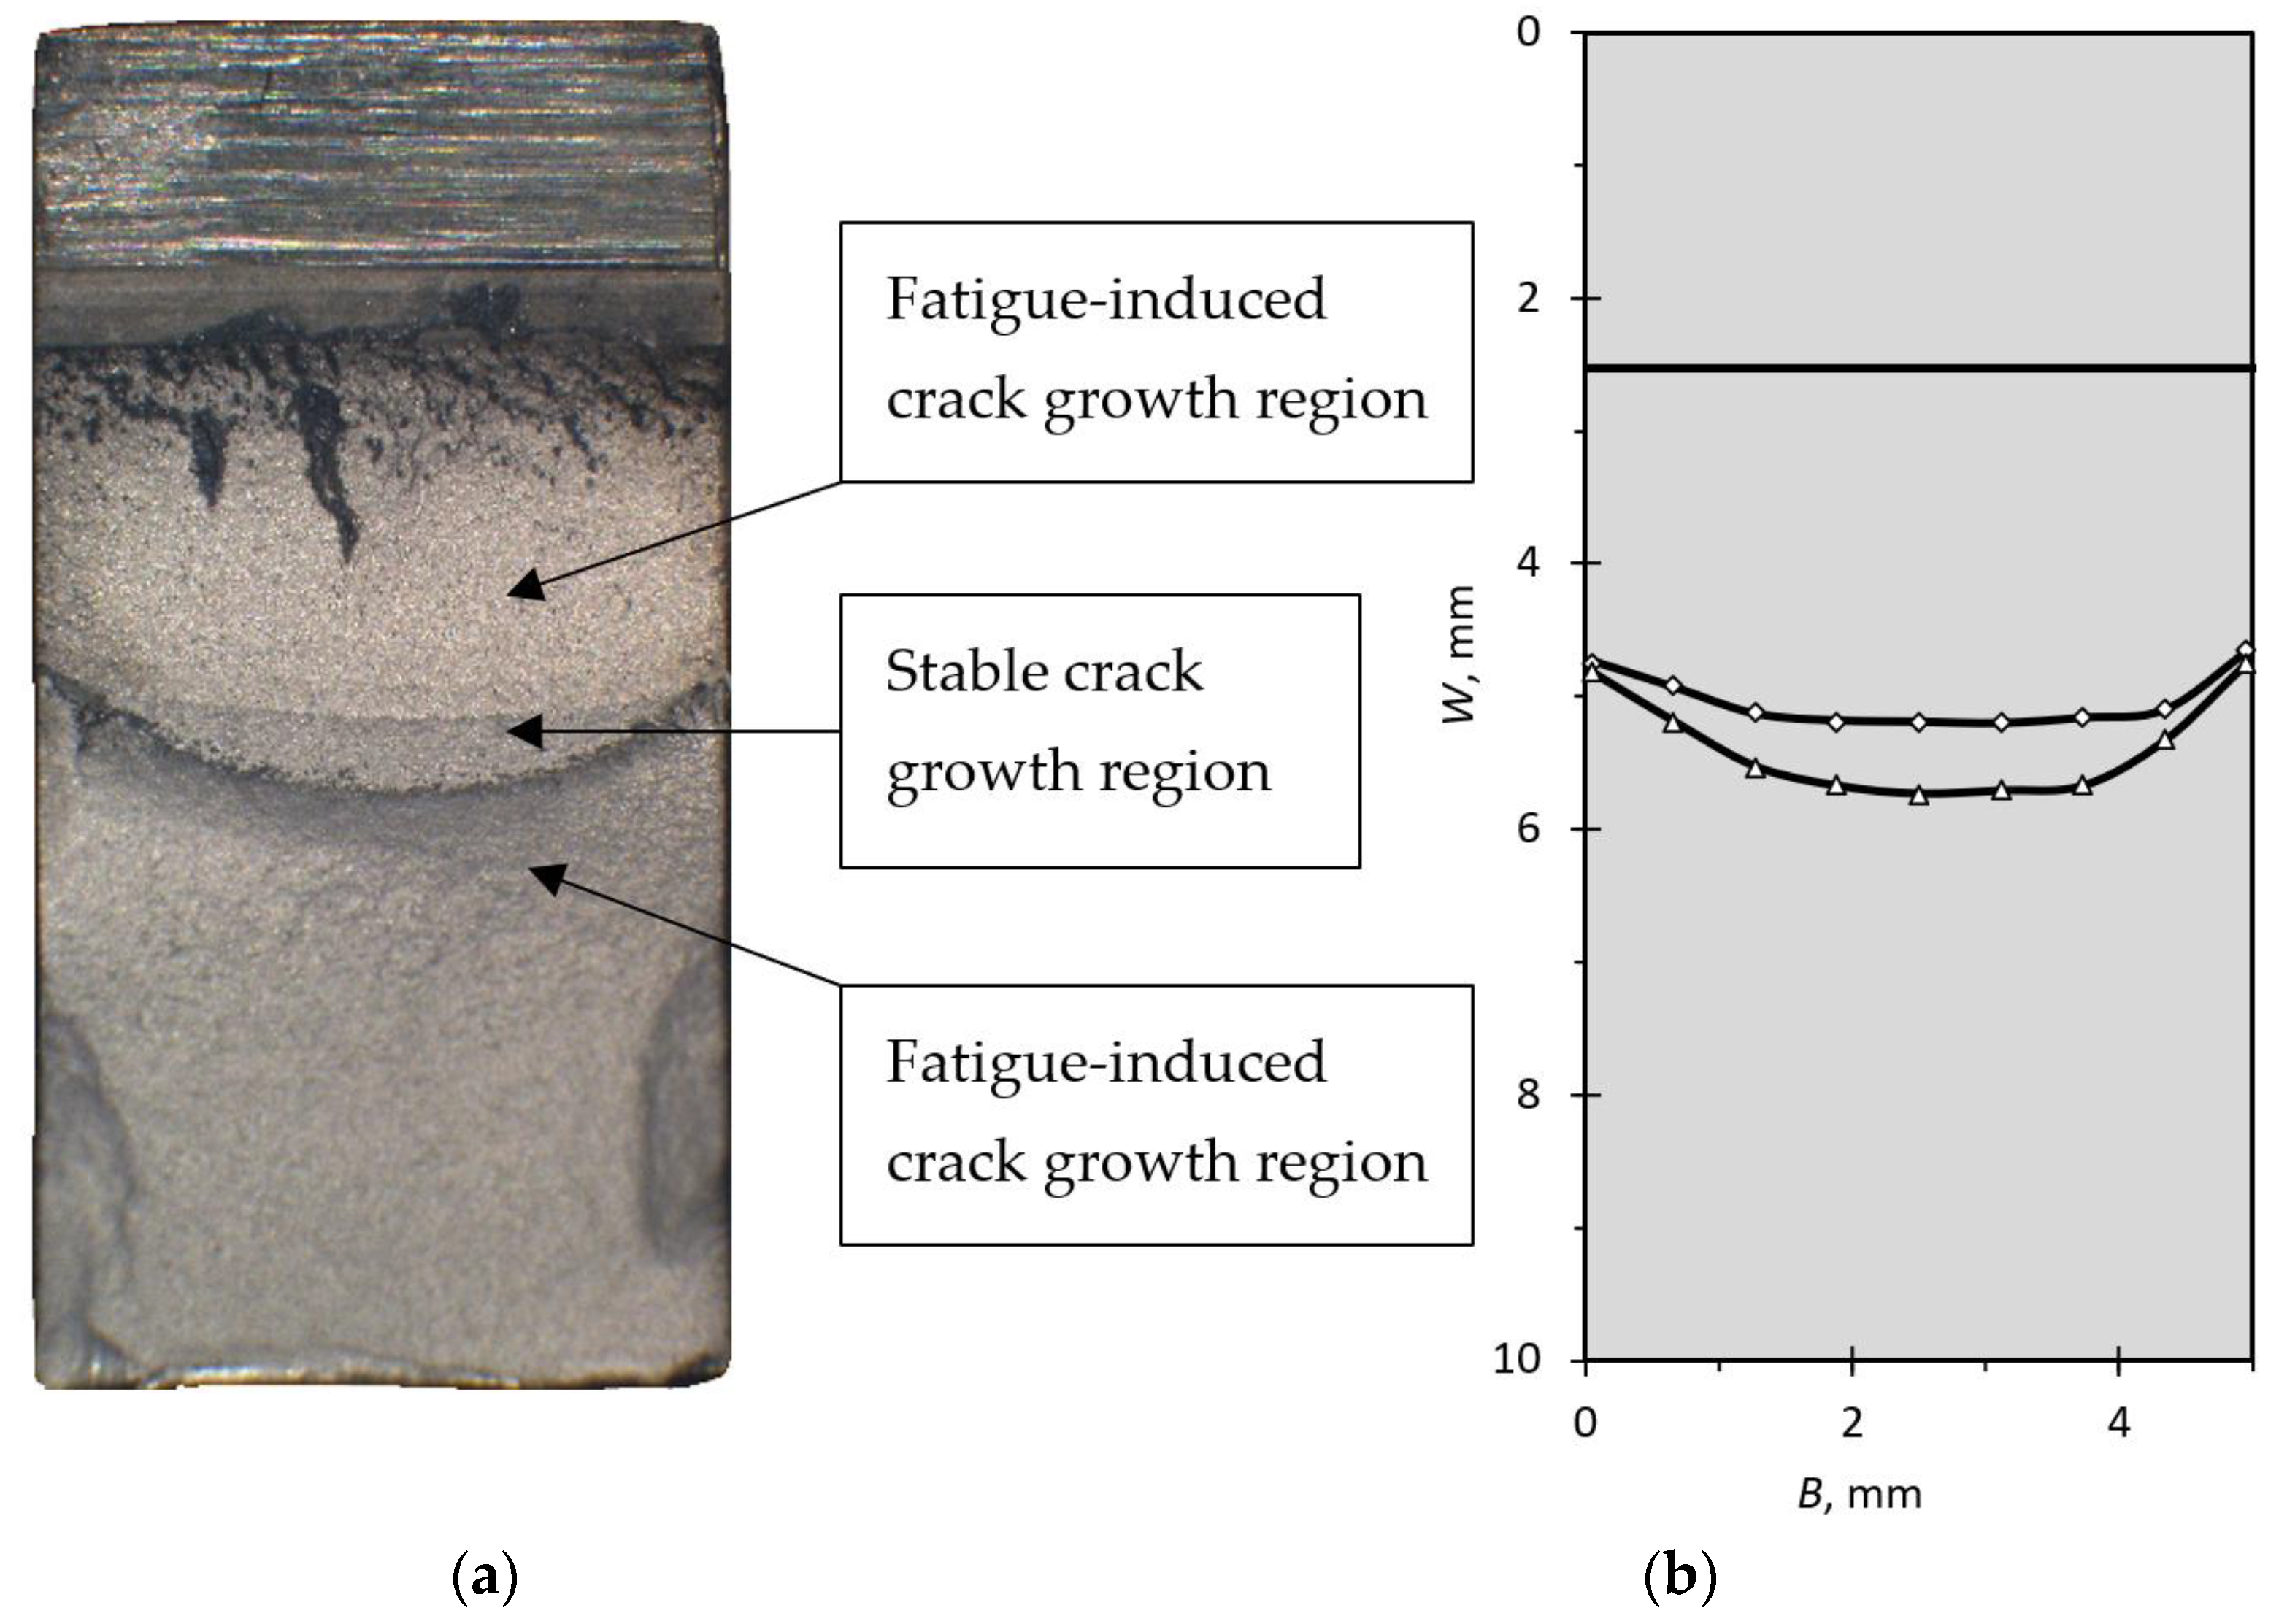
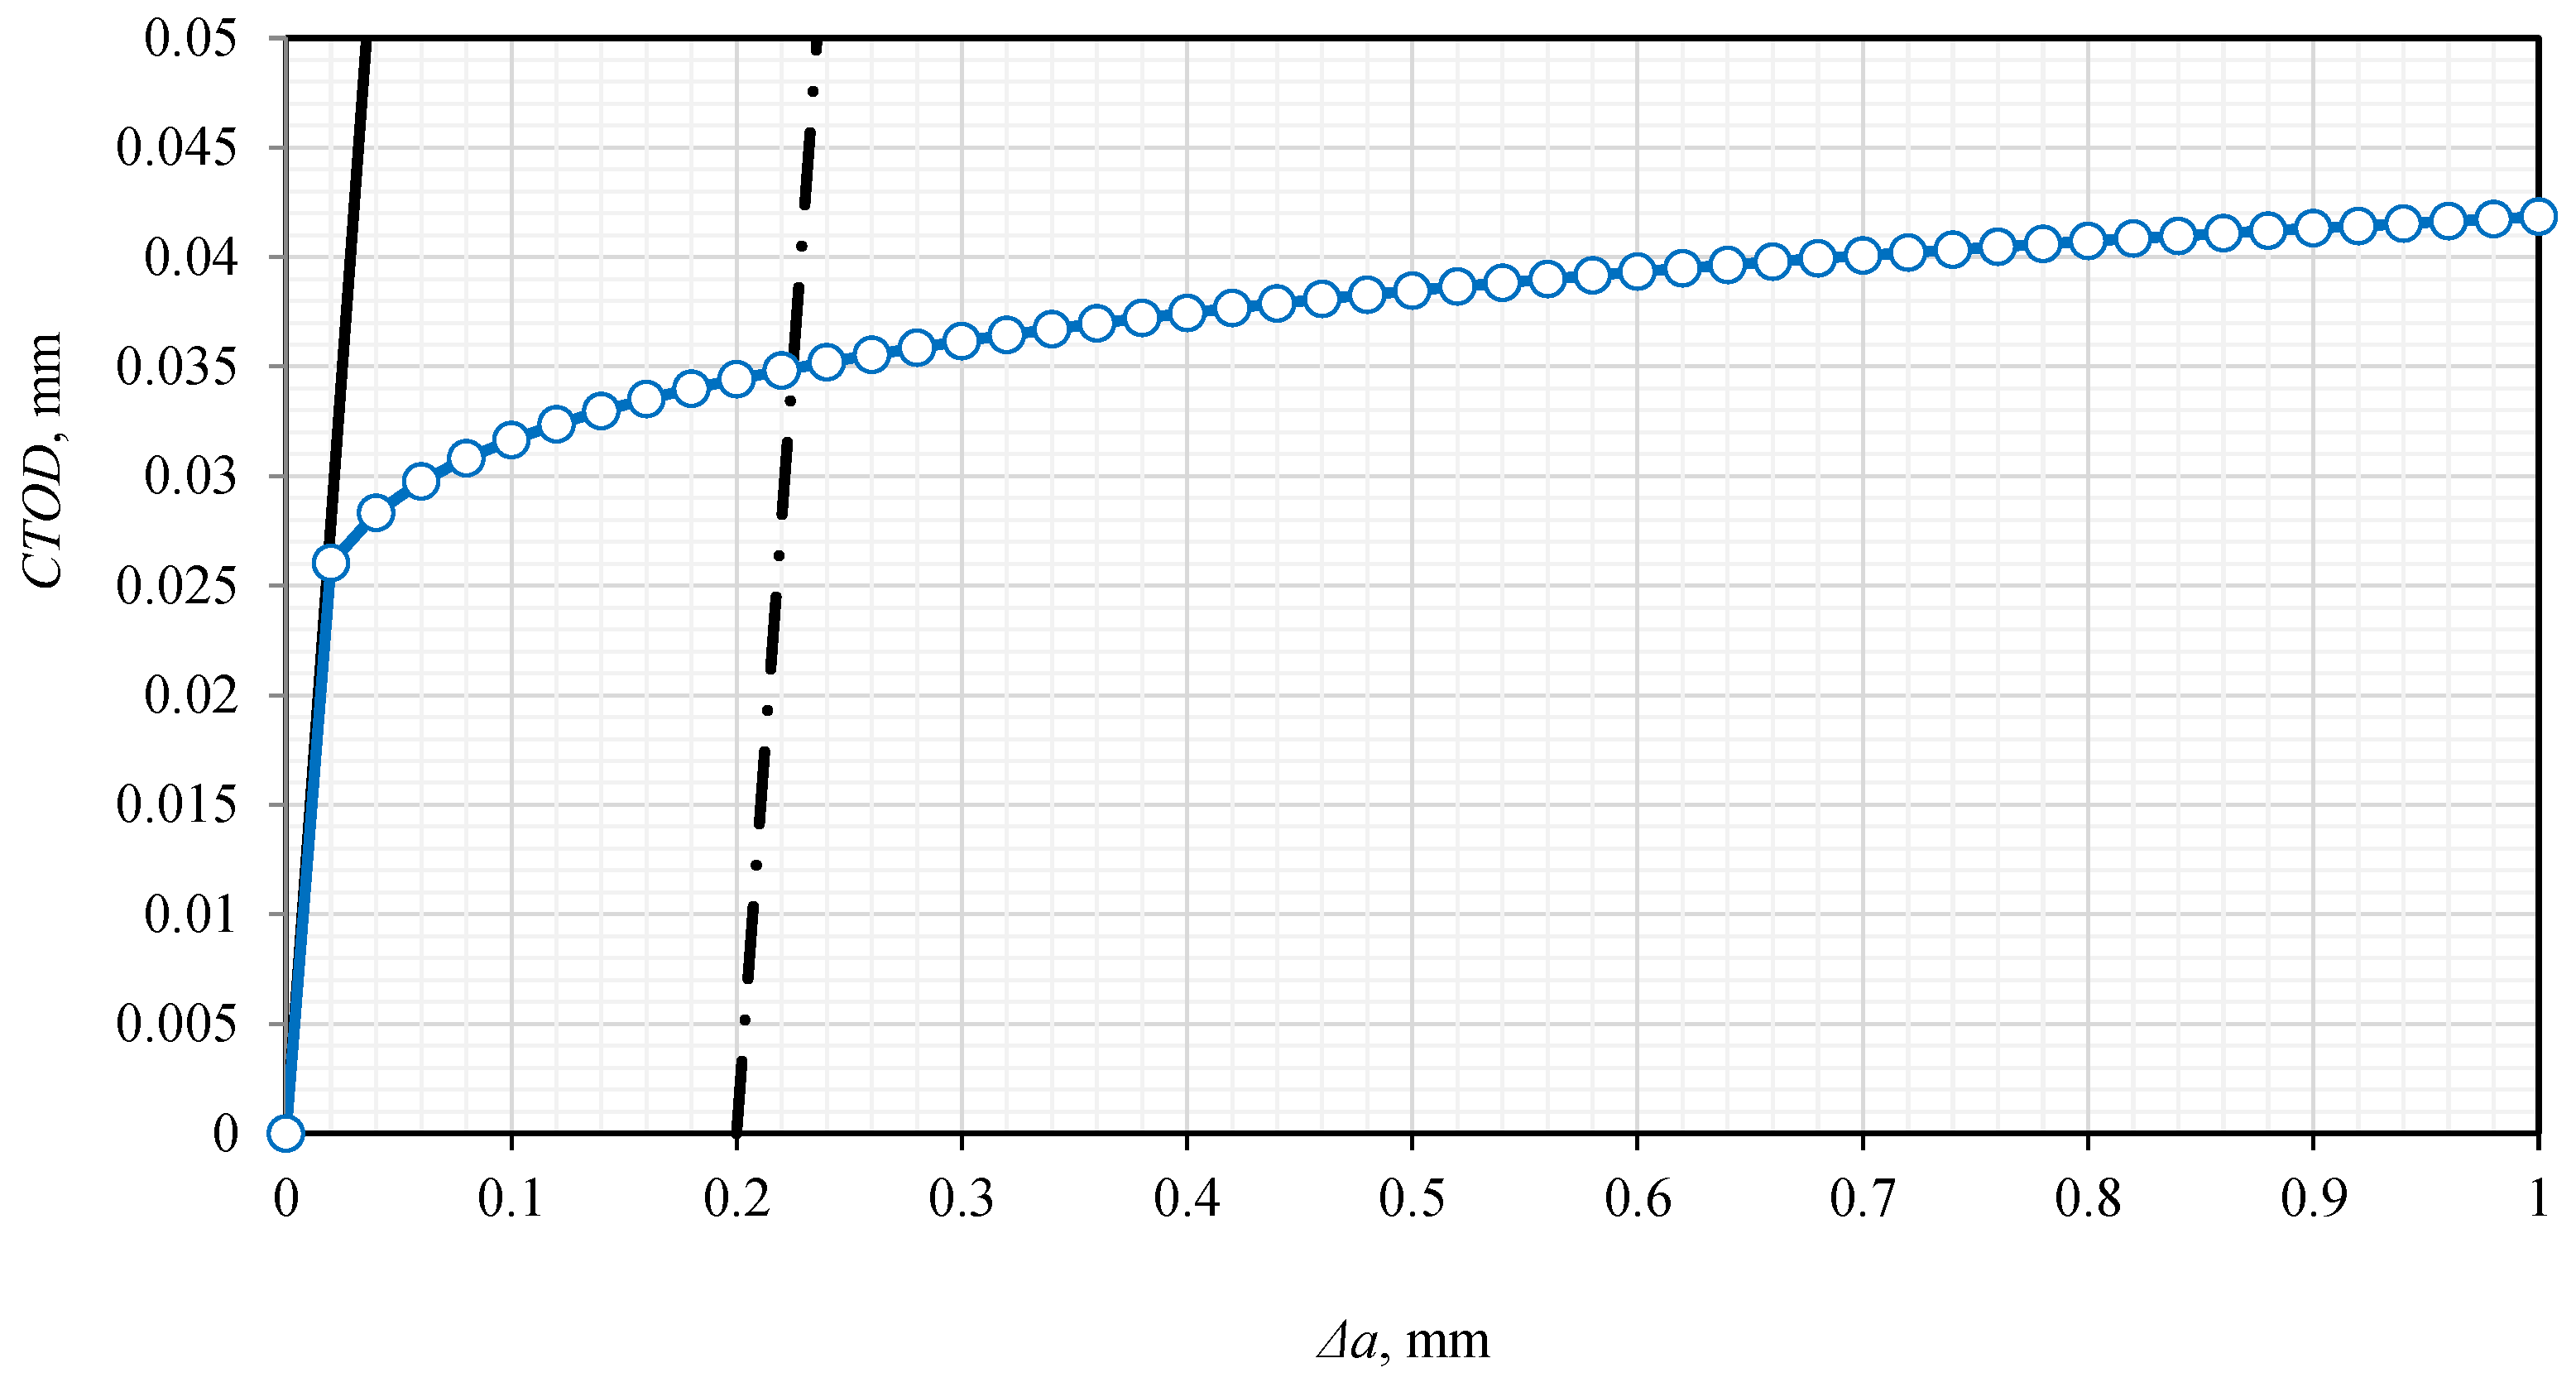
3.2. Fracture Toughness and Resistance Curves According to ASTM E1820

Experimental determination of fracture toughness regarding the criteria set by the standard was valid on three test specimens, two of which are produced from the drawn rod, and one via selective laser melting. The values obtained via the experiments are presented in Table 3.
The drawn Ti-6Al-7Nb shows significantly higher fracture toughness than the SLM-produced specimen. This large difference highlights the superior resistance to crack propagation in the drawn material, while the lower value for SLM is likely due to internal defects and microstructural inhomogeneity typical of additive manufacturing.
For the drawn test specimens, the resistance curves J-R and CTOD-R are constructed according to the same standard. These curves are nearly identical for both of the drawn test specimens used in the experiment. The J-R resistance curve is presented in Figure 12, while the CTOD-R resistance curve is presented in Figure 13.
The J-R and CTOD-R curves for the drawn specimens exhibit nearly identical rising trends, confirming predictable ductile fracture behavior and stable crack growth under increasing ΔK. Their overlapping trajectories validate the consistent mechanical response of Ti-6Al-7Nb produced via conventional production processes. The absence of curve plateaus suggests no sudden fracture instability, making the material suitable for applications requiring damage-tolerant design. However, recent work demonstrates that the use of advanced, physics-based damage laws further improves predictive reliability at the design stage. In particular, the SC11–TNT damage law developed by Rojas-Ulloa et al. [27] is shown to accurately represent the ductile fracture and evolution of porosity in titanium alloys, enabling precise simulation of failure under complex loading conditions. Incorporating such numerical models in future work would allow the insights observed here to be integrated into the design and safety assessment of components.

3.3. Fracture Toughness Determination Using Cylindrical Test Specimen

Using the measured values of both diameters and the force values with Equation (5), the fracture toughness values were calculated for the Ti-6Al-7Nb alloy produced via both production processes. The obtained results are presented in Table 4.
While the absolute values differ slightly between the two methods for determining fracture toughness, both experiments consistently show a higher value for the drawn rod specimens compared to the SLM-produced material. This confirms the fundamental trend that traditional manufacturing yields superior fracture resistance in Ti-6Al-7Nb, likely due to reduced defect density and an optimized microstructure. The variations between methods are visible, and the manufacturing-driven differences remain statistically significant.

4. Discussion

The experimental evaluation of fracture mechanics parameters for Ti-6Al-7Nb alloys produced by drawing and selective laser melting confirmed that there are critical differences in crack initiation and propagation behavior. The test specimens were produced by both production processes according to ISO 148-1:2009 [17] and ASTM E466-96 [18] standards, with rectangular specimens featuring V-notches and cylindrical specimens with ring-shaped notches.
Threshold stress intensity factor measurements showed that SLM-produced specimens exhibited higher initial resistance to crack initiation than the drawn alloy. However, Paris’ law analysis revealed fundamental differences, as the SLM material demonstrated a C factor that is two orders of magnitude greater as well as a lower m exponent, indicating accelerated low-ΔK crack growth rates despite reduced sensitivity to stress intensity increases at higher loads. This can be attributed to the well-known porosity issue for SLM-produced parts and a large grain structure, which create preferential crack paths, while the drawn material’s homogeneous α+β microstructure ensures more uniform deformation [28]. Recent studies confirm that the application of functionally graded coatings on titanium alloys significantly alters the tangential stress distribution and affects the paths of fatigue crack propagation, providing a potential way to improve fatigue resistance [29].
The fracture toughness values obtained by the circular test specimens [25] differ from the values obtained by the ASTM E1820 [23] standard but present the same difference between production processes, in favor of the drawn alloy. The bending moment range and medium bending moment values used for threshold stress intensity factor determination indicate a higher fracture toughness of the drawn Ti-6Al-7Nb alloy. This can be concluded since the higher value of the bending moment had to be applied to the drawn specimen in order to initiate the crack.
The drawn alloy’s favorable performance was further confirmed by stable J-R and CTOD-R resistance curves, whereas the SLM specimens exhibited highly brittle behavior, leading to crack instability. This resulted in significant data scattering and prevented the collection of reliable crack extension measurements necessary for constructing a valid J-R curve. Crack growth dynamics showed process-dependent characteristics, since the SLM-produced alloy exhibits propagation rates that are two orders of magnitude faster at ΔK = 0.1 MPam0.5, decreasing to an order of magnitude at ΔK = 30 MPam0.5, while the drawn alloy demonstrated greater high-ΔK sensitivity. The results show that conventionally drawn Ti-6Al-7Nb offers higher fracture toughness and more predictable crack growth than SLM-produced specimens. This indicates that the implants produced via SLM may need higher safety margins due to lower fracture resistance, while the drawn material allows less conservative margins. Therefore, production method selection is critical for ensuring implant safety.
Although a comprehensive microstructural analysis was not conducted in this study, preliminary inspection of fracture surfaces, even at a low magnification, revealed clear differences between the drawn and SLM-produced Ti-6Al-7Nb specimens. The drawn specimens exhibited uniform, ductile fracture surfaces, consistent with their higher measured fracture toughness and stable crack propagation. In contrast, the SLM specimens displayed visible irregular porosity on the fracture surfaces. This surface heterogeneity supports the interpretation that internal porosity plays a significant role in reducing the fracture resistance of additively manufactured materials. Future research should focus on comprehensive microstructural characterization of both drawn and SLM specimens, using optical and scanning electron microscopy (SEN) to directly correlate fracture behavior with material structure. Quantitative analysis of porosity in the parts produced via SLM is needed to support the conclusions about its influence on the properties mentioned in this paper. Increasing the sample size for each production process would allow for the statistical approach and improve the reproducibility of the results. Investigating the effects of post processing treatments, such as heat treatment or surface finishing, on SLM specimens would provide insight into optimizing their mechanical properties for biomedical applications. Advanced fracture surface analysis, especially using SEM, should be included to better interpret crack growth mechanisms and failure modes in relation to microstructural features and defects. Future studies should also explore the normalization of fracture toughness values to defect density. Performing these activities would yield a more comprehensive understanding of the fracture mechanics in Ti-6Al-7Nb alloys.

5. Conclusions

The study presented establishes clear, experimentally measured differences in the fracture behavior of Ti-6Al-7Nb produced via a conventional drawing process compared to selective laser melting.
The threshold stress intensity factor measurements revealed that the SLM-produced specimens exhibited a higher initial resistance to crack initiation, with ΔKth = 4.53 MPam0.5, compared to the drawn specimens, with ΔKth = 3.84 MPam0.5. However, this was contradicted by different fracture toughness values, where the drawn alloy demonstrated higher Kc = 84 MPam0.5 compared to the SLM-produced specimens, with Kc = 21.9 MPam0.5.
Analysis of crack growth under cyclic loading revealed further distinctions. The drawn alloy followed Paris’ law, with parameters C = 8.555 × 10⁻¹⁴ and m = 5.077, while the SLM-produced alloy showed C = 7.199 × 10⁻¹² and m = 4.6. This indicates that the crack propagation in the SLM parts occurs significantly faster in the low-ΔK regime, a difference mainly attributed to the microstructural non-uniformity and higher porosity inherent to the production process. In contrast, the drawn material’s more homogeneous structure slows initial crack growth but increases its sensitivity to load increases, as indicated by the higher exponent m. Supporting these quantitative findings, resistance curve behavior further supported the differences between the production processes. The drawn specimens displayed stable and rising J-R and CTOD-R curves, typical for ductile fracture and stable crack growth. In contrast, the SLM specimens exhibited highly brittle behavior, leading to crack instability that resulted in significant data scattering and prevented the collection of reliable crack extension measurements necessary for constructing a valid J-R curve.
Fracture toughness determination using cylindrical test specimens confirmed the fundamental trend observed, with rectangular specimens showing higher values in the drawn rod specimens compared to the SLM-produced specimens. While the absolute values differed slightly between the two testing methods, both experiments confirmed that traditional manufacturing yields superior fracture resistance in Ti-6Al-7Nb.
The comprehensive data supplied here, including explicit Paris’ law parameters and experimentally determined toughness values, enables more accurate service-life prediction and provides a foundation for rational selection between conventional and additive production for biomedical and structural applications.

Author Contributions

Conceptualization, D.K. and N.G.; methodology, D.K. and I.G.; validation, T.V., N.G. and I.G.; investigation, I.G.; data curation, T.V.; writing—original draft preparation, I.G.; writing—review and editing, P.K. and M.K.; visualization, I.G.; supervision, P.K. and M.K. All authors have read and agreed to the published version of the manuscript.

Funding

This research received no external funding.

Institutional Review Board Statement

Not applicable.

Informed Consent Statement

Not applicable.

Data Availability Statement

Dataset available on request from the authors.

Acknowledgments

The research was performed with the equipment of the Fakulteta za Strojništvo Univerze v Mariboru, to whom the authors extend their gratitude.

Conflicts of Interest

The authors declare no conflicts of interest.

Abbreviations

The following abbreviations are used in this manuscript:
SLMSelective Laser Melting
AMAdditive Manufacturing
ISOInternational Organization for Standardization
ASTMAmerican Society for Testing and Materials
CMODCrack Mouth Opening Displacement
LLDLoad Line Displacement
SENScanning Electron Microscopy

References

  1. Cosma, C.; Drstvensek, I.; Berce, P.; Prunean, S.; Legutko, S.; Popa, C.; Balc, N. Physical–Mechanical Characteristics and Microstructure of Ti6Al7Nb Lattice Structures Manufactured by Selective Laser Melting. Materials 2020, 13, 4123. [Google Scholar] [CrossRef] [PubMed]
  2. Delshadmanesh, M. Fatigue Investigations of Metallic Biomaterials Based on Ti-Nb and Co-Cr. 01 11 2018. Available online: https://repositum.tuwien.at/handle/20.500.12708/7333 (accessed on 2 June 2025).
  3. Hein, M.; Kokalj, D.; Dias, N.F.L.; Stangier, D.; Oltmanns, H.; Pramanik, S.; Kietzmann, M.; Hoyer, K.-P.; Meißner, J.; Tillman, W.; et al. Low Cycle Fatigue Performance of Additively Processed and Heat-Treated Ti-6Al-7Nb Alloy for Biomedical Applications. Metals 2022, 12, 122. [Google Scholar] [CrossRef]
  4. Laskowska, D.; Bałasz, B.; Zawadka, W. Microstructure and Mechanical Properties of As-Built Ti-6Al-4V and Ti-6Al-7Nb Alloys Produced by Selective Laser Melting Technology. Materials 2024, 17, 4604. [Google Scholar] [CrossRef] [PubMed]
  5. Gür, Y. Deformation Behaviour and Energy Absorption of 3D Printed Polymeric Gyroid Structures. Teh. Vjesn.—Tech. Gaz. 2024, 31, 1582–1588. [Google Scholar] [CrossRef]
  6. Pinheiro, T.S.; Gallego, J.; Bolfarini, C.; Kiminami, C.S.; Junior, A.M.J.; Botta, W.J. Microstructural Evolution of Ti-6Al-7Nb Alloy During High Pressure Torsion. Mater. Res. 2012, 15, 792–795. [Google Scholar] [CrossRef]
  7. Fellah, M.; Labaïz, M.; Assala, O.; Dekhil, L.; Taleb, A.; Rezag, H.; Iost, A. Tribological behavior of Ti-6Al-4V and Ti-6Al-7Nb Alloys for Total Hip Prosthesis. Adv. Tribol. 2014, 2014, 451387. [Google Scholar] [CrossRef]
  8. Tuninetti, V.; Fuentes, G.; Oñate, A.; Narayan, S.; Celentano, D.; García-Herrera, C.; Menacer, B.; Pincheira, G.; Garrido, C.; Valle, R. Computational Shape Design Optimization of Femoral Implants: Towards Efficient Forging Manufacturing. Appl. Sci. 2024, 18, 8289. [Google Scholar] [CrossRef]
  9. Hijazi, K.; Dixon, J.; Armstrong, J.; Rizkalla, A. Titanium Alloy Implants with Lattice Structures for Mandibular Reconstruction. Materials 2023, 17, 140. [Google Scholar] [CrossRef] [PubMed]
  10. Yu, H.; Zhao, Q.; Fu, J.; Hu, Y.; Liang, J.; Li, J.; Xu, W. The design of oxidation resistant Ni superalloys for additive manufacturing. Addit. Manuf. 2025, 97, 104616. [Google Scholar] [CrossRef]
  11. Squillaci, L.; Neikter, M.; Hansson, T.; Pederson, R.; Moverare, J. Microstructure and mechanical properties of Ti-6Al-4V alloy fabricated using powder bed fusion—Laser beam additive manufacturing process: Effect of hot isostatic pressing. Mater. Sci. Eng. A 2025, 931, 148226. [Google Scholar] [CrossRef]
  12. Sidambe, A.T. Biocompatibility of Advanced Manufactured Titanium Implants—A Review. Materials 2014, 7, 8168–8188. [Google Scholar] [CrossRef] [PubMed]
  13. Novak, R.; Valjak, F.; Bojčetić, N.; Šercer, M. Design Principle for Additive Manufacturing: Direct Metal Sintering. Teh. Vjesn.—Tech. Gaz. 2023, 30, 937–944. [Google Scholar] [CrossRef]
  14. Taherzadeh, P.; Kelleci, K.; Özer, S. Biomechanical Effects of the Implant Designed for Posterior Dynamic Stabilization of the Lumbar Spine (L4–L5): A Finite Element Analysis Study. Teh. Vjesn.—Tech. Gaz. 2024, 31, 193–199. [Google Scholar] [CrossRef]
  15. Wu, B.; Pan, Z.; Ding, D.; Cuiuri, D.; Li, H. Effects of Heat Accumulation on Microstructure and Mechanical Properties of Ti6Al4V Alloy Deposited by Wire Arc Additive Manufacturing. Addit. Manuf. 2018, 23, 151–160. [Google Scholar] [CrossRef]
  16. Cao, L.; Lu, R.; Dou, Z.; Zheng, M.; Han, X.; Hau, Y.; Zhang, L.; Zhang, J.; Liu, B.; Li, X. Understanding the influence of high-strength submicron precipitate on the fracture performance of additively-manufactured aluminum alloy. Int. J. Plast. 2025, 188, 104306. [Google Scholar] [CrossRef]
  17. ISO 148-1:2009; Metallic Materials—Charpy Pendulum Impact Test—Part 1: Test Method. International Organization for Standardization: Geneva, Switzerland, 2009.
  18. ASTM E466-96; Standard Practice for Conducting Force Controlled Constant Amplitude Axial Fatigue Tests of Metallic Materials. ASTM International: West Conshohocken, PA, USA, 2021.
  19. Jelaska, D. Fundamentals of Fracture Mechanics, Part 2: Crack Propagation. Available online: https://bib.irb.hr/datoteka/121375.Cl-MehLoma2.pdf (accessed on 2 June 2025).
  20. Paris, P.; Erdogan, F. A Critical Analysis of Crack Propagation Laws. J. Basic Eng. 1963, 85, 6. [Google Scholar] [CrossRef]
  21. Anderson, T.L. Fracture Mechanics: Fundamentals and Applications; CRC Press: Boca Raton, FL, USA, 2017. [Google Scholar]
  22. Broek, D. Elementary Engineering Fracture Mechanics; Martinus Nijhoff Publishers: Dodrecht, The Netherlands, 1986. [Google Scholar]
  23. ASTM E1820; Standard Test Method for Measurement of Fracture Toughness. ASTM International: West Conshohocken, PA, USA, 2019.
  24. Schwalbe, K.; Neal, B.; Heerens, J. The GKSS Test Procedure for Determining the Fracture Behaviour of Materials; GKSS Forschungszentrum Geesthacht GmbH: Geesthacht, Germany, 1994. [Google Scholar]
  25. Gubeljak, N. Fracture Mechanics. University of Maribor, Faculty of Mechanical Engineering: Maribor, Slovenia, 2008. [Google Scholar]
  26. Lewandowski, J.J.; Seifi, M. Metal Additive Manufacturing: A Review of Mechanical Properties. Annu. Rev. Mater. Sci. 2016, 46, 151–186. [Google Scholar] [CrossRef]
  27. Rojas-Ulloa, C.; Tuninetti, V.; Sepúlveda, H.; Betaieb, E.; Pincheira, G.; Gilles, G.; Duchêne, L.; Habraken, A.M. Accurate numerical prediction of ductile fracture and micromechanical damage evolution for Ti6Al4V alloy. Comput. Mech. 2024, 73, 177–198. [Google Scholar] [CrossRef]
  28. Riemer, A.; Leuders, S.; Thöne, M.; Richard, H.A.; Tröster, T.; Niendorf, T. On the fatigue crack growth behavior in 316L stainless steel manufactured by selective laser melting. Eng. Fract. Mech. 2014, 120, 15–25. [Google Scholar] [CrossRef]
  29. Wang, C.; Zhao, Q.; Zhou, Y.; Wang, D.; Wang, L.; Wahab, M.A. Fretting fatigue crack initiation and propagation behaviours of Ti6Al4V alloy coated by functionally graded material. Compos. Struct. 2024, 343, 118285. [Google Scholar] [CrossRef]
Figure 1. Test specimen dimensions.
Applsci 15 08308 g001
Figure 2. Test specimen adjustment for three-point bending test.
Applsci 15 08308 g002
Figure 3. Cylindrical test specimen dimensions.
Applsci 15 08308 g003
Figure 4. Typical crack growth curve for metals [19].
Applsci 15 08308 g004
Figure 5. Test specimen ISO 148-1:2009 [17] with V-shaped notch and measuring tape.
Applsci 15 08308 g005
Figure 6. Monitoring and measurement of crack growth using two microscopes.
Applsci 15 08308 g006
Figure 7. Microscopic view at 10x magnification of crack on test specimen with measurement scale.
Applsci 15 08308 g007
Figure 8. Three-point bending test setup with CMOD gauge.
Applsci 15 08308 g008
Figure 9. (a) Fractured surface of test specimen used for fracture toughness determination and (b) presentation of measurement positions for measuring stable crack growth zone.
Applsci 15 08308 g009
Figure 10. Fracture surface of cylindrical test specimen after fracture with measurements D and d for (a) test specimen produced out of drawn rod and (b) test specimen produced by SLM process.
Applsci 15 08308 g010
Figure 11. Logarithmic plot of da/dN versus dK relationship representing fatigue crack growth curve for (a) test specimen produced from drawn Ti-6Al-7Nb rod and (b) test specimen produced by SLM process out of Ti-6Al-7Nb powder.
Applsci 15 08308 g011
Figure 12. J-R resistance curve for Ti-6Al-7Nb produced by drawing.
Applsci 15 08308 g012
Figure 13. CTOD-R resistance curve for Ti-6Al-7Nb produced by drawing.
Applsci 15 08308 g013
Table 1. Parameters recorded during ΔKth determination for drawn alloy.
ΔK,
MPam0.5
da/dN,
nm/Cycle
a, mmN, -R, -ΔM, NmMm, Nm
2002.12367,2940.120.6112.60
18.99130.5172.171404,3650.119.3111.80
18.76122.772.184404,4660.119.0111.62
15150.0812.407405,9520.114.358.77
14.84155.1352.418406,0250.114.148.64
14.68129.7712.429406,1080.113.958.53
10.0287.2532.811411,7910.18.645.28
9.9131.1332.822412,1370.18.525.21
9.8142.5832.832412,3880.18.415.14
6.61.2353.228517,2760.15.113.12
6.530.9013.238528,4120.15.053.09
6.470.9193.248539,2890.14.993.05
4.550.2053.5991,528,9130.13.21.96
4.510.1943.6091,580,4070.13.161.93
4.460.163.6191,642,9950.13.121.91
3.880.0383.7623,202,6390.12.611.60
3.840.0293.7723,547,3160.12.581.58
3.840.0013.7746,106,6900.12.581.58
Table 2. Parameters recorded during ΔKth determination for SLM-produced alloy.
ΔK,
MPam0.5
da/dN,
nm/Cycle
a, mmN, -R, -ΔM, NmMm, Nm
1302.01112,5420.113.798.43
12.54804.7942.04727,8780.113.178.05
12.34618.0452.06327,9040.112.97.88
12.05418.9452.08727,9490.112.537.66
9.3493.2772.26730,9970.19.265.66
9.2473.0372.27831,1480.19.135.58
9.1447.1362.28931,3750.19.015.51
7.3810.2142.38244,6710.17.14.34
7.314.3622.39245,3720.17.014.28
7.238.1622.40246,6110.16.924.23
5.421.3922.691185,3180.14.822.95
5.360.9072.702197,3200.14.752.9
5.310.8012.712209,8090.14.72.87
4.630.0642.852866,4150.13.952.41
4.580.0452.8621,089,0850.13.92.38
4.530.0012.8722,460,5700.13.852.35
Table 3. Fracture toughness values determined according to ASTM E1820 [23].
Production ProcessKc, MPam0.5
Drawing (Specimen 1)84
Drawing (Specimen 2)83.5
Selective Laser Melting21.9
Table 4. Fracture toughness values determined according to [25].
Production ProcessF, ND, mmD, mmKc, MPam0.5
Drawing23,1145.953.9161.34
Selective laser melting94685.783.9224.64
Disclaimer/Publisher’s Note: The statements, opinions and data contained in all publications are solely those of the individual author(s) and contributor(s) and not of MDPI and/or the editor(s). MDPI and/or the editor(s) disclaim responsibility for any injury to people or property resulting from any ideas, methods, instructions or products referred to in the content.

