


Explainable AI Highlights the Most Relevant Gait Features for Neurodegenerative Disease Classification


Abstract
1. Introduction
2. Materials and Methods
2.1. Dataset
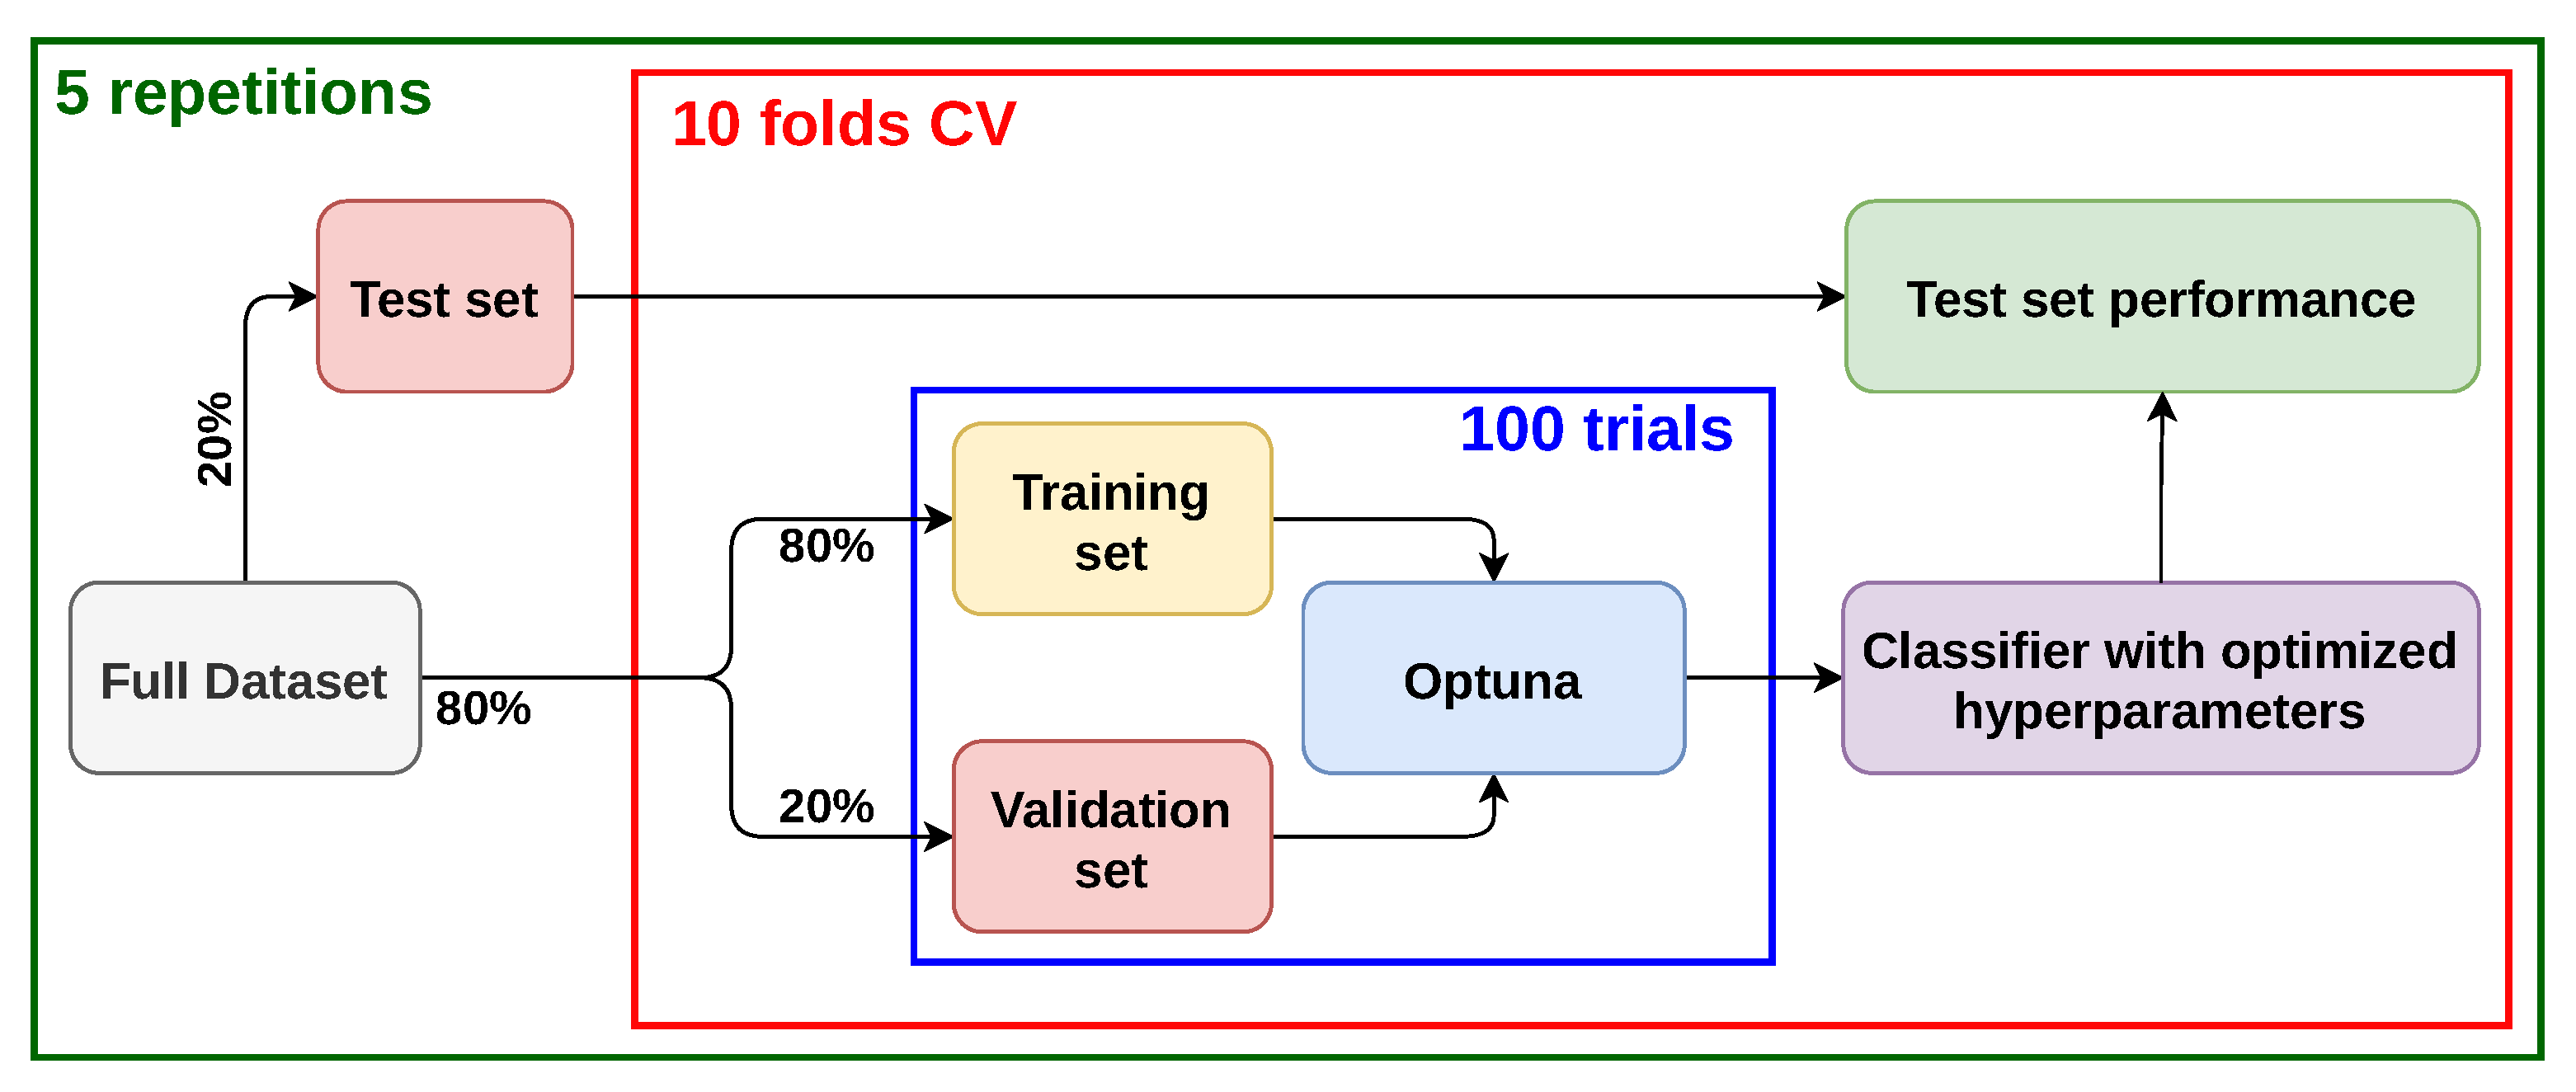
2.2. Training Protocol and Hyperparameters Optimization
- Multi-class classification;
- Binary classification between healthy and affected by any disease. In this case, the class labels PD, CA, and HSP were replaced with a common label, and we labeled this case as HC vs. rest;
- Binary classification between healthy and affected by disease. In this case, only the data belonging to the class HC and one of the other classes were provided to the model. We performed all the possible binary classifications, i.e., HC vs. PD, HC vs. CA, and HC vs. HSP.
2.3. Classifiers
- Random Forest (i.e., the RandomForestClassifier of scikit-learn (version 1.6.1) [25]);
- XGBoost (i.e., the XGBClassifier of the xgboost Python package, version 3.0.0);
- Multi-Layer Perceptron (i.e., the MLPClassifier of scikit-learn);
- Support Vector Machines (i.e., the SVC of scikit-learn), both with linear and Radial Basis Function (RBF) kernels.
2.4. Explainable AI
3. Results
4. Discussion
5. Conclusions
Supplementary Materials
Author Contributions
Funding
Institutional Review Board Statement
Informed Consent Statement
Data Availability Statement
Conflicts of Interest
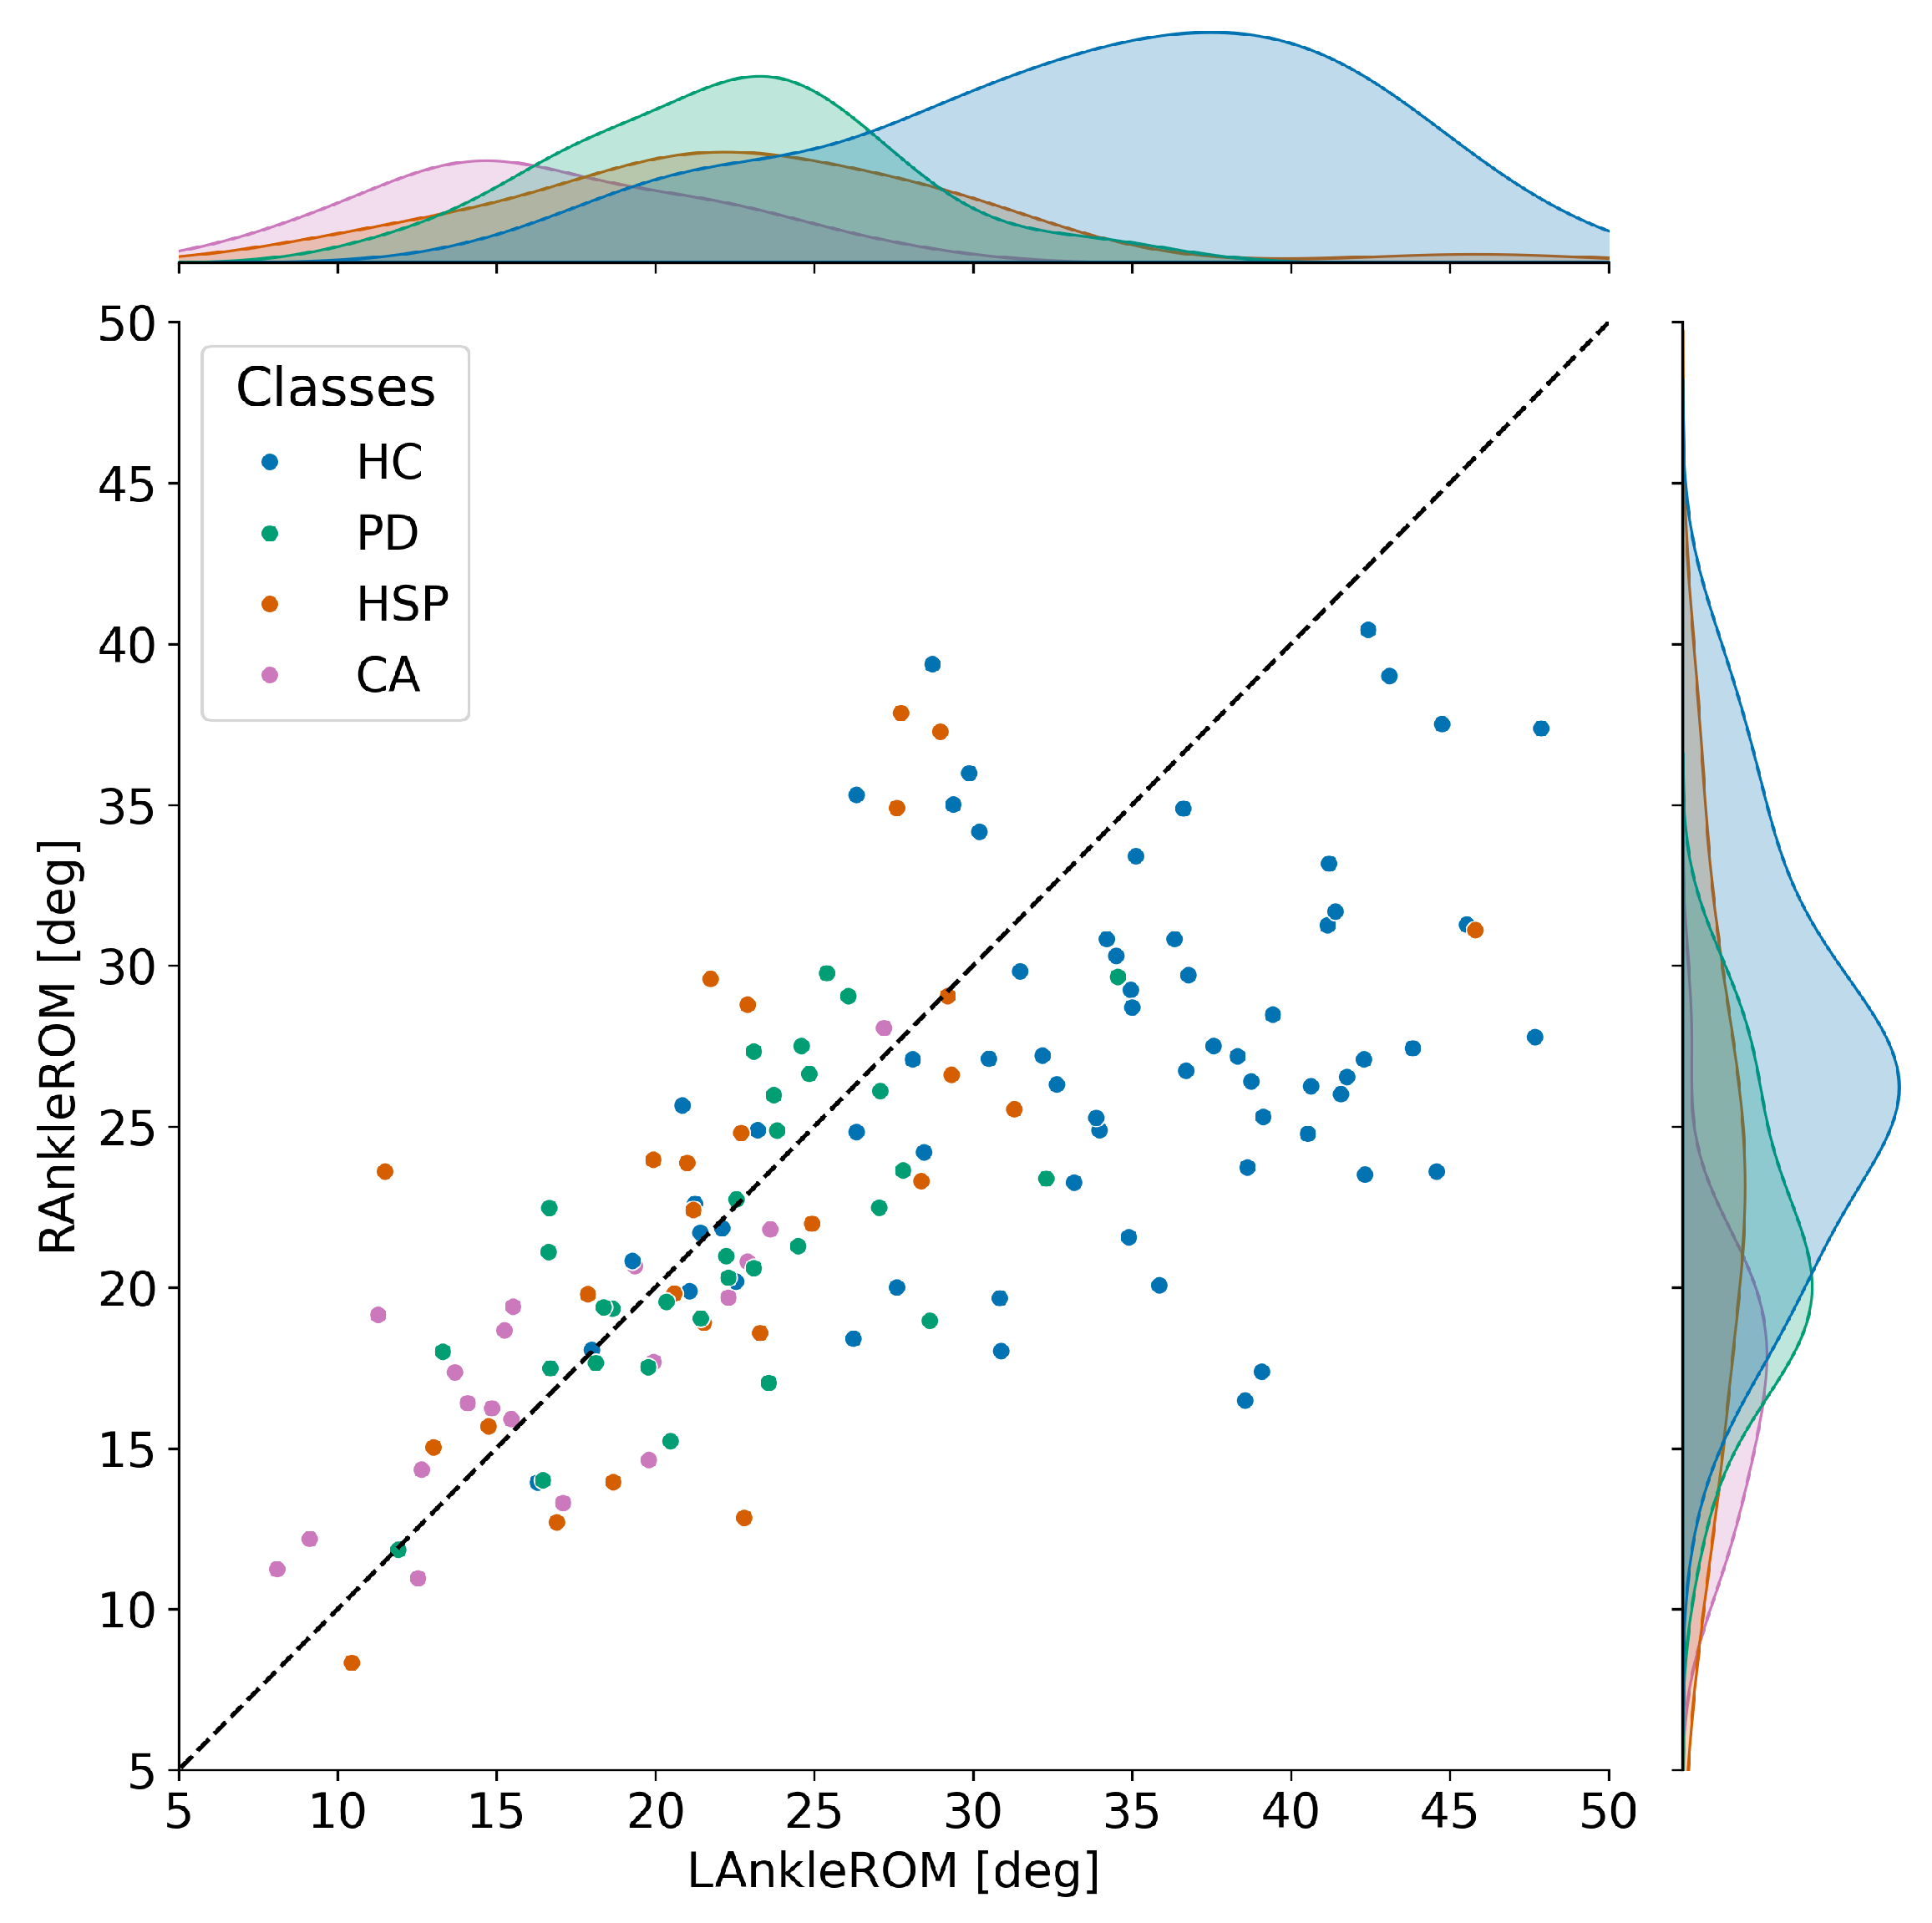
Appendix A. Exclusion of the Ankle ROM Data

| Comparison | Cohen’s d | Hedges’ g | t-Statistic | p-Value | df | |
|---|---|---|---|---|---|---|
| LAnkleROM | HC vs. PD | 1.64 | 1.63 | 8.79 | 88.19 | |
| HC vs. CA | 2.37 | 2.35 | 11.41 | 45.17 | ||
| HC vs. HSP | 1.45 | 1.43 | 6.42 | 49.18 | ||
| RAnkleROM | HC vs. PD | 0.95 | 0.95 | 4.84 | 78.58 | |
| HC vs. CA | 1.70 | 1.68 | 7.92 | 42.02 | ||
| HC vs. HSP | 0.59 | 0.58 | 2.29 | 38.06 |
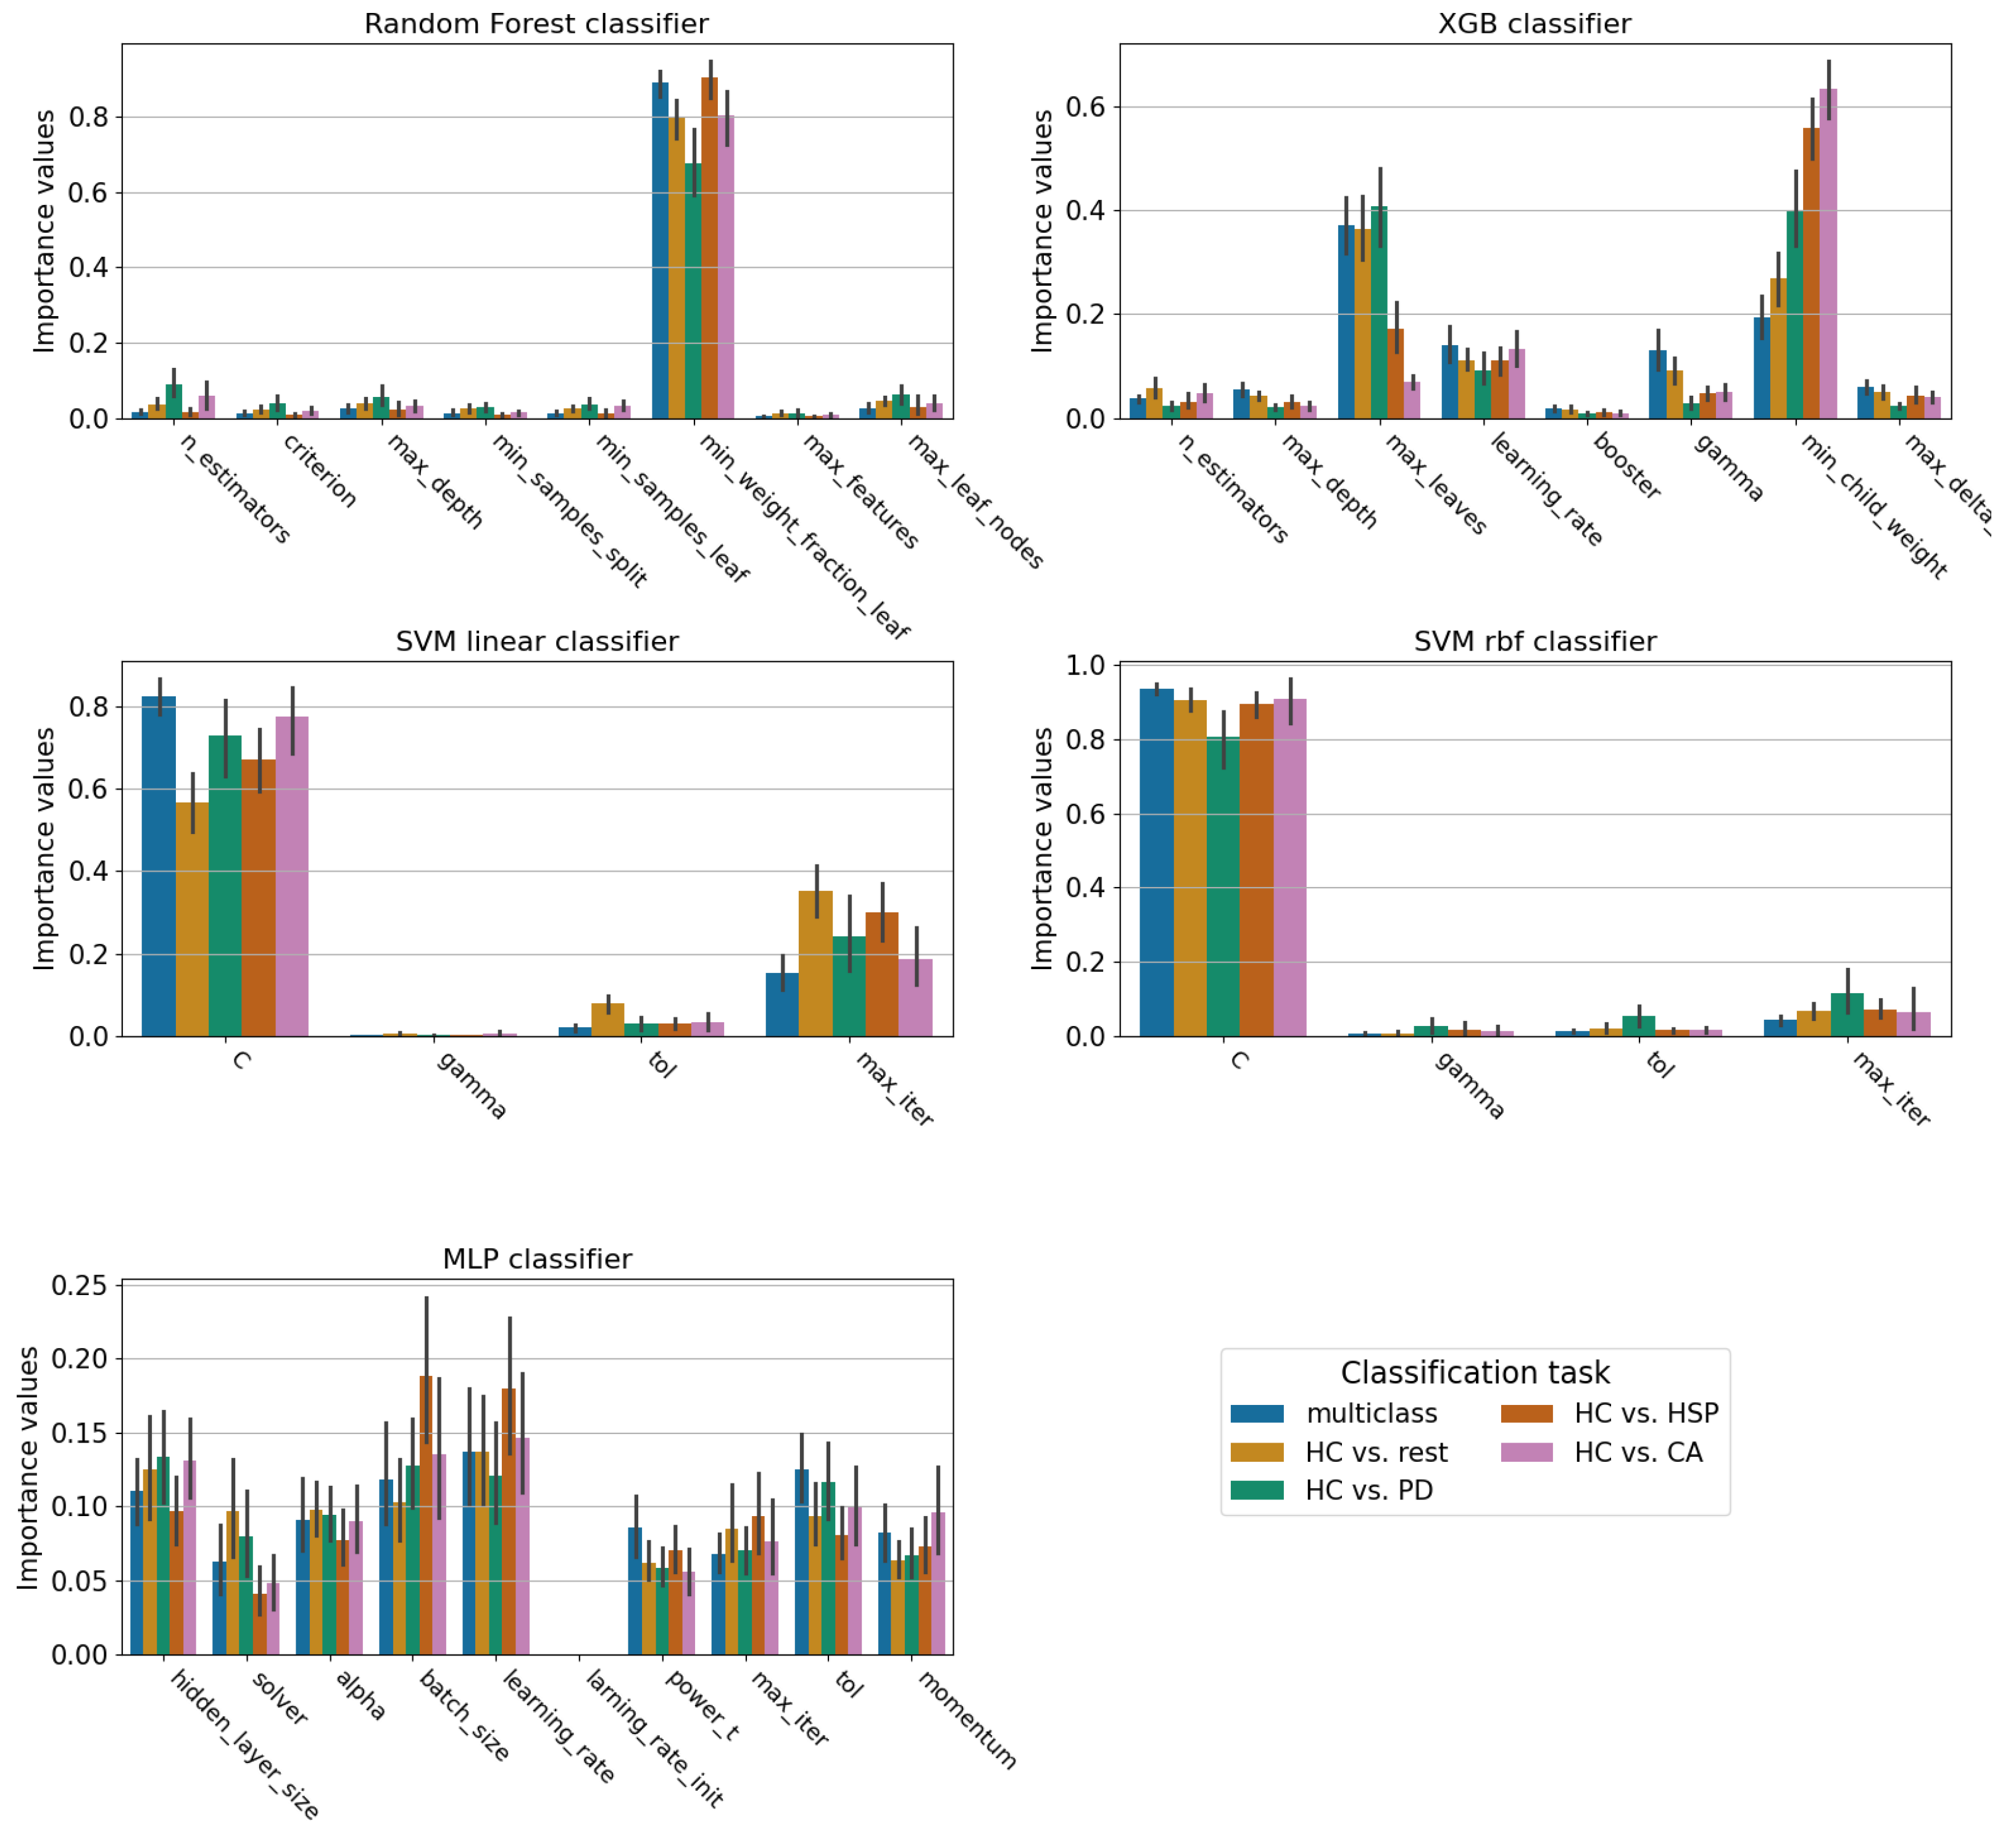
Appendix B. Hyperparameter Tuning
- Random Forest:
- –
- n_estimators—ranging from 100 to 1000, with a step of 100;
- –
- criterion—to be chosen between gini, entropy and log_loss;
- –
- max_depth—ranging from 2 to 8;
- –
- min_samples_split—ranging from 2 to 5;
- –
- min_samples_leaf—ranging from 1 to 5;
- –
- min_weight_fraction_leaf—ranging from 0 to , with a step of . In our case, all the data have the same weight;
- –
- max_features—to be chosen between sqrt and log2;
- –
- max_leaf_nodes—ranging between 4 and 16, with step of 1.
- XGBoost:
- –
- n_estimators—ranging from 100 to 1000, with a step of 100;
- –
- max_depth—ranging from 2 to 8;
- –
- max_leaves—ranging from 0 to 16, with step of 1;
- –
- learning_rate—ranging from to , with step of ;
- –
- booster—to be chosen between gbtree and dart;
- –
- gamma—ranging from 0 to , with step of ;
- –
- min_child_weight—ranging from 0 to 5, with step of 1;
- –
- max_delta_step—ranging from 0 to 10, with step of 1.
- MLP:
- –
- hidden_layer_sizes—ranging from 10 to 200, with a step of 10. This size refers to the number of nodes of the single hidden layer added to the model;
- –
- solver—to be chosen between sgd and adam;
- –
- alpha—ranging from to , with a step of ;
- –
- batch_size—ranging from 4 to 32, with a step of 4;
- –
- learning_rate—to be chosen between constant, invscaling, and adaptive;
- –
- learning_rate_init—ranging from to , with step of ;
- –
- power_t—ranging from to , with a step of ;
- –
- max_iter—ranging from 100 to 1000, with a step of 100;
- –
- tol—ranging from to , with step of ;
- –
- momentum—ranging from to , with step of .
- SVM: In this case, the kernel is treated separately from the other hyperparameters because of the kernel’s impact on the decision boundaries of the classifier. The hyperparameters optimized are the following:
- –
- C—ranging from to , with step of ;
- –
- gamma—to be chosen between scale and auto;
- –
- tol—ranging from to , with a step of ;
- –
- max_iter—ranging from 10 to , with a step of 100;
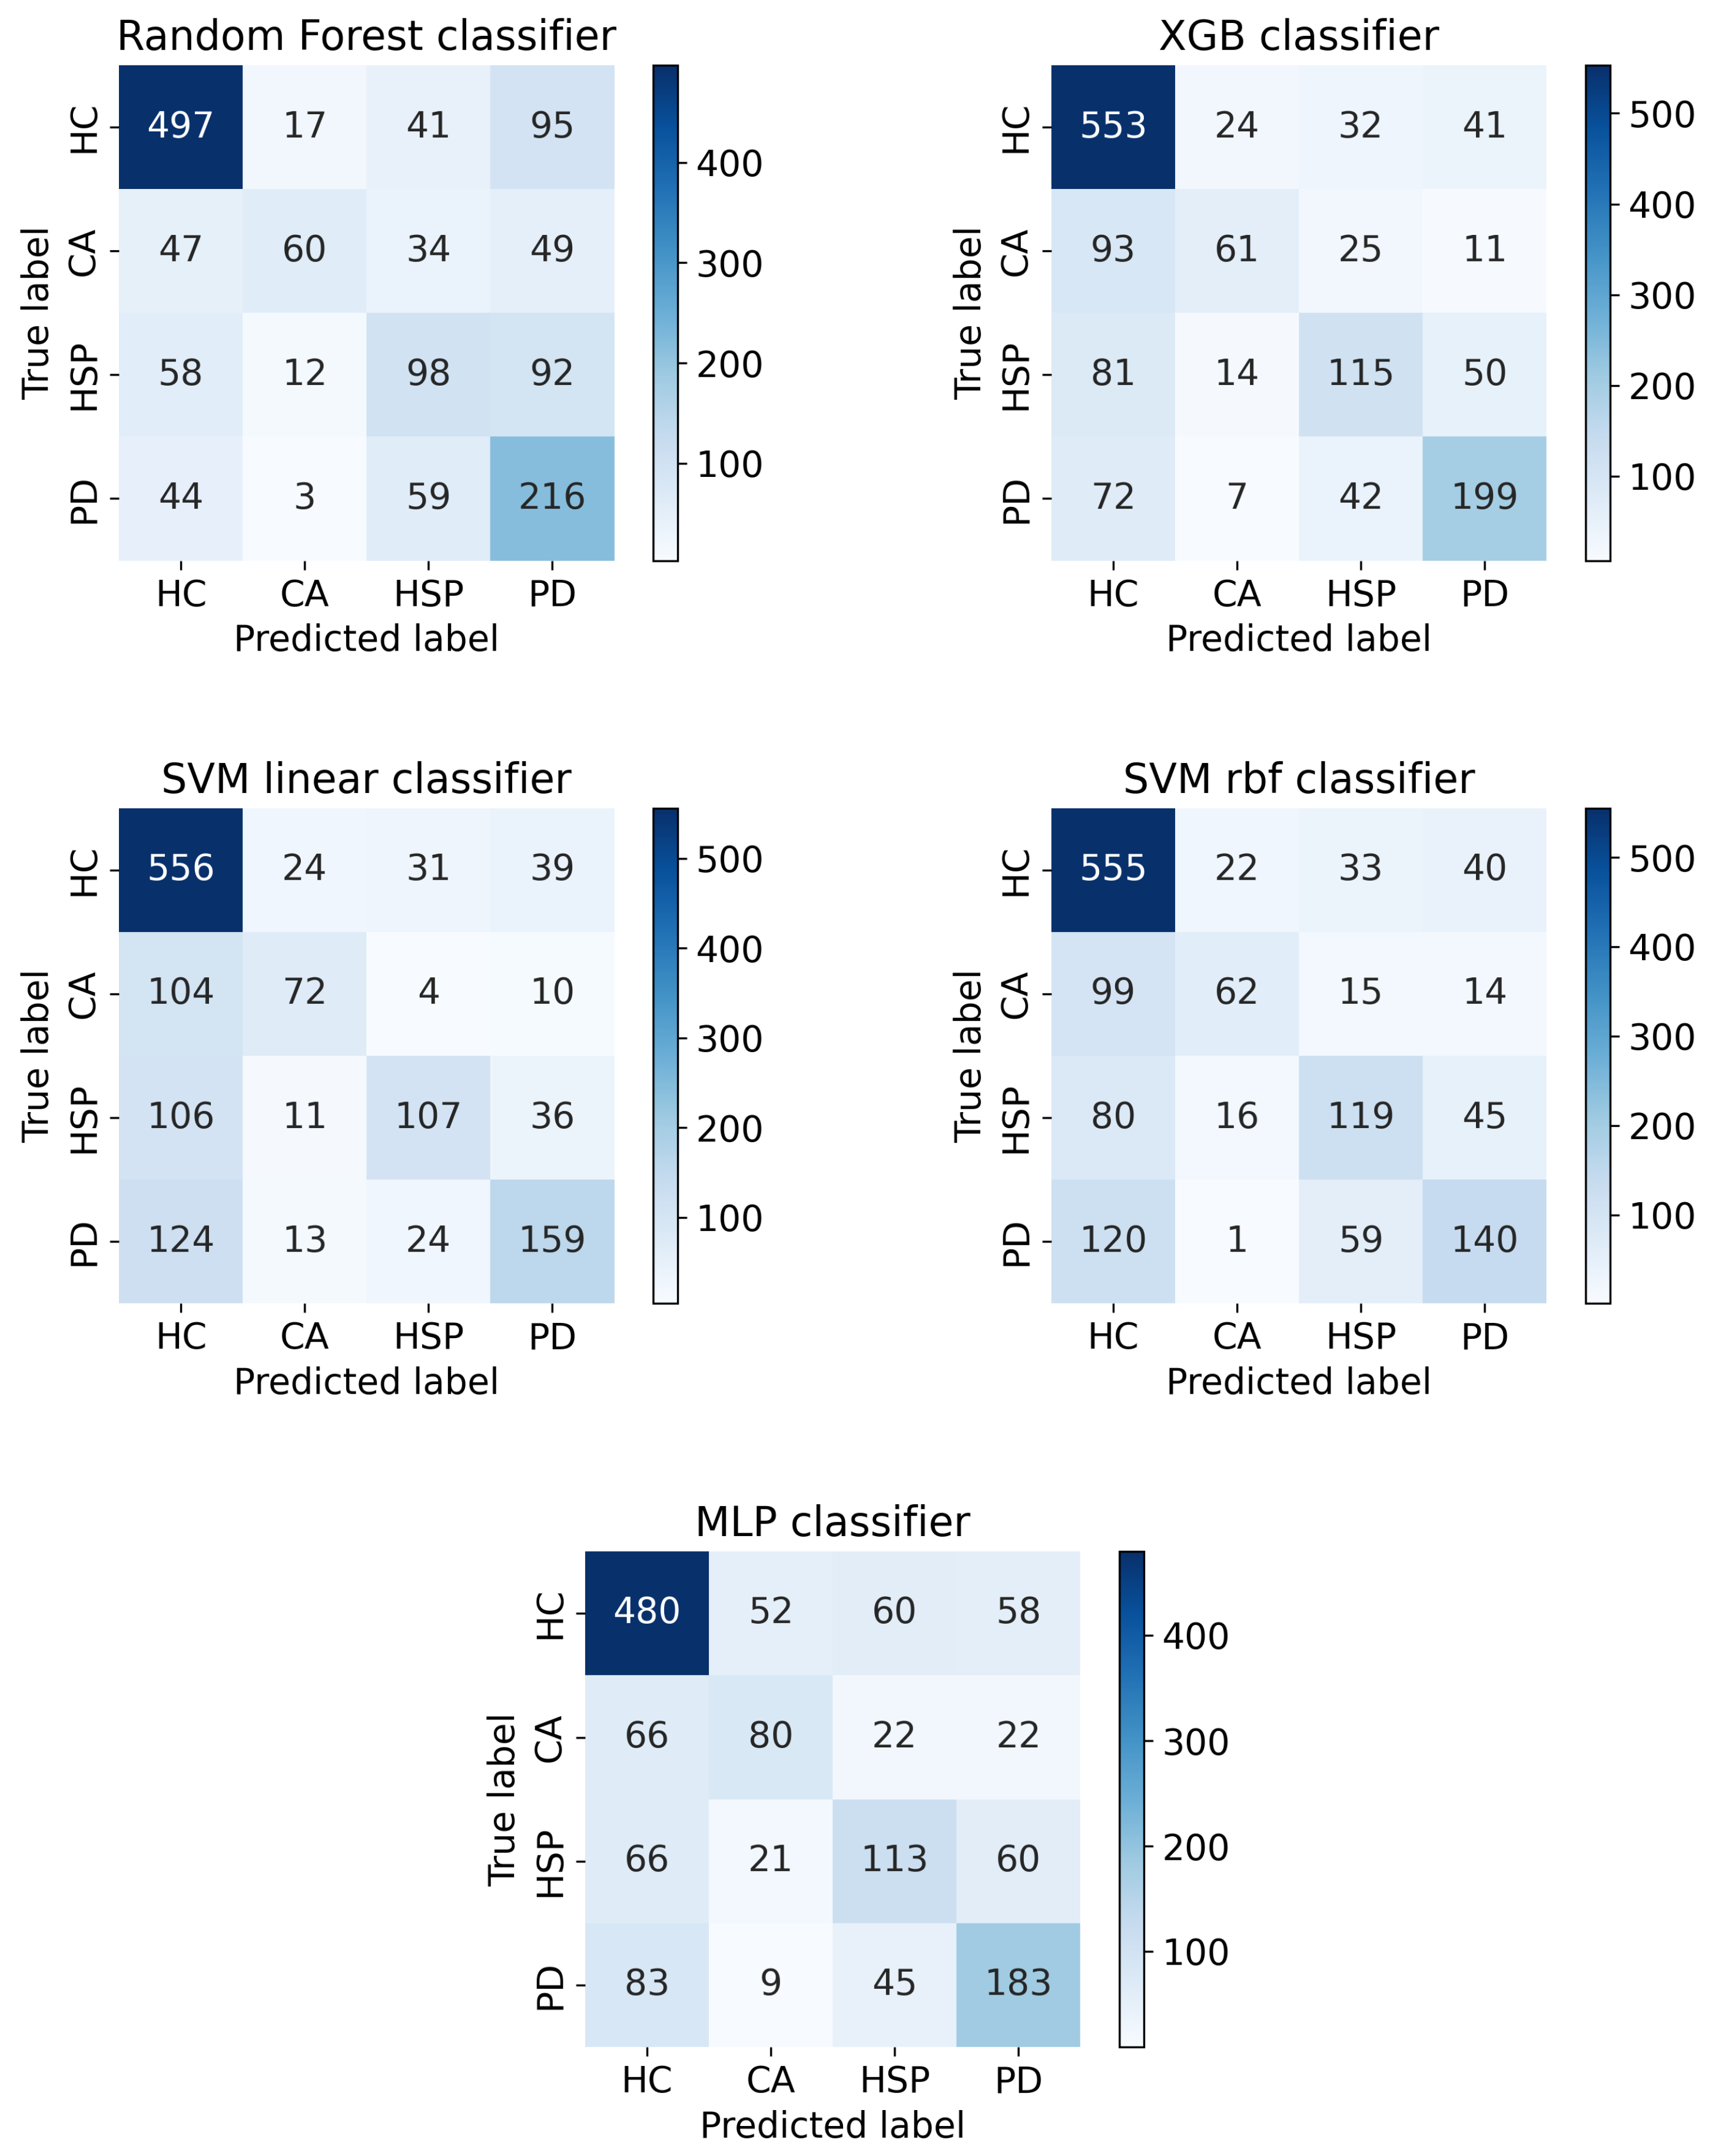
Appendix C. Confusion Matrices of the Multi-Class Classification Task
References
- Hausdorff, J.M.; Rios, D.A.; Edelberg, H.K. Gait variability and fall risk in community-living older adults: A 1-year prospective study. Arch. Phys. Med. Rehabil. 2001, 82, 1050–1056. [Google Scholar] [CrossRef] [PubMed]
- Cicirelli, G.; Impedovo, D.; Dentamaro, V.; Marani, R.; Pirlo, G.; D’Orazio, T.R. Human Gait Analysis in Neurodegenerative Diseases: A Review. IEEE J. Biomed. Health Inform. 2022, 26, 229–242. [Google Scholar] [CrossRef] [PubMed]
- Baker, J.M. Gait Disorders. Am. J. Med. 2018, 131, 602–607. [Google Scholar] [CrossRef] [PubMed]
- Bodranghien, F.; Bastian, A.; Casali, C.; Hallett, M.; Louis, E.D.; Manto, M.; Mariën, P.; Nowak, D.A.; Schmahmann, J.D.; Serrao, M.; et al. Consensus Paper: Revisiting the Symptoms and Signs of Cerebellar Syndrome. Cerebellum 2015, 15, 369–391. [Google Scholar] [CrossRef] [PubMed]
- Comber, L.; Galvin, R.; Coote, S. Gait deficits in people with multiple sclerosis: A systematic review and meta-analysis. Gait Posture 2017, 51, 25–35. [Google Scholar] [CrossRef] [PubMed]
- Creaby, M.W.; Cole, M.H. Gait characteristics and falls in Parkinson’s disease: A systematic review and meta-analysis. Park. Relat. Disord. 2018, 57, 1–8. [Google Scholar] [CrossRef] [PubMed]
- Khera, P.; Kumar, N. Role of machine learning in gait analysis: A review. J. Med. Eng. Technol. 2020, 44, 441–467. [Google Scholar] [CrossRef] [PubMed]
- Horsak, B.; Slijepcevic, D.; Raberger, A.M.; Schwab, C.; Worisch, M.; Zeppelzauer, M. GaitRec, a large-scale ground reaction force dataset of healthy and impaired gait. Sci. Data 2020, 7, 143. [Google Scholar] [CrossRef] [PubMed]
- Hausdorff, J.M. Gait in Parkinson’s Disease. 2008. Available online: https://physionet.org/content/gaitpdb/1.0.0/ (accessed on 11 July 2025).
- Serrao, M.; Chini, G.; Bergantino, M.; Sarnari, D.; Casali, C.; Conte, C.; Ranavolo, A.; Marcotulli, C.; Rinaldi, M.; Coppola, G.; et al. Dataset on gait patterns in degenerative neurological diseases. Data Brief 2018, 16, 806–816. [Google Scholar] [CrossRef] [PubMed]
- Schülein, S.; Barth, J.; Rampp, A.; Rupprecht, R.; Eskofier, B.M.; Winkler, J.; Gaßmann, K.G.; Klucken, J. Instrumented gait analysis: A measure of gait improvement by a wheeled walker in hospitalized geriatric patients. J. Neuroeng. Rehabil. 2017, 14, 18. [Google Scholar] [CrossRef] [PubMed]
- Serrao, M.; Chini, G.; Bergantino, M.; Sarnari, D.; Casali, C.; Conte, C.; Ranavolo, A.; Marcotulli, C.; Rinaldi, M.; Coppola, G.; et al. Identification of specific gait patterns in patients with cerebellar ataxia, spastic paraplegia, and Parkinson’s disease: A non-hierarchical cluster analysis. Hum. Mov. Sci. 2018, 57, 267–279. [Google Scholar] [CrossRef] [PubMed]
- Özateş, M.E.; Yaman, A.; Salami, F.; Campos, S.; Wolf, S.I.; Schneider, U. Identification and interpretation of gait analysis features and foot conditions by explainable AI. Sci. Rep. 2024, 14, 5998. [Google Scholar] [CrossRef] [PubMed]
- Kim, J.K.; Bae, M.N.; Lee, K.; Kim, J.C.; Hong, S.G. Explainable Artificial Intelligence and Wearable Sensor-Based Gait Analysis to Identify Patients with Osteopenia and Sarcopenia in Daily Life. Biosensors 2022, 12, 167. [Google Scholar] [CrossRef] [PubMed]
- Breiman, L.; Friedman, J.H.; Olshen, R.A.; Stone, C.J. Classification And Regression Trees; Routledge: Abingdon, UK, 2017. [Google Scholar] [CrossRef]
- Lundberg, S.M.; Lee, S.I. A Unified Approach to Interpreting Model Predictions. In Advances in Neural Information Processing Systems 30; Guyon, I., Luxburg, U.V., Bengio, S., Wallach, H., Fergus, R., Vishwanathan, S., Garnett, R., Eds.; Curran Associates, Inc.: Red Hook, NY, USA, 2017; pp. 4765–4774. [Google Scholar]
- Hof, A.L. Scaling gait data to body size. Gait Posture 1996, 4, 222–223. [Google Scholar] [CrossRef]
- Nagasaki, H.; Itoh, H.; Hashizume, K.; Furuna, T.; Maruyama, H.; Kinugasa, T. Walking Patterns and Finger Rhythm of Older Adults. Percept. Mot. Skills 1996, 82, 435–447. [Google Scholar] [CrossRef] [PubMed]
- Sekiya, N.; Nagasaki, H. Reproducibility of the walking patterns of normal young adults: Test-retest reliability of the walk ratio(step-length/step-rate). Gait Posture 1998, 7, 225–227. [Google Scholar] [CrossRef] [PubMed]
- Bogen, B.; Moe-Nilssen, R.; Kristin Aaslund, M. O27: The Walk Ratio: Gender differences or height differences? Gait Posture 2017, 57, 49. [Google Scholar] [CrossRef]
- Perry, J. Gait Analysis: Normal and Pathological Function; SLACK: Thorofare, NJ, USA, 1992. [Google Scholar]
- Akiba, T.; Sano, S.; Yanase, T.; Ohta, T.; Koyama, M. Optuna: A Next-generation Hyperparameter Optimization Framework. In Proceedings of the 25th ACM SIGKDD International Conference on Knowledge Discovery and Data Mining, Anchorage, AK, USA, 4–8 August 2019; pp. 2623–2631. [Google Scholar] [CrossRef]
- Rössler, R.; Wagner, J.; Knaier, R.; Rommers, N.; Kressig, R.W.; Schmidt-Trucksäss, A.; Hinrichs, T. Spatiotemporal gait characteristics across the adult lifespan: Reference values from a healthy population—Analysis of the COmPLETE cohort study. Gait Posture 2024, 109, 101–108. [Google Scholar] [CrossRef] [PubMed]
- Schloemer, S.A.; Thompson, J.A.; Silder, A.; Thelen, D.G.; Siston, R.A. Age-Related Differences in Gait Kinematics, Kinetics, and Muscle Function: A Principal Component Analysis. Ann. Biomed. Eng. 2016, 45, 695–710. [Google Scholar] [CrossRef] [PubMed]
- Pedregosa, F.; Varoquaux, G.; Gramfort, A.; Michel, V.; Thirion, B.; Grisel, O.; Blondel, M.; Prettenhofer, P.; Weiss, R.; Dubourg, V.; et al. Scikit-learn: Machine Learning in Python. J. Mach. Learn. Res. 2011, 12, 2825–2830. [Google Scholar]
- Shwartz-Ziv, R.; Armon, A. Tabular Data: Deep Learning is Not All You Need. arXiv 2021, arXiv:2106.03253. [Google Scholar] [CrossRef]
- Hossain, M.; Kabir, M.; Anwar, A.; Islam, M.Z. Detecting autism spectrum disorder using machine learning techniques. Health Inf. Sci. Syst. 2021, 9, 17. [Google Scholar] [CrossRef] [PubMed]
- Zhang, Y.; Ma, Y. Application of supervised machine learning algorithms in the classification of sagittal gait patterns of cerebral palsy children with spastic diplegia. Comput. Biol. Med. 2019, 106, 33–39. [Google Scholar] [CrossRef] [PubMed]
- Molnar, C. Interpretable Machine Learning, 3rd ed.; Christoph Molnar. 2025. Available online: https://christophm.github.io/interpretable-ml-book (accessed on 11 July 2025).
- Lundberg, S.M.; Erion, G.; Chen, H.; DeGrave, A.; Prutkin, J.M.; Nair, B.; Katz, R.; Himmelfarb, J.; Bansal, N.; Lee, S.I. From local explanations to global understanding with explainable AI for trees. Nat. Mach. Intell. 2020, 2, 2522–5839. [Google Scholar] [CrossRef] [PubMed]
- Buckley, E.; Mazzà, C.; McNeill, A. A systematic review of the gait characteristics associated with Cerebellar Ataxia. Gait Posture 2018, 60, 154–163. [Google Scholar] [CrossRef] [PubMed]
- Zanardi, A.P.J.; da Silva, E.S.; Costa, R.R.; Passos-Monteiro, E.; dos Santos, I.O.; Kruel, L.F.M.; Peyré-Tartaruga, L.A. Gait parameters of Parkinson’s disease compared with healthy controls: A systematic review and meta-analysis. Sci. Rep. 2021, 11. [Google Scholar] [CrossRef] [PubMed]
- Pistacchi, M. Gait analysis and clinical correlations in early Parkinson’s disease. Funct. Neurol. 2017, 32, 28. [Google Scholar] [CrossRef] [PubMed]
- Russo, M.; Amboni, M.; Pisani, N.; Volzone, A.; Calderone, D.; Barone, P.; Amato, F.; Ricciardi, C.; Romano, M. Biomechanics Parameters of Gait Analysis to Characterize Parkinson’s Disease: A Scoping Review. Sensors 2025, 25, 338. [Google Scholar] [CrossRef] [PubMed]
- Faccioli, S.; Cavalagli, A.; Falocci, N.; Mangano, G.; Sanfilippo, I.; Sassi, S. Gait analysis patterns and rehabilitative interventions to improve gait in persons with hereditary spastic paraplegia: A systematic review and meta-analysis. Front. Neurol. 2023, 14, 1256392. [Google Scholar] [CrossRef] [PubMed]
- Serrao, M.; Chini, G.; Casali, C.; Conte, C.; Rinaldi, M.; Ranavolo, A.; Marcotulli, C.; Leonardi, L.; Fragiotta, G.; Bini, F.; et al. Progression of Gait Ataxia in Patients with Degenerative Cerebellar Disorders: A 4-Year Follow-Up Study. Cerebellum 2016, 16, 629–637. [Google Scholar] [CrossRef] [PubMed]
- Palliyath, S.; Hallett, M.; Thomas, S.L.; Lebiedowska, M.K. Gait in patients with cerebellar ataxia. Mov. Disord. 1998, 13, 958–964. [Google Scholar] [CrossRef] [PubMed]
- Wolf, S.I.; Braatz, F.; Metaxiotis, D.; Armbrust, P.; Dreher, T.; Döderlein, L.; Mikut, R. Gait analysis may help to distinguish hereditary spastic paraplegia from cerebral palsy. Gait Posture 2011, 33, 556–561. [Google Scholar] [CrossRef] [PubMed]
- Chawla, N.V.; Bowyer, K.W.; Hall, L.O.; Kegelmeyer, W.P. SMOTE: Synthetic Minority Over-sampling Technique. J. Artif. Intell. Res. 2002, 16, 321–357. [Google Scholar] [CrossRef]
- Loya, A.; Deshpande, S.; Purwar, A. Machine Learning Driven Individualized Gait Rehabilitation: Classification, Prediction, and Mechanism Design. In Proceedings of the ASME 2019 International Design Engineering Technical Conferences and Computers and Information in Engineering Conference. Volume 5A: 43rd Mechanisms and Robotics Conference; Anaheim, CA, USA, 18–21 August 2019, American Society of Mechanical Engineers: New York, NY, USA, 2019. [Google Scholar] [CrossRef]
- Salimi-Badr, A.; Veisi, M.; Berangi, S. SincPD: An Explainable Method based on Sinc Filters to Diagnose Parkinson’s Disease Severity by Gait Cycle Analysis. arXiv 2025, arXiv:2502.17463. [Google Scholar]
- Rupprechter, S.; Morinan, G.; Peng, Y.; Foltynie, T.; Sibley, K.; Weil, R.S.; Leyland, L.A.; Baig, F.; Morgante, F.; Gilron, R.; et al. A Clinically Interpretable Computer-Vision Based Method for Quantifying Gait in Parkinson’s Disease. Sensors 2021, 21, 5437. [Google Scholar] [CrossRef] [PubMed]
- Ugbolue, U.C.; Robson, C.; Donald, E.; Speirs, K.L.; Dutheil, F.; Baker, J.S.; Dias, T.; Gu, Y. Joint Angle, Range of Motion, Force, and Moment Assessment: Responses of the Lower Limb to Ankle Plantarflexion and Dorsiflexion. Appl. Bionics Biomech. 2021, 2021, 1–13. [Google Scholar] [CrossRef] [PubMed]
- Cohen, J. Statistical Power Analysis for the Behavioral Sciences; Routledge: Abingdon, UK, 2013. [Google Scholar] [CrossRef]
- Hedges, L.V. Distribution Theory for Glass’s Estimator of Effect size and Related Estimators. J. Educ. Stat. 1981, 6, 107–128. [Google Scholar] [CrossRef]
- Gorton, G.E.; Hebert, D.A.; Gannotti, M.E. Assessment of the kinematic variability among 12 motion analysis laboratories. Gait Posture 2009, 29, 398–402. [Google Scholar] [CrossRef] [PubMed]

| Health Status | Male | Female | Age Range (yrs) | Average Age (yrs) |
|---|---|---|---|---|
| Healthy control (HC) | 33 | 32 | 21–78 | 50.2 ± 13.2 |
| Parkinson’s disease (PD) | 18 | 14 | 50–79 | 69.5 ± 6.7 |
| Cerebellar ataxia (CA) | 12 | 7 | 32–71 | 48.6 ± 9.9 |
| Hereditary spastic paraplegia (HSP) | 15 | 11 | 21–78 | 48.4 ± 16.2 |
Disclaimer/Publisher’s Note: The statements, opinions and data contained in all publications are solely those of the individual author(s) and contributor(s) and not of MDPI and/or the editor(s). MDPI and/or the editor(s) disclaim responsibility for any injury to people or property resulting from any ideas, methods, instructions or products referred to in the content. |
© 2025 by the authors. Licensee MDPI, Basel, Switzerland. This article is an open access article distributed under the terms and conditions of the Creative Commons Attribution (CC BY) license (https://creativecommons.org/licenses/by/4.0/).
Share and Cite
Tiddia, G.; Mainas, F.; Retico, A.; Oliva, P. Explainable AI Highlights the Most Relevant Gait Features for Neurodegenerative Disease Classification. Appl. Sci. 2025, 15, 8078. https://doi.org/10.3390/app15148078
Tiddia G, Mainas F, Retico A, Oliva P. Explainable AI Highlights the Most Relevant Gait Features for Neurodegenerative Disease Classification. Applied Sciences. 2025; 15(14):8078. https://doi.org/10.3390/app15148078
Chicago/Turabian StyleTiddia, Gianmarco, Francesca Mainas, Alessandra Retico, and Piernicola Oliva. 2025. "Explainable AI Highlights the Most Relevant Gait Features for Neurodegenerative Disease Classification" Applied Sciences 15, no. 14: 8078. https://doi.org/10.3390/app15148078
APA StyleTiddia, G., Mainas, F., Retico, A., & Oliva, P. (2025). Explainable AI Highlights the Most Relevant Gait Features for Neurodegenerative Disease Classification. Applied Sciences, 15(14), 8078. https://doi.org/10.3390/app15148078