Article

High-Temperature Mechanical and Wear Behavior of Hypoeutectic Al–Si–(Cu)–Mg Alloys with Hardening Mechanisms Dictated by Varying Cu:Mg Ratios

1
Interdisciplinary Major of Maritime AI Convergence, Department of Advanced Materials Convergence Engineering, National Korea Maritime and Ocean University, Busan 49112, Republic of Korea
2
3rd R&D Institute-6th Directorate Division, Agency for Defense Development, Daejeon 34186, Republic of Korea
*
Author to whom correspondence should be addressed.
Appl. Sci. 2025, 15(14), 8047; https://doi.org/10.3390/app15148047
Submission received: 23 May 2025 / Revised: 16 July 2025 / Accepted: 17 July 2025 / Published: 19 July 2025
(This article belongs to the Special Issue Characterization and Mechanical Properties of Alloys)

Abstract

Enhancing damage tolerance and wear resistance in Al–Si-based alloys under thermomechanical stress remains a key challenge in lightweight structural applications. This study investigates the microstructural and tribomechanical behavior of hypoeutectic Al–Si–(Cu)–Mg alloys with varying Cu:Mg ratios (3:1 vs. 1:3) under a T6 heat treatment. Alloys A and B, with identical Si contents but differing Cu and Mg levels, were subjected to multiscale microstructural characterization and mechanical and wear testing at 25 °C, 150 °C, and 250 °C. Alloy A (Cu-rich) exhibited refined α-Al(FeMn)Si phases and homogeneously dissolved Cu in the Al matrix, promoting lattice contraction and dislocation pinning. In contrast, Alloy B (Mg-rich) retained coarse Mg2Si and residual β-AlFeSi phases, which induced local stress concentrations and thermal instability. Under tribological testing, Alloy A showed slightly higher friction coefficients (0.38–0.43) but up to 26.4% lower wear rates across all temperatures. At 250 °C, Alloy B exhibited a 25.2% increase in the wear rate, accompanied by surface degradation such as delamination and spalling due to β-AlFeSi fragmentation and matrix softening. These results confirm that the Cu:Mg ratio critically influences the dominant hardening mechanism—the solid solution vs. precipitation—and determines the high-temperature performance. Alloy A maintained up to 14.1% higher tensile strength and 22.3% higher hardness, exhibiting greater shear resistance and interfacial stability. This work provides a compositionally guided framework for designing thermally durable Al–Si-based alloys with improved wear resistance under elevated temperature conditions.

1. Introduction

Hypoeutectic Al–Si alloys have garnered significant attention as high-performance materials capable of maintaining lightweight characteristics, high thermal conductivity, and an excellent wear and corrosion resistance even under elevated temperature conditions. Owing to these properties, they are extensively applied in components exposed to extreme service environments, such as those in the automotive, aerospace, and marine sectors [1,2]. Especially, their ability to retain mechanical stability and long-term durability under cyclic thermo-mechanical stress makes them promising candidates for next-generation lightweight structural applications, including engine blocks, pistons, and heat exchangers [3,4,5]. To fully optimize their performance in high-temperature damage environments, it is essential to go beyond mere compositional modifications. A systematic approach to microstructural engineering—encompassing precise control over the distribution of strengthening phases, stabilization of solute atoms in the Al matrix, and maintenance of interfacial coherence between phases—is required [6,7,8,9].
Among the various alloying elements, Copper (Cu) and Magnesium (Mg) are critical in determining the high-temperature strength, wear resistance, and corrosion behavior of Al–Si-based alloys, primarily by inducing solid solution strengthening and precipitation hardening, respectively [4,8,9]. Cu enhances the tensile strength and frictional resistance at elevated temperatures by forming substitutional solid solutions within the Al lattice, thereby introducing lattice distortion and impeding dislocation motion [10,11,12,13]. In contrast, Mg contributes to high-temperature strength through the formation of thermally stable Mg2Si precipitates. However, the excessive precipitation or agglomeration of Mg2Si may result in microstructural inhomogeneity, localized embrittlement, and an increased susceptibility to corrosion [10,13].
Thus, the synergistic interaction between Cu and Mg significantly influences the thermodynamic and mechanical stability of Al–Si alloys—extending far beyond the effects of their individual concentrations [14,15]. Nonetheless, most existing studies have focused primarily on the independent effects of either Cu or Mg or have been limited to first-order mechanical properties such as hardness and tensile strength [10,11,13]. Structural–property relationship studies examining the influence of the Cu:Mg ratio on the phase distribution, interfacial stability, and high-temperature wear resistance remain scarce. In particular, quantitative microstructural investigations capable of explaining the complex damage mechanisms under extreme thermal and mechanical environments are largely lacking.
This study aims to quantitatively elucidate the relationship between microstructural stability and the high-temperature mechanical and tribological performance in heat-treated hypoeutectic Al–Si alloys by varying the Cu:Mg ratio. Two alloys were designed with Cu:Mg ratios of 3:1 (Alloy A) and 1:3 (Alloy B), and their phase distributions, solute behavior, and thermodynamic stability were systematically evaluated using X-ray diffraction (XRD), scanning electron microscopy (SEM), energy-dispersive spectroscopy (EDS), and electron probe microanalysis (EPMA). Subsequent tensile, hardness, and wear tests were conducted at 25 °C, 150 °C, and 250 °C to identify the relationship between thermodynamic stability and the resistance to mechanical degradation. This study proposes a microstructural design roadmap for the performance optimization of Al–Si-based alloys and demonstrates that the precise control of the Cu:Mg ratio enables the simultaneous enhancement of the phase stability and damage resistance.

2. Materials and Methods

2.1. Material Preparation

To evaluate the high-temperature mechanical and wear performance of hypoeutectic Al–Si alloys, two alloy compositions with differing Cu:Mg ratios were fabricated. Both alloys contained approximately 9 wt.% Si to maintain consistent eutectic behavior, while the Cu:Mg ratio was adjusted to 3:1 (designated as Alloy A) and 1:3 (Alloy B), respectively.
Equilibrium phase relations were calculated with JMatPro v13 (aluminum alloy database). The simulations confirmed that both compositions solidify in the primary α-Al + eutectic domain (0–12.6 wt.% Si) and share a common solution heat treatment window around 530 °C; detailed isopleths and phase fraction profiles are provided in Figure S1.
Each alloy underwent T6 heat treatment based on prior optimization studies for Cu- and Mg-rich compositions. The solution treatment was conducted at 530 °C for 8 h, followed by immediate water quenching. Aging was then performed at 175 °C for 7 h to promote precipitation hardening. The chemical composition of the alloys was validated via Laser-Induced Breakdown Spectroscopy (LIBS; Z-903 Geochem, SciAps, Woburn, United States), conducted at the Eco-Friendly Shipbuilding Core Research Support Center at National Korea Maritime and Ocean University, and the results are summarized in Table 1.

2.2. Microstructural Characterization Preperation

X-ray diffraction was performed on a Rigaku D/MAX 2500 V/PC diffractometer (Rigaku, Tokyo, Japan) using Cu Kα radiation (λ = 1.5406 Å) at 40 kV and 30 mA. Patterns were collected over 2θ = 20–110° with a step size of 0.02° and 1 s dwell per step. For the critical overlap between α-Al (111) and Al2Cu (211), we carried out peak deconvolution in the 38.0–39.0° 2θ window using OriginPro 2021 and Rigaku SmartLab software (https://rigaku.com/products/x-ray-diffraction-and-scattering/xrd/smartlab, accessed on 16 July 2025). Two pseudo-Voigt functions—with a linear baseline and internal Si standard for 2θ calibration—were simultaneously fitted to the raw data. Fit quality was assessed via R2 and χ2 metrics, and the extracted peak centroids, full width at half maximum (FWHM), and integrated areas were used for quantitative phase analysis.
Microstructural analysis was carried out using a combination of scanning electron microscopy (SEM), energy-dispersive spectroscopy (EDS), and electron probe microanalysis (EPMA). Metallographic preparation involved sequential grinding with SiC papers (400 to 2400 grit), followed by polishing using 3 μm and 1 μm diamond pastes, and final finishing with 0.03 μm colloidal silica suspension.
Field emission scanning electron microscopy (FE-SEM; CLARA, TESCAN, Brno, Czech Republic) was employed at an accelerating voltage of 15.0 kV to investigate phase morphology and distribution. The chemical composition of intermetallic compounds was determined using an integrated EDS system (EDAX, CLARA, TESCAN). For more precise elemental mapping and precipitate analysis, EPMA (JXA-8230, JEOL, Tokyo, Japan) was also utilized.
To maintain consistency in analysis and discussion, specimens in the as-cast condition were labeled as AC_A and AC_B for Alloys A and B, respectively. After T6 heat treatment, the specimens were designated according to both alloy type and testing temperature: RT_A and RT_B for tests at 25 °C, 150_A and 150_B at 150 °C, and 250_A and 250_B at 250 °C.

2.3. Mechanical Test

Mechanical performance was evaluated in terms of hardness, tensile strength, and tribological behavior. Vickers hardness measurements were performed in accordance with ASTM E384 [16] using a microhardness tester (HV-110D, Mitutoyo, Tokyo, Japan) under a load of 1 kgf applied for 10 s. A total of 25 indentations were made per specimen, and the average value was reported. Hardness was measured at room temperature and also after tensile tests conducted at elevated temperatures (150 °C and 250 °C).
Tensile properties were assessed following ASTM E8 (subsize) standards [17] using a universal testing machine (TD-U03, Shimadzu, Kyoto, Japan) with a crosshead speed of 1 mm/min. Three replicate tests were conducted for each condition. High-temperature tensile tests were carried out at 150 °C and 250 °C, and yield strength (YS), ultimate tensile strength (UTS), and elongation (El.) were determined.
Tribological properties were evaluated using a ball-on-disk wear test in accordance with ASTM G99 [18], as detailed in Table 2. The tests were conducted using a pin-on-disk wear tester (RB 102 PD, R&B, Daejeon, South Korea) at three temperatures: 25 °C, 150 °C, and 250 °C. Each test was repeated three times to ensure reproducibility. The average coefficient of friction (COF) and wear rate were calculated to assess wear performance under different thermal conditions.

3. Results and Discussion

3.1. Microstructural Characterization

3.1.1. Phase Identification via X-Ray Diffraction (XRD) Analysis

Figure 1 presents the X-ray diffraction (XRD) patterns of Al–Si–(Cu)–Mg alloys (Alloy A and Alloy B) before and after the T6 heat treatment. All diffraction peaks were indexed with reference to ICDD PDF-4 + cards (Al [FCC] 04-0787; Si 03-016-1163; α-Al(FeMn)Si 35-102; β-AlFeSi 65-879; Mg2Si 01-077-2101; Al2Cu 03-065-6648; Q-phase Al5Cu2Mg8Si6 35-0784). In both alloys, characteristic diffraction peaks corresponding to Al, Si, α-Al(FeMn)Si, β-AlFeSi, and Mg2Si phases were commonly observed, indicating the dominant phases formed under the given casting and heat treatment conditions.
In the as-cast condition, Alloy A exhibited distinct diffraction peaks for Cu-rich intermetallics such as Al2Cu. However, these peaks either disappeared or were significantly reduced in intensity after the T6 heat treatment. Simultaneously, the Al peak was slightly shifted to a higher angle, as shown in the magnified region (highlighted by the purple box) in Figure 1b. According to Bragg’s law (nλ = 2d sinθ), this peak shift suggests a decrease in the interplanar spacing (d-spacing), implying lattice contraction [19].
Upon the T6 treatment, most Al2Cu and Q-phase peaks in Alloy A collapse or diminish below the XRD detection (<0.5 wt.%), whereas Mg2Si reflections emerge strongly in Alloy B (Figure 1a). The principal Al (FCC) 111 reflection at ≈ 38.5° 2θ also changes in shape and position. A detailed view (Figure 1b) reveals a composite reflection formed by overlapping α-Al (111) and Al2Cu (211). After T6, the centroid of the α-Al (111) component moves from 38.41° ± 0.01° (AC_A) to 38.47° ± 0.01° (HT_A), corresponding to a −0.16% decrease in d111 (Bragg’s law), which is indicative of Cu atoms entering the Al lattice and contracting its unit cell. The Williamson–Hall analysis (Table S1) shows the FWHM of the α-Al (111) peak narrows from 0.31° to 0.23° upon T6 in Alloy A (versus only 0.33°→0.26° in Alloy B), demonstrating a more complete dislocation annihilation and strain relief in the Cu-rich matrix during solutionizing (530 °C, 8 h). The pseudo-Voigt fitting of the 38.0–39.0° window (Figure S2, Table S1) separates the two contributions: the integrated area of Al2Cu (211) falls by ≈ 75% (0.18→0.04 a.u.), while that of α-Al (111) increases slightly (1.00→1.08 a.u.). This confirms that the post-T6 increase in the composite peak intensity arises from both the removal of the Al2Cu shoulder and the sharpening of the α-Al reflection. The measured lattice constant (a) of Alloy A decreased after the heat treatment, providing quantitative evidence for the incorporation of Cu into the Al lattice and the resultant solid solution strengthening. As the atomic radius of Cu (0.128 nm) is smaller than that of Al (0.143 nm), the Cu substitution induces local lattice distortion and impedes the dislocation motion, thereby contributing to enhanced mechanical strength through the formation of internal stress fields [20,21].
In contrast, Alloy B retained pronounced Mg2Si diffraction peaks even after the T6 treatment, indicating that Mg predominantly remained in a precipitated form rather than dissolving into the Al matrix. This behavior is consistent with the fact that the Mg content in Alloy B exceeded the maximum solubility limit of Mg in Al (~1.8 wt.% at 450 °C), resulting in the stabilization of Mg2Si as a secondary phase under the given thermal conditions. Therefore, in Alloy B, the dominant strengthening mechanism is likely governed by precipitation hardening rather than solid solution strengthening. Moreover, after T6 the composite peak at ~40° 2θ (overlapping Al (111) and Si (111)) intensified markedly in Alloy A, whereas Alloy B showed only a modest increase (see purple-boxed inset in Figure 1b). This marked increase can be understood as the result of two successive, Cu-mediated processes: first, during the solutionizing step at 530 °C, the high Cu concentration accelerates the recovery of the Al matrix by promoting the vacancy-assisted dislocation climb and annihilation, thereby reducing the lattice microstrain and sharpening the α-Al (111) reflection; second, in the aging stage at 175 °C, the same enhanced diffusion kinetics facilitate the rapid coalescence of fragmented eutectic Si into larger, well-oriented spheroids, which constructively add to the overlapping α-Al (111) signal. Together, these sequential effects of strain relief followed by Si spheroidization amplify the 40° 2θ peak intensity in the Cu-rich Alloy A relative to Alloy B. Furthermore, thermodynamic simulations (Figure S1) and EPMA maps (Figure 2) elucidate the contrasting Mg2Si behavior: Alloy A (Cu:Mg = 3:1) dissolves the Q-phase (Al5Cu2Mg8Si6) nearly completely, sequestering Mg in a solid solution, whereas Alloy B (1:3) retains the residual Q-phase, leaving excess Mg to precipitate as coarse Mg2Si during aging. Consequently, Alloy B exhibits stronger Mg2Si reflections at (200), (220), and (400), while Alloy A forms only fine Mg2Si, which is consistent with the precipitation hardening in Alloy B and the solid solution strengthening in Alloy A.

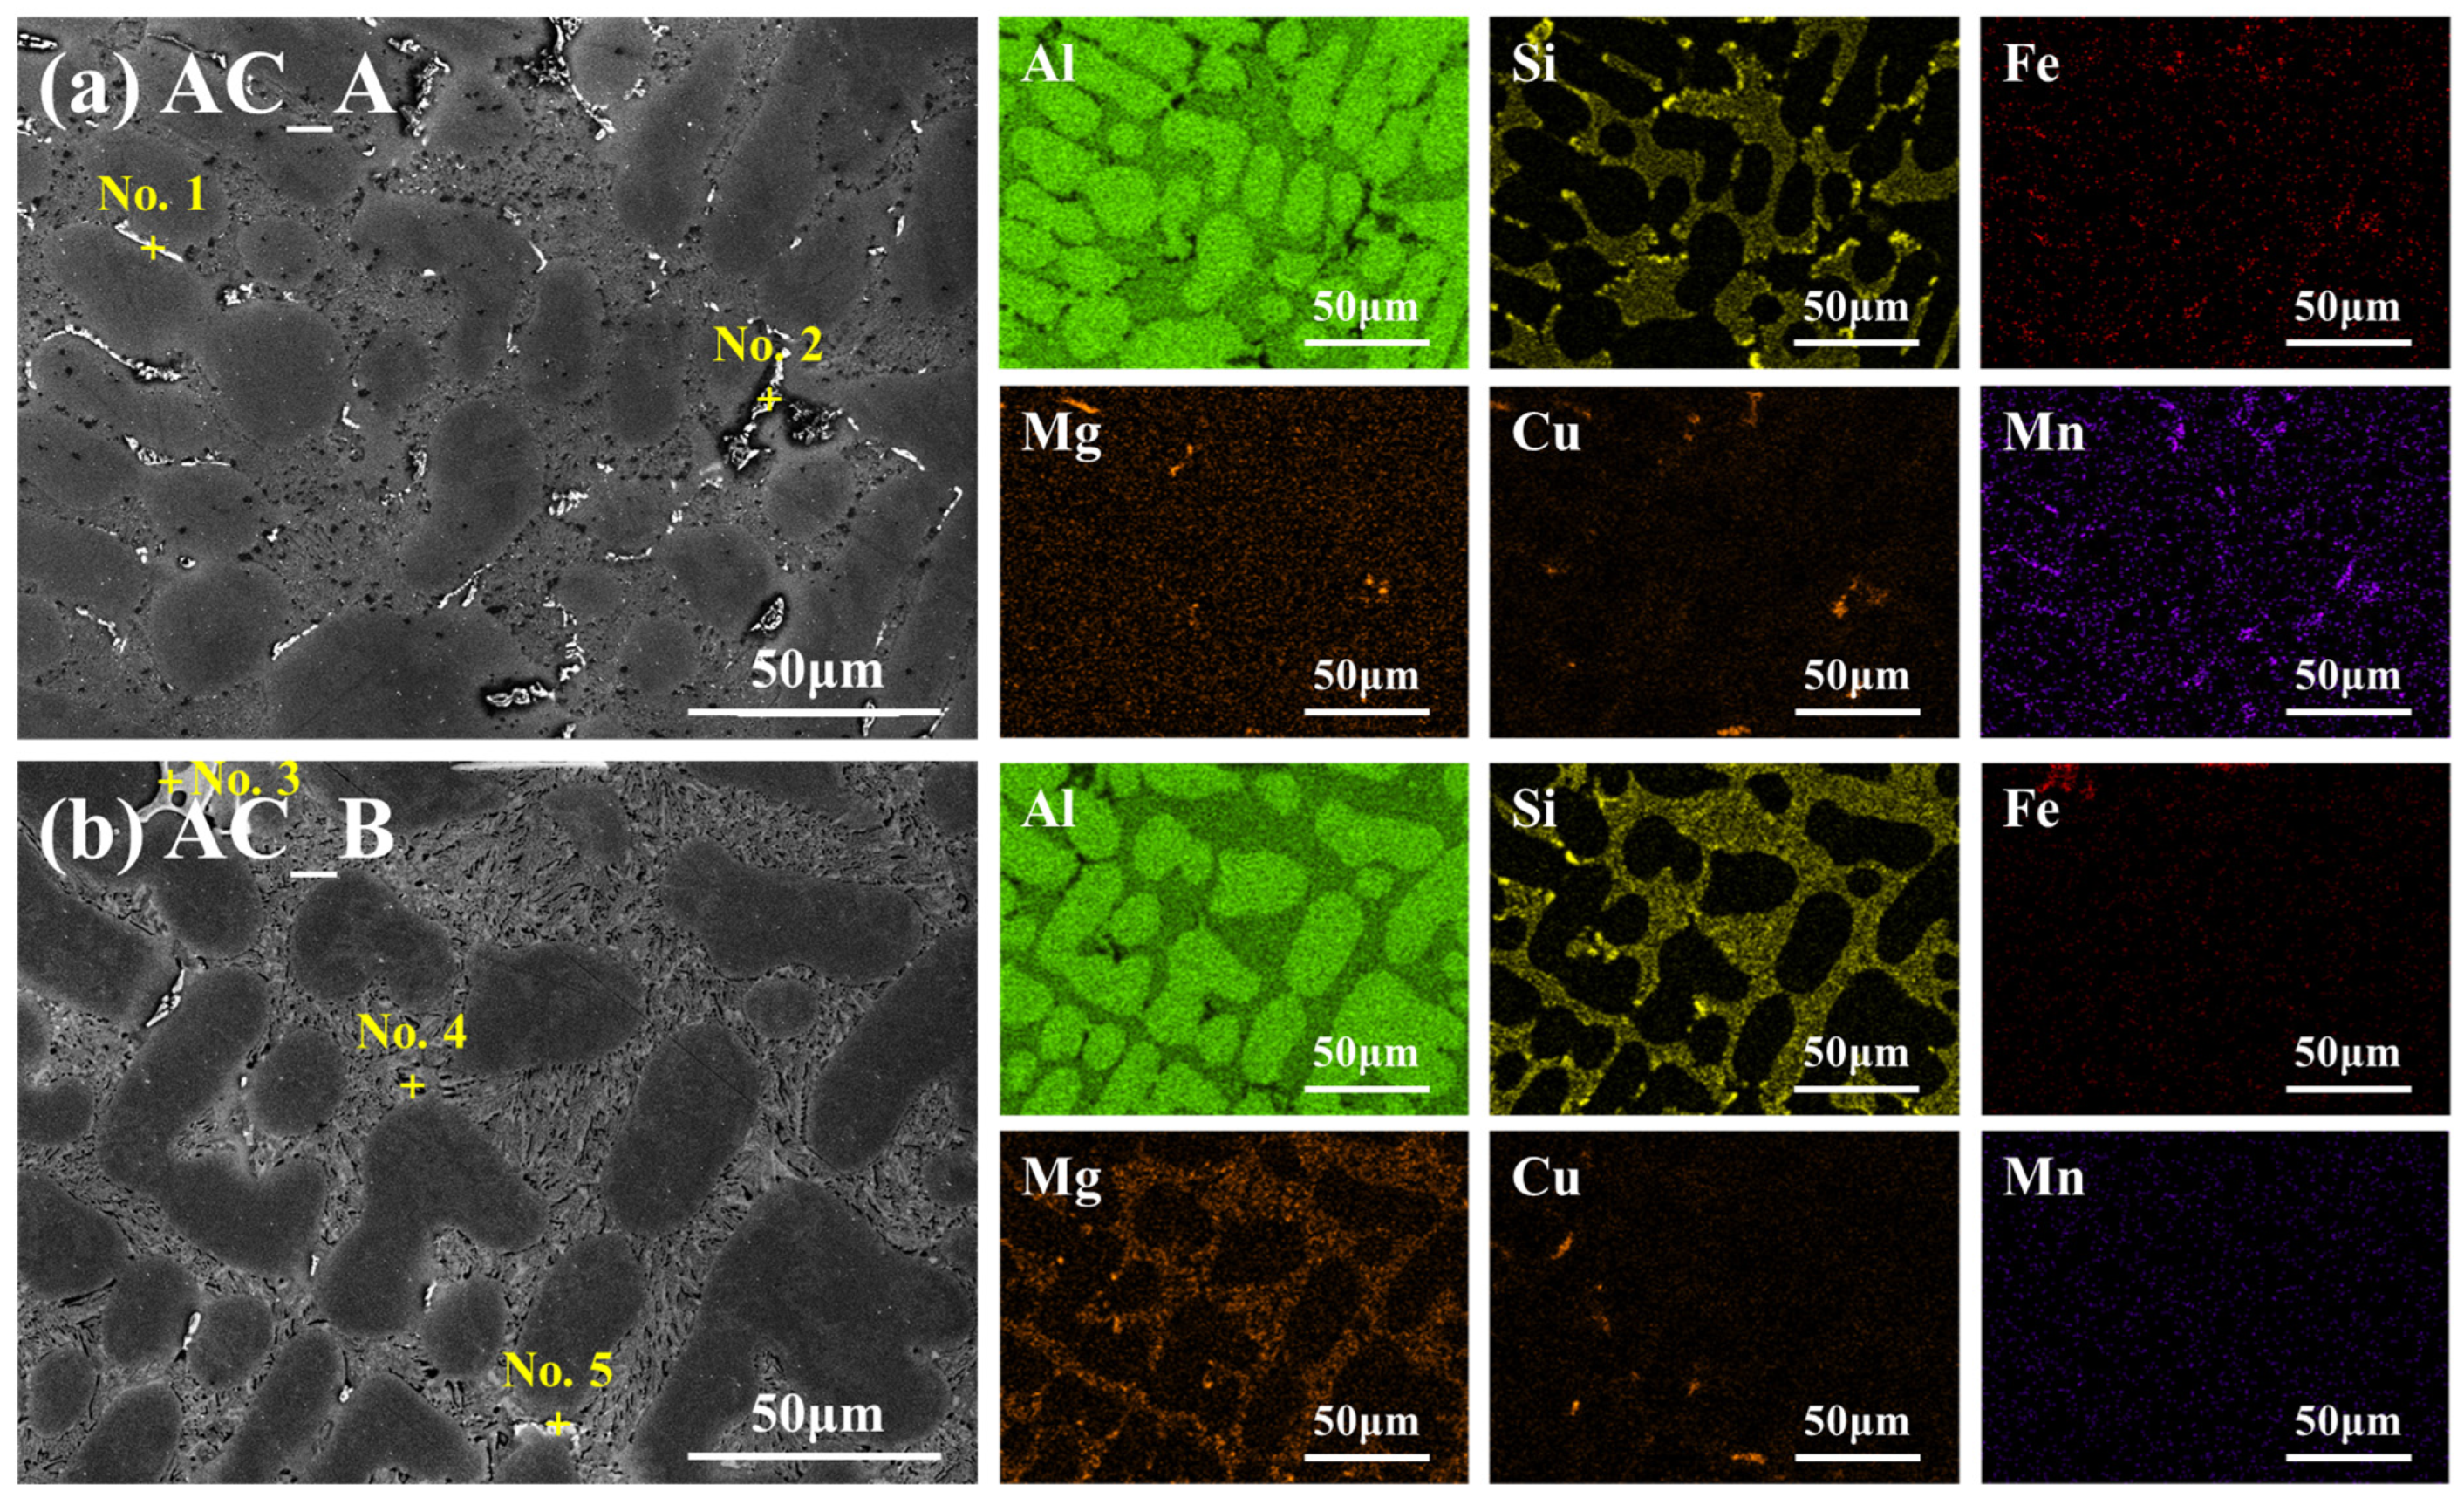
3.1.2. Microstructural Features in the As-Cast Condition

The as-cast microstructures and representative intermetallic compounds in Al–Si–(Cu)–Mg alloys (Alloy A and Alloy B) are shown in Figure 2 and Table 3. Both alloys exhibited typical eutectic architectures, characterized by a dendritic α-Al matrix interlaced with a three-dimensional network of eutectic Si along interdendritic regions. Several intermetallic phases were also identified coexisting within the matrix.
In Alloy A, the α-Al(FeMn)Si phase was uniformly distributed, appearing in globular or irregular morphologies. The EDS analysis at point No. 1 (Fe:Mn = 4.13:6.87 wt.%) confirmed the effective substitution of Mn within the α-phase. This phase is thermodynamically more stable than β-AlFeSi and plays a beneficial role in maintaining microstructural stability at elevated temperatures by enhancing the load transfer and serving as a crack-bridging structure. The presence of Mn regulates the Fe precipitation behavior, suppresses the formation of brittle β-AlFeSi, and thereby improves the mechanical strength and wear resistance.
In contrast, Alloy B exhibited a widespread presence of lamellar and clustered Mg2Si precipitates, resulting from the supersaturation of Mg beyond its solubility limit. The EDS analysis at point No. 6 (Mg: 32.97 wt.%, Si: 36.27 wt.%) confirmed a stoichiometric composition representative of Mg2Si. These precipitates formed sharp interfaces with the surrounding matrix, likely serving as preferential sites for stress concentration. Additionally, intermetallic compounds containing both Fe and Mg were detected in localized regions, suggesting the formation of Fe–Mg complex phases or the partial incorporation of Mg into the β-AlFeSi structure. These microstructural features indicate that Alloy B possesses a higher degree of heterogeneity and localized softening potential compared to Alloy A, particularly under high-temperature conditions.

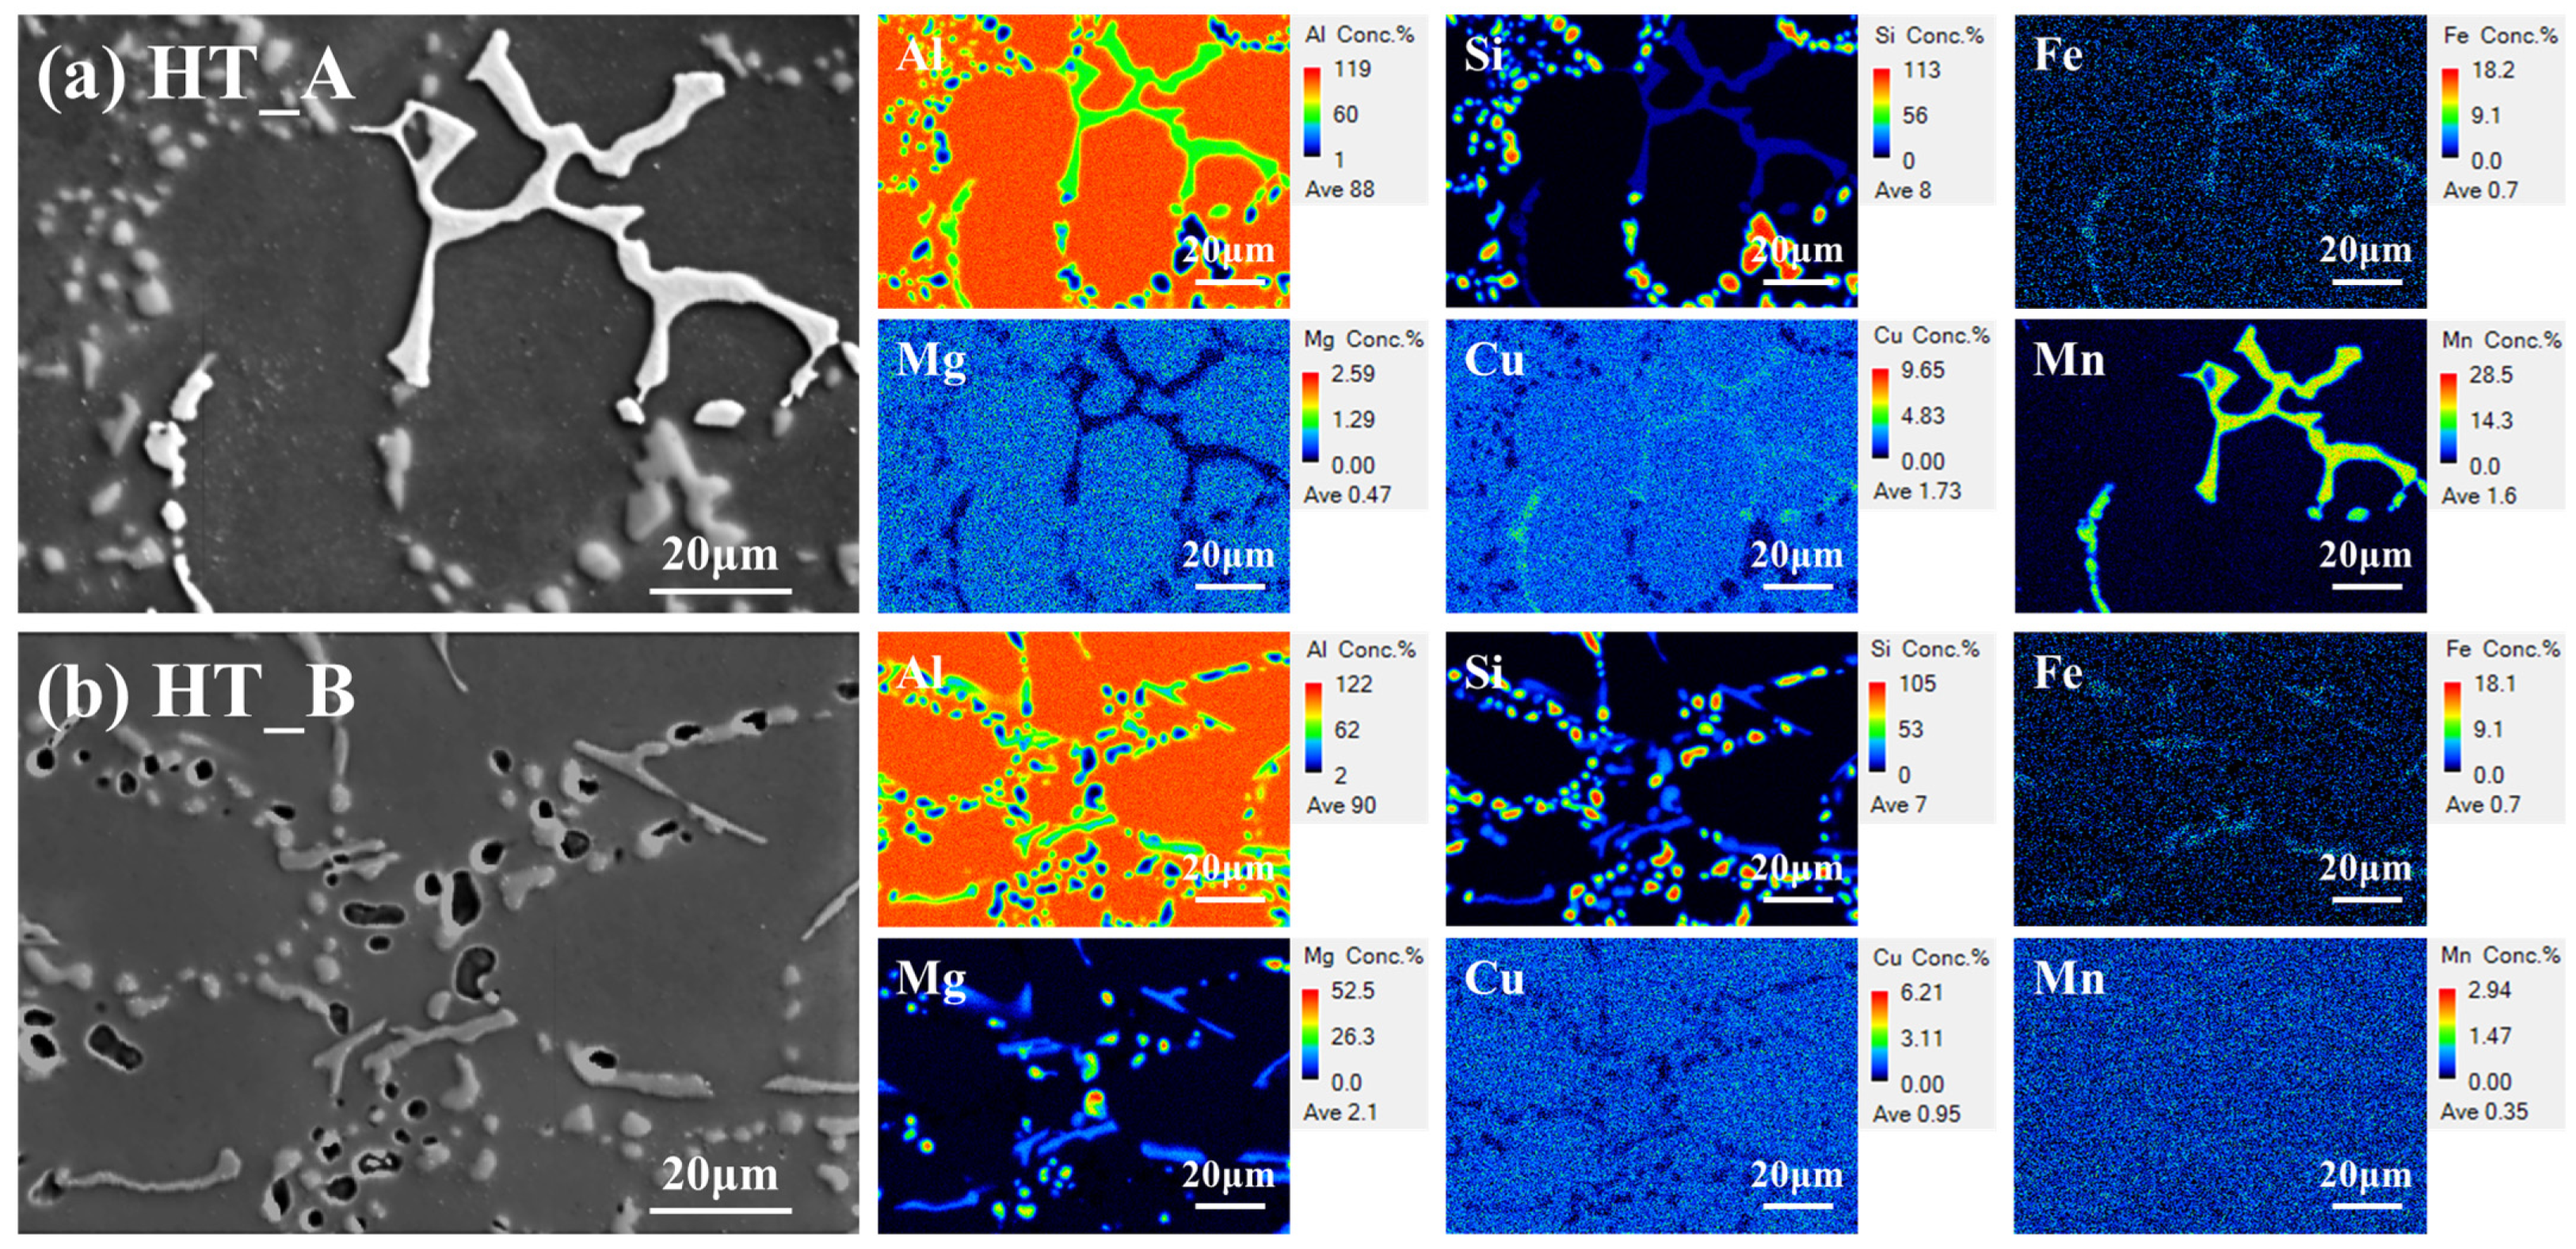
3.1.3. Microstructural Evolution After T6 Heat Treatment

The microstructural and elemental distribution characteristics of Al–Si–(Cu)–Mg alloys (Alloy A and Alloy B) after the T6 heat treatment are illustrated in Figure 3. Both alloys displayed clear differences in the redistribution of alloying elements and in the evolution of strengthening phases, particularly those involving Cu and Mg.
In Alloy A, Cu-rich intermetallics (e.g., Al2Cu) were either fully dissolved or significantly refined during the heat treatment. The EPMA elemental mapping (Figure 3a) revealed that Cu was homogeneously distributed throughout the Al matrix, indicating a substitutional solid solution. The uniform dispersion of Cu within the lattice suggests that Cu atoms diffused effectively into the Al matrix, inducing lattice distortion and thereby enhancing dislocation pinning at elevated temperatures—a mechanism conducive to solid solution strengthening.
In contrast, Alloy B retained localized Cu-rich phases even after the heat treatment (Figure 3b), suggesting the insufficient dissolution of Cu due to its lower initial content and limited diffusivity. This incomplete solid solution process indicates that Cu was not fully incorporated into the Al lattice, thus limiting its strengthening contribution in Alloy B.
Mg distribution patterns also revealed significant differences between the two alloys. In Alloy A, Mg was relatively uniformly dissolved within the Al matrix, with only fine and sparsely distributed Mg2Si precipitates observed. The α-Al(FeMn)Si phase remained thermodynamically stable after the heat treatment, indicating that Mn effectively modified the precipitation behavior of Fe by suppressing the formation of brittle β-AlFeSi, thus contributing to mechanical and microstructural stability.
Conversely, in Alloy B, Mg2Si precipitates became coarser and more pronounced following the heat treatment, accompanied by widespread regions of Mg-rich agglomeration. Moreover, the lamellar β-AlFeSi phase persisted after the heat treatment with little observable change in the morphology or distribution. Such microstructural features—particularly coarse precipitates and sharp phase boundaries—may act as stress concentration sites and nucleation points for microcracks, potentially deteriorating the wear resistance and mechanical stability, especially under high-temperature conditions.

3.2. Mechanical Behavior

3.2.1. Hardness Evolution at Elevated Temperatures

The variation in the hardness of the Al–Si–(Cu)–Mg alloys as a function of temperature was investigated using Vickers microhardness testing. As summarized in Table 4, both Alloy A and Alloy B exhibited a gradual decline in hardness with an increasing temperature. At room temperature, the average hardness values were 120 ± 6.5 HV for Alloy A and 115 ± 5.4 HV for Alloy B, suggesting that Alloy A possessed a superior initial hardness and, potentially, enhanced wear resistance under ambient conditions.
As the temperature increased to 150 °C and 250 °C, both alloys showed a marked decrease in hardness, with reductions of nearly 50% relative to their room temperature values. This degradation is primarily attributed to the thermally activated coarsening of intermetallic phases and the softening of the Al matrix. Two primary mechanisms are considered responsible for the observed thermal softening:
First, elevated temperatures promote increased atomic diffusion within the Al matrix, thereby weakening the solid solution strengthening effects of Cu and Mg. At 250 °C in particular, the diffusion of these solute atoms out of the Al lattice reduces their contribution to the lattice distortion and dislocation resistance, leading to a pronounced drop in hardness. Second, intermetallic phases such as Fe–Mn–Si and Mg2Si may undergo thermal instability, including phase decomposition or coarsening. As a result, fine precipitates that initially contributed to strengthening lose their effectiveness, leading to a further reduction in hardness.
Due to the microstructural heterogeneity and relatively poor mechanical performance of the as-cast alloys, all subsequent tensile and wear evaluations were conducted on specimens in the T6 heat-treated condition. This choice reflects the improved microstructural uniformity and precipitate stability achieved through the heat treatment, offering a more representative assessment of the materials’ performance under service-like conditions.

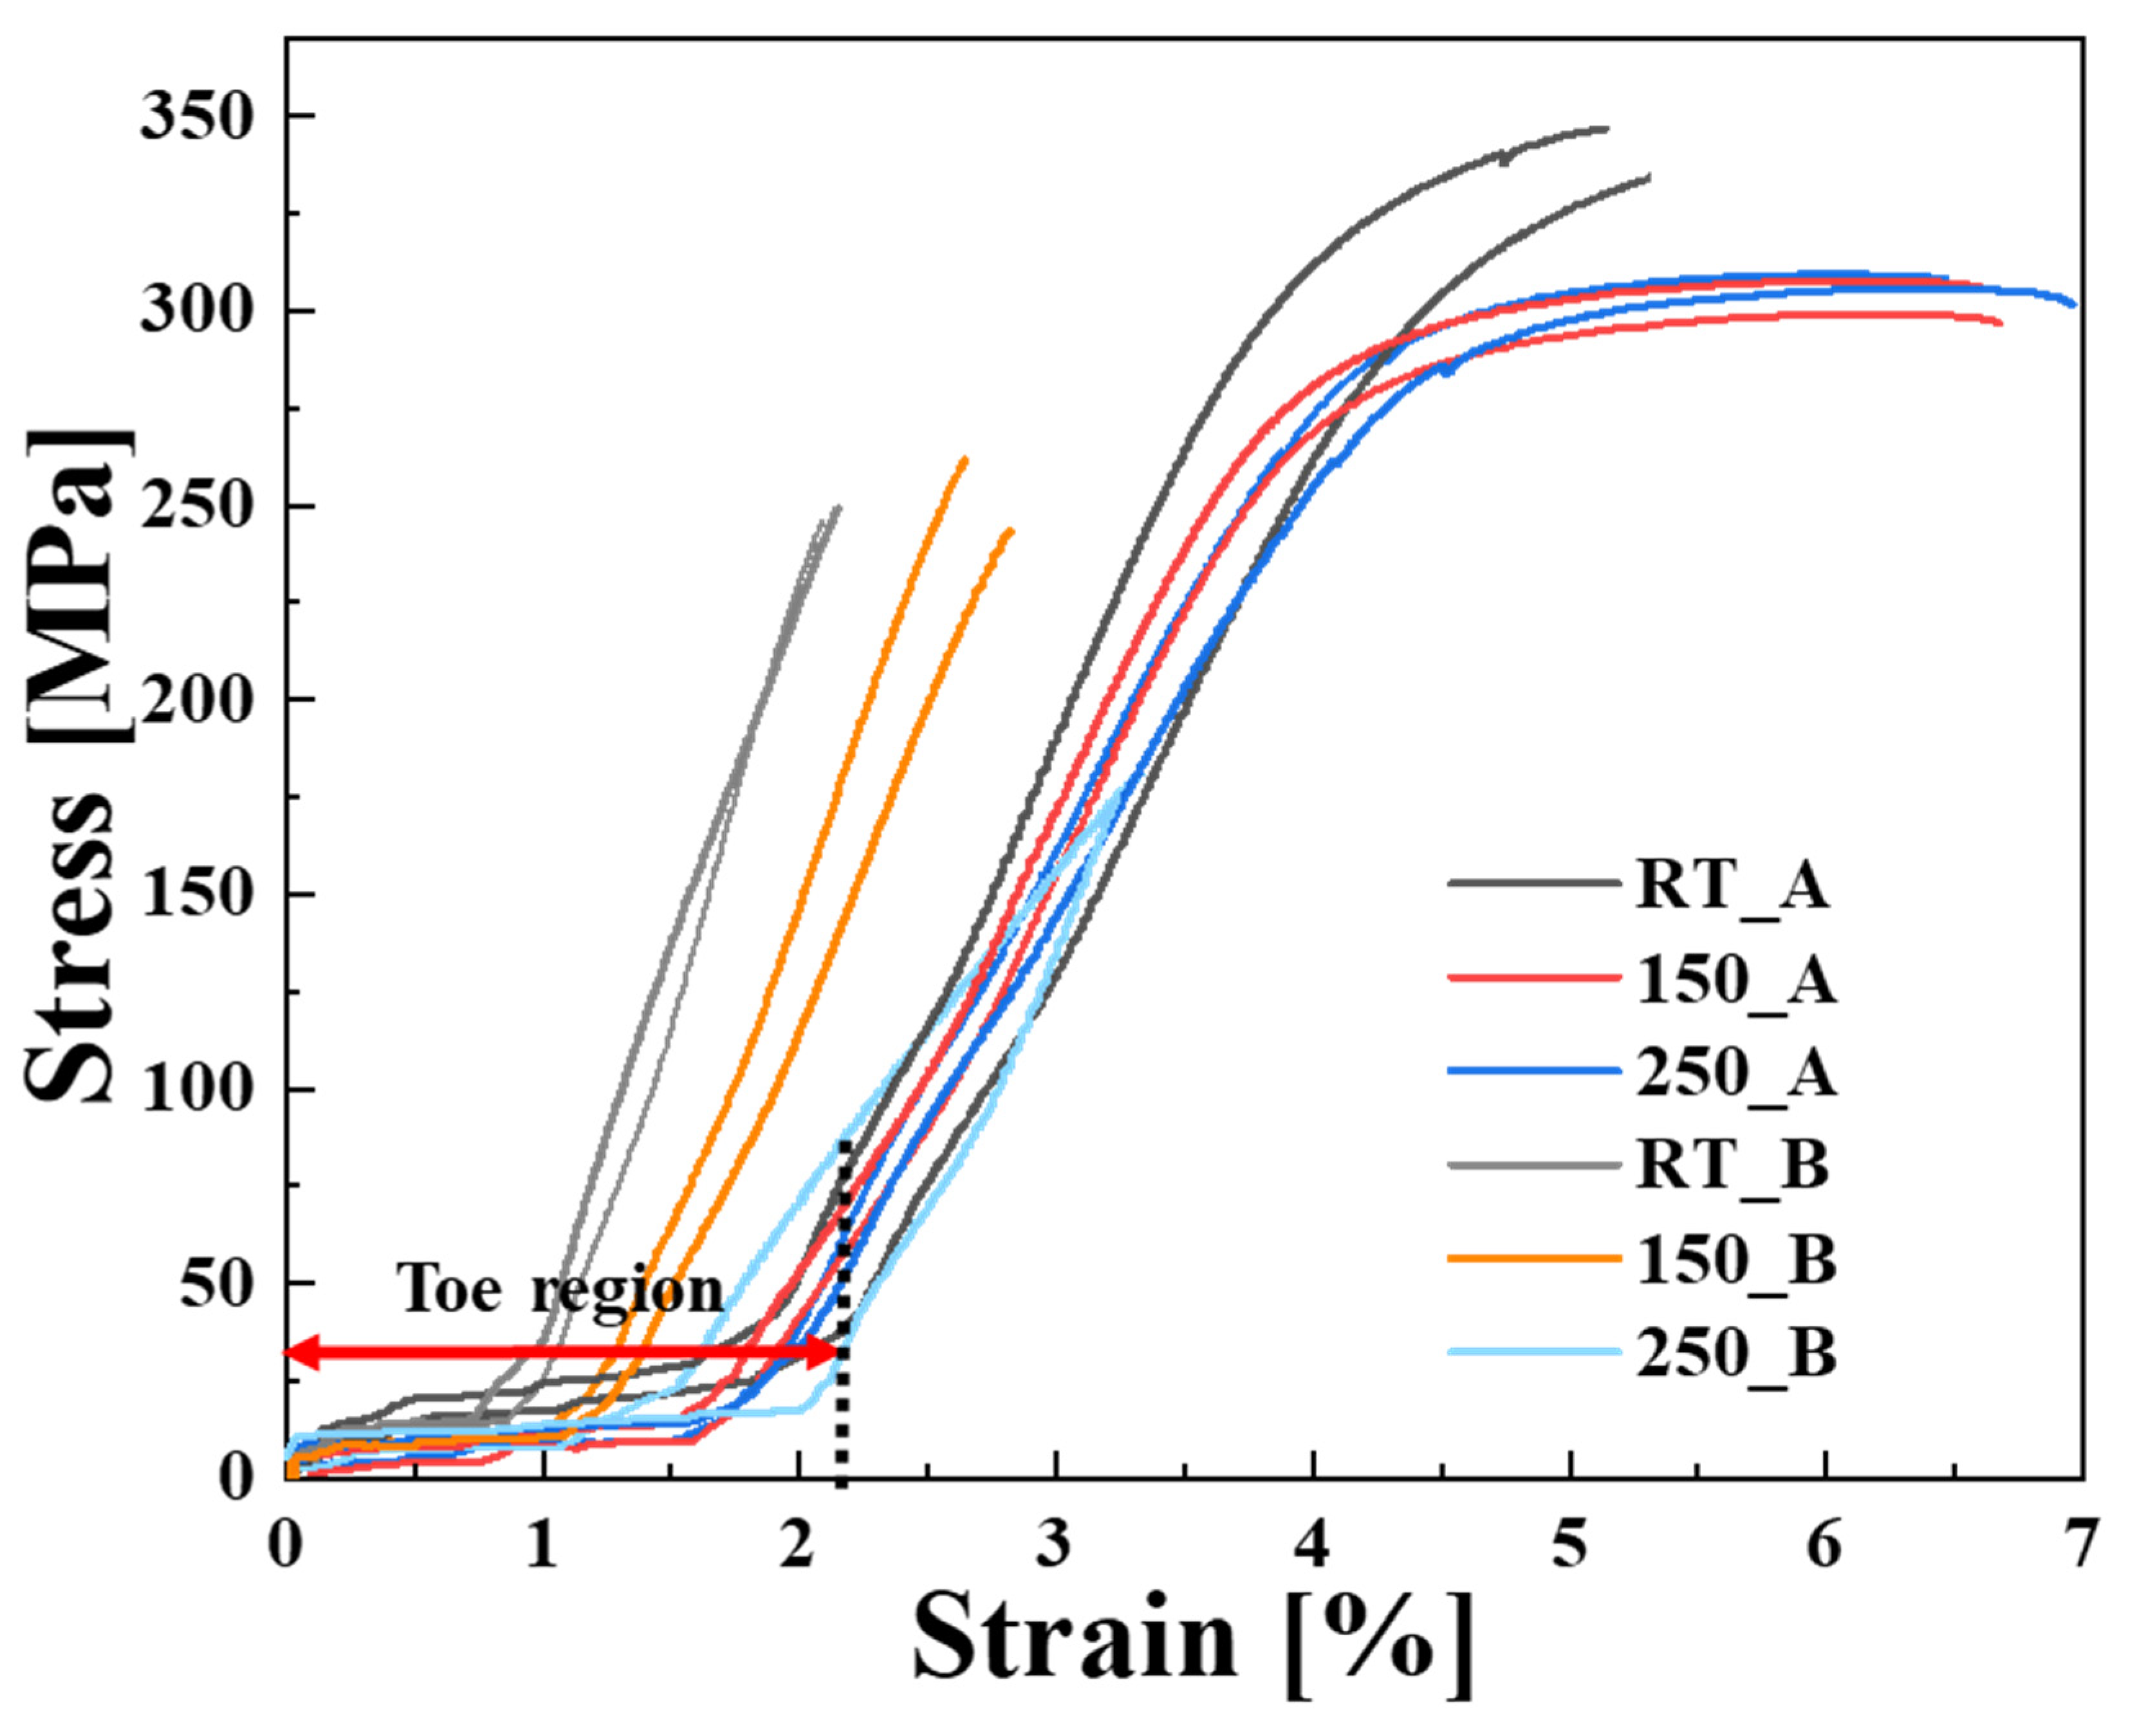
3.2.2. Elevated Temperature Tensile Behavior

Figure 4, which presents two representative stress–strain curves for each alloy at 25 °C, 150 °C, and 250 °C, and Table 5 summarize the tensile response of the hypoeutectic Al–Si–(Cu)–Mg alloys. Both materials show the expected thermal softening: the ultimate tensile strength (UTS), yield strength (YS), and elongation to fracture (EL) decrease monotonically as the temperature rises, owing to the increased matrix ductility and the coarsening of intermetallic phases that collectively lower dislocation resistance. As shown in Table 5, at room temperature, Alloy A attains 347.01 ± 7.56 MPa (UTS), 227.74 ± 3.12 MPa (YS), and 5.03 ± 0.16% (EL), markedly exceeding Alloy B (277.85 ± 4.26 MPa, 123.98 ± 2.81 MPa, 2.12 ± 0.11%). This difference is primarily attributed to the uniform solid solution of Cu in Alloy A, which induces lattice distortion and enhances strength via solid solution strengthening. Furthermore, the stable distribution of α-Al(FeMn)Si phases in Alloy A contributes to load transfer and crack resistance. In contrast, the presence of brittle β-AlFeSi and agglomerated Mg2Si in Alloy B promotes stress concentration, thereby reducing both strength and ductility.
The disparity persists at elevated temperatures. At 150 °C and 250 °C, Alloy A maintains relatively high tensile properties—343.27 ± 5.27 MPa (UTS), 227.62 ± 2.89 MPa (YS), and 4.26 ± 0.21% (EL) at 150 °C and 306.68 ± 4.45 MPa, 176.87 ± 3.41 MPa, and 6.55 ± 0.20% at 250 °C, demonstrating the robust retention of the mechanical integrity at elevated temperatures. This resilience is ascribed to the retention of Cu in the solid solution together with the thermal stability of the α-Al(FeMn)Si skeleton, which collectively suppress strain localization. Conversely, Alloy B shows a pronounced decline (150 °C: 249.45 ± 7.81 MPa, 112.27 ± 3.21 MPa, 3.12 ± 0.12%; 250 °C: 229.92 ± 4.98 MPa, 106.30 ± 2.71 MPa, 3.43 ± 0.18%), a consequence of the Mg2Si coarsening and the persistence of brittle β-AlFeSi plates, both of which increase the structural heterogeneity and local brittleness.
The analysis of the engineering stress–strain curves (Figure 4) revealed that Alloy A maintained a noticeable strain-hardening region after yielding, indicative of uniform plastic deformation. In contrast, Alloy B showed an immediate stress saturation or sharp post-yield softening at elevated temperatures, suggesting the early onset of necking due to localized softening and the presence of brittle intermetallics.
Both alloys exhibited an extended toe region in the initial stage of the stress–strain curve, with a more pronounced effect observed in Alloy B. This phenomenon implies a delayed load transfer and plastic deformation initiation, influenced by the alloy’s initial ductility and phase distribution. While a higher ductility generally correlates with a longer toe region [15,22], the presence of brittle phases, such as Mg2Si and β-AlFeSi, may induce heterogeneous deformation and localized stress shielding, thereby contributing to delayed yielding [15,22].

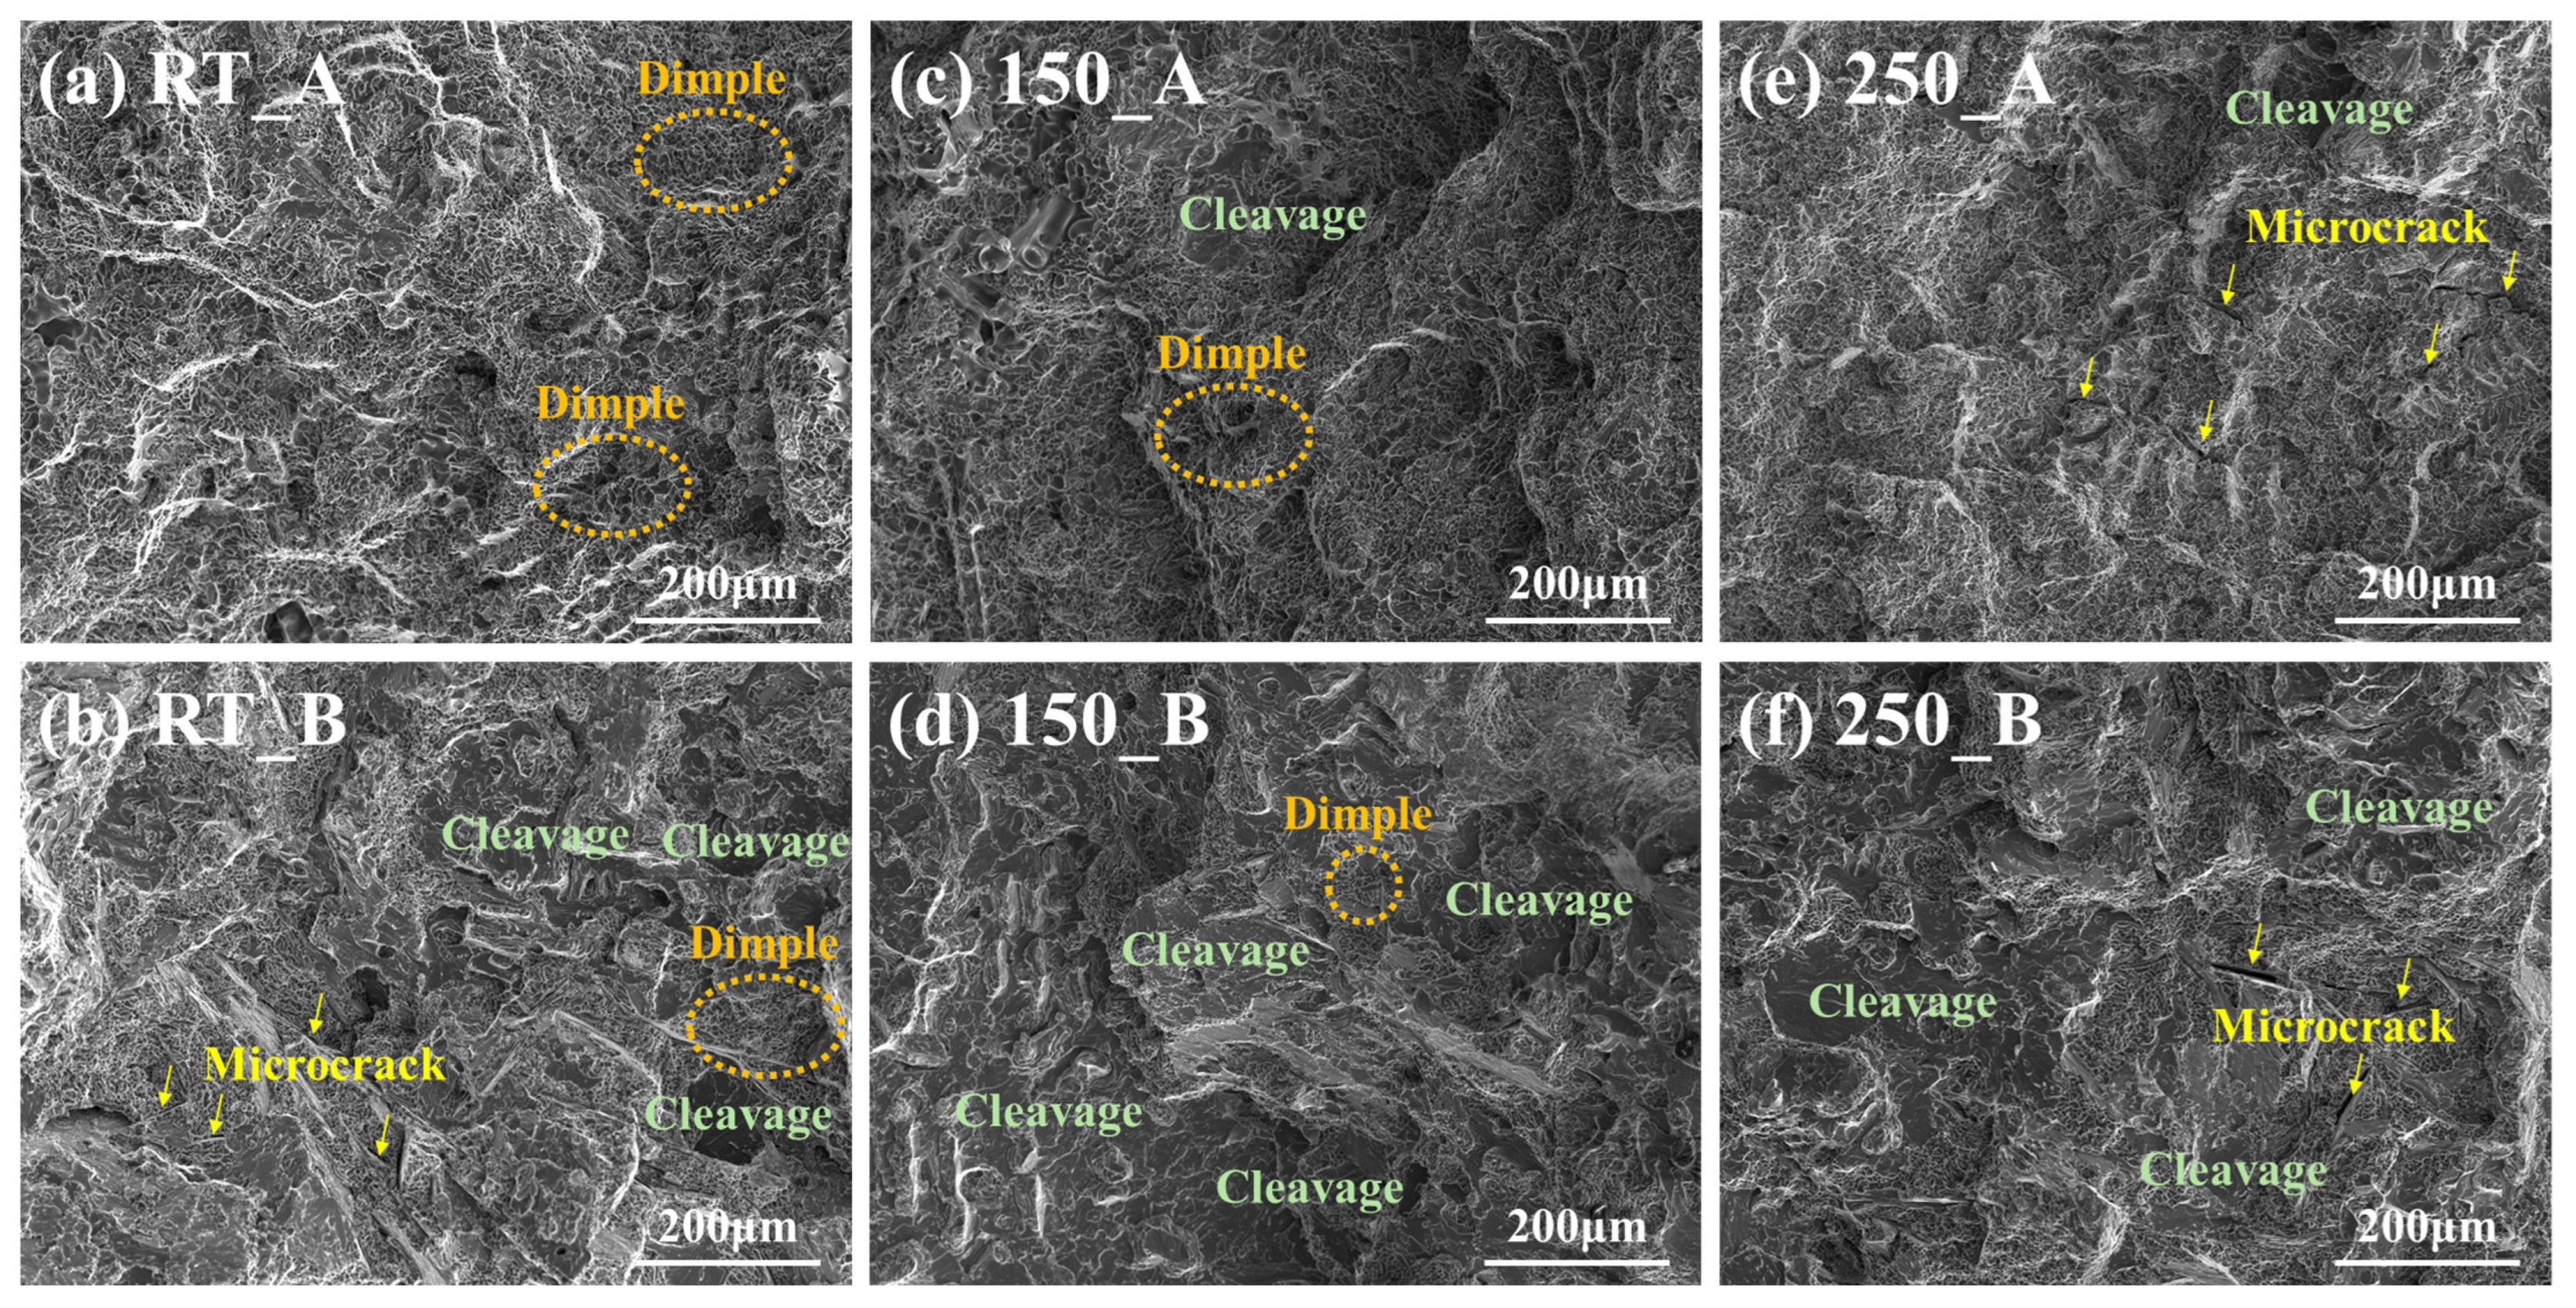
3.2.3. Fractographic Analysis

The fracture surfaces of Al–Si–(Cu)–Mg alloys (Alloy A and Alloy B) following the tensile testing at room temperature (RT), 150 °C, and 250 °C were examined via SEM and are presented in Figure 5. The images provide visual evidence of the fundamental differences in the fracture behavior between the two alloys under various temperature conditions.
Alloy A exhibited a predominantly ductile fracture mode across all temperatures, characterized by a uniform distribution of deep and densely populated dimples on the fracture surfaces (Figure 5a,c,e). This ductile behavior is attributed to a synergistic effect of the homogeneous Cu solid solution within the Al matrix, which induces lattice distortion, and the presence of finely dispersed α-Al(FeMn)Si phases that assist in stress delocalization. These features act as crack deflection and bridging mechanisms, delaying crack initiation and propagation and thereby enhancing both the ductility and high-temperature fracture resistance.
In contrast, Alloy B consistently exhibited features of brittle fractures under all tested conditions (Figure 5b,d,f). The fracture surfaces were dominated by cleavage facets, numerous microcracks, and irregular crack propagation paths. These characteristics suggest that acicular β-AlFeSi phases and agglomerated Mg2Si precipitates acted as stress concentrators, promoting interfacial debonding and early failure. Notably, the β-AlFeSi phase remained thermally stable and persisted along grain boundaries, serving as a preferential crack path even at elevated temperatures.
With the increasing temperature, Alloy A showed minor evidence of localized cleavage and crater formation; however, the prevalence of dimples indicated that the ductile behavior was retained. In contrast, Alloy B underwent severe thermal embrittlement, with cracks propagating rapidly along phase boundaries and through brittle constituents.
The stark contrast in the fracture behavior is attributed to differences in the type, distribution, and thermal stability of strengthening phases. The α-Al(FeMn)Si phase contributes to ductility by dispersing stress and bridging cracks, whereas the β-AlFeSi and Mg2Si phases promote brittleness by concentrating stress and disrupting grain boundary cohesion. Particularly, the spheroidized α-Al(FeMn)Si structure in Alloy A provides an effective crack-bridging capability, significantly improving the fracture toughness.

3.3. Tribological Properties

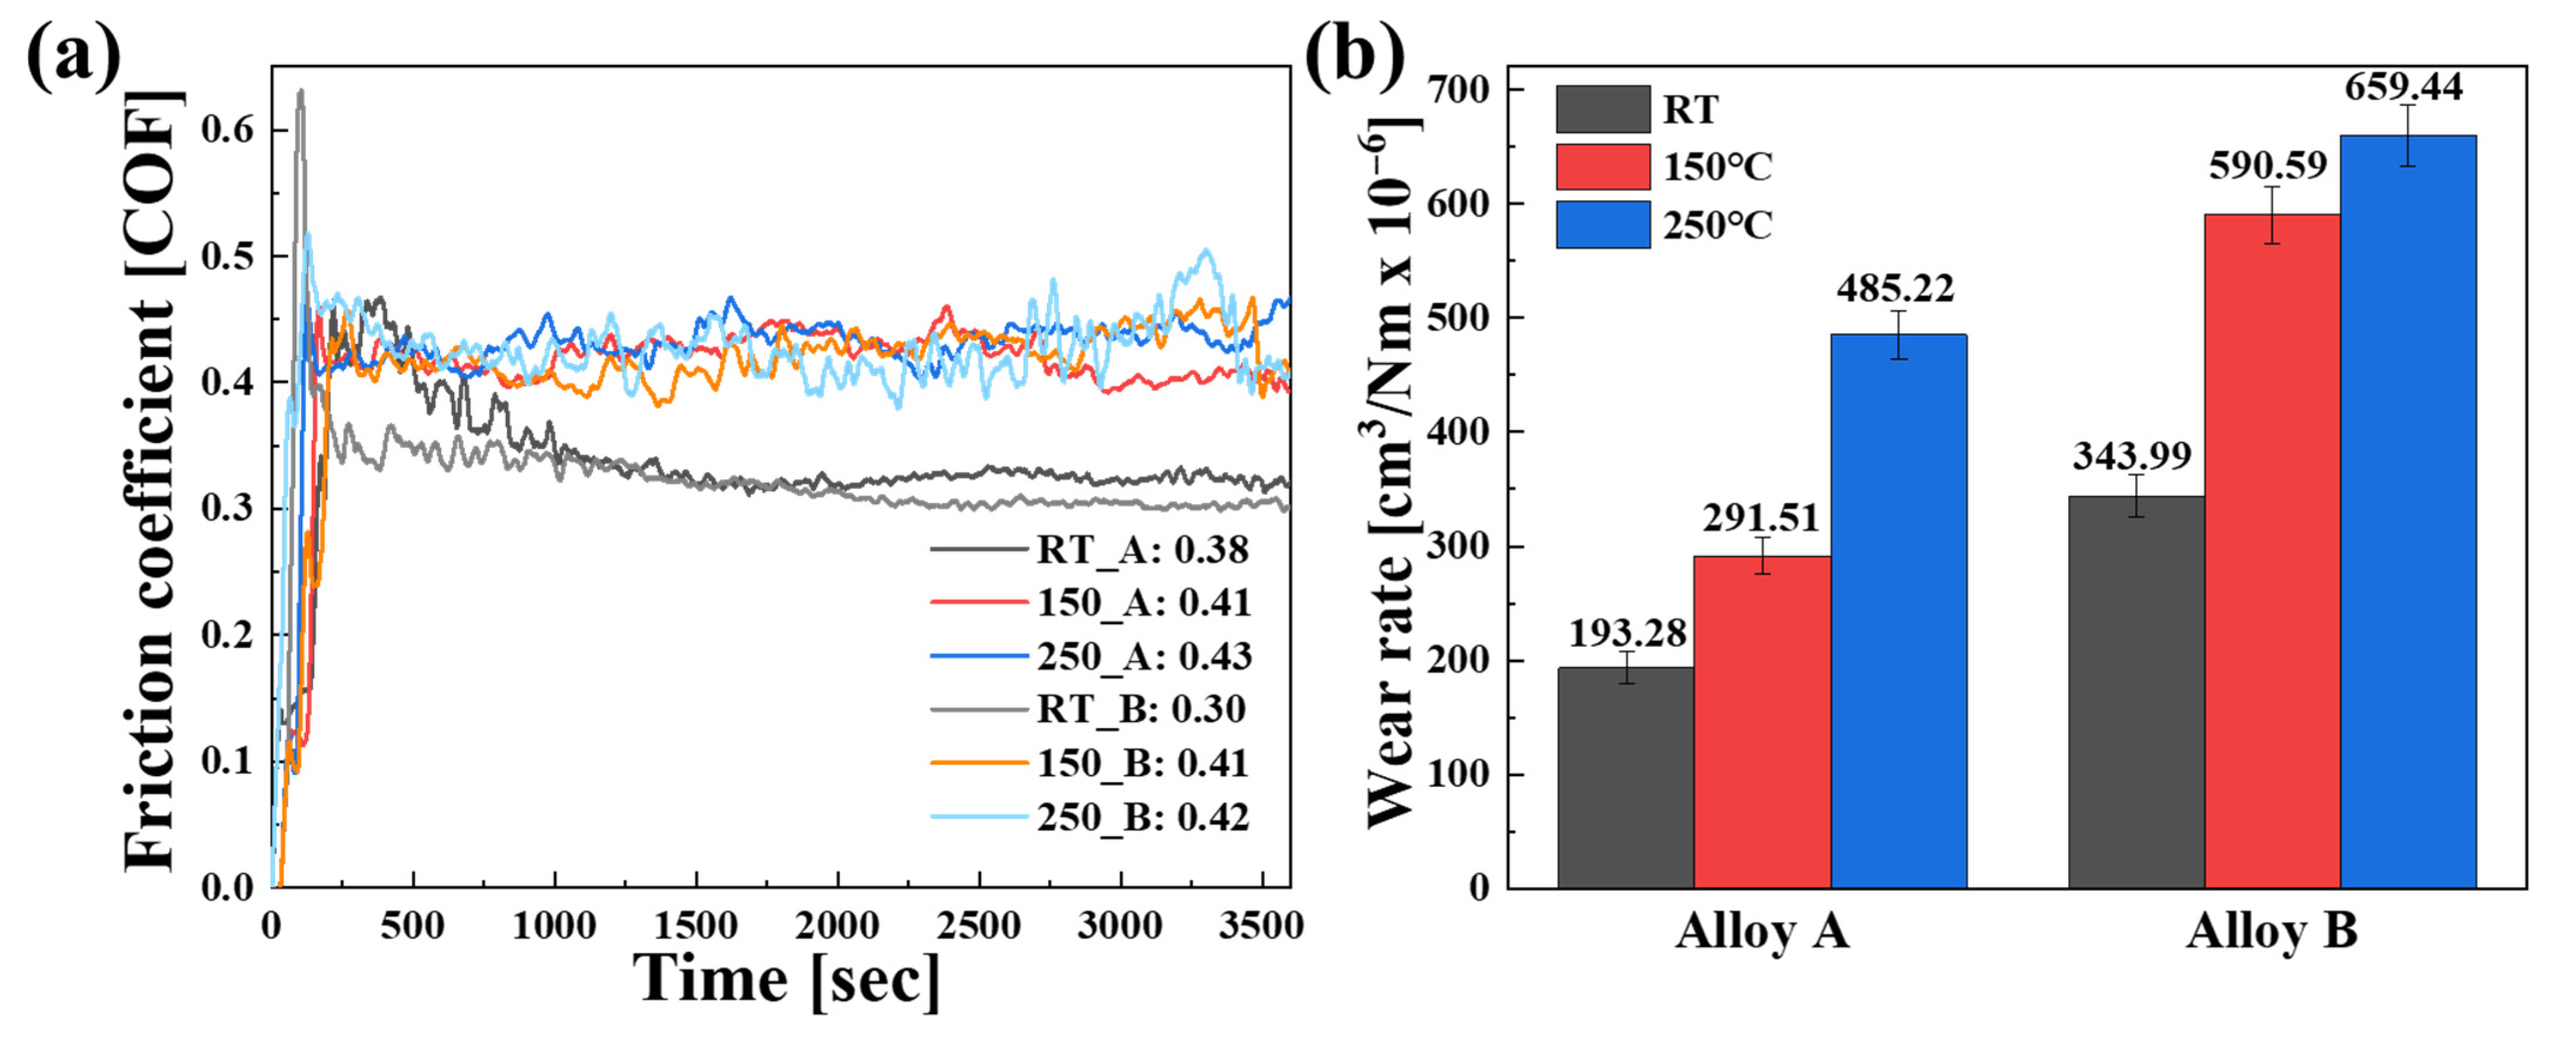
3.3.1. Friction Coefficient and Wear Rate

To quantitatively assess the high-temperature tribological performance of the Al–Si–(Cu)–Mg alloys, the average friction coefficient (COF) and wear rate were measured at 25 °C, 150 °C, and 250 °C (Figure 6a,b). The tests aimed to elucidate the influence of the microstructural stability, interfacial behavior, and thermal effects on tribological responses. Both COF and wear rate values were determined based on the steady-state region, excluding the initial run-in period.
The wear rate was calculated using Equation (1):
W e a r   R a t e   W R = V F · d
where V is the wear volume (mm3), F is the applied load (N), and d is the sliding distance (m).
At room temperature, Alloy A exhibited a COF of 0.38 and a wear rate of 485.22 × 10⁻⁶ mm3/N·m, whereas Alloy B showed a lower COF of 0.30 but a significantly higher wear rate of 659.44 × 10⁻⁶ mm3/N·m. The relatively higher COF of Alloy A is attributed to the enhanced shear resistance caused by the lattice distortion due to the uniformly dissolved Cu, along with the effective stress dispersion provided by finely distributed α-Al(FeMn)Si phases. In contrast, the presence of β-AlFeSi and agglomerated Mg2Si in Alloy B likely resulted in non-uniform interfacial bonding, leading to a lower COF and increased wear due to particle detachment.
At 150 °C, the COF for both alloys increased to 0.41, reflecting greater surface plasticity and interfacial adhesion due to thermal softening. Despite this, Alloy A maintained a relatively low wear rate of 561.15 × 10⁻⁶ mm3/N·m, supported by stable tribofilm formation and a preserved microstructure. Alloy B, although momentarily benefiting from the pseudo-lubricating effects of Mg2Si, exhibited a slightly higher wear rate of 590.59 × 10⁻⁶ mm3/N·m, likely due to the progressive impact of the microstructural heterogeneity.
Under high-temperature conditions (250 °C), the distinction in the tribological performance became more pronounced. The thermal softening of the Al matrix and the coarsening of intermetallics significantly influenced the wear behavior. Alloy A exhibited a moderate increase in the COF (0.43) and wear rate (615.03 × 10⁻⁶ mm3/N·m), demonstrating relatively controlled degradation. In contrast, Alloy B experienced a severe decline in wear resistance, with the COF reaching 0.42 and the wear rate increasing sharply to 823.67 × 10⁻⁶ mm3/N·m. This deterioration is attributed to the fragmentation of acicular β-AlFeSi phases under the thermal stress and surface cracking induced by coarsened Mg2Si particles, which facilitated crack propagation and material removal.

3.3.2. Wear Track Morphology

To further investigate the structural response of Al–Si–(Cu)–Mg alloys during high-temperature sliding, three-dimensional optical profilometry was performed to quantify the wear track depth and width after ball-on-disk testing (Figure 7).
At room temperature (25 °C), Alloy A exhibited a wear depth of 24.37 μm and a track width of 1044.24 μm, revealing a shallow and uniform wear morphology. This behavior is attributed to an effective shear resistance and load distribution, which were enhanced by the homogeneous Cu solid solution-induced lattice contraction and the stable dispersion of α-Al(FeMn)Si phases within the Al matrix. In contrast, Alloy B displayed significantly deeper and wider wear tracks (depth: 44.52 μm; width: 1362.51 μm), suggesting an accelerated surface degradation due to the local stress concentration induced by acicular β-AlFeSi phases and agglomerated Mg2Si precipitates.
At 150 °C, Alloy A maintained relatively controlled wear dimensions (depth: 32.80 μm; width: 975.13 μm), whereas Alloy B exhibited a severe wear progression (depth: 55.33 μm; width: 1838.45 μm). The pronounced damage in Alloy B is ascribed to the coarsening of Mg2Si and the thermal persistence of β-AlFeSi, which promote crack initiation, spalling, and lateral propagation.
Under the 250 °C test condition, Alloy A continued to exhibit stable wear resistance (depth: 31.33 μm; width: 1634.38 μm), likely due to the microstructural stabilization arising from precipitate spheroidization and thermally stable Cu solute atoms. Meanwhile, Alloy B experienced ongoing structural degradation (depth: 53.12 μm; width: 1618.64 μm), indicating a further decline in microstructural integrity.
These differences in the wear morphology are governed not merely by bulk hardness but more critically by the post-heat-treatment microstructural stability and the spatial distribution of intermetallic compounds. In Alloy A, the uniformly dispersed α-Al(FeMn)Si phases—often in the Chinese-script morphology—and consistent Cu solubility enhanced the load bearing and deformation resistance. In contrast, Alloy B retained structurally vulnerable features, including clustered Mg2Si and acicular β-AlFeSi phases, which facilitated localized stress intensification and crack propagation.

3.3.3. Surface Wear Mechanism Evolution with Temperature

Figure 8 shows SEM images of the wear track surfaces for Alloy A and Alloy B under various temperature conditions (RT, 150 °C, 250 °C), illustrating the temperature-dependent transitions in dominant wear mechanisms.
At room temperature, Alloy A primarily experienced abrasive wear (Figure 8a), with the wear tracks displaying uniformly distributed shallow grooves and fine scratch marks. This behavior is linked to the increased shear resistance and load distribution facilitated by the lattice distortion from the uniformly dissolved Cu and the dispersion of thermally stable α-Al(FeMn)Si phases. In contrast, Alloy B (Figure 8b) exhibited a combination of adhesive and delamination wear, characterized by adhered debris, plastic flow features, spalling pits, and layered delamination tracks. These patterns suggest that the stress concentration induced by agglomerated Mg2Si and β-AlFeSi phases accelerated the surface failure.
At 150 °C, both alloys exhibited transitions in wear mechanisms due to thermal softening. Alloy A (Figure 8c) continued to display abrasive wear as the dominant mechanism, but crater-like features, delamination zones, and plastic deformation bands began to emerge, indicating localized deformation in the softened matrix. Owing to its more stable microstructure, Alloy A retained a considerable wear resistance. Conversely, Alloy B (Figure 8d) remained dominated by adhesive and delamination wear. While clustered Mg2Si particles may have temporarily acted as pseudo-lubricants, their thermal instability at elevated temperatures led to a rapid decline in the tribological performance.
At 250 °C, both alloys transitioned predominantly to adhesive wear. In Alloy A (Figure 8e), softened matrix zones formed near the wear surface, and localized delamination cracks and craters became more evident. Abrasive features diminished, while the plastic flow-induced surface deformation increased. Alloy B (Figure 8f) exhibited a complex mixture of spalling, delamination, adhesion, and plastic deformation. Coarsened β-AlFeSi and agglomerated Mg2Si phases fragmented under cyclic loading, destabilizing the tribofilm and facilitating crack initiation. As a result, the wear track morphology in Alloy B became highly irregular, with an increased wear depth and width compared to Alloy A.
Across all temperature conditions, the appearance of spalling pits and scuffing traces indicated that repeated frictional loading, in conjunction with the oxide film breakdown and particle detachment, contributed to the wear track instability. Wear debris accumulated within craters is indicative of tribofilm breakdown and reformation cycles, which are closely correlated with fluctuations in the friction coefficient during sliding.

4. Conclusions

This study quantitatively clarified how tailoring the Cu:Mg mass ratio reshapes the solidification path, precipitation sequence, and service behavior of hypoeutectic Al–Si cast alloys designed for an elevated-temperature wear service. After the heat treatment, the Cu-rich alloy (Cu:Mg = 3:1) preserved a thermally stable α-Al(FeMn)Si network and maintained supersaturated Cu in a solid solution, whereas the Mg-rich alloy (1:3) developed coarse, lamellar Mg2Si together with brittle β-AlFeSi residues. These contrasting microstructures produced divergent properties. At 25 °C the Cu-rich alloy reached an ultimate tensile strength (UTS) of 280 MPa, a yield strength (YS) of 240 MPa, an elongation (EL) of 4.2%, and a hardness of 108 HV, outperforming its Mg-rich counterpart (210 MPa, 144 MPa, 2.2%, 88 HV). The strength retention at 150 °C and 250 °C followed the same trend: 165 MPa versus 124 MPa at 250 °C. Tribological tests conducted under a constant normal load of 10 N (5 cm s−1, 25–250 °C) showed that friction coefficients remained within 0.38–0.43 for the Cu-rich alloy versus 0.30–0.42 for the Mg-rich alloy, while specific wear rates were consistently lower for the Cu-rich material—6.15 × 10⁻⁴ mm3 N−1 m−1 at 250 °C compared with 8.24 × 10⁻⁴ mm3 N−1 m−1. Importantly, at the fixed load the wear rate displayed an inverse relation to both the bulk hardness and UTS (∆WR ≈ −7 × 10⁻⁵ mm3 N−1 m−1 for every 10 HV or 40 MPa increase), whereas greater elongation correlated with a shorter run-in period but did not significantly affect the steady-state wear. The SEM and 3D-profilometry confirmed that the Cu-rich matrix forms a stable, oxide-rich tribofilm and suppresses delamination, whereas the eutectic-free paths and β-AlFeSi fragmentation dominate the Mg-rich alloy. Collectively, the data demonstrate that a Cu-dominant chemistry favors solid solution strengthening, fine network phase reinforcement, and thermally robust tribofilms, providing a clear performance margin over a Mg-dominant alloy governed by coarse Mg2Si precipitation. Overall, this work identifies the Cu:Mg ratio as a key lever for balancing solid solution versus precipitation hardening and elucidates its quantitative impact on the coupled metrics of strength, ductility, and wear resistance. The findings offer a compositionally guided microstructural design strategy for developing heat-resistant Al–Si alloys with predictable wear behavior under elevated-temperature and dynamic loading conditions.

Supplementary Materials

The following supporting information can be downloaded at: https://www.mdpi.com/article/10.3390/app15148047/s1, Figure S1. JMatPro results: (a) Al–Si isopleth showing the hypoeutectic window, with the red-boxed region enlarged as an inset, and phase-fraction–temperature profiles for (b) Alloy A and (c) Alloy B. Figure S2. Peak deconvolution of the overlapping α-Al (111) and Al2Cu (211) reflections in the 38.0–39.0° 2θ window for (b) as-cast Alloy A (AC_A) and (c) T6-treated Alloy A (HT_A). Raw data are shown as black line, the total pseudo-Voigt fit as a red line, the α-Al (111) component as a blue line, and the Al2Cu (211) component as a green line. Table S1. Chemical composition of hypoeutectic Al–Si–(Cu)–Mg alloys with varying Cu:Mg ratios (wt. %).

Author Contributions

Conceptualization Methodology, J.B.; Software, J.B.; Validation, J.B. and E.L.; Formal Analysis, J.B.; Investigation, J.B.; Resources, J.B., Y.K. and E.L.; Data Curation, J.B.; Writing—Original Draft Preparation, J.B.; Writing—Review and Editing, J.B.; Visualization, J.B.; Supervision, Y.K. and E.L.; Project Administration, Y.K. and E.L.; Funding Acquisition, E.L. All authors have read and agreed to the published version of the manuscript.

Funding

This research was financially supported by the Institute of Civil Military Technology Cooperation funded by the Defense Acquisition Program Administration and Ministry of Trade, Industry and Energy of Korean government under grant No. UE241118TD.

Institutional Review Board Statement

Not applicable.

Informed Consent Statement

Not applicable.

Data Availability Statement

The data presented in this study is available on request from the corresponding author.

Conflicts of Interest

The authors declare no conflicts of interest.

References

  1. Liu, F.; Chen, S.; Dong, Q.; Qin, J.; Li, Z.; Zhang, B.; Nagaumi, H. Tailoring Microstructure and Mechanical Properties of Al-Mg-Si-Cu Alloy with Varying Mn and/or Cr Additions. Mater. Sci. Eng. A 2024, 892, 146053. [Google Scholar] [CrossRef]
  2. Niu, T.; Zhou, L.; Hu, H.; Gao, W.; Sun, Y.; Zou, G.; Zu, Q.; Chen, H.; Wang, P.; Peng, Q. Nano-Twinned Silicon in Al-Si Alloys for High Wear-Resistance. Wear 2024, 558–559, 205559. [Google Scholar] [CrossRef]
  3. Na, Y.; Pradhan, S.K.; Park, J.-S.; Oh, M.-S. Corrosion behavior of Zn, Zn-Mg-Al, and Al-Si alloy coated steel sheet in a simulated marine environment. J. Adv. Mar. Eng. Technol. 2024, 48, 302–309. [Google Scholar] [CrossRef]
  4. Huang, Z.-L.; Wang, K.; Zhang, Z.-M.; Li, B.; Xue, H.-S.; Yang, D.-Z. Effects of Mg Content on Primary Mg2si Phase in Hypereutectic Al–Si Alloys. Trans. Nonferrous Met. Soc. China 2015, 25, 3197–3203. [Google Scholar] [CrossRef]
  5. Hu, P.; Pan, L.; Chen, X.G. Elevated-Temperature Performances of Al-Si-Cu Casting Alloys for Cylinder Head Applications. Mater. Charact. 2024, 218, 114484. [Google Scholar] [CrossRef]
  6. Kwak, N.; Lim, Y.; Heo, S.; Jeon, C.; Jo, I. Effect of Aging Temperature on Microstructure, Mechanical, and Wear Properties of 18ni-300 Maraging Steel Produced by Powder Bed Fusion. Metals 2024, 14, 375. [Google Scholar] [CrossRef]
  7. Shang, A.; Stegman, B.; Choy, K.; Niu, T.; Shen, C.; Shang, Z.; Sheng, X.; Lopez, J.; Hoppenrath, L.; Zhang, B.P.; et al. Additive Manufacturing of an Ultrastrong, Deformable Al Alloy with Nanoscale Intermetallics. Nat. Commun. 2024, 15, 5122. [Google Scholar] [CrossRef] [PubMed]
  8. Zamani, M.; Seifeddine, S.; Jarfors, A.E.W. High Temperature Tensile Deformation Behavior and Failure Mechanisms of an Al–Si–Cu–Mg Cast Alloy—The Microstructural Scale Effect. Mater. Des. 2015, 86, 361–370. [Google Scholar] [CrossRef]
  9. Zhang, M.; Wang, D.; Nagaumi, H.; Wang, R.; Zhang, X.; Zhou, P.; Wu, F.; Zhang, B. Achieving Excellent Strength-Ductility in Al–Si–Cu–Mg Cast Alloy Via Effective Work Hardening. Mater. Sci. Eng. A 2024, 889, 145840. [Google Scholar] [CrossRef]
  10. Tu, W.; Tang, J.; Lu, F.; Ma, L.; Wang, S.; Chen, Y.; Zhan, X.; Xu, P. Study on Precipitation and Corrosion Behavior of Al-1.0mg-0.6si(-0.3cu) Alloys by Sn Addition Modification. J. Alloys Compd. 2025, 1024, 180120. [Google Scholar] [CrossRef]
  11. Wu, Y.; Yan, B.; Han, Y.; Sun, J.; Jiang, M.; Zu, G.; Zhu, W.; Ran, X. “High-Temperature Tensile Properties of Cu-Modified Alsi10mg Alloy Fabricated by Selective Laser Melting. J. Alloys Compd. 2024, 1001, 175190. [Google Scholar] [CrossRef]
  12. Abdelaziz, M.H.; Elgallad, E.M.; Doty, H.W.; Samuel, F.H. Strengthening Precipitates and Mechanical Performance of Al–Si–Cu–Mg Cast Alloys Containing Transition Elements. Mater. Sci. Eng. A 2021, 820, 141497. [Google Scholar] [CrossRef]
  13. Wang, G.; Cao, J.; Zhou, Y.; Tian, N. Effects of Mg Content on Microstructure, Mechanical Properties and Fracture Behavior of Wrought Al–8si–(<0.01–1.32)Mg Alloy Sheets in T6 Temper. J. Alloys Compd. 2023, 960, 170818. [Google Scholar]
  14. Alshammari, T.T.; Ijaz, M.F.; Alharbi, H.F.; Soliman, M.S. Effect of the Cu/Mg Ratio on Mechanical Properties and Corrosion Resistance of Wrought Al–Cu–Mg–Ag Alloy. Crystals 2023, 13, 908. [Google Scholar] [CrossRef]
  15. Zhang, M.; Tian, Y.; Zheng, X.; Zhang, Y.; Chen, L.; Wang, J. Research Progress on Multi-Component Alloying and Heat Treatment of High Strength and Toughness Al-Si-Cu-Mg Cast Aluminum Alloys. Materials 2023, 16, 1065. [Google Scholar] [CrossRef] [PubMed]
  16. ASTM E384-22; Standard Test Method for Microindentation Hardness of Materials. ASTM International: West Conshohocken, PA, USA, 2017.
  17. ASTM E8/E8M-22; Standard Test Methods for Tension Testing of Metallic Materials. ASTM International: West Conshohocken, PA, USA, 2016.
  18. ASTM G99-17; Standard Test Method for Wear Testing with a Pin-on-Disk Apparatus. ASTM International: West Conshohocken, PA, USA, 2017.
  19. Wei, Z.; Fang, N.; Zou, C.; Wang, H.; Chen, J.; Hu, K. Enhancing Mechanical Performances by Unconventional Si Precipitates Obtained in Pressure-Induced Al-Si-Cu-(Mg) Solid Solutions. Mater. Sci. Eng. A 2023, 877, 145123. [Google Scholar] [CrossRef]
  20. Shi, Z.; Yan, P.; Yan, B. Solidification Mechanism of Microstructure of Al-Si-Cu-Ni Alloy Manuf. by Laser Powder Bed Fusion and Mechanical Properties Effect. Metals 2024, 14, 586. [Google Scholar] [CrossRef]
  21. Ferguson, J.B.; Lopez, H.; Cho, K.; Kim, C.-S. Temperature Effects on the Tensile Properties of Precipitation-Hardened Al-Mg-Cu-Si Alloys. Metals 2016, 6, 43. [Google Scholar] [CrossRef]
  22. Sanchez, J.M.; Arribas, M.; Galarraga, H.; de Cortazar, M.G.; Ellero, M.; Girot, F. Effects of Mn Addittion, Cooling Rate and Holding Temperature on the Modification and Purification of Iron-Rich Compounds in Alsi10mnmg(Fe) Alloy. Heliyon 2023, 9, e13005. [Google Scholar] [CrossRef] [PubMed]
Figure 1. (a) X-ray diffraction (XRD) patterns of Alloy A and Alloy B in the as-cast and T6-treated conditions and (b) Magnified view of the region highlighted by the purple box in (a).
Applsci 15 08047 g001
Figure 2. SEM micrographs and EDS elemental maps of (a) Alloy A and (b) Alloy B in the as-cast condition.
Applsci 15 08047 g002
Figure 3. SEM micrographs and EPMA elemental maps of (a) Alloy A and (b) Alloy B after T6 heat treatment.
Applsci 15 08047 g003
Figure 4. Stress–strain curves of Alloy A and Alloy B obtained at RT, 150 °C, and 250 °C; two representative curves are shown for each condition.
Applsci 15 08047 g004
Figure 5. SEM images of fracture surfaces after tensile testing for Alloy A and Alloy B at different temperatures: (a) Alloy A at RT, (b) Alloy B at RT, (c) Alloy A at 150 °C, (d) Alloy B at 150 °C, (e) Alloy A at 250 °C, and (f) Alloy B at 250 °C.
Applsci 15 08047 g005
Figure 6. (a) Friction coefficient variation and (b) average wear rates of Alloy A and Alloy B at RT, 150 °C, and 250 °C.
Applsci 15 08047 g006
Figure 7. Three-dimensional optical profilometry of wear track morphology of Alloy A and Alloy B at different temperatures: (a) Alloy A at RT, (b) Alloy B at RT, (c) Alloy A at 150 °C, (d) Alloy B at 150 °C, (e) Alloy A at 250 °C, and (f) Alloy B at 250 °C.
Applsci 15 08047 g007
Figure 8. SEM images of wear track surfaces after sliding wear tests at different temperatures: (a) Alloy A at RT, (b) Alloy B at RT, (c) Alloy A at 150 °C, (d) Alloy B at 150 °C, (e) Alloy A at 250 °C, and (f) Alloy B at 250 °C.
Applsci 15 08047 g008
Table 1. Chemical composition of hypoeutectic Al–Si–(Cu)–Mg alloys with varying Cu:Mg ratios (wt.%).
SiCuMgFeMnBal.
Alloy A8.81.60.50.20.5Al
Alloy B90.82.50.20.5Al
Table 2. Test conditions for high-temperature ball-on-disk wear experiments conducted on Alloy A and Alloy B.
MaterialTemperatureCounter BodyCounter Body DiameterLoadSliding RadiusRotational Speed
Alloy A, BRT
150 °C 250 °C
Al2O312.7 mm30 N11.5 mm100 rpm
Table 3. EDS point analysis results of representative intermetallic phases identified in the as-cast microstructures.
No.Compositions (wt.%)Intermetallic
Phase
AlSiFeMgCuMn
166.8422.164.13 6.87α-AlFeMnSi
254.31 19.21 26.48 AlCuFe
362.8816.3820.74 β-Al5FeSi
44.2136.27 59.52 Mg2Si
567.03 32.97 Al2Cu
Table 4. Vickers hardness of Alloy A and Alloy B in as-cast and T6-treated conditions at various temperatures.
Alloy AAlloy B
ConditionTemperature (℃)Hardness (HV)ConditionTemperature (℃)Hardness (HV)
As-castRT97.63 ± 2.81As castRT86.88 ± 4.91
T6 heat treatmentRT139.97 ± 5.96T6 heat treatmentRT128.54 ± 6.54
150 °C120.51 ± 5.09150 °C104.29 ± 6.40
250 °C93.88 ± 7.91250 °C82.26 ± 5.39
Table 5. Average tensile properties of Alloy A and Alloy B after T6 heat treatment: UTS, YS, and EL measured at RT, 150 °C, and 250 °C.
Alloy AAlloy B
Temperature (℃)Tensile Strength (MPa)Yield Strength (MPa)Elongation (%)Temperature (℃)Tensile Strength (MPa)Yield Strength (MPa)Elongation (%)
RT347.01 ± 7.56227.74 ± 3.125.03 ± 0.16RT277.85 ± 4.26123.98 ± 2.552.12 ± 0.11
150 °C343.27 ± 5.28227.62 ± 2.874.26 ± 0.21150 °C249.45 ± 7.81112.27 ± 3.213.12 ± 0. 12
250 °C306.68 ± 4.45176.87 ± 3.416.55 ± 0.20250 °C229.92 ± 4.98106.30 ± 2.713.43 ± 0.18
Disclaimer/Publisher’s Note: The statements, opinions and data contained in all publications are solely those of the individual author(s) and contributor(s) and not of MDPI and/or the editor(s). MDPI and/or the editor(s) disclaim responsibility for any injury to people or property resulting from any ideas, methods, instructions or products referred to in the content.

