Article

Analysis of Surface Roughness of Diamond-Burnished Surfaces Using Kraljic Matrices and Experimental Design

Faculty of Mechanical Engineering and Informatics, University of Miskolc, H-3515 Miskolc, Hungary
*
Author to whom correspondence should be addressed.
Appl. Sci. 2025, 15(14), 8025; https://doi.org/10.3390/app15148025
Submission received: 20 June 2025 / Revised: 12 July 2025 / Accepted: 15 July 2025 / Published: 18 July 2025

Abstract

This study analyzed the surface layer condition of X5CRNI18-10 stainless austenitic chromium–nickel steel test pieces after burnishing. Among the finishing operations, burnishing is an economical and low-environmental-impact process. In special cases, grinding can be replaced by burnishing, so the same roughness can be achieved with much lower environmental impact. The aim of this study is to analyze the roughness of a surface machined by diamond burnishing using Kraljic matrices. The technological parameters used during the burnishing tests were burnishing speed, feed rate, and burnishing force. The full factorial experimental design method was used to carry out the experiments. Using Kraljic matrices, the optimum burnishing force was determined to select the best value of the surface roughness, and the change in surface roughness was investigated using full factorial experimental design for different technological parameter combinations. A special improvement ratio formula was developed to evaluate the effectiveness of the burnishing process with respect to 2D and 3D roughness parameters.

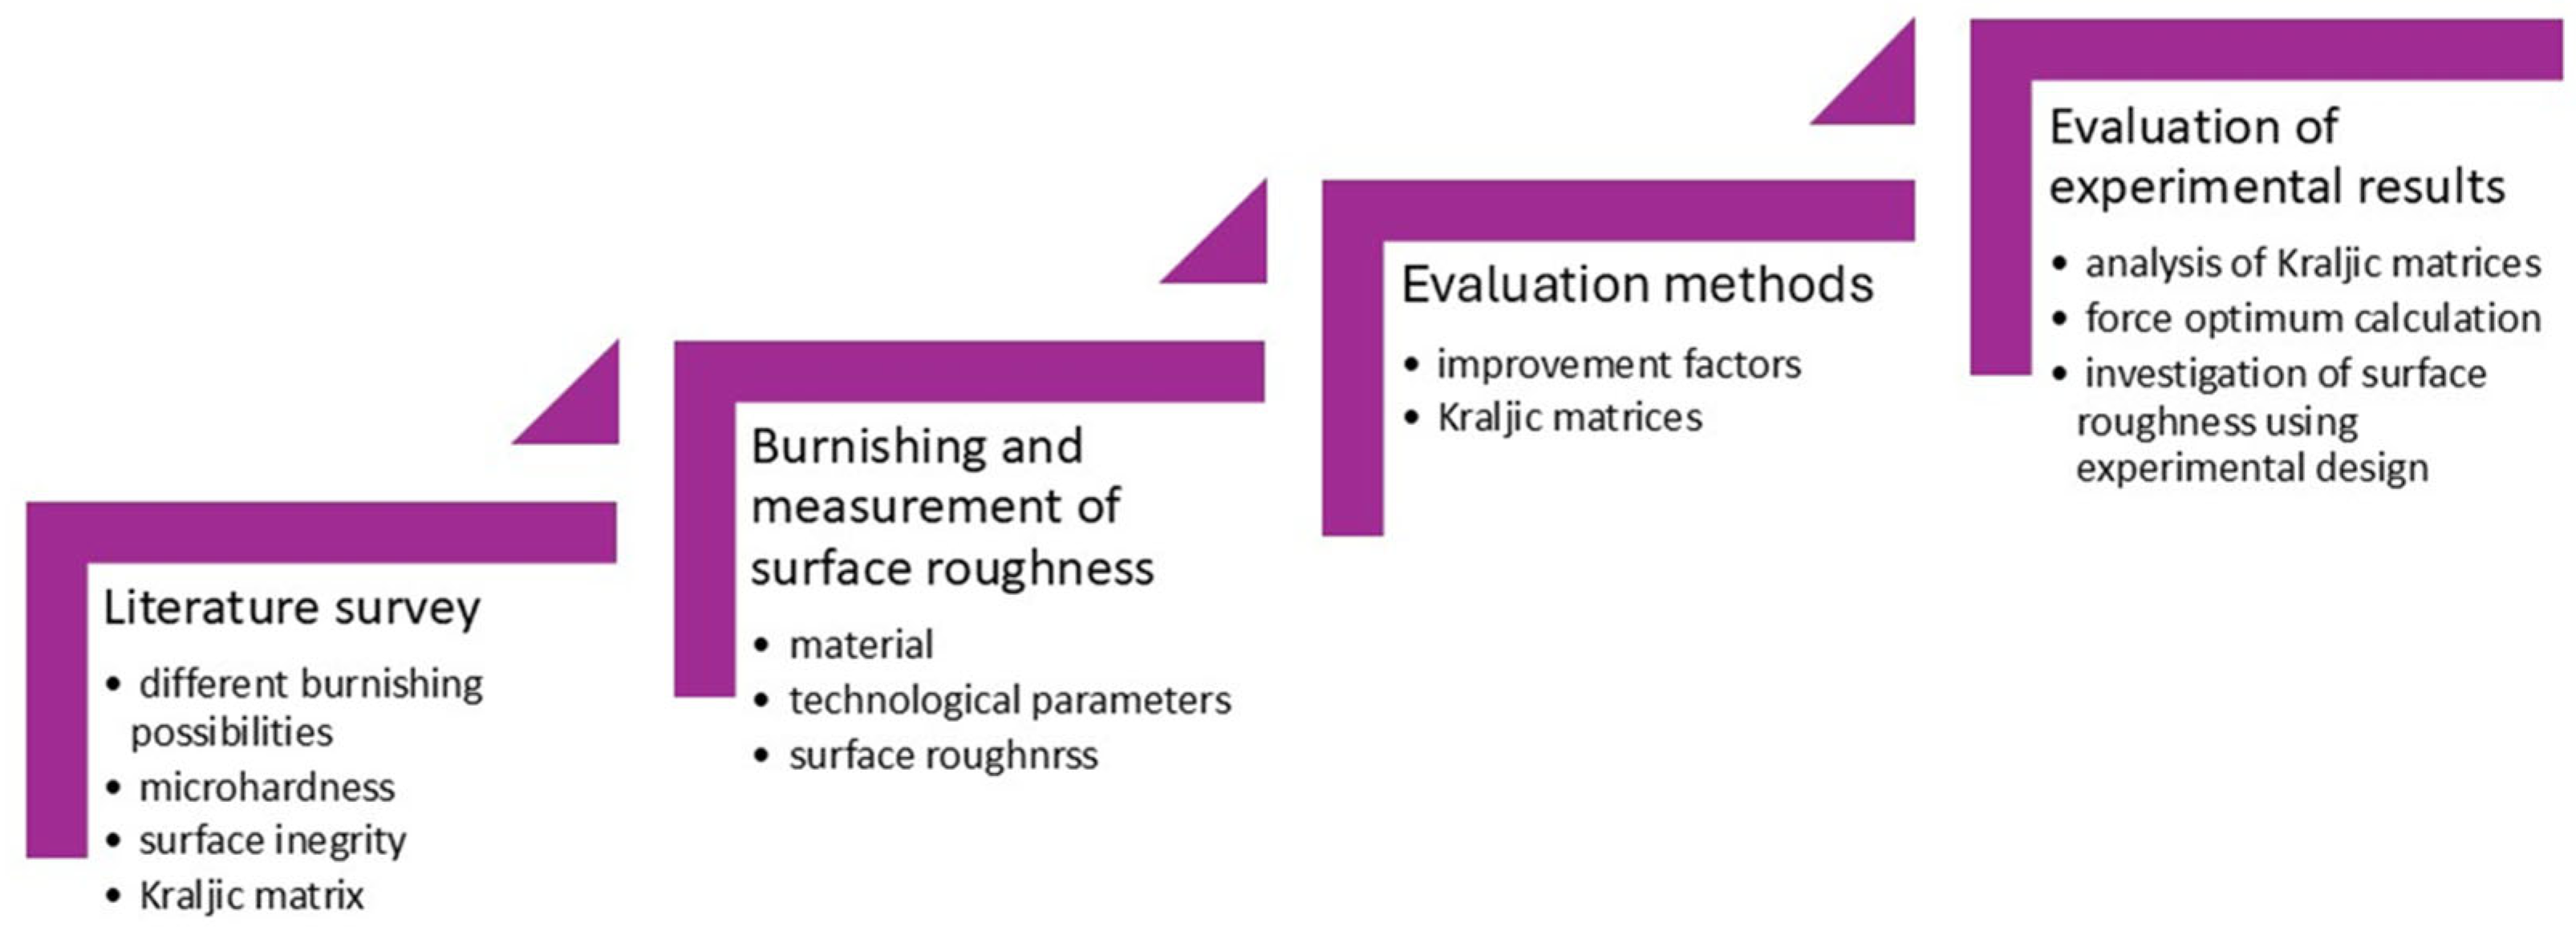
1. Literature Review

In the implementation of the currently ongoing 4th Industrial Revolution, ensuring the surface quality of manufactured parts with a fine surface is becoming increasingly important [1]. According to researchers, from a tribological perspective, the reliability and durability of machine parts depends on the result of the manufacturing process and the surface structure formed on the part [2]. The structure of the formed surface affects the wear and fatigue strength of the part [3]. After turning and milling, machined parts often require additional finishing operations, such as grinding and burnishing. During the burnishing process, the surface of the workpiece undergoes cold-plastic deformation. Burnishing can be implemented with burnishing tools operating on different principles, mainly ball burnishing or burnishing tools operating on the sliding friction principle. As a result of burnishing, the surface roughness of the machined part decreases and the surface layer becomes harder [4,5]. The burnishing process can be performed on various machine tools, including conventional universal lathes and relatively modern NC and CNC machines [6,7]. Diamond burnishing is a machining process similar to turning; however, it is a chipless, plastic process [8].
Many studies focus on the development of the burnishing technology, with particular attention to the optimization of surface quality, wear resistance, microhardness, and residual stresses. They deal with the burnishing of workpieces of an increasing range of material qualities, such as aluminum alloys [9,10,11,12], titanium and its alloys [13,14,15], magnesium and its alloys [16,17], Inconel [18,19,20], AISI 316L stainless steel [21,22,23], AISI 304 chromium–nickel austenitic stainless steel [24,25,26] chromium alloys [27,28,29,30,31,32,33], and bronze [34]. The material quality of the burnishing tool is often polycrystalline diamond [27,35,36,37,38,39]. The methodology of diamond burnishing research is also diverse. The Artificial Neural Network (ANN) method is increasingly used for the analysis of diamond burnishing [28,40,41]. The full experimental design methodology [42,43,44] and Taguchi’s method [45,46,47] are still commonly used methods. Ulhe et al. [7], Sachin et al. [48], and Shirsat et al. [49] have used ANOVA analysis in their research, and the finite element method has been used effectively in research [12,50,51,52,53].
In terms of implementation method, two main areas can be observed in the field of burnishing: ball burnishing and sliding friction burnishing. Of course, there are several other burnishing methods or special tools, such as roller burnishing [9,40,52,54,55].
Ball burnishing has been studied by Zhou et al. [10], Jagadeesh and Setti [16], Thit et al. [56], Li et al. [57], and Han et al. [58].
Zhou et al. [10] applied two-dimensional ultrasonic surface burnishing to produce gradient nanostructures in aluminum alloys and to improve wear resistance. Their research on two-dimensional ultrasonic surface peening (2D-USBP) in aluminum alloys was aimed at producing gradient nanostructures and improving wear resistance. The multi-ball burnishing tool, operating under the synergistic effect of ultrasonic vibration and machining pressure, causes plastic deformation on the surface of aluminum alloys. The heat generated during deformation and convective heat transfer reaches a dynamic equilibrium, which enables quasi-isothermal processing conditions. According to their results, 2D-USBP creates a gradient nanostructure with a thickness of about 660 μm on the surface of the specimen. The surface hardness of the burnished samples reached 120 HV, which is 60% higher than that of the original samples. According to the wear test results, there was a significant increase in wear resistance on the burnished samples.
The biodegradability of a magnesium alloy processed by ball-burnishing for bioresorbable implants in stimulated body fluids (SBF) was investigated by Jagadeesh and Setti [16]. According to their research, the application of ball burnishing had a positive effect on reducing the biodegradation rate of the magnesium substrate.
In their paper [56], Thit et al. used ball burnishing of laser-deformed metal surfaces to improve the surface integrity and high-cycle fatigue life of AISI 431 alloys. Their research results showed that the test pieces machined by ball burnishing showed a significant improvement in surface quality with a 91% reduction in roughness. The microhardness increased from 490 HV 0.1 to 530 HV 0.1 at 400 µm from the burnished surface towards the interior of the workpiece, which represented a 10% increase in hardness. Their results indicated that ball burnishing could be a suitable application for improving the dynamic fatigue resistance and overall life of laser-deformed metal surfaces of AISI 431 steel alloy parts.
The study by Li et al. [57] aimed to investigate the effect of burnishing on the surface properties and antifouling resistance of ultra-high-molecular-weight polyethylene (UHMWPE). Ball burnishing experiments were performed using different pressures and different burnishing paths. The surface roughness and surface topography of the burnished surfaces were measured. Furthermore, the microhardness, wear, and impact resistance of the burnished surface were investigated. According to their results, the surface roughness decreased with increasing reinforcement pressure. However, they were unable to establish a clear relationship between burnishing pressure and wear resistance. They found that burnishing increased the microhardness, wear, and impact resistance. Li et al. [57] attributed the improvement in surface integrity to the stretching of macromolecular chains and crystal networks in UHMWPE. The results show that ball burnishing with the appropriate burnishing path and pressure can be a suitable method for improving the surface stability of a ship bottom.
The evolution of surface characteristics and the fatigue resistance mechanism of Ti60 alloy were studied by Han et al. [58] during fatigue caused by ball burnishing and shot peening at room temperature and at 450 °C. They analyzed the residual stresses, microhardness, and microstructures during fatigue. According to their results, the residual stress relaxation rate of the burnished sample is lower than that of the shot-peened sample.
The topic of sliding friction-based diamond burnishing has been examined in several studies, such as those by Qi et al. [20], Kluz et al. [27], Varga et al. [35], Jiménez-García et al. [59], and Zhang et al. [60]. Significant research on sliding friction diamond burnishing has also been conducted by Maximov and his collaborators. A major portion of their investigations focused on surface integrity and surface roughness ([12,29,30,31,32,33,34,53,61,62,63]).
Their work also addressed how burnishing affects operational behavior, performance characteristics ([29,32,61,62]), and fatigue limit ([30,31,32,33,34,63]). For example, they studied sliding friction burnishing applied to symmetric rotating components made of high-strength D16T aircraft aluminum alloys [12]. The investigations analyzed the influence of process parameters on surface roughness, microhardness, and residual stresses induced by sliding friction burnishing. Using an optimized combination of process parameters, they also explored the effects of the number of tool passes and coolant/lubricant usage on the surface quality, microhardness, and residual stresses. Finite element analysis was conducted to determine residual stress profiles and surface topography as functions of tool radius and burnishing force, thereby assessing the effectiveness of sliding friction burnishing.
A 2024 study by Maximov et al. [30] aimed to determine the influence of cooling and lubrication conditions in diamond burnishing on the surface integrity and fatigue limit of chromium–nickel austenitic stainless steels. Based on their findings, a cost-effective and sustainable diamond burnishing method was developed. They demonstrated that lubricant-free diamond burnishing meets the requirements of sustainable manufacturing and offers a favorable cost-to-quality ratio. Four lubrication/cooling variants were tested: one conventional flooded (non-dry) lubrication process and three dry burnishing techniques. The dry methods included: (a) dry burnishing without cooling; (b) dry burnishing with air cooling at −19 °C; and (c) dry burnishing with nitrogen cooling at −31 °C. The dry diamond burnishing techniques (a, b, and c) generated a high atomic density submicrocrystalline structure, with the strongest crystalline development occurring in method (a). Among the dry methods, option (a) also produced the highest microhardness in both the surface and the subsurface layers.
In another study, Maximov et al. [31] established explicit correlations between surface integrity and fatigue limit in cold-worked chromium–nickel austenitic stainless steels. The cold-plastic deformation process was implemented by diamond burnishing of AISI 304 stainless steel. A simplified optimization approach was proposed to achieve the maximum fatigue limit without performing fatigue testing. Five surface roughness parameters were examined (Ra, Rq, Rv, Rsk, and Rku), each considered a functionally significant indicator of fatigue behavior, microhardness, and surface residual stress. The primary influencing factors were the burnishing force and the number of passes. The surface integrity and fatigue limit models were developed using design of experiments and regression analyses.
The fatigue behavior and corrosion resistance of AISI 304 austenitic stainless steel are also affected by heat treatment and diamond burnishing [32]. The highest fatigue strength in that study was achieved via multipass diamond burnishing without subsequent heat treatment. However, the best corrosion resistance was attained when burnishing was followed by heat treatment. In the case of AISI 304 chromium–nickel stainless steels, conventional chemical-thermal surface treatments often present issues such as grain boundary corrosion, for which low-temperature surface treatments are a viable alternative. Surface cold working can enhance both the surface microhardness and fatigue strength. The main objective of study [33] was to determine the effect of diamond burnishing on the rotating fatigue strength of AISI 304L stainless steel. The influence of burnishing parameters on surface integrity characteristics was assessed, and optimal conditions were identified where the surface roughness was minimized and microhardness was maximized.
Aluminum bronzes with the composition Cu-10Al-5Fe are widely used across various industries due to their high strength, wear resistance, and corrosion resistance, even in aggressive environments such as seawater. In study [34], hot-rolled Cu-10Al-5Fe bronze rods were subjected to various heat treatments, followed by diamond burnishing that induced significant surface plastic deformation. The effects of these processes on microstructure, surface integrity, mechanical properties, cyclic fatigue strength, and dry sliding wear resistance were investigated and quantitatively compared.
Similar studies were performed on CuAl8Fe3 bronze components [39] to evaluate the influence of heat treatment and significant surface plastic deformation. The effect of diamond burnishing on mechanical properties, fatigue life, and wear resistance was analyzed. In this case, surface integrity improvement could only be achieved through mechanical surface treatment. Using experimental data and regression analysis, a multi-parameter optimization of the diamond burnishing process was conducted, and optimal factor values were determined. Based on these optimized values, surface integrity indicators of the diamond-burnished CuAl8Fe3 samples were quantified. The results confirmed that diamond burnishing is feasible for CuAl8Fe3 bronze, resulting in favorable combinations of surface texture height and shape parameters. The burnished specimens showed significant improvement in both fatigue strength and wear resistance.
A review of the relevant literature revealed five essential criteria necessary for constructing a reliable finite element model [53]. The finite element method was used to evaluate substantial plastic deformation in subsurface layers, which has a pronounced effect on the surface integrity and, consequently, the operational performance of metal components.
A comprehensive study by Maximov et al. [61] addressed the effects of cryogenic and cooled burnishing on surface integrity and operational performance. At cryogenic temperatures (below −180 °C), metallic materials undergo structural changes that typically enhance service life. This practice, widely studied in recent decades, is referred to as cryogenic treatment and can be integrated as an auxiliary process in conventional metalworking. The study presented analyses and summaries of the impact of cryogenic burnishing on surface integrity and performance of the treated materials.
In another article, Maximov et al. [62] investigated the relationship between surface integrity and the operational behavior of components subjected to sliding friction diamond burnishing. They classified various burnishing methods and analyzed the technique based on significant surface plastic deformation, where the burnishing tool maintains sliding frictional contact with the treated surface. A comprehensive literature review of theoretical and practical results was conducted, with a triangular diagram used to graphically represent the findings. The vertices of the triangle corresponded to sliding friction burnishing, surface integrity, and operational behavior. Based on this analysis, relevant conclusions were drawn and promising directions for future investigations were outlined.
In addition to the use of well-known optimization methods, the search for new methods often arises, and methods that are currently less widely used are also welcome. One such method is the application of Kraljic matrices. With the help of Kraljic matrices, it is possible to clearly demonstrate which parameter values have a significant or less significant effect on the process, as well as which parameter value combinations are expected to produce the best solution. This method is also successfully used in areas, disciplines, and industries such as business [64], supplier selection [65,66], cleaner production [67], the chemical industry [68,69], and the food industry [70]. The Kraljic method is often used to select the best parameter combination when it is not possible or difficult to write down the aim function to be used for optimization. In this case, finding the appropriate quadrant of the parameter combinations helps to determine the best parameter combinations. In this case, however, the application of factorial experimental design is a good method. Of course, other methods, such as the ANOVA method, could have been used, as we used in our research on the burnishing of a flat surface [71], but now we intend to choose a different method.
Figure 1 shows the structure of this paper.

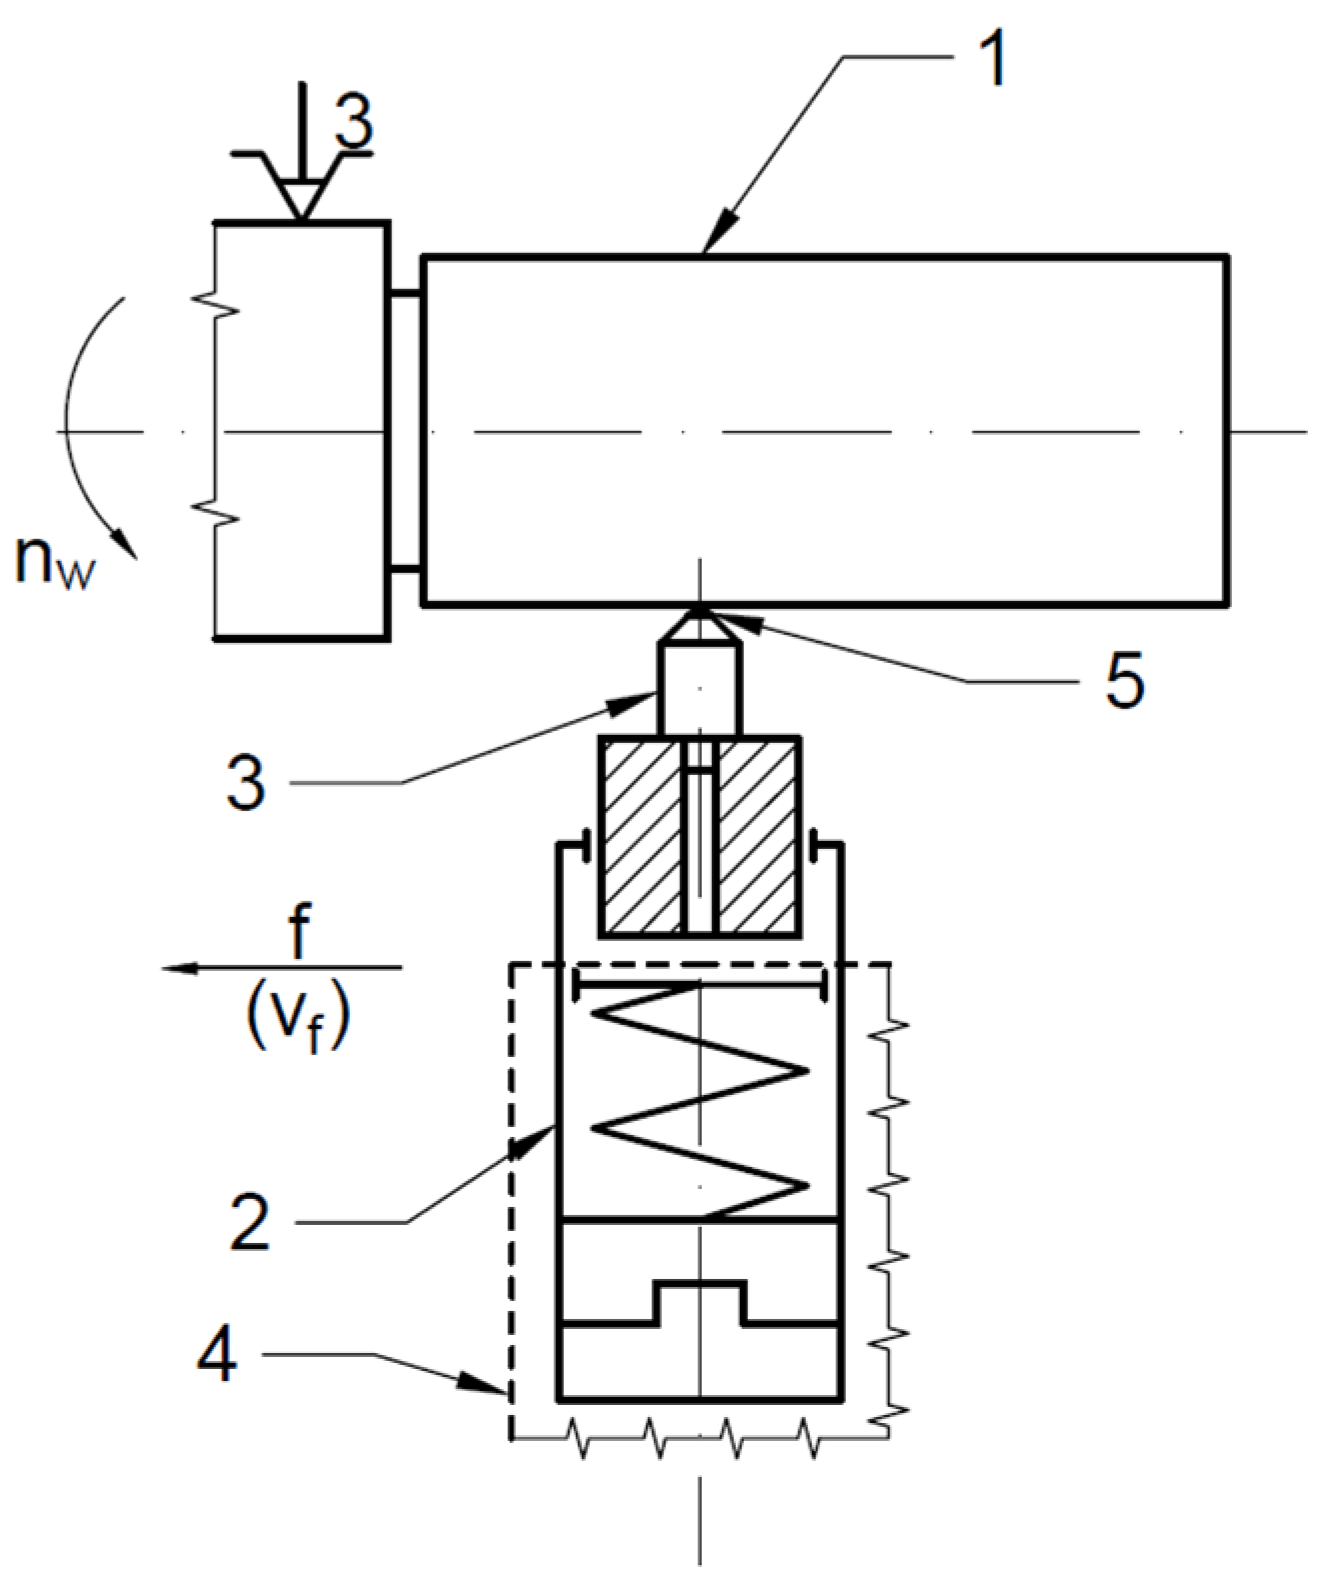
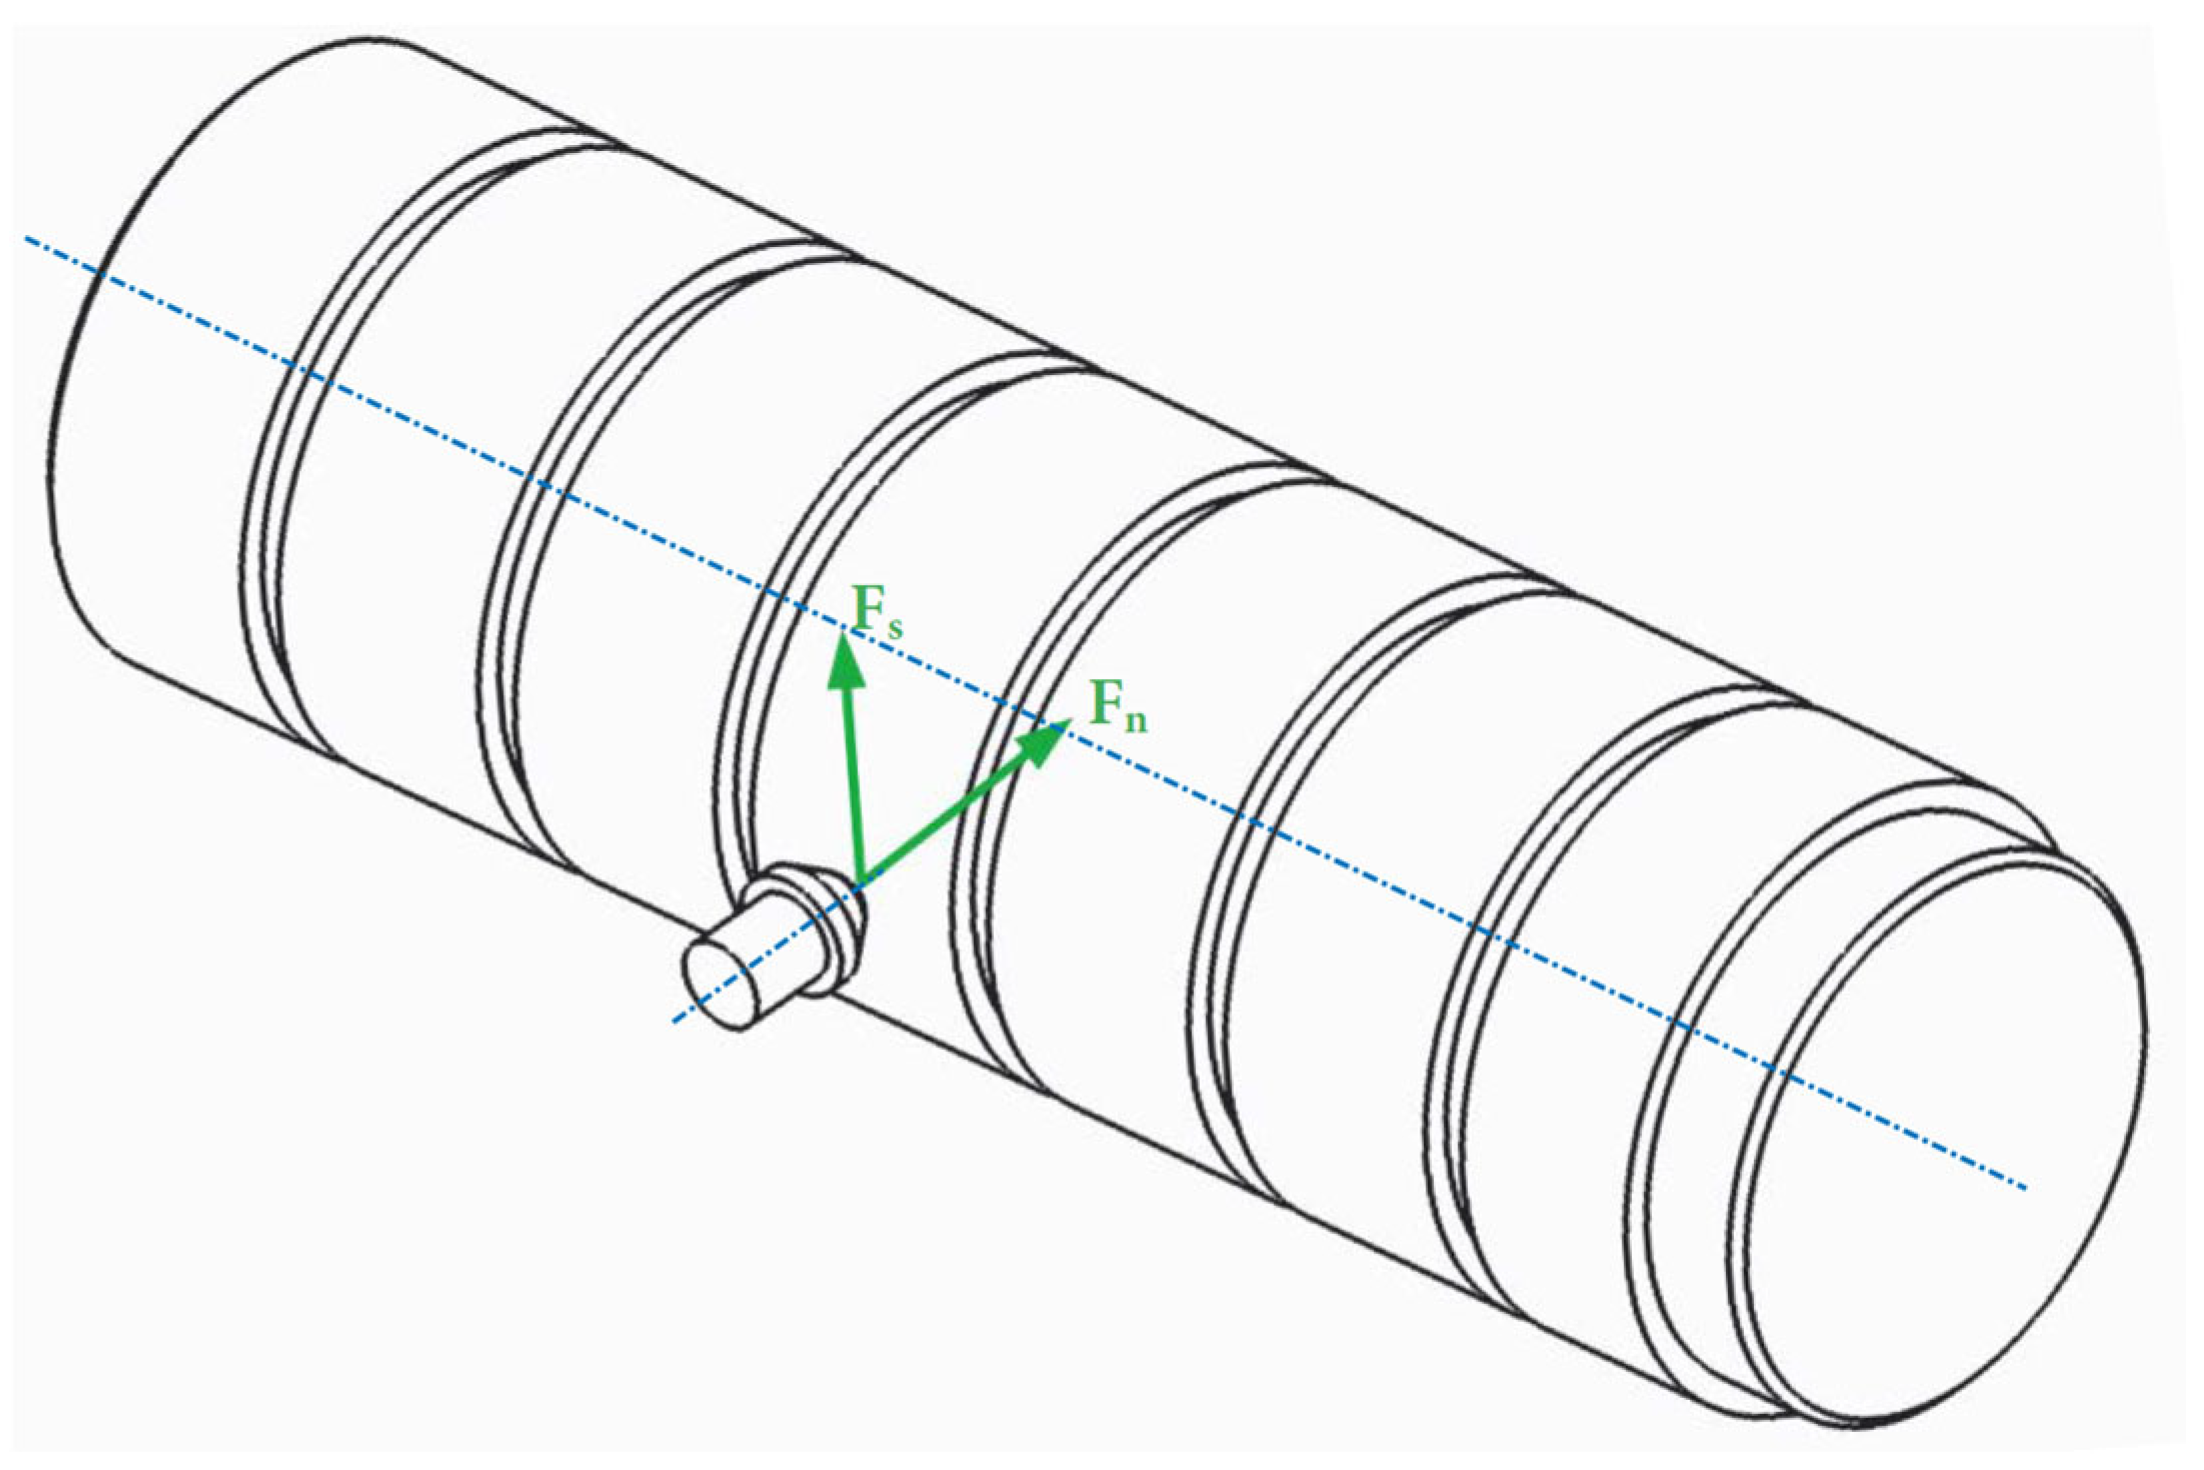
2. Surface Machining and Roughness Measurement

Our research focuses on the analysis of surface roughness generated by diamond burnishing. To ensure consistency, standardized test specimens were manufactured using machine tools located in the workshop of the Institute of Manufacturing Science at the University of Miskolc. The geometric dimensions of the specimen used for the burnishing experiments were six adjacent cylindrical surfaces with a diameter of Ø50.00 mm and a length of 22 mm. The chamfers, grooves, and clamping positions are formed by turning X5CRNI18-10 austenitic stainless chrome–nickel steel alloy with austenitic fabric construction with a yield strength of R p 0.2 210   M P a , a tensile strength of R m = 520 700   M P a , an elongation at break of A 45 % , a density of ρ = 7.9   k g / d m 3 , and a hardness of 160 190   H B . Chemically, the alloy consists of 66.8–71.3% iron, ≤0.03% carbon, 1% silicon, 2% manganese, 0.045% phosphorus, 0.015% sulfur, ≤0.11% nitrogen, 17.5–19.5% chromium, and 8–10.5% nickel.
The turning parameters were kept uniform across all specimens:
v c = 1.3875 m s   f = 0.05 m m r e v
This consistency enabled us not only to evaluate the surface roughness after diamond burnishing but also to assess the degree of roughness improvement—namely, how much surface quality enhancement was achieved compared to the initial turned surface. This comparison is especially relevant since identical turning parameters do not necessarily result in identical surface roughness values.
Diamond burnishing was also performed on a lathe (type: EU-400-01), where the burnishing tool was mounted in the tool post. The machining setup is shown in Figure 2, in which the following are classified: 1: workpiece; 2: burnishing tool body; 3: burnishing insert; 4: tool holder; 5: diamond tip. The spring mechanism is also visible, through which the burnishing force can be indirectly controlled by adjusting the spring tension.
The technological parameters of diamond burnishing were combined using two feed rates, two spindle speeds, and four burnishing forces. The independent parameter combinations are given in Table 1. The experimental parameter variations are written as follows:
Feed rate:
f 1 = 0.05 m m r e v ;   f 2 = 0.1 m m r e v
Workpiece RPM:
n 1 = 265 1 m i n ;   n 2 = 375 1 m i n
Burnishing force:
F v 1 = 60   N ;   F v 2 = 80   N ;   F v 3 = 100   N ;   F v 4 = 120   N
Using the workpiece diameter and spindle speed, the burnishing speed can be calculated as shown in Equation (1), written as follows:
v v = d · π · n m s ,
From an environmental perspective, it is important to assess the power demand of each machining operation. This can be calculated as the product of the burnishing force and burnishing speed, according to Equation (2), written as follows:
P = F ·   v v     N · m · s 1 ,
It is important to distinguish between the burnishing force F used in this equation and the technological parameter F v listed in Table 2. The latter is the force set directly on the machine tool via spring preload, while the former represents the effective force used in power calculations. The relationship between the two is illustrated in Figure 3: n represents the normal (passive) force, and F s the actual frictional force acting along the surface.
Using the relationship of frictional forces, Equations (3) and (4) can be written. Equation (3) uses traditional notation, while Equation (4) applies our chosen symbols, written as follows:
F s = μ · F n ,   [ N · ]
F = μ · F v ,   [ N · ]
Here, μ is the coefficient of friction, which is taken as μ = 0.1 for the diamond–steel interface with coolant/lubricant applied [73].
In our study, we analyzed surface roughness using various metrics, including both 2D [8] and 3D roughness parameters. Measurements were conducted using the AltiSurf 520 roughness measurement system, and data analysis was carried out using the AltiMap software provided with the equipment. Technical specifications of AltiSurf©520 can be found in [74]. It contains the measurement principle non-contact, optical, based on confocal chromatic technology, interferometric, and others. Measurement range from 100 µm to 25 mm. Resolution in Z down to 2 nm, lateral resolution 0.7 µm. Step-height accuracy (1 µm) 0.005%. Low. Measurable roughness (Ra/Sa) 20 nm/20 nm. (ISO 21920-2 [75], ISO 25178 [76]). Software: AltiMap version 6.2. The measurement setup is in the metrology laboratory of the Institute of Manufacturing Science at the University of Miskolc. During the examination, all measurements were performed under uniform laboratory conditions, with identical settings and external factors (e.g., temperature, humidity), in order to minimize distortions resulting from environmental effects and to ensure reproducibility of the results.

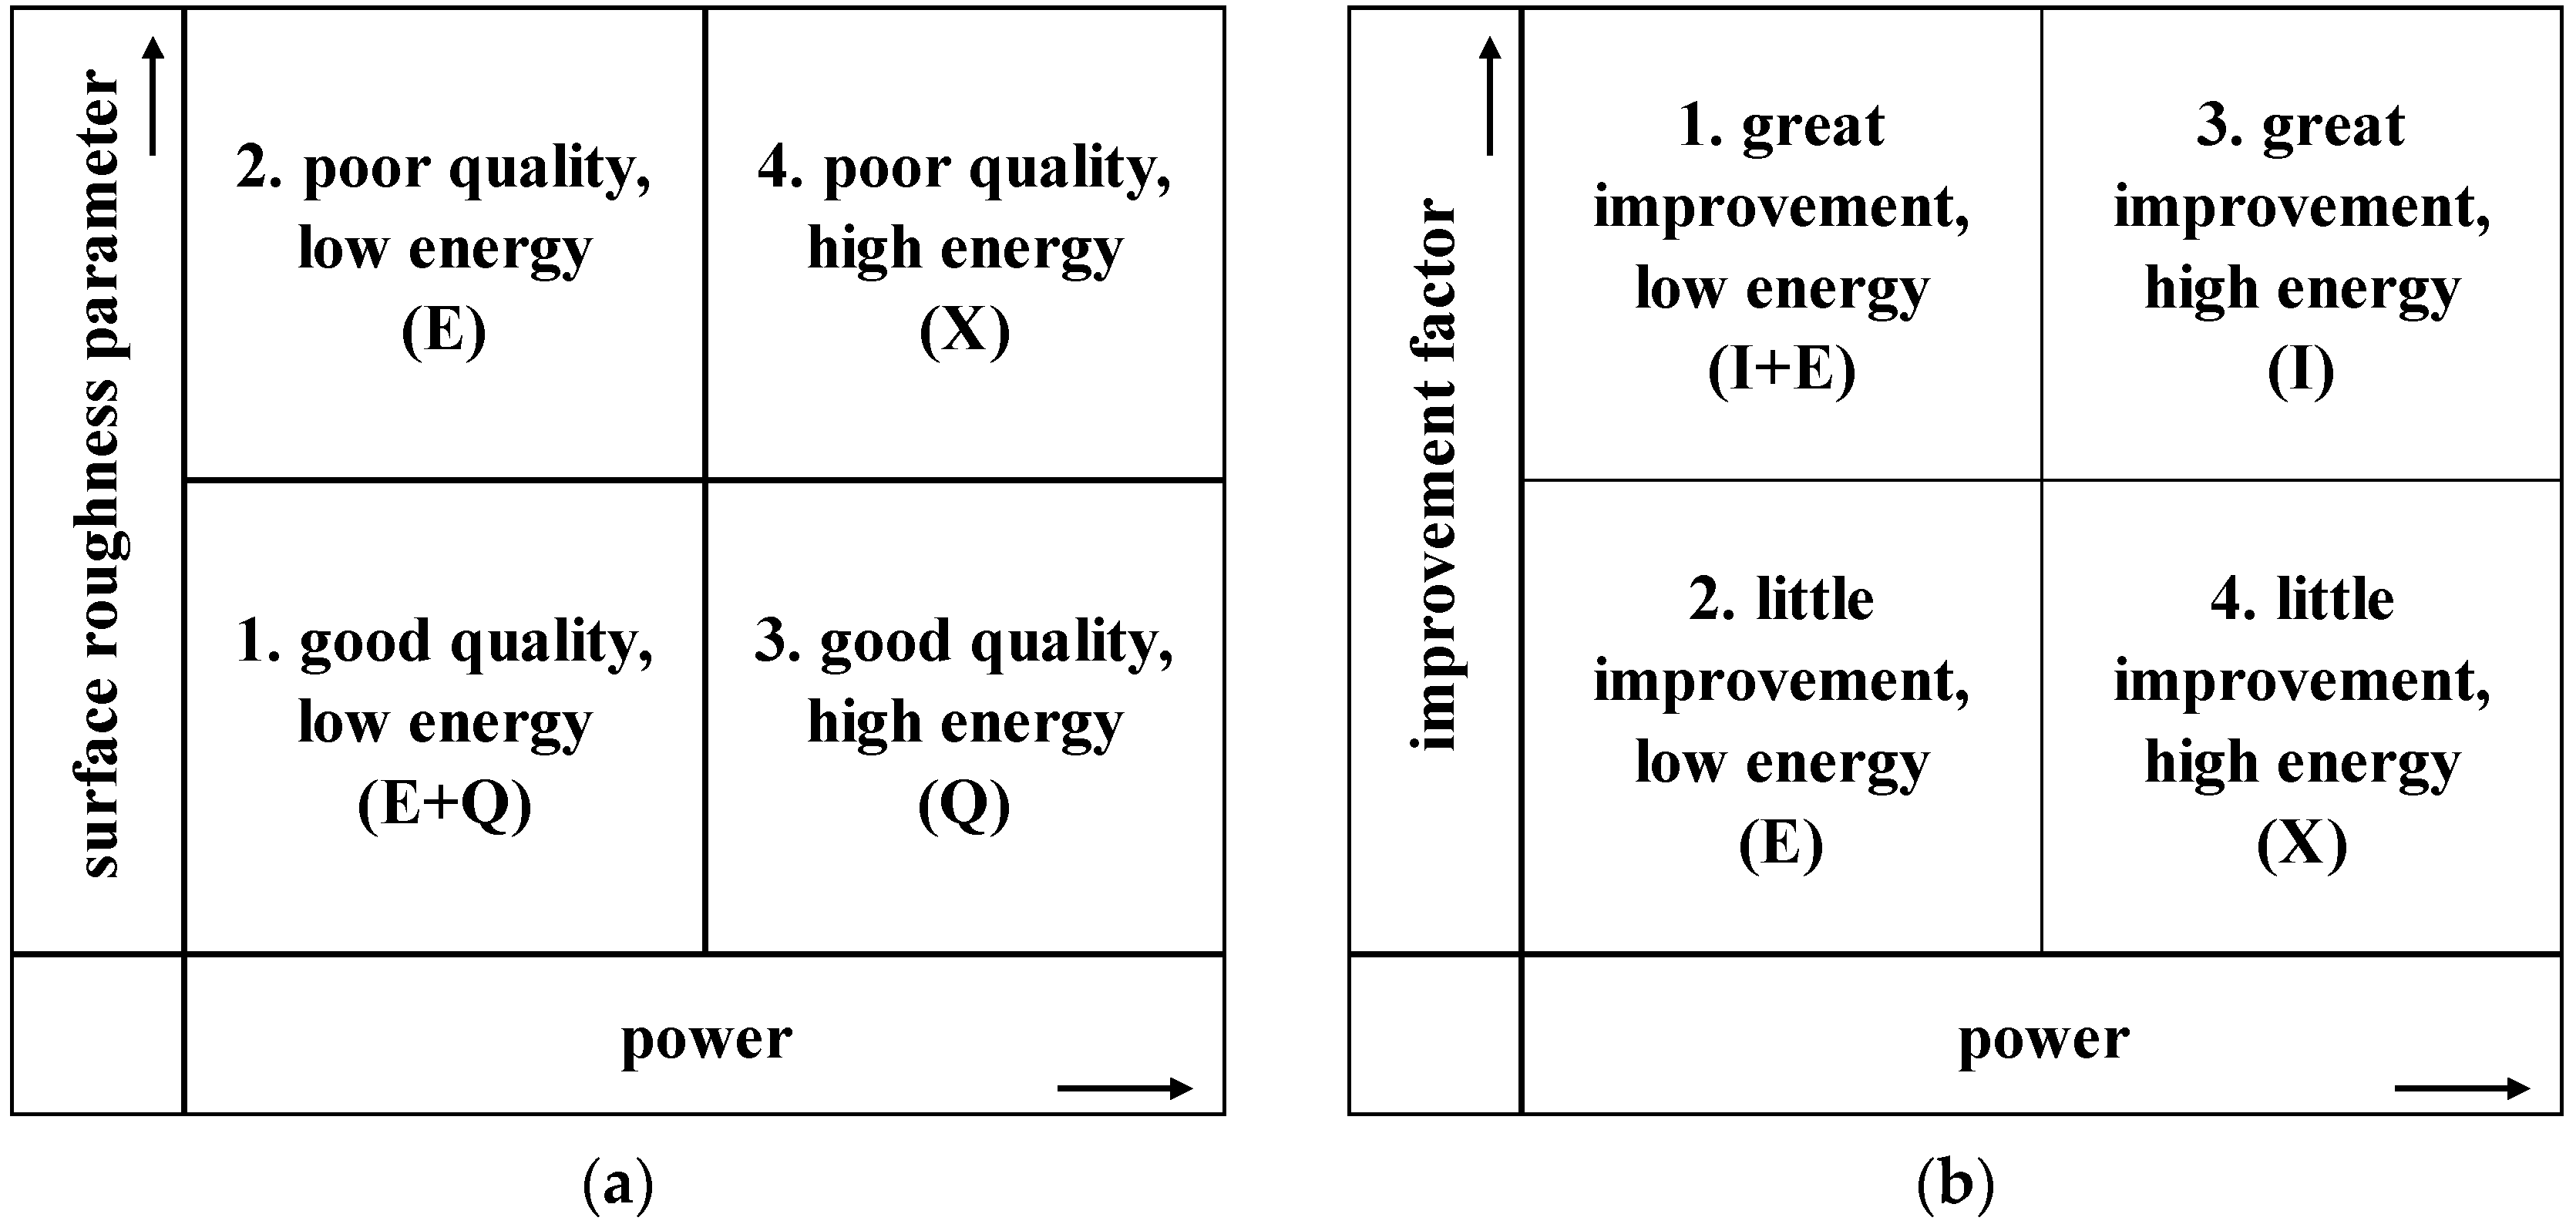
3. Evaluation Methods

The improvement in surface roughness due to diamond burnishing is also investigated using so-called improvement factors. Since the surfaces and their roughness characteristics after turning (i.e., before the diamond burnishing) may differ, it is important to know the initial condition to determine the improvement due to burnishing. The improvement factor was calculated using formula (5). This formula is a general expression applicable to various surface roughness parameters, where “I” stands for improvement, “X” stands for “R” in the case of 2D parameters and “S” in the case of 3D parameters, and “y” generalizes the different types of roughness measures.
I X y = X y ; t u r n e d X y ; b u r n i s h e d X y ; t u r n e d · 100   % ,
For visual representation of the data, so-called Kraljic matrices were applied, the layout of which is shown in Figure 4. These matrices are based on a coordinate system, where the horizontal axis represents power consumption, and the vertical axis represents a specific surface roughness parameter or its improvement factor. All previously measured values are plotted as individual data points based on these two parameters. Once all values—in our case, 16 in total—are placed on the diagram, it is transformed into a matrix by drawing lines vertically and horizontally at the median of each axis. It is easy to see that as a result, the two left, two right, two bottom, and two top cells will each contain eight data points in total, although the number of points in individual cells can vary between zero and eight.
For surface roughness parameters, the bottom-left cell is considered optimal, as it contains machining processes that result in low power demand and good surface quality. In contrast, the top-right cell represents processes to be avoided, since they result in relatively poor surface quality with high power consumption. The remaining two cells can be interpreted as compromises, where surface quality and energy consumption balance each other in a trade-off. The matrices for the improvement factors of the roughness parameters were constructed based on similar considerations, with the logical difference that in this case, the top-left cell is considered optimal, while the bottom-right is the one to be avoided.

4. Evaluation of Experimental Results

Table 3 contains the improvement factors of the examined surface roughness parameters (Ra, Rq, Sa, Sq) due to burnishing, indicating the technological parameters used for the experiments.

4.1. Analysis of the Kraljic Matrices

We begin the evaluation of the experimental results using the Kraljic matrices introduced in the previous section. In our earlier research ([8]), we established that diamond burnishing with a burnishing force less than 60 N did not yield significant improvements in surface roughness. Therefore, these data points were excluded from the dataset to obtain more accurate results, as they were significant outliers that considerably distorted the optimization.
Figure 5 shows the Kraljic matrices for the 2D surface roughness parameters—on the left side, the average roughness ( R a and on the right side, the root mean square roughness ( R q ). Different colors indicate the four feed rate and burnishing speed combinations, with the following values:
f 1 = 0.05 m m r e v ;   f 2 = 0.1 m m r e v
v v 1 = 0.6938 m s ;   v v 2 = 0.9817 m s
These combinations and their color codes are explained in the figure legends. Vertical and horizontal lines mark the matrix cell boundaries, with Roman numerals identifying the cells. To improve data interpretation, four quadratic polynomials were fitted per matrix using the trendline function in Microsoft Excel (Microsoft® Excel® for Microsoft 365 MSO (Build 2506 Version 16.0.18925.20076) 64-bit). The R-squared values for these trendlines are shown at the top of the figures in color-coded rectangles, indicating the accuracy of fit—i.e., how reliably conclusions can be drawn from the shape of the trendlines. The R-squared value ranges from 0 to 1, where values near 1 indicate a reliable model, while values near 0 imply unreliability, meaning no suitable function (in our case, a quadratic polynomial) fits the dataset well. Expressed as a percentage, for example, the red trendline corresponding to f = 0.05 m m r e v and v v = 0.6938 m s in the average roughness matrix reproduces the actual measured values with 99.75% reliability.
Figure 5 shows that the data points for average roughness and root mean square roughness are quite similar, so it is worth combining the conclusions from both matrices. Considering the R-squared values of the trendlines, it can be stated that all but the blue trendline offer a high level of reliability. The red trendline falls into cell I of the Kraljic matrix, indicating that the parameter combination with lower feed rate and lower burnishing speed best satisfies energy efficiency principles—that is, good surface quality coupled with low power demand. In contrast, the yellow trendline—representing data points with higher feed and higher burnishing speed—is mainly found in cell IV, which should therefore be avoided due to high power demand and poor surface roughness. The other two trendlines lie in the “compromise” cells of the matrices: the gray trendline is favorable in terms of power demand, while the blue trendline favors surface quality but shows less optimal values in terms of the other parameter. Nevertheless, based solely on these data and matrices, it is advisable to use the parameter combination of the red trendline in all respects.
Since quadratic polynomials were used for approximation, each trendline represents a parabola, which has a minimum point due to the positive x2 coefficient in their equations. In Section 4.2, these minimum points will be used to determine the minimum power and the minimum burnishing force.
Figure 4a and Figure 5 and Figure 6 correspond to each other. For example, Quadrant 1. marked with Arabic numerals in Figure 4a corresponds to Quadrant I. marked with Roman numerals in Figure 5 and Figure 6. Similarly, Quadrant 1. marked with Arabic numerals in Figure 4b corresponds to Quadrant I. marked with Roman numerals in Figure 7 and Figure 8.
In Figure 6, similarly to the previous figure, the Kraljic matrices of 3D surface roughness parameters are shown: the arithmetic mean on the left and the root mean square equivalent on the right. The fitted trendlines show similar tendencies for both parameters, while the reliability level is somewhat lower only for the blue trendline, but not as low as in the 2D case (59.79–34.49% for 2D and 74.66–68.51% for 3D).
The most favorable parameter combination remains the one marked in red, with low feed and low burnishing speed. Increasing feed rate worsened surface roughness at the same burnishing speed (gray trendline), while increasing burnishing speed increased power demand at the same feed rate (blue trendline). The simultaneous increase of both technological parameters resulted in even worse surface roughness. The minimum points of these parabolas can also be calculated here.
Kraljic matrices were also created for the improvement factors introduced in the previous chapter. Figure 7 shows the 2D Kraljic matrices for the improvement factors of average roughness (left) and root mean square roughness (right). These values indicate the percentage improvement achieved in the surface roughness of the longitudinally turned surface due to diamond burnishing. The structure of the figures, the trendlines, the R-squared values, and the color codes are similar to the previous figures, with the difference that here the upper-left cell corresponds to optimal energy efficiency.
The greatest improvement was achieved with the parameter combination of high feed rate and low burnishing speed (gray trendline), which was also optimal regarding power demand, placing it mainly in cell I of the matrix. The red trendline (corresponding to lower feed rates at the same burnishing speed compared to the previous figure) showed smaller improvements with the same power demand. However, these two trendlines rise steeply, with their maxima shifted along the power axis, even if these maxima fall within cell I. Burnishing with higher speed (yellow and blue trendlines) produced less favorable results both in terms of power and improvement factors. It may happen that the maxima of these trendlines are lower than those of the red and gray ones due to their steepness.
Figure 8 shows the last two Kraljic matrices of our study: the 3D arithmetic mean improvement factor (left) and the 3D root mean square improvement factor (right). The findings are like the 2D case, with the difference that the red and gray trendlines are much less steep, potentially yielding more favorable values in later maximum point calculations.
All other conclusions remain valid in this dimension as well: at constant burnishing speed, increasing feed rate resulted in higher improvement factors, while increasing burnishing speed decreased the improvement values.

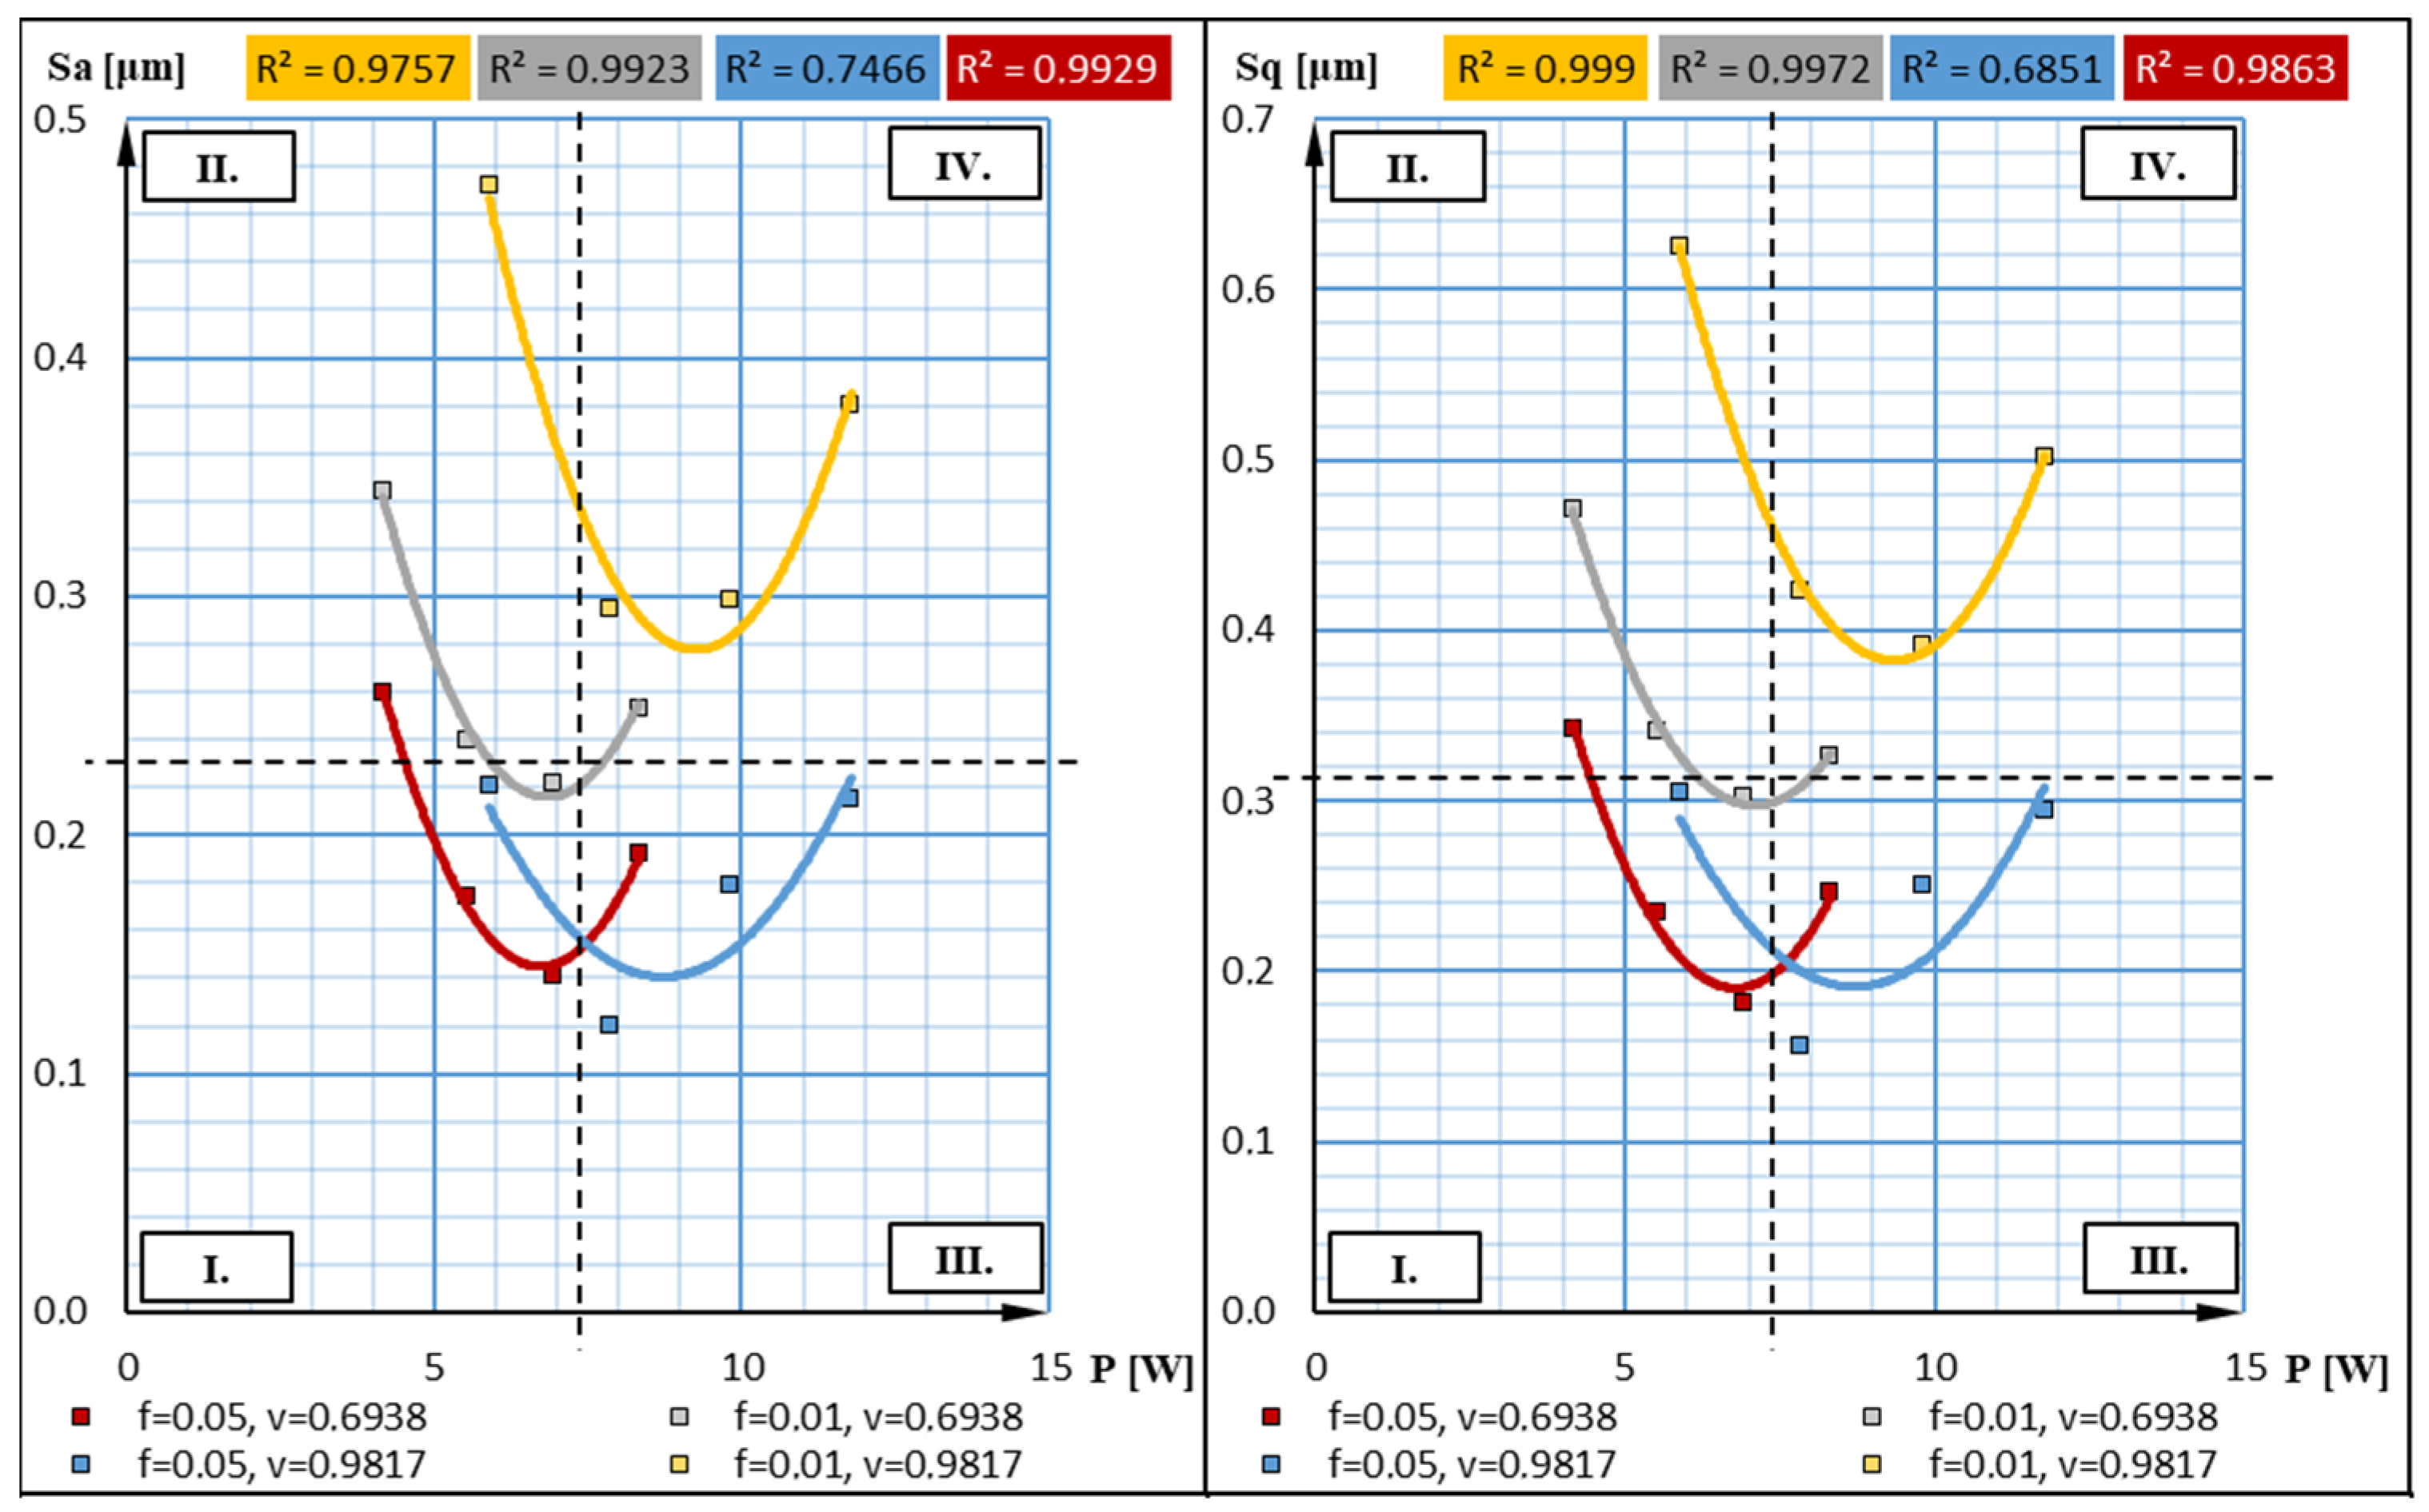
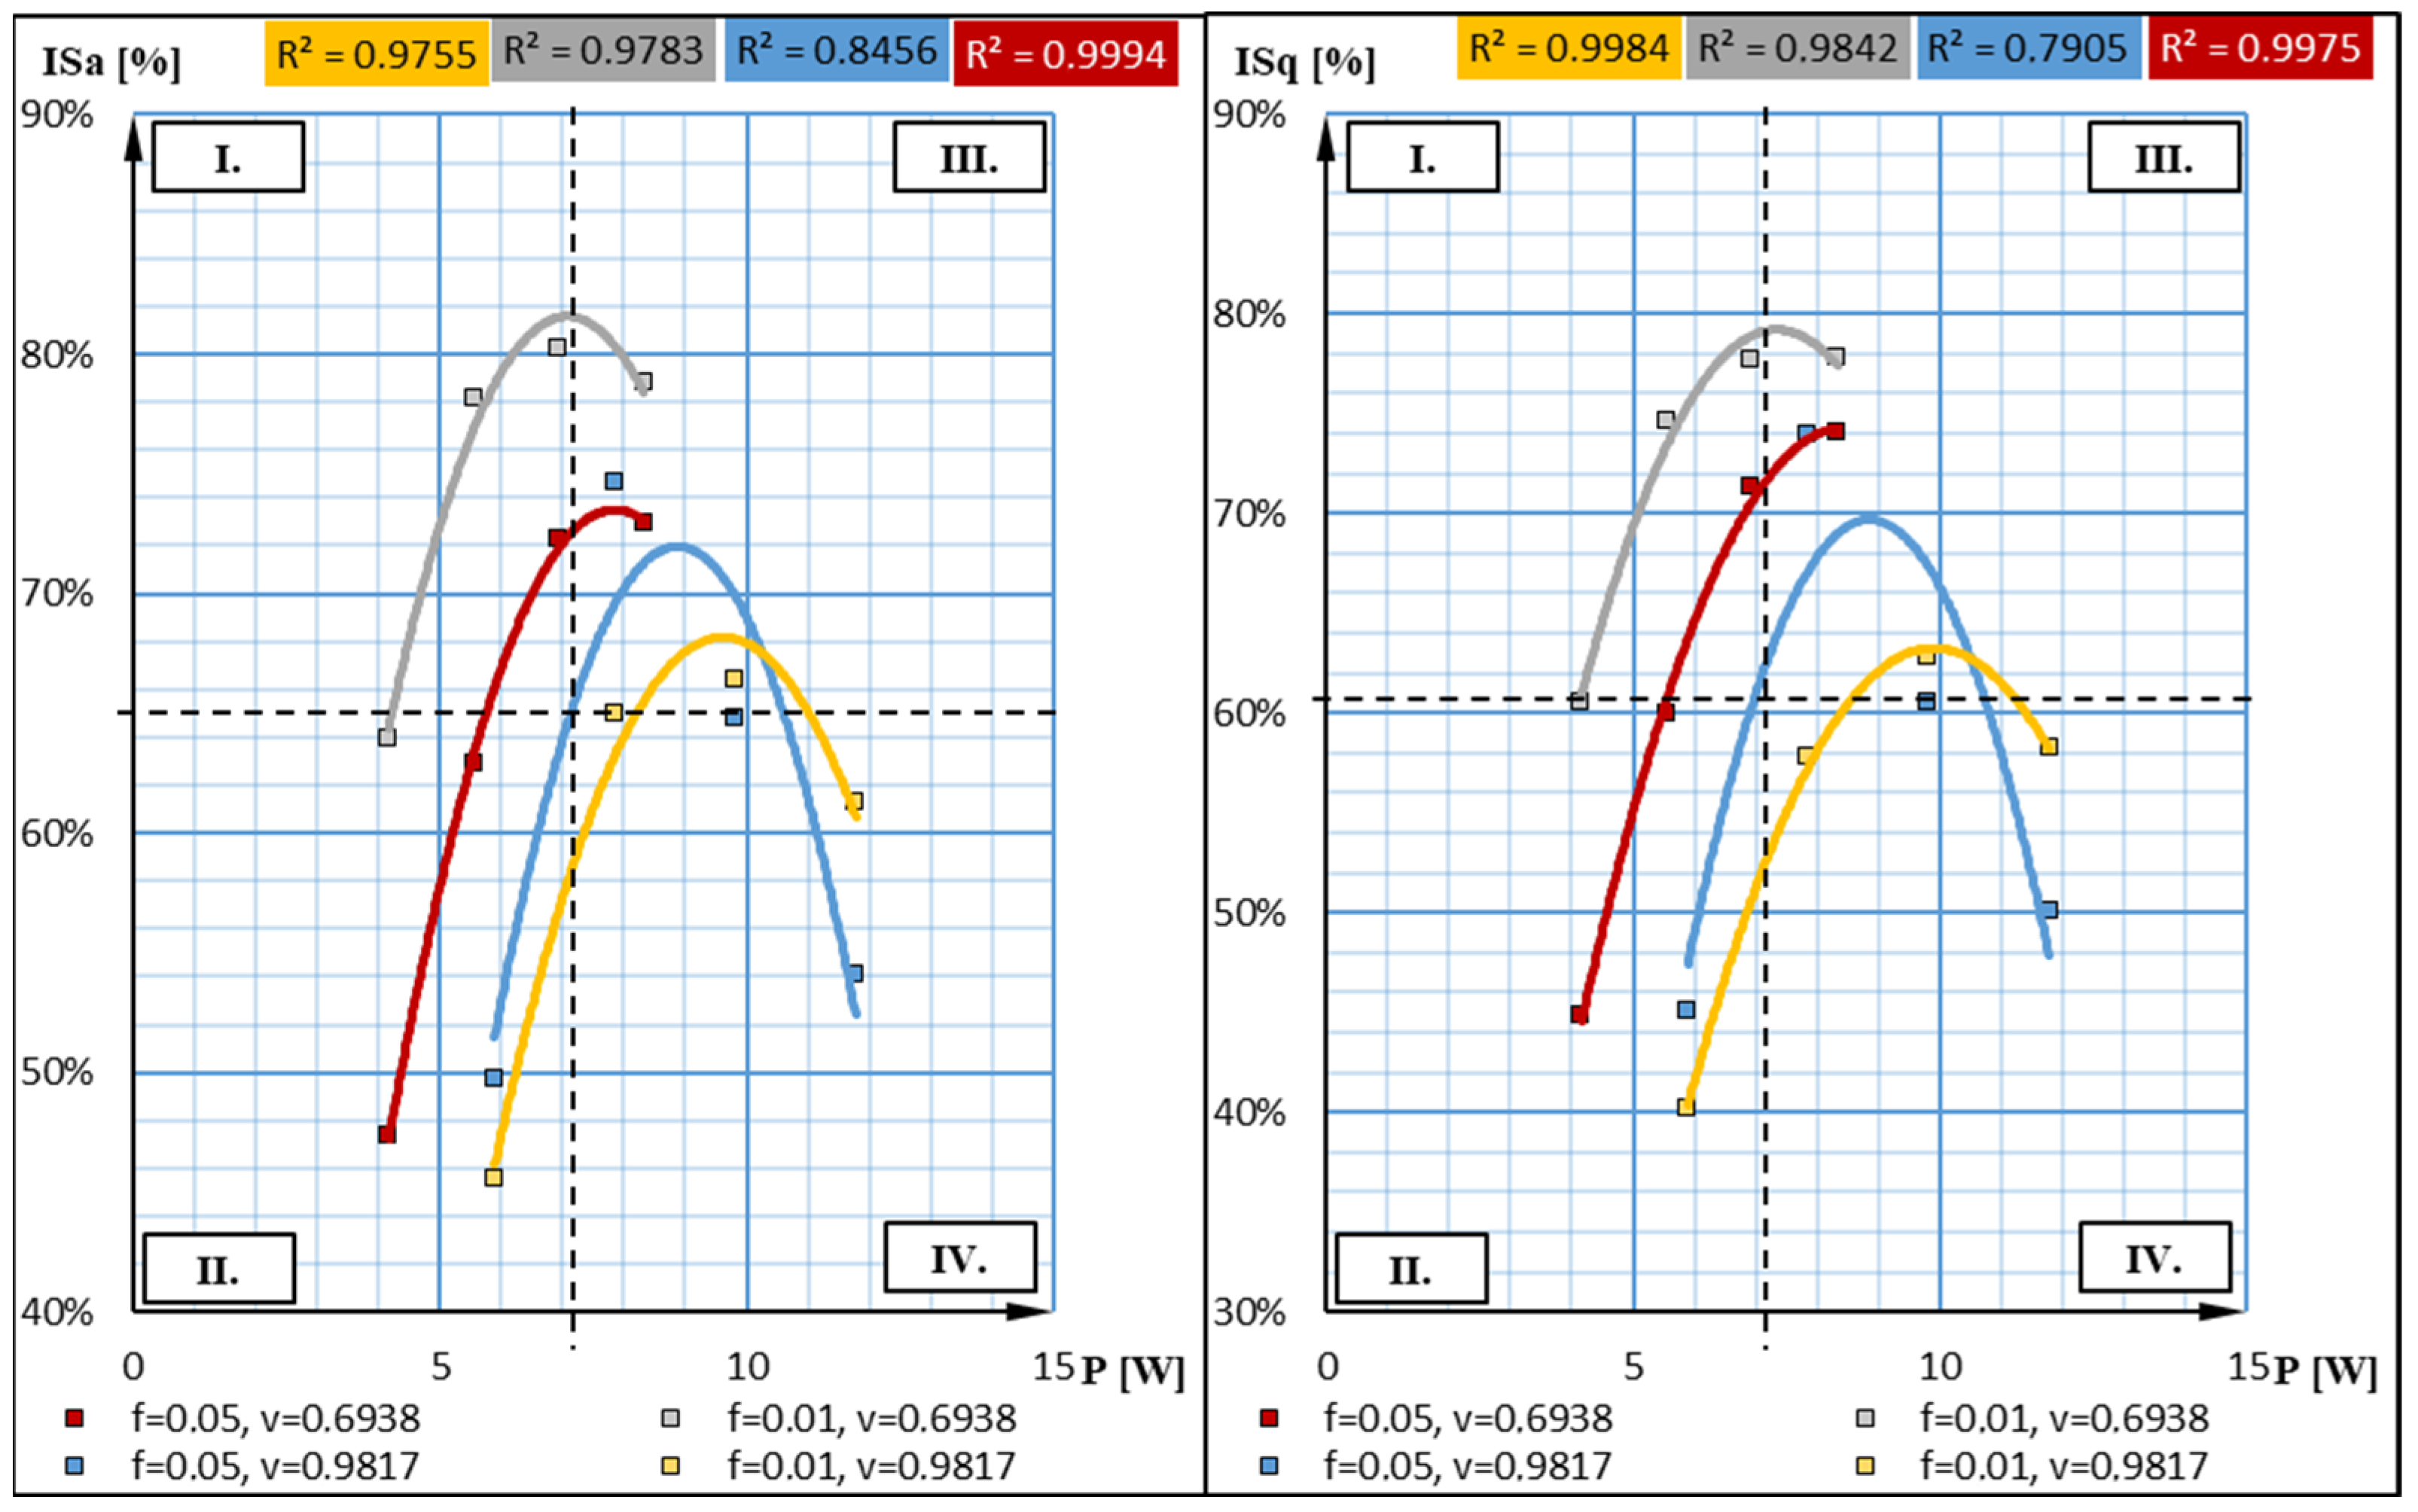
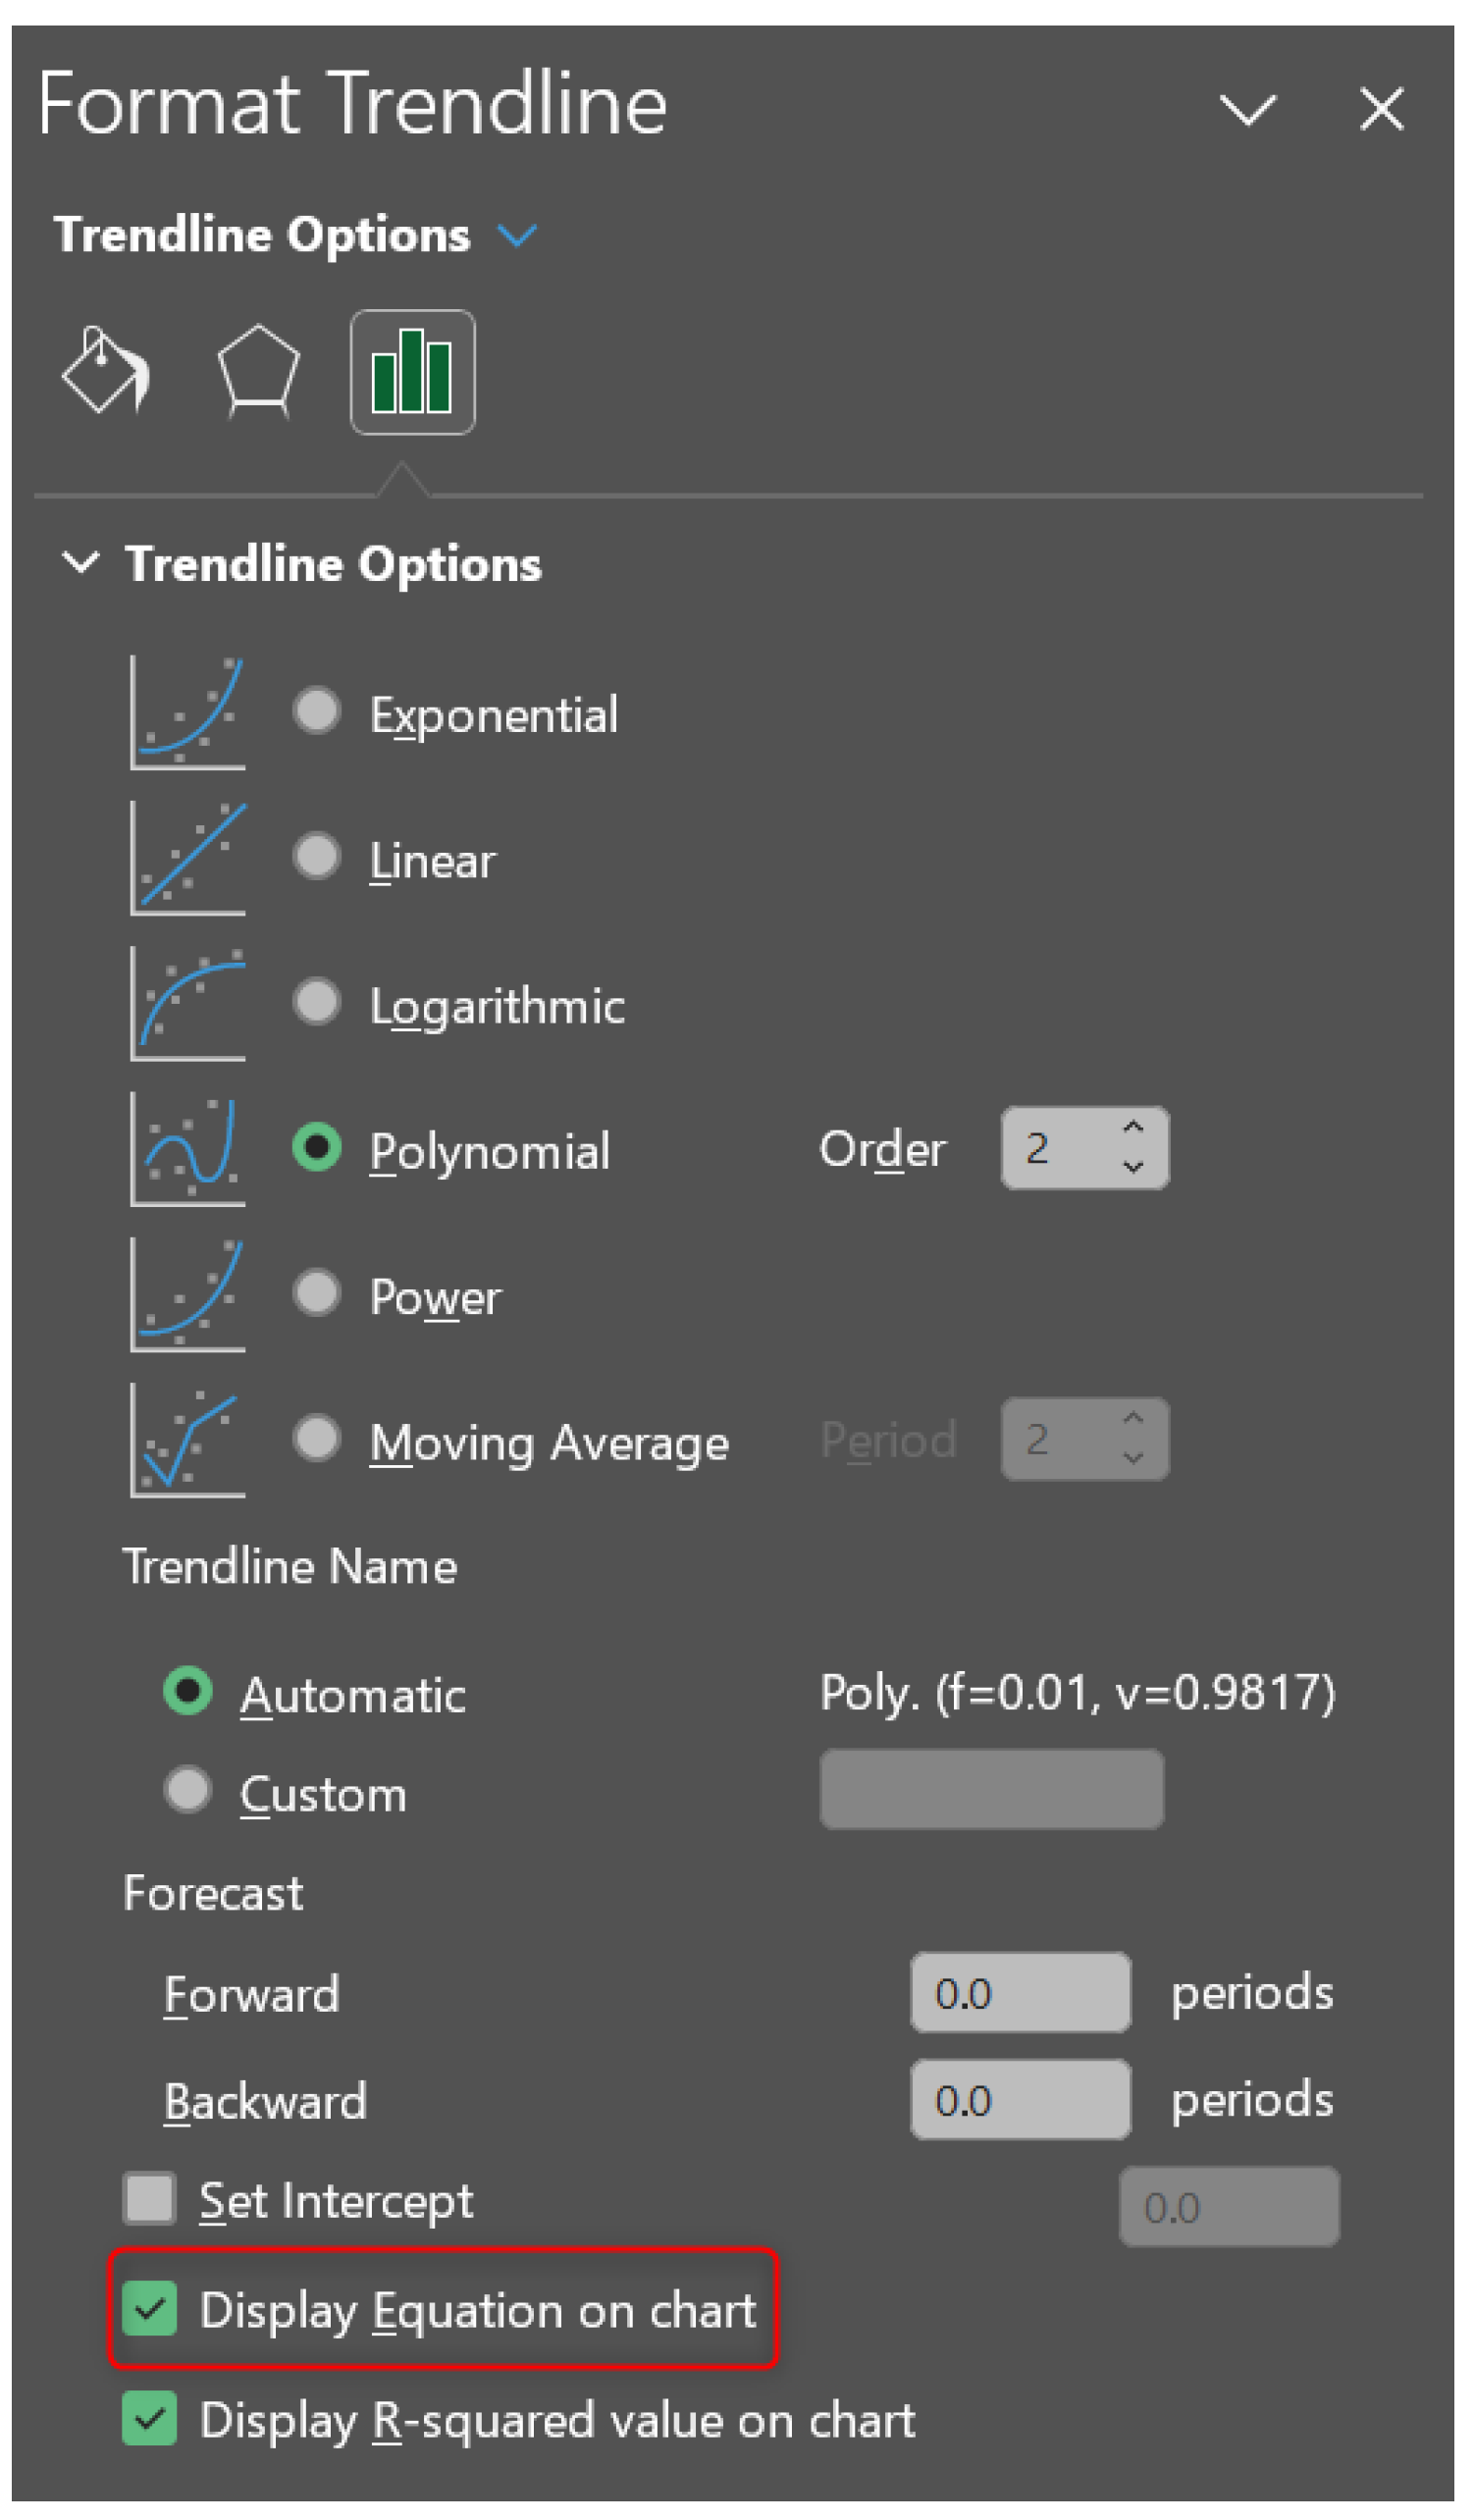
4.2. Optimum Force Calculation for Surface Roughness Optimisation

Using the parabolas defined in Section 4.1, minimum and maximum points can be defined. As previously shown, the parabolas had minimum points in the case of surface roughness indicators, while they exhibited maximum points when improvement factors were considered.
To perform the extremum calculation, the trendline equations are required, which can be displayed in Microsoft Excel through the trendline formatting options, as highlighted in red in Figure 9.
During the calculation, the optimal burnishing force required to achieve the best surface quality can be determined, meaning the process is optimized regarding surface roughness. In every case, the second-degree polynomial takes the form shown in Equation (6), where “x” represents the performance (power), and “y” denotes the surface roughness indicator or its improvement factor, written as follows:
y = a x 2 + b x + c ,
To determine the extremum, this equation must be differentiated once, resulting in the first-order Equation (7). The curve has a minimum or maximum point where this equation equals zero, so we set it to zero and rearrange for “x”, the desired optimal performance, as shown in Equation (8), written as follows:
y = 2 a x + b = 0 ,
x o p t = b 2 a = P o p t ,
By using Equations (2) and (4), the burnishing force defined as a technological parameter can be calculated from the performance. The following Equation (9) shows the substitution into the power formula, while Equation (10) represents the rearrangement to solve for the force optimum:
P o p t = μ · F o p t · v v ,
F o p t = P o p t μ · v v ,
Table 4 contains the calculations related to the surface roughness indicators. Since the x2 components of the equations are all positive, the calculated extreme values represent the minimum points of the parabolas. However, this distinction is not relevant for the later calculations, since the sought force is the so-called force optimum.
These values show the burnishing force at which further increase would be unfavorable in terms of both surface quality and energy efficiency, while decreasing it would improve energy efficiency at the expense of surface quality. This concept of force optimum is illustrated in Figure 10, where the right side shows machining performed with force above the optimum—resulting in increased surface roughness and energy demand—while the left side represents machining with force below the optimum—leading to increased roughness but reduced energy demand. Using the force optimum value, optimizations were performed for given combinations of technological parameters (combinations of feed rate and burnishing speed) for diamond-burnish machining in terms of surface roughness.
Figure 5 and Figure 6 trendline’s equations are included in Table 4. We concluded that the most favorable combination in terms of both surface quality and required performance was the one with a lower feed rate and lower burnishing speed (red trendline). Therefore, based on the Kraljic matrices and the calculated force optimum values, the optimal parameter combination in terms of surface roughness is as follows:
f 1 = 0.05   m m r e v ;   v v 1 = 0.6938   m s ;   F o p t = 97 104   N
By contrast, applying a larger feed rate (gray-coded) resulted in worse surface quality and higher force optimum, written as follows:
f 2 = 0.1   m m r e v ;   v v 1 = 0.6938   m s ;   F o p t = 98 121   N
The use of higher burnishing speed (according to Equation (2)) increased the power, as shown by the blue and yellow trendlines in the figures. Machining with a higher feed rate again led to significantly worse surface quality (yellow) compared to a lower feed rate (blue), which produced nearly identical roughness values to those measured at the lower burnishing speed (red). Due to the higher burnishing speed, the optimum force came out lower for these combinations, but the required power made these processes less favorable from an energy perspective, written as follows:
f 1 = 0.05   m m r e v ;   v v 2 = 0.9817   m s ;   F o p t = 83 89   N
f 2 = 0.1   m m r e v ;   v v 2 = 0.9817   m s ;   F o p t = 94 101   N
Table 5 contains the calculations made for the improvement factors. In every case, the x2 components of the equations are negative, meaning the calculated extremum points represent maximum points of the parabolas. However, the concept of force optimum still applies.
This table contains the same data as Table 4, with the difference that calculations were made for the improvement factors instead of the surface roughness indicators. The meaning of force optimum is again aligned with the concept illustrated in Figure 10. Based on a study of the Kraljic matrices in Section 4.1, the improvement factors presented in Figure 7 and Figure 8 showed that the combination of higher feed rate and lower burnishing speed (gray-coded) produced the most favorable trendline in terms of both improvement percentage and power demand. Based on the Kraljic matrices and the calculated force optimum values, the optimal parameter combination projected onto the improvement factors is written as follows:
f 2 = 0.1   m m r e v ;   v v 1 = 0.6938   m s ;   F o p t = 102 127   N
Using the same burnishing speed with a lower feed rate resulted in lower improvement, while the trendline became much steeper, leading to significantly higher force optimum values, written as follows:
f 1 = 0.05   m m r e v ;   v v 1 = 0.6938   m s ;   F o p t = 113 190   N
Applying higher burnishing speed produced results similar to earlier observations, with slightly lower improvement percentages, increased power demand, and, due to the speed, lower force optimums, written as follows:
f 1 = 0.05   m m r e v ;   v v 2 = 0.9817   m s ;   F o p t = 86 90   N
f 2 = 0.1   m m r e v ;   v v 2 = 0.9817   m s ;   F o p t = 98 104   N
In summary, based on the force optimization data, the most favorable burnishing force for surface quality optimization ranged between 100 N and 110 N. Applying a lower force, according to this theory, may degrade surface quality but improve energy efficiency. In Section 4.3 of the analysis, we use factorial design to assess exactly how a reduced burnishing force affects surface roughness.

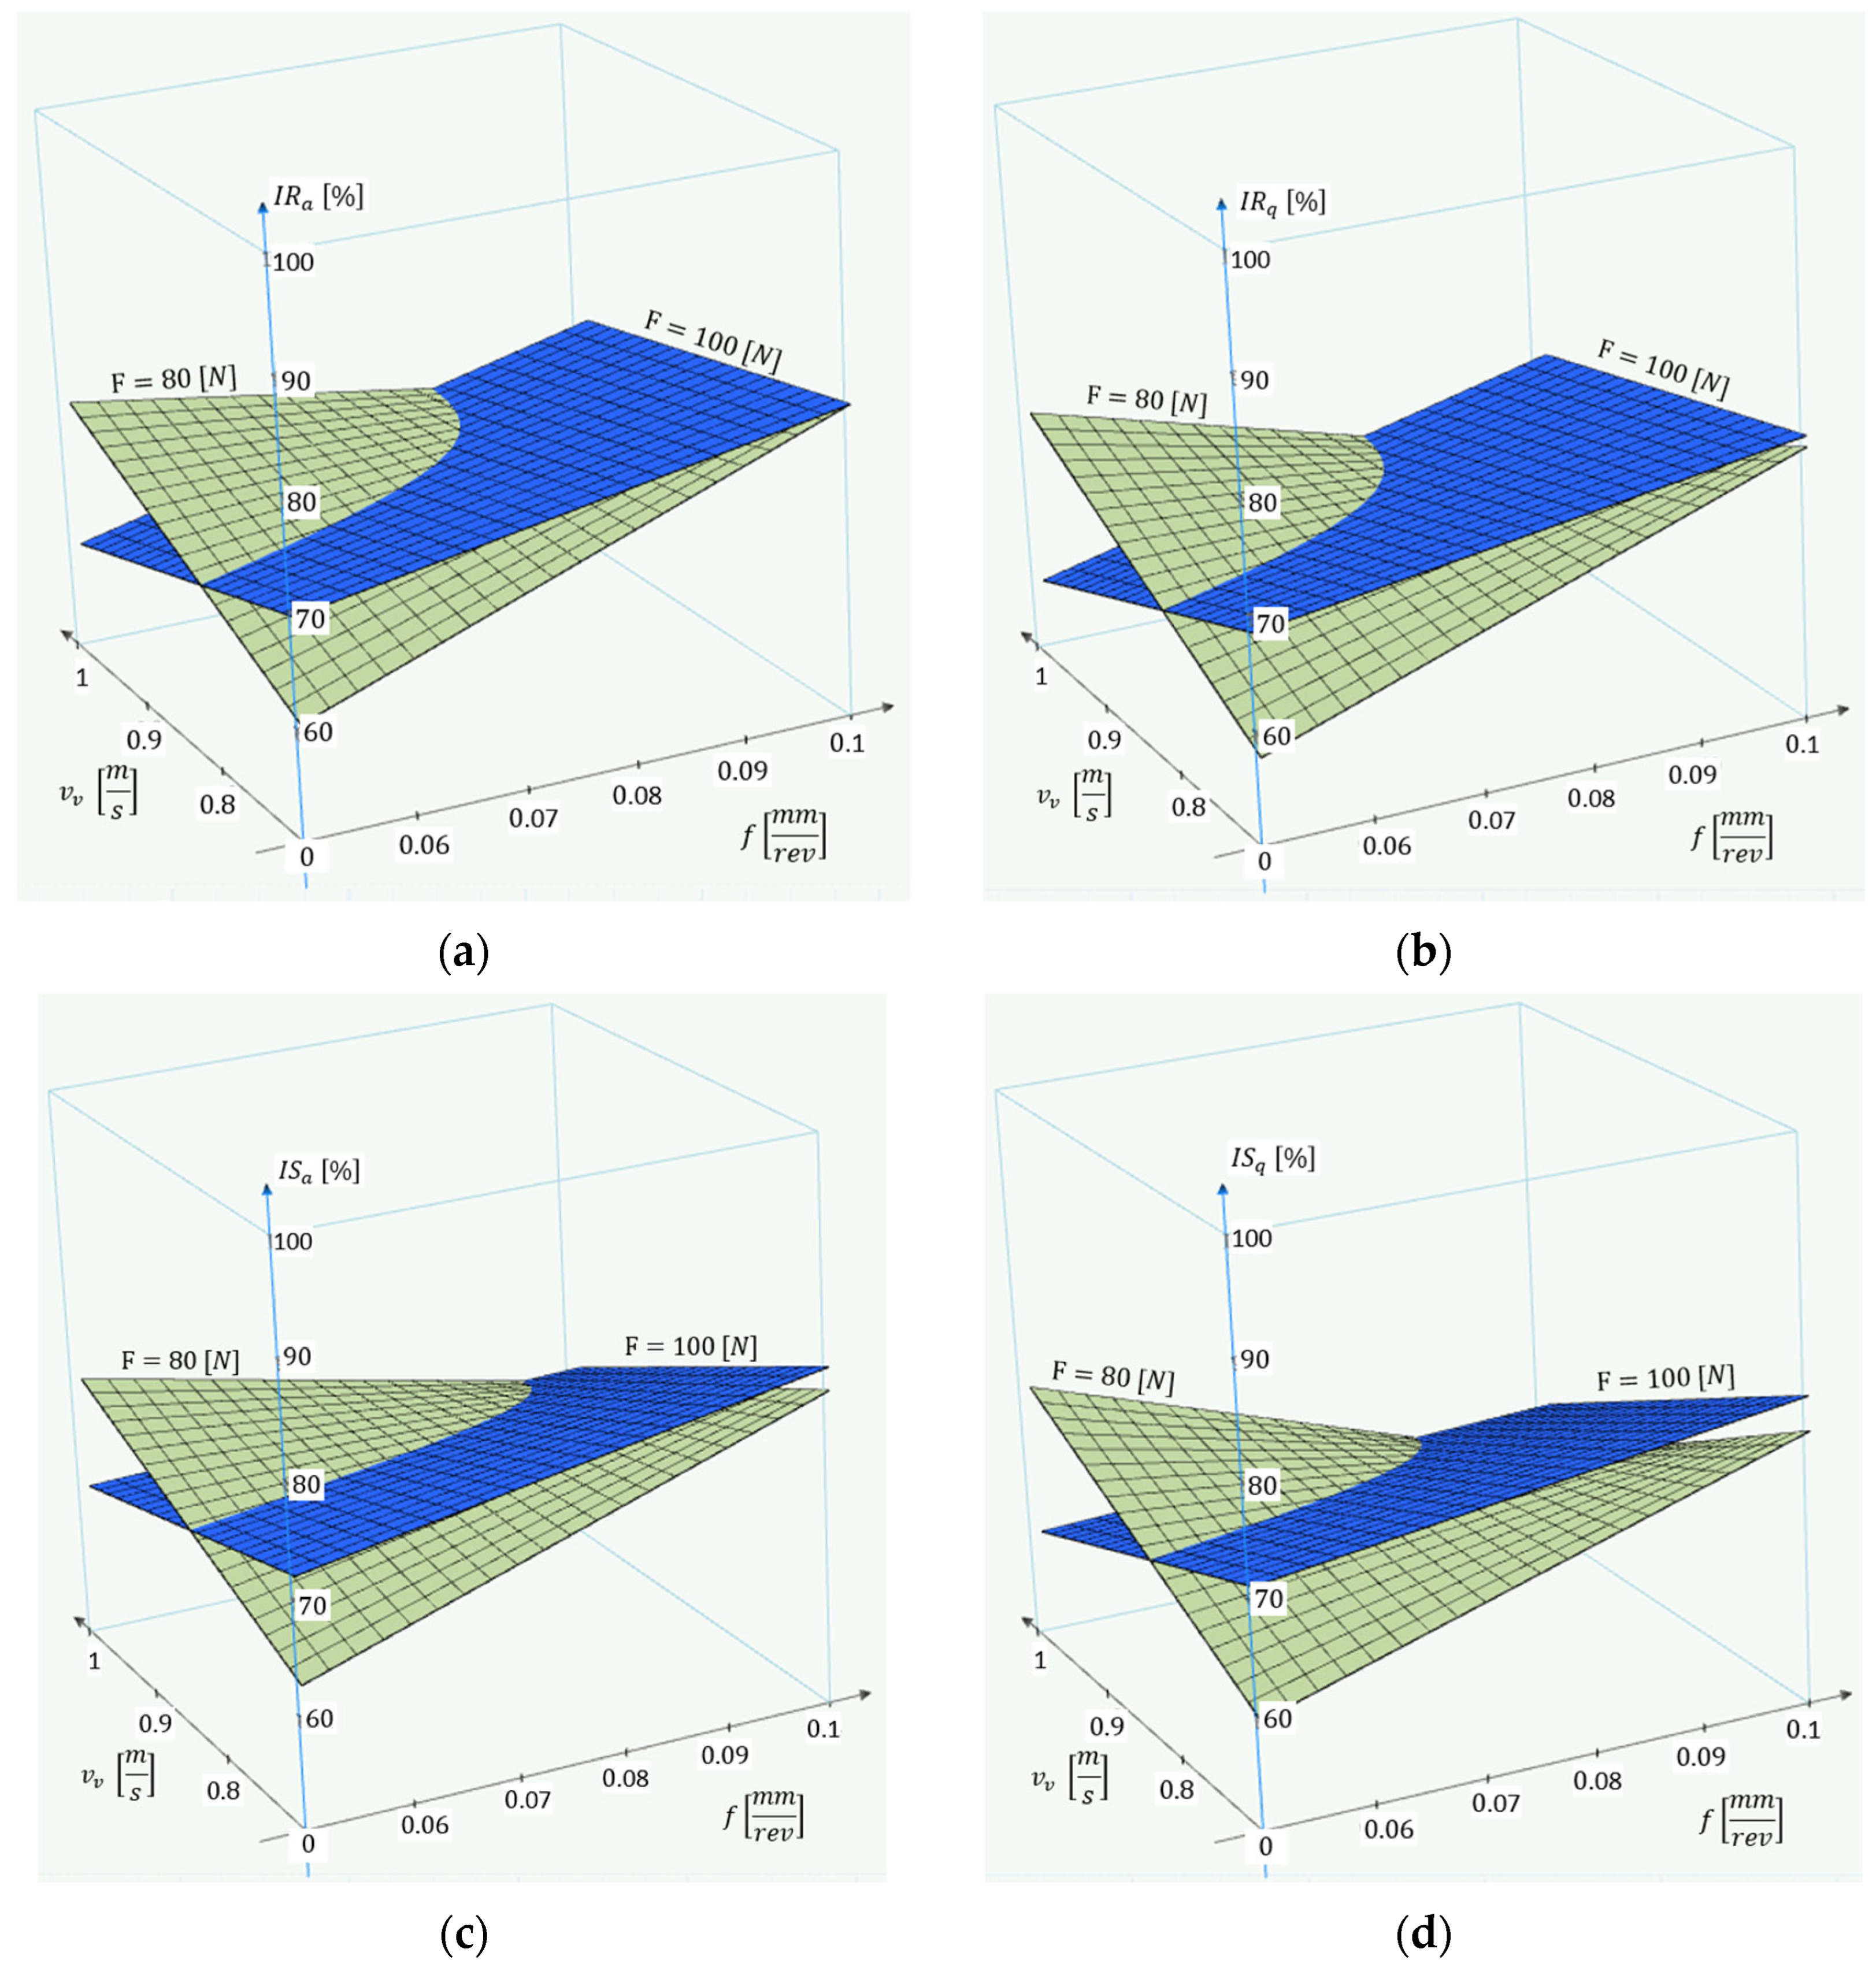
4.3. Investigation of Surface Roughness by Experimental Design for Different Process Parameters

Based on the previous considerations, a full factorial experimental design was carried out, comparing the results of diamond burnishing at 80 N and 100 N burnishing force. This was performed to gain a more accurate understanding of the outcomes when machining with a force lower than the theoretical optimum in order to improve the energy efficiency of the process.
Using the factorial design [77], empirical formulas were developed with PTC Mathcad Prime 10 software. Performing the design of experiments requires the definition of factors and levels, which in this case correspond to the previously introduced technological parameters: feed rate, burnishing speed, and burnishing force. For each parameter—with burnishing force values informed by the findings in earlier subsections—two levels are assigned, referred to hereafter as minimum and maximum values.
By combining these parameters, we obtain a total of eight independent parameter combinations, which can be calculated using the number of factors (f = 3) and the number of levels (p = 2), according to the following formula:
n = p f = 2 3 = 8 ,
The data from these experiments are summarized in Table 6.
In all cases, solutions are sought in the form of Equation (12), where k 0 ;   k 1 ;   k 2 ;   k 3 ;   k 12 ;   k 13 ;   k 23 ;   k 123 are arbitrary real numbers derived from the calculations. The variable “X” substitutes the letter “R” for 2D roughness values and “S” for 3D roughness values, while the subscript “y” generalizes the different types of roughness indicators, written as follows:
( I ) X y = k 0 + k 1 · f + k 2 · F v + k 3 · v v + k 12 · f · F v + k 13 · f ·   v v + k 23 · F v · v v + k 123 · f · F v · v v
Figure 11 shows the experimental results for the two- and three-dimensional surface roughness indicators, while Equations (13)–(16) present the corresponding empirical formulas. All four graphs exhibit essentially the same characteristics, suggesting that no significant differences exist among the various roughness indicators in this case.
R a = 3.2548 35.7575 · f 4.1532 · v v 0.0343 · F v + 49.2671 · f · v v + 0.3954 · f · F v + 0.0448 · v   · F v 0.5221 · f · v v · F v
R q = 4.5951 50.7559 · f 6.0219 · v v 0.0493 · F v + 72.2195 · f · v v + 0.5717 · f · F v + 0.0659 · v   · F v 0.7774 · f · v v · F v
S a = 2.2685 18.8935 · f 2.8288 · v v 0.0221 · F v + 27.3011 · f · v v + 0.1863 · f · F v + 0.0282 · v   · F v 0.2459 · f · v v · F v
S q = 3.7459 34.0105 · f 4.8333 · v v 0.038 · F v + 50.462 · f · v v + 0.355 · f · F v + 0.0501 · v · F v   0.4911 · f · v v · F v
In the graphs, the green color represents the results of diamond burnishing with 80 N, while blue indicates those with 100 N. In most cases, the higher burnishing force results in better surface roughness, within the current intervals of the other two parameters—feed rate and burnishing speed. However, this trend reverses when higher burnishing speed and lower feed rate are applied.
Increasing feed rate worsened surface roughness, while increasing burnishing speed improved surface roughness. Within the current parameter ranges, the following combination is considered optimal for minimizing surface roughness:
f = 0.05 m m r e v         v v = 0.9817 m s                 F = 80   N
Figure 12 presents the experimental results for improvement ratios of two- and three-dimensional surface roughness indicators, similar in structure to the previous figure. Equations (17)–(20) show the corresponding empirical formulas. Again, all four graphs display nearly identical characteristics.
I R a = 617.3081 + 7828.9877 · f + 844.3904 · v v + 7.092 · F v 9699.8958 · f · v v 78.2321 · f · F v                                                     8.8816 · v v · F v + 99.34 · f · v v · F v
I R q = 731.7867 + 9167.8887 · f + 997.4297 · v v + 8.3297 · F v 11622.7857 · f · v v 92.6757 · f                                                     · F v 10.5401 · v v · F v + 119.6249 · f · v v · F v
I S a = 470.0568 + 5651.476 · f + 650.9899 · v v + 5.3679 · F v 6871.8305 · f · v v 51.8225 · f · F v                                                     6.5457 · v v · F v + 64.2584 · f · v v · F v
I S q = 638.927 + 7604.1146 · f + 872.1778 · v v + 7.2023 · F v 9575.5471 · f · v v 72.8039 · f · F v                                                     8.9562 · v v · F v + 92.9142 · f · v v · F v
Based on the improvement ratios, it can also be concluded that in most cases, the higher burnishing force results in better surface roughness improvement when compared to the lower force during diamond burnishing. However, the combination of lower feed rate and higher burnishing speed again proves to be an exception, significantly improving the surface quality.
This confirms that within the examined parameter ranges, the best surface roughness is achieved with the following combination:
f = 0.05 m m r e v         v v = 0.9817 m s                 F = 80   N
With the technological parameters f = 0.05 mm/rev and vv = 0.9817 m/s, the optimal choice was a burnishing force of 83…89 N (optimization of surface roughness metrics) and 86…90 N (optimization of improvement factors), which is close to the 80 N determined using the factorial experimental design. The difference may be due to the different methodology, since during the experimental design we examined all parameter combinations simultaneously, while in the Kraljic matrices we first divided the data into “burnishing speed + feed” pairs and selected from them using the trend lines of the matrix.

5. Summary

The aim of our research was to analyze and optimize the surface roughness of diamond-burnished surfaces using Kraljic matrices and design of experiments.
From the analysis of the Kraljic matrices generated for the surface roughness parameters, we concluded that the parameter combination involving lower feed rate and lower burnishing speed best fulfilled the principles of energy efficiency: good surface quality was associated with low power demand. In contrast, machining processes with higher feed rates and higher burnishing speeds were deemed undesirable due to their high power requirements and poor surface quality.
By examining the improvement factors of the surface roughness parameters using Kraljic matrices, we found that the greatest improvement was achieved with the parameter combination of high feed rate and low burnishing speed, which also proved optimal in terms of power demand. At constant burnishing speed, increasing the feed rate resulted in a higher improvement factor, while increasing the burnishing speed led to a reduction in improvement values.
The data points of the Kraljic matrices were approximated with second-order polynomials. These curves exhibited a minimum point for the surface roughness values and a maximum point for their improvement factors. During the calculations, we determined the optimal burnishing force required to achieve the best surface quality, thus optimizing the process from a surface roughness perspective. These values indicate the threshold beyond which increasing the burnishing force becomes detrimental in terms of both surface quality and energy efficiency, while decreasing the force can improve energy efficiency but at the cost of surface quality.
Based on the Kraljic matrices and the calculated force optima, the parameter combination that proved optimal for surface roughness across the examined roughness metrics was the following:
f 1 = 0.05   m m r e v ;   v v 1 = 0.6938   m s ;   F o p t = 97 104   N
We also applied a full factorial design of experiments to derive empirical equations for surface roughness and its improvement factors as a function of the changes in technological parameters. We found that increasing feed rate worsened surface roughness, while increasing burnishing speed improved surface roughness. Within the investigated parameter ranges, the following combination was found to be the most effective for minimizing surface roughness:
f = 0.05 m m r e v         v v = 0.9817 m s                 F = 80   N

Author Contributions

Conceptualization, S.S. and G.V.; methodology, S.S. and G.V.; software, S.S. and G.V.; validation, S.S.; formal analysis, S.S.; investigation, S.S. and G.V.; resources, S.S. and G.V.; data curation, S.S. and G.V.; writing—original draft preparation, S.S. and G.V.; writing—review and editing, S.S. and G.V.; supervision, G.V.; project administration, S.S. and G.V.; funding acquisition G.V. All authors have read and agreed to the published version of the manuscript.

Funding

This research received no external funding.

Institutional Review Board Statement

Not applicable.

Informed Consent Statement

Not applicable.

Data Availability Statement

The original contributions presented in this study are included in the article. Further inquiries can be directed to the corresponding author.

Conflicts of Interest

The authors declare no conflicts of interest.

References

  1. Kovács, G. Combination of Lean value-oriented conception and facility layout design for even more significant efficiency improvement and cost reduction. Int. J. Prod. Res. 2020, 58, 2916–2936. [Google Scholar] [CrossRef]
  2. Sztankovics, I. Preliminary Study on the Function-Defining 3D Surface Roughness Parameters in Tangential Turning. Int. J. Integr. Eng. 2023, 15, 72–81. [Google Scholar] [CrossRef]
  3. Kundrák, J.; Felhő, C.; Nagy, A. Analysis and Prediction of Roughness of Face Milled Surfaces using CAD Model. Manuf. Technol. 2022, 22, 558–572. [Google Scholar] [CrossRef]
  4. Ferencsik, V. Analytical analysis of the theoretical surface roughness in the case of burnishing of cylindrical workpiece. Cut. Tool Technol. Syst. 2023, 99, 101–109. [Google Scholar] [CrossRef]
  5. Tesfom, K.F.; Felho, C. Examining the impact of slide burnishing parameters on the 3D surface features of medium carbon steel. J. Prod. Eng. 2024, 27, 30–35. [Google Scholar] [CrossRef]
  6. Dix, M.; Posdzich, M. Force-controlled burnishing process for high surface integrity on additive manufactured parts. Procedia CIRP 2022, 108, 642–647. [Google Scholar] [CrossRef]
  7. Ulhe, P.N.; Patil, U.D.; Patil, C.R. Optimization of Roller Burnishing Process Parameters on Surface Roughness Using Response Surface Methodology. Mater. Today Proc. 2019, 18, 3632–3637. [Google Scholar] [CrossRef]
  8. Varga, G.; Smolnicki, S.; Babič, M.; Caesarendra, W. Energy Efficiency Analysis When Grinding and Diamond Burnishing of Components. In Towards Industry 5.0: Selected Papers from ISPR2022; Güneş, G.M., Durakbasa, N.M., Eds.; Springer International Publishing: Cham, Switzerland, 2023; pp. 378–396. [Google Scholar] [CrossRef]
  9. Keymanesh, M.; Ji, H.; Zhang, X.; Wang, J.; Feng, P.; Zhang, J. Multi-roller taper burnishing of internal chamfers and its enhancement mechanism on 7050 aluminum alloy. Int. J. Fatigue 2024, 189, 108571. [Google Scholar] [CrossRef]
  10. Zhou, Z.-Y.; Shi, H.-H.; Zheng, Q.-Y.; Li, Y.; Jiang, Z.-G.; Yuan, Z.-P.; Piao, Z.-P. Research on fabricating gradient nanostructure and enhancing wear resistance in aluminum alloy via two-dimensional ultrasonic surface burnishing. Surf. Coat. Technol. 2024, 494, 131302. [Google Scholar] [CrossRef]
  11. Yuan, Z.; Zhou, Z.; Jiang, Z.; Zhao, Z.; Ding, C.; Piao, Z. Evaluation of Surface Roughness of Aluminum Alloy in Burnishing Process Based on Chaos Theory. Chin. J. Mech. Eng. 2023, 36, 2. [Google Scholar] [CrossRef]
  12. Maximov, J.T.; Anchev, A.P.; Duncheva, G.V.; Ganev, N.; Selimov, K.F. Influence of the process parameters on the surface roughness, micro-hardness, and residual stresses in slide burnishing of high-strength aluminum alloys. J. Braz. Soc. Mech. Sci. Eng. 2017, 39, 3067–3078. [Google Scholar] [CrossRef]
  13. Cai, Y.; Tang, K.; Zhang, H.; Xue, J.; Aslam, J.; Liang, X.; Song, Q.; Liu, Z. Fatigue performance of Ti6Al4V alloy treated with laser-assisted burnishing. Int. J. Fatigue 2025, 193, 108788. [Google Scholar] [CrossRef]
  14. Saffioti, M.R.; Rotella, G.; Cosco, F.; Umbrello, D. Surface changes and fretting fatigue evaluation of Ti6Al4V burnished hip necks. Procedia CIRP 2024, 123, 352–356. [Google Scholar] [CrossRef]
  15. Shen, X.; Ma, S.; Wang, Z.; Yu, Z.; Zhang, J.; Ma, X.; Zhu, J.; Yin, Y.; Pan, S.; Wei, F. Multiscale mechanical performance evaluation of L-DED Ti6Al4V by novel ultrasonic burnishing (UB). J. Manuf. Process. 2024, 124, 708–719. [Google Scholar] [CrossRef]
  16. Jagadeesh, G.V.; Setti, S.G. Biodegradation performance of ball burnished magnesium alloy in stimulated body fluids for bioresorbable implant applications. Mater. Today Commun. 2024, 38, 108525. [Google Scholar] [CrossRef]
  17. Buldum, B.B.; Cagan, S.C. Study of Ball Burnishing Process on the Surface Roughness and Microhardness of AZ91D Alloy. Exp. Tech. 2018, 42, 233–241. [Google Scholar] [CrossRef]
  18. Teimouri, R. A framework toward fatigue life modeling of machining process verified in burnishing. Mech. Syst. Signal Process. 2025, 223, 111923. [Google Scholar] [CrossRef]
  19. Alharbi, N. Interaction of electric current with burnishing parameters in surface integrity assessment of additively manufactured Inconel 718. Measurement 2024, 230, 114474. [Google Scholar] [CrossRef]
  20. Qi, B.; Chai, Z.; Huang, X.; Guo, W.; Ren, X.; Chen, H.; Chen, X. Surface integrity improvement of the ground surface of Inconel 718 fabricated by forging and additive manufacturing using a robotic rotational burnishing method. J. Manuf. Process. 2024, 125, 566–579. [Google Scholar] [CrossRef]
  21. Brocka, G.; Saelzera, J.; Biermann, D. Finite element analysis of the surface finishing of additively manufactured 316L stainless steel by ball burnishing. Procedia CIRP 2023, 117, 287–292. [Google Scholar] [CrossRef]
  22. Teimouri, R.; Sohrabpoor, H.; Grabowski, M.; Wyszynski, D.; Skoczypiec, S.; Raghavendra, R. Simulation of surface roughness evolution of additively manufactured material fabricated by laser powder bed fusion and post-processed by burnishing. J. Manuf. Process. 2022, 84, 10–27. [Google Scholar] [CrossRef]
  23. Attabi, S.; Himour, A.; Laouar, L.; Motallebzadeh, A. Effect of Ball Burnishing on Surface Roughness and Wear of AISI 316L SS. J. Bio-Tribo-Corros. 2021, 7, 7. [Google Scholar] [CrossRef]
  24. Argirov, Y.; Maximov, J.; Duncheva, G.; Anchev, A.; Dunchev, V.; Mechkarova, T. Evolution of Surface Integrity Characteristics and Mechanical Behavior of Diamond Burnished and Turned AISI 304 Steel Specimens After Prolonged Exposure to Natural Seawater. Coatings 2025, 15, 31. [Google Scholar] [CrossRef]
  25. Maximov, J.; Duncheva, G.; Anchev, A.; Dunchev, V.; Argirov, Y. Improvement in Fatigue Strength of Chromium–Nickel Austenitic Stainless Steels via Diamond Burnishing and Subsequent Low-Temperature Gas Nitriding. Appl. Sci. 2024, 14, 1020. [Google Scholar] [CrossRef]
  26. de Oliveira, D.A.; Brito, P.P.; de Castro Magalhaes, F.; Azzi, P.C.; Ardisson, J.D.; Abrao, A.M. Influence of low plasticity burnishing on the formation of strain induced martensite in the surface layer. J. Mater. Res. Technol. 2023, 27, 4573–4594. [Google Scholar] [CrossRef]
  27. Kluz, R.; Antosz, K.; Trzepiecinski, T.; Bucior, M. Modelling the Influence of Slide Burnishing Parameters on the Surface Roughness of Shafts Made of 42CrMo4 Heat-Treatable Steel. Materials 2021, 14, 1175. [Google Scholar] [CrossRef] [PubMed]
  28. Su, H.; Shen, X.; Xu, C.; He, J.; Wang, B.; Su, G. Surface characteristics and corrosion behavior of TC11 titanium alloy strengthened by ultrasonic roller burnishing at room and medium temperature. J. Mater. Res. Technol. 2020, 9, 8172–8185. [Google Scholar] [CrossRef]
  29. Maximov, J.; Duncheva, G.; Ichkova, M.; Anastasov, K. Optimal Diamond Burnishing of Chromium–Nickel Austenitic Stainless Steels Based on the Finishing Process–Surface Integrity–Operating Behavior Correlations. Metals 2025, 15, 574. [Google Scholar] [CrossRef]
  30. Maximov, J.; Duncheva, G.; Anchev, A.; Dunchev, V.; Anastasov, K.; Argirov, Y. Sustainable Diamond Burnishing of Chromium–Nickel Austenitic Stainless Steels: Effects on Surface Integrity and Fatigue Limit. Appl. Sci. 2024, 14, 9031. [Google Scholar] [CrossRef]
  31. Maximov, J.T.; Duncheva, G.V.; Anchev, A.P.; Dunchev, V.P. Explicit correlation between surface integrity and fatigue limit of surface cold worked chromium nickel austenitic stainless steels. Int. J. Adv. Manuf. Technol. 2024, 133, 6041–6058. [Google Scholar] [CrossRef]
  32. Maximov, J.; Duncheva, G.; Anchev, A.; Dunchev, V.; Argirov, Y.; Nikolova, M. Effects of Heat Treatment and Diamond Burnishing on Fatigue Behaviour and Corrosion Resistance of AISI 304 Austenitic Stainless Steel. Appl. Sci. 2023, 13, 2570. [Google Scholar] [CrossRef]
  33. Maximov, J.; Duncheva, G.; Anchev, A.; Dunchev, V.; Argirov, Y. Effect of Diamond Burnishing on Fatigue Behaviour of AISI 304 Chromium-Nickel Austenitic Stainless Steel. Materials 2022, 15, 4768. [Google Scholar] [CrossRef] [PubMed]
  34. Maximov, J.; Duncheva, G.; Anchev, A.; Dunchev, V.; Argirov, Y.; Todorov, V.; Mechkarova, T. Effects of Heat Treatment and Severe Surface Plastic Deformation on Mechanical Characteristics, Fatigue, and Wear of Cu-10Al-5Fe Bronze. Materials 2022, 15, 8905. [Google Scholar] [CrossRef] [PubMed]
  35. Varga, G.; Dezső, G.; Szigeti, F. Surface Roughness Improvement by Sliding Friction Burnishing of Parts Produced by Selective Laser Melting of Ti6Al4V Titanium Alloy. Machines 2022, 10, 400. [Google Scholar] [CrossRef]
  36. Ferencsik, V.; Varga, G. The Influence of Diamond Burnishing Process Parameters on Surface Roughness of Low-Alloyed Aluminium Workpieces. Machines 2022, 10, 564. [Google Scholar] [CrossRef]
  37. Duncheva, G.; Maximov, J.; Anchev, A.; Dunchev, V.; Argirov, Y.; Velkov, S. Modelling and Optimization of Surface Integrity and Sliding Wear Resistance of Diamond-Burnished Holes in Austenitic Stainless Steel Cylinder Lines. Machines 2023, 11, 872. [Google Scholar] [CrossRef]
  38. Duncheva, G.V.; Maximov, J.T.; Anchev, A.P.; Dunchev, V.P.; Argirov, Y.B.; Kandeva-Ivanova, M. Enhancement of the wear resistance of CuAl9Fe4 sliding bearing bushings via diamond burnishing. Wear 2022, 510–511, 204491. [Google Scholar] [CrossRef]
  39. Maximov, J.T.; Anchev, A.P.; Dunchev, V.P.; Argirov, Y.B.; Ganev, N.; Drumeva, D.K. Improvement in surface integrity of CuAl8Fe3 bronze via diamond burnishing. Int. J. Adv. Manuf. Technol. 2022, 119, 5885–5902. [Google Scholar] [CrossRef]
  40. Patel, K.A.; Brahmbhatt, P.K. A comparative study of the RSM and ANN models for predicting surface roughness in roller burnishing. Procedia Technol. 2016, 23, 391–397. [Google Scholar] [CrossRef]
  41. Kanovic, Z.; Vukelic, D.; Simunovic, K.; Prica, M.; Saric, T.; Tadic, B.; Simunovic, G. The Modelling of Surface Roughness after the Ball Burnishing Process with a High-Stiffness Tool by Using Regression Analysis, Artificial Neural Networks, and Support Vector Regression. Metals 2022, 12, 320. [Google Scholar] [CrossRef]
  42. Marquez-Herrera, A.; Diosdado-De la Peña, J.A. Influence of ball-burnishing on roughness, hardness and corrosion resistance of AISI 1045 steel. Procedia Manuf. 2019, 34, 287–292. [Google Scholar] [CrossRef]
  43. Patel, K.A.; Brahmbhatt, P.K. Burnishing of aerospace alloy: A theoretical–experimental approach. J. Manuf. Syst. 2015, 37, 472–478. [Google Scholar] [CrossRef]
  44. Babu, P.R.; Ankamma, K.; Prasad, T.S.; Raju, A.V.S.; Prasad, N.E. Optimization of Burnishing Parameters by DOE and Surface Roughness, Microstructure and Micro Hardness Characteristics of AA6061 Aluminium Alloy in T6 Condition. J. Eng. Res. Appl. (IJERA) 2012, 2, 1139–1146. [Google Scholar]
  45. Thorat, S.R.; Thakur, A.G. Analysis of surface roughness and wear resistance in low plasticity burnishing process using multi-objective optimization technique. Mater. Today Proc. 2021, 41, 1082–1088. [Google Scholar] [CrossRef]
  46. Kovács, Z.F.; Viharos, Z.J.; Kodácsy, J. Surface flatness and roughness evolution after magnetic assisted ball burnishing of magnetizable and non-magnetizable materials. Measurement 2020, 158, 107750. [Google Scholar] [CrossRef]
  47. Swirad, S.; Wdowik, R. Determining the effect of ball burnishing parameters on surface roughness using the Taguchi method. Procedia Manuf. 2019, 34, 287–292. [Google Scholar] [CrossRef]
  48. Sachin, B.; Narendranath, S.; Chakradhar, D. Analysis of surface hardness and surface roughness in diamond burnishing of 17-4 PH stainless steel. IOP Conf. Ser. Mater. Sci. Eng. 2019, 577, 012075. [Google Scholar] [CrossRef]
  49. Shirsat, U.; Ahuja, B.; Dhuttargaon, M. Effect of Burnishing Parameters on Surface Finish. J. Inst. Eng. India Ser. C 2017, 98, 431–436. [Google Scholar] [CrossRef]
  50. Borysenko, D.; Welzel, F.; Karpuschewski, B.; Kundrák, J.; Voropai, V. Simulation of the burnishing process on real surface structures. Precis. Eng. 2021, 68, 166–173. [Google Scholar] [CrossRef]
  51. Ferencsik, V. FEM Investigation of the Roughness and Residual Stress of Diamond Burnished Surface. J. Exp. Theor. Anal. 2024, 2, 80–90. [Google Scholar] [CrossRef]
  52. Duncheva, G.V.; Maximov, J.T.; Anchev, A.P.; Dunchev, V.P.; Atanasov, T.P.; Capek, J. Finite element and experimental study of the residual stresses in 2024-T3 Al alloy treated via single toroidal roller burnishing. J. Braz. Soc. Mech. Sci. Eng. 2021, 43, 55. [Google Scholar] [CrossRef]
  53. Maximov, J.T.; Duncheva, G.V.; Dunchev, V.P.; Anchev, A.P. Different strategies for finite element simulations of static mechanical surface treatment processes—A comparative analysis. J. Braz. Soc. Mech. Sci. Eng. 2021, 43, 371. [Google Scholar] [CrossRef]
  54. Yamana, N.; Sunay, N.; Kaya, M.; Kaynak, Y. Enhancing Surface Integrity of Additively Manufactured Inconel 718 by Roller Burnishing Process. Procedia CIRP 2022, 108, 681–686. [Google Scholar] [CrossRef]
  55. Duncheva, G.V.; Maximov, J.T.; Dunchev, V.P.; Anchev, A.P.; Atanasov, T.P. Improvement in Fatigue Performance of 2024-T3 Al Alloy Via Single Toroidal Roller Burnishing. J. Mater. Eng. Perform. 2021, 30, 2256–2266. [Google Scholar] [CrossRef]
  56. Thit, M.; Rocissano, A.; Hatem, A.; Uddin, M.; Hall, C.; Schlaefer, T. Surface integrity and high-cycle fatigue life of direct laser metal deposited AISI 431 alloys modified by plasticity ball burnishing. Int. J. Fatigue 2025, 190, 108614. [Google Scholar] [CrossRef]
  57. Li, T.; Uddin, M.; Stevens, G. Effect of ball burnishing on surface roughness, wettability, mechanical integrity and antifouling resistance of UHMWPE. Surf. Coat. Technol. 2024, 476, 130237. [Google Scholar] [CrossRef]
  58. Han, K.; Tan, L.; Yao, C.; Zhang, D. Evolution and anti-fatigue mechanism of surface characteristics of Ti60 alloy induced by ball burnishing and shot peening during tensile-compression fatigue. Eng. Fail. Anal. 2024, 159, 108136. [Google Scholar] [CrossRef]
  59. Jiménez-García, J.I.; Capilla-González, G.; Balvantín-García, A.de.J.; Travieso-Rodriguez, J.A.; Ruíz-López, I.; Saldana-Robles, A. A numerical investigation into the influence of the slide burnishing process on the real surface roughness and residual stress profiles of AHSS. J. Mater. Res. Technol. 2024, 33, 1406–1419. [Google Scholar] [CrossRef]
  60. Zhang, W.; Dong, H.; Li, Y.; Yang, C.; Xue, H. Combining turning with slide burnishing to improve surface integrity and stress corrosion resistance. J. Manuf. Process. 2023, 107, 16–33. [Google Scholar] [CrossRef]
  61. Maximov, J.; Duncheva, G. Effects of Cryogenic- and Cool-Assisted Burnishing on the Surface Integrity and Operating Behavior of Metal Components: A Review and Perspectives. Machines 2024, 12, 312. [Google Scholar] [CrossRef]
  62. Maximov, J.; Duncheva, G. The Correlation between Surface Integrity and Operating Behaviour of Slide Burnished Components—A Review and Prospects. Appl. Sci. 2023, 13, 3313. [Google Scholar] [CrossRef]
  63. Maximov, J.T.; Duncheva, G.V.; Anchev, A.P.; Dunchev, V.P.; Capek, J. A cost effective optimization approach for improving the fatigue strength of diamond burnished steel components. J. Braz. Soc. Mech. Sci. Eng. 2021, 43, 33. [Google Scholar] [CrossRef]
  64. Kraljic, P. Purchasing Must Become Supply Management. Harv. Bus. Rev. 1983, 61, 109–117. [Google Scholar]
  65. Saputro, T.E.; Figueira, G.; Almada-Lobo, B. A comprehensive framework and literature review of supplier selection under different purchasing strategies. Comput. Ind. Eng. 2022, 167, 108010. [Google Scholar] [CrossRef]
  66. Chen, X.; He, Y.; Pakdel, G.H.; Liu, X.; Wang, S. A comprehensive multi-stage decision-making model for supplier selection and order allocation approach in the digital economy. Adv. Eng. Inform. 2025, 63, 102961. [Google Scholar] [CrossRef]
  67. Corsini, F.; Bernardi, C.D.; Gusmerotti, N.M.; Frey, M. Introducing the circular assessment of suppliers (CAoS) tool: A Kraljic matrix-based tool to facilitate circular procurement in private organizations. J. Clean. Prod. 2024, 452, 142085. [Google Scholar] [CrossRef]
  68. Pulicharla, R.; Brar, S.K.; Rouissi, T.; Auger, S.; Drogui, P.; Verma, M.; Surampalli, R.Y. Degradation of chlortetracycline in wastewater sludge by ultrasonication, Fenton oxidation, and ferro-sonication. Ultrason. Sonochem. 2017, 34, 332–342. [Google Scholar] [CrossRef] [PubMed]
  69. Skarohlíd, R.; Kraljic, D.; Suchan, J.; Kühnl, K.; Hanzlová, B.; Tesínská, P.; Kholomyeva, M.; Martinec, M.; Michalcová, A.; McGachy, L. Overlooked effects of chlorides and bicarbonates on the intensity of peroxydisulfate activation in Fe(II)/citric acid-S2O82− process. Environ. Technol. Innov. 2024, 35, 103687. [Google Scholar] [CrossRef]
  70. Karabulut, G.; Subasi, B.G.; Ivanova, P.; Goksen, G.; Chalova, V.; Capanoglu, E. Towards sustainable and nutritional-based plant protein sources: A review on the role of rapeseed. Food Res. Int. 2025, 202, 115553. [Google Scholar] [CrossRef] [PubMed]
  71. Felhő, C.; Tesfom, F.; Varga, G. ANOVA Analysis and L9 Taguchi Design for Examination of Flat Slide Burnishing of Unalloyed Structural Carbon Steel. J. Manuf. Mater. Process. 2023, 7, 136. [Google Scholar] [CrossRef]
  72. Varga, G. Effect of burnishing technological parameters on the surface roughness and hardness of stainless steel test pieces (A vasalástechnológiai paraméterek hatása a rozsdamentes acél próbadarabok felületi érdességére és keménységére). Multidiszcip. Tudományok Miskolci Egy. Közleménye 2022, 12, 151–163. (In Hungarian) [Google Scholar] [CrossRef]
  73. Maximov, J.T.; Anchev, A.P.; Duncheva, G.V. Modeling of the friction in the tool-workpiece system in diamond burnishing process. Coupled Syst. Mech. 2015, 4, 279–295. [Google Scholar] [CrossRef]
  74. Available online: https://www.imeco-th.cz/files/tinymce/AltiSurf%E2%84%A2%20520.pdf (accessed on 13 July 2025).
  75. ISO 21920-2:2021; Geometrical Product Specifications (GPS)—Surface Texture: Profile Part 2: Terms, Definitions and Surface Texture Parameters. ISO: Geneva, Switzerland, 2021.
  76. ISO 25178-2:2021; Geometrical Product Specifications (GPS)—Surface Texture: Areal. Part 2: Terms, Definitions and Surface Texture Parameters. ISO: Geneva, Switzerland, 2021.
  77. Fridrik, L. Selected Chapters on the Topic of Designing Engineering Technology Experiments; Tankönyvkiadó: Budapest, Hungary, 1993. (In Hungarian) [Google Scholar]
Figure 1. Structure of this paper.
Applsci 15 08025 g001
Figure 2. Schematic representation of the diamond burnishing process [72].
Applsci 15 08025 g002
Figure 3. Spatial relationship between real and calculated burnishing forces.
Applsci 15 08025 g003
Figure 4. The applied Kraljic matrices: (a) Surface roughness parameter matrix; (b) Improvement factor matrix.
Applsci 15 08025 g004
Figure 5. Kraljic matrices of 2D surface roughness parameters during diamond burnishing.
Applsci 15 08025 g005
Figure 6. Kraljic matrices of 3D surface roughness parameters during diamond burnishing.
Applsci 15 08025 g006
Figure 7. Kraljic matrices of improvement factors for 2D surface roughness parameters.
Applsci 15 08025 g007
Figure 8. Kraljic matrices of improvement factors for 3D surface roughness parameters.
Applsci 15 08025 g008
Figure 9. Displaying the trendline equation in Microsoft Excel.
Applsci 15 08025 g009
Figure 10. Defining the meaning of force optimum.
Applsci 15 08025 g010
Figure 11. Variation of surface roughness indicators as a function of technological parameters: (a) Ra; (b) Rq; (c) Sa; (d) Sq.
Applsci 15 08025 g011
Figure 12. Variation of improvement ratios as a function of technological parameters: (a) IRa; (b) IRq; (c) ISa; (d) ISq.
Applsci 15 08025 g012
Table 1. Data of the diamond burnishing parameter variations.
No. f m m r e v n 1 m i n F v [ N ]
1-10.05265120
1-20.05265100
1-30.0526580
1-40.0526560
2-10.1265120
2-20.1265100
2-30.126580
2-40.126560
3-10.05375120
3-20.05375100
3-30.0537580
3-40.0537560
4-10.1375120
4-20.1375100
4-30.137580
4-40.137560
Table 2. Measurement results of surface roughness metrics.
No. f m m r e v v v m s F v [ N ] R a μ m R q μ m S a μ m S q μ m
1-10.050.69381200.16130.20470.19180.2465
1-20.050.69381000.14250.18560.14080.1816
1-30.050.6938800.17290.22540.17430.2338
1-40.050.6938600.23650.30360.25970.3423
2-10.10.69381200.20970.27150.42950.5365
2-20.10.69381000.22970.31510.57790.6953
2-30.10.6938800.22690.32250.25340.3262
2-40.10.6938600.32630.42850.22170.3026
3-10.050.98171200.21480.26140.21520.2940
3-20.050.98171000.19550.27050.17840.2505
3-30.050.9817800.11800.15450.12010.1559
3-40.050.9817600.19100.25070.22080.3047
4-10.10.98171200.30810.38650.38050.5016
4-20.10.98171000.24040.32060.29830.3909
4-30.10.9817800.28000.39600.29510.4235
4-40.10.9817600.40260.54350.47190.6252
Table 3. Measurement results of the improvement factors for surface roughness metrics.
No. f m m r e v v v m s F v [ N ] I R a % I R q % I S a % I S q %
1-10.050.693812075.40%74.82%72.94%74.00%
1-20.050.693810069.94%68.73%72.24%71.37%
1-30.050.69388060.65%58.07%62.95%59.94%
1-40.050.69386050.73%48.33%47.32%44.88%
2-10.10.693812082.00%80.96%78.82%77.80%
2-20.10.693810078.35%75.53%80.23%77.70%
2-30.10.69388078.37%74.55%78.18%74.61%
2-40.10.69386064.96%63.08%63.97%60.53%
3-10.050.981712050.94%52.37%54.10%50.10%
3-20.050.981710060.71%57.33%64.79%60.53%
3-30.050.98178073.96%72.92%74.69%73.92%
3-40.050.98176055.62%53.90%49.78%45.12%
4-10.10.981712066.49%64.44%61.25%58.31%
4-20.10.981710072.49%69.02%66.36%62.77%
4-30.10.98178066.45%59.85%65.00%57.75%
4-40.10.98176053.25%47.12%45.56%40.18%
Table 4. Results of force optimization calculation for surface roughness indicators.
R/S f m m r e v v v m s Equation P o p t W F o p t N
  R a 0.050.6938y = 0.0107x2 − 0.1519x + 0.68447.10102
  R q y = 0.0126x2 − 0.1821x + 0.84367.23104
  S a y = 0.0177x2 − 0.2382x + 0.9466.7397
  S q y = 0.0225x2 − 0.3057x + 1.22776.7998
  R a 0.050.9817y = 0.006x2 − 0.0982x + 0.55128.1883
  R q y = 0.0057x2 − 0.0924x + 0.58198.1183
  S a y = 0.0089x2 − 0.1554x + 0.8188.7389
  S q y = 0.0125x2 − 0.2172x + 1.13658.6988
  R a 0.10.6938y = 0.0103x2 − 0.1538x + 0.78157.47108
  R q y = 0.0081x2 − 0.1356x + 0.8468.37121
  S a y = 0.0177x2 − 0.2417x + 1.04186.8398
  S q y = 0.02x2 − 0.2843x + 1.3067.11102
  R a 0.10.9817y = 0.0123x2 − 0.2346x + 1.35769.5497
  R q y = 0.0138x2 − 0.2724x + 1.67169.87101
  S a y = 0.0168x2 − 0.3107x + 1.71419.2594
  S q y = 0.0203x2 − 0.3785x + 2.15089.3295
Table 5. Results of force optimization calculation for improvement factors.
R/S f m m r e v v v m s Equation P o p t W F o p t N
  I R a 0.050.6938y = −0.0058x2 + 0.1324x + 0.05511.41165
I R q y = −0.0047x2 + 0.1241x + 0.04613.20190
  I S a y = −0.0194x2 + 0.3041x − 0.45817.84113
  I S q y = −0.0161x2 + 0.2728x − 0.40968.47122
  I R a 0.050.9817y = −0.0182x2 + 0.3083x − 0.60958.4786
I R q y = −0.0155x2 + 0.2645x − 0.4578.5387
  I S a y = −0.0231x2 + 0.4094x − 1.0968.8690
  I S q y = −0.0254x2 + 0.4502x − 1.29578.8690
  I R a 0.10.6938y = −0.0127x2 + 0.1952x + 0.06547.69111
I R q y = −0.0078x2 + 0.1373x + 0.20278.80127
  I S a y = −0.0203x2 + 0.287x − 0.19917.07102
  I S q y = −0.0181x2 + 0.2662x − 0.18427.35106
  I R a 0.10.9817y = −0.0125x2 + 0.2434x − 0.47149.7499
I R q y = −0.0112x2 + 0.2295x − 0.496410.25104
  I S a y = −0.0159x2 + 0.306x − 0.78879.6298
  I S q y = −0.0143x2 + 0.2828x − 0.76679.89101
Table 6. The technological data used for the factorial experimental design.
No. f m m r e v v v m s F v [ N ]
1-30.050.693880
2-30.10.693880
3-30.050.981780
4-30.10.981780
1-20.050.6938100
2-20.10.6938100
3-20.050.9817100
4-20.10.9817100
Disclaimer/Publisher’s Note: The statements, opinions and data contained in all publications are solely those of the individual author(s) and contributor(s) and not of MDPI and/or the editor(s). MDPI and/or the editor(s) disclaim responsibility for any injury to people or property resulting from any ideas, methods, instructions or products referred to in the content.

