Article

Hybrid Methods for Selecting Precast Concrete Suppliers Based on Factory Capacity

by
Mohammed I. Aldokhi
,
Khalid S. Al-Gahtani
*,
Naif M. Alsanabani
and
Saad I. Aljadhai
Department of Civil Engineering, College of Engineering, King Saud University, P.O. Box 800, Riyadh 12372, Saudi Arabia
*
Author to whom correspondence should be addressed.
Appl. Sci. 2025, 15(14), 8027; https://doi.org/10.3390/app15148027
Submission received: 17 June 2025 / Revised: 10 July 2025 / Accepted: 17 July 2025 / Published: 18 July 2025

Abstract

Supplier selection is one of the critical processes that entail multiple complex deliberations. The selection of an appropriate alternative supplier is a highly intricate process, primarily due to there being multiple criteria which are exceptionally subjective. This paper aims to develop a practical framework for choosing a suitable precast supplier by integrating the Value Engineering (VE) concept, Stepwise Weight Assessment Ratio Analysis (SWARA), and the Weighted Aggregated Sum Product Assessment (WASPAS) technique. This paper introduces a novel method to estimate the quality weights of alternative suppliers’ criteria (CQW) by linking factory capacity with the coefficients of the nine significant criteria, computed using principal component analysis (PCA). None of the formal studies make this link directly. The framework’s findings were validated by comparing its results with an expert assessment of five Saudi supplier alternatives. The results revealed that the framework’s results agree with the expert’s judgment. The method of payment criterion received the highest weight, indicating that it was considered the most important of the nine criteria identified. Combining PCA and VE with the WASPAS technique resulted in an unprecedentedly effective selection tool for precast suppliers.

1. Introduction

The construction industry in the Kingdom of Saudi Arabia (KSA) is one of the fastest-growing sectors in the country. For the past 30 years, there has been a significant increase in construction projects across the KSA. This trend is driven by increased demand for housing, which is occasioned by several factors. First, the country has the largest population compared to other members of the Gulf Cooperation Council region [1]. Between 1974 and 2020, the population of the KSA increased from 7 million to 31 million [2]. As of 2022, the housing demand in the KSA is approximately four million housing units. Second, the KSA government has doubled its efforts to facilitate infrastructural developments. Such developments are geared towards realizing the country’s economic and social reform plan, titled Saudi Vision 2030 [3]. The cities of Mecca and Medina attract the most religious tourists and Muslims annually [4]. This attraction explains the demand for accommodation, especially during the annual Islamic pilgrimage. Therefore, the construction industry is currently crucial to the KSA economy.
Stakeholders in the KSA construction industry strive to adopt the best practices that facilitate the completion of quality projects in the shortest time possible. The KSA’s Ministry of Housing approved the use of precast elements, among other modern construction methods, to address problems associated with traditional construction methods in the country [5]. Additionally, there is a substantial global shift towards minimizing the carbon footprints of new housing units. One way to achieve this is by using precast concrete instead of in situ concrete constructions.
Many people also prefer precast concrete structures due to their superior resistance to fire, natural disasters, and attacks from mold and insects [6]. This reduction in emissions helps reduce the costs incurred for maintenance and insurance premiums. Precast concrete is also a suitable construction material because its density causes buildings to absorb sound effectively. The most appealing attribute of precast concrete is that it helps to reduce the duration of completing construction projects. Consequently, the project’s subsequent phases commence immediately after the installation of precast structures. Priya and Neamitha [7] also add that using precast concrete enables project owners to minimize the cost of completing their projects.
Successful construction project completion involves many stakeholders, including contractors, suppliers, and project owners. Many researchers have sought to identify the reasons behind incomplete projects and delays in completing construction projects in the KSA [8,9,10]. Any stakeholders listed above may hinder the successful execution of a construction project if they fail to promptly address issues arising from their roles. For instance, the acquisition of the required construction materials is fundamental to the successful completion of a project. Therefore, suppliers of construction materials should ensure they deliver quality materials promptly and at a relatively cheaper cost. Alshakhrit et al. [9] identified delays in material delivery as the third major cause of project completion delays in the KSA.
This interconnectedness is often formalized through contractual obligations, where suppliers are explicitly responsible for adhering to material specifications, delivery schedules, and quality standards. Failure to meet these contractual terms directly translates into project risks for the main contractor and, by extension, the project owner, necessitating robust supplier vetting. While the primary focus often lies on direct material suppliers, it is also important to recognize that main contractors frequently subcontract various project elements, creating a cascading risk effect. Subcontractors typically assume specific performance and delivery risks as defined in their agreements with the main contractor. Breaches of these secondary contracts can result in liquidated damages, additional project delays, and cost overruns, ultimately affecting the overall project’s successful completion and potentially creating liabilities for the main contractor or owner.
Furthermore, the nature of supplier engagement, such as the use of ‘nominated suppliers,’ profoundly impacts risk distribution. A nominated supplier is specifically chosen and mandated by the project owner for the contractor to engage with, often due to specialized expertise, proprietary materials, or established relationships. While this approach can ensure quality and consistency for critical components, it shifts some procurement and performance risks away from the main contractor. In such arrangements, the main contractor’s liability for delays or defects arising directly from the nominated supplier’s performance may be limited, with the primary risk reverting to the project owner who made the nomination. This distinct contractual model fundamentally alters the risk allocation matrix and demands careful consideration in early project planning and legal agreements to clearly define responsibilities and mitigate potential disputes. Consequently, project owners or contractors must select effective suppliers before beginning a construction project.
The inherent complexity of selecting a precast concrete supplier, driven by numerous qualitative and subjective criteria, poses a significant challenge that traditional, less comprehensive decision-making methods struggle to address effectively. Simple evaluations often yield inconsistent outcomes due to their limited capacity to account for the multifaceted trade-offs. While various Multicriteria Decision-Making (MCDM) approaches exist, existing studies frequently fall short in two key areas: they either rely too heavily on singular expert intuition for all decision parameters, leading to time-consuming and resource-intensive processes, or they lack a robust, direct mechanism for integrating objective operational data, such as factory capacity, into the qualitative assessment of supplier performance. This research identifies a critical gap in the existing literature: the absence of a comprehensive yet efficient and integrated framework that systematically evaluates suppliers against diverse criteria and explicitly links objective operational attributes to the derived quality weights. The need for an integrated approach combining Stepwise Weighted Ratio Analysis (SWARA) for efficient expert-driven criteria weighting, principal component analysis (PCA) for objectively linking capacity to quality coefficients, Weighted Aggregate Product Assessment (WASPAS) for robust alternative ranking, and Value Engineering for a holistic cost–benefit analysis stems from its ability to leverage the strengths of each method, mitigate their weaknesses, reduce overall subjectivity, and thereby significantly enhance the accuracy and practicality of supplier selection decisions in this complex domain.

2. Literature Review

2.1. Methods Utilized for Selecting a Supplier

There is extensive research on selecting a suitable supplier for a specific material. Such research helps decision-makers increase the success of a project. A review of the existing literature reveals that different researchers employed various techniques to conduct their supplier selection studies. The study by Singh and Modgil [11] presents a unique approach to cement supplier selection, using a component that first-tier suppliers identify as the primary input. In their study, Rahmiati et al. [12] investigate the ceramic supply in the construction industry. In response to global efforts to promote green construction, Keshavarz-Ghorabaee et al. [13] propose an efficient and novel framework for evaluating green construction suppliers with uncertainty. Concerning the supply of green construction materials, Wissal et al. [14] recommend a green supplier evaluation and selection model that considers the ecological and traditional characteristics of the Moroccan construction sector. Rani et al. [15] suggest a framework for assessing and choosing trading suppliers for sustainable supply chain management.
Singh and Modgil [11] combined the SWARA and WASPAS methods to assess and rank the leading indicators in the selection criteria for cement suppliers. The proposed framework by Keshavarz-Ghorabaee et al. [13] combines WASPAS and the simple multi-attributed rating technique (SMART). Rani et al. (2020) [15] propose an innovative framework that integrates the Complex Proportional Assessment (COPRAS) and SWARA methods, utilizing hesitant fuzzy sets (HFSs). Rahmiati et al. [12] utilized the Analytical Hierarchy Process (AHP) to determine the most suitable feldspar supplier for an Indonesian ceramic manufacturing company. Six other supplier selection studies reviewed using the AHP model either on its own or in conjunction with other frameworks [12,16,17,18,19,20]. The model that Bettioui Wissal et al. [14] recommend entails integrating the Fuzzy Technique for Order Preference by Similarity to the Ideal Solution (Fuzzy TOPSIS) and the Fuzzy Analytic Hierarchical Process (Fuzzy AHP). Similarly, the Fuzzy AHP method was utilized on its own by Biruk et al. (2019) [21] and has been combined with other methods in many supplier selection studies [14,16,22,23].
In the study by Rahmiati et al. [12], primary data was collected using questionnaires sent to three departments and through an interview with the ceramic company’s quality control manager. The determinants of the selection criteria considered by Bettioui Wissal et al. [14], Rahmiati et al. [12], and Tushar et al. [22] are based on a comprehensive literature review and analysis, as well as interviews with selected expert team members. The primary data in the study by Keshavarz-Ghorabaee et al. [13] consisted of expert opinions from a group of decision-makers, comprising three experts drawn from the company’s purchasing, project, and engineering departments. Just like Bayazit et al. [18] and Singh and Modgil [11], they brainstormed with experts and utilized the experts’ implicit inputs in their study. Similarly, Lope and Rodriguez [24], Keshavarz-Ghorabaee et al. [13], and Rani et al. [15] also relied on expert knowledge from a team of individuals. Table 1 summarizes the literature review.

2.2. Previous Studies on the Relationship Between Factory Supplier Capacity and Its Quality

Determining supplier factory quality based on its capacity involves a multifaceted approach that considers various factors beyond production capabilities. The relationship between a supplier’s quality and its capacity is crucial in supply chain management. Supplier quality and capacity influence product pricing, quality decisions, and firm profitability [31]. This responsiveness can be an indirect factor in a supplier’s quality. Elshafei et al. [32] emphasized the importance of utilizing available resources efficiently to improve productivity and quality, suggesting that a supplier’s capacity for flexible and efficient resource allocation can serve as a quality indicator. The Fuzzy AHP application to evaluate supplier performance, including criteria such as quality and delivery, further supports the notion that capacity-related metrics can reflect on quality, as the supplier’s capacity influences these criteria [33]. The discussion of the study carried out by Ding et al. [34] on extending capacity planning to suppliers to prevent capacity overloads also implies that well-managed capacity is crucial for maintaining quality, as overloads can compromise production standards. Bradford et al. [35] highlighted the indirect influence of supplied capacity on the quality. The significance of suppliers’ capacity–load balance in ensuring efficiency and meeting required quality specifications was explored by [36].

2.3. Overview of Integrated Decision-Making Methodologies

Effective supplier selection in complex industries like construction necessitates robust MCDM approaches. This study employs a novel integration of the SWARA, WASPAS, and VE methods. SWARA is a prominent subjective weighting method recognized for its simplicity and the ability to accurately capture expert opinions, particularly when assigning relative importance to criteria [37,38]. Its stepwise nature facilitates the systematic determination of criteria weights, prioritizing the most influential factors based on collective expert consensus. Conversely, WASPAS is a powerful compensatory MCDM technique that combines the strengths of the Weighted Sum Model (WSM) and Weighted Product Model (WPM) to provide enhanced ranking accuracy and stability, making it suitable for evaluating alternatives across multiple attributes [39,40]. Its utility lies in its capacity to generate precise outputs while remaining computationally straightforward, a key benefit for its practical application. On the other hand, the WASPAS method is subject to several important limitations that can affect the reliability of its outcomes. A primary and frequently cited weakness is the determination of the lambda (λ) coefficient. This parameter balances the influence of the WSM and WPM components in the final aggregated score. The selection of λ is often subjective. At the same time, a value of 0.5 is commonly adopted to give equal precedence to both models; this choice lacks a rigorous theoretical foundation and can be seen as arbitrary, meaning the final ranking can be heavily influenced by the decision-maker’s preference rather than objective analysis [41]. Furthermore, because WASPAS incorporates WSM, it inherits WSM’s susceptibility to the rank reversal phenomenon, where the ranking of alternatives can change with the addition or removal of an irrelevant alternative, thus questioning the stability of the solution [41].
Integrating these methods is crucial for addressing the multifaceted challenges associated with selecting a precast concrete supplier. SWARA is utilized to derive the relative importance of the qualitative criteria, ensuring that expert knowledge directly informs the weighting structure. WASPAS then leverages these criteria weights to systematically evaluate and rank supplier alternatives, providing a comprehensive quality score. Crucially, the framework then incorporates VE, a systematic approach to maximizing value by optimizing the relationship between function, quality, and cost [42]. By dividing the WASPAS-derived quality score (representing “value” or “utility”) by the supplier’s normalized cost, VE provides a holistic performance metric that balances technical and quality considerations with economic feasibility. This layered integration ensures that the selection process is robust in its multicriteria evaluation and is strategically aligned with the practical project objectives of cost-effectiveness and overall value.

2.4. Gap in Knowledge
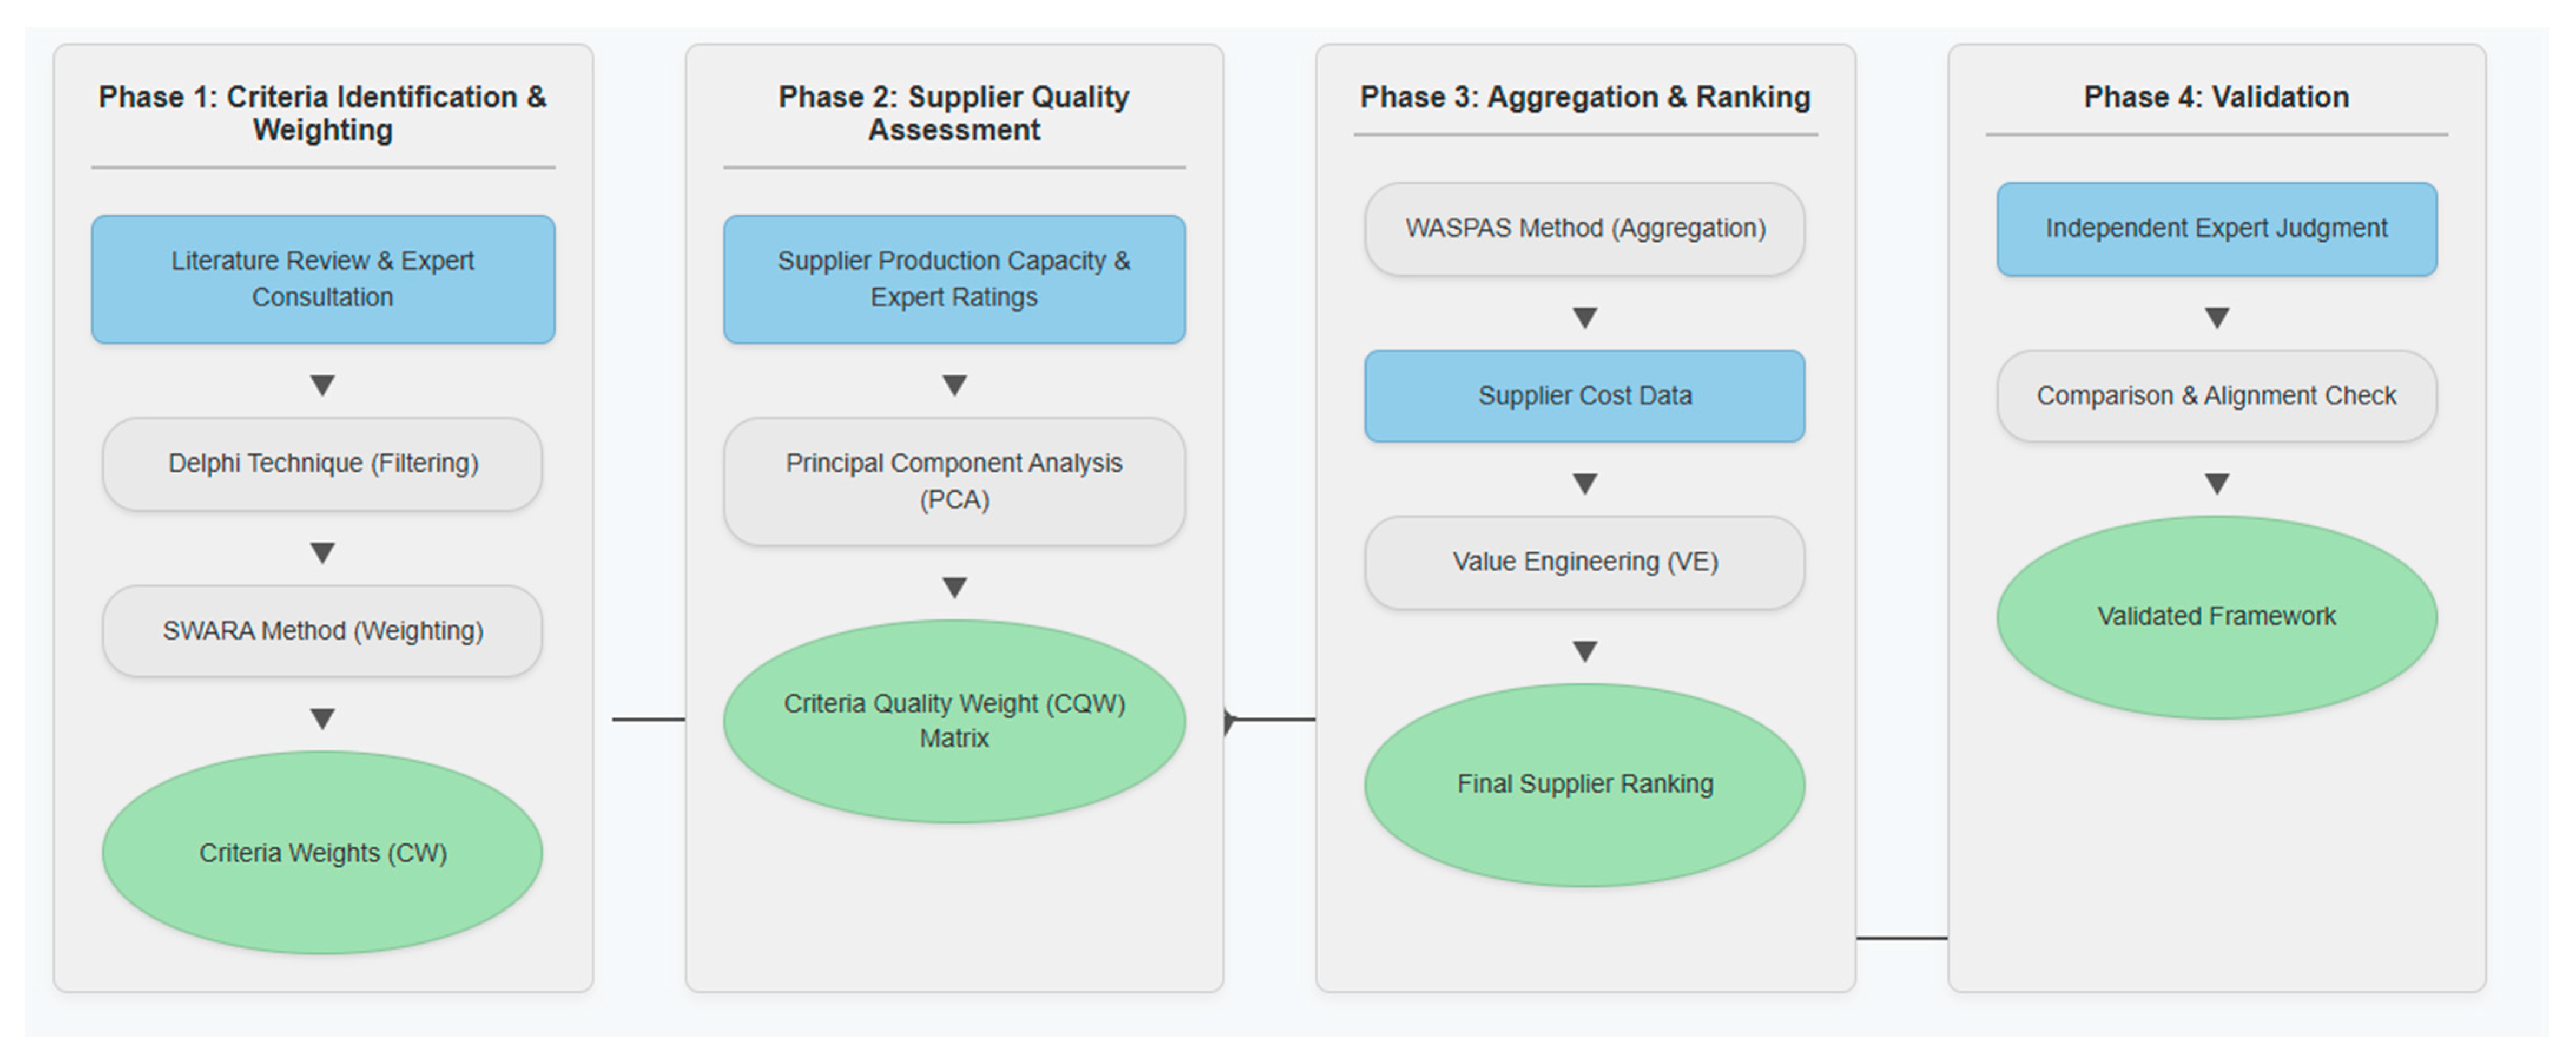
There are notable knowledge gaps in the existing literature concerning the selection of supplier materials in the construction industry. The first gap involves a failure of existing studies to address the issue of supplier selection for precast components. Over the years, the precast construction method has become one of the most sustainable and cost-effective. Therefore, research-based guidance is lacking in the decision-making processes associated with selecting suitable precast suppliers.
Secondly, most of the available studies generally assume that supplier productivity is the primary criterion for evaluation. Comprehensive evaluation criteria are needed to identify the most suitable supplier for the precast construction method. The existing literature fails to conclusively explore and identify the multi-layered factors that should be coupled with supplier productivity during the selection process.
Thirdly, the efforts and time required to construct a CQW matrix, as utilized in the WASPAS method, can be significantly reduced by leveraging knowledge of resource capacity. Traditional methods heavily rely on expert judgment, which can be time-consuming and resource-intensive. Therefore, there is a pressing need to streamline and optimize this process to minimize costs and time investment.
Fourthly, there is a need to assess the integration of SWARA, WASPAS, and VE in the supplier process. Current studies do not combine the listed methods and techniques to develop a comprehensive framework for assessing and selecting precast suppliers.
Finally, a significant gap exists regarding the operational efficiency and consistency of existing hybrid MCDM frameworks. Many established models, such as those combining AHP with TOPSIS or VIKOR, place a “dual subjective burden” on experts: they are required to first weight the criteria and then score each alternative against every subjective criterion. This process is not only resource-intensive but can also introduce inconsistencies, especially with a large number of alternatives. Furthermore, these models often lack a systematic and automated mechanism to translate a key objective performance indicator, such as factory capacity, into qualitative performance scores. This gap highlights the need for a framework that not only integrates multiple criteria but also automates key evaluation steps to enhance consistency and reduce the subjective workload of decision-makers.

3. Methodology

This section describes the research approach used to establish the proposed framework. Figure 1 represents the framework process as a flowchart. The methodology consists of six sequence steps, as shown in Figure 2. The first step was to conduct a comprehensive literature review to identify potential criteria that influence supplier selection. Then, the criteria collected in the first step were evaluated and identified as significant by experts using the Delphi technique. After that, the weights of these significant criteria were determined using the expert judgment and the SWARA method. Next, the CQWs of different alternative suppliers were estimated based on the supplier’s capacity and the coefficient of the nine criteria derived from PCA. Then, the quality of each supplier alternative was established using WASPAS. Based on the supplier’s quality and cost, the VE was determined. Finally, the VE of the different supplier alternatives was ranked.

3.1. Collect Data

The process of collecting data for this study is described in detail in this section. Once the data collection exercise was completed, the criteria were identified to assess the precast suppliers. Different search engines were considered as data sources for this study. Such databases include Google Scholar, Web of Science, IEEE, ASCE, Springer, and Taylor and Francis. To retrieve the data, 15 keywords were utilized to locate the relevant documents. General terms such as bridges, highways, and construction projects were excluded from the search. The included keywords were appropriate and closely connected to the topic of this study. As a result, the search results were more refined and focused on the research topic. Such keywords included precast concrete, factors, productivity, performance, prefabricated, and challenges. The other inclusion criteria entailed selecting research materials written in English. Lastly, only peer-reviewed research materials published between 2000 and 2024 were selected for this study. Over 126 existing research materials were initially selected. This number dropped to about 22 research materials upon applying the above-described filters. To identify the criteria for selecting ready-mix concrete suppliers, data was collected through a multifaceted approach that included an in-depth literature review, construction site visits, and consultations with industry experts. This process yielded the 15 key factors presented in Table 2. Recognizing that the importance of these factors varies, this study’s next objective was to determine which are most critical within the specific context of the Saudi construction market, as detailed in the following section.
The framework’s methodology begins with a comprehensive initial pool of 15 potential criteria, as detailed in Table 2. Acknowledging that these factors are not of equal importance, the framework employs a systematic, multi-stage process to address this complexity. The first and most critical stage involves filtering these factors using the Delphi technique to identify the criteria most significant for differentiating between suppliers in the specific context of the Saudi market. This reliance on expert-driven input ensures that the model’s conclusions are grounded in practical industry priorities, making the framework inherently flexible as it can be customized by any organization using its panel of decision-makers.
A crucial distinction emerged from the iterative Delphi process: the separation of criteria into “qualifiers” and “differentiators.” The expert panel unanimously identified certain factors as non-negotiable, mandatory prerequisites. Specifically, Safety Standards (C15) and, to a lesser extent, Sustainability Practices (C13), were framed as ‘pass/fail’ gate-keeping criteria. In the Saudi Arabian construction industry, a supplier failing to meet fundamental safety regulations would be disqualified at the outset, never reaching a comparative evaluation. Similarly, sustainability is currently treated more as a compliance checkpoint than a primary variable for competitive ranking.
Therefore, the nine criteria that emerged from this filtering process represent the core differentiators—factors such as cost, payment terms, and delivery performance—that decision-makers actively trade off against each other after a supplier has met the foundational requirements. The exclusion of qualifier criteria from the ranking model does not diminish their importance; it methodologically positions them as pre-screening conditions. Consequently, it is this refined set of nine differentiating criteria that proceeds to the next stage: quantitative weighting of their relative importance using the SWARA method.

3.2. Identify the Significant Criteria

This study involving human participants received ethical approval from the Ethics Committee of Graduate Studies at King Saud University. The ethical review included an assessment of the study’s methodology, data collection procedures, and participant protection measures to ensure compliance with the principles of the Declaration of Helsinki. The approval was granted under the ethical board approval number KSU-HE-24-800. All participants in this study provided informed consent for their involvement. This consent was verbal, and documentation of consent is securely stored.
The Delphi technique was employed to identify significant criteria based on the experts’ judgments, and a panel of experts with knowledge and expertise regarding the precast supplier sector was selected. Then, an individual structured interview with each expert in the panel was conducted by distributing the survey to a group of three experts to evaluate the influence criteria using a scale from 1 (poor) to 5 (excellent), as shown in Table A1 (in the Appendix A) to gather their judgments and insights regarding the significant criteria. The questions should be open-ended to allow experts to provide detailed responses. The responses from the initial interviews were analyzed. The common criteria mentioned by the experts were identified. The findings were summarized. In addition, a list of potentially significant criteria was established. Based on the findings of the initial interviews, a second round of questionnaires was performed. The list of potential significant criteria and additional criteria suggested by the experts during the initial interviews was included. The responses were analyzed to identify the level of agreement or consensus among experts regarding the significance of each criterion. The data collection and analysis process was repeated, and the list of criteria in each subsequent round was refined. This iterative process was continued until a consensus was reached among the experts on the significant criteria. However, despite these strengths, the model exhibited several limitations, primarily related to its scope and reliance on expert input. A significant concern is its multi-stage dependency on expert judgment. While using a small, purposively selected panel of three experts for the initial Delphi stage is a justifiable practice for niche industrial domains where deep expertise is concentrated among a few individuals, it inherently limits the broad generalizability of the initial criteria weights. The consensus achieved is robust *within the context of this expert group*, but a different panel could potentially produce different priorities. Furthermore, using separate small panels for different stages (e.g., the three experts for validation) introduces the risk of inconsistency. Future research should aim to expand the validation of the framework with a larger and more diverse group of experts to test the stability of the criteria weights and enhance the model’s external validity.
Table 3 shows information about the experts interviewed using the Delphi technique. The round one question was “Do you agree that these criteria are suitable for selecting precast concrete suppliers”; in round two, the results obtained from round one were presented to all of the experts, and the question was “Since you agree with these criteria, kindly ranking the criteria based on your personal opinion and suggest any further comments or criteria”. Each expert filled out a questionnaire indicating their ranking of the criteria. The experts entered values between 1 and 9, where 9 denotes the most important (highest) and 1 denotes the least important (lowest) criteria. Table 4 presents the collated results from the questionnaires, showing the experts’ criteria rankings.
The expert panel for the Delphi technique and subsequent SWARA weighting was intentionally composed of professionals from both governmental and private sectors (Table 3). This diverse representation was crucial for developing a framework applicable across the Kingdom of Saudi Arabia’s varied construction landscape, where public and private projects are prevalent. It is acknowledged that public sector entities often prioritize stringent specifications, compliance, and long-term value, potentially emphasizing quality and reliability. Abdolshah [19] discussed the context of quality evaluation, noting that private sector decision-makers typically emphasize cost minimization and profit maximization. The iterative nature of the Delphi technique, followed by the SWARA method, is specifically designed to facilitate the aggregation of these diverse individual judgments into a robust group consensus, even amidst differing initial priorities. Through this structured process, experts engage in reasoned discussions and adjustments, allowing a collective understanding of the importance of critical criteria to emerge, thereby implicitly balancing these varied sectoral concerns and resulting in a consolidated industry perspective.

3.3. Determine Quality Weight

The weights of the significant criteria were computed using the SWARA method. The outstanding feature of the SWARA method is the prominence given to expert opinions. A team of selected experts from corresponding fields assigns weights to the provided criteria [37]. Experts are expected to utilize their implicit knowledge when ranking suppliers. In addition, the experts determine the importance of each criterion. The simplicity of this technique enables a team of experts to work seamlessly together on a joint project.
There are five significant steps involved in conducting an analysis using SWARA. First, the criteria requirements should be organized by their usefulness. The experts rank the defined criteria so that the most essential requirement is placed in the first position and the least essential requirement is placed in the last [38]. The second step is identified as calculating Sj (scientific criteria). This process involves experts determining the importance of a criterion (Sj) with a relative importance index (RII); the RII and Sj can be computed using the following Equations (1) and (2), respectively:
R I I = 1 n 1 + 2 n 2 + 3 n 3 + 4 n 4 + 5 n 5 + 6 n 6 + 7 n 7 + 8 n 8 + 9 n 9 9 n 1 + n 2 + n 3 + n 4 + n 5 + n 6 + n 7 + n 8 + n 9
S j = R I I j 1 R I I j R I I j
where n1, n2, n3, n4, n5, n6, n7, n8, and n9 are the frequencies of options 1, 2, 3, 4, 5, 6, 7, 8, and 9, respectively.
Step three requires the SWARA users to determine the coefficient Kj using Equation (3).
K j = 1 ,                                 j = 1 , s j + 1 ,                   j > 1
In step four, Equation (4) recalculates the weighting factors qj.
q j = 1 ,                                     j = 1 , q j 1 k j ,                       j > 1
Lastly, the equation below is used to calculate the relative weighting factors of the evaluation criteria. The criteria weight (CW) can be calculated using Equation (5) [39].
C W j = q j k = 1 n q k
The weightages for different supplier selection criteria were derived using the SWARA method. Table 5 summarizes the results obtained. The detailed calculations of the SWARA method are presented in Appendix A.

3.4. Estimate the CQW of the Alternative Based on Its Capacity

Estimating the CQWs of different criteria is crucial when evaluating the value of alternative options. The determination of these weights can be either objective or subjective. It is essential to note that in many cases, evaluating alternatives requires a subjective approach, necessitating the expertise and opinions of knowledgeable individuals. This process demands significant effort and time to execute, irrespective of the subsequent preparations and operations that follow the evaluations. To address this challenge, a method has been devised to determine the CQW value of alternatives based on their capacity. This method is founded on the premise that quality depends on the resource capacity and the nine characteristics above. Therefore, the PCA was employed to determine the coefficients of the nine criteria related to capacity.

Determining the CQW by PCA

To empirically establish the link between a supplier’s production capacity and its performance across the nine significant quality criteria (C1–C9), PCA was employed. The objective of PCA in this context was to reduce the multi-dimensional expert opinions into a single, representative factor that captures the ‘general quality impact of capacity’.
The input for the analysis was a 20 × 9 data matrix, where the rows represented the 20 expert respondents and the columns contained their ratings (from −5 to +5) on how production capacity influences each of the nine criteria (as detailed in Table 6). Before proceeding, the suitability of the data for factor analysis was confirmed. The Kaiser–Meyer–Olkin (KMO) measure of sampling adequacy was 0.708 (well above the 0.5 threshold), and Bartlett’s test of sphericity was significant (p < 0.001), as shown in Table 7. These results indicate that the correlations between the criteria were strong enough for PCA to be a valid technique.
The analysis extracted several components with eigenvalues greater than one; however, only the first principal component (PC1) was used to derive the quality coefficients. This decision was based on two key rationales. First, PC1 accounted for 63.18% of the total variance (Table 8), making it the dominant component that captured the most significant shared variance across all nine quality criteria. It can thus be interpreted as the primary underlying factor representing the “overall capacity–quality relationship.” Second, the goal of this step was to derive a single set of weights to link capacity to quality in a clear and applicable manner. Using only the loadings from PC1 provides a direct, interpretable, and parsimonious way to achieve this. The loadings of each criterion on PC1, presented in the rotated component matrix (Table 9), were then normalized using Equation (6) to compute the final coefficients (C), which quantify the proportional impact of production capacity on each specific quality criterion.
To ensure the suitability of the data, the Kaiser–Meyer–Olkin (KMO) coefficient, which should exceed 0.5, was examined. The KMO value was 0.708, greater than 0.5, as shown in Table 7. The KMO test is intended to measure the adequacy of the sample size. In this study, the KMO value is 0.708, which exceeds the recommended threshold of 0.5. This result implies a sufficient sample size (Shrestha, 2021) [46].
The findings in Table 8 display the initial eigenvalue of the nine components. Eigenvalues represent the variance explained by each principal component. The initial eigenvalue of the first component is 49.117, indicating that it explains a significant amount of variance in the data. The eigenvalues of the subsequent components decrease, with the second component having an initial eigenvalue of 9.345.
A rotated component matrix in PCA represents the relationship between the original variables and the principal components that have been rotated. It is a transformed representation of the loadings of each variable on the principal components. A rotation technique is often applied to enhance the interpretability of the components. The rotation aims to achieve a more straightforward and meaningful structure by maximizing the loadings of some variables on specific components while minimizing loadings on others. The rotated matrix loadings (RMLs) for the first and second components are shown in Table 9. The values in the matrix indicate the strength and direction of the relationship between the variables. Each cell in the matrix represents the correlation between a criterion and a principal component that has been rotated. The first component was chosen based on its high eigenvalue and the comprehensiveness of the first component over the nine criteria. Therefore, the RML of the first component was used to compute the normalized coefficients ( C ¯ ) of the criteria, as shown in Equation (6). The values of C ¯ for the nine criteria are presented in Table 10.
C ¯ i = R M L i R M L
The research team visited their respective manufacturing facilities in person to gain a deeper understanding of each of the supplier’s capacities. The framework was applied to suppliers in Riyadh, Saudi Arabia, where the precast concrete market has few reliable providers. Therefore, five suppliers were selected using the developed framework to select the best among them. Table 11 summarizes each supplier’s annual production capacity, measured in cubic meters. For context and a better understanding of capacity values, the research team noted that a precast house characteristically needs an average capacity of 200 to 300 cubic meters. The normalized capacity supplier (NCS) entails dividing each supplier’s capacity ( C S i ) by the maximum capacity among all suppliers ( C S m a x ), as computed in Equation (7), facilitating the easier comparison and evaluation of each supplier’s capacity.
N C S i = C S i C S m a x
The final column in Table 11 presents the NCS values. These capacity assessments and site visits yielded valuable insights into each supplier’s production capacity.
The selection of these five specific suppliers for the case study was deliberate, aiming to encompass a representative range of production capacities within Riyadh’s limited pool of reliable precast concrete providers. The observed variation in supplier productivity, as detailed in Table 11, is not an arbitrary aspect but a fundamental characteristic that the proposed framework is designed to explicitly address and leverage. The model’s core novelty lies in linking factory capacity to the CQW via PCA coefficients (as established in the section “Determining the CQW by PCA”), thereby inherently recognizing that larger, more resourceful suppliers may be better positioned to excel across various quality attributes due to potential economies of scale, more efficient resource allocation, and greater flexibility [32,34]. Consequently, the higher ranking of suppliers with larger normalized capacities reflects the model’s underlying logic, which suggests that robust production capability translates to enhanced performance across multiple evaluation criteria.
While the framework integrates production capacity as a key performance indicator, it is important to note that specific granular operational details, such as a supplier’s direct access to batching plants or proximity to raw material sources, were not explicitly factored into the current model. Such logistical elements can significantly influence a supplier’s cost-effectiveness, delivery reliability, and responsiveness [36]. While deemed outside the immediate scope of this initial framework’s primary capacity-to-quality linkage, future refinements could incorporate a broader range of supply chain and operational logistics to provide an even more granular and comprehensive supplier capability assessment, further enhancing the model’s predictive power and practical utility in real-world scenarios.
The criteria quality weight ( C Q W i j ) of the ith criterion and jth alternative supplier can be determined based on the value of C ¯ i and N C S j , as shown in Equation (8).
C Q W i j = C ¯ i × N C S j
For more clarification on the computation of the CQW, the following example was elaborated: the C Q W 15 can be calculated based on the C ¯ ’s first criterion ( C ¯ 1 ) and the N C S of the fifth alternative supplier ( N C S 5 ). The C ¯ 1 and N C S 5 values were determined in Table 10 and Table 11 to be 0.128 and 0.5, respectively. Thus, the C Q W 15 was 0.064 ( C Q W 15 = 0.128 × 0.5 ). Hence, the CQW matrix utilized in WASPAS is shown in Table 12. The values provide the precise weights allocated to each corresponding criterion. These criteria play a significant role in the decision-making process for selecting a precast supplier through the WASPAS method.
The resulting criteria quality weight (CQW) matrix, presented in Table 12, represents a pivotal output of the PCA-based analysis and the key innovation of this stage. Each value of CQWij quantifies the objective performance score of a specific supplier (j) on a specific criterion (i), derived directly from their production capacity. This matrix now serves as the core input for the subsequent aggregation phase of the framework.
The next logical step is to systematically aggregate these individual performance scores, taking into account the relative importance of each criterion as determined by the SWARA method. For this purpose, the Weighted Aggregated Sum Product Assessment (WASPAS) method is employed. The rationale for selecting WASPAS is its proven robustness in combining the strengths of both the Weighted Sum Model (WSM) and the Weighted Product Model (WPM) to provide a stable and comprehensive performance index (Qi) for each alternative. The following section details the application of the WASPAS method to synthesize the CQW matrix and the SWARA weights into a final, ranked list of suppliers.

3.5. Estimate Each Supplier’s Qi Score Using the WASPAS Method

The WASPAS method is one of the most commonly used Multicriteria Decision-Making (MCDM) techniques. Before detailing its application, it is essential to clearly state the underlying assumptions of this method and their implications for this study. The WASPAS method, like other multi-attribute utility theory (MAUT) models, operates on several key prerequisites. First, it assumes that the evaluation criteria are mutually independent, meaning the performance score of a supplier on one criterion (e.g., safety standards) does not influence its score on another (e.g., on-time delivery). While this assumption simplifies the model, it may not accurately reflect real-world scenarios, where factors such as cost and quality are often interrelated. Second, the method assumes that the criteria weights, derived here from SWARA, accurately reflect the decision-maker’s valid preferences. Finally, it assumes that a linear trade-off between criteria is acceptable, as established by the WSM component. In this study, these assumptions are deemed reasonable for a strategic-level assessment, as the criteria are selected to be as distinct as possible, and the weights are derived from a panel of industry experts. However, for projects requiring a deeper analysis of criterion interdependencies, an extension of this model using methods like the Analytic Network Process (ANP) could be considered as a future research direction. WASPAS combines the Weighted Sum Model (WSM) and the Weighted Product Model (WPM) to enhance ranking accuracy. According to Alinezhad and Khalili (2019) [39], the WASPAS method is a compensatory technique with independent attributes. The qualitative features are changed into quantitative characteristics. Besides generating accurate outputs, most users also prefer using WASPAS because its computing process is simple. There are four significant steps associated with analyzing data using WASPAS.
After computing the CQW matrix and the weights of the nine criteria (Table 5), the WASPAS method was applied to calculate the Qj of the precast suppliers based on the WSM and WPM. The WSM and WPM methods are used to calculate the total relative importance of the jth alternative using Equations (9) and (10). For these equations, wi represents the weight (relative importance) of the ith criterion.
Q i 1 = i = 1 n C Q W i j W i
Q i 2 = i = 1 n C Q W i j w i
In the last step, a generalized equation (Equation (11)) is used to calculate the total relative significance of each alternative. Establishing this generalized equation increases the ranking accuracy and improves the effectiveness of the associated decision-making processes.
Q i = λ Q i 1 + 1 λ Q i 2 = λ i = 1 n C Q W i j w i + 1 λ i = 1 n C Q W i j w i
The values of λ range between 0 and 1. The WASPAS method becomes the WPM or WSM method if the value of λ is 0 and 1, respectively [40]. When using WASPAS, the most suitable alternative is the one with the highest Q value. The results of the WSM and WPM are shown in Table 13 and Table 14, respectively. The finding score for WASPAS for each supplier is displayed in Table 15.
For a more granular analysis, a radar chart (Figure 2) is proposed to illustrate the performance profile of each supplier across the nine evaluation criteria. In a radar chart, each vertex represents a criterion, and the distance from the center to a vertex indicates the supplier’s weighted score for that specific criterion (data from Table 13). This visualization allows for an immediate comparison of how suppliers perform on individual metrics. For example, a supplier with a large, well-rounded shape indicates strong performance across many criteria. In contrast, a supplier with a “spiky” shape excels in some areas but is weak in others. This detailed profile explains why a supplier achieved its final rank and provides valuable insights for strategic decision-making. The identical nature of the curves for A2 and A4 is a direct result of their equivalent capacities.
The radar chart shown in Figure 3 provides a multi-dimensional comparison of the five suppliers based on their normalized Weighted Product Model (WPM) scores across the nine distinct criteria. Each spoke of the chart represents a performance criterion (C1 through C9), with values farther from the center indicating a higher, more favorable score. Visually, the supplier with the largest enclosed area represents the best overall performer according to this model.
From the chart, Supplier A3 (green) clearly stands out, exhibiting the most robust performance by consistently achieving the highest scores across nearly all criteria, particularly in C3 (Method of payment), C6 (Ease of communication), C7 (Quick response), and C9 (Technical expertise). In contrast, Supplier A5 (purple) demonstrates the weakest overall profile, with its shape being the most compressed towards the center. The chart also reveals that the performance profiles for Supplier A2 (red) and Supplier A4 (orange) are identical, as their lines overlap entirely. This visualization effectively highlights not only the overall ranking but also the specific strengths and weaknesses of each supplier, allowing for a more nuanced and granular assessment than a simple numerical score.
To enhance the transparency and reproducibility of the research, this section provides a detailed, step-by-step explanation of the calculation process for the WSM, WPM, and the final WASPAS scores. The calculations for Supplier A1 are used as a running example to illustrate how the data from various tables is substituted into the formulas.
To calculate the WSM score for Supplier A1 ( Q A 1 ), we multiply each of the CQWs of the A1 values from Table 12 by the corresponding criterion weight from Table 5 and then sum the results. The individual products for each criterion form the basis of Table 13. For instance, the weighted score for Supplier A1 on criterion C4 (Accuracy of the quantity sent) is calculated by multiplying its CQW value (0.118 from Table 12) by the criterion weight for C4 (0.165 from Table 5), resulting in 0.01947, which is rounded to 0.019, as shown in Table 13. This process is repeated for all nine criteria for Supplier A1. The final WSM score is the sum of these individual weighted scores, as presented in Table 13, such as ( Q A 1 = 0.005 + 0.007 + 0.003 + 0.019 + 0.007 + 0.012 + 0.019 + 0.009 + 0.003 = 0.085 ). This final value of 0.085 is the WSM score for Supplier A1, as shown in the “WSM” column of Table 15.
To calculate the WPM score for Supplier A1 ( Q A 2 ), we take each CQW value for A1 from Table 12 and raise it to the power of the corresponding weight from Table 5. The results of these exponentiations are presented as the intermediate values in Table 14. For example, the intermediate WPM value for A1 on criterion C1 (Material suitability) is calculated as follows: (0.092)0.051 = 0.885; this value is presented as 0.885 in Table 14. The final WPM score for Supplier A1 is the product of all its intermediate values shown in Table 14, as follows: ( Q A 2 = 0.885 × 0.833 × 0.911 × 0.703 × 0.880 × 0.631 × 0.721 × 0.632 × 642 = 0.077). Using the previously calculated WSM score (0.097) and WPM score (0.050) for Supplier A1, the final WASPAS score is computed as follows: Q A 1 = λ × Q A 1 1 + 1 λ Q A 2 = 0.5 × 0.085 + 0.5 × 0.077 = 0.081 .
This result is rounded to 0.074, which is the final score for Supplier A1, presented in the “WASPAS” column of Table 15 and the “WASPAS” column of Table 16. This same three-step process is applied to all other suppliers to determine their final rankings.

3.6. Compute VE and Ranking

While the WASPAS score primarily considers production aspects, VE incorporates cost considerations to achieve a well-rounded evaluation. The cost determination depends on the precast elements’ square meters, assuming a thickness of 150 mm and a fixed HC width of 1200 mm. The depth of precast elements fluctuates depending on the specific span requirements.
The cost is determined depending on the bids submitted by the suppliers. Each cost is divided by the highest cost to normalize the cost values. Further, the quality weight is divided by the normalized cost to calculate the value of VE. This ratio is equivalent to the WASPAS score. For instance, if the WASPAS score for A4 is 0.067 and a normalized cost is 0.73, the VE score can be calculated as 0.067/0.73, yielding 0.092. This calculation is performed so that all suppliers can derive their corresponding VE scores. Then, the VE score is calculated in conjunction with the WASPAS scores, and the outcomes are presented in Table 16.
The VE score shows each supplier’s relative strength, with a higher score signifying a preferred choice. The last column of Table 16 displays the supplier ranking. In the precast industry, VE plays a pivotal role in selecting the most suitable supplier by striking a balance between various factors.
The model’s results, summarized in Table 16, provide a clear and quantitatively robust ranking of the supplier alternatives. The distribution of the final normalized Value Engineering (VE) scores, which range from 0.54 to 1.00, indicates that the framework is highly effective at discriminating between the performance of suppliers. A3 emerges as the definitively top-ranked alternative with a perfect normalized VE score of 1.00. Crucially, this is not a marginal victory; there is a substantial performance gap between the top suppliers. A3’s VE score is 25% higher than the second-ranked supplier, A4 (VE score = 0.754), and 85% higher than the lowest-ranked supplier, A2 (VE score = 0.55). This significant quantitative differential underscores a clear and statistically meaningful preference for A3 based on the model’s integrated assessment of quality, capacity, and cost.
In contrast, A4 represents the “value-for-money” option, securing the second rank despite having a moderate production capacity by offering the lowest cost. The lower-ranked suppliers exhibit clear quantitative weaknesses. For example, A2’s high cost is not justified by its capacity, resulting in the lowest VE score. This analysis demonstrates how the framework translates complex trade-offs into a single, decisive score. The robustness of these performance differentials and the stability of the final rankings are statistically interrogated in the subsequent Sensitivity Analysis (Section 4) and validated against external expert opinion (Section 5).
This data-driven insight allows project managers to move beyond a simple ranking and make nuanced selection decisions. For instance, a manager could select A3 for critical projects and A4 for standard ones, thereby creating a flexible and cost-effective supplier portfolio. Furthermore, the results serve as a powerful tool for supplier development and negotiation. A project manager could leverage this data to approach Supplier A2 with evidence of its uncompetitive pricing or to negotiate better terms with Supplier A1 by highlighting its cost disadvantages relative to A4. By translating numerical scores into practical business insights, the framework becomes a strategic tool for optimizing supplier selection, mitigating risk, and enhancing the overall supply chain in the dynamic Saudi construction environment.

4. Sensitivity Analysis

To evaluate the stability and reliability of the model’s results, a sensitivity analysis was performed. This analysis is crucial for understanding how the final supplier rankings respond to variations in key input parameters, which are often subject to uncertainty or subjective judgment. The investigation focuses on two critical parameters: (1) the weights of the evaluation criteria, as determined by the SWARA method, and (2) the lambda (λ) coefficient used in the WASPAS aggregation formula.

4.1. Sensitivity to Changes in Criteria Weights

The criteria weights derived from the SWARA method are based on expert opinions and represent a significant source of subjectivity. To assess the model’s sensitivity to these weights, a series of experiments were performed. The analysis focused on adjusting the weight of the most influential criterion, C6 (Easy to communicate), which originally weighted 0.171 (as shown in Table 5). In each scenario, the weight of C6 was increased by 10%, 20%, and 30%, while the weights of the remaining eight criteria were proportionally reduced to maintain a sum of 1.0. This simulates a situation where a decision-maker places even greater importance on the top criterion. Equation (12), used to redistribute the weights, is as follows:
w j n e w = w j o l d × 1 w i n e w 1 w i o l d
where w j n e w is the new weight of the adjusted criterion (C6) and w i n e w is the recalculated weight for any other criterion. The final WASPAS scores and resulting supplier rankings for each scenario are presented in Table 17.
The results from Table 17 demonstrate that the model remains remarkably stable in the face of changes in the weight of the most important criterion. Even when the weight of C6 was increased by up to 30%, the final ranking of all five suppliers remained unchanged. The top supplier (A3) and the worst-performing supplier (A2) held their positions consistently. This stability indicates that the performance differences between the suppliers are significant enough to withstand moderate shifts in criteria priorities. For decision-makers, this suggests that the recommendation of Supplier A3 is robust and not merely an artifact of a specific, narrowly defined set of expert weights.

4.2. Sensitivity to the Lambda (λ) Parameter
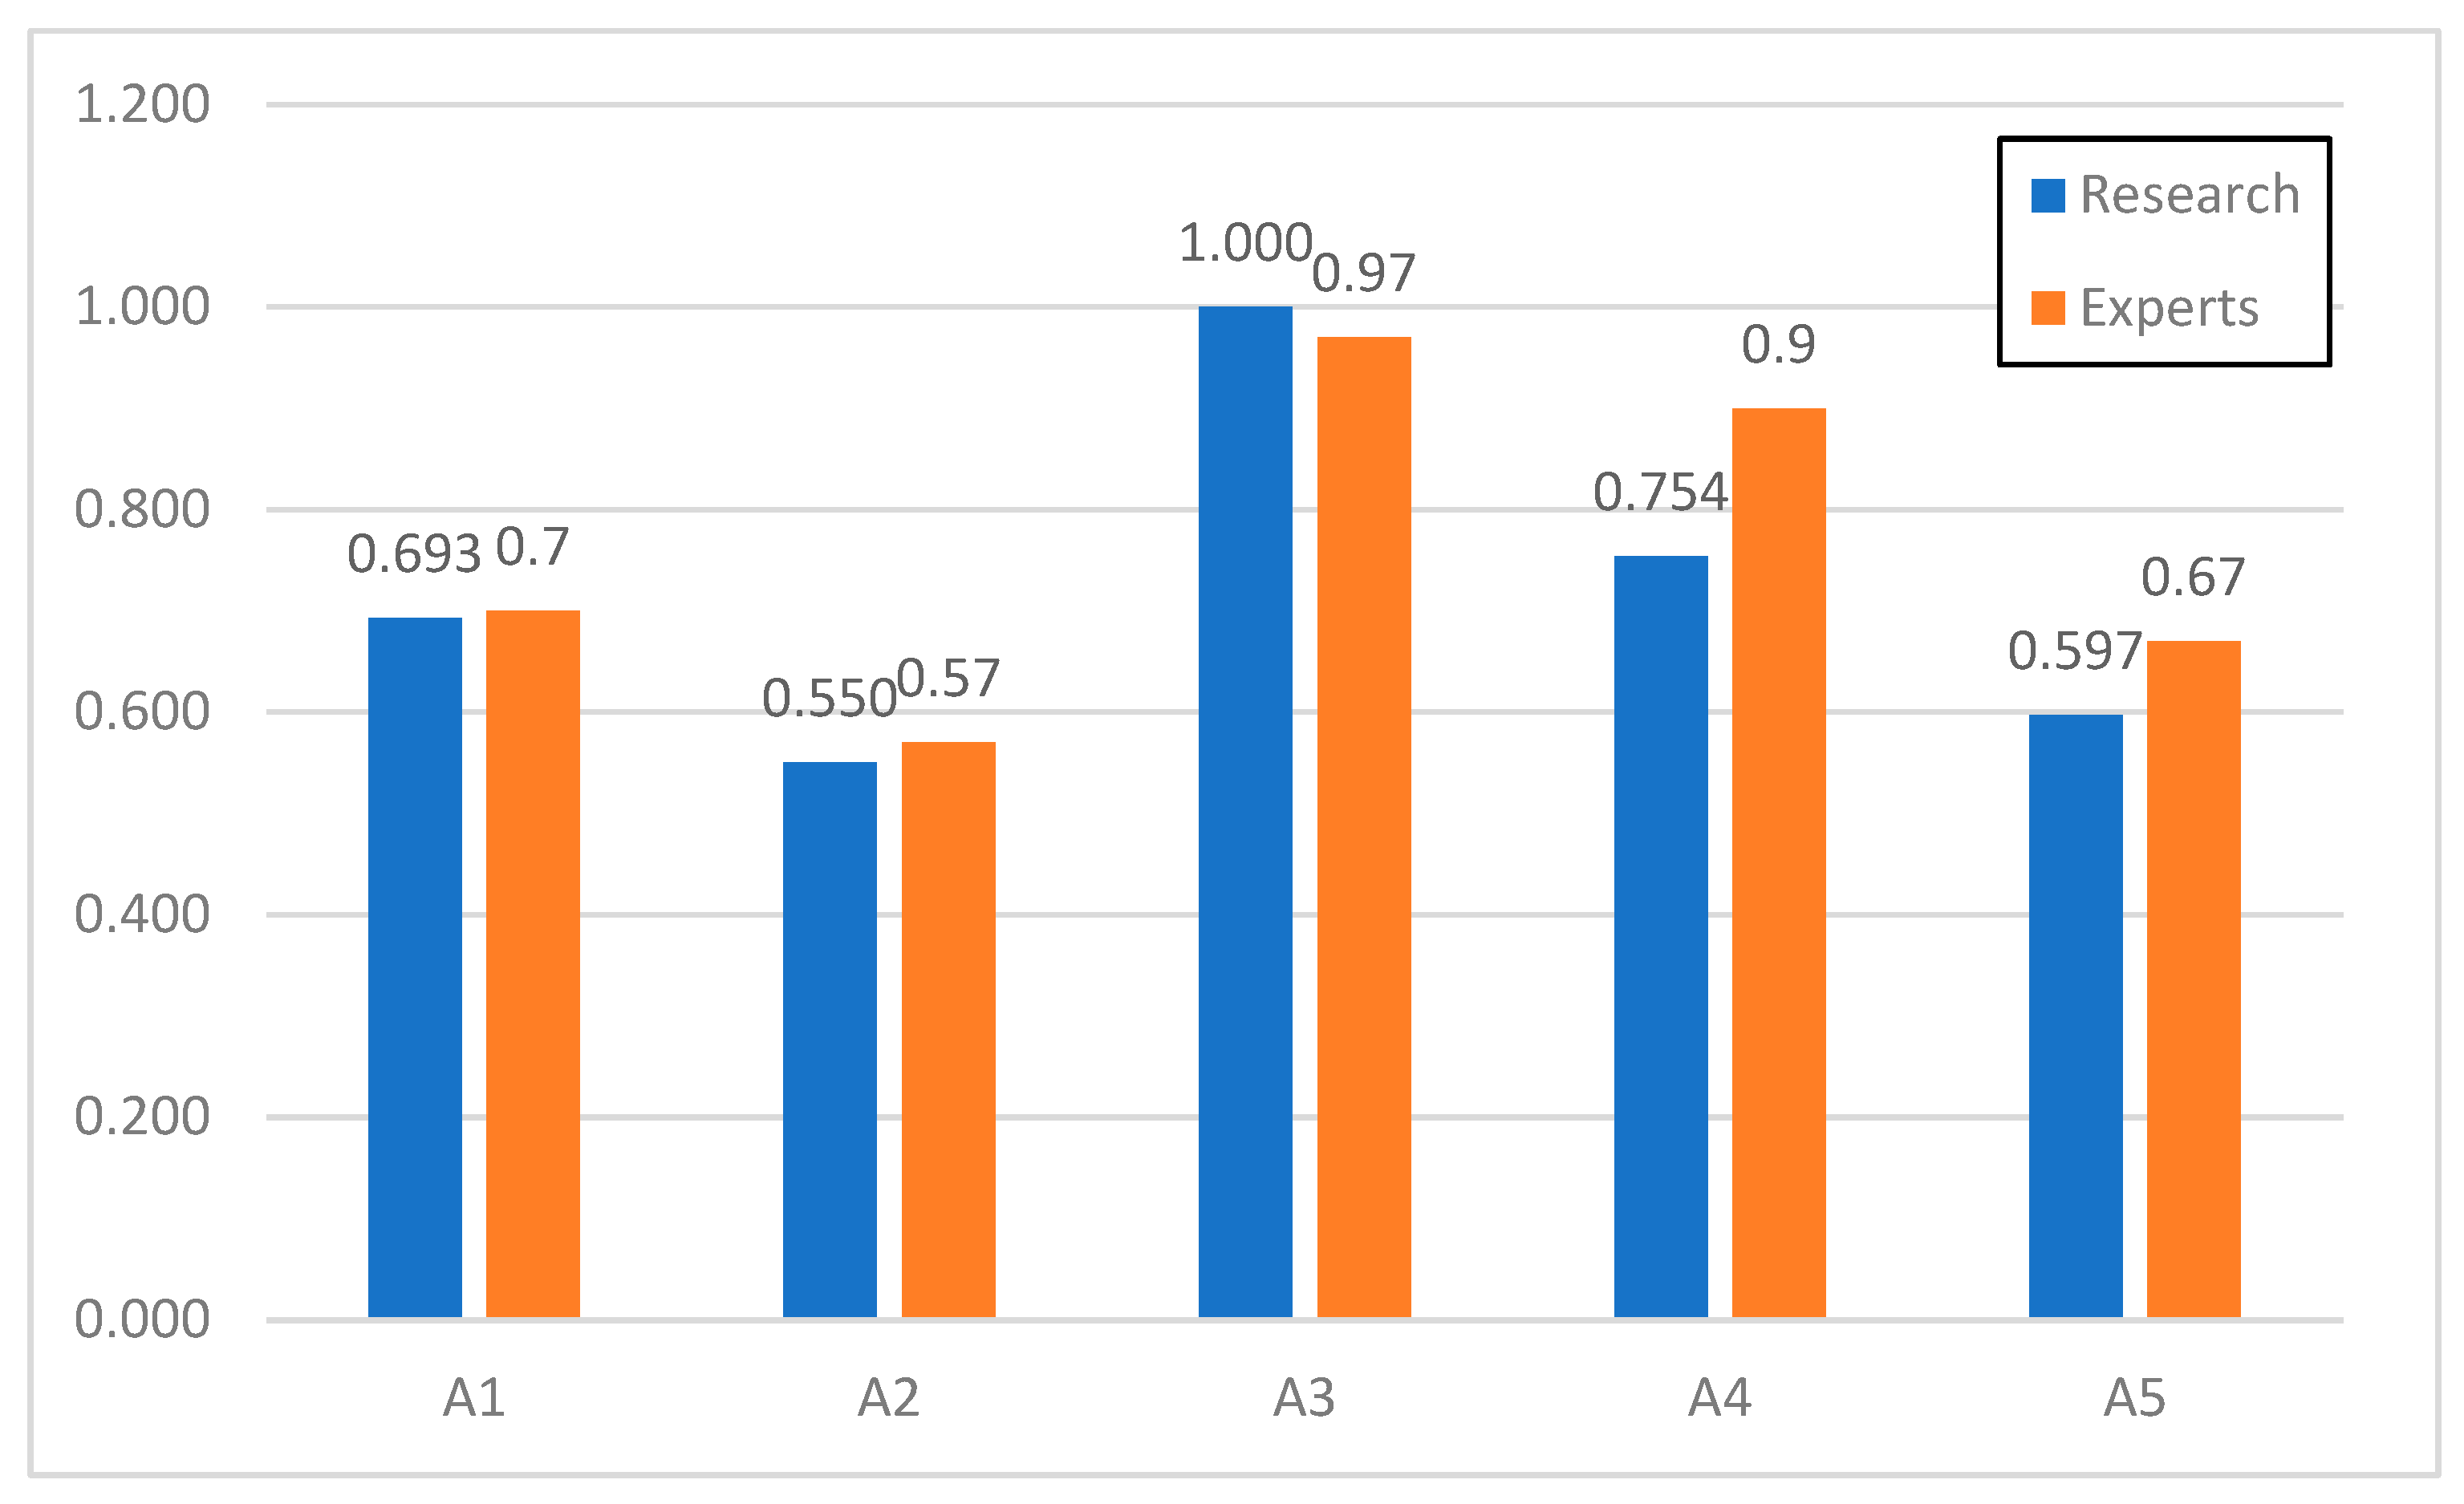
The WASPAS method combines the WSM and WPM scores using the λ coefficient, which was set to 0.5 in the base case to give equal importance to both models. To test the sensitivity of the results to this parameter, the value of λ was varied from 0 (a pure WPM) to 1 (a pure WSM) in increments of 0.1. This analysis reveals whether the final ranking is dependent on the specific aggregation strategy chosen. The final WASPAS scores for each supplier were recalculated for each value of λ.
The results of this analysis can be visualized in Figure 4, where the x-axis represents the value of λ and the y-axis represents the calculated WASPAS score.
The graph would display five lines, one for each supplier, plotting their WASPAS score changes from 0 to 1. The line for Supplier A3 consistently remains above all other lines across the entire range of λ. Similarly, the lines for the other suppliers (A4, A1, A5, and A2) maintain their relative positions without intersecting each other. The ranking order A3 > A4 > A1 > A5 > A2 is preserved for all values of λ.
The analysis of the λ parameter further confirms the stability of the proposed framework. The fact that the supplier rankings do not change, regardless of the value of λ, indicates that the superiority of Supplier A3 is consistently identified by both the WSM and WPM components of the model. This alignment between the additive (WSM) and multiplicative (WPM) approaches strengthens confidence in the final ranking. Decision-makers can be assured that the choice of λ = 0.5 is not a critical factor influencing the outcome and that the results are robust across different aggregation assumptions within the WASPAS framework.
In conclusion, the sensitivity analysis shows that the model’s results are highly stable and reliable. The final supplier rankings are resistant to moderate changes in criteria weights and are independent of the λ coefficient value, reinforcing the validity of the study’s findings and the practical utility of the framework.

5. Validation

To validate the framework’s results, this study employed a qualitative validation approach aimed at establishing the face validity and practical relevance of the model’s rankings. Given the specialized nature of the Saudi precast market, a purposive sample of three senior industry experts was selected, each possessing over 15 years of experience in governmental, contracting, or procurement management roles. To mitigate the risks of individual bias and enhance the reliability of the findings from a small panel, a structured, two-stage process was used. First, each expert independently rated the five suppliers on a scale of 1 to 10 based on their holistic assessment. Following this, the experts participated in a moderated consensus-building session, during which their initial ratings were discussed. This structured dialog facilitated the clarification of criteria, justification of scores, and reconciliation of differing viewpoints, resulting in a more robust and consolidated collective judgment. The final expert rankings, derived from these reconciled assessments using the relative importance index (RII), provide a rigorous qualitative benchmark against which to compare the model’s outputs.
Table 18 summarizes the ratings of the three experts for the suppliers and includes the ranking based on their expert opinions. Additionally, the table presents validation outcomes, including the average ratings and RII values for the suppliers.
Figure 5 presents the expert opinions and research findings. The research results include normalized VE (Value Engineering) scores, while the expert opinions include RII scores. Figure 3 clearly shows that the research results and expert findings are consistently aligned, confirming the validity of the preferred methodology.

6. Discussion

The findings of this study provide a robust, data-driven framework for selecting precast concrete suppliers, an area of critical importance in rapidly growing construction markets such as Saudi Arabia. The primary contribution of this research is not merely the final ranking of suppliers but the establishment of a novel methodological link between a key objective metric—factory capacity—and the multifaceted qualitative criteria that define a superior supplier. This section interprets these findings, contextualizes them within the existing literature, and discusses their practical and theoretical implications.
A particularly noteworthy outcome from the SWARA was that “Method of payment” (C3) emerged as the most important criterion, receiving the highest weight from the expert panel (Table 5). At first glance, this might seem counterintuitive in a field where technical quality and on-time delivery are often considered paramount. However, this finding offers a crucial insight into the specific economic pressures and business realities of the KSA construction market, aligning with broader industry practices where cash flow is a critical determinant of project success.
In high-cost, capital-intensive projects, as is common in the KSA, a supplier’s payment terms—such as requirements for large advance payments, the structure of progress payments, and the duration of credit periods—can significantly impact a main contractor’s working capital and overall project liquidity. A supplier offering flexible or favorable payment terms can provide a substantial, tangible financial advantage, freeing up capital that can be used to manage other project risks or operational needs. Contractors can perceive this financial flexibility as being as valuable, or even more so, than a marginal improvement in other quality aspects. This prioritization is not unique to the KSA; studies in other construction contexts have also highlighted that financial stability and favorable terms are key factors in mitigating project risk and ensuring a healthy and sustainable supply chain [47]. Therefore, the high weighting of C3 reflects a sophisticated, risk-averse decision-making process in which financial viability is viewed as a foundational element of a supplier’s overall value proposition.
A central finding was the top ranking of Supplier A3, which achieved the highest VE score due to its superior production capacity combined with a competitive cost (Table 16). This result empirically validates the framework’s underlying logic: in a high-demand market, a supplier’s capacity is a strong representative of its overall performance, influencing reliability, delivery timelines, and the ability to manage large-scale projects [48]. In contrast, existing models often treat capacity as just one of many independent criteria, failing to capture its cascading effect on other performance attributes like on-time delivery (C5) and responsiveness [49,50]. Our PCA-driven approach, which systematically translates capacity into a CQW matrix, offers a more integrated and realistic assessment, addressing a key gap identified in the literature.
Furthermore, this study revealed that “Method of payment” was the criterion assigned the highest weight by the expert panel using the SWARA method. This finding offers a significant insight into the specific business dynamics of the Saudi Arabian construction market. While the literature often emphasizes technical criteria like quality and delivery [19,47], our results suggest that financial terms and cash flow considerations are of paramount importance to decision-makers in this region. This aligns with the findings from [41], which note that financial flexibility is a crucial element of project success. This underscores the value of using a context-specific weighting method, such as SWARA, as it ensures the final model reflects the practical priorities of the industry rather than relying on generalized assumptions.
The validation results, which showed a perfect ordinal alignment (Spearman’s coefficient = 1.0) and a strong linear correlation (Pearson coefficient = 0.98) between the framework’s output and external expert judgment, provide robust evidence of the model’s face validity. This suggests that our hybrid SWARA-PCA-WASPAS-VE framework successfully operationalizes the complex, often intuitive, decision-making calculus of seasoned industry professionals. It effectively transforms their holistic assessments into a structured, transparent, and replicable process.

6.1. Practies and Implementation

The proposed framework is most effectively integrated into a multi-stage decision process that mirrors professional procurement practices. The first stage would involve an initial screening of all potential suppliers using a set of mandatory, non-negotiable “pass/fail” criteria. For the KSA precast industry, this would include verifying regulatory compliance, assessing financial stability, ensuring a minimum production capacity, and confirming a proven track record. This preliminary filtration efficiently ignores unsuitable candidates, creating a smaller, pre-qualified pool of viable suppliers.
In the second stage, this shortlisted group of suppliers would undergo a detailed evaluation using the hybrid SWARA-PCA-WASPAS-VE framework developed in this paper. By applying a resource-intensive analysis to pre-qualified candidates only, decision-makers can conduct a more focused and rigorous assessment of the nuanced trade-offs between critical factors, such as cost, quality, and delivery performance.
This two-stage approach enhances the scientific and practical value of the selection process. It ensures efficiency by focusing on deep analysis where it matters most. It guarantees that the final top-ranked supplier not only has the highest performance score but also meets all fundamental operational and commercial requirements. This methodology ensures that the final decision is both strategically sound and operationally reliable.

6.2. Comparative Advantages of the Proposed Framework

A primary innovation of this framework is the use of PCA to systematically and objectively link a single, critical quantitative metric (factory capacity) to the CQW matrix. In many traditional hybrid models (e.g., AHP-TOPSIS, Fuzzy AHP), the evaluation of alternatives against qualitative criteria is a purely manual and subjective task, requiring experts to fill out extensive and often complex decision matrices. Our PCA-based approach automates this step, translating supplier capacity into a consistent set of performance coefficients. It significantly reduces the subjective burden on experts, minimizes the potential for human inconsistency, and ensures that the evaluation is grounded in objective operational data, a feature often lacking in other models.
The framework begins with the SWARA method for determining the weights of the criteria. Compared to the popular AHP, SWARA is less complex for experts. It avoids the large number of pairwise comparisons required by AHP, which can lead to expert fatigue and logical inconsistencies, especially when dealing with many criteria. SWARA’s straightforward process of ranking and rating criteria in order of importance makes the initial data collection more efficient and transparent, further enhancing the practical applicability of the model.
In summary, by intelligently combining the strengths of SWARA, PCA, WASPAS, and VE, the proposed framework creates a more automated, stable, and consistent decision-making tool that improves upon many existing hybrid approaches by reducing subjectivity and grounding the evaluation in both expert knowledge and objective performance data.

7. Conclusions

This research proposes an integrated methodology for selecting the best precast concrete supplier in the context of KSA’s construction boom. The methodology employs three well-established techniques: SWARA, WASPAS, and VE. SWARA helps determine the weights and rank the identified criteria. A new method was established to estimate the CQWs of alternatives and create the CQW matrix. This study developed and validated a hybrid MCDM framework for selecting precast concrete suppliers, yielding several key conclusions with significant implications for the construction industry, particularly in high-demand markets like the KSA. Instead of reiterating the methodology, this section outlines the principal findings of the research:
  • The framework’s ability to rank suppliers in a manner perfectly consistent with expert judgment (Spearman’s coefficient = 1.0) validates its core premise: that a supplier’s production capacity is a robust indicator of its overall quality and reliability. The top-ranked supplier (A3) demonstrated a superior capacity, which translated into a higher Value Engineering (VE) score, confirming that in capital-intensive projects, capacity is a critical differentiator.
  • The SWARA revealed that “Method of payment” was the most heavily weighted criterion by the expert panel. This indicates that in the Saudi Arabian construction context, a supplier’s financial terms and their impact on a contractor’s cash flow are considered paramount, often outweighing purely technical specifications in the final decision-making calculus.
  • The novel use of PCA to systematically link an objective metric (factory capacity) to the subjective quality criteria (the CQW matrix) proved highly effective. This automated approach reduces the subjective burden on decision-makers, enhances consistency, and provides a transparent, data-driven foundation for the evaluation, addressing a common limitation in many traditional MCDM models.
  • The framework demonstrated high stability in the sensitivity analysis, with rankings remaining consistent despite significant variations in criteria weights and aggregation parameters. This robustness, combined with the strong validation against expert opinion, establishes the proposed hybrid model as an unprecedentedly effective and reliable tool for strategic supplier selection in the precast concrete industry.
A significant concern is its continued multi-stage dependency on expert judgment for tasks such as initial criteria weighting (SWARA), defining the impact of capacity (PCA), and the final validation. Using different and, at times, small expert panels (e.g., only three experts for validation) across these stages introduces potential inconsistencies and raises questions about the generalizability and robustness of the findings. Additionally, greater transparency regarding the specific selection and differential treatment of criteria (e.g., using only 9 out of 15 initially identified criteria, with cost and capacity handled separately) would strengthen the model’s methodological clarity. Finally, as acknowledged by the authors, the model’s specific application within the KSA construction sector limits its immediate applicability, as different precast elements may dictate varying priorities in selection criteria (e.g., quality vs. design), and selection outcomes could differ significantly across countries. Therefore, future research should expand the framework to encompass broader industries and diverse geographical locations, providing a more comprehensive and widely applicable analysis that would greatly assist stakeholders in enhancing supplier selection efficiency.

Author Contributions

Conceptualization, M.I.A. and K.S.A.-G.; Data curation, M.I.A.; Formal analysis, M.I.A. and N.M.A.; Funding acquisition, K.S.A.-G. and S.I.A.; Investigation, M.I.A., K.S.A.-G., and N.M.A.; Methodology, M.I.A. and K.S.A.-G.; Project administration, K.S.A.-G. and S.I.A.; Resources, M.I.A. and K.S.A.-G.; Software, N.M.A.; Supervision, K.S.A.-G. and S.I.A.; Validation, M.I.A. and K.S.A.-G.; Visualization, M.I.A. and K.S.A.-G.; Writing—original draft, M.I.A. and N.M.A.; Writing—review and editing, K.S.A.-G., N.M.A., and S.I.A. All authors have read and agreed to the published version of the manuscript.

Funding

The study is funded by the Ongoing Research Funding program, (ORF-2025-1265), King Saud University, Riyadh, Saudi Arabia.

Institutional Review Board Statement

The study was conducted in accordance with the Declaration of Helsinki, and approved by the Institutional Review Board (or Ethics Committee) of King Saud University (KSU-HF23-377 in 30 July 2023).

Informed Consent Statement

Informed consent was obtained from all subjects involved in the study.

Data Availability Statement

Data available on request due to privacy restrictions.

Conflicts of Interest

The authors declare no conflicts of interest.

Appendix A

Table A1. Customer survey.
Customer satisfactory survey
Company Name:Location:
ATTN:Project(s) date/duration:
P.O. Box:Tel:
E-Mail:Fax:Survey date:
Inspection/Project:
Please mark √ against the boxes below based on your assessment of our services to your esteemed organization.
You need not write your name on this sheet if you feel so. We would appreciate your sincere comments and valid suggestions for improvement.
SLDescriptionPoorSatisfactoryGoodVery goodExcellent
1Material suitability with the required specification 3
2Guarantee conditions 3
3Method of payments 21
4Accuracy of the quantity sent 3
5On-time delivery 21
6Easy to communicate 3
7Quick response regarding the quality problem 12
8Quick response regarding urgent order 12
9Technical expertise 3
General remarks/Comments/Suggestions:
Name:Signature:
Table A2. Criteria ranking questionnaire.
DenotedCriteriaRank
12345678910
C1Material suitability with the required specification
C2Guarantee conditions
C3Method of payments
C4Accuracy of the quantity sent
C5On-time delivery
C6Easy to communicate
C7Quick response regarding the quality problem
C8Quick response regarding urgent order
C9Technical expertise

References

  1. GCC Statistical Yearbook 2023. Gulf Cooperation Council (GCC) Secretariat. 2023. Available online: https://www.gcc-sg.org/en-us/Statistics/Pages/default.aspx (accessed on 23 June 2025).
  2. Mulliner, E.; Algrnas, M. Preferences for housing attributes in Saudi Arabia: A comparison between consumers’ and property practitioners’ views. Cities 2018, 83, 152–164. [Google Scholar] [CrossRef]
  3. Grand, S.R.; Wolff, K. Assessing Saudi Vision 2030: A 2020 Review; Atlantic Council: Washington, DC, USA, 2022. [Google Scholar]
  4. Henderson, J.C. Religious Tourism and Its Management: The Hajj in Saudi Arabia. Int. J. Tour. Res. 2010, 13, 541–552. [Google Scholar] [CrossRef]
  5. Shash, A.A.; Alawad, M. Modern Construction Methods (MMC) in Saudi Arabia: Evaluation Aspects and Barriers. J. Eng. Arch. 2020, 8, 50–65. [Google Scholar] [CrossRef]
  6. Mohammed, H.A. Precast Concrete Cost Solution. 2018. Available online: https://www.researchgate.net/publication/329391473 (accessed on 14 June 2023).
  7. Priya, P.K.; Neamitha, M. A review on precast concrete. Int. Res. J. Eng. Technol. 2018, 5, 967–971. Available online: www.irjet.net (accessed on 5 April 2023).
  8. Abdellatif, H.; Alshibani, A. Major factors causing delay in the delivery of manufacturing and building projects in Saudi Arabia. Buildings 2019, 9, 93. [Google Scholar] [CrossRef]
  9. Alshakhrit, A.K.; Supeni, E.E.; Zahari, N.I. Causes and effects of delays in Saudi arAabian construction projects. J. Glob. Econ. Manag. Bus. Res. 2019, 11, 165–174. [Google Scholar]
  10. Alsuliman, A.K. Causes of delay in Saudi public construction projects. Alex. Eng. J. 2019, 58, 801–808. [Google Scholar] [CrossRef]
  11. Singh, R.K.; Modgil, S. Supplier selection using SWARA and WASPAS—A case study of Indian cement industry. Meas. Bus. Excell. 2020, 24, 243–265. [Google Scholar] [CrossRef]
  12. Rahmiati, F.; Syafei, H.Y.; Purwanto, P.; Andianto, J. Ceramic supplier selection using analytical hierarchy process method. Int. J. Ind. Optim. 2021, 2, 113–124. [Google Scholar] [CrossRef]
  13. Keshavarz-Ghorabaee, M.; Amiri, M.; Hashemi-Tabatabaei, M.; Zavadskas, E.K.; Kaklauskas, A. A new decision-making approach based on fermatean fuzzy sets and WASPAS for green construction supplier evaluation. Mathematics 2020, 8, 2202. [Google Scholar] [CrossRef]
  14. El Bettioui, W.; Zaim, M.; Sbihil, M. A combined fuzzy multicriteria decision making approach for green supplier selection in building material industry. J. Theor. Appl. Inf. Technol. 2022, 15, 6913–6933. Available online: www.jatit.org (accessed on 23 March 2023).
  15. Rani, P.; Mishra, A.R.; Krishankumar, R.; Mardani, A.; Cavallaro, F.; Ravichandran, K.S.; Balasubramanian, K. Hesitant fuzzy SWARA-complex proportional assessment approach for sustainable supplier selection (HF-SWARA-COPRAS). Symmetry 2020, 12, 1152. [Google Scholar] [CrossRef]
  16. Plebankiewicz, E.; Kubek, D. Multicriteria Selection of the Building Material Supplier Using AHP and Fuzzy AHP. J. Constr. Eng. Manag. 2016, 142, 04015057. [Google Scholar] [CrossRef]
  17. Al-Ghamdi, M.A.; Al-Gahtani, K.S. Integrated Value Engineering and Life Cycle Cost Modeling for HVAC System Selection. Sustainability 2022, 14, 2126. [Google Scholar] [CrossRef]
  18. Bayazit, O.; Karpak, B.; Yagci, A. A purchasing decision: Selecting a supplier for a construction company. J. Syst. Sci. Syst. Eng. 2006, 15, 217–231. [Google Scholar] [CrossRef]
  19. Abdolshah, M. A Review of Quality Criteria Supporting Supplier Selection. J. Qual. Reliab. Eng. 2013, 2013, 621073. [Google Scholar] [CrossRef]
  20. Cagnin, F.; Oliveira, M.C.; Simon, A.T.; Helleno, A.L.; Vendramini, M.P.; Sampaio, M.S. Proposal of a method for selecting suppliers considering risk management. Int. J. Qual. Reliab. Manag. 2016, 33, 488–498. [Google Scholar] [CrossRef]
  21. Biruk, S.; Jaskowski, P.; Czarnigowska, A. Fuzzy AHP for selecting suppliers of construction materials. In IOP Conference Series: Materials Science and Engineering; IOP Publishing: Bristol, UK, 2019; p. 032093. [Google Scholar] [CrossRef]
  22. Tushar, Z.N.; Bari, A.B.M.M.; Khan, M.A. Circular supplier selection in the construction industry: A sustainability perspective for the emerging economies. Sustain. Manuf. Serv. Econ. 2022, 1, 100005. [Google Scholar] [CrossRef]
  23. Ulutaş, A. Supplier Selection by Using a Fuzzy Integrated Model for a Textile Company. Eng. Econ. 2019, 30, 579–590. [Google Scholar] [CrossRef]
  24. Lopes, A.P.; Rodriguez-Lopez, N. A Decision Support Tool for Supplier Evaluation and Selection. Sustainability 2021, 13, 12387. [Google Scholar] [CrossRef]
  25. Zolfani, S.H.; Yazdani, M.; Zavadskas, E.K. An extended stepwise weight assessment ratio analysis (SWARA) method for improving criteria prioritization process. Soft Comput. 2018, 22, 7399–7405. [Google Scholar] [CrossRef]
  26. Nurprihatin, F.; Antonius, R.; Rembulan, G.D.; Djajasoepena, R.; Sulistyo, E. Analytical hierarchy process and TOPSIS approach to perform supplier selection in construction industry. J. Ind. Eng. Manag. Syst. 2022, 15, 130–138. Available online: http://journal.ubm.ac.id/index.php/jiems (accessed on 23 June 2025). [CrossRef]
  27. Su, Y. Selection and Application of Building Material Suppliers Based on Intuitionistic Fuzzy Analytic Hierarchy Process (IFAHP) Model. IEEE Access 2020, 8, 136966–136977. [Google Scholar] [CrossRef]
  28. Qambrani, F.U.R.; Yousfani, A.M. Quality Attributes for Supplier Selection in the Construction Industry of Pakistan: The Contractors’ Perspective. Eng. Conf. 2022, 22, 10. [Google Scholar] [CrossRef]
  29. Majd, E.; Balakrishnan, V.; Godazgar, V. Selecting the reliable supplier by using the advisor agents. J. Bus. Ind. Mark. 2017, 32, 238–250. [Google Scholar] [CrossRef]
  30. Alsanabani, N.M.; Al-Gahtani, K.S.; Bin Mahmoud, A.A.; Aljadhai, S.I. Integrated Methods for Selecting Construction Foundation Type Based on Using a Value Engineering Principle. Sustainability 2023, 15, 8547. [Google Scholar] [CrossRef]
  31. Jiang, B.; Tian, L. Effects of Reactive Capacity on Product Quality and Firm Profitability in an Uncertain Market. Oper. Res. 2022, 70, 2619–2636. [Google Scholar] [CrossRef]
  32. Elshafei, B.; Mo, F.; Chaplin, J.C.; Arellano, G.M.; Ratchev, S. Capacity Modelling and Measurement for Smart Elastic Manufacturing Systems. In Proceedings of the 2023 AeroTech, Fort Worth, TX, USA, 14–16 March 2023. SAE Technical Paper. [Google Scholar]
  33. Ahmad, N.; Kasim, M.M.; Rajoo, S.S.K. Evaluating supplier quality performance using fuzzy analytical hierarchy process. AIP Conf. Proc. 2014, 1635, 35–40. [Google Scholar] [CrossRef]
  34. Ding, F.-Y.; Raghavan, B.; Pollard, S. Supplier capacity analysis for a manufacturing firm with a case study. Prod. Plan. Control. 2007, 18, 514–525. [Google Scholar] [CrossRef]
  35. Bradford, P.; Koenig, T.; Cordonnier, K.; Buckmaster, J.; Ballinger, J.; Ladd, D.; Gale, J.; Gilstorf, A.; Honda Motor Co., Ltd. Computerized Dynamic Capacity Management System and Method. U.S. Patent Application 13/205, 9 February 2012. [Google Scholar]
  36. Tu, J.F.; Liu, K. Order Allocation Based on Supplier Capacity-Load Balance. In 2011 International Conference on Computer Science and Service System (CSSS); IEEE: New York, NY, USA, 2011. [Google Scholar]
  37. Zolfani, S.H.; Zavadskas, E.K.; Turskis, Z. Design of products with both international and local perspectives based on Yin-Yang balance theory and SWARA method. Ekon. Istraz. 2013, 26, 153–166. [Google Scholar] [CrossRef]
  38. Stanujkic, D.; Karabasevic, D.; Zavadskas, E.K. A framework for the selection of a packaging design based on the SWARA method. Eng. Econ. 2015, 26, 181–187. [Google Scholar] [CrossRef]
  39. Alinezhad, A.; Khalili, J. International Series in Operations Research & Management Science New Methods and Applications in Multiple Attribute Decision Making (MADM). 2019. Available online: http://www.springer.com/series/6161 (accessed on 15 May 2023).
  40. Chakraborty, D.; Elhegazy, H.; Elzarka, H.; Gutierrez, L. A novel construction cost prediction model using hybrid natural and light gradient boosting. Adv. Eng. Inform. 2020, 46, 101201. [Google Scholar] [CrossRef]
  41. Rani, P.; Mishra, A.R.; Krishankumar, R.; Ravichandran, K.; Kar, S. Multi-criteria food waste treatment method selection using single-valued neutrosophic-CRITIC-MULTIMOORA framework. Appl. Soft Comput. 2021, 111, 107657. [Google Scholar] [CrossRef]
  42. Polat, G.; Eray, E.; Bingol, B.N. An integrated fuzzy MCGDM approach for supplier selection problem. J. Civ. Eng. Manag. 2017, 23, 926–942. [Google Scholar] [CrossRef]
  43. Tomczak, M.; Biruk, S.; Jaskowski, P. Selection of Construction Products Suppliers According to the Condorcet Criterion. In IOP Conference Series: Materials Science and Engineering; IOP Publishing: Bristol, UK, 2019. [Google Scholar] [CrossRef]
  44. Azadeh, A.; Zarrin, M.; Salehi, N. Supplier selection in closed loop supply chain by an integrated simulation-Taguchi-DEA approach. J. Enterp. Inf. Manag. 2016, 29, 302–326. [Google Scholar] [CrossRef]
  45. de Santis, R.B.; Golliat, L.; de Aguiar, E.P. Multi-criteria supplier selection using fuzzy analytic hierarchy process: Case study from a Brazilian railway operator. Braz. J. Oper. Prod. Manag. 2017, 14, 428–437. [Google Scholar] [CrossRef]
  46. Shrestha, N. Factor Analysis as a Tool for Survey Analysis. Am. J. Appl. Math. Stat. 2021, 9, 4–11. [Google Scholar] [CrossRef]
  47. Akintoye, A. Analysis of factors influencing project cost estimating practice. Constr. Manag. Econ. 2000, 18, 77–89. [Google Scholar] [CrossRef]
  48. Mamavi, O.; Nagati, H.; Pache, G.; Wehrle, F.T. How does performance history impact supplier selection in public sector? Ind. Manag. Data Syst. 2015, 115, 107–128. [Google Scholar] [CrossRef]
  49. Ebrahimipour, V.; Shoja, B.M.; Li, S.; Madu, C. Supplier selection considering product structure and product life cycle cost. Int. J. Qual. Reliab. Manag. 2016, 33, 654–675. [Google Scholar] [CrossRef]
  50. de Araújo, M.C.B.; Alencar, L.H.; Viana, J.C. Structuring a model for supplier selection. Manag. Res. Rev. 2015, 38, 1213–1232. [Google Scholar] [CrossRef]
Figure 1. Methodology framework.
Applsci 15 08027 g001
Figure 2. Radar chart of supplier performance profiles and overall ranks for WSM.
Applsci 15 08027 g002
Figure 3. Radar chart of supplier performance profiles and overall ranks for WPM.
Applsci 15 08027 g003
Figure 4. Sensitivity of supplier rankings to the λ coefficient.
Applsci 15 08027 g004
Figure 5. Comparison between research results and expert findings.
Applsci 15 08027 g005
Table 1. Summary of the literature review.
S. NoAuthor(s) and YearResearch IntentionsUnit of
Analysis
Tool of AnalysisApproach
1[16]building materialsIndustryAnalytical Hierarchy Process (AHP) and Fuzzy Analytic Hierarchical Process (FAHP)Findings are available in the literature, as well as the authors’ own experience
2[11]cementIndustryStepwise Weight Assessment Ratio Analysis (SWARA) and Weighted Aggregated Sum Product Assessment (WASPAS)Brainstorming sessions for SWARA and WASPS with a set of experts
3[18]limeFirmAnalytic Hierarchical Process (AHP) and sensitivity analysisMeetings with a team of AKG decision-makers
4[24]fresh fruit FirmPreference Ranking Organization Method for Enrichment of Evaluations—Geometrical Analysis for Interactive Assistance (PROMETHEE-GAIA)Use of expert knowledge from specialists
5[25]high-tech industriesIndustryStepwise Weight Assessment Ratio Analysis (SWARA)Integrating the reliability evaluation of experts’ ideas into the first step of SWARA
6[12]feldspar FirmAnalytical Hierarchy Process (AHP)Questionnaires and an interview
7[23]textile supplierFirmFuzzy Analytic Hierarchy Process (FAHP) and fuzzy extension of Operational Competitiveness Rating (Fuzzy OCRA)Questionnaires
8[17]an HVAC system IndustryAHP, pairwise,
Function Analysis System (FAST), and Monte Carlo techniques
Interviews and case study
9[19]the quality evaluation of suppliersIndustryAHP and Modified Likelihood Ratio (MLR) selection ruleReview of the existing literature
10[20]material suppliers’ systematic selection in the automotive industry FirmAHP, Failure Mode and Effect Analysis (FMEA)Case study
11[13]evaluation of green
construction suppliers
FirmFuzzy sets: simple multi-attribute
rating technique (SMART) and WASPAS
A group of decision-makers, including three experts
12[15]to evaluate and select a desirable sustainable supplier
within the HFS context
FirmCOPRAS (Complex Proportional Assessment) and SWARA (Stepwise
Weight Assessment Ratio Analysis)
Use of expert knowledge from a team of managers
13[21]construction material FirmFuzzy AHPCase study
14[26]financial and non-financial lossesFirmAnalytical Hierarchy Process (AHP) and Technique for Order Preference by Similarity to Ideal Solution (TOPSIS)Qualitative opinions based on pairwise comparisons
15[27]building material FirmIntuitionistic Fuzzy Analytic Hierarchy Process (IFAHP) ModelKnowledgeable and experienced experts
16[14]ceramic tile company FirmFuzzy Analytic Hierarchical Process (Fuzzy AHP) and Fuzzy Technique for Order Preference by Similarity to Ideal Solution (Fuzzy TOPSIS)A real-world case study
17[28]quality attributes IndustryWeighted Sum Model (WSM)A survey targeting renowned contractors in Pakistan
18[22]building and construction industry suppliers IndustryFuzzy Analytical Hierarchy Process (FAHP) and a Preference Ranking Organization Method for Enrichment of Evaluations II (PROMETHEE II)Literature reviews and expert feedback
19[29]intelligent agentsIndustryTrust-based recommender system for the peer production services (TREPPS) model, Technique for Order Preference by Similarity to Ideal Solution (TOPSIS)Case study
20[30]to develop a framework for selecting appropriate foundation typesFirmFunction Analysis System Technique (FAST), SWARA, WASPAS, and Value Engineering (VE) methodsReviewing international standards, expert interviews, and the literature
Table 2. The criteria were found through the stage of collecting data.
#CriterionAuthor(s)
C1Material suitability with the required specification[12]
C2Guarantee conditions[43]
C3Method of payment[12]
C4Accuracy of the quantity sent[12]
C5On-time delivery[12]
C6Easy communication[43]
C7Quick response regarding quality problems[12]
C8Quick response regarding an urgent order[12]
C9Technical expertise[43]
C10Cost[14]
C11Production capacity[44]
C12Experience and track record[22]
C13Sustainability practices[15]
C14Supply chain management[11]
C15Safety standards[45]
Table 3. Experts’ information about the first group.
ExpertSectorPositionYears of Experience
Exp. 1GovernmentalSupplier relationship manager13
Exp. 2PrivateConstruction manager23
Exp. 3PrivateProcurement manager18
Exp. 4GovernmentalSupplier relationship specialist9
Exp. 5GovernmentalSupply chain supervisor12
Exp. 6PrivateProject manager12
Exp. 7PrivateProject manager10
Table 4. Criteria ranking by experts.
C1C2C3C4C5C6C7C8C9
Exp. 1231746895
Exp. 2142839567
Exp. 3324517986
Exp. 4342718956
Exp. 5341829765
Exp. 6241938576
Exp. 7231857694
Table 5. Weightage calculations through SWARA.
RIISKqW
C60.857143 1.0001.0000.171
C40.8253970.0381.0380.9630.165
C80.7936510.0401.0400.9260.159
C70.7777780.0201.0200.9070.156
C90.6190480.2561.2560.7220.124
C20.3809520.6251.6250.4440.076
C50.3015870.2631.2630.3520.060
C10.2539680.1881.1880.2960.051
C30.1904760.3331.3330.2220.038
Table 6. Survey data on the influence of the nine criteria.
NoQ1Q2Q3Q4Q5Q6Q7Q8Q9
Exp. 1435555554
Exp. 2441343314
Exp. 3002050053
Exp. 4−1−2−4−4−5−4−4−4−4
Exp. 5000−5−500−50
Exp. 6000000000
Exp. 7−1−2−3−2−2−4005
Exp. 8550554355
Exp. 9444454444
Exp. 10344444445
Exp. 1134005−3−234
Exp. 125444−24−2−35
Exp. 13340440123
Exp. 14003255551
Exp. 15305000455
Exp. 16030030454
Exp. 17553255535
Exp. 18−531−111−5−4−5
Exp. 19444532345
Exp. 20123253244
Table 7. KMO and Bartlett’s test.
Kaiser–Meyer–Olkin Measure of Sampling Adequacy0.708
Bartlett’s Test of SphericityApprox. Chi-Square142.271
df36
Sig.0.000
Table 8. Eigenvalue with variance explained.
ComponentInitial Eigenvalues
Total% of VarianceCumulative %
Raw149.11763.17963.179
29.34512.02075.199
37.4749.61384.813
45.8237.49092.302
52.4053.09495.396
61.4791.90397.299
71.0591.36298.660
80.7320.94199.602
90.3100.398100.000
Table 9. Rotated component matrix.
Component
12
C11.8651.010
C21.8270.436
C31.7600.893
C42.3831.350
C51.3712.611
C62.4840.717
C71.1302.330
C80.5683.355
C91.1702.002
Table 10. RML and C ¯ of the nine criteria.
RML C ¯
C11.8650.128
C21.8270.125
C31.7600.121
C42.3830.164
C51.3710.094
C62.4840.171
C71.1300.078
C80.5680.039
C91.1700.080
1.000
Table 11. Normalization of PCA.
Alternative SupplierCapacity per Year (m3) Capacity   per   Day   ( C S ) (m3) N C S
A1360,0009860.72
A2300,0008220.6
A3500,00013701
A4300,0008220.6
A5250,0006850.5
Table 12. CQWs of the alternative supplier using PCA.
C1C2C3C4C5C6C7C8C9
A10.0920.090.0870.1180.1180.0680.1230.0560.028
A20.0770.0750.0730.0980.0980.0560.1030.0470.023
A30.1280.1250.1210.1640.1640.0940.1710.0780.039
A40.0770.0750.0730.0980.0980.0560.1030.0470.023
A50.0640.0630.0610.0820.0820.0470.0860.0390.02
Table 13. Normalized weighted matrix of WSM.
C1C2C3C4C5C6C7C8C9WSM
A10.0050.0070.0030.0190.0070.0120.0190.0090.0030.085
A20.0040.0060.0030.0160.0060.0100.0160.0070.0030.070
A30.0070.0100.0050.0270.0100.0160.0270.0120.0050.118
A40.0040.0060.0030.0160.0060.0100.0160.0070.0030.070
A50.0030.0050.0020.0140.0050.0080.0130.0060.0020.059
Table 14. Normalized weighted matrix of WPM.
C1C2C3C4C5C6C7C8C9WPM
A10.8850.8330.9110.7030.8800.6310.7210.6320.6420.077
A20.8770.8210.9050.6820.8700.6110.7010.6150.6260.064
A30.9000.8540.9230.7420.8970.6670.7590.6670.6690.107
A40.8770.8210.9050.6820.8700.6110.7010.6150.6260.064
A50.8690.8100.8990.6620.8610.5930.6820.5970.6160.054
Table 15. WASPAS score.
WSMWPMWASPAS
A10.0850.0770.081
A20.0700.0640.067
A30.1180.1070.112
A40.0700.0640.067
A50.0590.0540.056
Table 16. Ranking of suppliers.
Alternatives to the SupplierWASPASCost (SAR/m2)Normalization of Cost (Cost/Max Cost)VENormalized VE = VEi/Max(VEi)Rank
A10.0811250.960.0840.6933
A20.06713010.0670.5505
A30.1121200.920.1221.0001
A40.067950.730.0920.7542
A50.0561000.770.0730.5974
Table 17. Sensitivity analysis of supplier rankings based on changes in the weight of criterion C6.
ScenarioWeight of C6 (w6)A1 RankA2 RankA3 RankA4 RankA5 RankFinal Ranking (A3 > A4 > A1 > A5 > A2)
Base Case0.17135124A3 > A4 > A1 > A5 > A2
Scenario 1 (+10%)0.18835124A3 > A4 > A1 > A5 > A2
Scenario 2 (+20%)0.20535124A3 > A4 > A1 > A5 > A2
Scenario 3 (+30%)0.22235124A3 > A4 > A1 > A5 > A2
Table 18. Validation result.
A1A2A3A4A5
Exp. 1861097
Exp. 2751086
Exp. 366977
Average7.005.679.678.006.67
RII0.700.570.970.800.67
Rank35124
Disclaimer/Publisher’s Note: The statements, opinions and data contained in all publications are solely those of the individual author(s) and contributor(s) and not of MDPI and/or the editor(s). MDPI and/or the editor(s) disclaim responsibility for any injury to people or property resulting from any ideas, methods, instructions or products referred to in the content.

