1. Introduction
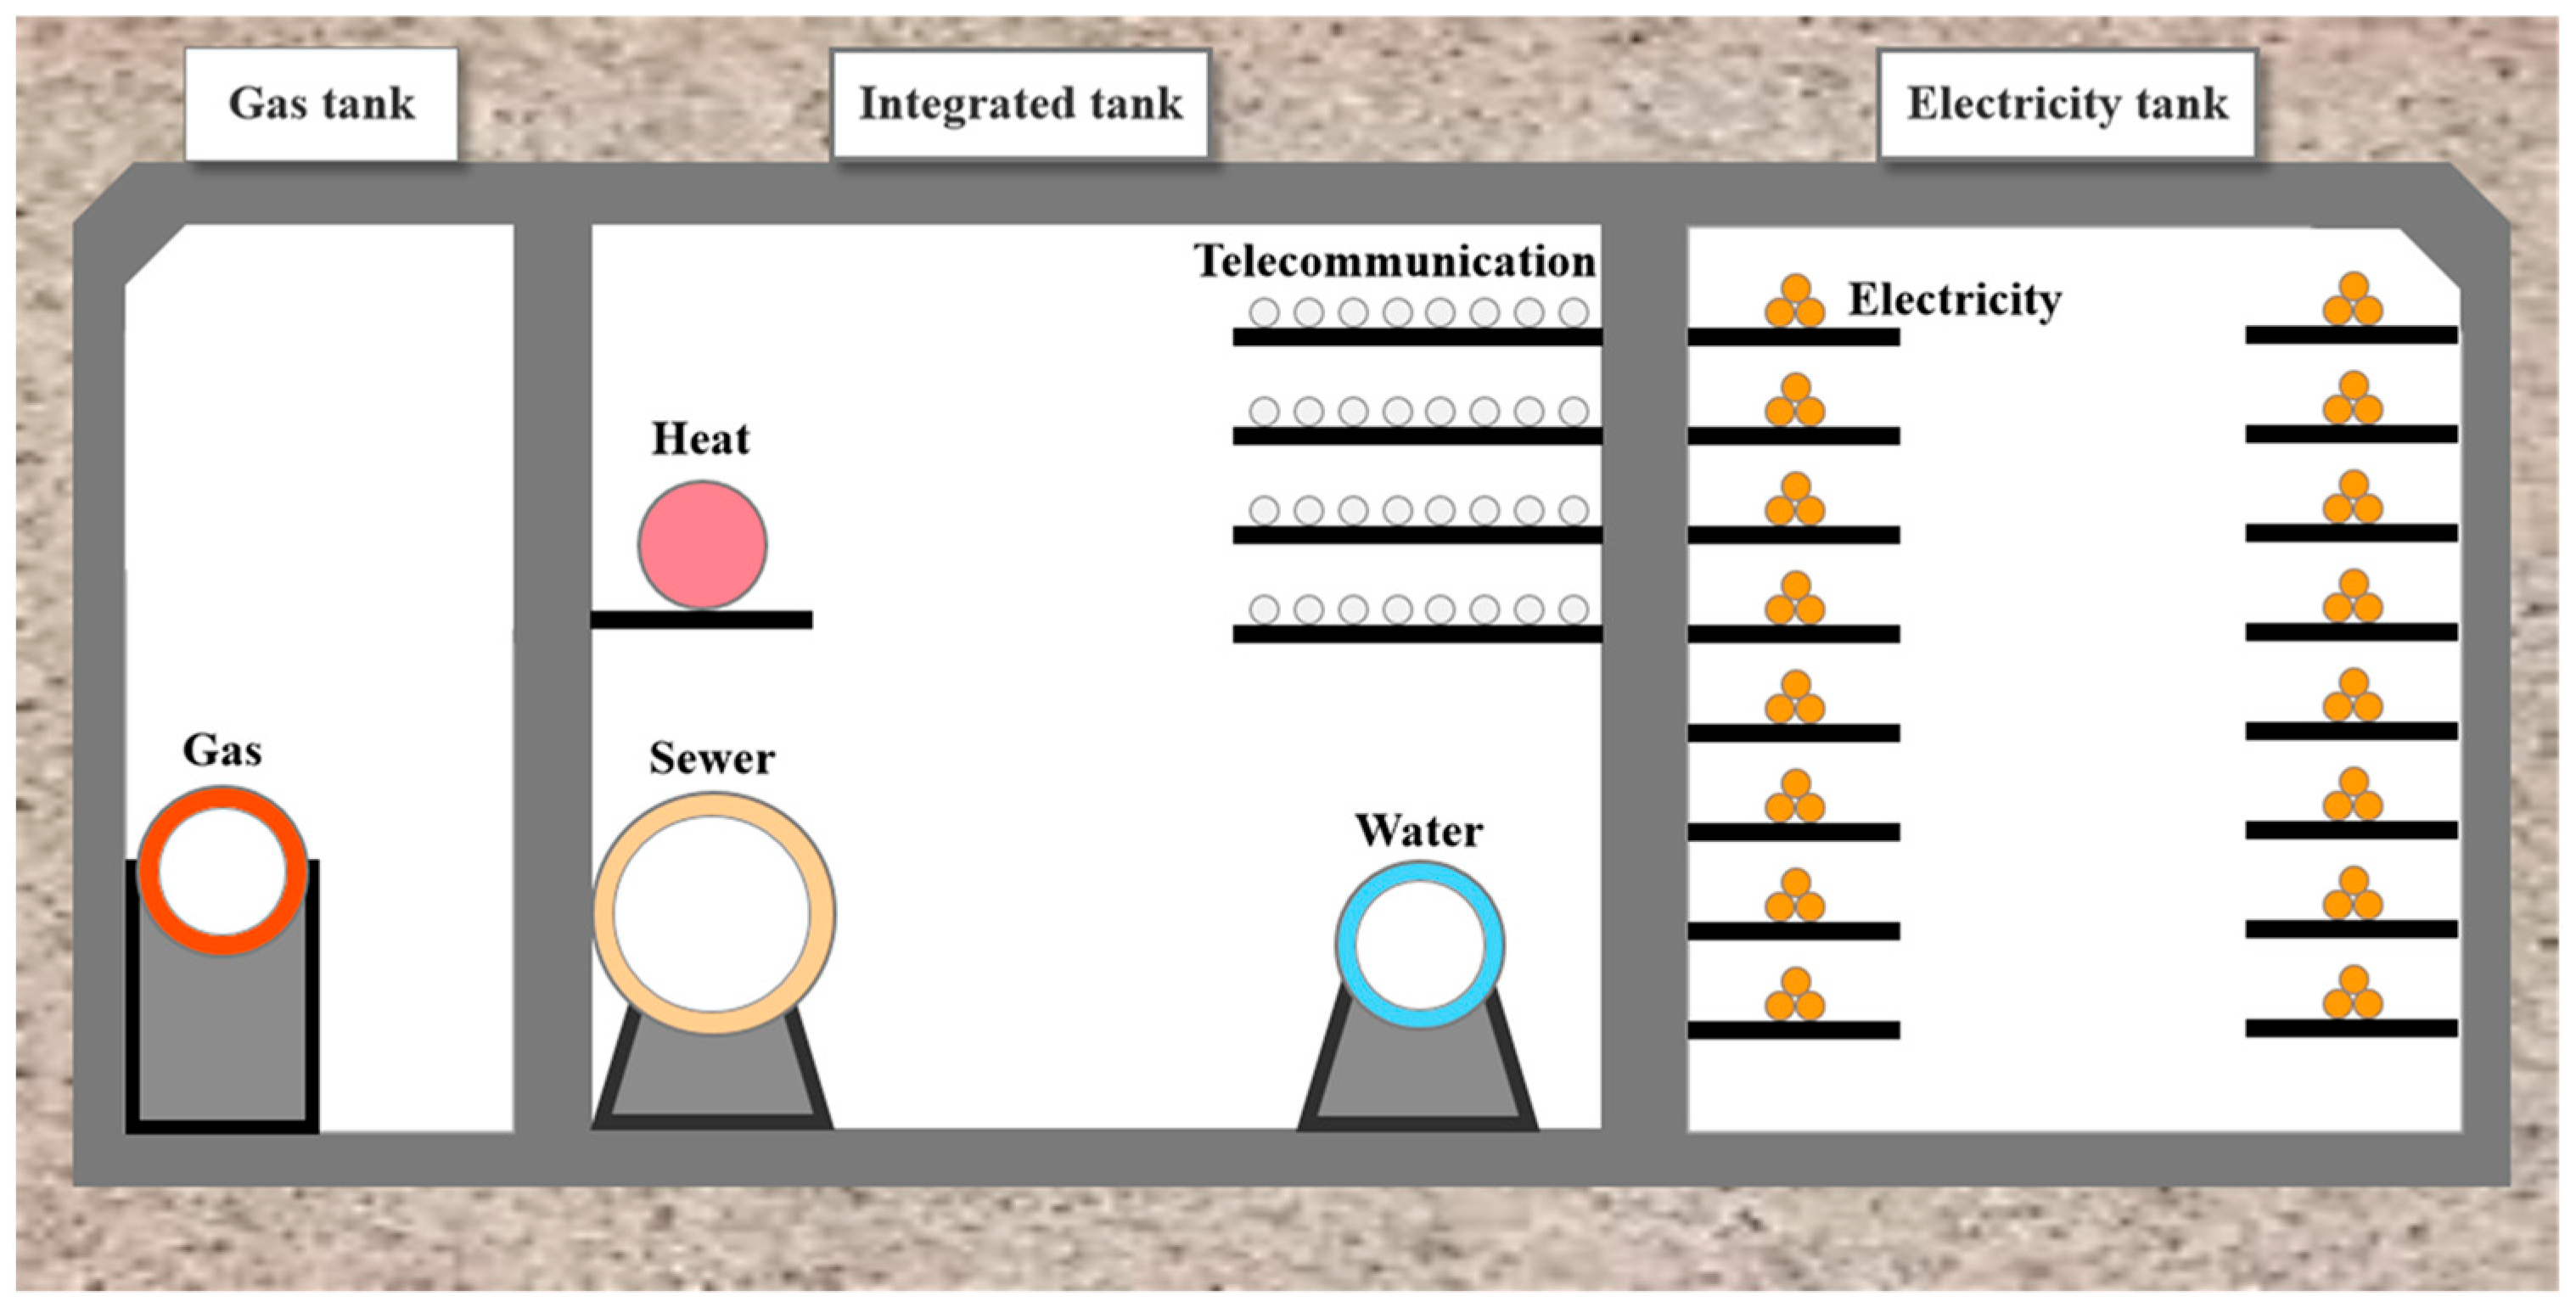
Underground utility tunnels (UUTs), as illustrated in
Figure 1, are vital urban underground infrastructure, which include various utility pipelines and equipment. They play a crucial role in city functioning and, particularly, in the eastern coastal regions of China. The construction of a UUT can reduce the impact on urban ground activities and improve the comprehensive utilization rate of underground space [
1]. At the same time, UUTs can provide protective barriers for pipelines, thereby improving the safety of municipal pipelines. The focus of UUT risk management is transitioning from the construction phase to long-term operation and maintenance. Despite the extensive development of UUTs in recent years, their maintenance is fraught with significant safety hazards and uncertainties. Natural gas pipelines pose a major threat to UUT safety due to their flammable, explosive, and toxic nature. The confined spaces of UUTs exacerbate the risk, as gas leaks can quickly lead to high concentrations and potential fires or explosions, causing more damage than outdoor incidents [
2]. Current quality inspection and risk monitoring practices heavily rely on manual patrols and gas sensors. Patrol personnel regularly conduct routine inspections inside UUTs but are unable to detect leakage of colorless gas. Gas sensors, while providing real-time monitoring, lack the ability to pinpoint leaks until gas concentrations are detectable, which hinders timely responses. Thus, meeting the monitoring needs for large-scale UUTs remains a challenge.
Faced with the above problems, at present, the operation and maintenance phase relies heavily on manual work and sensors, and there is no efficient and accurate detection method to ensure the safe and reliable operation of a UUT. In addition, the risks and safety issues that arise during the operation and maintenance of a UUT are relatively complex, which places high requirements on inspection personnel and significantly increased operating costs [
3]. To solve these problems, this paper aims to realize the real-time monitoring and grading of gas leaks in UUTs. This is achieved through the development of a novel and efficient model based on a deep convolutional neural network (CNN). An experimental setup is designed to simulate the leakage of gases in realistic scenarios, thereby constructing a comprehensive gas leakage dataset for UUTs that encapsulates a diversity of leakage conditions and involves the intricacies of real-world environments. To solve the problem of the low resolution of existing imaging devices, Basic Video Super-Resolution Reconstruction (BasicVSR++) [
4] is used to process thermal imaging video data, and then data enhancement methods, such as rotation, mirroring, adding Gaussian noise, changing brightness, and adding a color block occlusion and sliding window, are used to create a dataset. Then, a convolutional recurrent neural network (CRNN) [
5], based on a CNN and a long short-term memory network (LSTM) of recurrent neural network (RNN) variants, was used to model the time series data to detect and grade gas leaks in UUTs. This study enables the detection of gas leaks within UUTs, overcoming the constraints of current manual inspections and sensor-based detection methods, thereby enhancing the operation and maintenance management capabilities of UUTs.
2. Literature Review
2.1. UUT Gas Leakage Detection and Computer Vision Application
Current UUT gas leakage detection relies on sensor networks for monitoring. Zhou et al. [
6] optimized sensor layouts via CFD simulations, reducing leakage source localization errors to 4.58 m, but they faced trade-offs between the response time and accuracy. Similarly, Wu et al. [
7] proposed a BI-IEnKF-coupling source term estimation model to achieve gas concentration distribution prediction. However, Wu et al. [
7] point out that the integration of models will create a huge computational burden. There is no guarantee of the estimation efficiency. Wang et al. [
8] analyzed gas diffusion patterns for sensor deployment but limited generalizability due to only one tunnel-type simulation. Zhao et al. [
9] integrated CFD with deep learning (DL) for hydrogen-blended gas detection, improving prediction accuracy through sensor optimization but noted insufficient training data. Apart from that, it still relied on gas diffusion, where gas leakage and accumulation were already a reality. Chen et al. [
10] developed a sensor-dependent robotic inspection system, but lacked the ability to accurately locate the leak point in the scene. In addition, Ning et al. [
11] proposed a neural architecture combining spectral enhancement and a CNN to detect leakage in natural gas pipelines. However, leakage signals are susceptible to noise. Current UUT gas leak detection mainly uses sensor-based methods and fluid dynamics for positioning, which improves the detection effect of leak points while achieving unmanned operation. However, it still faces the disadvantages of insufficient positioning accuracy and over-reliance on the cumulative gas concentration threshold. For example, Wang et al. [
12] proposed that the sensor will only sound an alarm when the gas is at 20% of the lower explosion limit. Nevertheless, since alarm triggering occurs after sustained leakage durations, this method inherently suffers from detection latency, allowing for hazardous gas accumulation. These limitations amplify the risks, complicating emergency re-pairs and jeopardizing UUT operational safety.
Recent computer vision (CV) advances enable gas leakage detection. Wang et al. [
12] achieved a 97% accuracy using CNN-based optical imaging, but there is the limitation of insufficient image datasets. Parag et al. [
13] fused LSTM-processed sensor data with CNN-analyzed thermal images for multimodal detection, but model robustness depends on extensive training data and gas mixture complexity. In addition, applying LSTM to sensors still does not get rid of the disadvantage that sensors rely on gas diffusion. Apart from that, using only a CNN to process image data abandons the temporal characteristics of the image. The mixed use of the above two points makes the overall process more complicated. Differing from Wang et al. [
14], methane leak size classification was treated as a video task, achieving near-perfect binary detection accuracy but facing data scarcity. At the same time, the gas leakage data used mainly come from gas leakages in open above-ground spaces, and the problem of insufficient data quality in environments such as UUTs is not discussed. These studies demonstrate the potential of CV while highlighting persistent data scarcity challenges. In addition, many studies have used CV to detect cracks or erosion in pipelines [
15,
16]. However, unlike gas diffusion, cracks or erosion are often static, and gas detection requires attention to the gas-column formation process and state to determine the leakage level. Based on the above, applying CV to gas leak detection can get rid of the limitation of the gas concentration. By identifying the gas column state at the leak point, a judgment can be made, which improves the detection efficiency. However, the current detection objects are often gas leak detection in general scenarios, and conventional CV detection also lacks application for UUTs. At the same time, current detection methods are often limited by insufficient data.
To address the above issues, this study aims to use DL and CV to address the limitations of sensor accuracy and insufficient case data in UUT gas leak detection. Unlike sensors that require actual destructive experiments and leak toxic gases to obtain experimental data, DL-based CV can identify and classify leak events only by the presence or absence of leaks and the shape of the leaked gas column, which provides a solution to the high requirements of gas-diffusion-based sensor detection on the concentration and gas type. In terms of scalability, the proposed method has advantages over traditional sensor detection. Traditional sensor-based methods [
6,
7,
8,
9,
10,
11,
12] face scalability challenges due to the need to deploy a large number of physical sensors and perform calibration and maintenance in a large UUT network, and their costs continue to grow with the length and complexity of the UUT. In contrast, since the UUT needs to be equipped with real-time monitors to ensure daily safety and achieve full scene coverage, the CV-based method can utilize the existing monitor infrastructure in the UUT without the need for additional sensors or hardware. In addition, all camera data are aggregated to the server through the network for processing. The central server can exert centralized data processing capabilities and process input data from multiple cameras at the same time without excessive hardware requirements. On the other hand, in response to the existing CV detection method [
12,
13,
14,
15,
16], this study built an experimental data acquisition platform. By extracting single-frame images from the video and combining data enhancement methods, a large amount of data can be provided, thereby overcoming the challenge of insufficient data. The experimental scenario has high scalability and can provide a simulation site for different gas leaks and different environmental conditions, ensuring the way to obtain data. At present, there are few studies on the application of DL and CV in UUT operation and maintenance. This study aims to develop an infrared-camera-based system using existing monitors, especially for low-light environmental conditions. The goal of this system is to use spatiotemporal sequence CRNN technology to build an infrared monitoring system for continuous monitoring inside the UUT, focusing on detecting high-risk events such as natural gas pipeline leaks.
2.2. Video Super-Resolution Reconstruction Technology
Super-resolution reconstruction is divided into single image (SR) and VSR, among which VSR is more suitable for dynamic monitoring of gas diffusion through multi-frame time series processing. Liu et al. [
17] divided deep learning-based VSR methods into the following two categories: alignment and non-alignment. Alignment methods use inter-frame motion information for feature alignment, such as deformable convolution; non-alignment methods directly fuse spatiotemporal features, such as end-to-end deep neural network [
18]. In response to the high complexity of traditional VSR models, Chan et al. [
19] proposed BasicVSR, which mitigates local propagation constraints and single-line imbalance via bidirectional propagation for efficient reconstruction. Its enhanced version, BasicVSR++ [
4], combines second-order mesh propagation and flow-guided deformable alignment to achieve improved performance. The UUT gas detection method adopts BasicVSR++ due to its end-to-end efficiency, multi-scale feature fusion, robust spatiotemporal integration, and compatibility with LSTM-based joint modeling in VSR tasks.
VSR enhances video quality and recognition accuracy, with applications in medical imaging [
20,
21], satellite remote sensing [
22,
23], 3D reconstruction [
24], VR [
25], and surveillance. However, existing VSR methods primarily target visible-light datasets, with limited adoption in thermal imaging and civil engineering applications. The low-resolution infrared equipment used in UUT systems further degrades imaging quality in dark environments, making VSR a crucial research focus for UUT operation and maintenance management.
2.3. Time Series Video Classification Technology Based on CRNN
The original DL-based video classification methods independently extracted frame features and pooled predictions, neglecting temporal dynamics. Enhancements like long-term recurrent convolutional networks (LRCNs) [
26] combined 2D CNNs with LSTMs for temporal modeling but lost structural features. Three-dimensional convolutions [
27] addressed this by integrating temporal dimensions, while two-stream inflated 3D conv [
28] further improved spatiotemporal feature extraction. Recent advances include Transformer-based models like the video transformer network (VTN) [
29], which uses 2D convolutions and attention mechanisms for efficient spatiotemporal learning, achieving competitive performance with faster training and inference. Gas leakage dynamics require temporal dependency modeling across sequential frames. Current single-frame approaches neglect structural time series information, reducing the classification accuracy. Exploring temporal feature extraction is critical for monitoring dynamic hazards like UUT natural gas leaks.
To solve the above problems, this paper proposes a UUT pipeline operation and maintenance monitoring method based on DL and CV. The main contributions are as follows:
Model development and implementation. This paper proposes a CRNN detection method based on LSTM and a CNN, which can fully identify the occurrence of leakages and grade the leakage level using time series information, providing a new technical solution for UUT operation and maintenance management.
Experimental design. In order to safely and effectively obtain data for model training, this paper sets up an experimental environment on site to fully restore and simulate the on-site conditions and truly simulate a gas leakage state, which ensures the validity of the data.
Dataset creation. To make full use of time series information, this paper uses sliding windows and other means to create a dataset, as well as a variety of data enhancement methods to increase the complexity of the data, which helps to improve the training effect of the model and enhance the robustness of the model.
3. Research Methods
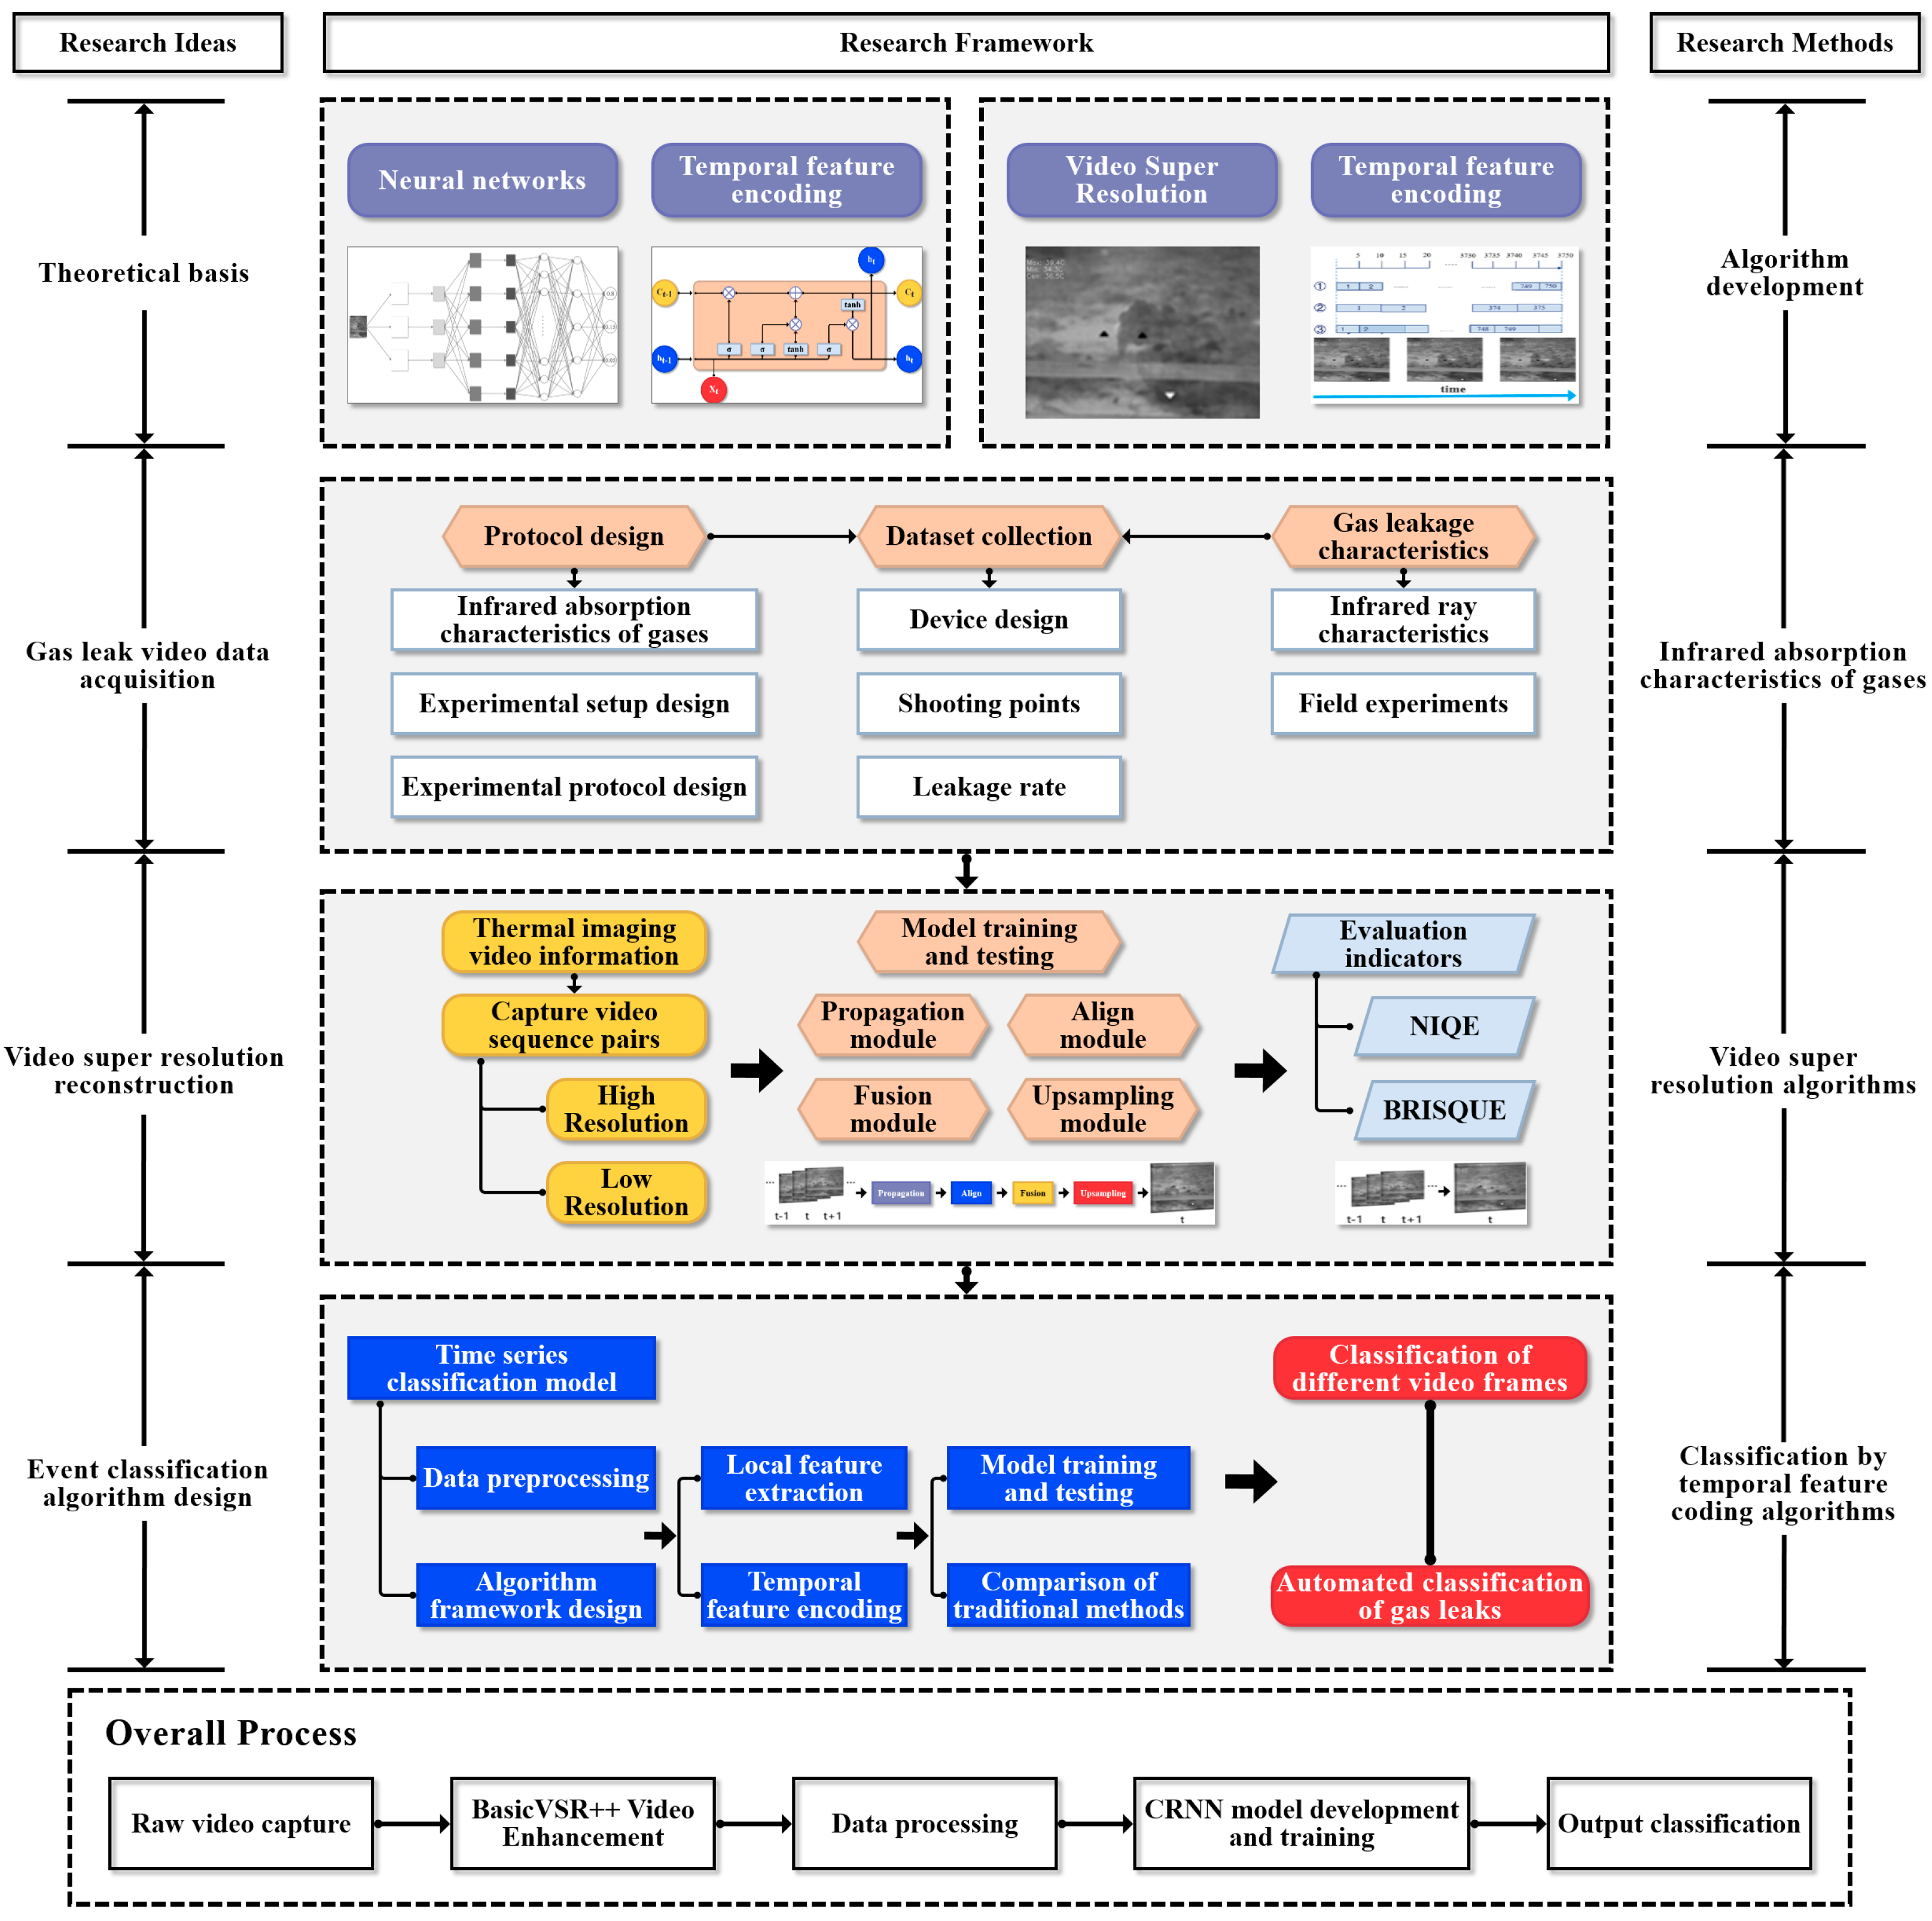
The research process of this paper is shown in
Figure 2. The project mainly includes the following three stages: experimental design, dataset collection and production, and a VSR and time-series-based CRNN gas leakage detection system. Since there is no public infrared image dataset for natural gas pipeline leakage at different rates in UUTs, in order to obtain image data for model training, a complete experimental process was designed and a natural gas plant in Nanjing, China, was visited for field data collection. A set of video monitoring data of a natural gas leakage was filmed and collected. Since the clarity of the source video captured was not sufficient to support refined model training, VSR was used to achieve noise reduction and a detailed reconstruction of the video data. In addition, data enhancement is a common method that can avoid the overfitting problem in DL and improve its diversity and generalization ability. To increase the complexity of the image scene used in the experiment, data enhancement operations were performed on the image data after super-resolution reconstruction. After the dataset was completed, the CRNN algorithm based on the time series was designed and tested. It was evaluated using some indicators such as accuracy and a confusion matrix. Combined with the set gas-leakage automatic grading operation, a comprehensive UUT gas-leakage detection system was developed. In addition, the developed model was compared with the traditional CNN model to comprehensively evaluate its performance. The developed model can well meet the needs of actual detection and has application value.
3.1. Steps of BasicVSR++ Restoration
VSR algorithms need to use the temporal information between adjacent frames to assist in reconstructing high-resolution video frames, which makes VSR algorithms more challenging than single-frame image super-resolution algorithms. BasicVSR++ reconstruction can be mainly divided into the following four parts: propagation, alignment, aggregation, and up-sampling.
3.1.1. Propagation
The propagation module determines the way that the algorithm uses the video sequence information. Current propagation methods are mainly local propagation, one-way propagation, and two-way propagation [
19]. BasicVSR++ is based on two-way propagation, which can realize multiple information propagation optimizations and improve the information aggregation ability. However, the algorithm has difficulty distinguishing between unwanted shadows and beneficial details in the case of unknown degradation types. Therefore, a pre-cleaning module is needed to process the degradation information before information propagation. The residual network is used to process the input and output of the pre-cleaning module. The variable
xi represents the
i-th frame image of the input sequence, and C represents the image cleaning module.
The cleaned sequence information is input into the BasicVSR model for quality reconstruction, as shown in Equation (2), where
S represents the VSR algorithm.
To constrain the output of the image pre-cleaning module, the cleaning process loss,
, and fidelity loss,
, are introduced as shown in Equation (3), as follows:
where
represents the high-resolution image,
d represents the down-sampling operation, and
represents the Charbonnier loss [
30], as follows:
where
x represents the difference between the predicted value and the true value, and
represents a constant, usually 10
−3.
3.1.2. Alignment
Existing alignment methods include unaligned, image alignment, and feature alignment. Unaligned methods risk accuracy loss in aggregation modules, degrading performance. Image alignment relies on optical flow for frame warping, often causing blurring and detail loss. Feature alignment employs motion estimation, compensation or deformable convolutional networks to align frames via motion extraction and distortion. The process can be described as follows:
where
MC is the motion compensation function,
I is the continuous adjacent frames,
is the optical flow vector field,
is the parameter of the motion compensation function,
and
are the horizontal and vertical optical flow vector fields,
ME is the optical flow vector field calculation function, and
is the parameter of the optical flow vector field calculation function.
In addition, since BasicVSR++ introduces DCN, the VSR technology based on DCN calculates the spatial offset by processing the target frames and adjacent frames in parallel and deforms the adjacent frames to achieve accurate alignment of the feature map. This process fully considers the spatial variability of each feature point and its corresponding offset. The mathematical expression of the process is the following:
where
is the aligned feature map, and
is the offset corresponding to the feature point, with its specific expression shown in Equation (7), and
is the mask corresponding to the feature points.
where
f is the function composed of the convolutional layer,
and
are the low-resolution feature maps of the
t +
i-th frame and the
t-th frame, respectively.
3.1.3. Fusion
Feature fusion can effectively improve the performance of the algorithm. In the field of super-resolution, commonly used fusion methods are splicing and addition. Splicing splices multiple feature maps in the depth dimension to obtain richer feature expressions. Addition can add multiple feature map elements to obtain the average value of the feature, thereby reducing the impact of noise.
3.1.4. Up-Sampling
At present, most of the up-sampling modules of the super-resolution methods choose to use the pixel reorganization method. Pixel reorganization is a classic up-sampling method that can effectively enlarge the reduced feature map. Its main function is to obtain a high-resolution feature map from a low-resolution feature map through convolution and multi-channel reorganization. It can replace interpolation or deconvolution methods to achieve the up-sampling process, as shown in Equation (8).
where
is the high-resolution image sequence, and
U is the up-sampling module.
3.2. CRNN Grading Algorithm Based on Time Series
3.2.1. Convolutional Neural Network
The convolution layer is the core part of a CNN, which performs cross-correlation operation on the model input and the convolution kernel, as well as adds a scalar to obtain the output. The model parameters of the convolution layer include the convolution kernel and the scalar bias. Usually, after randomly initializing the convolution kernel, the parameters of the convolution kernel and the bias are continuously iterated. The mathematical expression is shown in Equation (9), as follows:
where
and
are the convolution kernel weight and bias of the position respectively,
is the feature map of the previous layer,
is the feature map of the current layer,
is the activation function, and
is the set of feature maps.
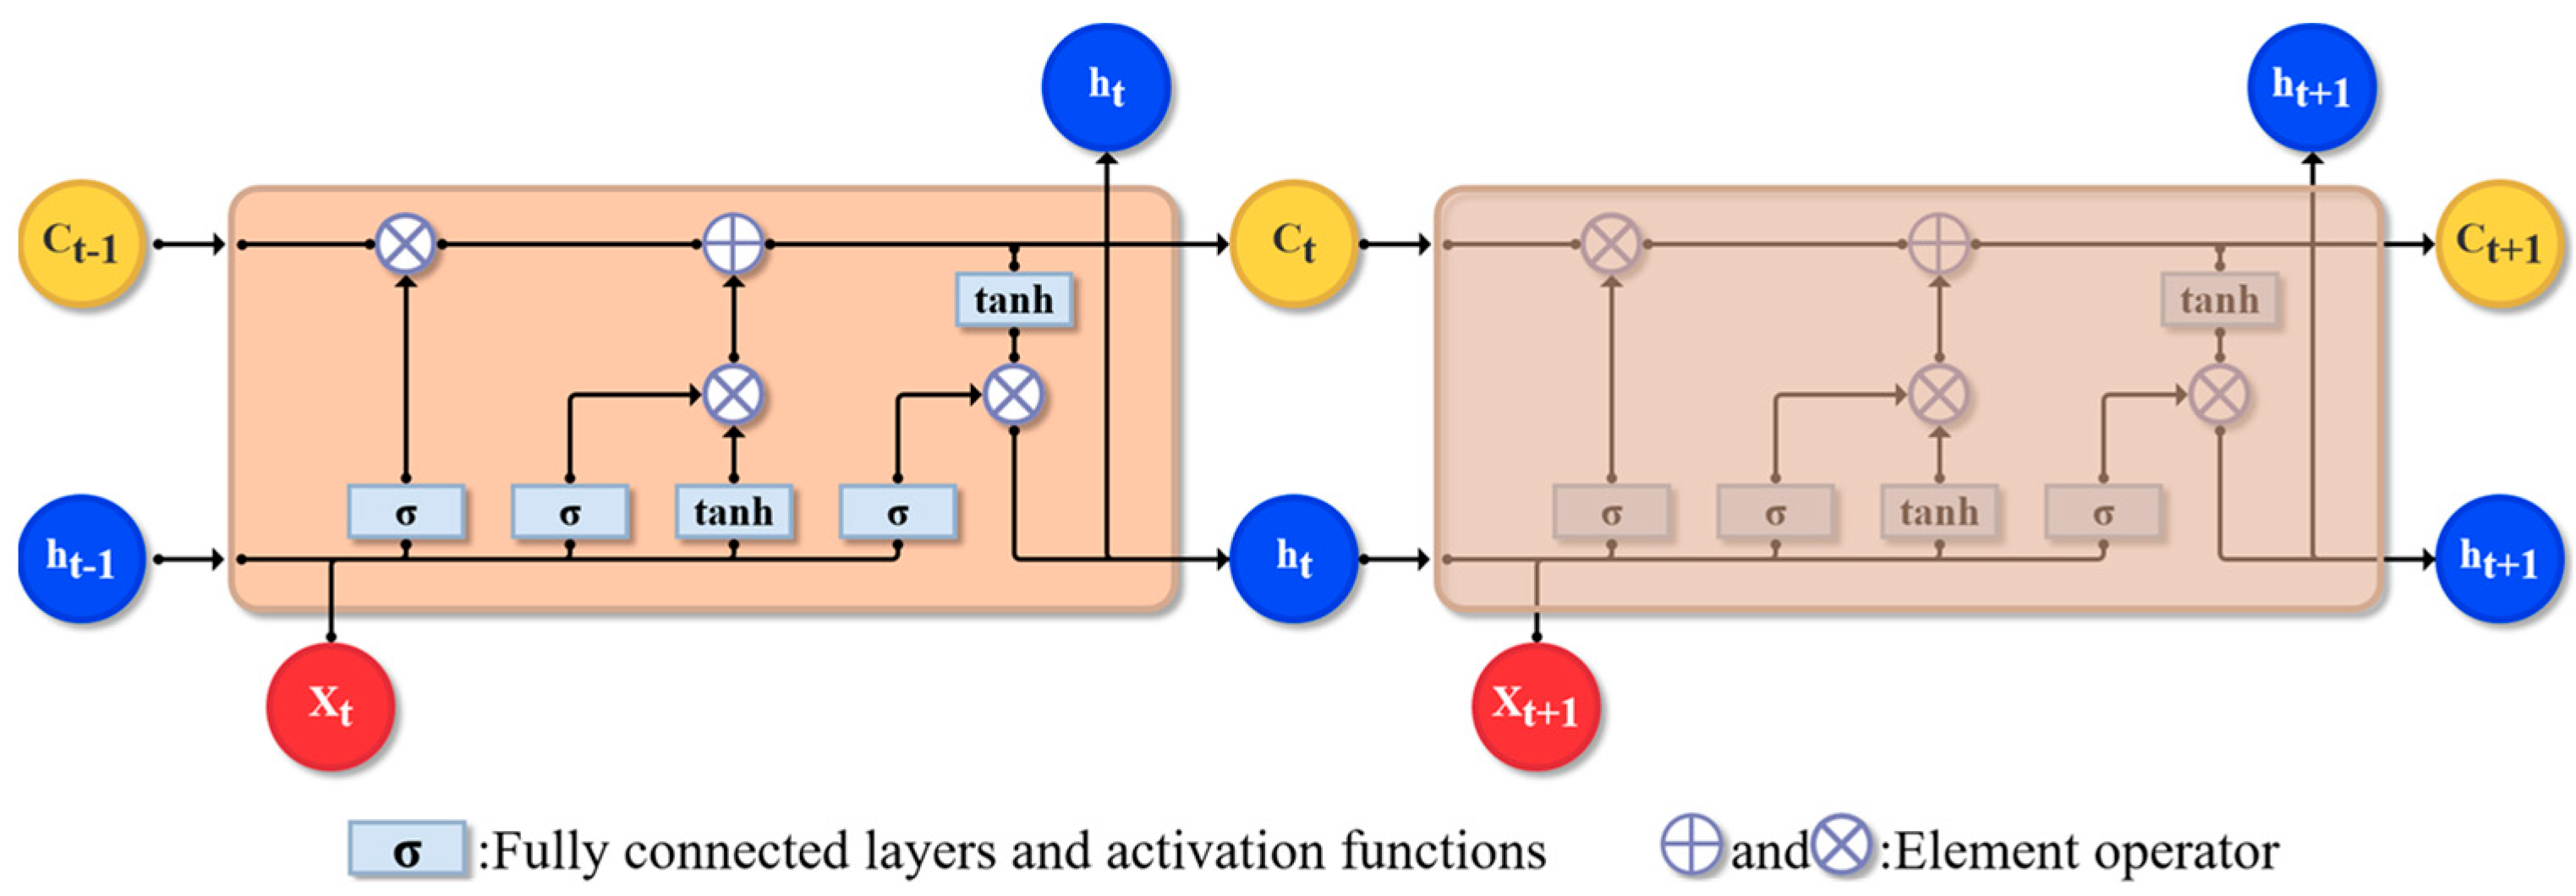
3.2.2. Long Short-Term Memory Network
LSTM is a special RNN model that solves the problem of the standard RNN structure performing poorly at capturing long-term information. LSTM introduces three gate units and memory cells that are the same as the hidden state to record additional information. A structural diagram is shown in
Figure 3.
The input of LSTM is the input of the current time step and the hidden state of the previous time step. The output is the fully connected layer’s output for the calculation of the Sigmoid function. The calculation of each gate unit is shown in Equation (10).
where
is the input gate output at time step
t;
is the forget gate output at time step
t;
is the output gate output at time step
t;
,
,
,
,
, and
are model weight parameters; and
,
, and
are model bias parameters. Then, the candidate memory cell parameter,
, at time step
t is calculated, as follows:
where
is the memory cell of the current time step, and
represents the element multiplication of the matrix. Finally, the output gate controls the output of the memory cell information to the hidden state, as shown in Equation (12). When the output gate is approximately 1, the memory cell will be passed to the hidden state for use by the output layer; when the output gate is approximately 0, the memory cell information is only retained by itself.
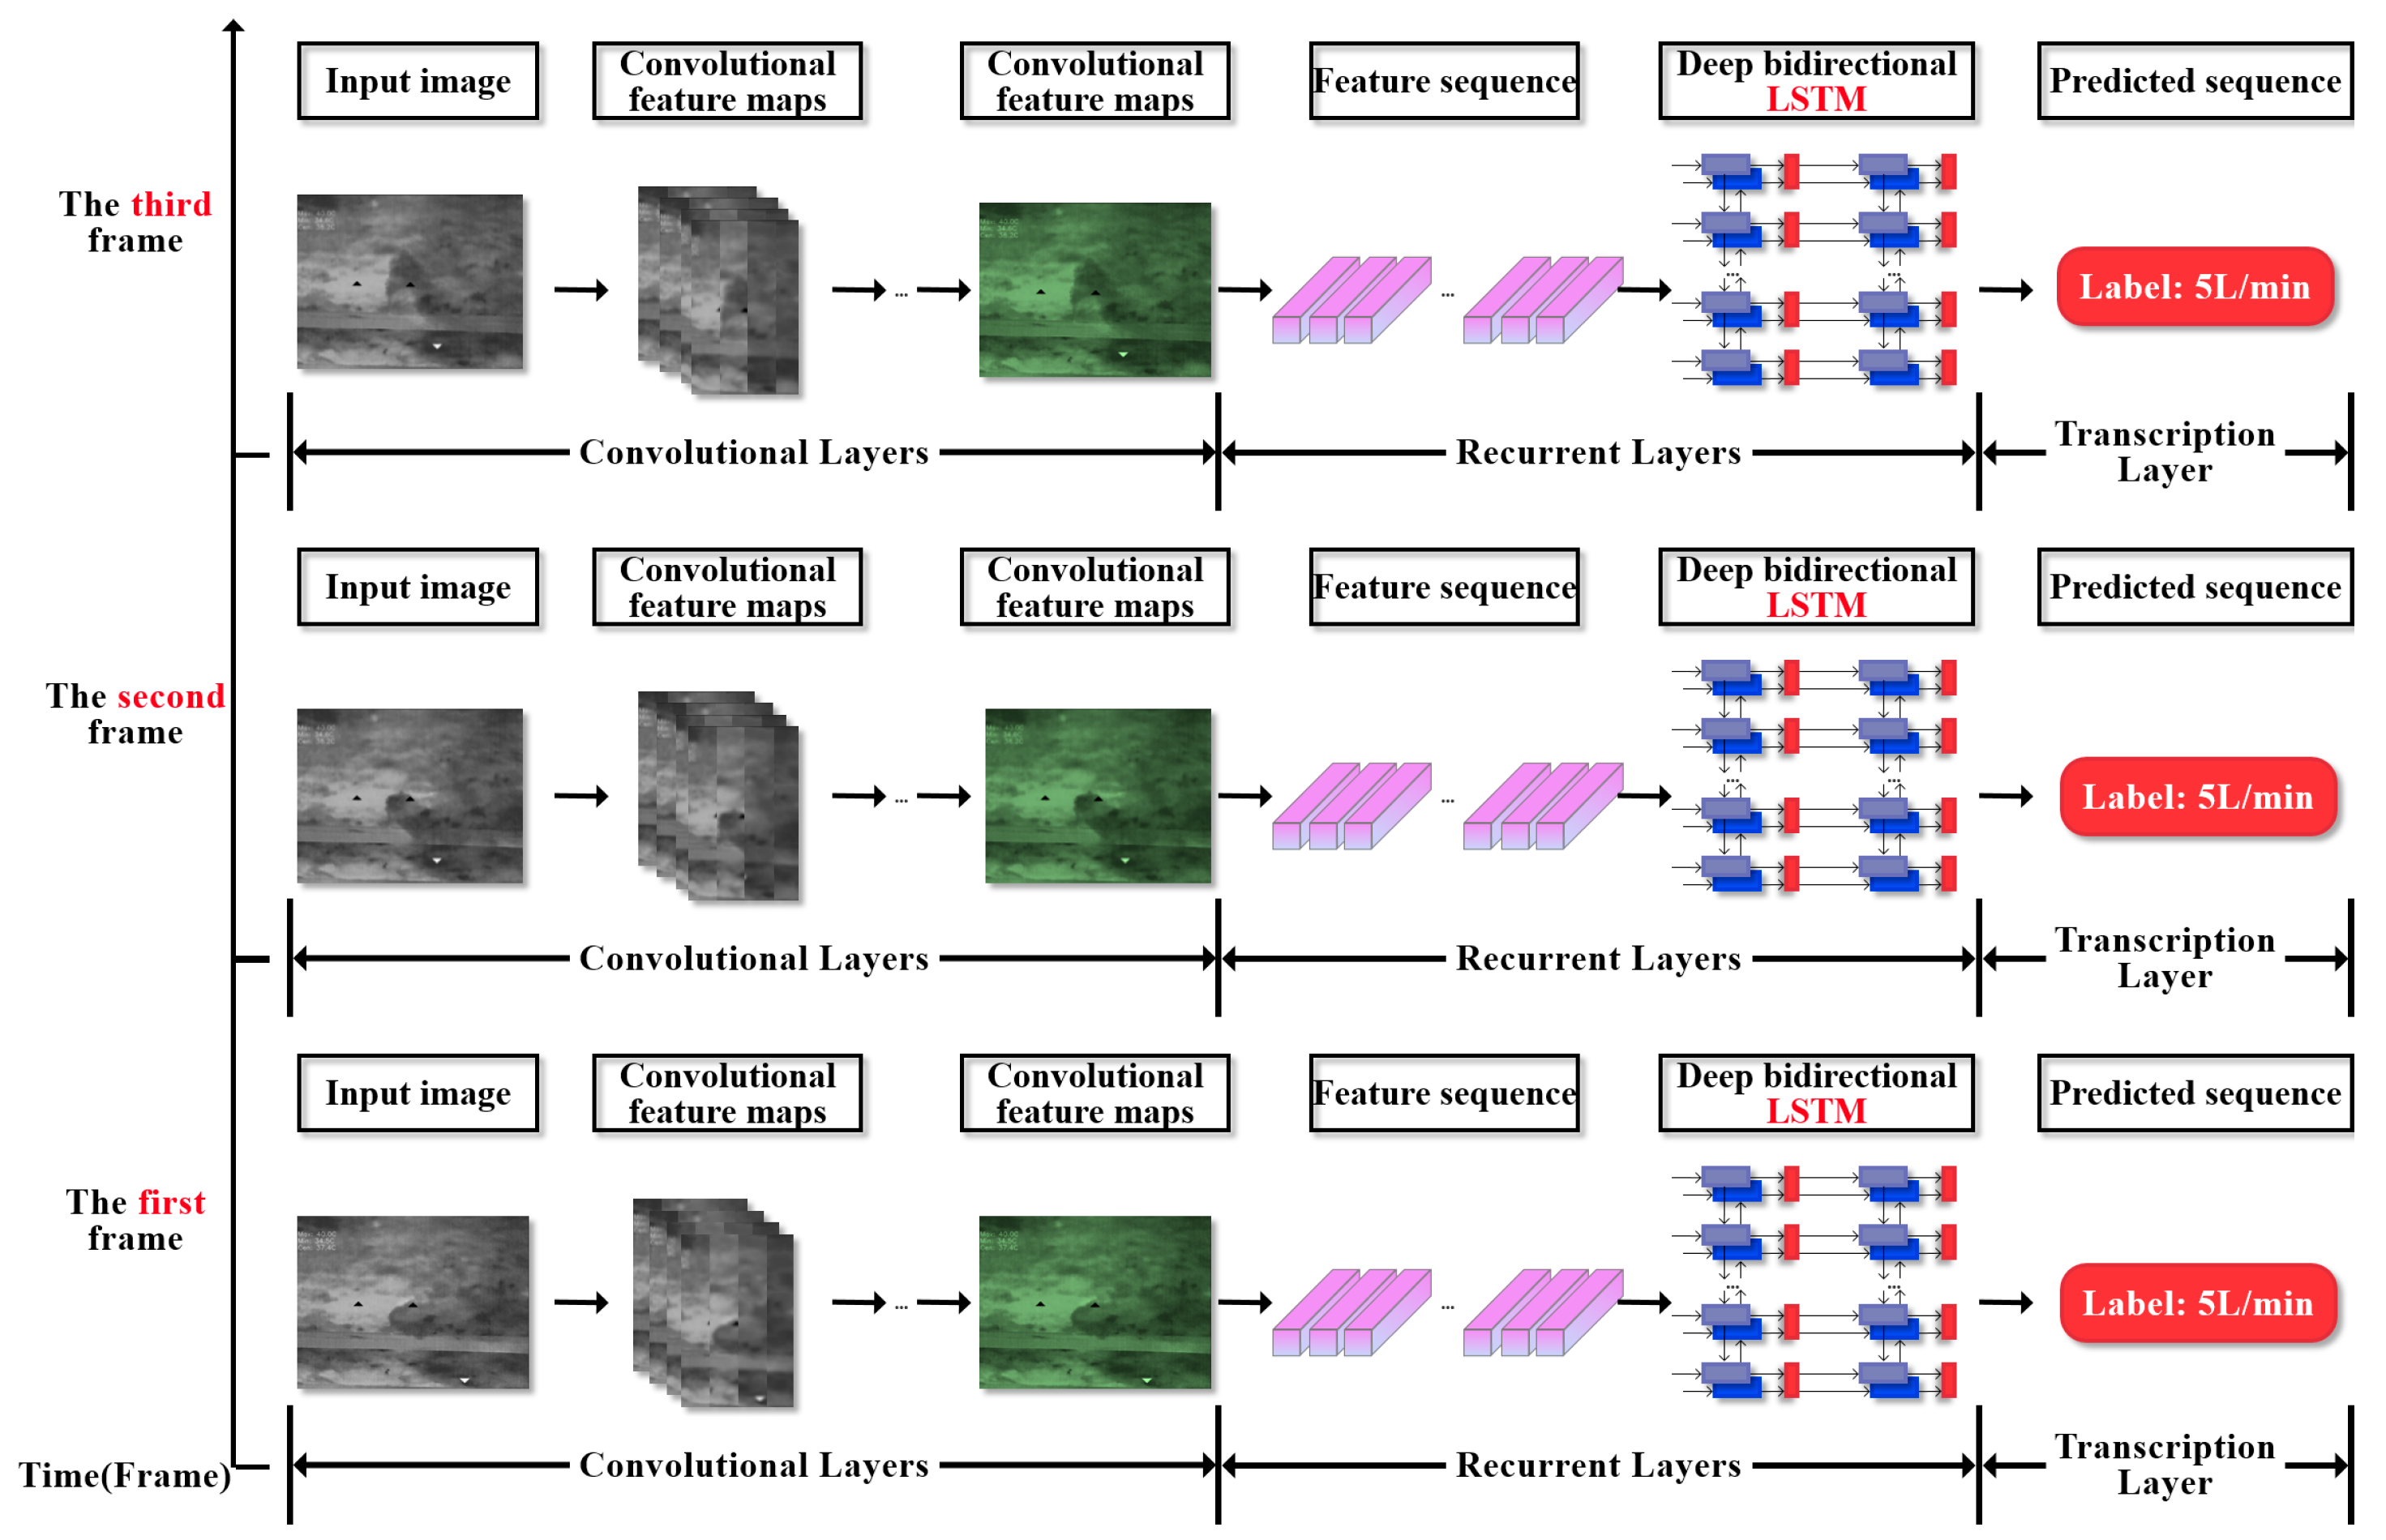
The CRNN architecture integrates spatial feature extraction and temporal sequence modeling for video-based time series grading, as shown in
Figure 4. The entire network architecture is analyzed as follows: the network uses a CNN to process video clips by frame. Through three layers of convolution, the number of channels increases from 32 to 48 and then to 64, and then single-frame spatial features are extracted. Each layer is followed by maximum pooling to compress the spatial dimension. The feature sequence is modeled with temporal dependencies through a bidirectional LSTM, with a total of 256 units. Finally, the classification is completed by aggregating the time step output through a fully connected layer.
4. Experimental Design and Data Collection
4.1. Simulation Experiments for Gas Leakage Detection in UUT
4.1.1. Analysis of Gas Leakage Data Characteristics of UUTs
A UUT is a confined space. For the leakage and diffusion of gas in a confined space, the gas at the leak hole is first sprayed to the inner edge of the top of the UUT in a high-speed jet and gathers in large quantities over a short time, resulting in a high gas concentration around the leak hole. However, the gas diffusion needs to reach a certain concentration before the sensor alarm is triggered. Then, a large gas leakage is an established fact, and the degree of danger in the UUT increases. This is the disadvantage of a sensor. However, this paper relies on a camera to detect gas leaks in real time. It only needs to observe the gas column sprayed from the leak point to identify the occurrence of the leak. Therefore, it is only necessary to focus on the leak point without considering gas diffusion and environmental conditions. However, when the leaking gas is colorless, this process is difficult to observe, so it is necessary to use an infrared gas imager to monitor it.
4.1.2. Overall Experimental Process Design
With the development of thermal imaging technology, gas leakage infrared imaging detection technology has been widely used in the industry. This study uses an infrared gas imager produced by a Chinese manufacturer. Its main product parameters are shown in
Table 1. Natural gas is composed of a variety of mixed gases, of which methane accounts for the vast majority, and there are also small amounts of ethane, propane, and butane. When it leaks, infrared rays with a wavelength of 3.3–3.4 μm will be strongly absorbed by natural gas. By setting a filter at the corresponding wavelength, the change can be detected by an infrared imaging gas detector.
Figure 5 shows the experimental platform that was built. The gas-leakage detection experimental device is mainly composed of gas, pipelines, and detection models. Natural gas is used as the gas source. A brass pressure-reducing valve controls the gas flow rate. A hose is used to connect the natural gas, the brass pressure-reducing valve, and the seamless-steel pipe with a diameter of 40 mm, and a hole is punched in the middle of the seamless-steel pipe to simulate the gas leakage position in the real scene. After opening the valve of the natural-gas storage tank, the gas flow of the entire system can be quantitatively controlled by the brass pressure-reducing valve. Brass has excellent hot-workability and cutting performance. The brass pressure-reducing valve can control the flow of the medium, thereby achieving control of the gas leakage rate. It is worth noting that the experimental environment simulates the temperature, humidity, air pressure, and other conditions in the UUT. Since the recognition and classification of leaks by the CRNN depends on the state of the gas column ejected from the leak port, in order to ensure that the imaging information has a certain generalization performance and fully considers the influence of the diffused gas, a 3 min video was recorded each time as the training data of the model, which can fully include the state of the diffused gas in the UUT. However, the detection basis of the CRNN is still based on the state of the gas column ejected from the leak. In addition, each time the gas flow rate is changed, it is necessary to wait for 15 s until the gas column is stable before starting to record.
4.2. Data Collection
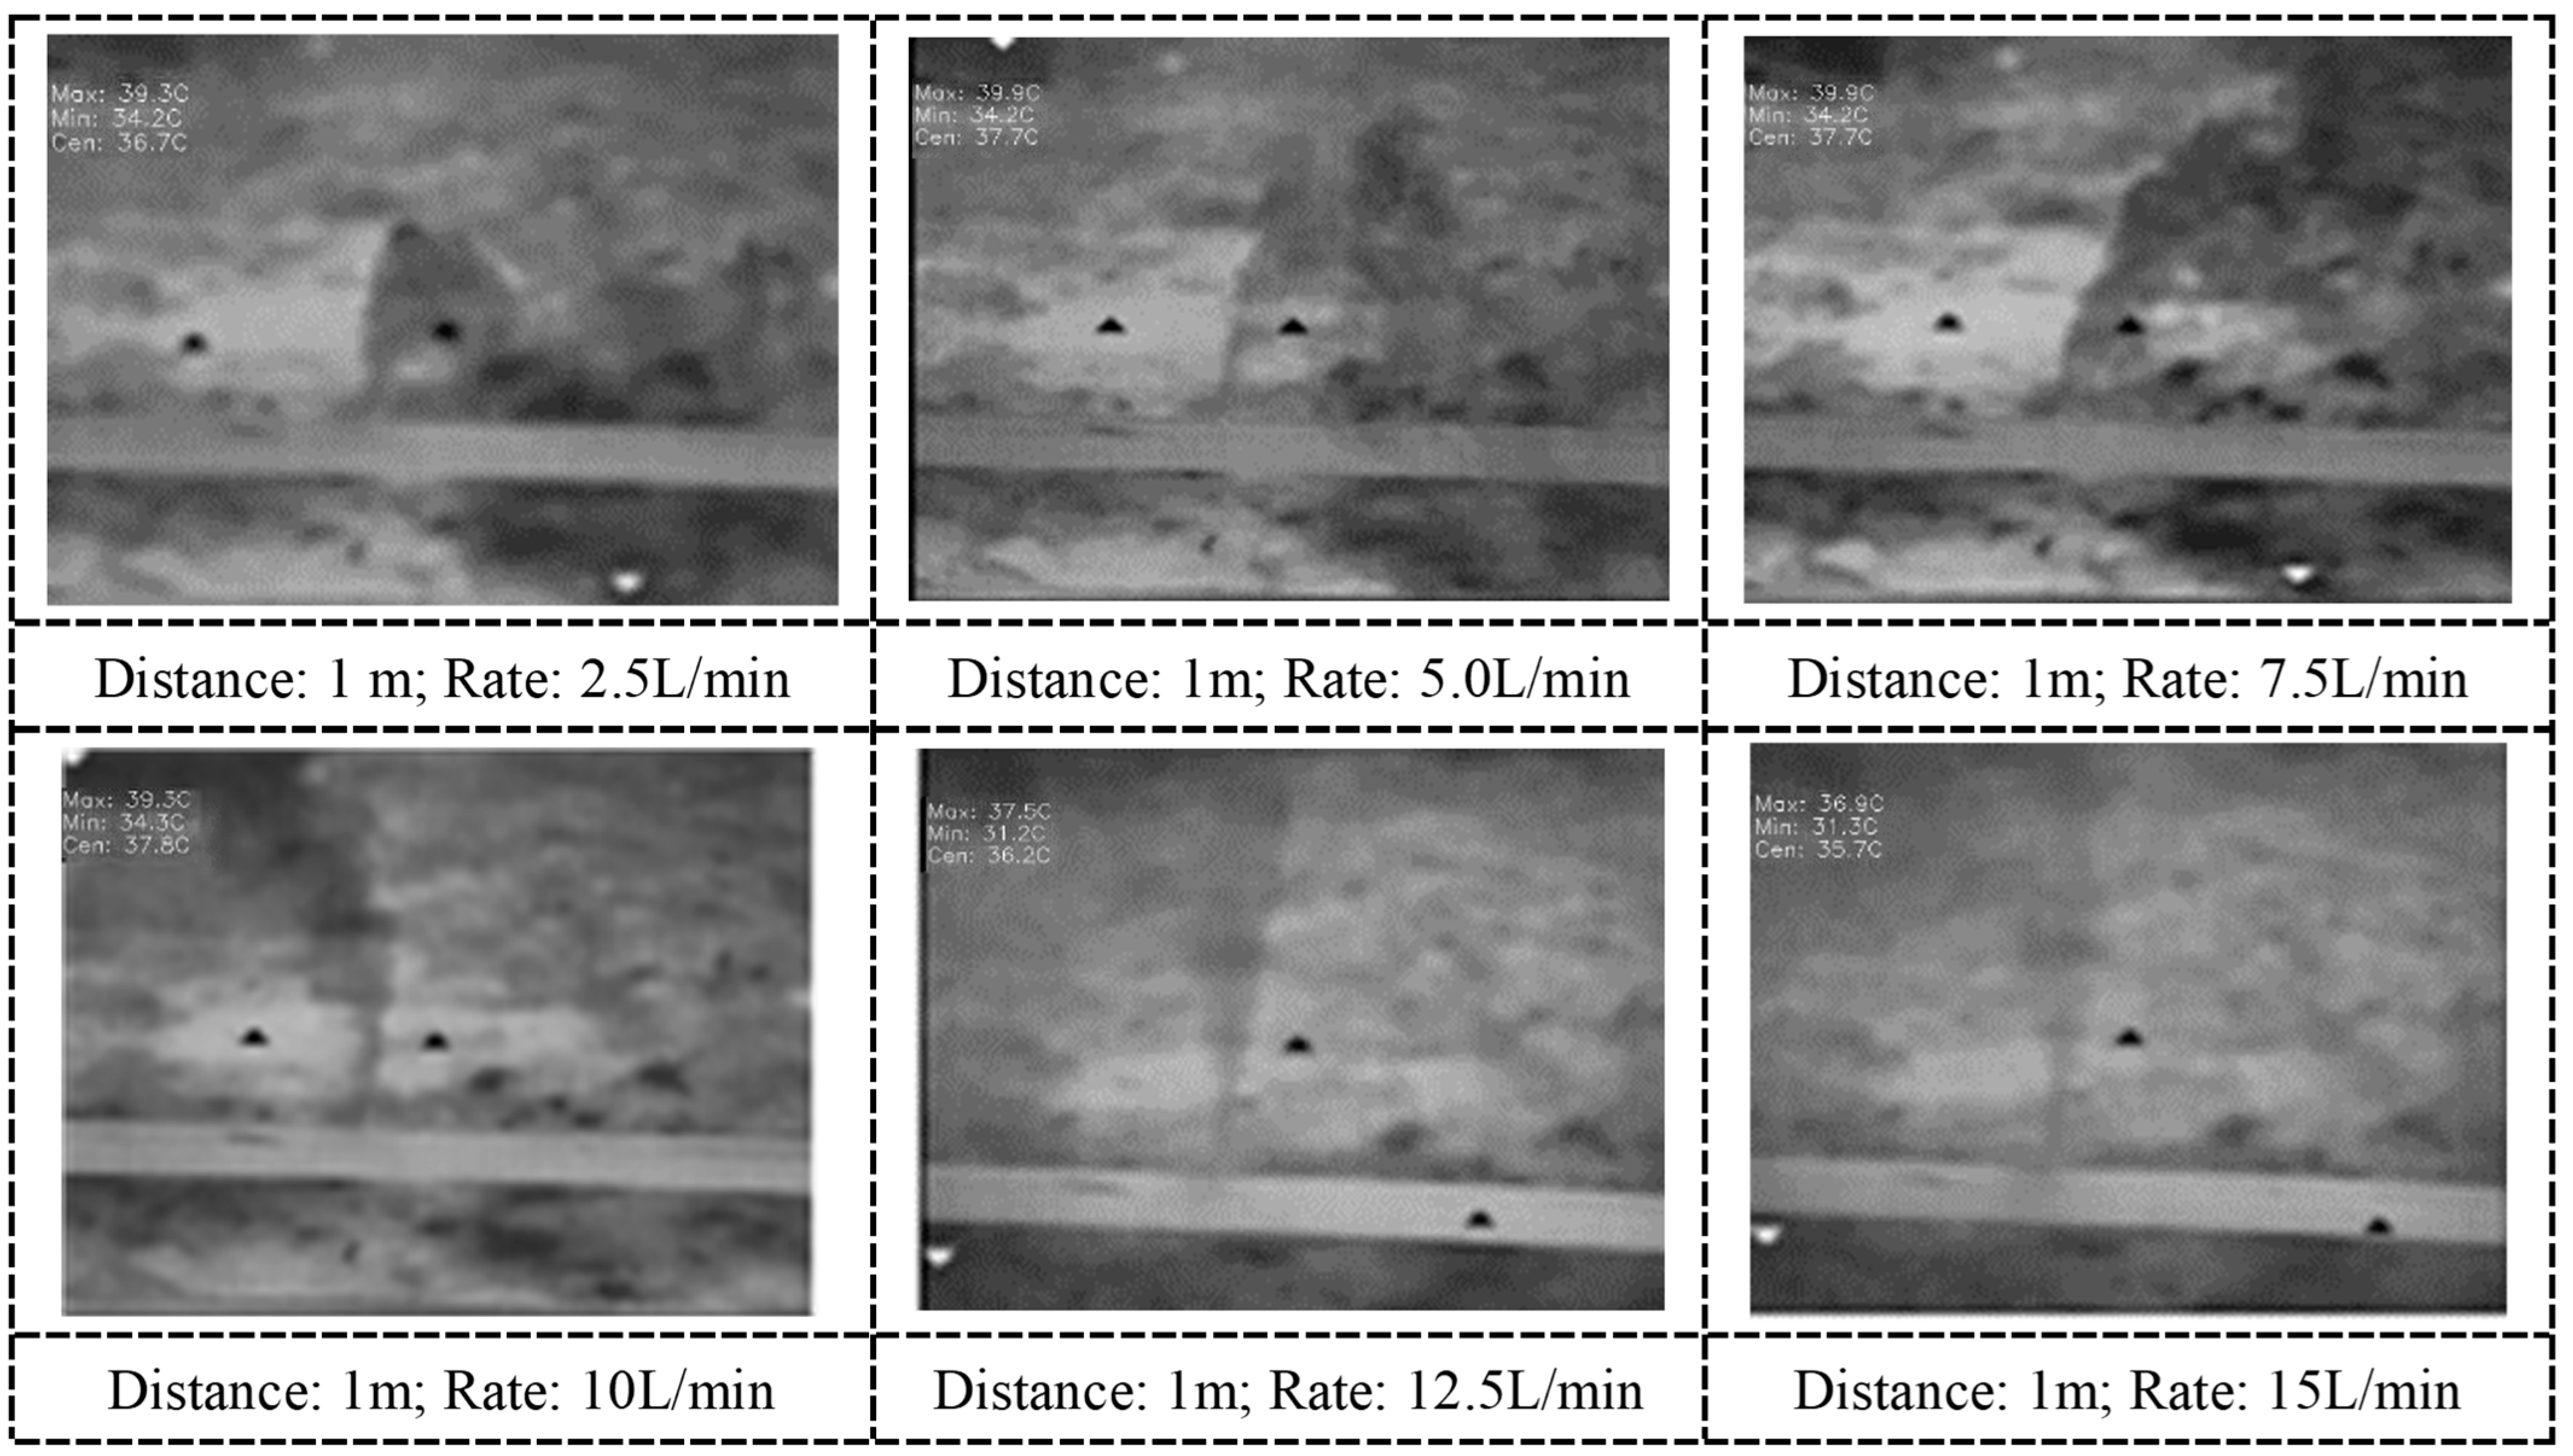
After building the experimental device, the infrared imager is used to collect video images of the gas at different leakage rates. The specific experimental steps are as follows: ① Set the leakage rate. Combined with the range of the pressure-reducing valve and the volume of natural gas that can be used, 6 levels of leakage rates were designed, as follows: 2.5 L/min, 5.0 L/min, 7.5 L/min, 10 L/min, 12.5 L/min, and 15 L/min, which correspond to levels 1 to 6, respectively. ② Set up the infrared imager. Combined with the shooting distance of the infrared imager and the limitations of the experimental site, the shooting distance of this experiment is designed to be 1.5 m. The setting height is 2.2 m. ③ Start recording. Switch the infrared imager to video mode and center the leakage point in the picture. ④ Repeat the experimental process. According to the leakage rate, shooting distance, and shooting angle, the shooting point is adjusted continuously, and the experimental process is repeated to obtain leakage data under various working conditions.
To obtain more realistic experimental data, the data collection of this experiment is carried out in a natural gas plant in Nanjing, China. The experimental device is set up according to the schematic diagram of the experimental device shown in
Figure 5. First, holes were drilled on the seamless steel pipe using professional drilling equipment to simulate the gas leakage points in real situations. Then, the liquefied gas tank and the seamless steel pipe were connected with a hose. The connection needed to be sealed and fixed. A gas leakage infrared detector was set up at the pre-designed point, and the tripod height and detector angle were adjusted. The liquefied gas switch was turned on, and the gas flow rate was controlled by the brass pressure-reducing valve.
Figure 6 shows the state of the leaking gas at different leakage rates taken at a distance of 1 m, focusing on the shape of the gas column.
4.3. Video Super-Resolution Reconstruction and Evaluation Based on BasicVSR++
In real-world super-resolution tasks, it is necessary to use non-reference image evaluation indicators. This evaluation method does not require any original reference image information and only uses the characteristics of the image itself for quality assessment. Commonly used indicators include NIQE (Natural Image Quality Evaluator) [
31] and BRISQUE (Blind/Reference less Image Spatial Quality Evaluator) [
32] indicators. The smaller the results of the two indicators, the higher the image quality.
4.3.1. NIQE Indicator
NIQE uses the MVG (multivariate Gaussian) model to fit a set of quality-aware features that can be obtained through a simple but highly regularized NSS (Natural Scene Statistics) model. The distance between the output obtained from the test image and the output obtained from the natural image corpus is then positioned as the NIQE indicator. The calculation equation is as follows:
where
v and
represent the mean and covariance matrix of the MVG model obtained by standard maximum likelihood estimation. The smaller the NIQE index, the higher the image quality. The NIQE value of an image can be quickly calculated using the Image Processing Toolbox toolkit in MATLAB 2021b.
4.3.2. BRISQUE Index
Natural images collected by imaging equipment have certain statistical characteristics, and image distortion will change these statistical characteristics. Therefore, some statistical characteristics of images can be used for image quality evaluation. BRISQUE is a method for no-reference image quality assessment using artificial features. The algorithm finds that the local normalized brightness coefficient extracted from the image tends to a normal Gaussian distribution, so distortion will destroy this tendency. The BRISQUE value of the image can be quickly calculated with the help of the Image Processing Toolbox toolkit in MATLAB.
4.3.3. VSR Reconstruction Effect and Evaluation
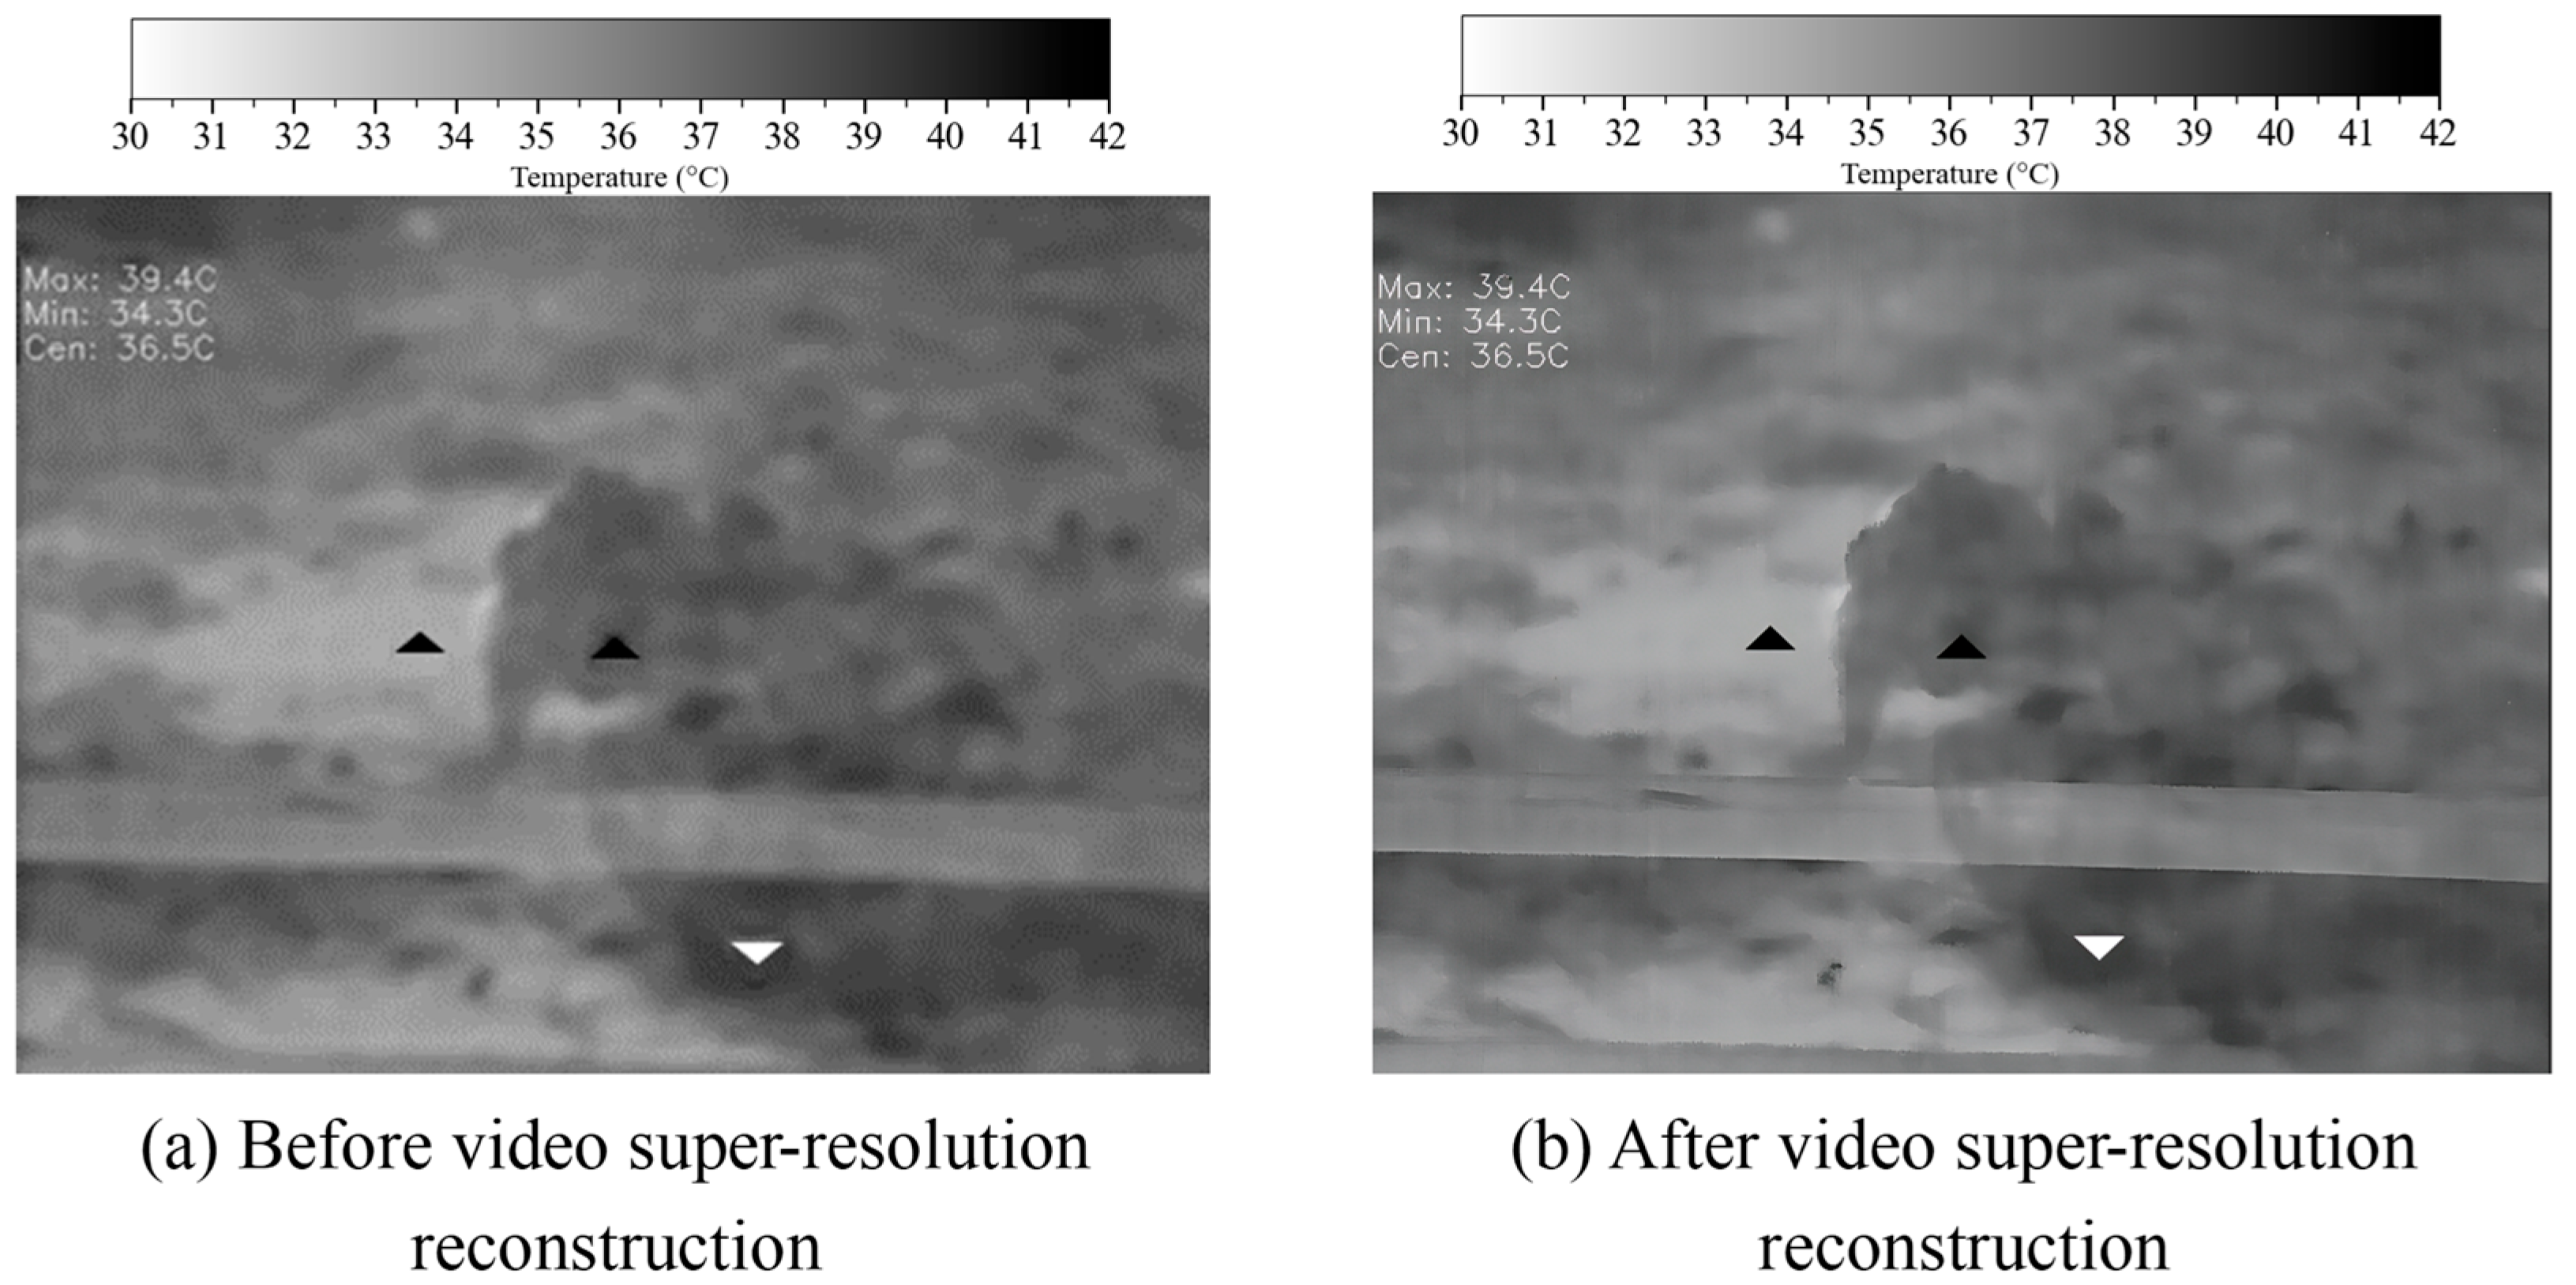
The real-world VSR reconstruction results of the UUT gas leakage event based on the BasicVSR++ model is shown in
Figure 7. The reconstructed gas-leakage feather image is clearer, the edge details in the low-resolution image are restored, the noise is effectively reduced, and the information quality of the image is improved. In addition, NIQE and BRISQUE were used to further quantify the evaluation algorithm results. Due to the limited computing resources, only the first frame, middle frame, and last frame of each video sequence were extracted for indicator evaluation. The NIQE of the original image was 7.4006, and the NIQE after the output of the BasicVSR++ was 3.0021, which is a decrease of 4.3985 points. Similarly, the BRISQUE of the original image was 22.3987, and the BRISQUE after the output of the BasicVSR++ was 18.2362, which is a decrease of 4.1625 points. The above results prove that the VSR reconstruction based on the BasicVSR++ is successful, which provides a basis for subsequent video grading and recognition.
4.4. Video Data Segmentation and Data Enhancement Based on Sliding Windows
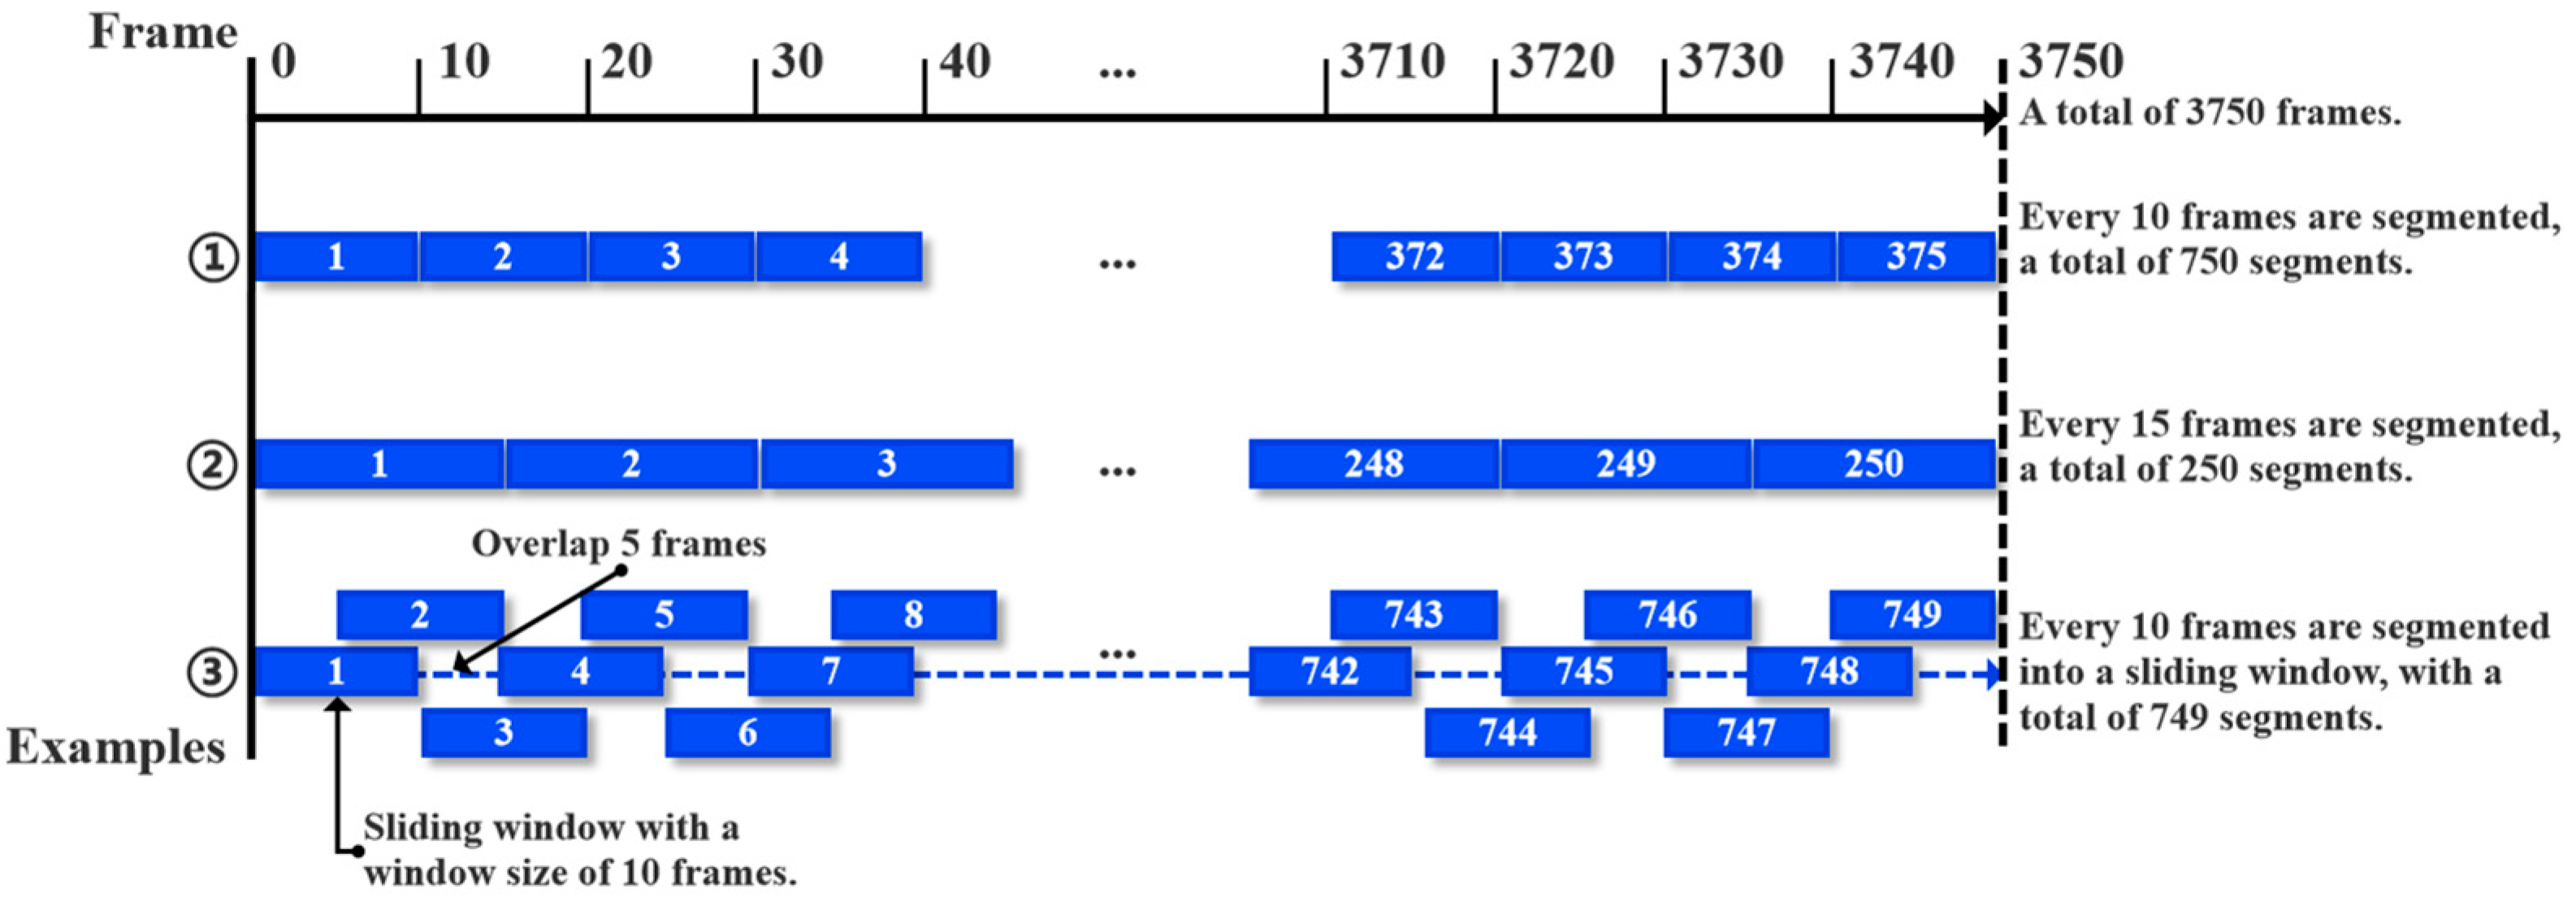
To maintain a consistent number of videos across various frame rates, this study employs a sliding window algorithm for video data segmentation, as illustrated in
Figure 8. A dataset of 3750 frames can produce 750 videos of 10 frames each (①). Without the sliding window, the dataset would only yield 250 videos of 15 frames each (②), reducing the video count by half, which hinders algorithm performance assessment. Consequently, a sliding window with a 5-frame step size is applied to create a dataset with 10-frame segments, resulting in 749 video segments (③).
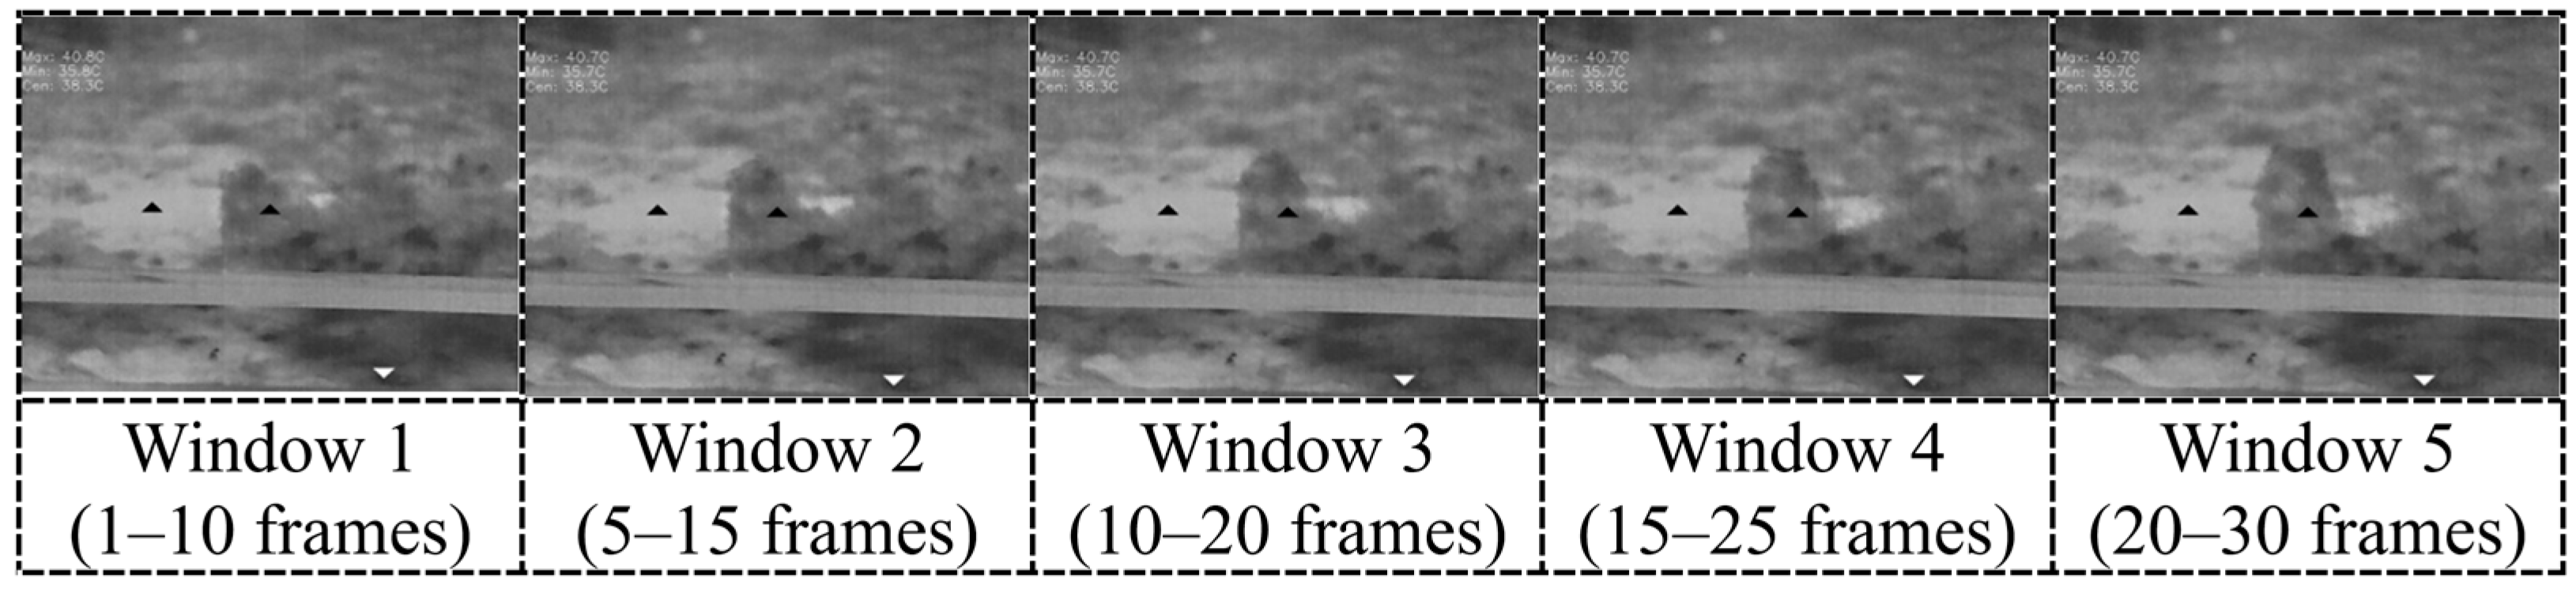
In this experiment, the window size is set as a hyperparameter of the model expression, with a value range of 5 frames, 10 frames, 25 frames, and 50 frames. The step size is 5 frames, and the schematic diagram of the data after segmentation is shown in
Figure 9. The initial window is set to 5 frames (about 0.2 s, the video has a frame rate of 30 fps) to capture the minimum effective time unit of the transient response during the leakage process. The step size is set to 5 frames to reduce redundant calculations while retaining time continuity, thereby achieving the optimal trade-off between efficiency and accuracy. When switching the leakage flow rate, it is necessary to remove the first and last 15 s of each video in order to improve the imaging accuracy of the picture.
Six videos are shot for the six experimental levels set, and each video contained 3750 video frames after processing. To improve the training effect, enhance the robustness of the model, and achieve the purpose of expanding the dataset, data enhancement operations are required. Unlike traditional image detection, video detection needs to consider the relationship between different video frames, so different data enhancement methods need to be carried out in stages. After all videos are super-resolution reconstructed, each video is rotated 45 degrees as a prerequisite for later video enhancement. Similarly, the video after super-resolution reconstruction is mirrored, which includes horizontal mirroring and vertical mirroring. The super-resolution reconstructed video, the rotated video, and the mirrored video are used as three types of data sources for frame extraction, and the extracted video frames are subjected to another data enhancement operations, such as changing brightness, adding Gaussian noise, and adding color block occlusion. Unlike the low-definition noise that comes with the original data, Gaussian noise is a noise pixel point that conforms to the Gaussian distribution and does not interfere with the high-precision reproduction of the edge and contour of the target by super-resolution reconstruction. It is worth noting that only the square black blocks are added to the image for image occlusion. The black triangles and white triangles in the figure are the system graphics when the monitoring instrument is calibrated. Therefore, the triangular blocks exist in the original image data, but they are not objects added by data enhancement.
Figure 10 shows the effect of data enhancement.
Finally, a total of 53,676 video frames are obtained, with the ratio of training set, validation set, and test set being 7:2:1, respectively. In addition,
Table 2 shows the amount of data on the different leakage rate levels contained in different video frames after sliding window processing. From the table content, there are more than 2000 video frames corresponding to each leakage rate. At the same time, the data are enhanced to make the training more challenging. The use of a large amount of data for the training helps to enhance the robustness of the model and improve the training effect.
5. Model Training and Result Discussion
The computer hardware and software configuration used in this study was the following: CPU—Intel (R) Core (TM) i7-10700K CPU @ 3.80 GHZ; GPU—NVIDIA GeForce RTX 4070 Ti SUPER; and operating system—Windows 10. The entire DL code in this article was compiled using Python 3.8, torch—1.13.1+cu117. After testing, for the final model training process, the batch size was set to 32, the Adam [
33] optimizer was used, the learning rate was set to 1 × 10
−4, and the cosine annealing strategy was used. The above settings ensured the efficiency and stability of the training. The weight decay parameter was set to 0.1 to effectively prevent the model from overfitting. The training was performed for 10 epochs, and the model showed a stable convergence effect after the 1200th iteration.
5.1. Performance Evaluation Indicators
To better evaluate the detection capability of the developed model, this study used multiple indicators for evaluation. Among them, accuracy was the most used indicator in the classification problems, which was usually used to evaluate the overall performance of the model. Its calculation equation is shown as follows:
However, to better evaluate the advantages of the model, precision (
P) and recall (
R) were used, which are also common typical evaluation indicators for neural network models. The calculation equations are shown in Equations (15) and (16), where
P reflects the detection performance of the model, expressed as the ratio of the number of correctly detected objects to the total number of detected objects, and
R reflects the recall performance of the model, expressed as the ratio of the number of correctly detected objects to the total number of objects detected by the model [
34]. However, there is a certain complementarity between precision and recall, that is, the recall rate of a model with high precision will decrease to a certain extent and vice versa. For this reason, researchers often consider the F1 score to comprehensively weigh
P and
R, which can effectively avoid the short board effect and is mathematically called the harmonic mean. This study uses the F1 score as an evaluation indicator to evaluate the training effect of the model, as shown in Equation (17).
However, in order to better evaluate the advantages of the model, the evaluation indicators are often not limited to the traditional accuracy and F1 indicators. In the field of object detection, average precision (AP) and mean average accuracy (mAP) are also the evaluation indicators of different model training effects. Equations (18) and (19) are mathematical expressions of AP and mAP, respectively. The AP represents the area under the precision–recall curve for each category, while the mAP is the average AP for all classes.
where
P and
R represent the precision and recall, and
N is the number of all of the categories in this study.
5.2. Experimental Results
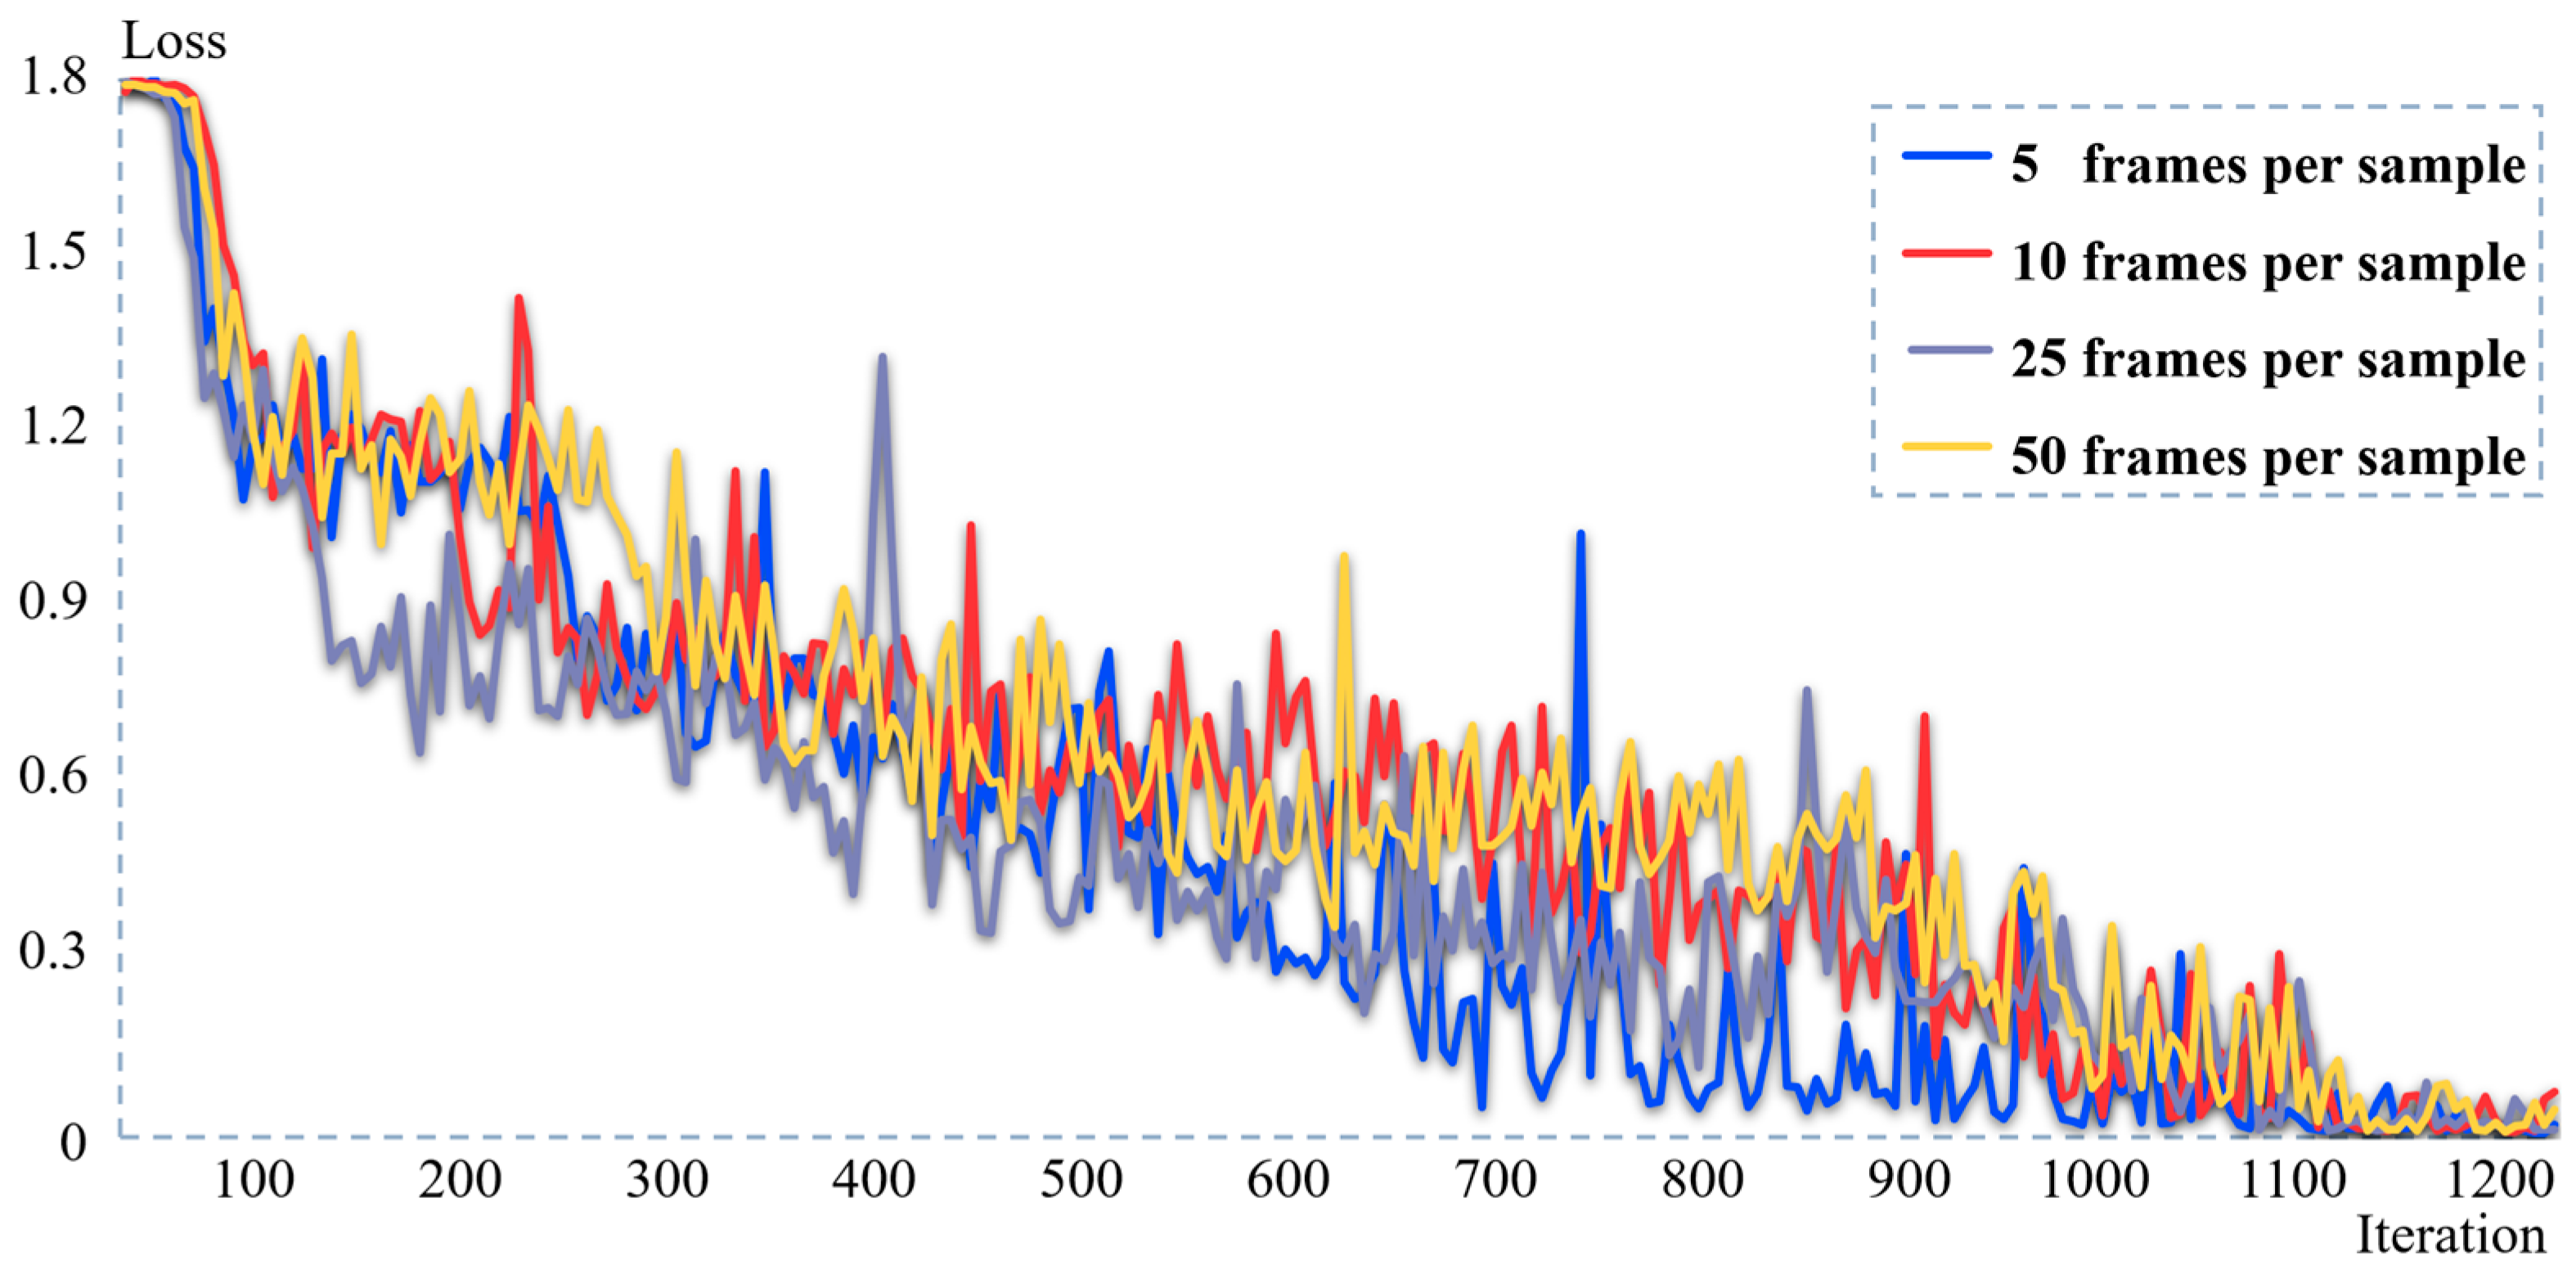
This experiment trained the CRNN model on the four video frame numbers of 5, 10, 25, and 50 frames, as well as evaluated the effect on the test set training loss curves, as shown in
Figure 11. In the initial training, the loss of the model in the four experiments showed a rapid downward trend. After about 900 iterations, the model gradually began to converge and showed a stable trajectory.
Figure 12 shows the performance evaluation results, where the model performed best when the number of video frames for a single sample was 10. On the validation set, its accuracy, mAP, and F1 score were 98.18%, 99.46%, and 0.9817, respectively; on the test set, the comprehensive effect of the dataset with 10 frames per sample was also excellent, with an accuracy, mAP, and F1 score of 98.52%, 99.34%, and 0.9849.
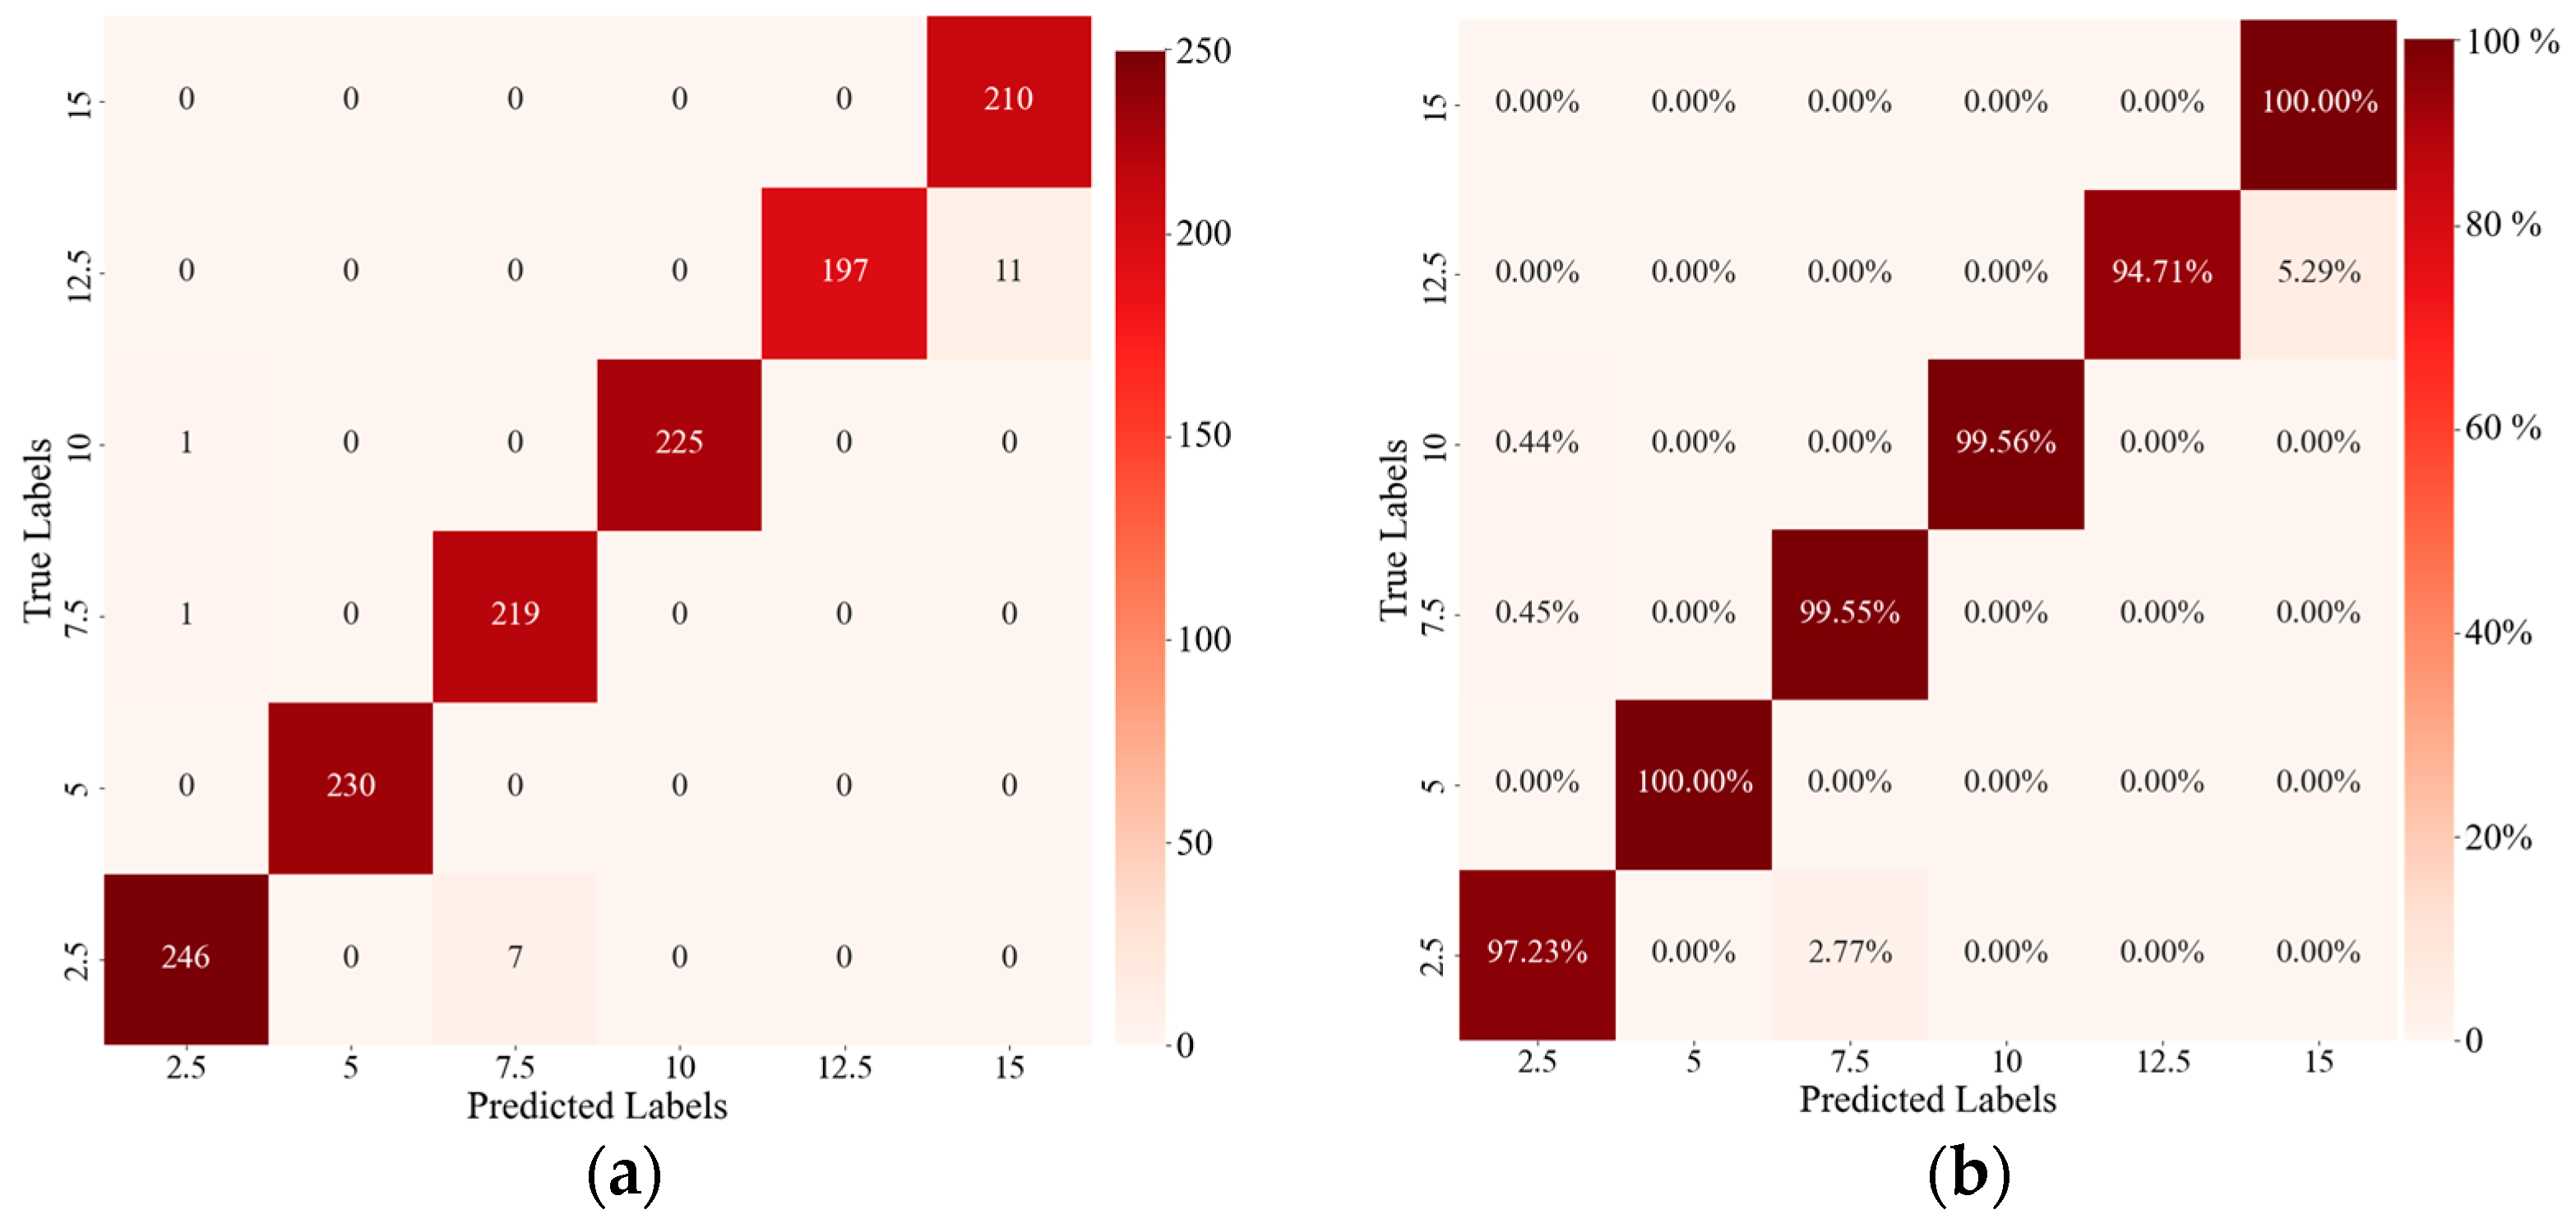
In the supervised learning field of machine learning, classification results and actual measurement results are often compared through confusion matrices. The confusion matrix is a visualization tool that can present the accuracy of the classification results and depict the true positives, true negatives, false positives, and false negatives of each category.
Figure 13 shows the confusion matrix of the dataset of 10 frames per sample on the test set. The test set is automatically extracted from the dataset according to the algorithm. There are more than 200 corresponding test samples for each leakage level.
Figure 13a shows the difference between the predicted results and the actual labels of the various leakage levels. In
Figure 13b, the values are in percentile, and it is determined that the CRNN has a correct rate of more than 90% for each leakage level. The best performance is achieved for leakage levels of 5.0 L/min and 15 L/min, achieving 100% correct recognition. The results prove that the developed method has strong detection capabilities. It can meet the needs of industrial detection.
5.3. Comparative Test of Model Detection Effect Based on Voting Method
To verify the effectiveness of the model, in this section a comparative test was conducted between the CRNN model based on time series data and the traditional CNN based on single-frame images. All video data were collected based on existing cameras at the UUT site, uploaded to the data center through the local area network for BasicVSR++ and sliding window-frame extraction, and finally analyzed. The sliding window hyperparameter of the CRNN model was 10, and it was trained based on the video data; the CNN model was trained based on the image data converted from the same training datasets and tested on the same test datasets. To ensure the fairness of the comparison, each time the CNN was given 10 video frames to measure its detection effect. The traditional CNN model judged each frame of the video data separately, and finally used the voting method to take the category with the highest votes as the leakage level of the video. The accuracy of the CRNN on the test set reached 0.9852, while the performance of the CNN on the test set was only 0.96, which also proves that the developed detection method had a high detection ability. In order to intuitively compare the differences between the two models in dealing with this problem, a set of data was randomly selected for visualization and analysis. As shown in
Figure 14, this set of video had a total of 10 frames, and the leakage level was 2.
The CNN model makes a grading judgment for each frame of the picture, where the first 6 frames are judged as leakage level 1, and the last 4 frames are judged as leakage level 2. According to the voting method, the category with the highest votes is used as the leakage level of the video, so the video is judged to be leakage level 1, which is an incorrect judgment. The CRNN model based on time series information directly judges the video data as leakage level 2, which is a correct judgment. The CRNN model based on a time series can extract trend and periodic features in the image, and it can ignore the influence of the external environment on the image features, bringing higher accuracy and robustness.
6. Discussion
The proposed method for detecting gas leaks uses BasicVSR++ for video super-resolution processing and combines it with the CRNN for time series analysis to achieve high-precision identification and classification of natural gas leaks. This method significantly reduces the reliance on manual inspections and traditional sensor systems, providing a scalable solution for real-time monitoring. However, a key limitation of the current system is that it cannot quickly and accurately locate the specific leak point on the pipeline. Although the system can effectively detect and classify leaks based on the gas column features captured by the infrared camera, the positioning range is limited to the area covered by the camera field of view. Inspectors still need to manually align the detected leak features with the camera field of view to match the specific point of the leak, which may delay emergency repairs and increase operational complexity. This limitation is mainly due to the lack of spatial mapping technology in the current method. Therefore, the system cannot convert the visual detection results into coordinates of the actual three-dimensional world. In addition, for the generalization of this study, since the current UUT is mostly in the form of a rectangular space, the scene built in this experiment is also a closed rectangular space. However, it is difficult to build a full-coverage experimental environment for special structures of UUT or special parts such as corners, so this experiment does not cover these special scenes. Apart from that, the experimental environment fully simulates the various environmental factors in the actual UUT, including humidity, temperature, dust, and light conditions. In the actual UUT, there is also maintenance equipment to maintain the relative stability of the environment in the UUT, which is also guaranteed in the experimental environment. So that, special circumstances where factors such as temperature and dust change due to failure of operation and maintenance equipment are not taken into consideration. In addition, the height and angle of the camera are installed and arranged with reference to the setting requirements under normal circumstances in practice. Despite this, the experimental process of this study may fail or perform poorly in the extreme cases mentioned above. Moreover, since infrared imagers can only capture gases within their parameter range, when other harmful gases in the UUT have wavelengths beyond the range, they may not be detected. However, as natural gas is the most common and widespread harmful gas in civil facilities, its detection is still the most critical.
For the spatial positioning problem, in future work, it is possible to consider incorporating visual ranging technology to improve positioning accuracy by providing relevant depth information and 3D mapping. In addition, spatial mapping can also be considered and multi-camera setups can be utilized within a UUT to further enrich the inspection perspective and improve positioning accuracy. Regarding the generalization of the detection method, future research can further enrich the experimental scenarios and detection equipment to meet the detection needs of special parts, special structures, and other harmful gases in a UUT. In addition, the detection conditions under environmental factors changes caused by failure of operation and maintenance facilities can be tested. These works will further reduce manual intervention and, thus, achieve the goal of fully automated pipeline monitoring within a UUT.
7. Conclusions
A UUT is a new type of urban infrastructure. Existing operation and maintenance systems are highly dependent on patrol personnel and special gas leak detectors. To address these problems, this paper proposes a UUT gas-leakage emergency monitoring method based on VSR and a LSTM-based CRNN to identify natural gas leaks in a UUT and classify the leaks according to the stable gas column sprayed from the leak point. A model training dataset was produced using BasicVSR++, a sliding window, and data enhancement. After the CRNN experiments, it was shown that when the number of video frames for a single dataset was 10, the model performed best. On the validation set, its accuracy, mAP, and F1 score were 98.18%, 99.46%, and 0.9817, respectively; on the test set, the comprehensive performance of the dataset with 10 frames was also the best, with an accuracy, mAP, and F1 score of 98.52%, 99.34%, and 0.9849, respectively. In addition, the accuracy of the CRNN algorithm improved by two percentage points when compared with the traditional CNN algorithm, which verified the effectiveness of the time series analysis. The UUT gas leakage emergency monitoring method proposed in this paper can well meet the needs of industrial detection and can accurately detect the leakage of pipelines in UUTs.
While this study achieved gas leak detection in a UUT, its scope remains confined to leakage identification rather than comprehensive defect monitoring. Future research should expand the detection range to cover more defect types. Apart from that, current localization capabilities are limited to camera positioning, requiring manual alignment of leak features with camera perspectives for approximate spatial estimation. In the future, the inspection module can be integrated with visual ranging technology to improve defect location accuracy. On the other hand, the complexity of the experimental environment and conditions can be increased to test the detection effect of the model under special situations, such as changes in environmental conditions caused by UUT structures, corners, and failures of operation and maintenance equipment. These works lay a solid foundation for UUT monitoring, which is expected to reduce reliance on manual inspection and improve safety management.
Author Contributions
Conceptualization, Z.J., C.Z., Z.X., and W.S.; Data curation, Z.J. and W.S.; Formal analysis, Z.J.; Funding acquisition, Z.X.; Investigation, Z.J., C.Z., and W.S.; Methodology, Z.J., C.Z., and Z.X.; Project administration, Z.X.; Resources, Z.J. and Z.X.; Software, Z.J., C.Z., and W.S.; Supervision, Z.X.; Validation, Z.J.; Visualization, Z.X.; Writing—original draft, Z.J.; Writing—review & editing, Z.X. All authors have read and agreed to the published version of the manuscript.
Funding
This research was funded by the National Key R&D Program of China (grant no. 2021YFF0500900) and the National Natural Science Foundation of China (grant no. 72071043).
Institutional Review Board Statement
Not applicable.
Informed Consent Statement
Not applicable.
Data Availability Statement
Some or all data, models, or code that support the findings of this study are available from the corresponding author upon reasonable request.
Conflicts of Interest
The authors declare that they have no known competing financial interests or personal relationships that could have appeared to influence the work reported in this paper.
References
- Canto-Perello, J.; Curiel-Esparza, J. An analysis of utility tunnel viability in urban areas. Civ. Eng. Environ. Syst. 2006, 23, 11–19. [Google Scholar] [CrossRef]
- Jang, Y.; Jung, S. Quantitative risk assessment for gas-explosion at buried common utility tunnel. J. Korean Inst. Gas 2016, 20, 89–95. [Google Scholar] [CrossRef]
- Han, B.J.; Jiang, Y.S.; Wang, Z.; Gong, D.; Jiang, H.; Jiang, P.-L.; Li, Z. Analysis of the risk path of the pipeline corridor based on system dynamics. Shock Vib. 2021, 2021, 5529642. [Google Scholar] [CrossRef]
- Chan, K.C.K.; Zhou, S.; Xu, X.; Loy, C.C. Basicvsr++: Improving video super-resolution with enhanced propagation and alignment. In Proceedings of the IEEE/CVF Conference on Computer Vision and Pattern Recognition, New Orleans, LA, USA, 18–24 June 2022; pp. 5972–5981. [Google Scholar] [CrossRef]
- Yu, S.-S.; Chu, S.-W.; Chan, Y.-K.; Wang, C.-M. Share price trend prediction using CRNN with LSTM structure. In Proceedings of the 2018 International Symposium on Computer, Consumer and Control (IS3C), Taichung, China, 6–8 December 2018. [Google Scholar] [CrossRef]
- Zhou, K.; Li, F.; Cai, H.; Jing, Y.; Zhuang, J.; Li, M.; Xing, Z. Estimation of the natural gas leakage source with different monitoring sensor networks in an underground utility Tunnel: From the perspectives of energy security. Energy Build. 2022, 254, 111645. [Google Scholar] [CrossRef]
- Wu, J.; Cai, J.; Liu, Z.; Yuan, S.; Bai, Y.; Zhou, R. BI-IEnKF coupling model for effective source term estimation of natural gas leakage in urban utility tunnels. Tunn. Undergr. Space Technol. 2023, 136, 105080. [Google Scholar] [CrossRef]
- Wang, R.; Zhang, Z.; Gong, D. Simulation study on gas leakage law and early warning in a utility tunnel. Sustainability 2023, 15, 15375. [Google Scholar] [CrossRef]
- Zhao, J.; Bai, Y.; Li, J.; Cu, W.; Zhou, W.; Zhang, Y.; Wei, J. A leakage detection method for hydrogen-blended natural gas pipelines in utility tunnels based on multi-task LSTM and CFD simulation. Int. J. Hydrogen Energy 2025, 97, 1335–1347. [Google Scholar] [CrossRef]
- Chen, M.; Cao, G.; Yang, J. Remote System Design of Urban Underground Comprehensive Pipe Gallery Inspection. In Proceedings of the 2023 IEEE 6th Eurasian Conference on Educational Innovation (ECEI), Singapore, 3–5 February 2023; pp. 230–233. [Google Scholar] [CrossRef]
- Ning, F.; Cheng, Z.; Meng, D.; Duan, S.; Wei, J. Enhanced spectrum convolutional neural architecture: An intelligent leak detection method for gas pipeline. Process Saf. Environ. Prot. 2021, 146, 726–735. [Google Scholar] [CrossRef]
- Wang, J.; Tchapmi, L.P.; Ravikumar, A.P.; McGuire, M.; Bell, C.S.; Zimmerle, D.; Savarese, S.; Brandt, A.R. Machine vision for natural gas methane emissions detection using an infrared camera. Appl. Energy 2020, 257, 113998. [Google Scholar] [CrossRef]
- Narkhede, P.; Walambe, R.; Mandaokar, S.; Chandel, P.; Kotecha, K.; Ghinea, G. Gas detection and identification using multimodal artificial intelligence based sensor fusion. Appl. Syst. Innov. 2021, 4, 3. [Google Scholar] [CrossRef]
- Wang, J.; Ji, J.; Ravikumar, A.P.; Savarese, S.; Brandt, A.R. VideoGasNet: Deep learning for natural gas methane leak classification using an infrared camera. Energy 2022, 238, 121516. [Google Scholar] [CrossRef]
- Zhang, J.; Lan, X.; Wang, S.; Liu, W. EP-YOLO: A Pipeline Leak Detection Algorithm Based on Improved YOLOv7. IEEE Access 2024, 12, 198132–198141. [Google Scholar] [CrossRef]
- Chen, K.; Li, H.; Li, C.; Zhao, X.; Wu, S.; Duan, Y.; Wang, J. An automatic defect detection system for petrochemical pipeline based on cycle-gan and yolo v5. Sensors 2022, 22, 7907. [Google Scholar] [CrossRef] [PubMed]
- Liu, H.; Ruan, Z.; Zhao, P.; Dong, C.; Shang, F.; Liu, Y.; Yang, L.; Timofte, R. Video super-resolution based on deep learning: A comprehensive survey. Artif. Intell. Rev. 2022, 55, 5981–6035. [Google Scholar] [CrossRef]
- Jo, Y.; Oh, S.W.; Kang, J.; Kim, S.J. Deep video super-resolution network using dynamic up sampling filters without explicit motion compensation. In Proceedings of the IEEE Conference on Computer Vision and Pattern Recognition, Salt Lake City, UT, USA, 18–22 June 2018; pp. 3224–3232. [Google Scholar] [CrossRef]
- Chan, K.C.; Wang, X.; Yu, K.; Dong, C.; Loy, C.C. Basicvsr: The search for essential components in video super-resolution and beyond. In Proceedings of the IEEE/CVF Conference on Computer Vision and Pattern Recognition, Nashville, TN, USA, 20–25 June 2021; pp. 4947–4956. [Google Scholar] [CrossRef]
- Ren, S.; Guo, H.; Guo, K. Towards efficient medical video super-resolution based on deep back-projection networks. In Proceedings of the 2019 International Conference on Internet of Things (iThings) and IEEE Green Computing and Communications (GreenCom) and IEEE Cyber, Physical and Social Computing (CPSCom) and IEEE Smart Data (SmartData), Atlanta, GA, USA, 14–17 July 2019; pp. 682–686. [Google Scholar] [CrossRef]
- Lin, J.Y.; Chang, Y.C.; Hsu, W.H. Efficient and phase-aware video super-resolution for cardiac MRI. In International Conference on Medical Image Computing and Computer Assisted Intervention, Proceedings of MICCAI 2020: 23rd International Conference, Lima, Peru, 4–8 October 2020; Proceedings, Part IV 23; Springer International Publishing: Berlin/Heidelberg, Germany, 2020; pp. 66–76. [Google Scholar] [CrossRef]
- Jiang, K.; Wang, Z.; Yi, P.; Jiang, J. A progressively enhanced network for video satellite imagery super resolution. IEEE Signal Process. Lett. 2018, 25, 1630–1634. [Google Scholar] [CrossRef]
- Luo, Y.; Zhou, L.; Wang, S.; Wang, Z. Video satellite imagery super resolution via convolutional neural networks. IEEE Geosci. Remote Sens. Lett. 2017, 14, 2398–2402. [Google Scholar] [CrossRef]
- Li, Y.; Tsiminaki, V.; Timofte, R.; Pollefeys, M.; Gool, L.V. 3D appearance super-resolution with deep learning. In Proceedings of the IEEE/CVF Conference on Computer Vision and Pattern Recognition, Long Beach, CA, USA, 15–20 June 2019; pp. 9671–9680. [Google Scholar] [CrossRef]
- Dasari, M.; Bhattacharya, A.; Vargas, S.; Sahu, P.; Balasubramanian, A.; Das, S.R. Streaming 360-degree videos using super-resolution. In Proceedings of the IEEE INFOCOM 2020-IEEE Conference on Computer Communications, Toronto, ON, Canada, 6–9 July 2020; pp. 1977–1986. [Google Scholar] [CrossRef]
- Thung, G.; Jiang, H.A. Torch Library for Action Recognition and Detection Using CNNs and LSTMs; Stanford University: Stanford, CA, USA, 2016; Available online: https://cs231n.stanford.edu/reports/2016/pdfs/221_Report.pdf (accessed on 25 April 2025).
- Tran, D.; Bourdev, L.; Fergus, R.; Torresani, L.; Paluri, M. Learning Spatiotemporal Features With 3D Convolutional Networks. In Proceedings of the IEEE International Conference on Computer Vision, Santiago, Chile, 7–13 December 2015; pp. 4489–4497. [Google Scholar] [CrossRef]
- Carreira, J.; Zisserman, A. Quo vadis, action recognition? A new model and the kinetics dataset. In Proceedings of the IEEE Conference on Computer Vision and Pattern Recognition, Honolulu, HI, USA, 21–26 July 2017; pp. 6299–6308. [Google Scholar] [CrossRef]
- Neimark, D.; Bar, O.; Zohar, M.; Asselmann, D. Video transformer network. In Proceedings of the IEEE/CVF International Conference on Computer Vision, Montreal, QC, Canada, 10–17 October 2021; pp. 3163–3172. [Google Scholar] [CrossRef]
- Charbonnier, P.; Blanc-Feraud, L.; Aubert, G.; Barlaud, M. Two deterministic half-quadratic regularization algorithms for computed imaging. In Proceedings of the 1st International Conference on Image Processing, Austin, TX, USA, 13–16 November 1994; Volume 2, pp. 168–172. [Google Scholar] [CrossRef]
- Mittal, A.; Soundararajan, R.; Bovik, A.C. Making a “completely blind” image quality analyzer. IEEE Signal Process. Lett. 2012, 20, 209–212. [Google Scholar] [CrossRef]
- Mittal, A.; Moorthy, A.K.; Bovik, A.C. No-reference image quality assessment in the spatial domain. IEEE Trans. Image Process. 2012, 21, 4695–4708. [Google Scholar] [CrossRef] [PubMed]
- Kingma, D.P.; Ba, J. Adam: A method for stochastic optimization. arXiv 2014, arXiv:1412.6980. [Google Scholar] [CrossRef]
- Jiang, Z.; Han, Y.; Cheng, Y.; Wang, Z.; Meng, H. An Improved YOLOv8-Dyhead-WiseIoU Model for Positioning and Counting Detection of Grouting Sleeves in a Prefabricated Wall. J. Constr. Eng. Manag. 2025, 151, 04025016. [Google Scholar] [CrossRef]
| Disclaimer/Publisher’s Note: The statements, opinions and data contained in all publications are solely those of the individual author(s) and contributor(s) and not of MDPI and/or the editor(s). MDPI and/or the editor(s) disclaim responsibility for any injury to people or property resulting from any ideas, methods, instructions or products referred to in the content. |
© 2025 by the authors. Licensee MDPI, Basel, Switzerland. This article is an open access article distributed under the terms and conditions of the Creative Commons Attribution (CC BY) license (https://creativecommons.org/licenses/by/4.0/).


