1. Introduction
The versatility and loading precision of ultrahigh-strength tendon rods for civil engineering are making them increasingly important in structural applications governed by durability and resilience criteria. This trend requires updated knowledge concerning structural integrity when service conditions entailing combined mechanical and environmental actions might promote the occurrence of failure by stress corrosion cracking or hydrogen embrittlement [
1,
2,
3,
4,
5].
Despite the relatively simple geometrical configuration of the high-strength steel bars used as tendon rods in modern structures, they are hardly compatible with most of the specimen configurations used in fracture mechanics tests. This complicates the experimental determination of steel bar resistance to hydrogen-assisted cracking, especially when deformation measurements are required on samples exposed to environments able to promote hydrogen uptake. Thus, the classical
, single-edge bending (SEB) specimens and the varieties of compact tension (CT) specimens of the ASTM E1820 [
6] and ASTM E1737 [
7] standards for measuring crack growth resistance by means of the J-integral do not provide the optimal conditions. However, the recently adopted fatigue precracked single-edge notched tension (SENT) specimen by the BS-8571 [
8] standard overcomes this issue. In particular, it has the advantage of not requiring displacement measurements along the load line to determine the strain energy absorbed by the specimen. This feature facilitates the experimental determination of the J-integral [
9,
10,
11,
12,
13] and eases the use of digitalized video extensometry measurement systems [
14,
15]. In addition to this, the standard explicitly considers the possibility of performing tests in liquid media, which makes it a suitable tool for assessing the hydrogen-assisted cracking resistance of the bar steel and its subsequent comparison with the steel under the hydrogen-free condition. Therefore, the BS-8571 standard [
8] practically offers a laboratory method for assessing the effect of combining the mechanical action applied to a SENT specimen with the embrittlement action resulting from the steel’s exposure to a hydrogen-promoting solution. The adopted solution is that prescribed in the recently updated standard, UNE-EN ISO 15630-3 [
16], used to qualify high-strength steel bars for prestressing concrete according to resistance to hydrogen embrittlement.
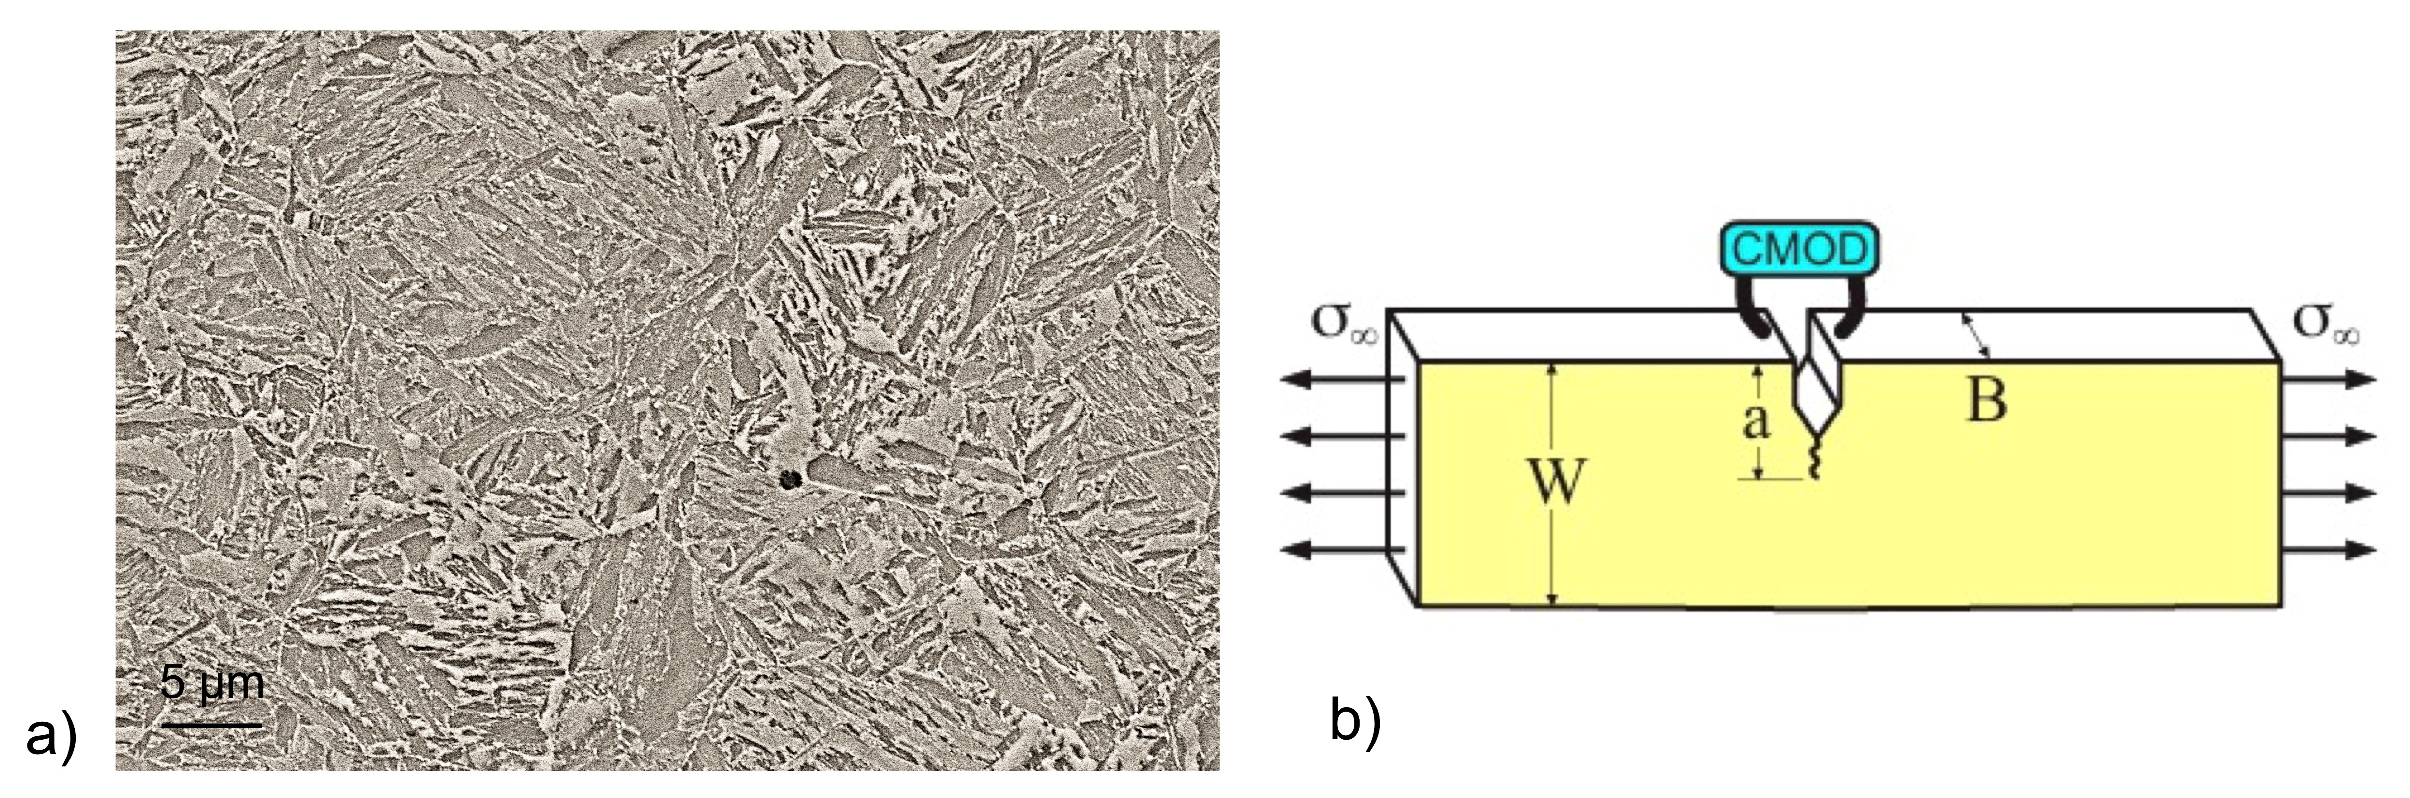
Accordingly, this work addresses, not only from an experimental, but also from a theoretical point of view, critical aspects regarding the mechanical behavior of an ultrahigh-strength tendon rod steel of lath martensitic microstructure, recently developed for highly demanding civil engineering applications related to structural integrity. Its improved mechanical properties are related to the hierarchical microstructure resulting from the prior austenite grains divided into the structural units of lath martensite, sub-blocks, blocks and packets [
17,
18], as well as due to the presence of discrete inclusions coming from steel microalloying [
19,
20,
21].
The newly analyzed aspect of the present research is the resistance of the bar steel to non-assisted and hydrogen-assisted cracking, namely the resistance to crack growth caused by mechanical loading in both an inert medium and a medium capable of steel embrittlement by hydrogen uptake, on precracked SENT specimens. The experimental analysis is complemented by a theoretical approach, which involves the Dugdale cohesive model applied to the SENT configuration with the aid of the Green function proposed by Chell [
22] and the reciprocity theorem reformulated by Rice for cracked Hookean solids [
23]. The theoretical results regarding the applied load—CMOD (crack mouth opening displacement) and the J-integral—are compared with the experimentally obtained data, for both studied media in order to determine the cohesive resistance of the steel and its variation with hydrogen exposure.
3. Cohesive Model Applied to the SENT Specimen in Tension
The cohesive crack was initially introduced by Bilby [
29] to model the nonlinearities that occur at the crack tip. The basic postulate of the model is that the singularity of the stress field vanishes because of the formation of a crack extension referred as the cohesive zone, capable of transmitting a given uniform tensile stress Y
, between its two faces. Therefore, the stress intensity factor of the extended crack, referred to as a cohesive crack, becomes zero due to the contributions of the applied tensile load and of the stress Y, referred to as cohesive resistance. This condition determines the size of the cohesive zone. In the subsequent evolution of the model [
30,
31], the cohesive resistance Y is no longer a material constant and is replaced by a material law
, which determines a one-to-one relationship between the separation acquired by each pair of points of the cohesive zone coming from the same initial material point, and the tensile stresses of equal value and opposed sign that they transmit to each other.
The Green function proposed by Chell [
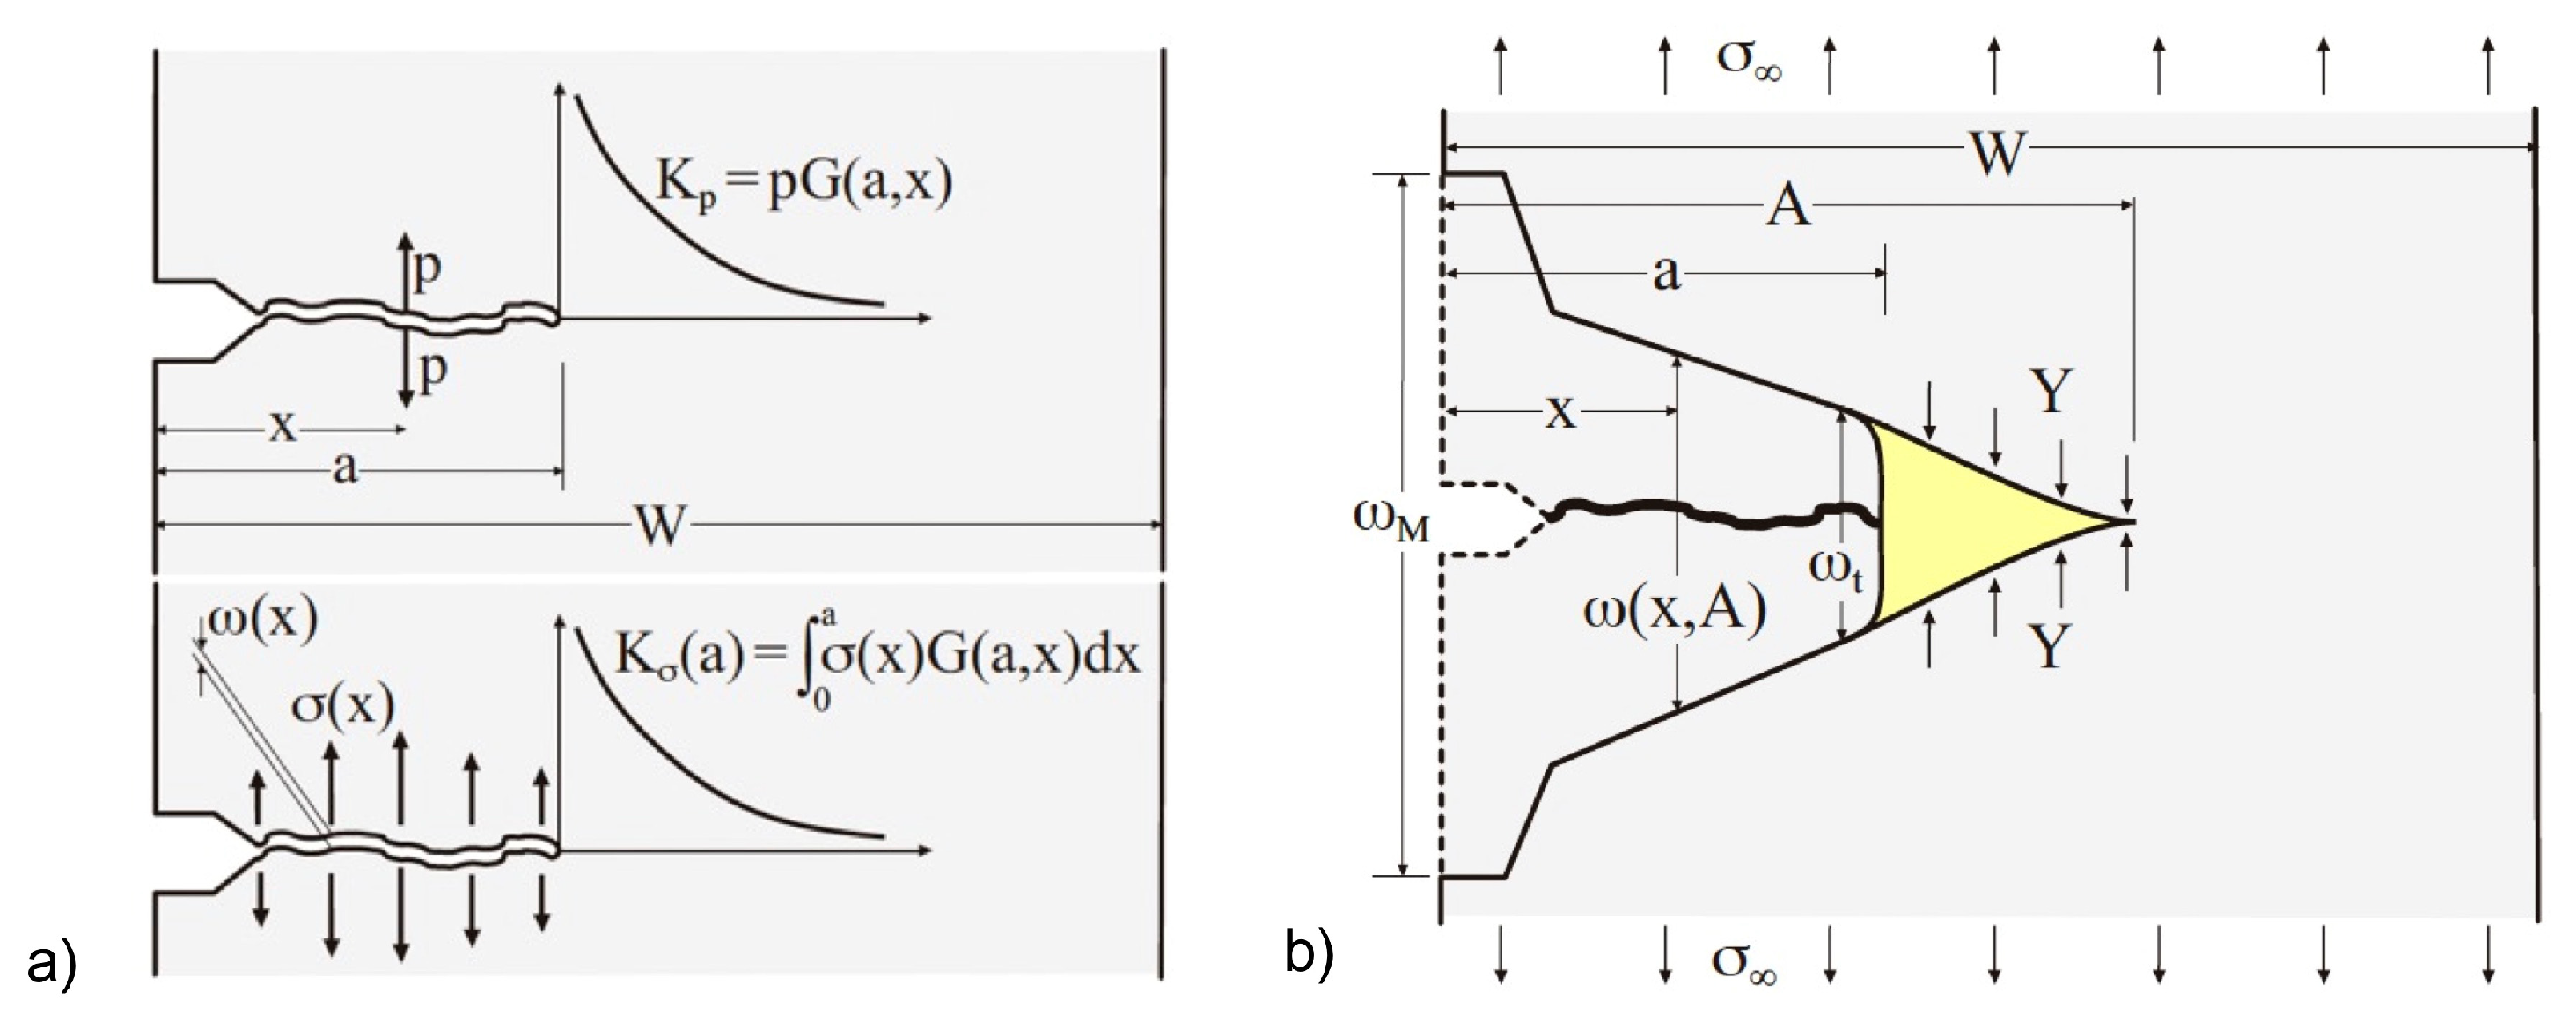
22] allows for the cohesive model to be particularized for the SENT specimen in the view of obtaining the theoretical curves load–CMOD and J-integral—CMOD as a function of the cohesive resistance Y. The Green function G(x, a) is the stress intensity factor per unit load K
p/p in a SENT specimen with a crack of depth a, when its faces are compressed by concentrated loads per unit thickness p applied at a depth x from the crack mouth. The superposition principle and the reciprocity theorem, as formulated by Rice [
23] for Hookean cracked bodies, allow the stress intensity factor K
s and the crack opening field ω = ω(x, a) to be determined for any compressive stress distribution s(x) acting symmetrically on both faces of the crack (
Figure 4a):
where E is the elastic modulus of the steel and plane stress has been assumed. The Green function proposed in [
22] is:
where h,
2(a, x) is the derivative with respect to the second variable of the given function h(a, x) is:
and the factor k(a/W) can be obtained from the stress intensity factor K∞ of the SENT specimen when subjected to uniform stresses along the whole crack, s(x) = s∞, or equivalently, loaded in tension with remote stress s∞ far away from the crack.
The substitution in Equation (6) of the stress intensity factor K∞ given in [
28] leads to the following expression for the function k(a/W):
The condition of zero stress intensity factor K∞ − K
Y due to the combined action of the remote tensile stresses s∞ and the stresses Y developed in the cohesive zone of the crack determines the total depth a that the cohesive crack acquires when the SENT specimen is tensile-loaded (
Figure 4a).
Thus, the depth a results from the function h(A, a) given by Equation (5) in terms of the relative crack size ã = a/W:
The field ω(x) of crack-opening displacements along the cohesive crack (
Figure 4a) is the difference between those given by Equation (2) when K
S(t) is respectively particularized for the stress intensity factors K∞ and K
Y, and the crack size is particularized for A:
The respective values ω
M and ω
t of this field the positions x = a and x = 0 are the crack-opening displacements at the physical crack tip (CTOD) and at the mouth of the notch (CMOD):
Given that the cohesive crack does not entail any stress singularity, the integration contour to determine the J-integral can be infinitely close to the crack faces. In this case, its value is the product Yωt and, consequently, Equation (11) provides the quotient J/Y.
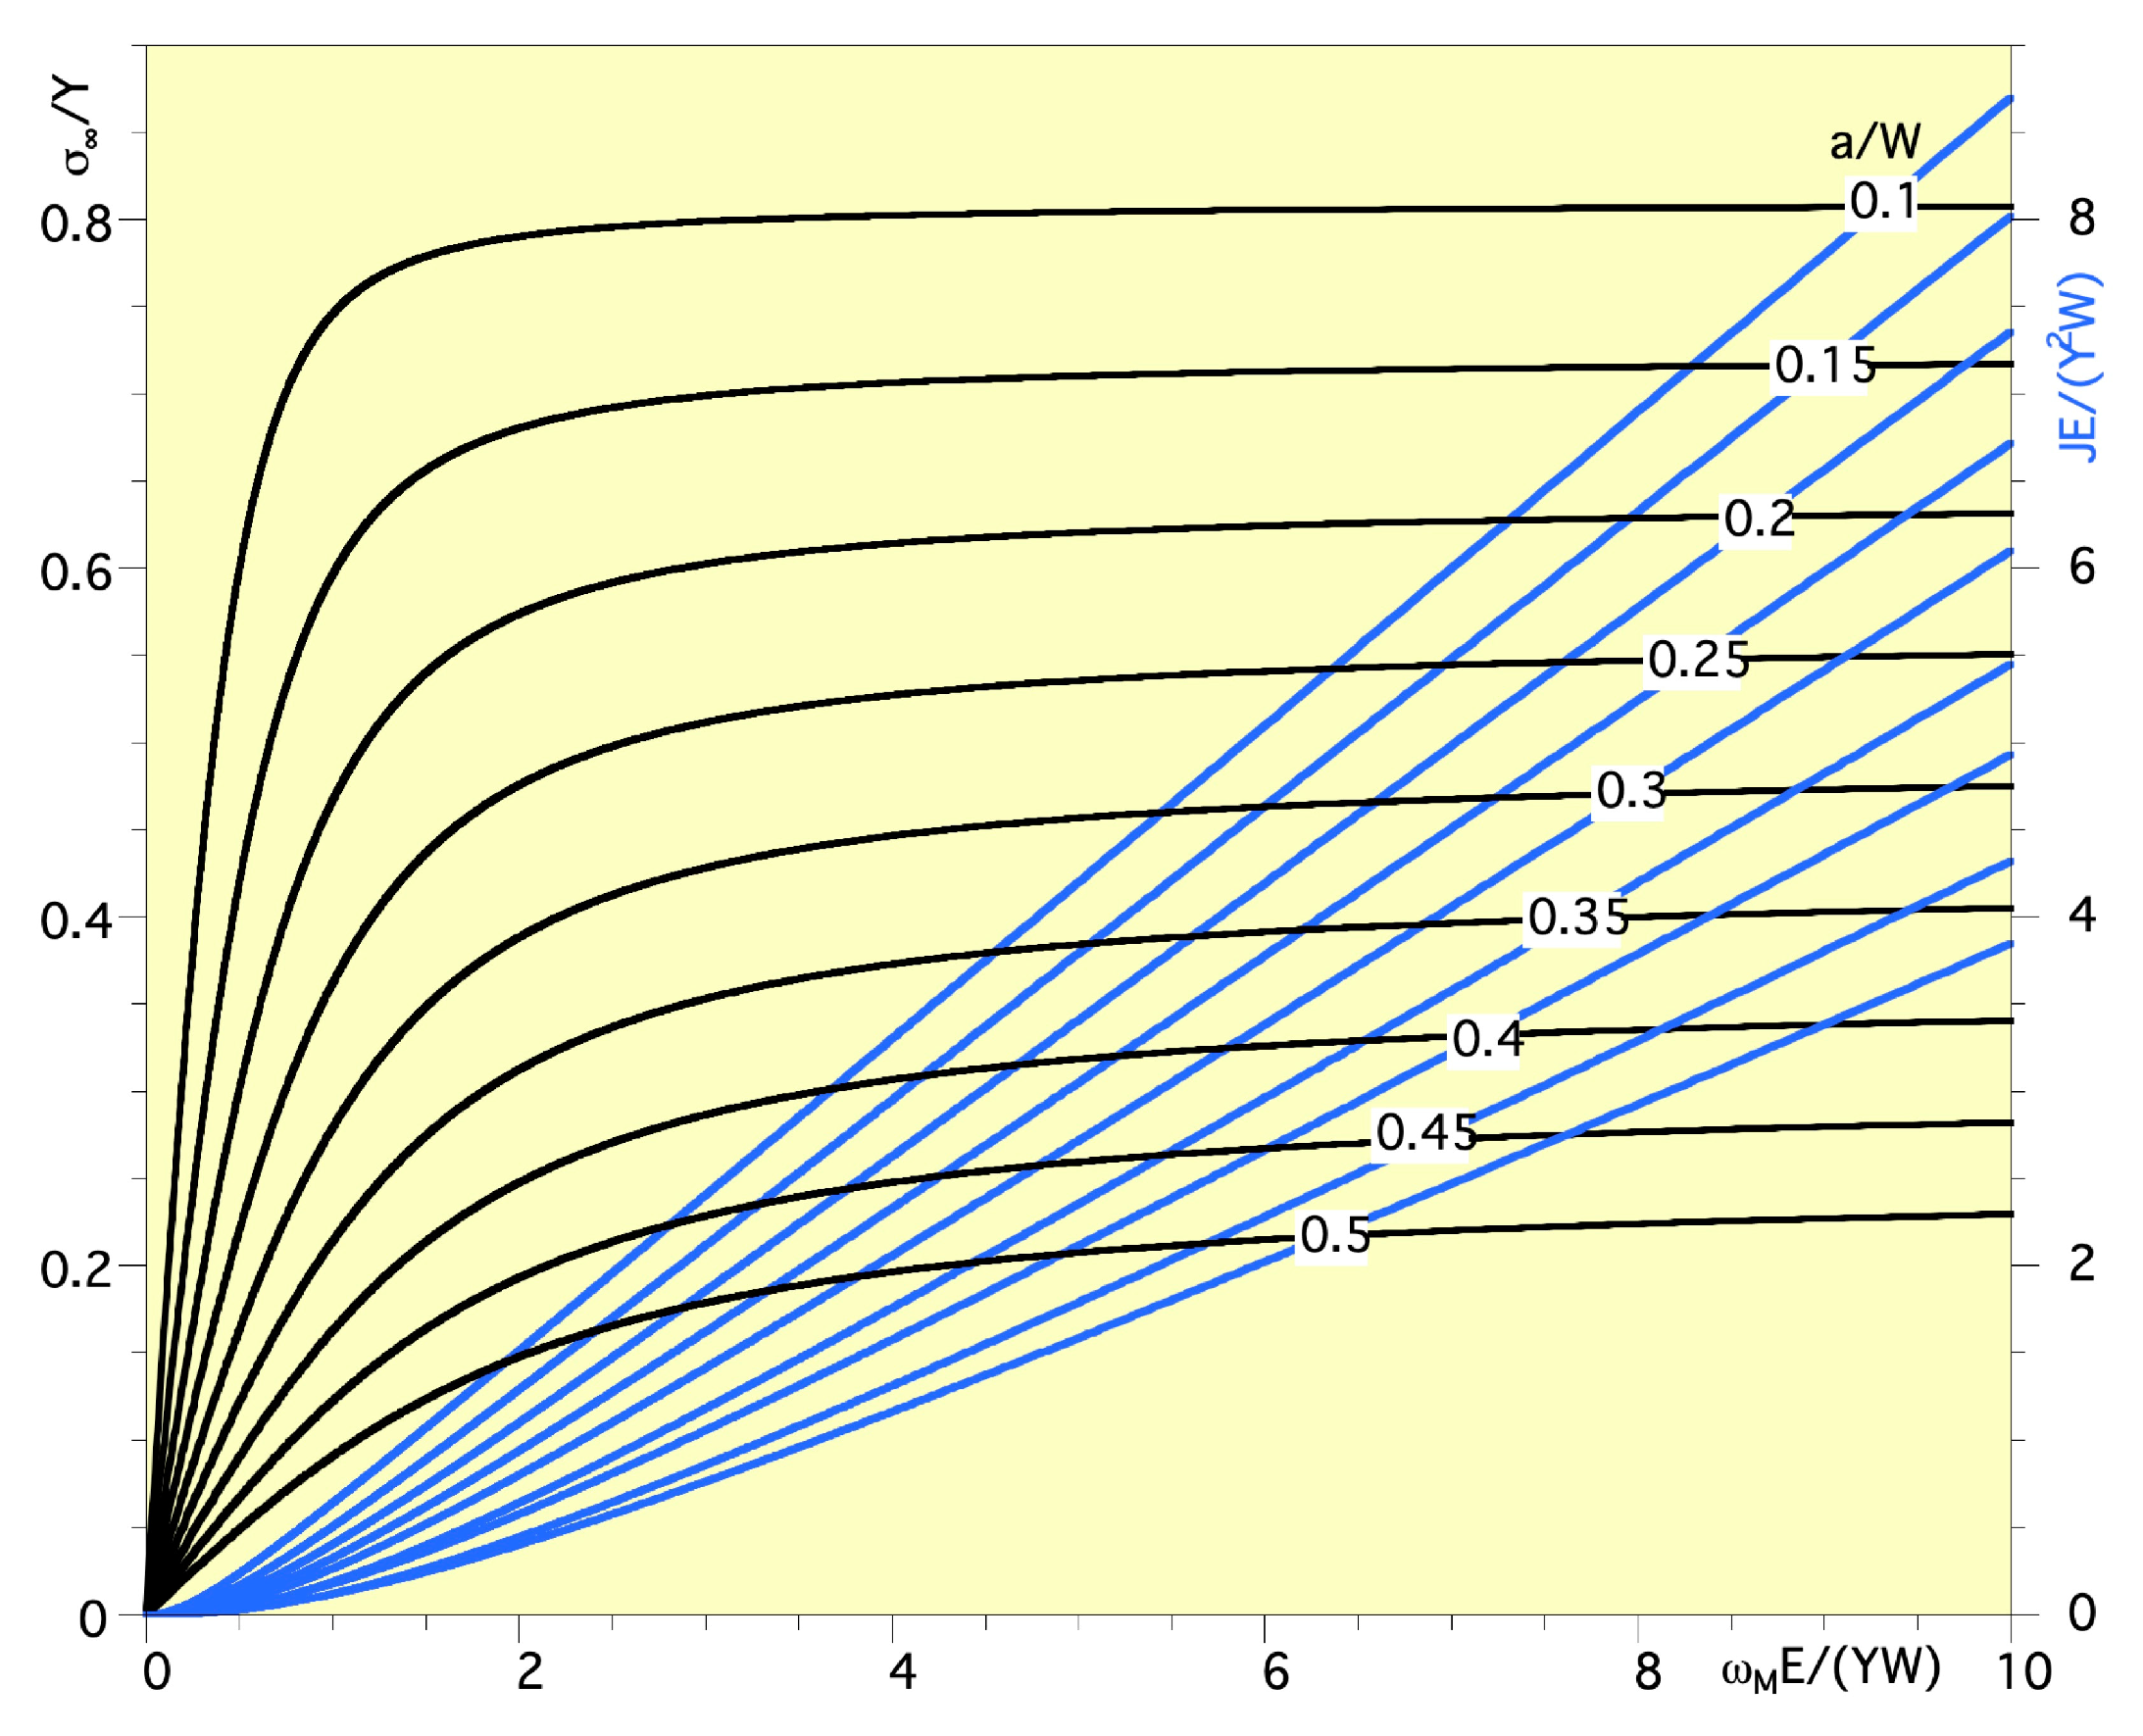
The integrals of Equations (11) and (12) were numerically solved and combined with Equation (10) in order to determine the applied remote stress and the value of the J-integral as a function of CMOD and the relative crack size ã = a/W, with generic values of the elastic modulus E and the cohesive resistance Y.
Figure 5 shows these results. Note that the values of the dimensionless J-integral are also those of the dimensionless CTOD (ω
tE)/(WY).
The asymptotic maximum of the load–CMOD curves corresponds to the condition of A = W and means that the physical crack and the cohesive zone completely occupies the cracked cross-section. The most notable feature of the J-integral is the tendency to increase linearly once the parabolic growth typical to the SSY regime is exceeded.
According to Equation (9), the remote stress limit s∞Y is:
The dependence between the relative crack size and the slope of the straight part of the curve giving the J-integral can be fully fitted by the linear equation:
The validity range of the equations derived from the cohesive model for the SENT specimen is determined by the Green function (Equation (4)), which was verified for relative crack sizes of 0.1 ≤ a/W ≤ 0.5 in [
22] by comparison with finite element results.
4. Results and Discussion
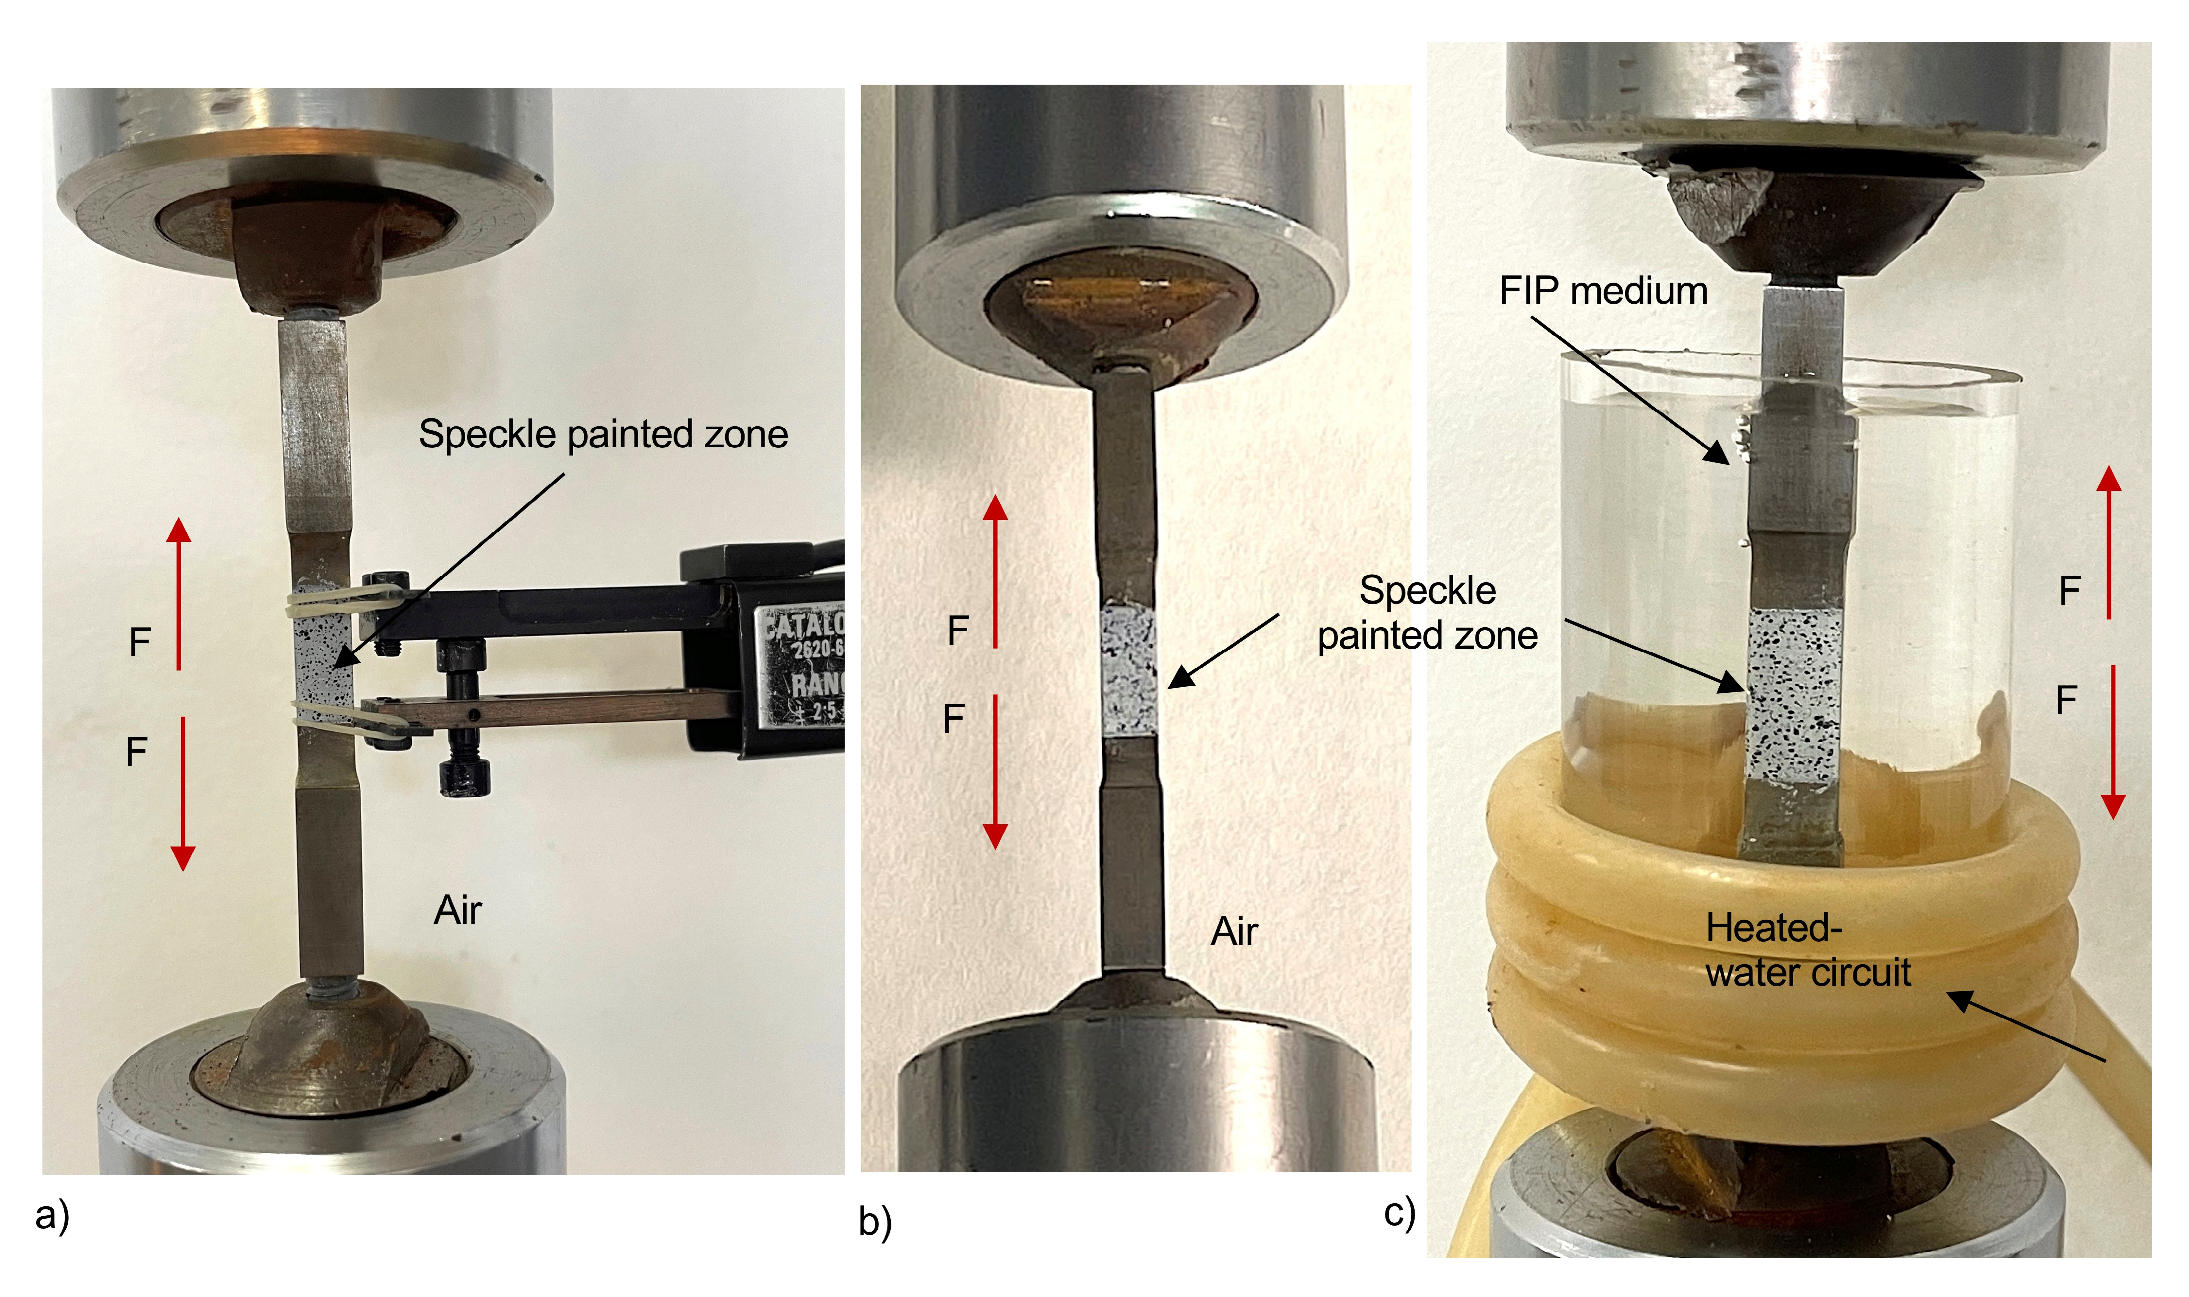
4.1. Experimental Results of the J-Integral Fracture Tests Made in Air and in FIP Environment
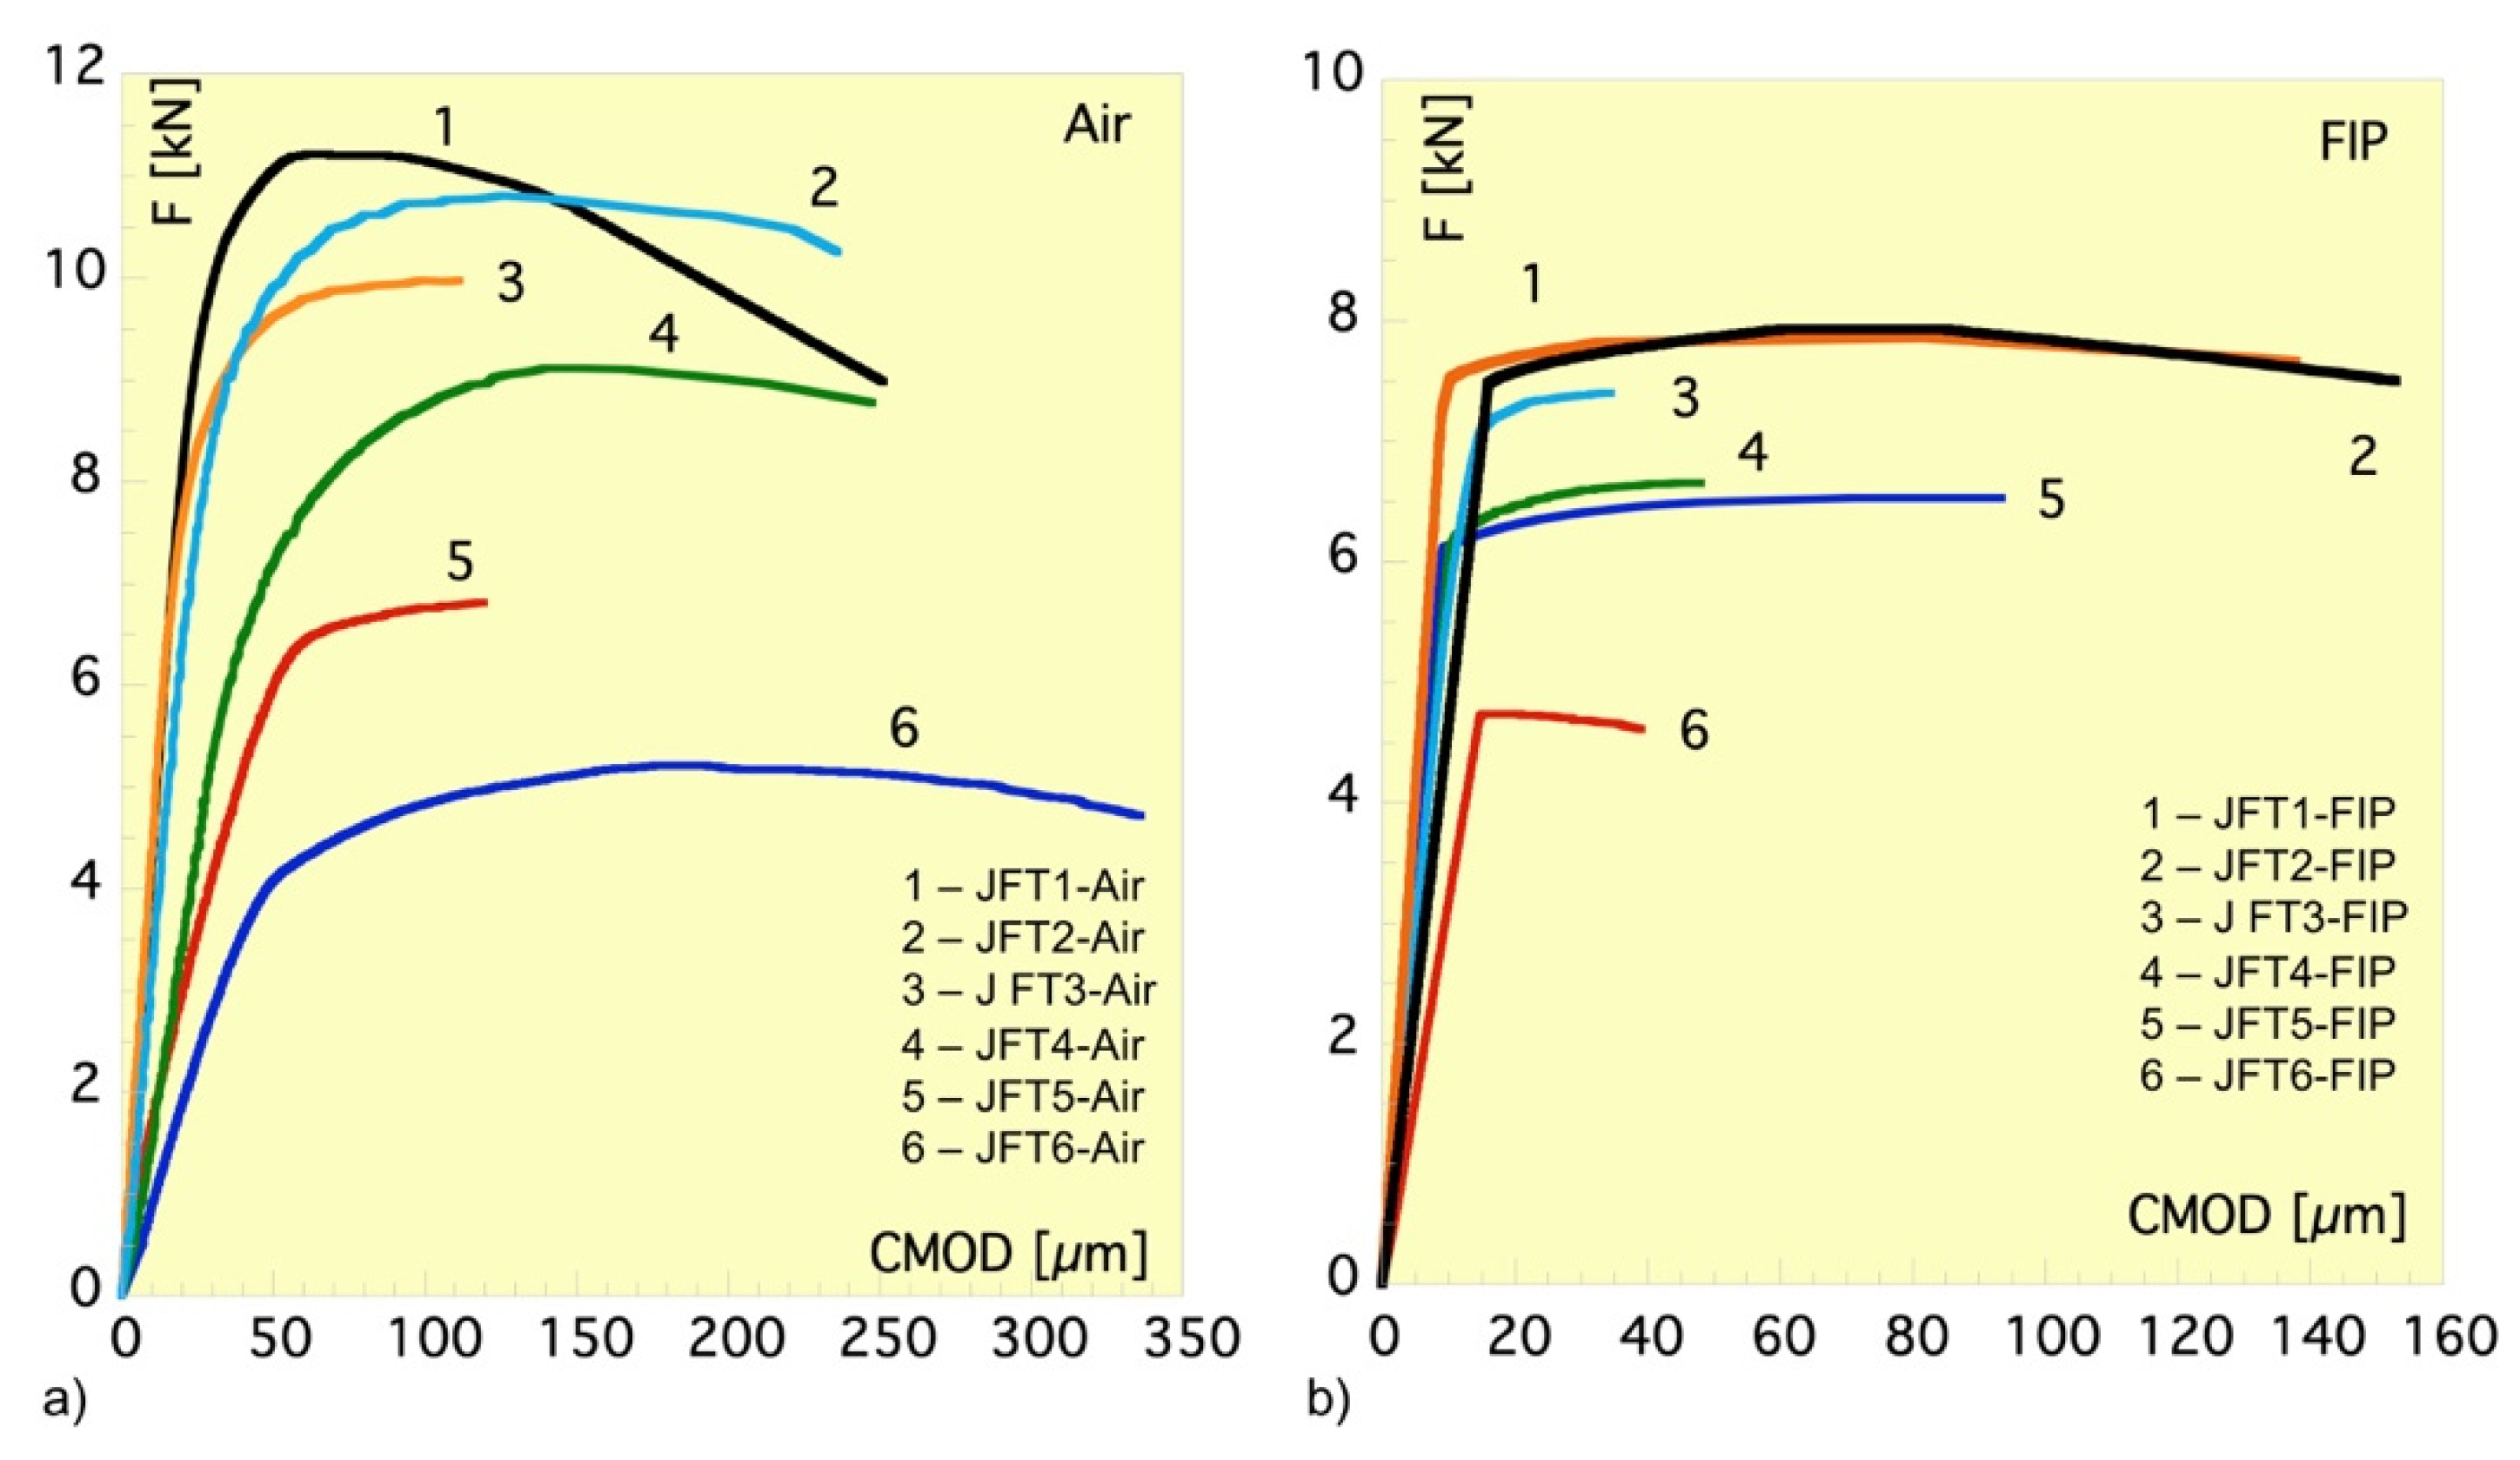
Figure 6a shows the load–CMOD data of the six J-integral fracture tests conducted in-air (JFT-Air, four of them on fatigue precracked SENT specimens, and the remaining two, JFT5-Air and JFT6-Air, after previous assisted cracking in FIP solution). These last two tests were performed after enough time from the unloading aggressive solution removal and cleaning to ensure that most of the diffusible hydrogen had vanished. The initial crack size a
0 of specimens, including the 0.5 mm notch depth, ranged from 0.95 mm to 2 mm.
The graph in
Figure 6b illustrates the load–CMOD data of the six J-integral fracture tests performed in FIP solution (JFT-FIP), with initial fatigue crack sizes a
0, including the 0.5 mm notch depth, ranging from 0.6 mm to 1 mm.
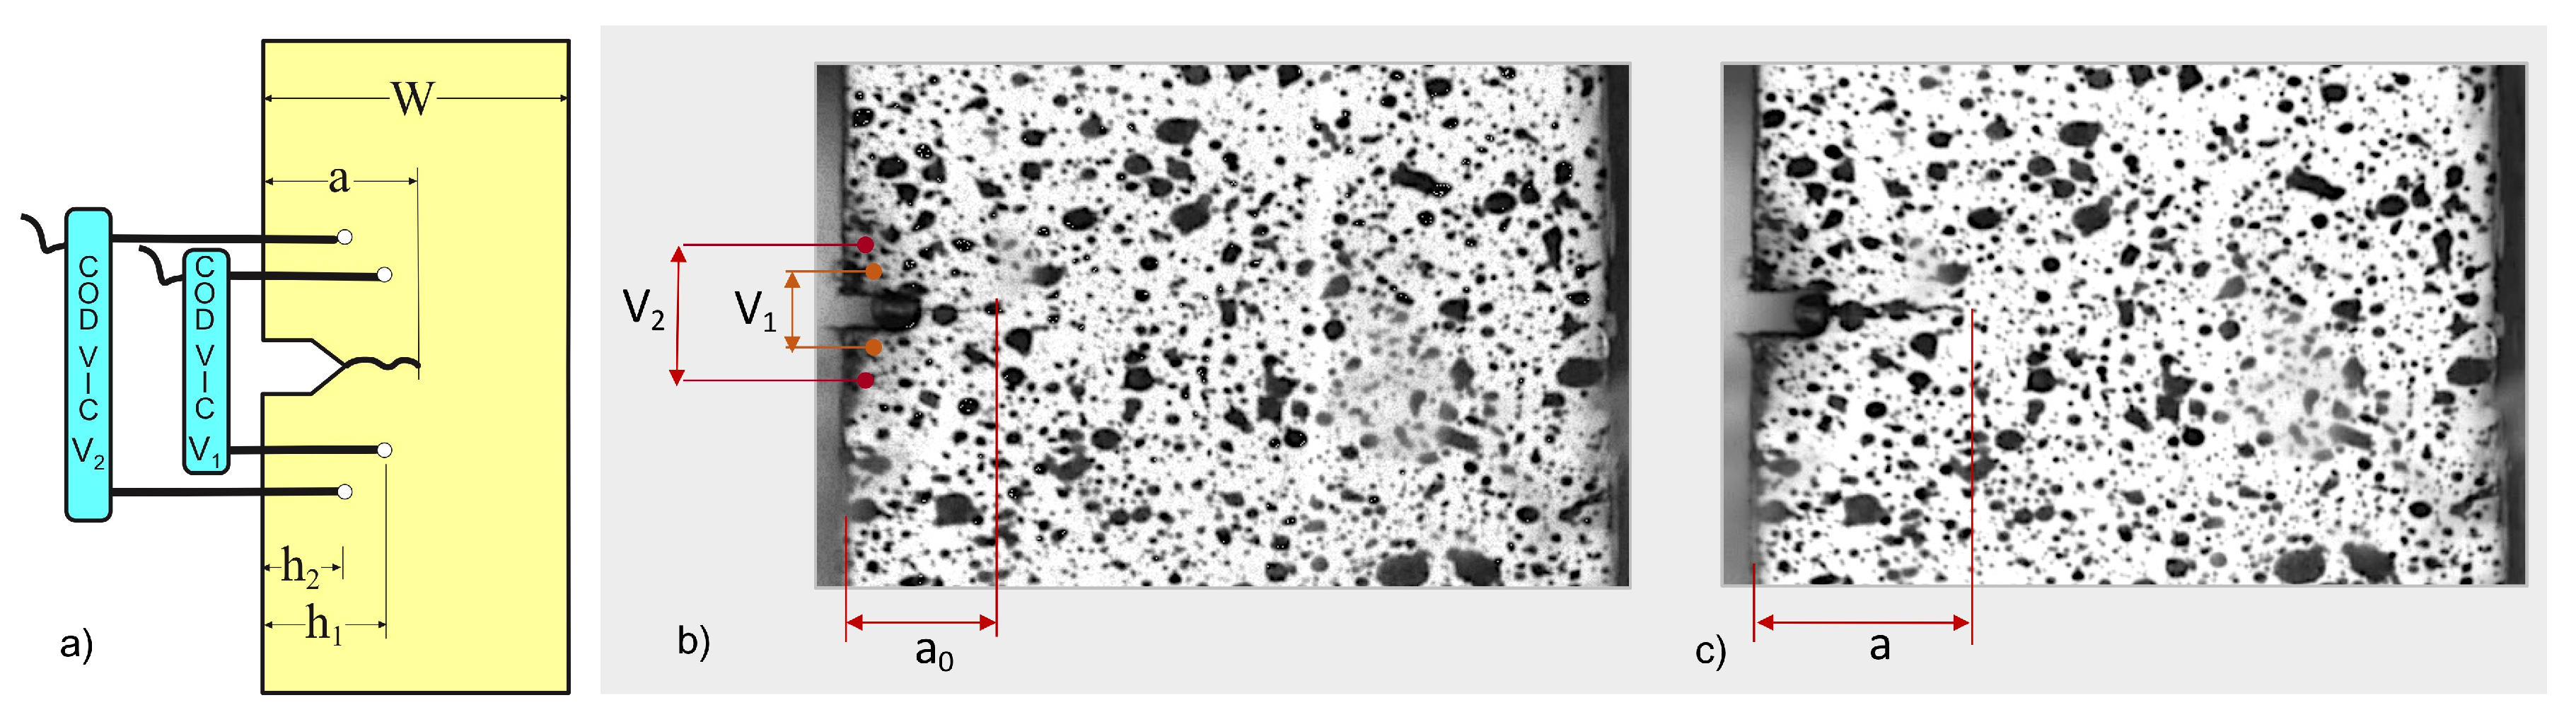
The CMOD data employed in both diagrams given in
Figure 6 come from Equation (1), which uses the crack opening displacements V
1 and V
2 measured with the pair of virtual extensometers mounted on the speckled painted surface of each of the tested specimens.
The simple comparison of the maximum loads reached in the JFT-FIP tests with those obtained in the JFT-Air tests, in which the initial crack sizes were almost double that of the former, shows the strong hydrogen-embrittlement power of the FIP solution. The CMOD values registered at the corresponding maximum loads of the JFT-FIP tested specimens are less than a quarter of those found in the JFT-Air tested ones and confirm that hydrogen uptake not only significantly reduces the bearing load and the deformation capacities of the cracked specimens [
32,
33].
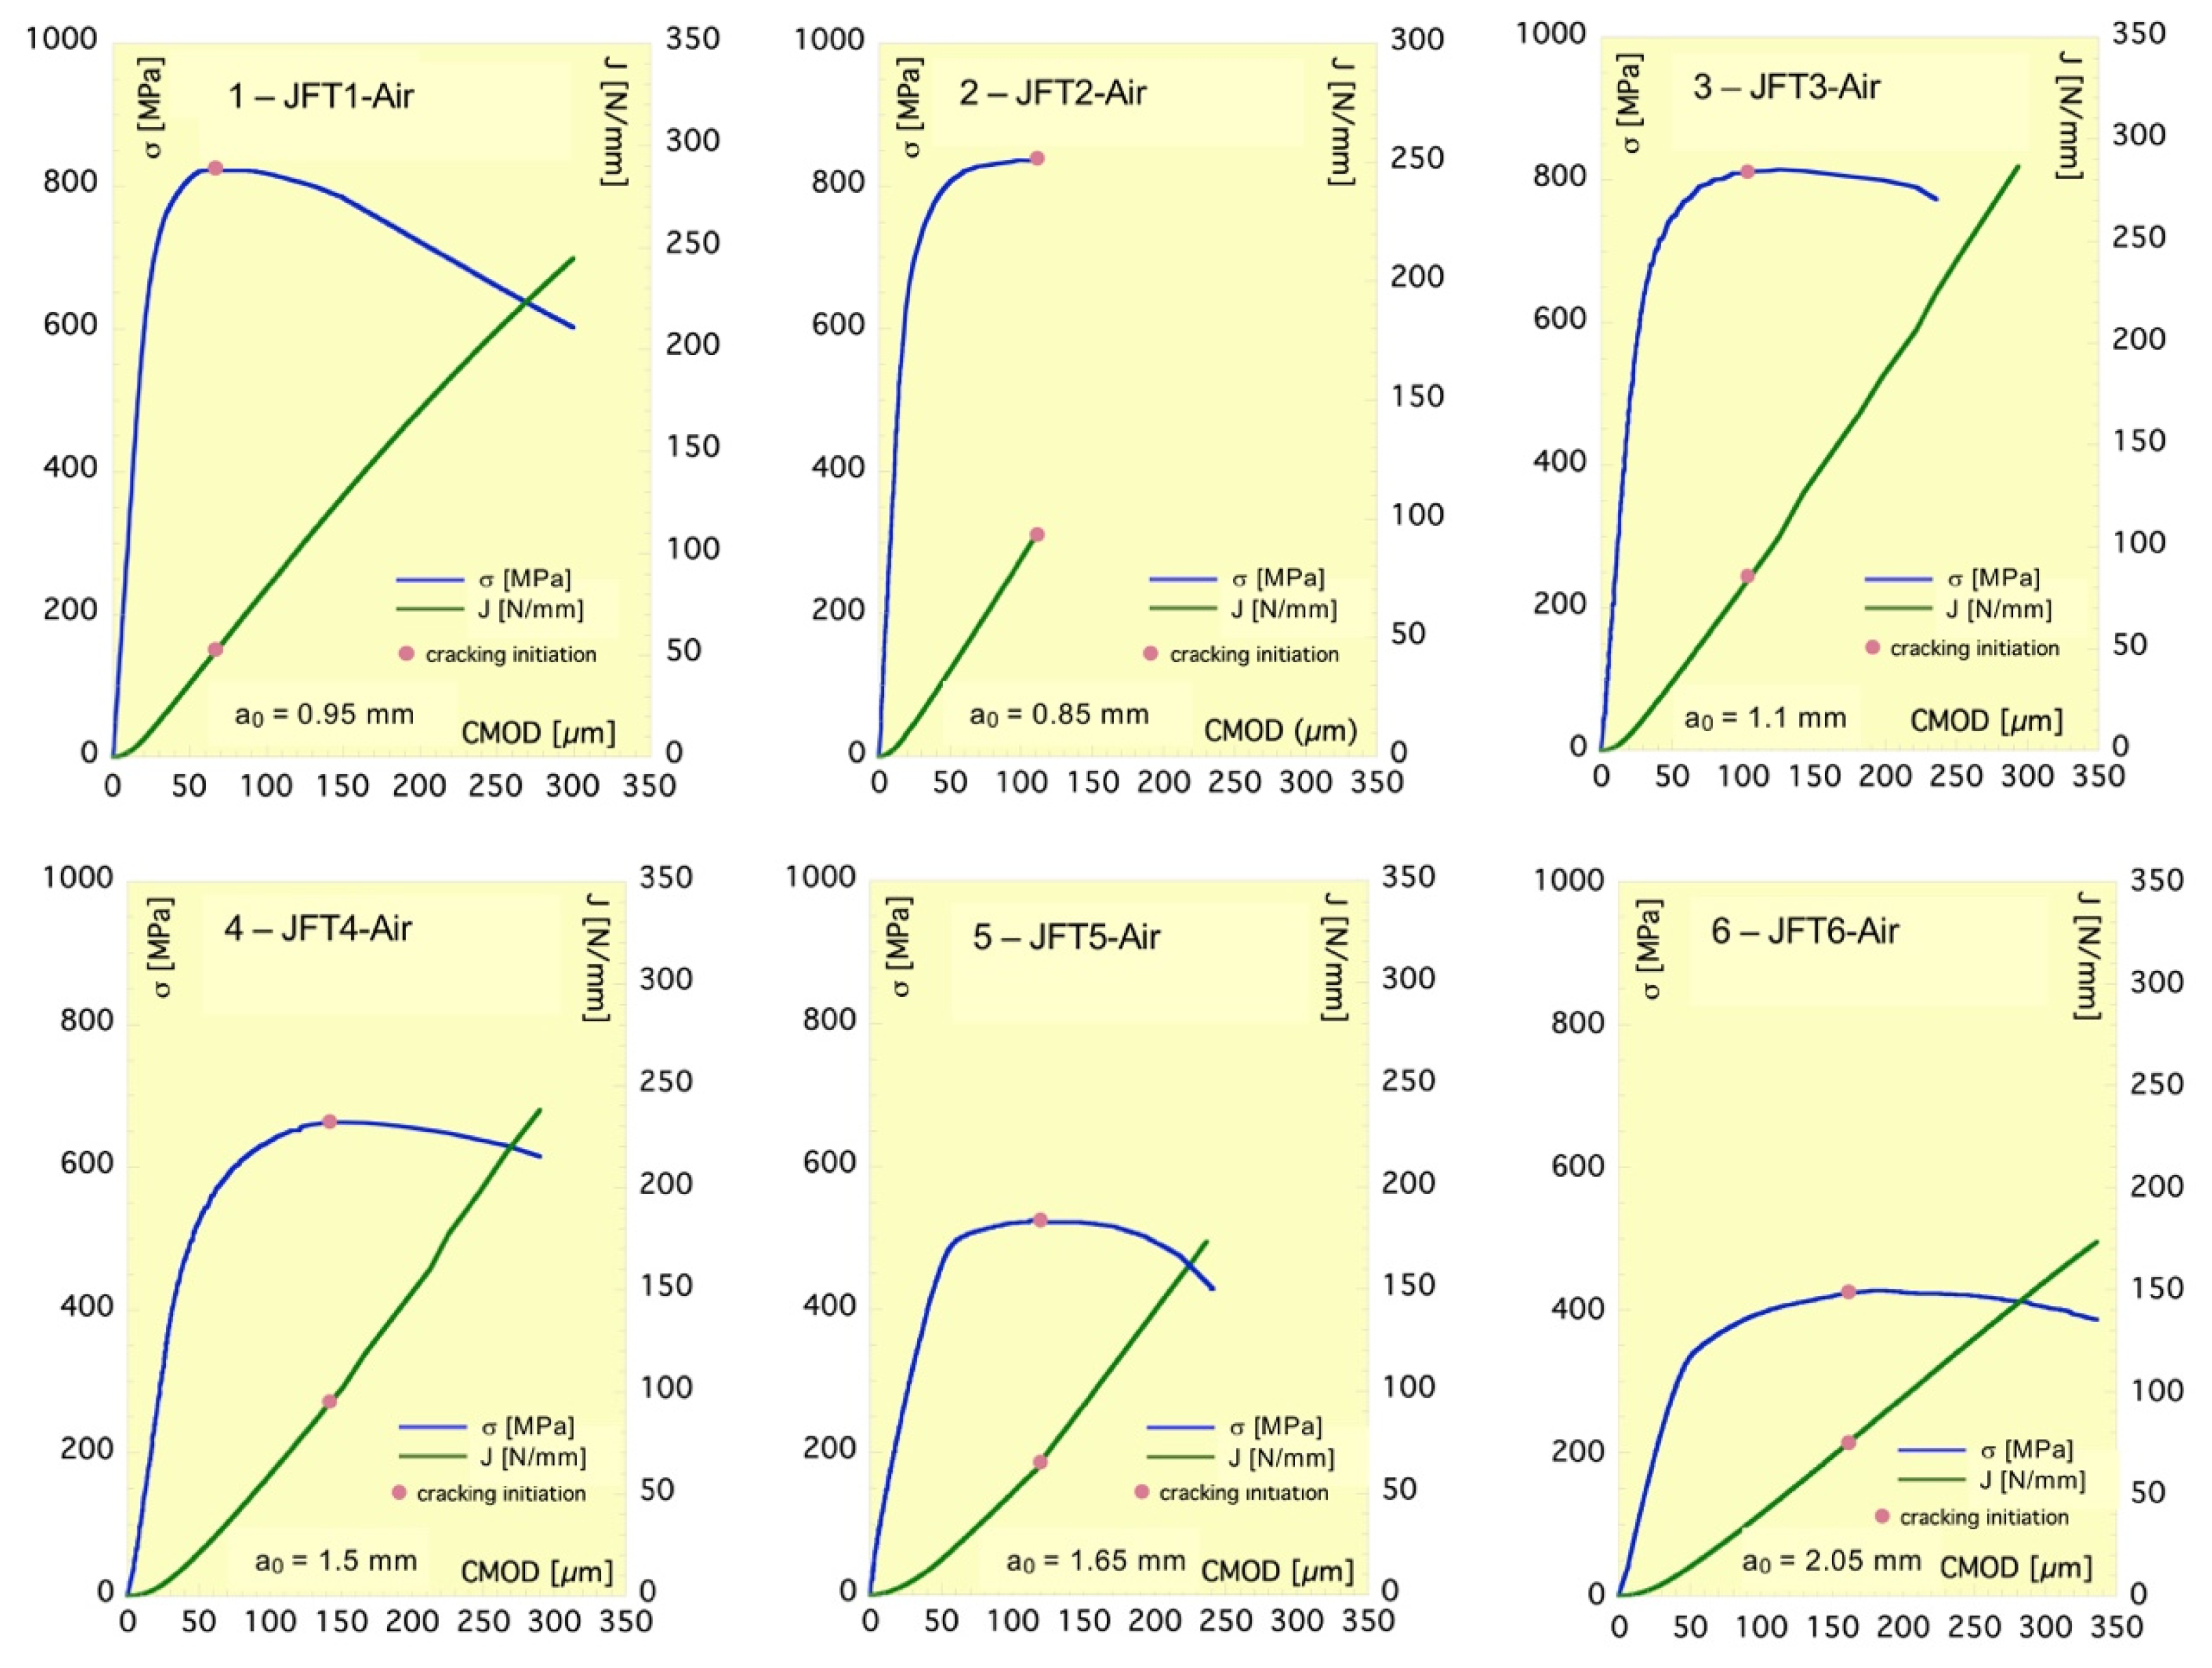
The two-axis plots of
Figure 7 show the load (in terms of remote stress) and the J-integral vs. CMOD curves for each of the six tests performed in-air, with the J-integral computed according to BS-8571. The red dot added to each plot indicates the crack initiation, which was automatically detected by the VIC-2D (Version 7) software through the alterations experienced by the sequence of the axial displacements at the crack tip.
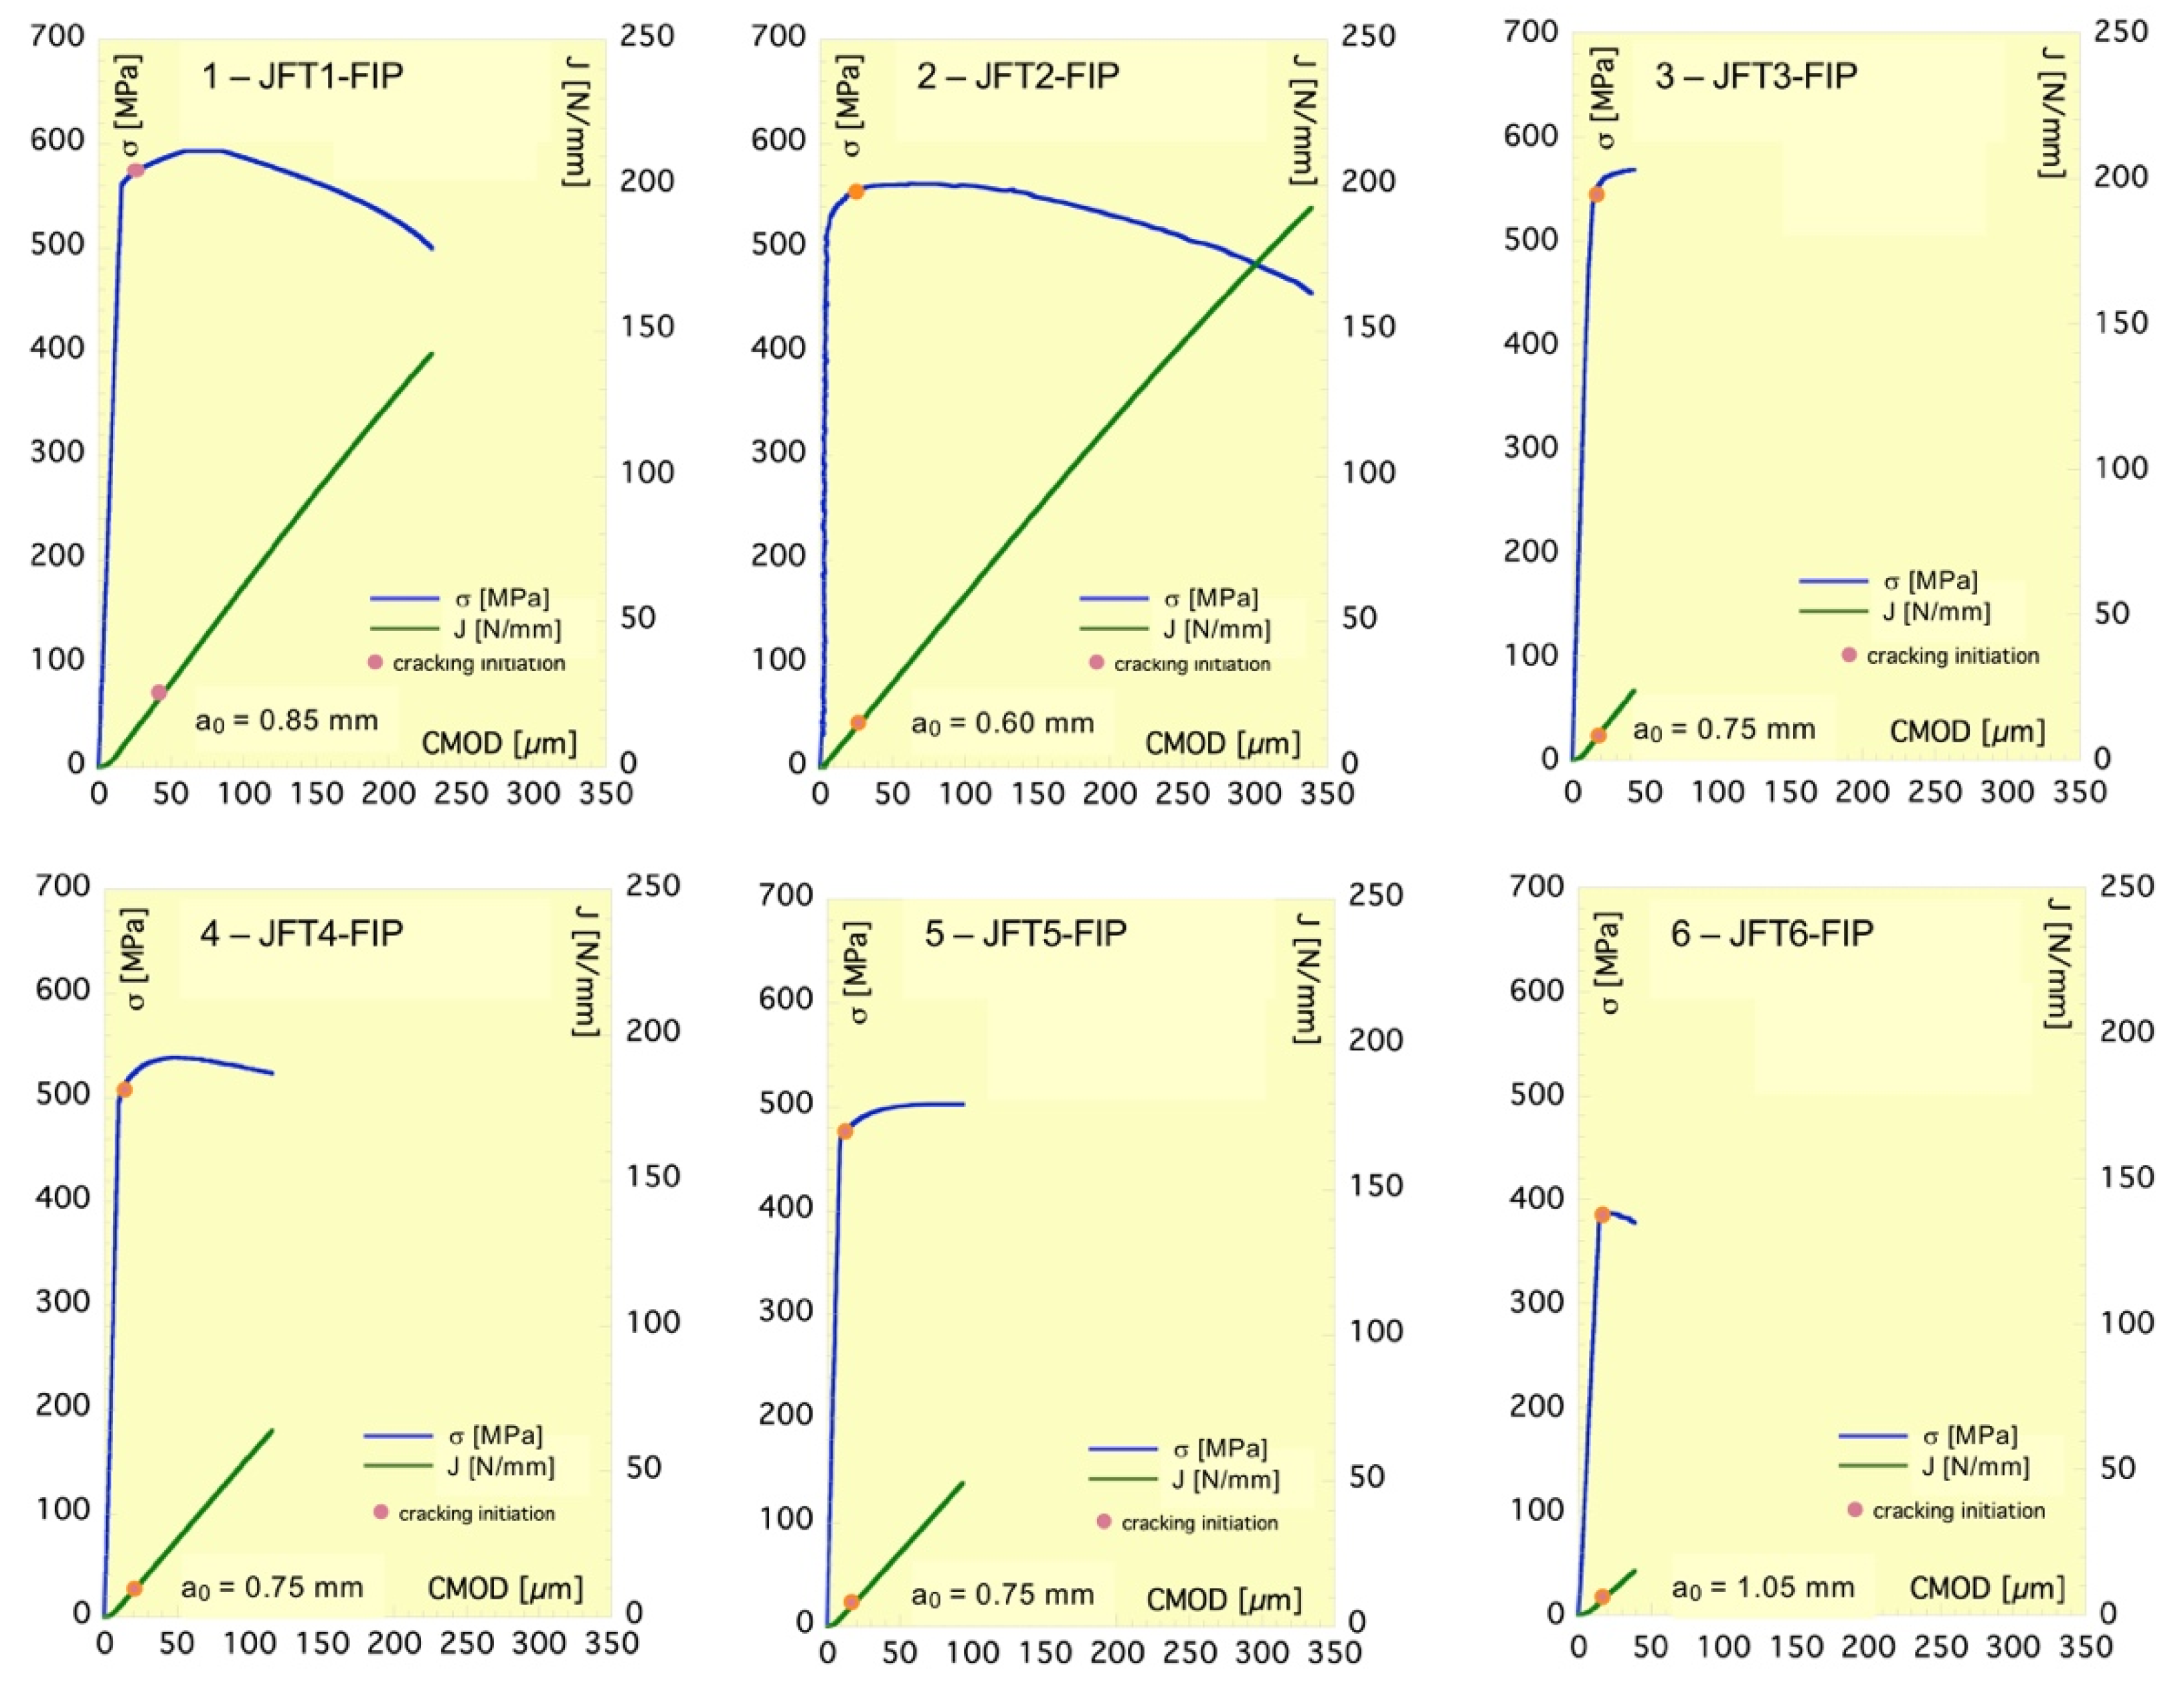
On the same terms are given the plots in
Figure 8, which illustrate the experimental results of tests conducted in the FIP solution. In contrast with the tests performed in-air, the onset of cracking occurs with the specimen barely indicating the general yielding. In addition, the stress intensity factor K
I due to the test load at crack initiation is approximately 31 MPam
1/2, the same that would determine the end of the SSY regime of specimen if it is assumed that the limit of ASTM E-399 [
34] is also valid in the SENT case. This limit is given as a function of the specimen thickness B and the 0.2% yield stress R
p0.2 of the material, which yields to:
The onset of assisted cracking that occurs at the end of SSY regime, after the first signs of general yielding, shows the embrittlement capacity of steel due to the hydrogen absorption, and also the need for a certain level of plastic deformation for effectiveness.
4.2. Agreement of the Cohesive Model with the Experimental Data
The value of the cohesive resistance Y is the only degree of freedom that allows the theoretical predictions derived from the cohesive model to match the experimental results. However, as shown by the curves in
Figure 5, Y operates as a scale factor regarding the predictions and therefore the shape of the theoretical load–CMOD and J–CMOD curves must be similar to those of the experimental ones up to cracking initiation, as actually occurs. The cohesive resistance Y has to be the value of the scale factor that makes the curves of both origins match.
Hence, two options were taken into account to find the cohesive resistance from the two curves given in each plot of
Figure 7 and
Figure 8. The options consist of identifying the maximum remote stress s∞Y and the slope dJ/dwM of the linear part of the J-integral–CMOD curve, respectively, with the theoretical values given by Equations (13) and (14). This double identification leads to the following values Y
J and Y
s for the cohesive resistance:
The values of Ys are derived from the instability stage of the loading process according to the theoretical model. Nevertheless, in the tests instability and cracking could interfere to the detriment of the reliability of Ys. As a consequence, the values of YJ were those used to determine the cohesive resistance of the bar steel from the JTF tests.
The condition of the material constant, implicit in the cohesive model for the resistance Y in the absence of hydrogen uptake, means that its experimental values resulting from the JFT-Air tests should not differ from each other much more than expected in a series of tests for measuring any constant characterizing the fracture behavior of a material. In the case of the fracture toughness K
Ic, a standard deviation of less than 3% of the mean value is almost unattainable [
34].
In addition to this, the mean value should be consistent with the physical meaning attributed to the cohesive resistance in the model; that is, the yield stress of an ideally plastic material. The mean value of the 0.2% yield stress and tensile strength, or the tensile strength, are often adopted as ideal yield stress in engineering applications based on theoretical models assuming no hardening strain. The tensile strength of the steel bar is 1138 MPa, as indicated in
Table 2.
Table 3 shows the cohesive resistance values obtained from the J-integral fracture tests of the bar steel performed in-air. The standard deviation of the series of values obtained for Y
J, of only 7% of the mean value, is not higher than those expected in fracture mechanics testing, despite having used fatigue and assisted cracking to generate the initial crack.
The mean value of 1122 MPa hardly differs from the tensile strength of the bar steel of 1138 MPa. Therefore, all three aforementioned conditions for the experimental data to agree with the cohesive model are satisfied by the bar steel when hydrogen-free.
Table 4 gathers the cohesive resistance values obtained from each JFT-FIP test of the bar steel performed in the FIP medium. Again, the standard deviation of the series of values obtained for Y
J, of 8% of the mean value is not higher than those expected in fracture mechanics testing. However, the mean value of the series strongly differs from the tensile strength of the bar steel, to the point of almost not exceeding 60% of it. This loss of cohesive resistance provides the first major difference between the fracture behavior of the bar steel in an inert environment and in an environment that propitiates hydrogen uptake. Thus, the cohesive resistance consistently quantifies the effect of hydrogen embrittlement on the bar steel.
The low scattering of the experimental values of the cohesive resistance occurs despite the quantity of hydrogen accumulated at the crack tip potentially having considerably varied from one test to another, given the different sizes of the cracks, which entails different severity as stress concentrators and different capacity as hydrogen sinks.
4.3. Agreement of the Cohesive Model Behavior and Hydrogen Embrittlement Micro-Mechanisms
The micro-mechanisms causing crack growth in the steel bar when hydrogen-free and when hydrogen-embrittled are not at all in contradiction with the cohesive model. In the absence of hydrogen, the crack front behaves as a stress concentrator in the regime SSY, but transforms into a plastic strain concentrator which spreads ahead of the crack once the SSY regime vanishes.
In support of this statement,
Figure 9a shows a macroscopic image of the fracture surface of the JFT3-Air specimen (a
0 = 1100 µm), and two higher-magnification details given in
Figure 9c,d. According to
Figure 9a, the crack grows from the fatigue front and penetrates the resistant ligament, narrowing toward its center and ultimately causing specimen collapse. As noted in the VIC-2D image sequence and indicated in
Figure 7, the onset of crack growth occurred quite close to the maximum tensile load and was preceded by a strong blunting of the fatigue front. This is substantiated by
Figure 9c and entails high levels of local plastic deformation, which give rise to a quasi-ductile fracture morphology, with a significant amount of relatively large dimples converted into transverse secondary cracks.
Figure 9d captures the ductile morphology that characterizes the crack growth prior to the final failure of specimen by plastic instability; a crack length of approx. 450 mm being estimated by considering an equivalent straight propagation front.
In contrast, in the J-integral tests performed in the aggressive solution, the crack front absorbs and concentrates diffusible hydrogen, which subsequently induce mechanisms like hydrogen-enhanced localized plasticity (HELP) and hydrogen-enhanced decohesion (HEDE) to operate on a microscopic scale by increasing the deformability of the microstructural matrix of steel. The former increases the dislocation mobility, which intensifies and localizes the plastic deformation that favors the steel embrittlement, and the latter weakens the cohesion between the martensitic matrix components [
25,
35,
36]. The material thus altered forms the cohesive zone which, in order to reach a certain level of deformation, would require less stress than that under a hydrogen-free condition, and as a consequence, needs lower cohesive strength.
In sustaining the above, the macroscopic image given in
Figure 9b and two details of it (
Figure 9e,f) belonging to JFT1-FIP (a
0 = 850 µm) were selected to observe and evaluate the hydrogen embrittlement effect on the respective morphologies and fracture micro-mechanisms.
Figure 9e illustrates the transition from fatigue to the onset of assisted crack followed by stable progress (of approx. 950 mm) until the specimen collapses beyond the maxim load (
Figure 8), the value of which is 30% smaller than that of a similar, in-air broken specimen (
Table 3 and
Table 4). This is due to the continuous absorption of hydrogen through the crack tip, which embrittles its front and causes the early initiation of cracking, almost simultaneously with the limit of the SSY regime.
Figure 9e captures the environmentally assisted crack initiation of quasi-cleavage morphology indicating either the martensite packets rupture or decohesion and small, secondary cracks probably formed at previous austenite grain borders. This morphology, which characterizes almost the entire crack length of approx. 950 mm, estimated by considering an equivalent straight propagation front, is due to the combined action of the HELP and HEDE fracture mechanisms [
18,
20,
26]. Then, according to
Figure 9f, at maximum load, due to the onset of plastic instability, HELP, the predominant ductile mechanisms begin to induce the quasi-ductile collapse of the specimen.
5. Conclusions
The fracture behavior and hydrogen-assisted cracking sensitivity of the lath martensite steel used to manufacture a new type of ultrahigh-strength tendon bar for construction has been explained and quantified from the cohesive crack model adapted to the SENT specimen configuration, as well as from the J-integral experimental values obtained by testing precracked SENT specimens.
The complete agreement between the J-integral values measured and predicted allowed for the cracking resistance of the bar steel to be quantified through the cohesive resistance. The obtained values are fully consistent with the condition of the material constant attributed to the cohesive resistance in the model. The differences found when comparing the values in an inert medium and in a hydrogenating medium clearly illustrate and quantify the hydrogen embrittlement effect, since losses of almost 40% occur when an inert medium such as air is replaced by a hydrogen-promoting one.
Despite these, the research has shown that the analyzed steel does not obey a fracture criterion based on a single toughness constant, such as KIc or JIc, but its crack growth behavior is consistent with the cohesive model. Hence, a design application of this finding would consist of limiting the service tensile load of the bars as a function of environment aggressivity in order to assure their structural integrity in the presence of a postulated crack. The cohesive strength would be measured with SENT specimens, and the numerical implementation of the cohesive model for cracked bars would provide the designer with curves such as those resulting from the present research, i.e., load vs. CMOD. The combination of both results would allow for a safe load level to be adopted.
In addition, it was found that the lath martensite microstructure is favorable to the hydrogen-embrittlement mechanisms like HELP and HEDE, since the high densities of dislocations and interfaces that it entails facilitate plastic deformation and decohesion which, in terms of the cohesive model, are equivalent to the loss of cohesive strength. The morphologies found on the fracture surfaces of the tested specimens confirm the hydrogen action ahead of the crack front by showing how they gradually transform from brittle to quasi-ductile from the onset of assisted cracking up to the unstable fracture process that causes the specimen collapse.


