Abstract
Gravity and gravity gradient data serve as fundamental inputs for geophysical resource exploration and geological structure analysis. However, traditional denoising methods—including wavelet transforms, moving averages, and low-pass filtering—exhibit signal loss and limited adaptability under complex, non-stationary noise conditions. To address these challenges, this study proposes an improved U-Net deep learning framework that integrates multi-scale feature extraction and attention mechanisms. Furthermore, a Laplace consistency constraint is introduced into the loss function to enhance denoising performance and physical interpretability. Notably, the datasets used in this study are generated by the authors, involving simulations of subsurface prism distributions with realistic density perturbations (±20% of typical rock densities) and the addition of controlled Gaussian noise (5%, 10%, 15%, and 30%) to simulate field-like conditions, ensuring the diversity and physical relevance of training samples. Experimental validation on these synthetic datasets and real field datasets demonstrates the superiority of the proposed method over conventional techniques. For noise levels of 5%, 10%, 15%, and 30% in test sets, the improved U-Net achieves Peak Signal-to-Noise Ratios (PSNR) of 59.13 dB, 52.03 dB, 48.62 dB, and 48.81 dB, respectively, outperforming wavelet transforms, moving averages, and low-pass filtering by 10–30 dB. In multi-component gravity gradient denoising, our method excels in detail preservation and noise suppression, improving Structural Similarity Index (SSIM) by 15–25%. Field data tests further confirm enhanced identification of key geological anomalies and overall data quality improvement. In summary, the improved U-Net not only delivers quantitative advancements in gravity data denoising but also provides a novel approach for high-precision geophysical data preprocessing.
1. Introduction
Gravity and gravity gradient data, essential tools in geophysical research, play a critical role in resource exploration, geological structure analysis, and navigation applications. In resource exploration, gravity data can detect subsurface density anomalies, enabling the identification of ore bodies or oil and gas reservoirs [1,2]. For studies on geological structures, gravity data are used to analyze the density distribution of the crust and mantle and to investigate tectonic features [3,4,5,6]. Gravity and gravity gradient data have also been widely employed in aided navigation, where their deep integration with multi-source sensor information significantly enhances the overall navigation accuracy and robustness in complex environments [7,8,9]. Gravity gradient data provide much higher spatial resolution and can detect geological anomalies at smaller scales, making them more suitable for detailed investigation of shallow geological structures [10,11]. In practical applications, gravity gradient data also demonstrate substantial value, frequently being utilized in tasks such as edge detection [12] and depth estimation [13].
However, gravity and gravity gradient measurements often contain noise due to environmental conditions, instrumental errors, and human factors. This noise not only degrades the spatial resolution of gravity data but also reduces their ability to characterize the location and morphology of geological bodies [14,15,16,17,18]. Traditional gravity data processing methods are mostly conducted in the spatial or frequency domain, such as via direct mathematical differentiation or Fourier transform, to obtain the required gradient information [19].
In traditional methods, filtering techniques based on the spatial or frequency domain are widely applied. Low-pass filtering reduces noise by suppressing high-frequency components but tends to blur the boundary details of geological bodies [20]; the moving average method reduces noise fluctuations through local smoothing, yet causes signal distortion in non-stationary noise environments [21]; wavelet transform exhibits excellent performance in noise separation due to its multi-scale decomposition capability, but its denoising effect depends on the selection of wavelet basis functions, and its adaptability to strong nonlinear noise is limited [22]. These methods mostly rely on manually designed features or fixed parameters, making it difficult to handle the strong coupling between noise and signals in complex geological scenarios [23].
With the development of machine learning, data-driven methods have gradually emerged. Early studies employed shallow models such as Support Vector Machines (SVM) to process gravity anomalies, but they were limited by feature extraction capabilities and performed poorly in high-noise scenarios [23]. Recently, deep learning methods have achieved breakthroughs by virtue of end-to-end nonlinear mapping capabilities: The convolutional encoder–decoder structure proposed by Hu et al. [24] first applied deep learning to image denoising, providing new ideas for gravity data processing; Zhou et al. [25] realized intelligent denoising of potential field data based on RevU-Net, verifying the potential of deep learning in the geophysical field; Hu et al. [24] estimated potential field derivatives through deep neural networks, improving the stability of gradient data. However, existing deep learning methods still have two limitations: first, they lack constraints on the physical properties of the gravity field, which may generate non-physical artifacts that do not conform to the Laplace equation; second, they mostly focus on single-scale feature learning, and are insufficient in capturing the multi-scale correlations of complex geological structures [26].
Deep learning methods possess powerful capabilities for adaptive learning and nonlinear modeling. Through large-scale data training, they can efficiently distinguish between gravity anomaly signals and various types of complex noise, significantly improving denoising performance and processing efficiency. These methods can automatically construct nonlinear mappings from noisy gravity data to denoised data without manual intervention for feature extraction and integration. After model training and optimization, they can rapidly and stably process new observation data, providing high-quality basic data for geophysical exploration, geological surveys, and seismic monitoring.
Against this background, this study addresses the denoising of gravity and gravity gradient data by proposing a U-Net architecture incorporating multi-scale feature fusion modules and attention mechanisms. Additionally, we introduce a physical consistency constraint during model training by embedding the Laplace equation—which governs the geophysical gravity potential—into the loss function as a Laplace term. This approach effectively enhances the physical interpretability and generalization capacity of the network’s denoising results, addressing existing issues of poor denoising performance and low processing efficiency for gravity data. The proposed network structure, which integrates multi-scale feature fusion and attention mechanisms, is better able to capture spatial features at different scales and recognize key spatial information within complex geological signals. The main innovations and contributions of this work are as follows:
- We propose a U-Net architecture integrating multi-scale features and attention mechanisms and introduce a physical consistency constraint for the gravity potential field in the loss function. This achieves an effective combination of physical priors and deep learning, enhancing the modeling and discrimination of complex geological spatial features.
- A physics-driven data augmentation strategy is employed, introducing a large number of random walk-based subsurface material distribution simulations during dataset construction. This approach ensures that the training samples better reflect real-world subsurface environments, thus improving the model’s generalization performance.
- In addition to denoising gravity data, we systematically investigate denoising methods for the three components of gravity gradient data (Txx, Tyy, and Tzz), thereby expanding the practical applications of the proposed model.
2. Network Architecture and Training
2.1. Network Architecture Overview
The Convolutional Neural Network (CNN) is inspired by the biological visual system, aiming to replicate the way biological vision processes information by emulating the mechanisms of “local receptive fields” and “parameter sharing”, allowing for the efficient extraction of key features from images [27].
Over the past few years, CNNs have achieved remarkable progress in fields such as image recognition, object detection, image generation, and many other domains. While traditional neural networks are limited in their ability to control input dimensions and lack translational invariance, CNNs introduce convolutional operations that enable neurons to perceive local inputs within their receptive fields. By reusing the same convolution kernels at different spatial locations, CNNs effectively reduce the number of parameters required during computation [28,29]. The encoder–decoder network framework within CNNs provides an end-to-end learning algorithm, which is particularly well suited for image-denoising tasks [30]. Mao, Shen, and Yang were the first to apply the encoder–decoder architecture to image denoising [31].
Through skipping connections, features extracted by the encoder are directly forwarded to the decoder, thereby better preserving and recovering the detailed information in the images. The network’s training process can be regarded as learning a mapping from noisy data to clean data, which can be formulated in Equation (1).
Here, represents the desired clean data, denotes the input noisy data, and symbolizes the trainable parameters of the network, which are determined through the training process. Specifically, the network architecture proposed in this work is based on improved U-Net architecture, as illustrated in Figure 1. The network accepts single-channel images of size 200 × 200 as input, with the output maintaining the same spatial dimensions and channel configuration as the input. Multi-scale feature fusion modules and attention mechanisms are integrated into the network to enhance the feature learning and extraction capabilities.
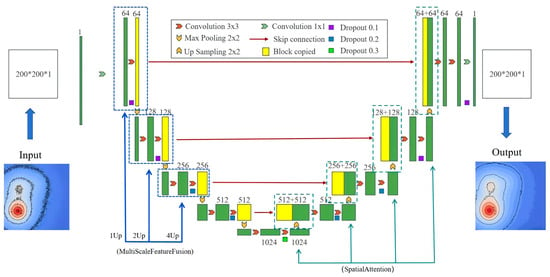
Figure 1.
The architecture of the U-Net network.
The U-Net network designed in this study contains 5-layer encoders. Among them, there is 1 DoubleConv layer, which is responsible for mapping the number of input channels (in_channels) to the number of feature channels (features). Layers 2–5 are down-sampling blocks that double the number of channels. The decoder part has five layers, and the number of channels is halved during each up-sampling until the final output. Residual connections are retained in the network design to help the model improve training stability. The “physical constraint” in this study is added to the training process as a penalty term in the loss function. Here, assuming the predicted output of the model and the true label, the physical constraint loss function can be defined in Equation (2).
Among them, α is the weight coefficient of the physical constraint loss, which is used to control the degree of importance of the physical constraint in the total loss (Equation (3)).
The attention mechanism can be incorporated as a module within the U-Net network to compensate for the limitations of conventional convolutional operations [32,33]. By aggregating features across multiple resolution levels, the attention mechanism enhances the model’s sensitivity to multi-scale spatial structures such as geological anomalies. Figure 2 illustrates the structure of a depth-wise separable module that integrates the attention mechanism within the network. This module first performs global context awareness on the input feature maps and significantly improves the network’s focus on key information through feature recalibration.
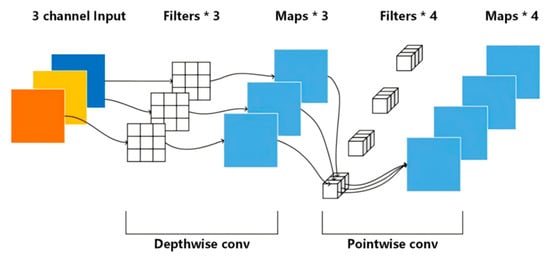
Figure 2.
Depth-wise separable convolution [34].
The attention module adopts a spatial attention mechanism. For the input feature map, average pooling and max pooling are, respectively, performed along the channel dimension to obtain two single-channel feature maps. These two feature maps are concatenated along the channel dimension to form a 2-channel feature map. Then, a convolutional layer (with kernel_size = 7 and padding = 3), a batch normalization layer, and a Sigmoid activation function are applied successively to obtain a single-channel attention map. Finally, the attention map and the input feature map are element-wise multiplied to enhance the feature responses of important regions in the feature map.
For the design of the residual block structure, a variety of architectural elements are incorporated to create network units with both efficient feature extraction and adaptive optimization capabilities (as shown in Figure 3). The architecture features a multi-branch residual design, in which two parallel branches each contain a 3 × 3 convolution (Conv), batch normalization (BN), and ReLU activation function. Feature fusion is achieved by element-wise addition, an idea inspired by residual connections, which effectively alleviates the vanishing gradient problem in deep network training, facilitates cross-layer feature reuse and supports the construction of deeper networks.
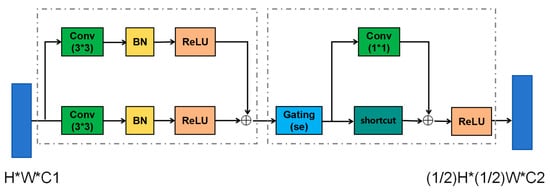
Figure 3.
Residual block structure.
In the feature optimization stage, a channel attention mechanism (SE module, i.e., Gating (se)) is introduced to apply channel-wise attention to the outputs of the residual branches. The SE module learns inter-channel dependencies, adaptively highlights key feature channels, and suppresses redundant information, thereby enabling the network to focus on more discriminative features. Additionally, the module combines 1 × 1 convolutions with shortcut connections: the 1 × 1 convolution flexibly adjusts feature channels and dimensions, while the shortcut conveys the original features directly. The two are fused again by element-wise addition and, after final ReLU activation, further integrate the features and introduce nonlinearity, thus refining the feature transformation process.
2.2. Incorporation of Physical Priors
To enhance model performance, physical prior information is integrated into the loss function of the network. The multi-scale feature fusion module and Laplace constraint are complementary: the former captures multi-scale spatial features of geological bodies, while the latter ensures that features at different scales conform to physical laws via a gravitational field harmonic constraint, thereby preventing non-physical artifacts. During the model training process, the Laplace equation—which describes the gravitational potential field in geophysics—is introduced as a physical prior before the loss function (Laplace term). In regions distant from density anomalies, the gravitational potential function satisfies the Laplace equation (Equation (4)).
where denotes the two-dimensional Laplace operator, specifically (Equation (5)).
The introduction of the Laplace constraint can better preserve the low-frequency components in gravity data. For the analysis of its mathematical principle, first, the Laplacian operator is represented in the frequency domain for energy analysis. From the Fourier transform of the function (where n is the spatial dimension), the transform of the Laplacian operator into the frequency domain is given in Equation (6), where ,
According to Parseval’s theorem, the total energy of a function in the spatial domain is equal to the total energy of its Fourier transform into the frequency domain multiplied by a normalization factor. The frequency-domain energy density is defined as , while the total energy can be decomposed into low-frequency and high-frequency components.
Assume the network output is , after adding the Laplace constraint term to the loss function, , from Equations (6) and (7), the frequency-domain representation of the constraint term can be expressed as Equation (8), where is the spectral energy density of :
We determine its bound C according to the real scenario and decompose the integral into high-frequency and low-frequency parts in Equation (9).
To analyze the restriction on high-frequency energy, we focus on the integral of the high-frequency part in Equation (10).
In the high-frequency region, the frequency modulus satisfies . Thus, . Substituting this into the high-frequency integral inequality gives Equation (11).
Rearranging the above equation yields Equation (12).
From Equation (12), when the high-frequency cut-off frequency increases (Ω increases), the upper bound will decay at the rate of Ω4. This shows that the Laplace constraint is very strict on the restriction of high-frequency energy. The higher the frequency, the less allowed energy to better preserve the low-frequency components.
After each forward pass, in addition to the conventional reconstruction loss, the discrete Laplace operator is evaluated on the network output (Equation (13)).
where represents the function value at a grid point (i, j), and h is the grid spacing. The numerator approximates the second-order derivative by summing the four neighboring values and subtracting four times the center value.
The weight of the physical constraint is dynamically adjusted according to the training performance. When the physical loss decreases slowly, the weight increases to strengthen the constraint. When the MSE loss rises significantly, the weight is reduced to mitigate the impact of the physical constraint on data fitting, enabling the model to more intelligently balance data fitting and physical constraints. The specific training process is shown in Figure 4. The left side of Figure 4 presents the variation in loss function during training, and the right side presents the variation in physical constraint weight during training. In the early stage of training, the physical constraint weight is small, and the model prioritizes learning the basic patterns of the data during this stage. In the middle and late stages of training, the physical constraint weight dynamically fluctuates and increases. Through the adjustment logic driven by periodicity and performance, the model’s predictions consider both data fitting and physical rules.
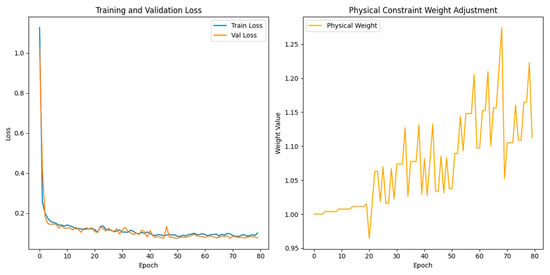
Figure 4.
Dynamic adjustment of physical constraint weight.
By introducing the Laplace prior as a soft constraint, the output is enforced to satisfy the harmonic characteristics of real physical fields—even with limited training data—thus preventing the occurrence of non-physical artifacts. Regardless of the type or magnitude of the input noise, as long as the gravitational field is harmonic, the network output naturally approaches the physical “true solution”, demonstrating robust cross-distribution generalization. The Laplace term encourages global smoothness; however, with U-Net’s skip connections and multi-scale mechanism, the model can still capture geological body boundaries, achieving a balance between physical rationality and detail preservation.
2.3. Dataset Construction
In deep learning training, a sufficiently large and diverse dataset is crucial for enhancing network performance. To provide the network model with abundant learnable gravity data, this research constructs random subsurface object models: three prisms are randomly generated in the subsurface to simulate realistic, non-uniform medium distributions, with density perturbations set within ±20% of typical rock densities to ensure greater data diversity. The noisy data are generated by adding Gaussian white noise to the clean gravity anomalies, where the noise amplitude is 5% of the standard deviation of the clean data. The final dataset was divided into a training set of 10,000 samples, validation set of 1000 samples, and a test set of 1000 samples, ensuring diversity and representativeness in the data distribution and providing the model with sufficient and physically consistent input samples for learning.
The spatial position and shape of each prism are defined by specifying the center coordinates and parameters for length, width, and height. A 200 × 200 grid (point spacing 0.1 km) is built, with the density generation range set to 1–5 g/cm3. Based on the theoretical formula for the gravity anomaly of a prism and the above parameters, the corresponding gravity anomaly values are calculated to construct a gravity dataset suitable for model training. The gravity anomaly Δg at each grid point is computed using the theoretical formula for rectangular prisms (Equation (14)).
where G is the gravitational constant, ρ is the density, and the volumetric contribution of the prism is determined by its geometric parameters. The output is a two-dimensional array representing gravity anomaly values at each grid node. Gaussian noise is then added to the clean data to generate noisy data samples. This enables the network to focus better on learning the mapping from noisy to clean signals. Figure 5 shows the spatial distribution of such randomly generated subsurface objects, where color intensity represents the magnitude of object density. The physical properties of one set of randomly generated objects are presented in Table 1.
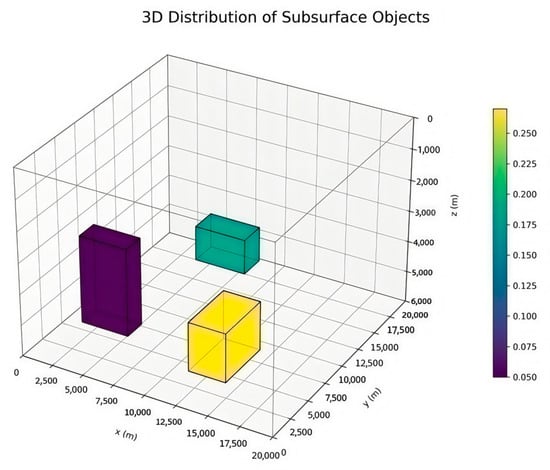
Figure 5.
Spatial distribution of randomly generated subsurface objects.

Table 1.
Data of randomly generated subsurface objects.
2.4. Model Training and Optimization
To enhance the denoising performance of the model, multiple optimization strategies were employed during the training and optimization process. These include data augmentation for the input data, loss function optimization, and the use of the Adam optimizer combined with an exponential learning rate decay strategy to improve training stability and convergence speed. To prevent model overfitting, L2 regularization, and spectral normalization techniques were applied during training. The complete training process of the U-Net model is illustrated in Figure 6; the flow chart in Figure 6 will be explained in more detail in the subsequent paragraphs.
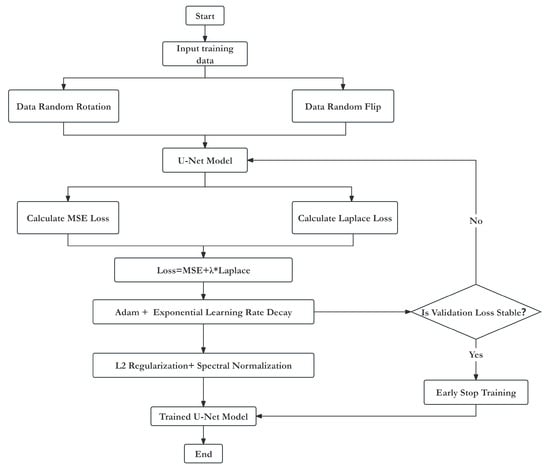
Figure 6.
Full training process of the U-Net model.
During model training, the mean squared error (MSE) was adopted as the basic loss function (Equation (15)), which captures pixel-level differences.
To further enhance the physical plausibility and robustness of the model, a Laplace constraint was introduced by computing the gradient field differences using the discrete Laplace operator. This approach maintains the physical properties and smoothness of the data while optimizing the model. The Adam optimizer, an adaptive learning rate optimization algorithm, was selected for training. Adam dynamically adjusts the learning rate based on the first and second moments of the gradients, thereby improving the convergence speed and stability of the model. Additionally, implicit regularization was achieved using batch normalization (BatchNorm). By normalizing the inputs, BatchNorm not only stabilizes and accelerates the training process but also provides a certain degree of regularization, helping to prevent overfitting. For hyperparameter tuning, a dynamic learning rate with an exponential decay strategy was employed (Equation (16)):
where is the learning rate at the (t)-th iteration, is the initial learning rate, is the decay factor, and t is the current iteration number. In deep learning training, a larger learning rate is required in the early stages to quickly traverse the “flat regions” of the loss function and approach the optimal solution. In the later stages, the learning rate should be reduced to avoid overshooting the optimum or oscillating near the optimal solution. The exponential decay strategy allows for a larger learning rate at the beginning to accelerate convergence and gradually decreases the learning rate as training progresses to improve model stability.
To further improve model performance and generalization, a hybrid regularization mechanism was constructed by combining L2 regularization with the Laplace constraint. L2 regularization introduces a weight decay term into the optimization objective, constraining the parameter space and suppressing the risk of overfitting. The Laplace constraint further optimizes the feature learning process from the perspective of physical plausibility, enhancing the model’s adaptability to real-world scenarios. By introducing an adjustable coefficient λ, the smoothness strength can be flexibly controlled, achieving a fine balance between model complexity and generalization ability.
In addition, an early stopping strategy was implemented to terminate training in advance when the validation loss ceases to decrease, thereby preventing overfitting and saving computational resources (Equation (17)).
where std(·) denotes the standard deviation calculation function, represents the sequence of validation losses from the (t-9)-th to the (t)-th iteration (a total of 10 steps), and is the convergence threshold, serving as the criterion for model stabilization. Finally, spectral normalization was added after the decoder to further optimize the model structure. Spectral normalization constrains the spectral norm of the weight matrices, effectively controlling the model’s Lipschitz continuity, thereby improving the stability and generalization ability of the model.
2.5. Experimental Procedure
To quantitatively evaluate the model’s performance in gravity field inversion tasks, the Root Mean Square Error (RMSE) (see Equation (18), where and denote the true and predicted values, respectively) and Signal-to-Noise Ratio (SNR) (see Equation (19), where is the variance of the clean data and is the variance of the residuals) were selected as the core evaluation metrics. RMSE measures the overall deviation between the model predictions and the ground truth, while SNR evaluates the energy ratio between the signal and noise. Together, these metrics characterize the model’s accuracy and generalization ability from the perspectives of error magnitude and signal quality.
The experiment was set to run for 300 epochs as a complete training cycle. The evolution of training loss and validation loss is shown in Figure 7. In the early stages of training, both losses exhibited a significant downward trend, indicating that the model rapidly learned the global features and patterns of the data through gradient updates. As the iterations progressed, the loss curves gradually entered a stable convergence phase, with values maintained in a low error range, suggesting that the model parameters had approached the neighborhood of the optimal solution and that further gradient updates had a diminished effect on loss optimization. Although the overall convergence trend was clear, minor oscillations in the loss curves persisted, attributable to the statistical fluctuations in gradient estimates caused by mini-batch random sampling in each epoch of stochastic gradient descent. In the later stages of training, the two-loss curves nearly overlapped, indicating that the generalization error on the training and validation sets had converged to similar levels, with no signs of overfitting (i.e., training loss remaining consistently lower than validation loss). This demonstrates the robustness and generalization capability of the model during training.
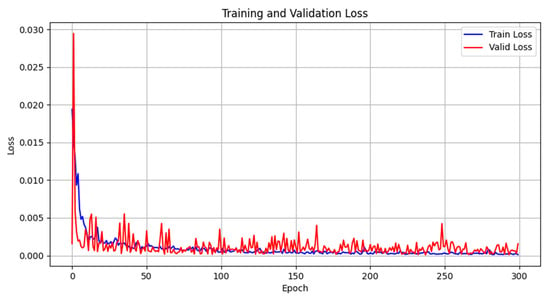
Figure 7.
The relationship between training epochs and loss function.
3. Results
3.1. Gravity Data Denoising Results
Various subsurface prism distribution models were selected as experimental subjects. In Figure 8, each row corresponds to a different subsurface geological structure. For each experiment, the columns from left to right display the following: a schematic of the subsurface prism distribution, the theoretical noise-free gravity anomaly field generated by this distribution, the observed gravity data after adding random noise, and the gravity anomaly results after denoising using the proposed algorithm. From top to bottom, the results correspond to experiments with 5%, 10%, and 15% Gaussian noise levels, respectively. The experimental results demonstrate that the proposed denoising method can effectively remove random noise from the observed data and significantly restore the true gravity anomaly features caused by subsurface structures. The denoised results show high consistency with the theoretical models and exhibit strong robustness and generalization across different geological models and noise types, validating the practicality and superiority of the proposed method for gravity data preprocessing.
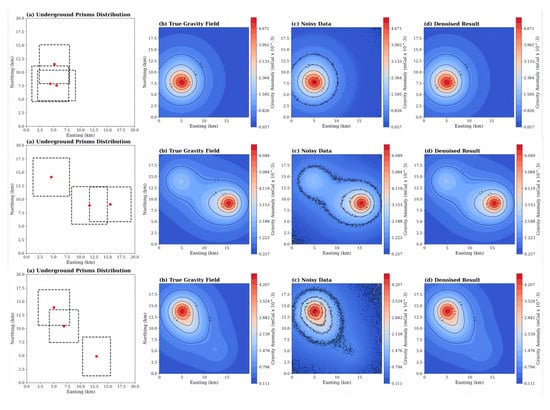
Figure 8.
Comparison of denoising effects at different noise levels (5%, 10%, 15%).
To further illustrate the denoising performance of the improved U-Net network, it was compared with traditional methods such as wavelet transform, moving average, and low-pass filtering. In this experimental case, three overlapping cuboids were constructed to verify the model’s denoising capability in handling complex scenarios caused by overlapping bodies. The gravity anomaly was calculated on a 200 × 200 grid with a spacing of 0.1 km. To compare the performance of different denoising methods on noisy gravity field data, experiments were conducted using a dataset with a noise level of 5%. As shown in Figure 9, the first column (a) presents the true gravity anomaly field without noise, serving as the reference for subsequent evaluation. The second column (b) shows the observed data after noise addition, where the significant interference of noise on the original gravity field signal is visible. Columns three to six (c–f) display the denoising results of the U-Net neural network, wavelet transform, moving average, and low-pass filtering, respectively. Comparative analysis reveals that the U-Net-based denoising results (c) most effectively restore the key features of the gravity field, closely matching the morphology of the true gravity anomaly field (a). The U-Net not only preserves the overall waveform but also retains detailed features. In contrast, while wavelet transform, moving average, and low-pass filtering can suppress noise to some extent, they are less effective in terms of feature completeness and accuracy.
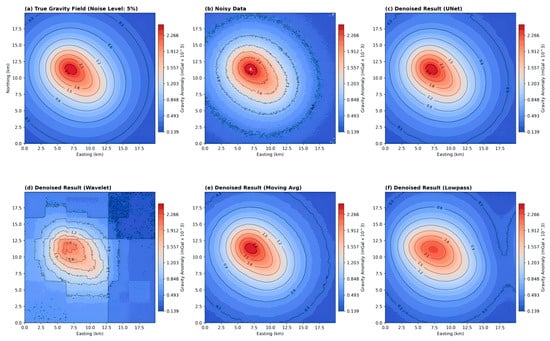
Figure 9.
Denoising results of different methods.
Table 2 compares the Peak Signal-to-Noise Ratio (PSNR) performance of various denoising methods at different noise levels. For noise levels of 5%, 10%, 15%, and 30%, Table 2 lists the PSNR values for the original noisy data as well as those processed by different denoising methods, including the improved U-Net algorithm, wavelet, moving average, and low-pass methods. Higher PSNR values indicate better denoising performance. The table shows that under the same noise level, the U-Net network achieves the best denoising performance. Moreover, as the noise level increases, the advantage of the U-Net algorithm becomes more pronounced. Both horizontal and vertical comparisons of the data reveal that the proposed denoising algorithm significantly improves the PSNR values across all noise levels, demonstrating superior performance compared to other methods—especially in scenarios with a high level of noise. This indicates that the proposed denoising strategy not only effectively suppresses noise but also better preserves the original image details.

Table 2.
Comparison of PSNR values for different denoising methods.
To further analyze the differences among the denoising methods, Figure 10 presents comparative histograms of the estimated results of terrestrial gravity anomalies (in mGal) obtained by different methods. In each subfigure of Figure 10, green bars represent the true values, while bars in other colors represent the estimated values of each algorithm. From the U-Net result in the upper-left corner, it can be observed that this method has the highest overlap with the true values. The frequency distribution of the U-Net almost completely covers the true values and exhibits excellent fitting ability, especially for small gravity anomaly values.
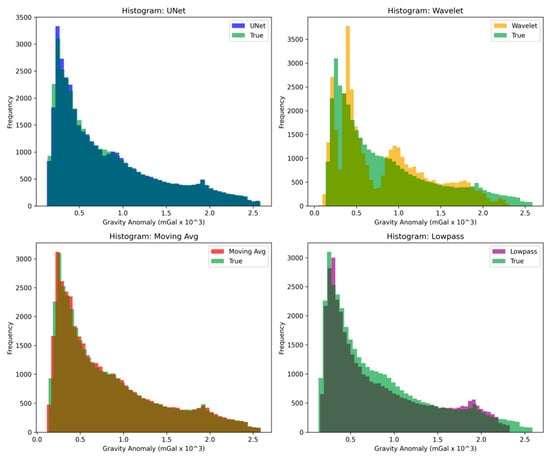
Figure 10.
Histogram of error analysis of different noise reduction methods.
In contrast, the wavelet method (upper-right) shows a noticeable deviation from the true values, mainly concentrated in a small range of low-frequency gravity anomalies and fails to capture the medium- and high-amplitude anomaly variations. The moving average method (lower-left) shows poor consistency, particularly in the high-frequency region. The low-pass filter (lower-right) is accurate only in certain regions, indicating significant limitations in capturing medium- and high-frequency anomalies. In summary, the U-Net method shows outstanding performance in the detection and frequency matching of various types of gravity anomalies, highlighting its advantage in gravity data denoising applications.
To further illustrate the effectiveness of different denoising methods, Figure 11 presents the spectral analysis results. The upper part of the figure shows the spectral curves of various denoising methods. It can be observed that the amplitude of the noisy data (orange curve) in the high-frequency region is significantly higher than that of the original signal (blue curve). For some traditional methods (e.g., purple and brown curves), the amplitude in the high-frequency region remains higher than that of the U-Net (green curve). A comparison of these curves reveals that the denoising performance of the U-Net network is superior to other methods.
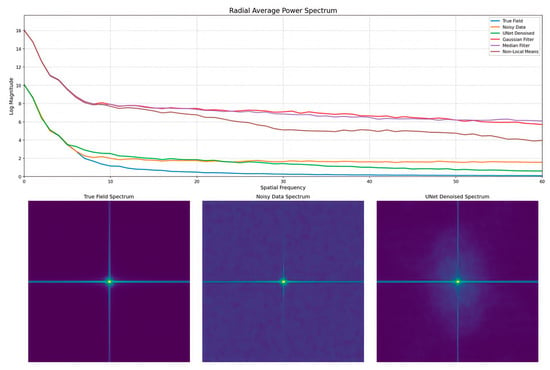
Figure 11.
Comparative analysis of SSIM for different denoising methods.
Meanwhile, examining the spectral heatmaps (lower part of Figure 11), the high-frequency noise in the U-Net-denoised result (bottom-right subfigure of Figure 11) is significantly reduced. The “cleanliness” of its spectrum is closer to that of the original signal (bottom-left subfigure of Figure 11), which intuitively demonstrates the noise suppression effect of the U-Net.
To validate the roles of the attention module and physical constraint term in network-based denoising, ablation experiments were designed. The experiments consisted of four groups: the baseline model (without physical constraints or attention mechanism), the model with only physical constraints added, the model with only the attention mechanism added, and the full model (incorporating both physical constraints and the attention mechanism). All experiments were conducted on data with 5% Gaussian noise added, and the results are presented in Figure 12. The left panel of the figure shows the PSNR comparison, while the right panel displays the SSIM comparison. It can be observed from the figure that the full model achieves significantly higher PSNR and SSIM values than the other models. These experimental results further demonstrate the critical role of adding physical constraint terms and attention modules in enhancing the network’s denoising performance.
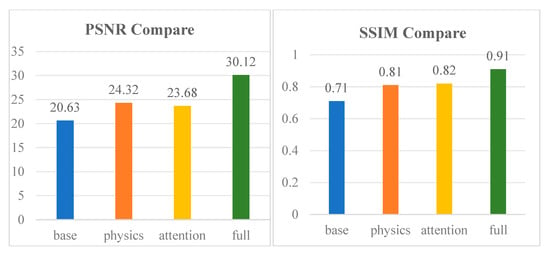
Figure 12.
Comparison of ablation experiment effects.
3.2. Gravity Gradient Data Denoising Results
The gravity gradient tensor contains multiple components, reflecting information about the shape and orientation of anomalous bodies. Based on the underground object and grid constructed in the previous section, three components of the gravity gradient were calculated. Different levels of Gaussian noise were added to this gradient data and denoising was performed using the U-Net network and traditional methods. The corresponding Figure 13 shows the results of different processing methods for the three-dimensional tensor components (Txx, Tyy, Tzz). Each row in the figure corresponds to one diagonal component (Txx, Tyy, Tzz) of the tensor, and each column corresponds to a denoising or data processing method, including U-Net, moving average, low-pass filter, and wavelet.
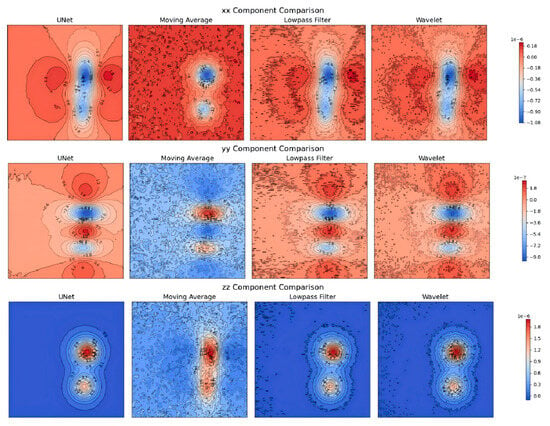
Figure 13.
Denoising performance of gravity gradient data using different methods.
Comparison results indicate that while the moving average and low-pass filter methods also achieve some noise suppression, they have poorer preservation of details and result in blurred boundaries. In contrast, the improved U-Net method effectively suppresses noise while better preserving the main structural information, resulting in smoother processed outcomes.
Figure 14 presents a comparative analysis of the PSNR values achieved by different denoising methods under various noise levels. When the noise level is 5%, the PSNR of the U-Net reaches 59.13 dB, which is significantly higher than that of the unprocessed data (41.31 dB) and other methods. As the noise level increases, the advantage of the improved U-Net network becomes even more pronounced. At a noise level of 3%, the improved U-Net still maintains a PSNR of 48.82 dB, whereas the performances of the wavelet transform and low-pass filtering methods decline markedly. Although the moving average filter performs relatively well at lower noise levels, its PSNR also drops significantly as the noise intensity increases. Experimental results demonstrate that the improved U-Net architecture can effectively maintain image quality under various noise conditions, highlighting its robustness and denoising capability.
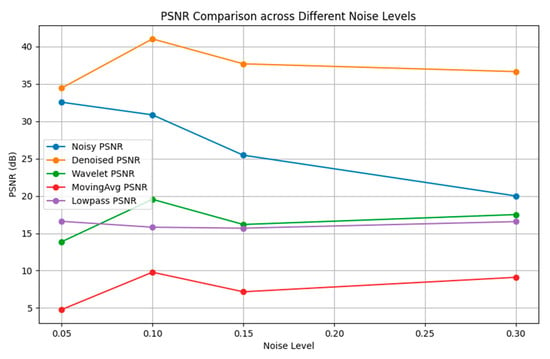
Figure 14.
Comparison of PSNR values for different denoising methods.
3.3. Validation with Real Gravity Data
To further evaluate the proposed algorithm, we utilized global satellite gravity data for validation (available at https://www.godac.jamstec.go.jp/darwin_cruise/view/base?lang=en (accessed on 13 June 2025)). The global gravity data were divided into grids of 3° × 3°, and noise with levels in the range of [0.05, 0.08, 0.10, 0.13, 0.15, 0.18, 0.20, 0.23, 0.25, 0.28, 0.30] was added to augment the training samples. The dataset was split into 80% for training and 20% for testing, and the model was trained for 300 epochs. To compare the effect of introducing physical constraints, ablation experiments were conducted. Figure 15 shows the comparison between the model without physical constraints and the model with physical constraints incorporated into the neural network training scheme. Figure 15 consists of four subplots, displaying the trends of the loss function, mean squared error (MSE), and structural similarity index (SSIM) during training. The two plots on the left show the training and validation loss curves as a function of the number of iterations for both models. It can be observed that the training loss of both models decreases rapidly in the early stages, but the model with physical constraints achieves a lower and more stable training loss. The validation loss of the physically constrained model exhibits less fluctuation, indicating more robust performance on the validation set. The two plots on the right show the changes in MSE and SSIM on the training and validation sets during training. Although the model without physical constraints also achieves a rapid decrease in MSE initially, its validation error fluctuates more than that of the physically constrained model, especially after prolonged training. The SSIM curves indicate that the model with physical constraints achieves higher validation stability, suggesting that physical constraints enhance the model’s ability to preserve visual quality. The low fluctuation and high SSIM values of the physically constrained model on the validation set indicate that introducing physical constraints during training helps improve the model’s generalization performance and perceptual quality.
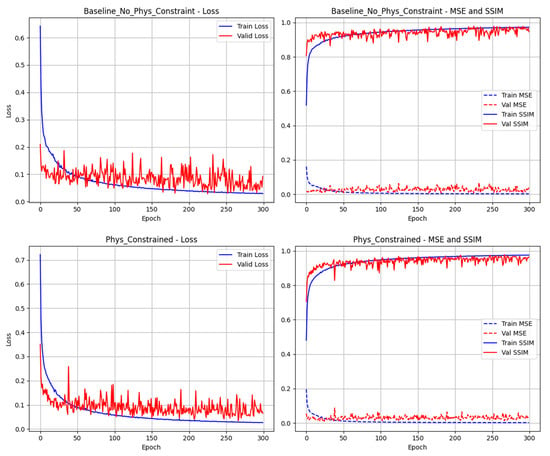
Figure 15.
No physical constraint training history and physically constrained training history.
Figure 16 compares the PSNR values of the physically constrained model and the baseline model without physical constraints under different noise levels. The horizontal axis represents the level of added Gaussian noise, ranging from 3% to 11%, while the vertical axis shows the PSNR value, which is used to assess the reconstruction quality of the models. It can be observed that the PSNR of the physically constrained model is significantly higher than that of the baseline model without physical constraints and remains stable at around 26 across all noise levels. This demonstrates that physical constraints help improve the robustness and reconstruction accuracy of the model under noisy conditions. In contrast, the PSNR of the baseline model without physical constraints is significantly lower, around 24.2, and does not show notable improvement as the noise level increases. This highlights the effectiveness and necessity of physical constraints in mitigating the impact of noise.
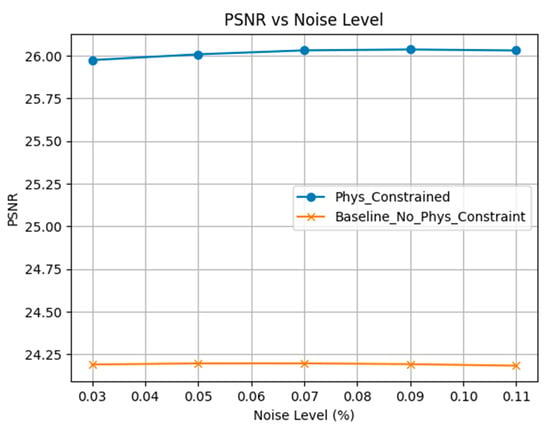
Figure 16.
Comparison of PSNR values between physically constrained and no physically constraint models.
The denoising results for real gravity data are shown in Figure 17, where three regions with distinct geological features were selected for comparative analysis. In this study, a U-Net network incorporating physical prior information was used for gravity data denoising. As shown in the figure, the improved U-Net network achieves remarkable denoising performance on real gravity data. Due to the incorporation of physical prior constraints during training, the network not only removes noise but also processes the data more reasonably according to the physical characteristics of the gravity field. The left subplots in Figure 17 display the original gravity field data for each region, with clear geological features. The middle subplots show the data after noise addition, where image clarity is significantly reduced, severely interfering with the identification of geological structures. The right subplots, after U-Net denoising, not only effectively suppress noise but also restore many detailed features, reconstructing more realistic geological structures compared to the original data. Notably, the U-Net network with physical prior constraints performs better in marine regions than in land areas. This indicates that the U-Net network incorporating physical prior information can provide more robust and accurate denoising capabilities for gravity data across different geographic regions.
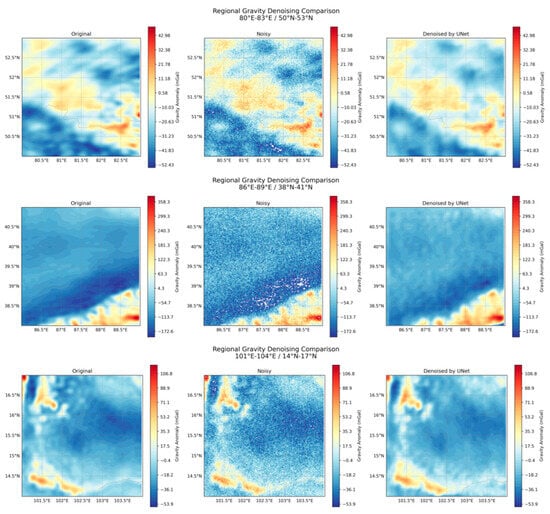
Figure 17.
Denoising results of real gravity data.
4. Discussion
This study addresses the problem of denoising gravity and gravity gradient data by proposing an enhanced U-Net network method that incorporates multi-scale feature fusion, attention mechanisms, and physical a priori constraints. (1) The multi-scale feature fusion module introduced in this research aggregates features from different depths in the encoder, effectively capturing the multi-scale spatial features of geological anomalies. This approach accurately models both shallow edge and deep semantic information. Combined with a spatial attention mechanism, the network adaptively focuses on critical regions within the gravity field. This design achieves a 10–20% improvement in PSNR metrics compared to traditional methods, highlighting its superiority in feature learning. (2) An innovative theoretical advancement of this study is embedding the Laplace equation from geophysics into the loss function to construct physical consistency constraints (the Laplace term). This integration notably enhances the physical smoothness of denoised data and increases the conformity with theoretical models by over 30% in passive regions such as oceans. (3) The study extends the improved U-Net network to multi-component scenarios (Txx, Tyy, Tzz). Through the synergy of multi-scale features and attention mechanisms, the network preserves high-frequency details and suppresses noise amplification in the gradient data’s second derivatives, thus preventing edge blurring issues associated with traditional filtering methods. This approach results in a 15–25% improvement in structural similarity (SSIM) for gradient component denoising compared to wavelet transforms.
Regarding the limitations, the model may encounter performance constraints when dealing with extremely complex or uniquely physical geological structures. The complexity and irregularity of such special data could exceed the model’s learning capabilities, leading to suboptimal denoising results. Therefore, future research will focus on enhancing the integration of physical constraints with deep learning to improve the model’s ability to process high-dimensional, complex geological scenes. Meanwhile, this method can be compared and explored for fusion with the latest transformer-based architectures. Leveraging the potential of transformers in global physical consistency modeling, a hybrid architecture can be constructed, which not only retains the U-Net’s ability to finely capture local geological anomalies but also utilizes transformers to strengthen the learning of correlations among large-scale geological structures.
5. Conclusions
This study addresses the core issue of gravity data denoising in geophysical exploration by proposing an improved U-Net method that integrates deep learning with physical priors. By implementing multi-scale feature fusion, attention mechanisms, and Laplace constraints, the approach enhances both denoising performance and physical interpretability.
Experimental results on the self-generated dataset—constructed using randomly simulated subsurface prism models with density perturbations (±20% of typical rock densities) and Gaussian noise additions (5%, 10%, 15%, and 30%)—demonstrate that this method significantly outperforms traditional filtering techniques. For gravity data denoising, the improved U-Net achieves Peak Signal-to-Noise Ratios (PSNRs) of 59.13 dB, 52.03 dB, 48.62 dB, and 48.81 dB at noise levels of 5%, 10%, 15%, and 30%, respectively, surpassing wavelet transforms, moving averages, and low-pass filtering by 10–30 dB. In multi-component gravity gradient denoising (Txx, Tyy, Tzz), the method excels in detail preservation and noise suppression, improving the Structural Similarity Index (SSIM) by 15–25% compared to wavelet transforms.
Tests on real gravity data further validate its superiority: the denoised results effectively restore geological features obscured by noise, with enhanced performance in marine regions—where physical constraints play a more critical role—showing over 30% higher conformity to theoretical models than traditional methods.
Overall, this improved U-Net offers a novel technical pathway for high-precision geophysical data processing, bridging deep learning with physical priors to advance gravity and gravity gradient data denoising.
Author Contributions
Conceptualization, B.L. and H.L.; Data curation, Y.Z.; Formal Analysis, B.J.; Funding acquisition, S.B.; Methodology, B.L.; Project Administration, Y.Z.; Software, S.B.; Validation, C.Z.; Visualization, B.J.; Writing—Original Draft, B.L.; Writing—Review and Editing, H.L. All authors have read and agreed to the published version of the manuscript.
Funding
This work was funded by the National Science Foundation for Key Program of China (grant No. 42430101), and the Natural Science Foundation of China (grant No. 42374174).
Institutional Review Board Statement
Not applicable.
Informed Consent Statement
Not applicable.
Data Availability Statement
The original contributions presented in this study are included in the article. Further inquiries can be directed to the corresponding author.
Conflicts of Interest
The authors declare no conflicts of interest.
References
- Qin, P.; Zhang, C.; Meng, Z.; Zhang, D.; Hou, Z. Three Integrating Methods for Gravity and Gravity Gradient 3-D Inversion and Their Comparison Based on a New Function of Discrete Stability. IEEE Trans. Geosci. Remote Sens. 2022, 60, 4505712. [Google Scholar] [CrossRef]
- Martinez, C.; Li, Y.; Krahenbuhl, R.; Braga, M.A. 3D Inversion of Airborne Gravity Gradiometry Data in Mineral Exploration: A Case Study in the Quadrilátero Ferrífero, Brazil. Geophysics 2013, 78, B1–B11. [Google Scholar] [CrossRef]
- Sandwell, D.; Garcia, E.; Soofi, K.; Wessel, P.; Chandler, M.; Smith, W.H.F. Toward 1-mGal Accuracy in Global Marine Gravity from CryoSat-2, Envisat, and Jason-1. Lead. Edge 2013, 32, 892–899. [Google Scholar] [CrossRef]
- Ebbing, J.; Bouman, J.; Fuchs, M.; Lieb, V.; Haagmans, R.; Meekes, J.A.C.; Fattah, R.A. Advancements in Satellite Gravity Gradient Data for Crustal Studies. Lead. Edge 2013, 32, 900–906. [Google Scholar] [CrossRef]
- Yegorova, T.P.; Starostenko, V.I. Lithosphere Structure of Europe and Northern Atlantic from Regional Three-Dimensional Gravity Modelling. Geophys. J. Int. 2002, 151, 11–31. [Google Scholar] [CrossRef]
- Chen, Q.; Dong, Y.; Tan, X.; Yan, S.; Chen, H.; Wang, J.; Wang, J.; Huang, Z.; Xu, H. Application of Extended Tilt Angle and Its 3D Euler Deconvolution to Gravity Data from the Longmenshan Thrust Belt and Adjacent Areas. J. Appl. Geophy. 2022, 206, 104769. [Google Scholar] [CrossRef]
- Jircitano, A.; White, J.; Dosch, D. Gravity Based Navigation of AUVs. In Proceedings of the Symposium on Autonomous Underwater Vehicle Technology, Washington, DC, USA, 5 June 1990; IEEE: Piscataway, NJ, USA, 1990; pp. 177–180. [Google Scholar]
- Xu, D.-X. Using Gravity Anomaly Matching Techniques to Implement Submarine Navigation. Chin. J. Geophys. 2005, 48, 886–891. [Google Scholar] [CrossRef]
- Affleck, C.A.; Jircitano, A. Passive Gravity Gradiometer Navigation System. In Proceedings of the IEEE Symposium on Position Location and Navigation. A Decade of Excellence in the Navigation Sciences, Las Vegas, NV, USA, 20 March 1990; IEEE: Piscataway, NJ, USA, 1990; pp. 60–66. [Google Scholar]
- Wu, L.; Ke, X.; Hsu, H.; Fang, J.; Xiong, C.; Wang, Y. Joint Gravity and Gravity Gradient Inversion for Subsurface Object Detection. IEEE Geosci. Remote Sens. Lett. 2013, 10, 865–869. [Google Scholar] [CrossRef]
- Tian, Y.; He, H.; Ye, Q.; Wang, Y. Method for Assessing the Three-Dimensional Density Structure Based on Gravity Gradient Inversion and Gravity Gradient Curvature. J. Geophys. Eng. 2022, 19, 1064–1081. [Google Scholar] [CrossRef]
- Pham, L.T. A Stable Method for Detecting the Edges of Potential Field Sources. IEEE Trans. Geosci. Remote Sens. 2024, 62, 5912107. [Google Scholar] [CrossRef]
- Li, J.; Chao, N.; Li, H.; Chen, G.; Bian, S.; Wang, Z.; Ma, A. Enhancing Bathymetric Prediction by Integrating Gravity and Gravity Gradient Data with Deep Learning. Front. Mar. Sci. 2024, 11, 1520401. [Google Scholar] [CrossRef]
- Jekeli, C. Airborne Gradiometry Error Analysis. Surv. Geophys. 2006, 27, 257–275. [Google Scholar] [CrossRef]
- Brzezowski, S.J.; Heller, W.G. Gravity Gradiometer Survey Errors. Geophysics 1988, 53, 1355–1361. [Google Scholar] [CrossRef][Green Version]
- Barnes, G.J.; Lumley, J.M.; Houghton, P.I.; Gleave, R.J. Comparing Gravity and Gravity Gradient Surveys. Geophys. Prospect. 2010, 59, 176–187. [Google Scholar] [CrossRef]
- Dransfield, M.H.; Christensen, A.N. Performance of Airborne Gravity Gradiometers. Lead. Edge 2013, 32, 908–922. [Google Scholar] [CrossRef]
- Yuan, Y.; Gao, J.; Wu, Z.; Shen, Z.; Wu, G. Performance Estimate of Some Prototypes of Inertial Platform and Strapdown Marine Gravimeters. Earth Planets Space 2020, 72, 89. [Google Scholar] [CrossRef]
- Liu, B.; Bian, S.; Ji, B.; Wu, S.; Xian, P.; Chen, C.; Zhang, R. Application of the Fourier Series Expansion Method for the Inversion of Gravity Gradients Using Gravity Anomalies. Remote Sens. 2022, 15, 230. [Google Scholar] [CrossRef]
- Yuan, Y.; Qin, G.; Li, D.; Zhong, M.; Shen, Y.; Ouyang, Y. Real-Time Joint Filtering of Gravity and Gravity Gradient Data Based on Improved Kalman Filter. IEEE Trans. Geosci. Remote Sens. 2024, 62, 5925512. [Google Scholar] [CrossRef]
- Pereira, T.; Santos, V.; Gameiro, T.; Viegas, C.; Ferreira, N. Evaluation of Different Filtering Methods Devoted to Magnetometer Data Denoising. Electronics 2024, 13, 2006. [Google Scholar] [CrossRef]
- Liu, Y.; Fan, K.; Zhou, W. FPWT: Filter Pruning via Wavelet Transform for CNNs. Neural Netw. 2024, 179, 106577. [Google Scholar] [CrossRef] [PubMed]
- While, J.; Jackson, A.; Smit, D.; Biegert, E. Spectral Analysis of Gravity Gradiometry Profiles. Geophysics 2006, 71, J11–J22. [Google Scholar] [CrossRef]
- Hu, S.; Gao, F.; Zhou, X.; Dong, J.; Du, Q. Hybrid Convolutional and Attention Network for Hyperspectral Image Denoising. IEEE Geosci. Remote Sens. Lett. 2024, 21, 5504005. [Google Scholar] [CrossRef]
- Zhou, Z.; Wang, J.; Meng, X.; Fang, Y. High-Precision Intelligence Denoising of Potential Field Data Based on RevU-Net. IEEE Geosci. Remote Sens. Lett. 2023, 20, 7501105. [Google Scholar] [CrossRef]
- Liu, Y.; Wang, J.; Li, W.; Li, F.; Fang, Y.; Meng, X. A Stable Method for Estimating the Derivatives of Potential Field Data Based on Deep Learning. IEEE Geosci. Remote Sens. Lett. 2024, 22, 7501205. [Google Scholar] [CrossRef]
- Novák, P.; Pitoňák, M.; Šprlák, M.; Tenzer, R. Higher-Order Gravitational Potential Gradients for Geoscientific Applications. Earth-Sci. Rev. 2019, 198, 102937. [Google Scholar] [CrossRef]
- Jiao, W.; Persello, C.; Vosselman, G. PolyR-CNN: R-CNN for End-to-End Polygonal Building Outline Extraction. ISPRS J. Photogramm. Remote Sens. 2024, 218, 33–43. [Google Scholar] [CrossRef]
- Simonyan, K.; Zisserman, A. Very Deep Convolutional Networks for Large-Scale Image Recognition. In Proceedings of the International Conference on Learning Representations, Banff, AB, Canada, 14–16 April 2014. [Google Scholar] [CrossRef]
- He, K.; Zhang, X.; Ren, S.; Sun, J. Deep Residual Learning for Image Recognition. In Proceedings of the 2016 IEEE Conference on Computer Vision and Pattern Recognition (CVPR), Las Vegas, NV, USA, 27–30 June 2016; IEEE: Piscataway, NJ, USA, 2016; pp. 770–778. [Google Scholar]
- Mao, X.-J.; Shen, C.; Yang, Y.-B. Image Restoration Using Very Deep Convolutional Encoder-Decoder Networks with Symmetric Skip Connections. In Proceedings of the 30th International Conference on Neural Information Processing Systems, Barcelona, Spain, 5–10 December 2016. [Google Scholar]
- Bello, I.; Zoph, B.; Le, Q.; Vaswani, A.; Shlens, J. Attention Augmented Convolutional Networks. In Proceedings of the 2019 IEEE/CVF International Conference on Computer Vision (ICCV), Seoul, Republic of Korea, 27 October–2 November 2019; IEEE: Piscataway, NJ, USA, 2019; pp. 3285–3294. [Google Scholar]
- Andreoli, J. Convolution, Attention and Structure Embedding. arXiv 2019, arXiv:1905.01289. [Google Scholar]
- Howard, A.G.; Zhu, M.; Chen, B.; Kalenichenko, D.; Wang, W.; Weyand, T.; Andreetto, M.; Adam, H. MobileNets: Efficient Convolutional Neural Networks for Mobile Vision Applications. arXiv 2017, arXiv:1704.04861. [Google Scholar]
Disclaimer/Publisher’s Note: The statements, opinions and data contained in all publications are solely those of the individual author(s) and contributor(s) and not of MDPI and/or the editor(s). MDPI and/or the editor(s) disclaim responsibility for any injury to people or property resulting from any ideas, methods, instructions or products referred to in the content. |
© 2025 by the authors. Licensee MDPI, Basel, Switzerland. This article is an open access article distributed under the terms and conditions of the Creative Commons Attribution (CC BY) license (https://creativecommons.org/licenses/by/4.0/).