Article

Mechanical Properties and Failure Mechanisms of Sandstone Under Combined Action of Cyclic Loading and Freeze–Thaw

School of Resources & Safety Engineering, Central South University, Changsha 410083, China
*
Authors to whom correspondence should be addressed.
Appl. Sci. 2025, 15(14), 7942; https://doi.org/10.3390/app15147942
Submission received: 10 June 2025 / Revised: 10 July 2025 / Accepted: 14 July 2025 / Published: 16 July 2025

Abstract

In high-elevation mining areas, the roadbeds of certain surface ore haul roads are predominantly composed of sandstone. These sandstones are exposed to cold climatic conditions for long periods and are highly susceptible to erosion by the effects of freeze–thaw, which can degrade their support properties. This paper investigates the mechanism of strength deterioration of sandstone containing prefabricated cracks under cyclic loading and unloading after experiencing freeze–thaw. Sandstone specimens containing prefabricated cracks were prepared and subjected to 0, 20, 40, 60, and 80 freeze–thaw cycle tests. The strength changes were tested, and the crack extension process was analyzed using numerical simulation techniques. The study results show the following: 1. The wave propagation speed within the sandstone is more sensitive to changes in the number of freeze–thaw cycles. In contrast, mass damage shows significant changes only when more freeze–thaw cycles are experienced. 2. As the number of freeze–thaw cycles increases, the frequency of energy release from the numerical model accelerates. 3. The trend of the Cumulative Strain Difference ( ε c ) reflects that the plastic strain difference between numerical simulation and actual measurement gradually decreases with increasing stress cycle level. 4. With the increase in freeze–thaw cycles, the damage morphology of the specimen undergoes a noticeable change, which is gradually transformed from monoclinic shear damage to X-shaped conjugate surface shear damage. 5. The number of tensile cracks dominated throughout the cyclic loading and unloading process, but with the increase in freeze–thaw cycles, the percentage of shear cracks increased. As the freeze–thaw cycles increase, sandstones are more inclined to undergo shear damage. These findings are important guidelines for road design and maintenance in alpine mining areas.

1. Introduction

In the alpine regions of China, the slopes and roadbeds of some railroads, highways, and other infrastructures are dominated by sandstone. In such an environment, the alternation of seasons and day–night cycle leads to sandstone being under freeze–thaw conditions for an extended period [1]. Under the influence of cyclic loading, its internal damage and strength weakening mechanism are of great significance in guiding the project’s construction [2]. Currently, many methods exist to study the evolution of internal cracks in rocks, mainly acoustic emission, CT scanning, and scanning electron microscope (SEM). Some scholars proved the feasibility of these methods in their studies. Martínez et al. [3] carried out freeze–thaw of carbonate rocks and investigated the changes in the microstructure of the rocks after freeze–thaw with the help of the scanning electron microscope (SEM) technique. Song et al. [4] carried out freeze–thaw tests on cracked sandstones in two ways, namely, water-saturated and ice-saturated, and analyzed the crack extensions under the action of freeze–thaw by applying the CT scanning method. Jiang et al. [5] investigated the damage during freeze–thaw of sandstone under different hydration environments with the help of nuclear magnetic resonance and acoustic emission techniques. Chen et al. [6] analyzed the generation of freeze–thaw rock cracks using the laser scanning microscope and digital image correlation (DIC) analysis techniques. They found that the cracks’ depth, width, and surface area were positively correlated with the number of freeze–thaw cycles. The above studies have achieved excellent results. However, these methods have limitations in observing the spatial location and sequence of crack generation, which can be effectively solved using particle flow numerical simulation software [7]. Particle flow numerical simulation software is based on the discrete element method, which can observe the occurrence and evolution of cracks from a microscopic point of view and has certain advantages in studying crack extension.
Using particle flow software to simulate rock freeze–thaw, researchers can visualize and analyze the types of cracks, crack extension paths, and energy conversion mechanisms generated during this process. Therefore, many scholars have carried out research in this area. Some scholars [8] innovatively adopted the Particle Expansion Model (PEM) to simulate the freeze–thaw effect inside the rock due to the change of freezing and swelling force and achieved remarkable results. Meanwhile, some scholars have simulated the freeze–thaw cycle of rocks using the built-in thermal calculation module of PFC6.0 software. This simulation method is closer to the freeze–thaw process of rocks in the natural environment, which significantly improves the realism of the simulation [9,10,11,12].
The numerical simulation technique is also an effective method to simulate the mechanical behavior of rocks under complex loading. Abdolghanizadeh et al. [13] analyzed the crack extension mechanism of granite under ultra-high frequency (UHF) fatigue loading through indoor tests and PFC2D numerical simulation. Wang et al. [14] used particle flow software to simulate the sandstone containing intersecting fractures and studied the damage characteristics of specimens under the influence of intersecting fractures. Biankang et al. [15] simulated the unloading process of shale under different water-saturated states based on PFC2D, which revealed the evolution of internal cracks in shale under different unloading stages. It is worth noting that most of the current studies focus on the uniaxial strength changes of rocks under freeze–thaw conditions [16,17,18,19,20]. In contrast, exploring the mechanical behavior of rocks under cyclic loading conditions is still insufficient.
Given this, the thermal calculation module of PFC software is used in this paper to simulate the freeze–thaw of sandstone. Constant lower limit cyclic loading and unloading experiments were performed on the freeze–thawed sandstone. This study aims to reveal sandstone’s damage mechanism and fracture expansion characteristics after freeze–thaw cycles and complex loading to provide theoretical support and reference for engineering design and maintenance in related fields.

2. Materials and Methods

2.1. Indoor Testing Program

The rock is sandstone, taken from a mine. A crack is machined in the center of the entire rock sample. The crack runs through the sample, inclines 45°, is 2 mm long, and 0.2 mm wide. The rock samples were then divided into 5 groups, namely, freeze–thaw 0 times (i.e., without freeze–thaw treatment), 20 times, 40 times, 60 times, and 80 times groups, to simulate sandstones with different degrees of freezing in the natural environment. A freeze–thaw tester is used to freeze–thaw sandstone specimens. The specific operation of freeze–thaw is as follows: the sandstone specimens are frozen in the air, and after the freezing is completed, the specimens are immersed in water to warm up and melt slowly. The freezing temperature is set to −20 °C, and the melting temperature is set to 20 °C. There are 4 stages in a freeze–thaw cycle. In the first stage, the sandstone specimens were slowly cooled to −20 °C. In the second stage, the specimens were frozen at −20 °C for 4 h to ensure they were fully frozen. In the third stage, the water in the freeze–thaw tester tank was returned to the freeze–thaw box to submerge the sandstone specimens so that they were slowly warmed up to 20 °C. In the fourth stage, the temperature was kept at 20 °C for 4 h to allow the sandstone specimens to be fully thawed. The above process is a complete freeze–thaw cycle, repeated until the preset number of freeze–thaws is reached. The temperature change process is shown in Figure 1.
Figure 2 shows the damage pattern of some sandstones after being subjected to freeze–thaw cycles.
After the freeze–thaw cycle test, the sandstones were dried using a drying oven. Then, the mass of the sandstone specimens was measured using an electronic balance, and the sandstones’ wave velocity was measured using a wave velocity meter. The measuring instruments used are shown in Figure 3.
The sandstone wave velocity was calculated by Equation (1).
V = L t p t 0
where V is the longitudinal wave velocity, [m/s];
L is the gap between the center points of the transmitting and receiving transducers, [m];
t p is the propagation time of the longitudinal wave in the specimen, [s];
t 0 is the zero delay time of the instrument system, [s].
To assess the effect of sandstone by the freeze–thaw cycles, two metrics, Mass Damage Factor ( D m ) and Wave Velocity Damage Factor ( D v ), were selected to measure the changes in sandstone specimens. These two indicators are calculated as shown in Equations (2) and (3).
D m = m 0 ¯ m t ¯ m 0 ¯
D v = V ¯ 0 V ¯ t V ¯ 0
where D m is the Mass Damage Factor;
m 0 ¯ is the average mass of the sandstone without freeze–thaw and m t ¯ is the average mass after the freeze–thaw cycle, [kg];
D v is the Wave Velocity Damage Factor;
V ¯ 0 is the average wave velocity of the sandstone without freeze–thaw and V ¯ t is the average wave velocity after the freeze–thaw cycle, [m/s].
Before the cyclic loading test starts, the first task is to clarify the cyclic loading methods. Through reading the references [21,22,23,24,25,26,27], we learned that there are various cyclic loading methods. The main methods are equal amplitude, graded, constant lower limit, variable lower limit cyclic loading and unloading, and so on. To simulate the change rule of the load on the roadbed during regular use, we adopted the constant lower limit cyclic loading and unloading method to study sandstone’s mechanical properties and damage mechanism. Figure 4 shows axial stress change with time during constant lower limit cyclic loading and unloading, where n indicates the cycle level.
Previous studies have shown that the whole stress–strain curve of sandstone obtained by cyclic loading and unloading tests can be mainly divided into 5 stages (Figure 5). The 5 stages are as follows: Compacting Stage (OA), Elastic Deformation Stage (AB), Crack Stable Expansion Stage (BC), Crack Unstable Expansion Stage (CD), and Destruction Stage (DF). Crack extension and stress–strain curves behave differently at different stages.

2.2. Numerical Modeling

PFC is a numerical simulation software based on the particle discrete element method. The particle discrete element method simplifies the complex mechanical behavior of reality to the mechanical representation of a large number of small particles. The linear parallel bond model is a mathematical method for describing the mechanical behavior between discrete particles. The core of the linear parallel bond model is the bond between the numerous particles. The bond transmits not only forces but also moments. As shown in Figure 6, two bonded particles may be subjected to a force in different directions in the linear parallel bond model (Linear Parallel Bond Model). These parameters mainly determine the bond’s strength: Pb_ten, Pb_coh, Emod, and Pb_fa. If this force exceeds the set bond strength, various types of ruptures occur in the bond between the particles. PFC can record this rupture and label it as different types of damage. A large number of small breaks eventually form macroscopic cracks.
PFC3D requires many more particles than PFC2D to show the crack extension process accurately. The particle increase consumes much computer memory, leading to computational inefficiency. PFC2D was chosen as the simulation tool based on research objectives and computational cost savings.
The numerical model was modeled according to the actual parameters. A rectangular specimen of 50 mm × 100 mm was constructed in PFC2D, where the particle size range was 0.25–0.5 mm, and the total number of particles generated ranged between 9000 and 10,000. We classify particles smaller than 0.30 mm as water particles and particles from 0.30 mm to 0.50 mm as rock particles. To reduce simulation errors, the ratio of the model (RA) [28] was calculated so that the particle size did not affect the macromechanical properties. The ratio of the numerical model was calculated using Equation (4).
R A = R m a x R m i n
where R m a x is the maximum particle size, [mm];
R m i n is the minimum particle size, [mm].
The particle numbers meet the requirements of numerical calculations, the RA = 2.0 (the recommended value is above 1.25) was calculated by substituting the specific values. The prefabricated crack was generated after the particles were cemented, and the linear parallel bond model (Linear Parallel Bond Model) was selected for the cementation model. Some scholars [29] have shown that this bond model can very well simulate the properties of the rock.
The selection of numerical model parameters needs to be based on experimental parameters. To obtain the mechanical parameters needed for modeling, we took three sandstone specimens without freeze–thaw cycles for uniaxial compression tests. The experimental results are shown in Table 1.
According to the experimental results, the trial-and-error method was used to select the model parameters. Subsequently, uniaxial compression simulation was carried out on the model. The stress–strain curve was made according to the simulation results and compared with the experimentally derived stress–strain curve (Figure 7).
The model generated by PFC software does not have a compaction phase during uniaxial compression. In contrast, sandstone in its natural state has a complex composition, and its interior has certain pore spaces, joints, and other defects. Sandstone cannot be regarded as a purely ideal elastic body, and its stress–strain curve has a compacting phase. Therefore, the simulated curves do not precisely overlap with the measured curves [30]. Parameter calibration aims to confirm whether the uniaxial compressive strength and modulus of elasticity are consistent. From the fitting results of the two curves, the effect of parameter calibration meets the basic requirements of numerical simulation. The specific parameters of the numerical simulation are shown in Table 2. In Table 2, Pb_fa refers to the angle of internal friction of the rock. Emod refers to the modulus of elasticity of the rock. Fric is the coefficient of friction between the particles. Pb_ten refers to the tensile strength of the rock. Pb_coh refers to the cohesive force of the rock.

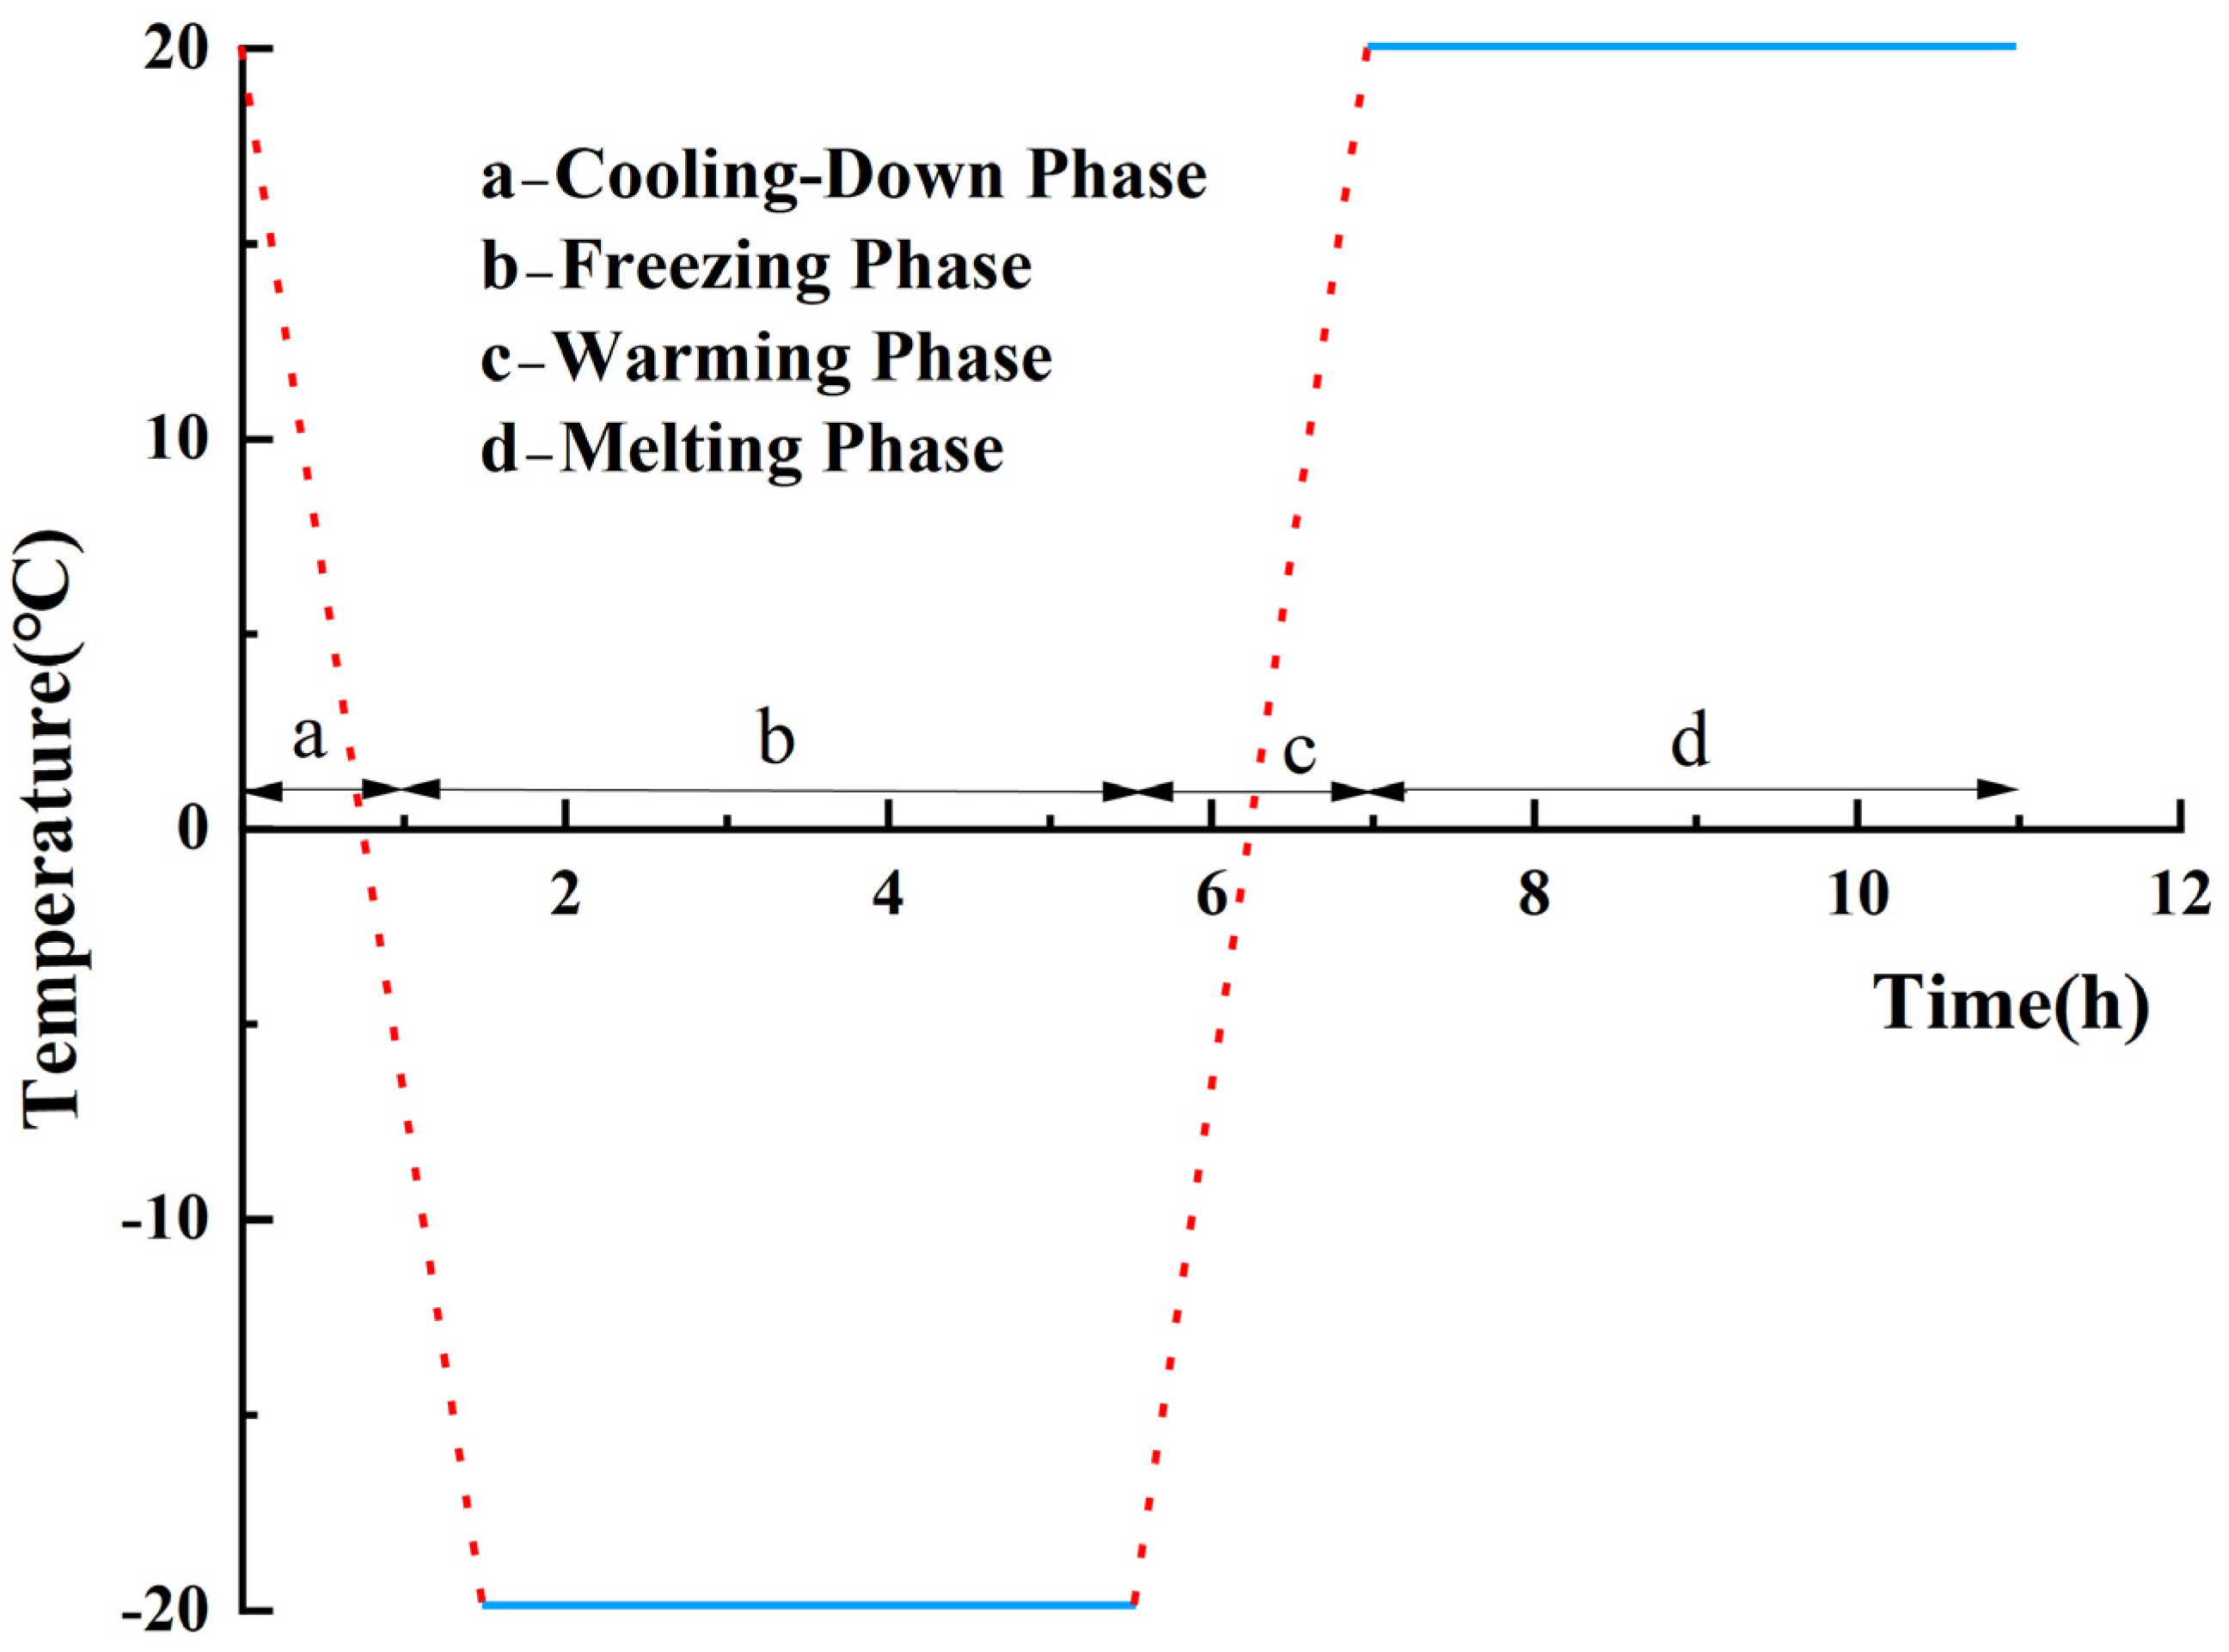
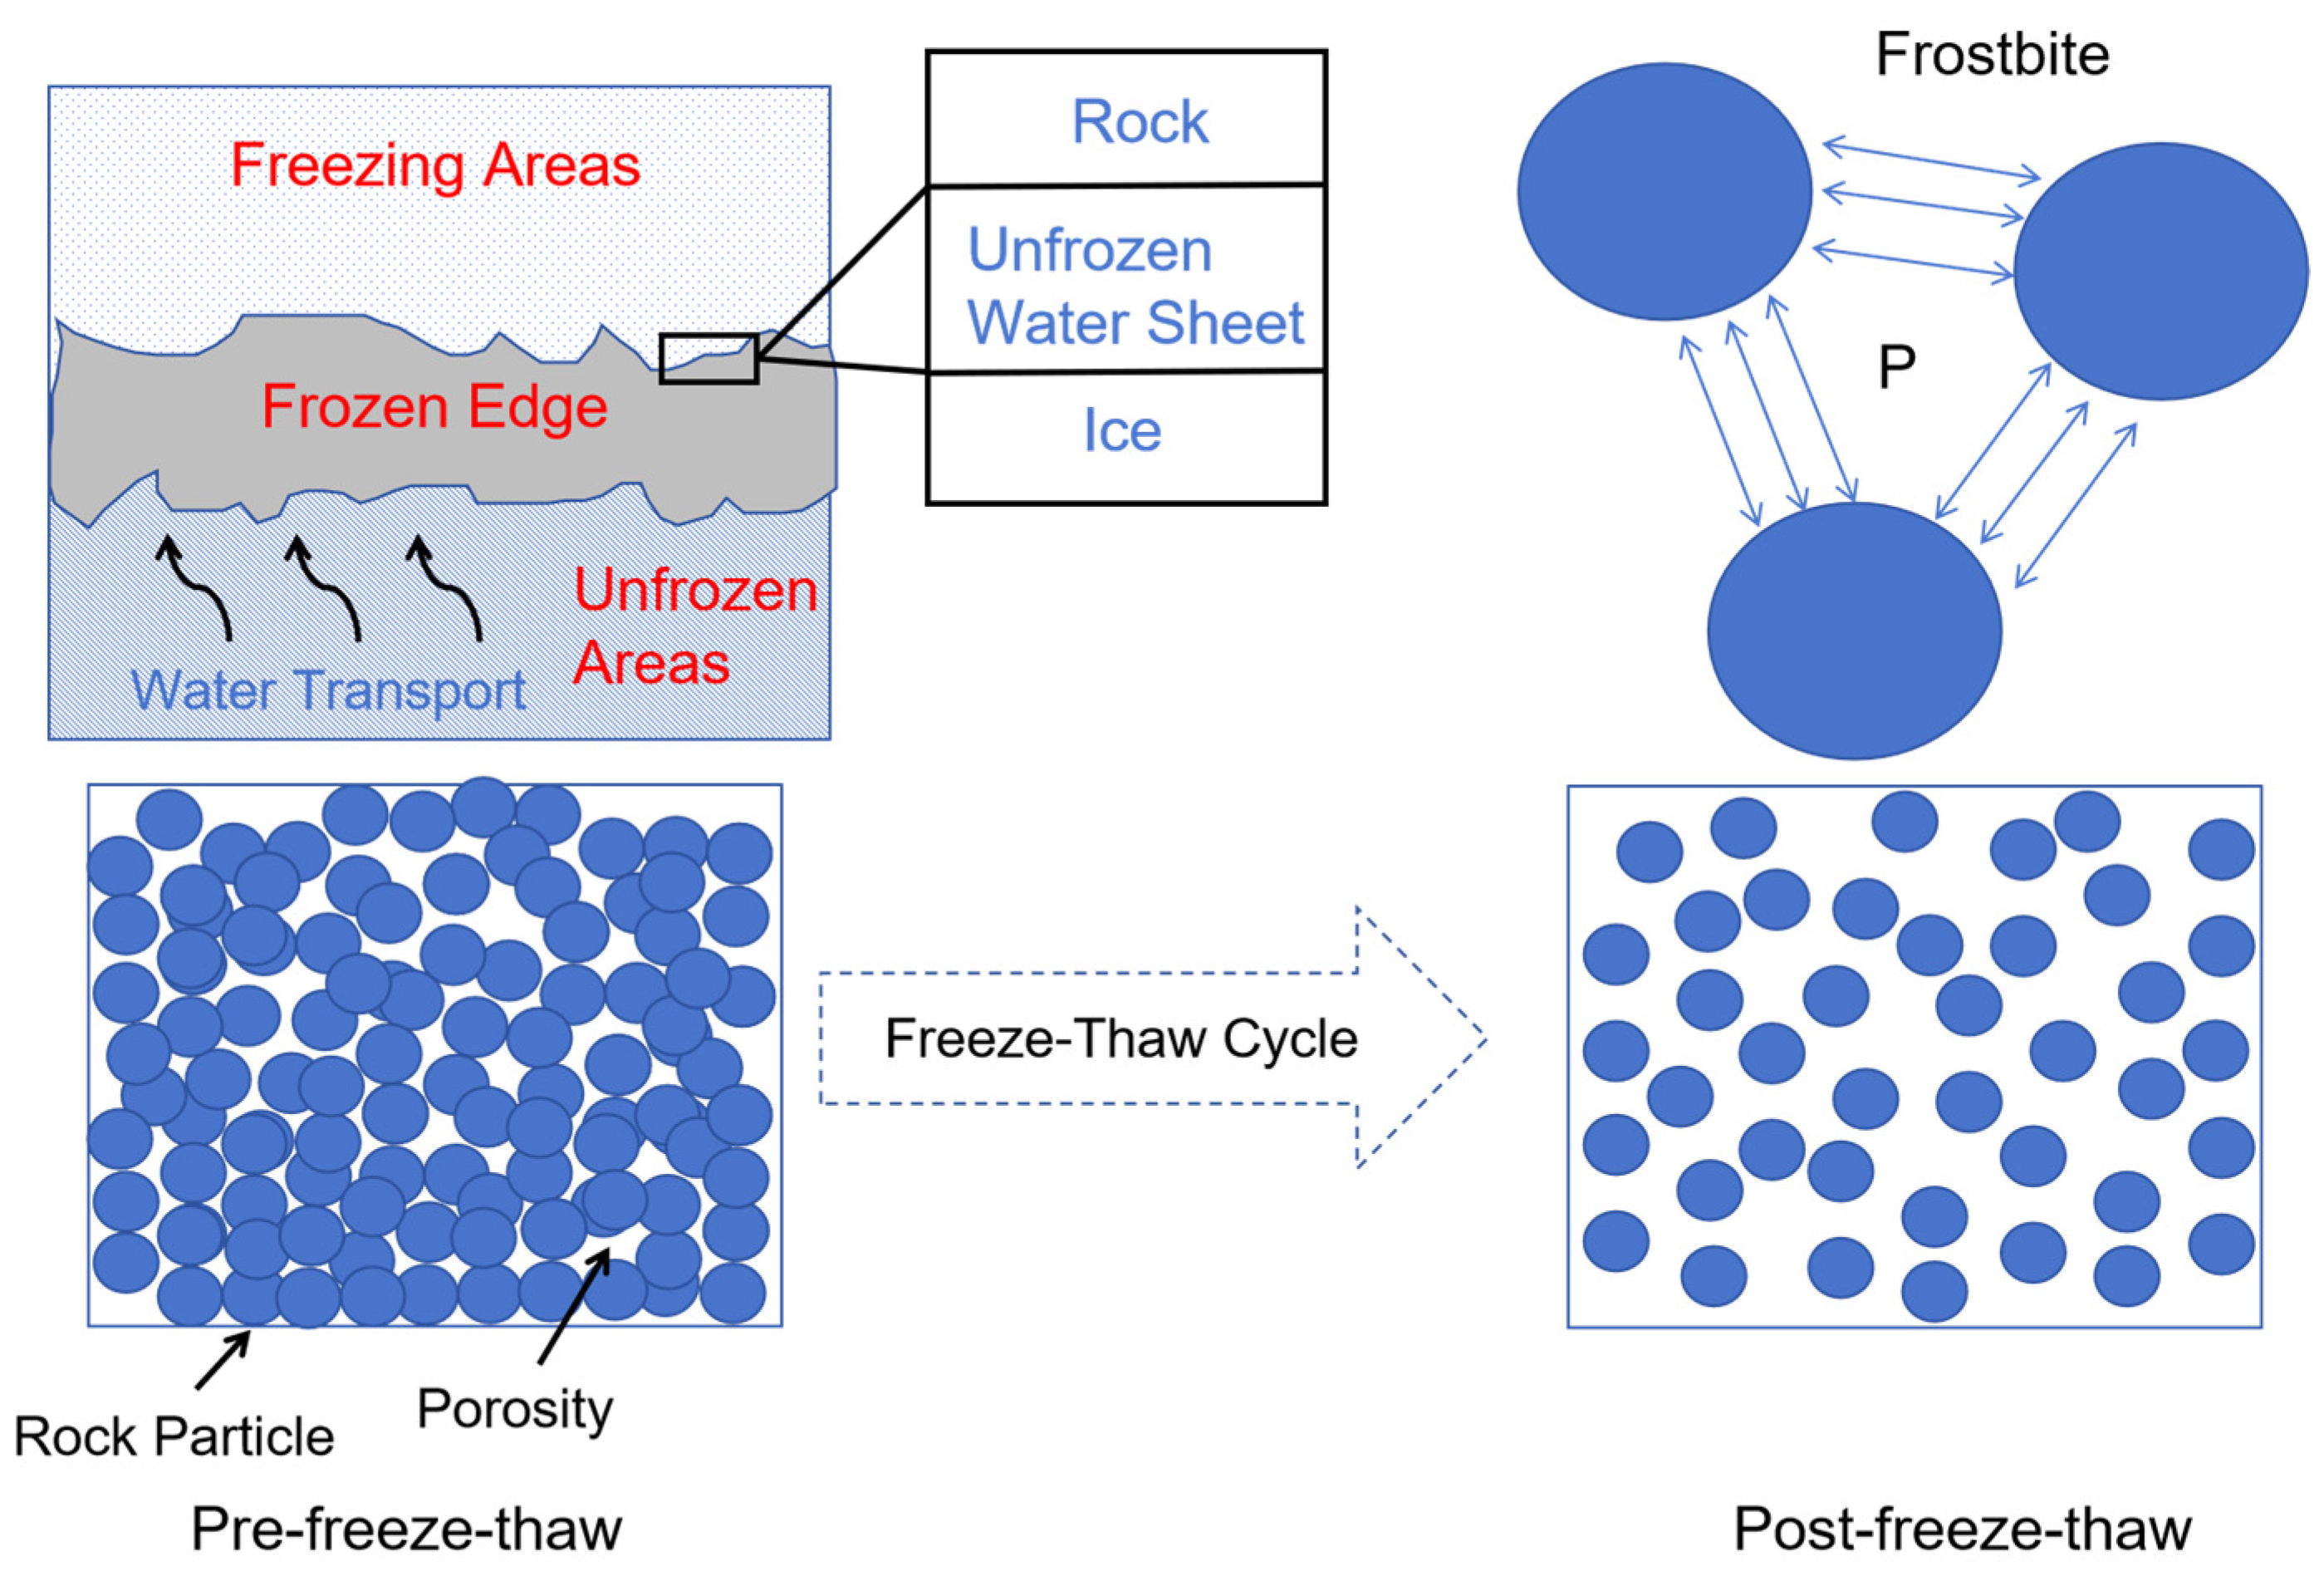
2.3. Freeze–Thaw Cycle Simulation

In PFC, the heat transfer differential equation of the thermal calculation module is derived based on the continuity equation and Fourier’s law of heat conduction. The following assumptions are present in the thermal calculation module of the PFC: 1. The strain of the particles due to the temperature does not affect the heat transfer. 2. No thermal radiation or convection occurs between particles during the heat transfer process [31]. The heat transfer differential equation is expressed as Equation (5):
q i x i + q v = ρ C v + T t
where q i is the heat flow vector, [W/m2];
q v is the thermal power density, [W/m3];
ρ is the density, [kg/m3];
C v is the specific heat capacity, [J/kg°C];
T is the temperature, [°C].
In PFC, the relationship between the heat flow vector and the temperature gradient can be expressed by Equation (6) according to Fourier’s law for continuous media:
q i = k i j T x j
where k i j is the heat transfer tensor, [W/m°C].
The strain of particles in PFC is due to thermal expansion. The linear parallel bond model (Linear Parallel Bond Model) will also consider the particles’ thermal expansion. The expression is as Equation (7).
R = α R T
where R is the amount of change in particle size, [mm];
α is the coefficient of thermal expansion of the particles, [1/K];
R is the initial particle size of the particles, [mm];
T is the temperature change, [K].
The PFC implements the model’s thermal calculation process under different conditions by assigning three parameter values (thermal resistance, linear expansion coefficient, and temperature). In a freeze–thaw cycle, the process of size change of particles can be represented by the following process [32]. The particle size decreases during cooling and increases during warming. The change in particle size leads to a change in the Contact Force and a weakening of the bond strength between the particles. The process can be seen in Figure 8.
Combined with the experimental data, the thermal calculation parameters are derived as shown in Table 3.
In the natural state, the heat exchange between the sandstone and the environment occurs from outside to inside. Therefore, the simulation uses changing the temperature of the model’s outer surface to allow spontaneous heat transfer to the interior and simulate the heat transfer process under natural conditions. The thermodynamic calculation module was enabled to simulate freeze–thaw cycles, and Figure 9 is a temperature change process graph of the model.

3. Results and Discussion

3.1. Mass and Wave Velocity Damage Analysis

Table 4 shows the mass and wave velocity loss results calculated using Equations (2) and (3). Figure 10 shows the trend change in mass versus wave velocity damage after processing the data from Table 4. Three sandstone specimens were set up for each group of freeze–thaw temperatures. The specimens were numbered F-T-X-Y, where X denotes the number of freeze–thaw cycles, and Y represents the serial number of sandstones under the same grouping.
According to Figure 10, with the increase in freeze–thaw cycles, the Mass Damage Factor ( D m ) generally shows an increasing trend, but the growth rate is different at different stages. Specifically, when the number of freeze–thaw cycles is lower than 60, the Mass Damage Factor’s growth is gentler. The Mass Damage Factor increased from 0.28% to 0.30% during the phase of 20 to 40 freeze–thaw cycles and reached 0.43% during the period of 40 to 60 cycles. However, when the freeze–thaw cycles exceeded 60, the Mass Damage Factor jumped to 0.75%. This phenomenon suggests that 60 freeze–thaw cycles is a threshold value below which the sandstone mass loss is relatively small. While once exceeded, the sandstone mass damage increases rapidly.
The water–ice phase change in sandstone causes dislocations and displacements of the internal mineral particles, particle shedding on the surface, and rock debris falling, resulting in a loss of sandstone mass. As the freeze–thaw cycles increase, the displacement of the sandstone’s internal mineral grains accumulates, leading to a rapid increase in the Mass Damage Factor at a certain point in time.
The wave velocity magnitude reflects the degree of development of defects within the sandstone. Longitudinal wave propagation in sandstone encountering discontinuity surfaces will be refracted, emitted, and bypassed, resulting in a change of propagation trajectory and speed. Therefore, the smaller the wave velocity inside the sandstone, the more severe the damage. From Figure 10, the Wave Velocity Damage Factor ( D v ) shows a linear increasing trend, indicating that the number of cracks inside the sandstone continuously increases.
In conjunction with Figure 10, the sandstone wave velocity is more sensitive to changes in the freeze–thaw cycles, showing an overall near-linear increase. In contrast, the mass damage shows significant changes only at higher numbers of freeze–thaw cycles.

3.2. Analysis of Numerical Simulation Results

3.2.1. Crack Extension Analysis

The distribution of cracks inside the numerical model after experiencing different numbers of freezes and thaws is shown in Figure 11.
The crack distribution images show that tension cracks dominate the crack types in the early freeze–thaw stage. This phenomenon coincides with the conclusion of the Second Theory of Freeze–thaw Force [33]. The Second Theory of Freeze–thaw Force suggests that when a water particle freezes, there is a region with low water content and low moisture conductivity at the bottom of the particle. This region is called the frozen edge (Figure 12). Moisture migrates from the unfrozen region through the frozen edge to the freezing zone under the action of temperature gradients, gravitational potential energy, pressure potential energy, matrix potential energy, and other generalized traction forces. As moisture continues to migrate and accumulate in the freezing zone, the moisture inside the sandstone specimens gradually freezes into ice, forming freeze–thaw force. Under freeze–thaw forces, sandstone particles squeeze each other, making the pore space between the particles larger. More critically, the repeated phase transitions between water and ice are like cyclic loading and unloading on sandstone particles. These are subjected to cyclic loading and unloading and undergo cementation damage to form tiny cracks. Moreover, due to the characteristics of the rock’s high compressive capacity and weak tensile capacity, the microcracks formed by the freeze–thaw process are mostly tension cracks.
The changes in the number of different types of cracks throughout the freeze–thaw process are plotted in Figure 13 to visualize the trend of the cracks. In Figure 13, we divided the process into four stages. Stage I is 0–20 freeze–thaw cycles. Stage II is 20–40 freeze–thaw cycles. Stage III is 40–60 freeze–thaw cycles. Stage IV involves 60–80 freeze–thaw cycles. In Stages I and II, the number of cracks remained almost stable and showed no significant increase, indicating that the damage inside the model was mild. However, from Stage III onwards, the number of cracks starts to climb sharply, indicating that a large amount of damage is rapidly occurring inside the model. Upon entering Stage IV, the total number of cracks jumps to over 8000. Combined with the internal fragment view of the model (Figure 14), we can see that the prefabricated cracks in the central region were significantly affected. Expansion and particle spalling occurred in the prefabricated cracks themselves. At this point, the numerical model shows a ‘frozen crisp’ state, with powdery spalling. This phenomenon agrees with the experimental results.

3.2.2. Energy Analysis

Under cyclic loading, sandstones with flaws can develop behaviors such as crack closure, sprouting, and expansion. These processes can significantly affect the energy response characteristics of sandstone [34].
There are no parameters in the PFC that directly characterize the energy changes. By comprehensively analyzing the changes in Porosity and Contact Force, we can approximate the complex energy evolution within the model. Therefore, during the simulation, monitoring points were set up inside the model to record the Porosity change and Contact Force change inside the sandstone. Figure 15 shows the schematic layout of the three monitoring points inside the model.
The change curves of Porosity and Contact Force throughout the freeze–thaw process are plotted (Figure 16) based on the data from the monitoring points. Of the three monitoring points, measurement point 1 has a larger initial Porosity because it covers the prefabricated crack. Measurement point 2 and measurement point 3 more realistically reflect the initial pore state.
As shown in Figure 16, the Porosity trend is related to the freeze–thaw cycles. At the beginning of the freeze–thaw period, the Porosity decreases slowly as the freeze–thaws increase. Subsequently, after reaching a certain point (50th freeze–thaw), the Porosity increased rapidly. In addition, there are also small periodic fluctuations in the change of Porosity, a phenomenon closely related to the periodic change of temperature. When the model temperature increases, the particles squeeze each other, resulting in the Porosity decreasing. When the model temperature decreases, the inter-particle pore space increases, and the Porosity increases accordingly. The model’s Porosity increased significantly between the 50th and 55th freeze–thaw, jumping from 15.9% to 17.2%, an amplification of 1.3%. However, from the 55th to the 80th freeze–thaw, Porosity increased from 17.2% to 17.5%, an amplification of 0.3%, much lower than the 1.3% amplification. It proves that that a significant structural change occurred within the model at around 50 freeze–thaw cycles, which occurred rapidly and stabilized over a short period. The Porosity fluctuation of measuring point 2 and measuring point 3 is more drastic. This indicates that the model’s Porosity change close to the surface is more prominent, i.e., the region close to the surface is more affected by the freeze–thaw cycle.
The Contact Force increases continuously throughout the freeze–thaw process. As illustrated by the dotted coil labeling in Figure 15, substantial fluctuations in Contact Force and Porosity transpire in a near-simultaneous fashion. Specifically, an increase in temperature results in tighter squeezing of the particles against each other and an increase in Contact Force due to the squeezing. Conversely, when the temperature decreases, the extrusion between the particles reduces, and the Contact Force decreases. The Contact Force maintains minor periodic fluctuations during the first 50 freezes and thaws. However, at the 50th freeze–thaw, there is a considerable fluctuation in the Contact Force, with the maximum value reaching 6310 Pa and the minimum value plummeting to 821 Pa, an abnormal change far beyond the previous fluctuation range.
The Porosity and Contact Force shows that at the beginning of the freeze–thaw period, the freezing and swelling forces within the model did not destroy the cementation between the particles. The freezing and swelling effect gradually accumulates energy inside the model. When it reaches a certain threshold, the cementation between the particles begins to fail in a large amount, followed by a rapid release of energy. This process is manifested in the violent fluctuation of the Contact Force curve. Between the two sharp fluctuations in Contact Force, there was a relatively stable period of fluctuation, which was the accumulation stage before the next concentrated release of energy. During the 73rd to 80th freeze–thaw cycles, the value of the Contact Force increased from 7500 Pa to 10,000 Pa, which is a significant amplification. In addition, the Contact Force also fluctuated wildly during the 63rd, 72nd, and 73rd freeze–thaw cycles, indicating that the energy release rate was accelerated. This phenomenon indicates that the energy inside the model is in a state of continuous growth. The energy release rate becomes faster and faster as the internal cracks gather and penetrate through each other.
The variation of the model’s Contact Force map provides visual evidence for the above analysis. As shown in Figure 17, the distribution and change of Contact Force show a certain regularity with the increase in freeze–thaw cycles. At the 20th freeze–thaw cycle, regions of high Contact Force appeared sporadically inside the specimen, signaling the beginning of energy accumulation inside the model. When the freeze–thaw cycle reached 40 times, a large area of high Contact Force appeared in the top part of the model. A small area of high Contact Force formed around the prefabricated crack’s perimeter. This indicates that energy has been accumulated to a certain extent inside the model during the 40th freeze–thaw cycle. When the freeze–thaw cycle reaches 60 times, the number of high Contact Force areas decreases, and they are mainly concentrated on the left and right sides of the model. It reveals that energy release occurred in the model during the freeze–thaw cycles from 40 to 60 times. Eventually, at the 80th freeze–thaw cycle, the number of high Contact Force areas continued to decrease, and the Contact Force was evenly distributed over most of the specimen. This indicates that the energy is stored uniformly in different locations.

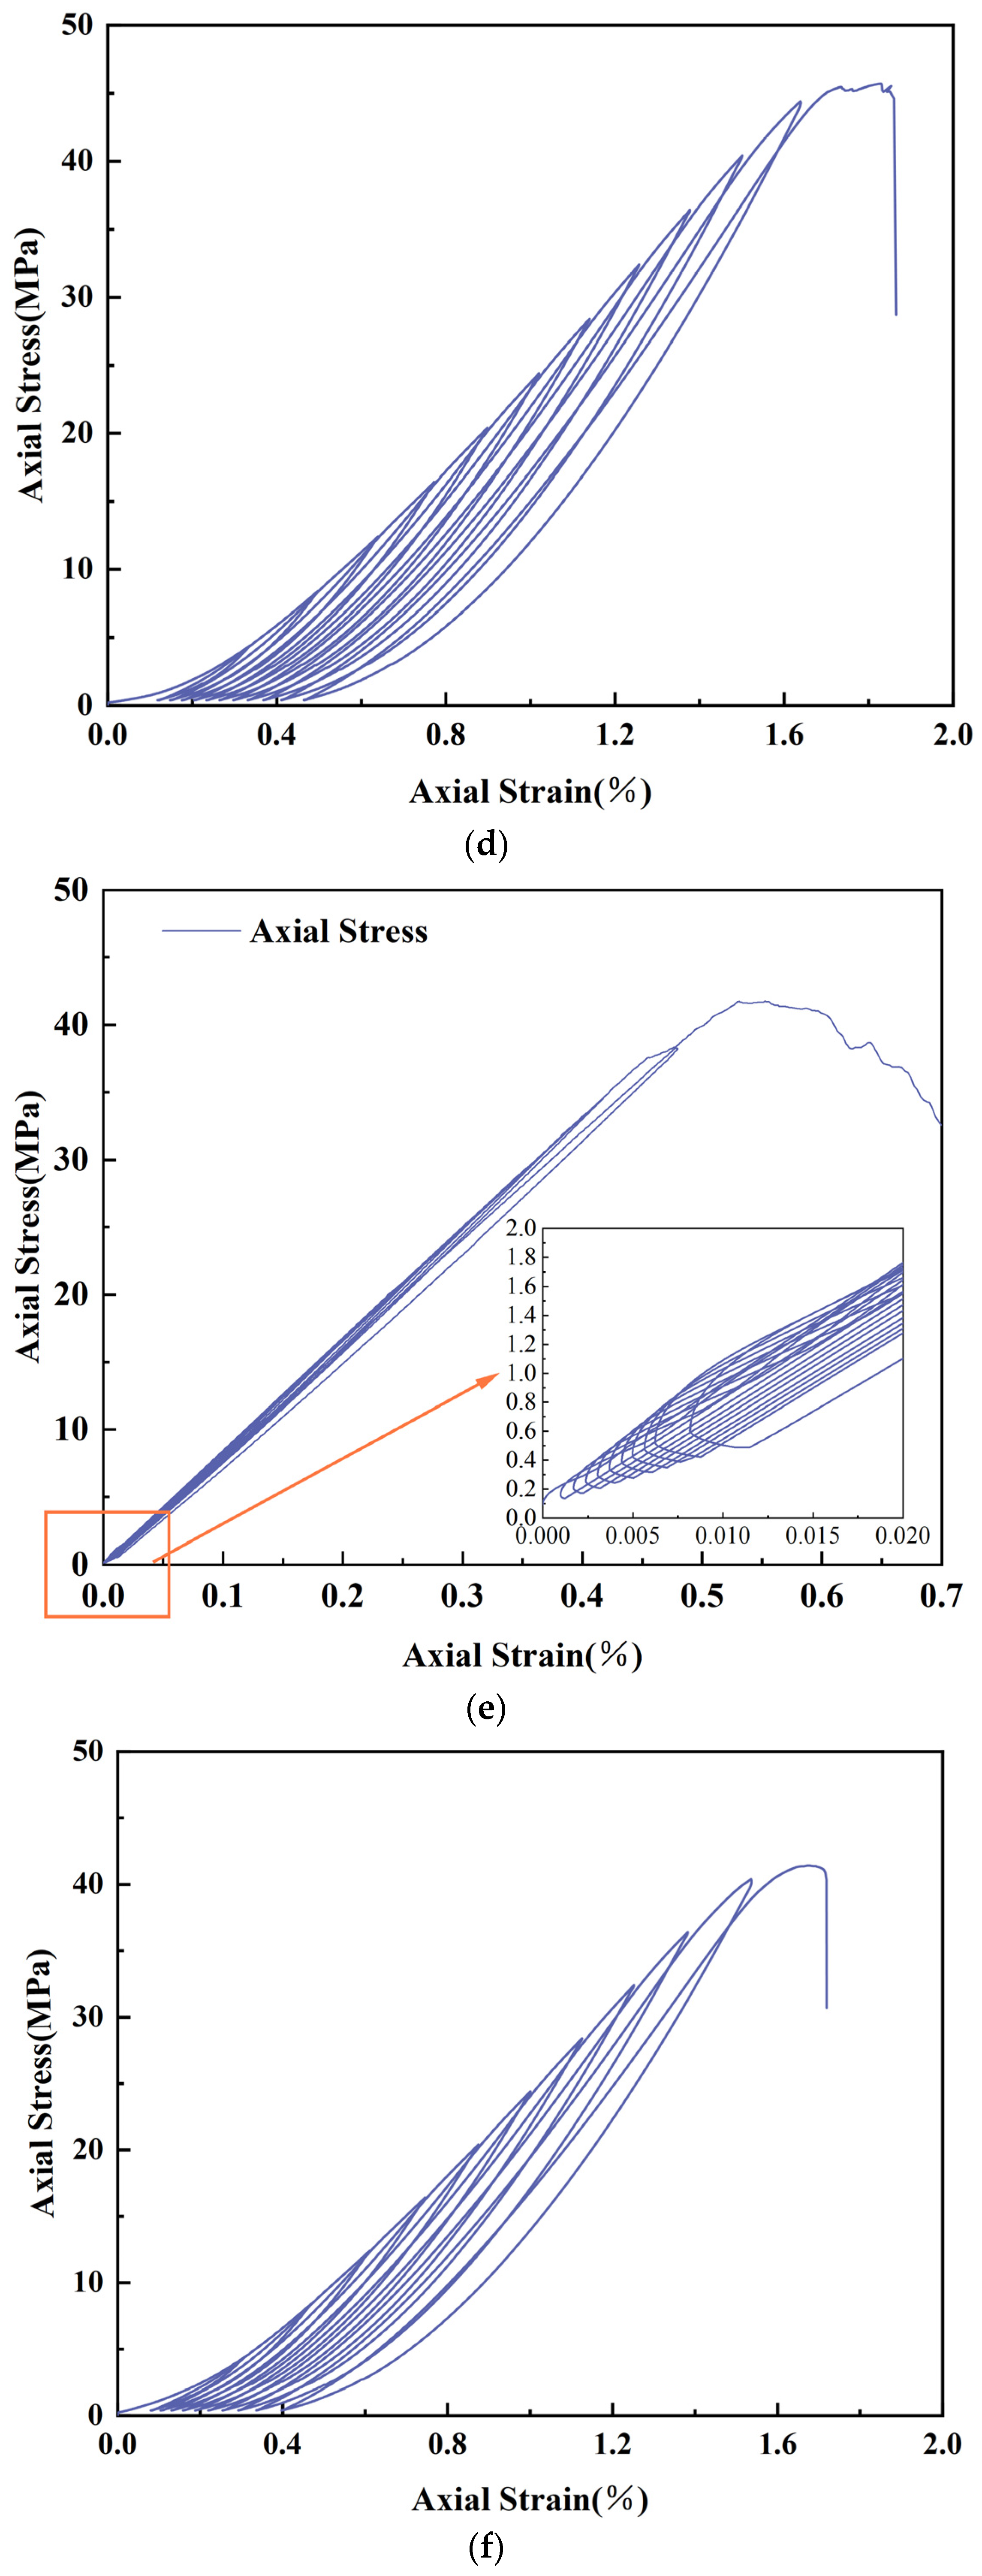
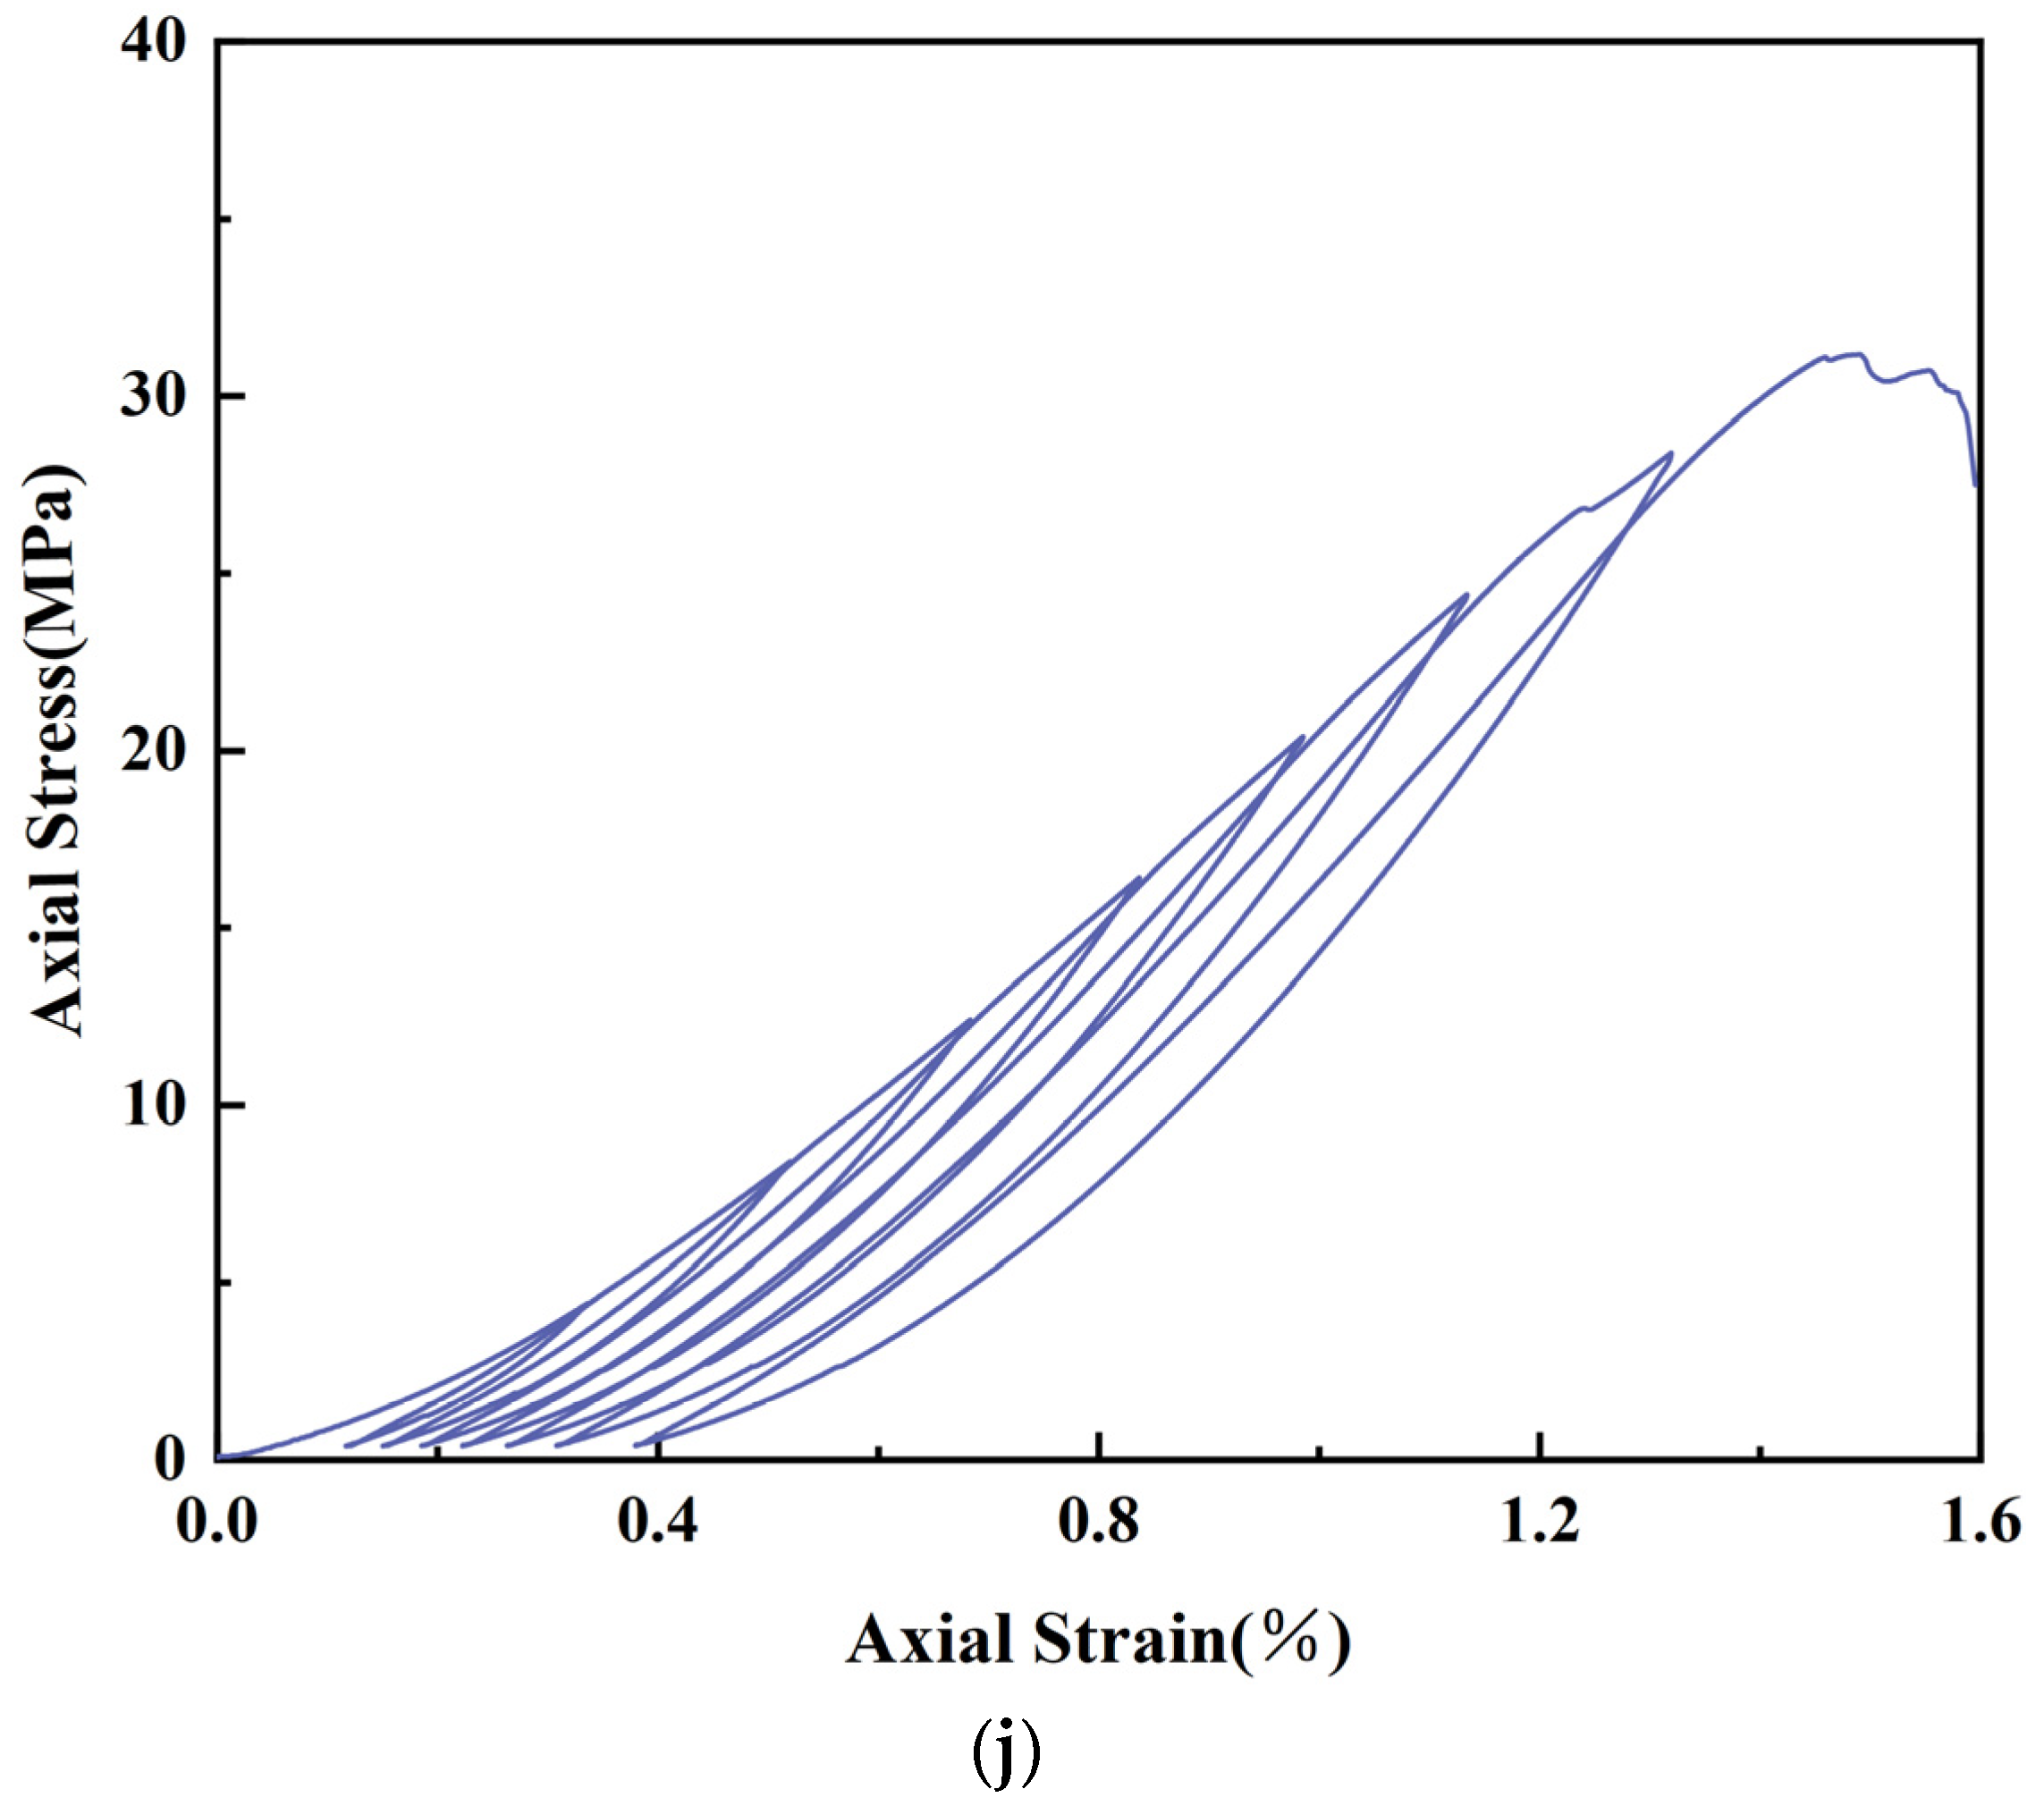
3.2.3. Cyclic Loading and Unloading Stress–Strain Analysis

The numerical simulation and experimentally measured stress–strain curves are shown below.
As seen in Figure 18, the spacing of the experimentally measured hysteresis loops showed two stages of ‘dense–sparse’. With the increase in freeze–thaw cycles, the spacing of the hysteresis loops became more and more sparse. On the other hand, the simulated hysteresis loops show equal spacing, with no noticeable ‘dense–sparse’ phase. At the early loading stage, the peak values of the experimental curves are almost on the same curve (Peak-to-peak envelope), gradually shifting in the direction of strain increase. Many scholars [35,36,37,38,39,40] have found that the envelope curve coincides with the uniaxial compression curve of the sandstone specimen. At the later loading stage, the curve deviates significantly from the uniaxial compression stress–strain curve. This phenomenon indicates that cyclic loading accumulates internal damage in the specimen, and irreversible strain damage occurs.
The loading and unloading methods used in the numerical simulation are not the same as the experiments, which are loaded by triangular waves, while sinusoidal waves load the numerical simulation. Figure 18 shows that the cumulative plastic strain is different between the simulation and the measurement under the same number of loading and unloading cycles, mainly because the numerical model does not have a compacting phase, and enters the elastic strain phase directly. For this reason, we define a new parameter, Cumulative Strain Difference ( ε c s ), to evaluate the strain difference between simulation and experiment. It is calculated from Equation (8).
ε c = ε m s ε c s σ m s σ c s ε a σ a
where ε c s is the strain generated by a loading in the simulation process, [%];
ε m s is the strain generated by the corresponding loading in the measured process, [%];
σ c s is the peak stress in the simulation process with the corresponding loading, [MPa];
σ m s is the peak stress in the measured process with the corresponding loading, [MPa];
ε a is the strain difference between measured and simulated during parameter calibration, [%];
σ a is the measured peak stress during parameter calibration, [MPa]. As an illustration, consider the stress–strain data of unfreeze–thaw rock samples (see Table 5 for details). Among them, the specimen was damaged at cycle level 13, and the strain values were not informative, so only the first 12 cycle levels were calculated. The specific calculations are shown in Table 5.
The results obtained from the calculations in Table 5 are plotted in Figure 19. The variation of the Cumulative Strain Difference for different numbers of freeze–thaw cycles is also shown in Figure 19.
From the results, the maximum value of Cumulative Strain Difference is 37.10%, which occurs in cycle level 1, and the minimum value is 7.00%, which occurs in cycle level 10. The average Cumulative Strain Difference was calculated to be 20.57%. From the past studies [41,42,43,44], the strain of numerical simulation of uniaxial compression is about 25% lower than the actual measurement on average. So, using a sinusoidal wave in the paper is feasible. Moreover, the trend of Cumulative Strain Difference shows that the plastic strain difference between simulated and measured decreases with increasing cycle levels.

3.2.4. Analysis of Damage Patterns of Specimens

Figure 20 visualizes the damage characteristics of sandstone after cyclic loading and unloading applied under different freeze–thaw cycles. The following features can be observed by comparing the measured damage images with the simulation results. For the sandstone without freeze–thaw, the damage cracks are generated at the ends of the prefabricated crack. Then, it gradually extended to the top and bottom ends of the specimen. During this process, the region with the most considerable deformation appears near the prefabricated crack. The overall deformation of the sandstone specimens freeze–thawed 20 cycles was close to that of the specimens without freeze–thaw, and the expansion patterns of the cracks were macroscopically similar. The difference is that after 20 freeze–thaw times, the sandstone formed a crack through the specimen’s top left and bottom right surfaces. The inclination of this crack remained the same as that of the prefabricated crack.
In sandstone of 40 freeze–thaw cycles, cracks first appeared on the top right surface of the specimen. Then, it penetrated the prefabricated crack and expanded toward the bottom right surface. Then, cracks began to develop on the top left surface, expanding towards and penetrating the prefabricated crack and then expanding toward the bottom left surface, forming an X-shaped crack. The maximum deformation of the sandstone with 40 cycles of freeze–thaw was concentrated on the bottom left and top right surfaces.
The cracks first appeared on the top left surface of the sandstone after 60 freeze–thaw cycles, expanding towards the prefabricated crack to form a through crack. Cracks then began to appear on the top right surface of the specimen, expanding towards the center to form a through crack with the prefabricated crack. Then, the left side cracks expanded to the bottom of the specimen until the specimen was destroyed.
In the sandstone with 80 freeze–thaw cycles, cracks first appeared on the right surface of the specimen and did not penetrate the central prefabricated crack. Instead, it developed in the right surface area, causing small block spallings to form on the right surface. A similar situation occurred on the left surface of the specimen with large block spalling, but it occurred slightly later relative to the right side. Finally, a distinct, wide crack was formed on the right surface. It started at the top right corner, crossed the center of the specimen, and extended to the bottom right corner. In contrast, the crack formed on the left side was minor in width and did not penetrate the specimen’s center.
The above analyses show that the crack extension patterns within the specimens exhibit significant differences with freeze–thaw cycles. When the number of freeze–thaw cycles is high, the specimens are prone to X-shaped conjugate plane shear damage. On the contrary, the specimens are prone to monoclinic shear damage. The difference in damage patterns results from weakened cementation between rock particles. The freeze–thaw effect on the specimens is from the outside to the inside, with the outer surface showing more drastic cementation damage. Therefore, cracks are more likely to extend to the outer surface, leading to block spalling.

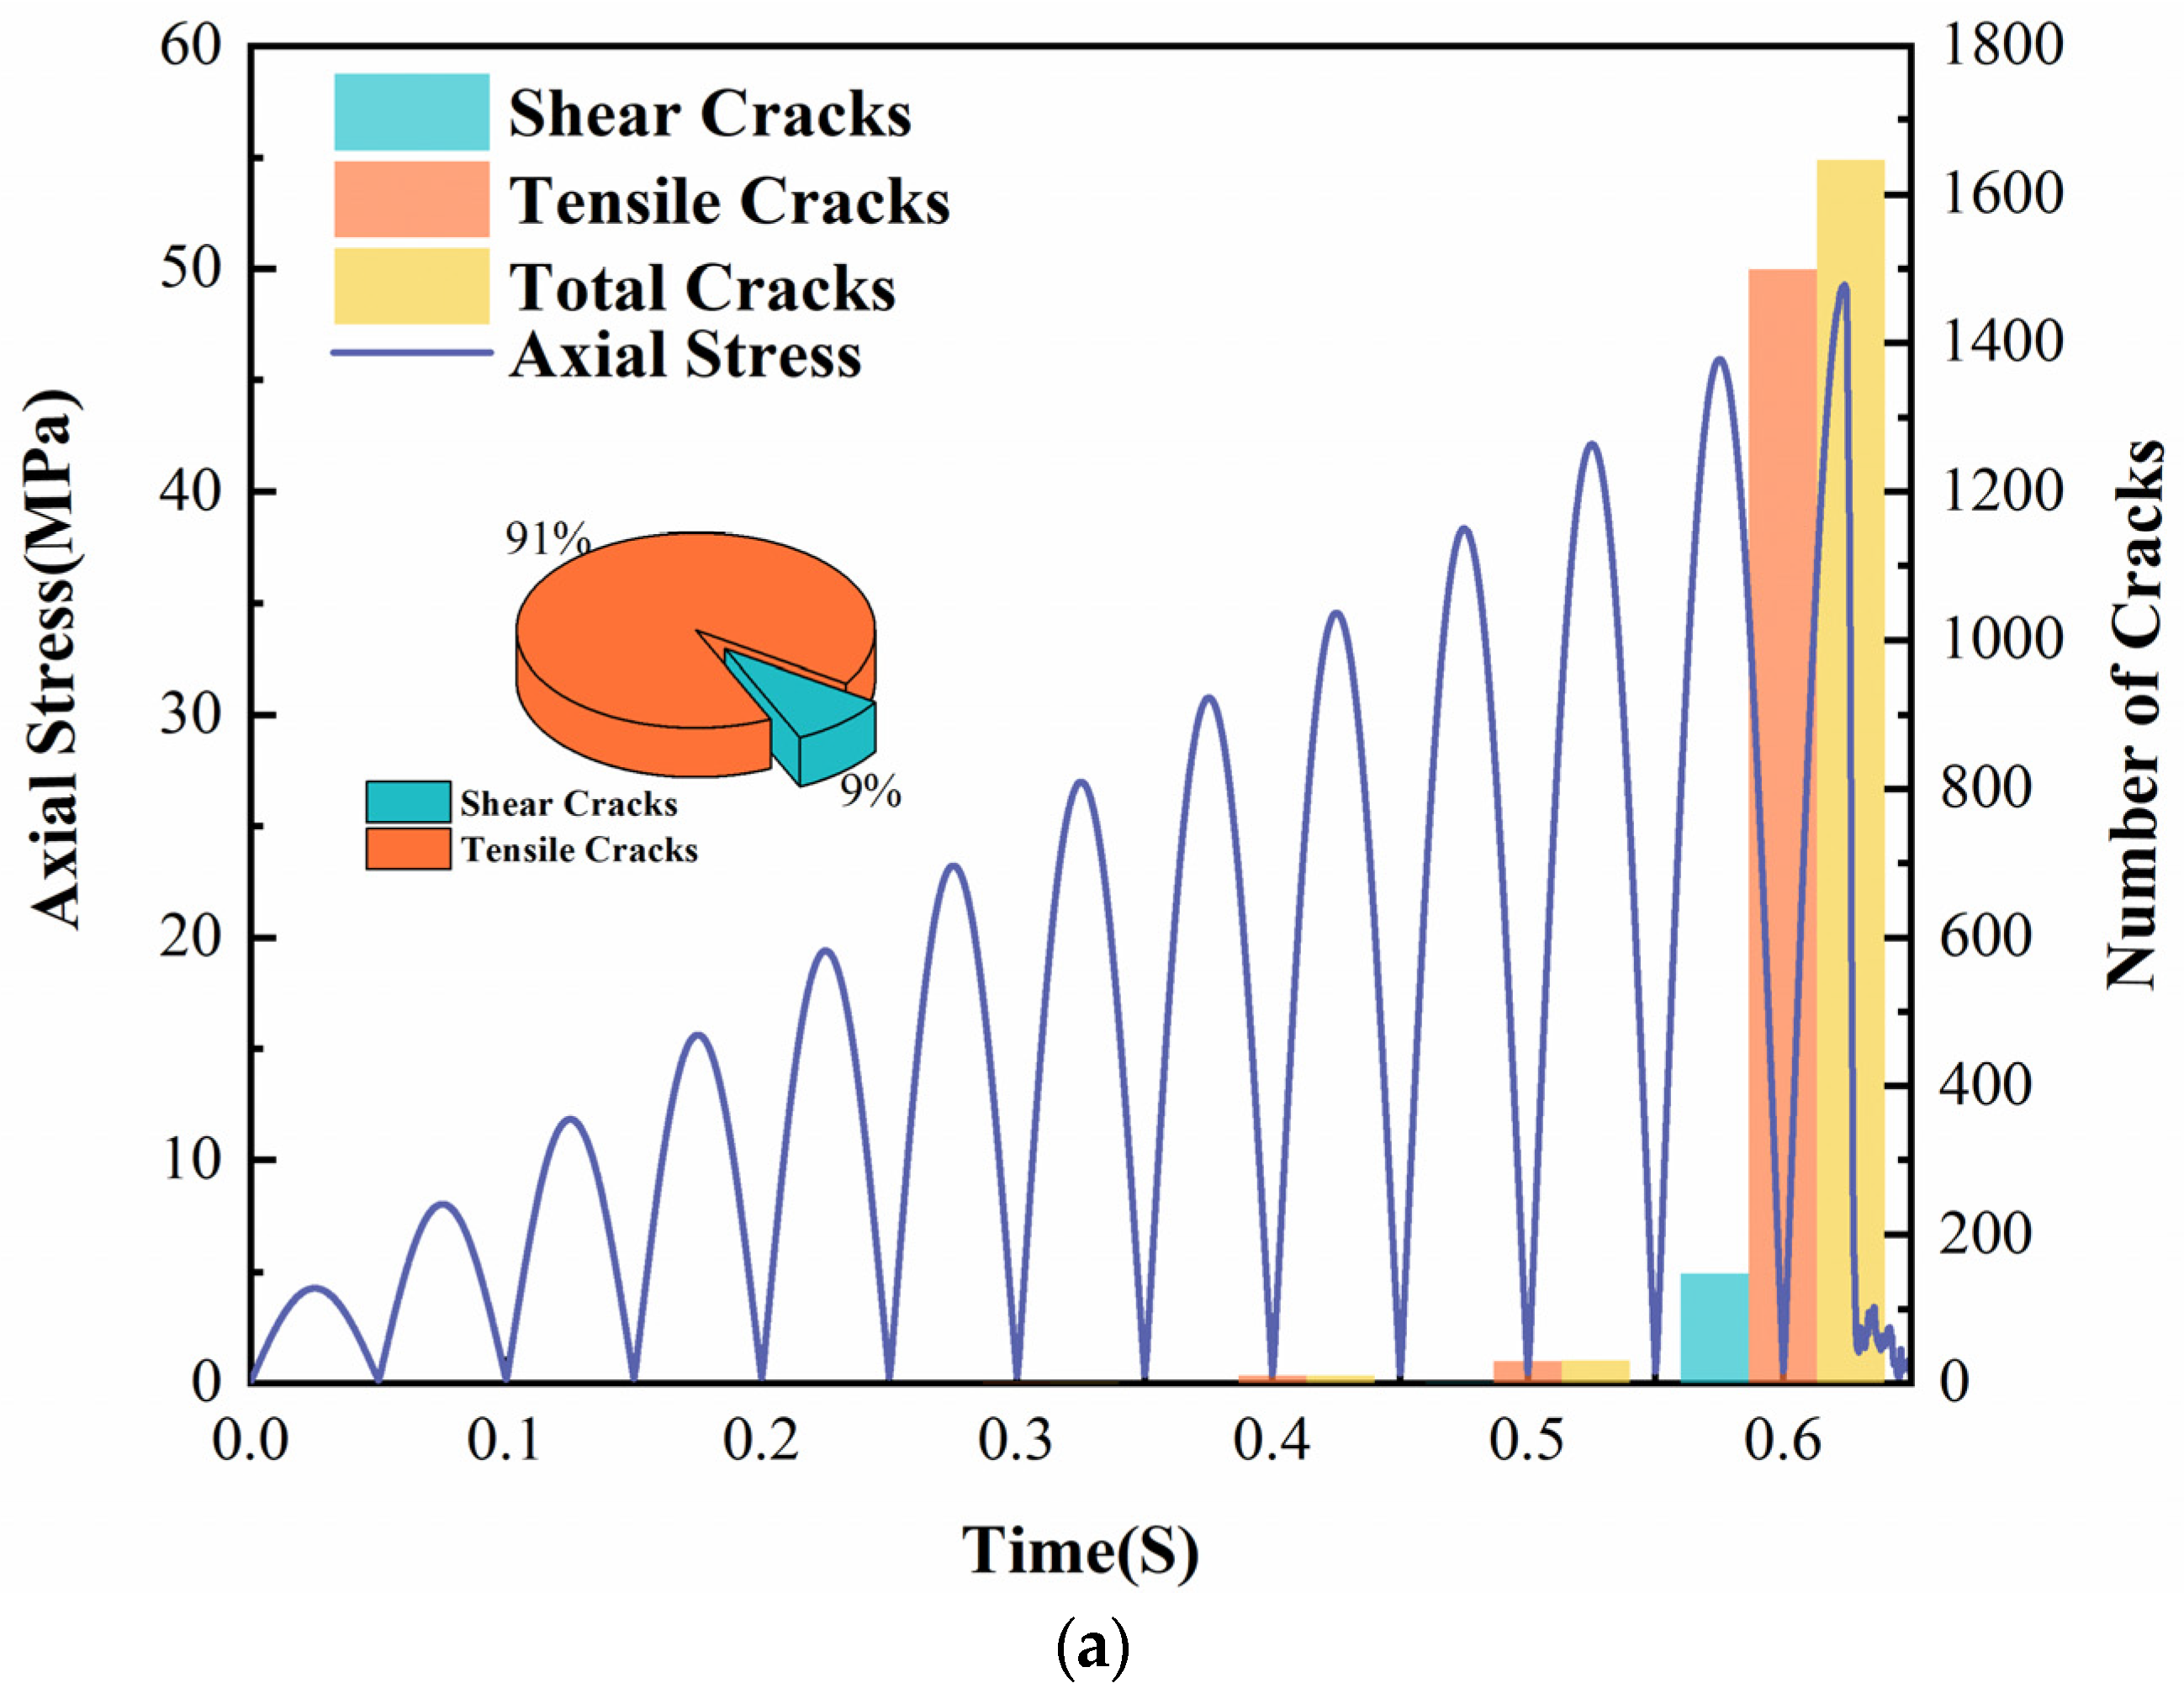
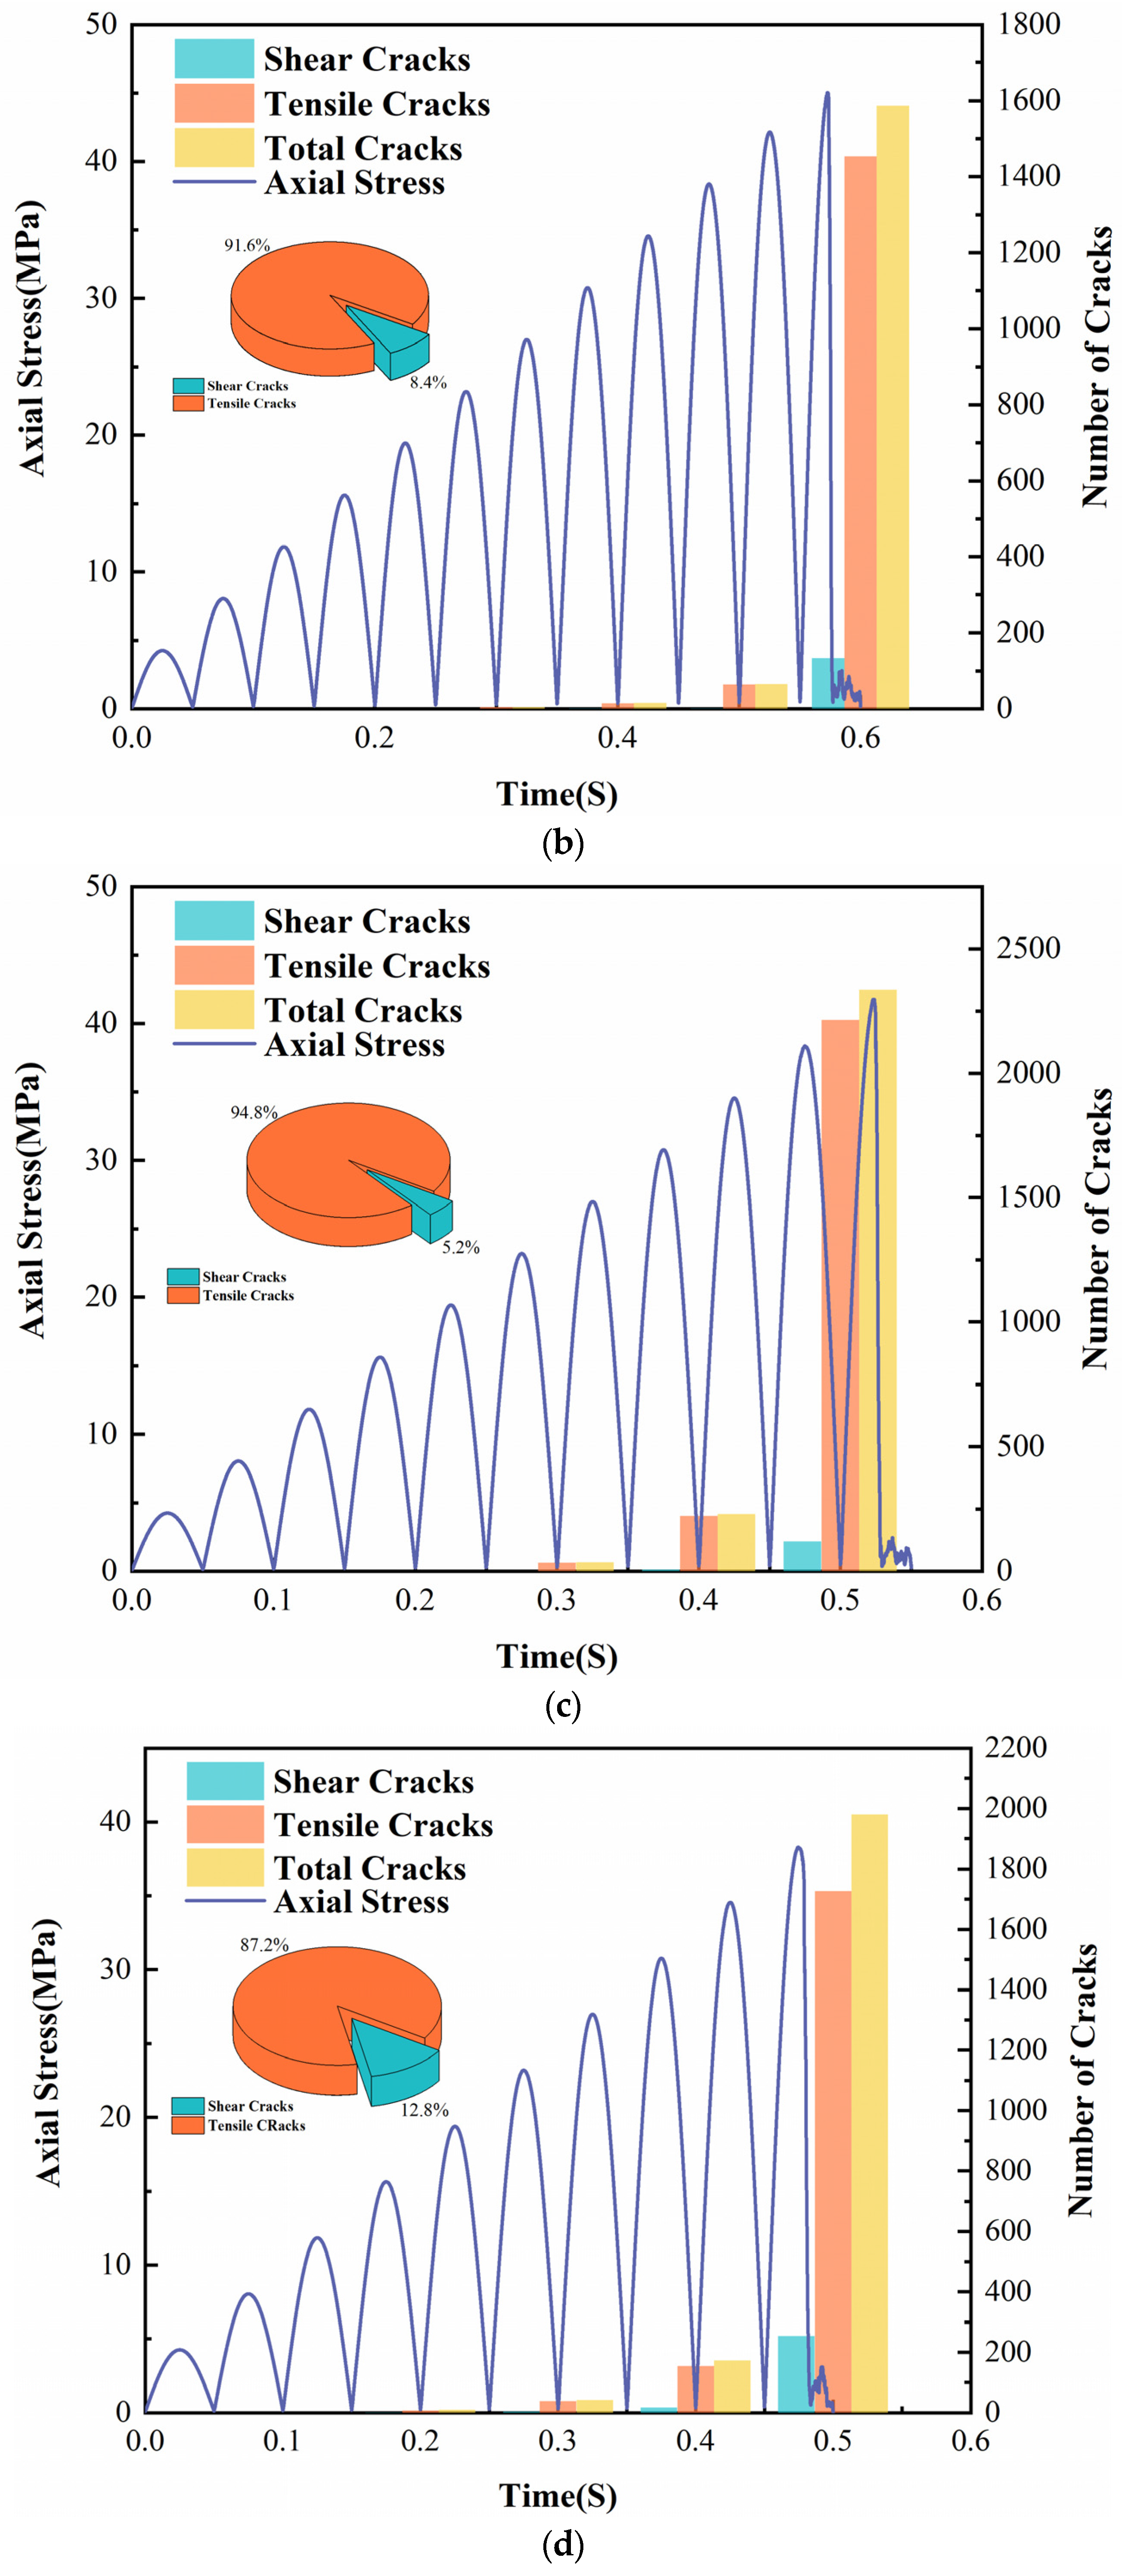
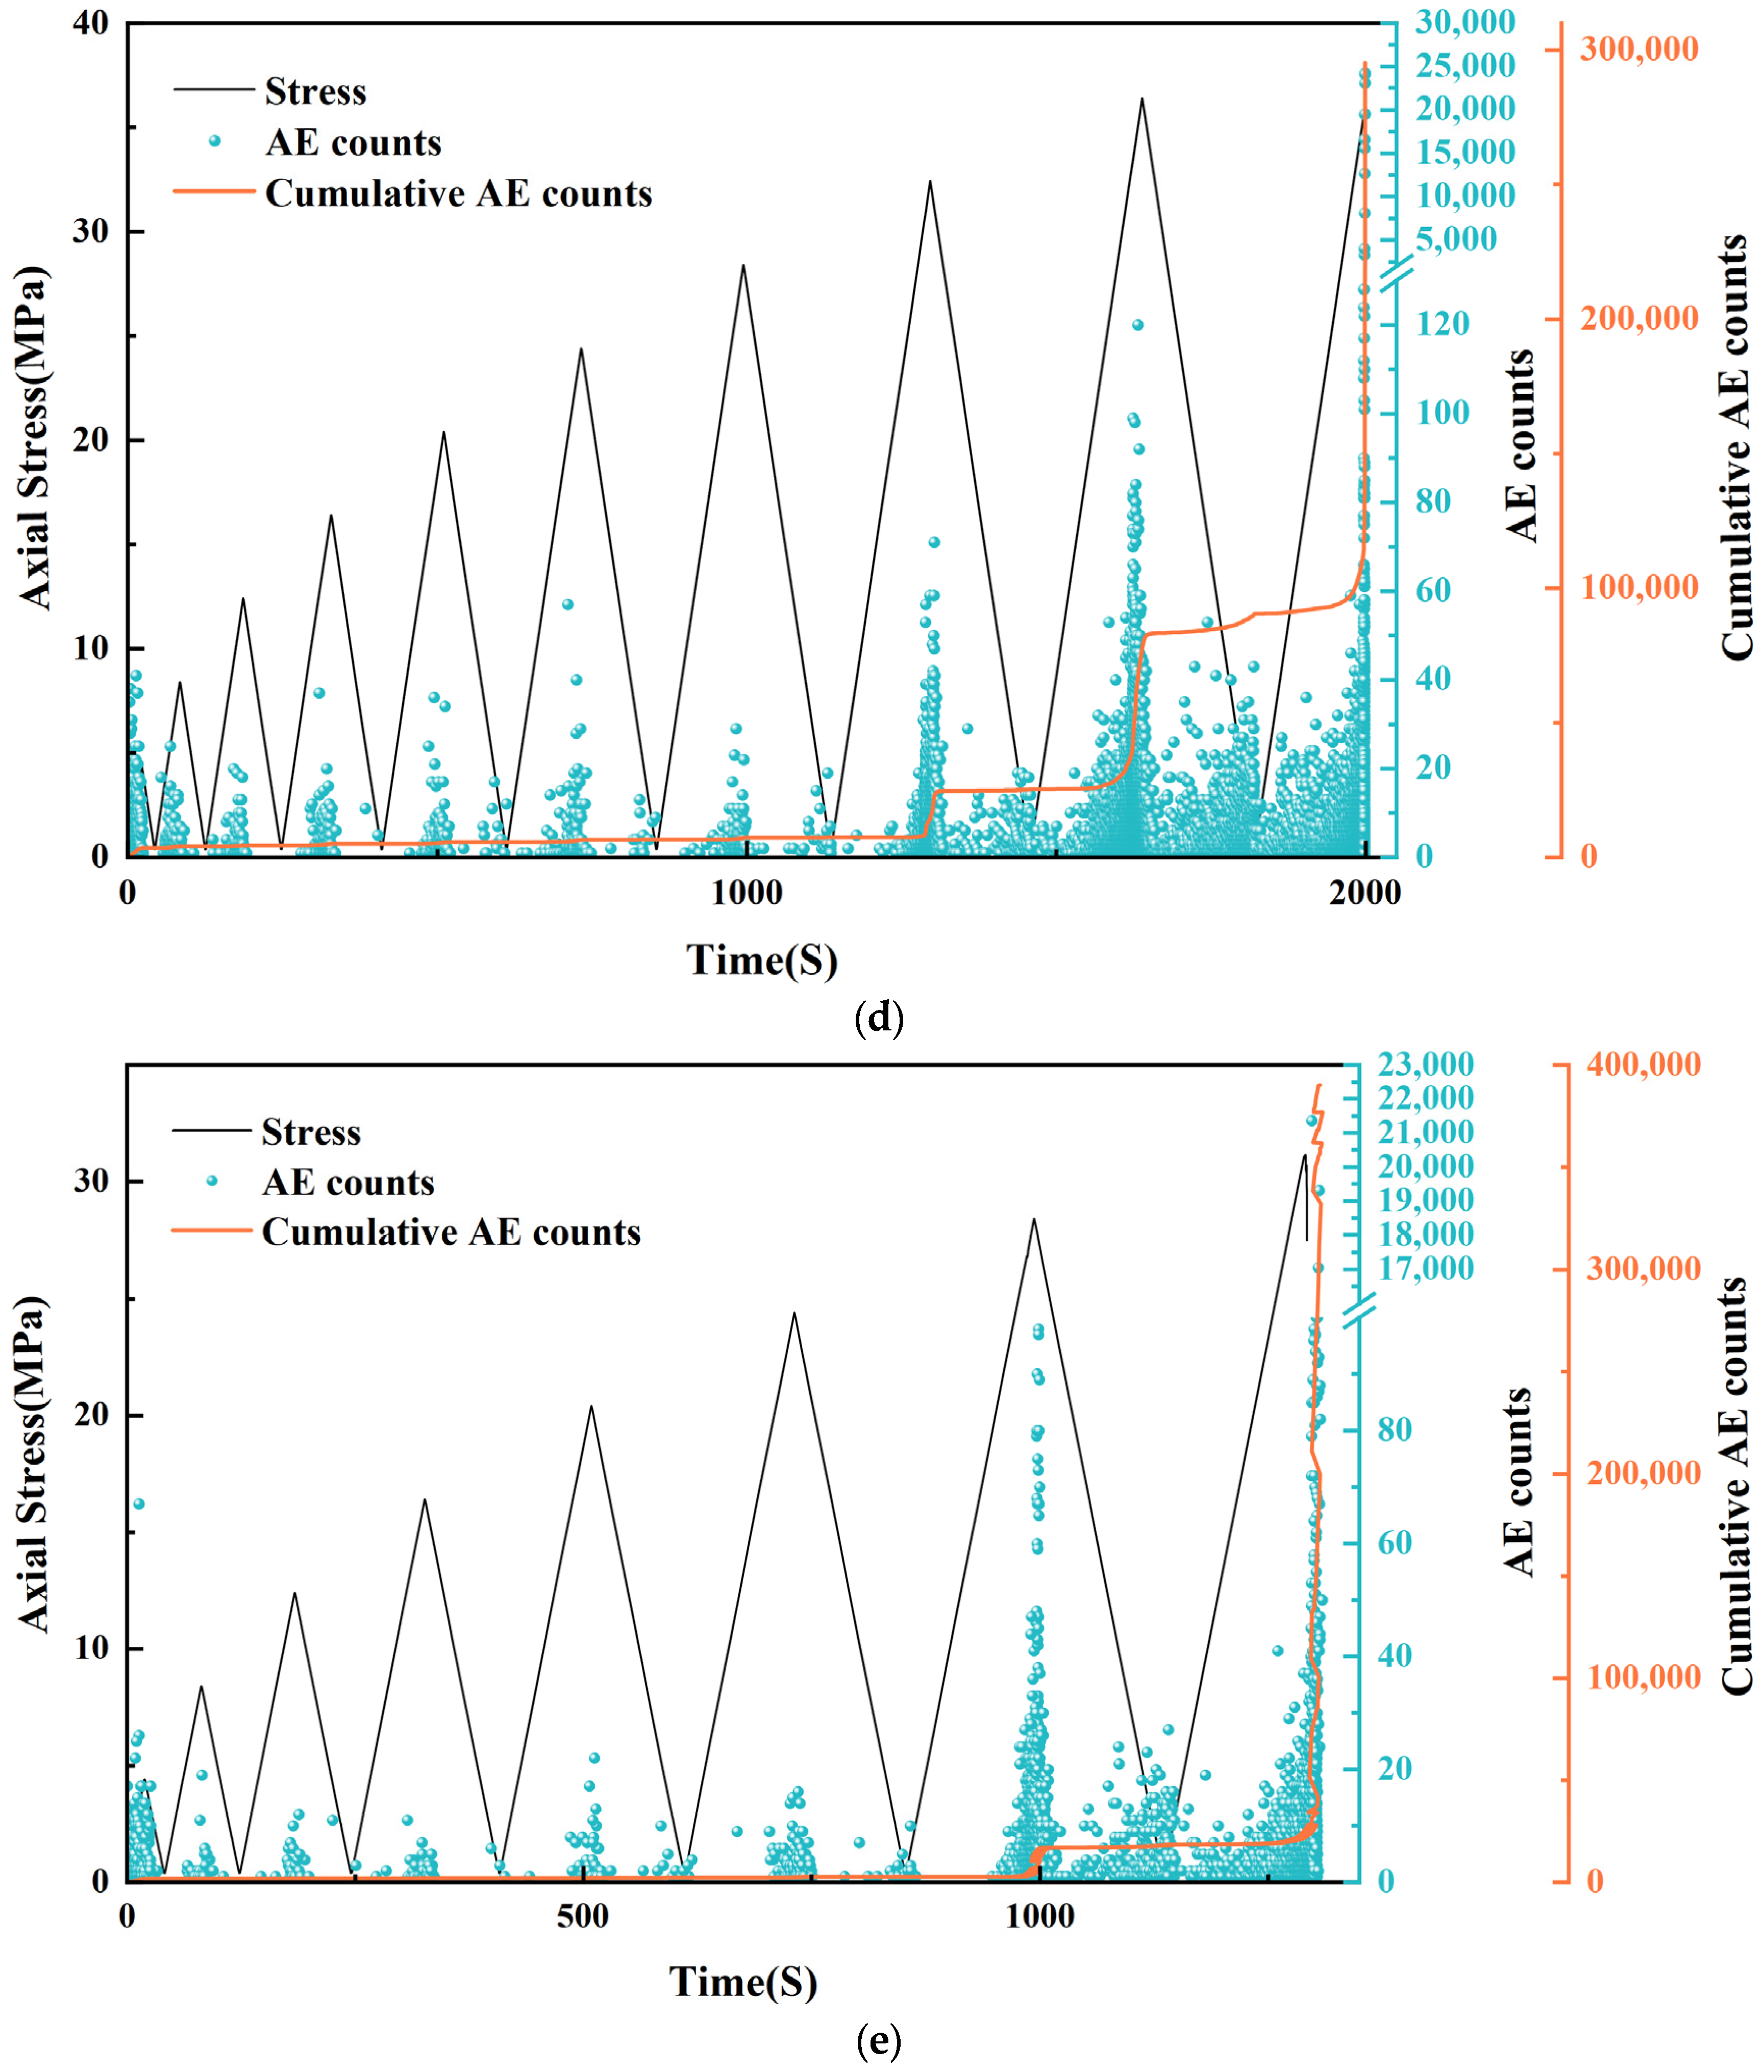
3.2.5. Analysis of Crack Extension During Cyclic Loading and Unloading Simulation

The built-in crack analysis function of PFC can help researchers conveniently analyze the expansion of cracks and the types of cracks. Figure 21 visualizes the dynamic changes of crack numbers and the generation of different types of cracks throughout the simulation process. Figure 22 shows the changes in the acoustic emission (AE) parameters. The two sets of pictures visualize the crack evolution of sandstone under cyclic loading conditions.
Figure 23 plots the changes in the percentage of crack types with the freeze–thaw cycles under different loading and unloading conditions.
As can be seen from Figure 21 and Figure 22, the emergence of cracks shows a significant correlation with the magnitude of axial stress. When the axial stress exceeds a specific value, cracks appear in large numbers. The energy accumulation within the sandstone reaches a certain degree and is more likely to be released in large quantities at the later stage of cyclic loading. Hence, cracks tend to appear in the last 2~3 stress cycle levels.
The number of tensile cracks dominated throughout the cyclic loading process. The proportion of shear cracks showed an increasing trend with the increment of freeze–thaw cycles (Figure 23). It can be attributed to the formation of shear rupture zones in the sandstone damage process. The shear rupture zone is a high-incidence zone for shear cracks. Thus, shear cracks briefly dominate at a given stage of rock damage. In addition, after the 50th freeze–thaw cycle, the growth rate of tension cracks decreased, and the growth rate of shear cracks increased. This further indicates that the higher the freeze–thaw cycles, the more prone the sandstone is to shear damage.

4. Conclusions

This paper investigates the sandstone with prefabricated cracks subjected to cyclic loading after freeze–thaw cycles by combining indoor tests and numerical simulation analysis. Taking a high-altitude mine sandstone as the research object, a prefabricated crack with an inclination angle of 45° at the center of the sandstone specimen was subjected to freeze–thaw cycles and uniaxial cyclic loading and unloading tests. The following conclusions were drawn.
  • The Wave Velocity Damage Factor ( D v ) increases linearly throughout the cycle period. It provides that the wave propagation velocity within the sandstone is sensitive to changes in the freeze–thaw cycles. In contrast, the Mass Damage Factor ( D m ) shows a significant change only at a higher number of freeze–thaw cycles.
  • The PFC thermal calculation module was used to simulate the freeze–thaw cycle process of sandstone, and the model agreed with the experimental results. Combined with the energy analysis, the model continues accumulating energy due to the freezing and swelling effect. At specific moments, the energy undergoes a drastic and rapid release. Subsequently, the specimen enters the next energy accumulation period, and the frequency of energy release increases as the number of freeze–thaw cycles increases.
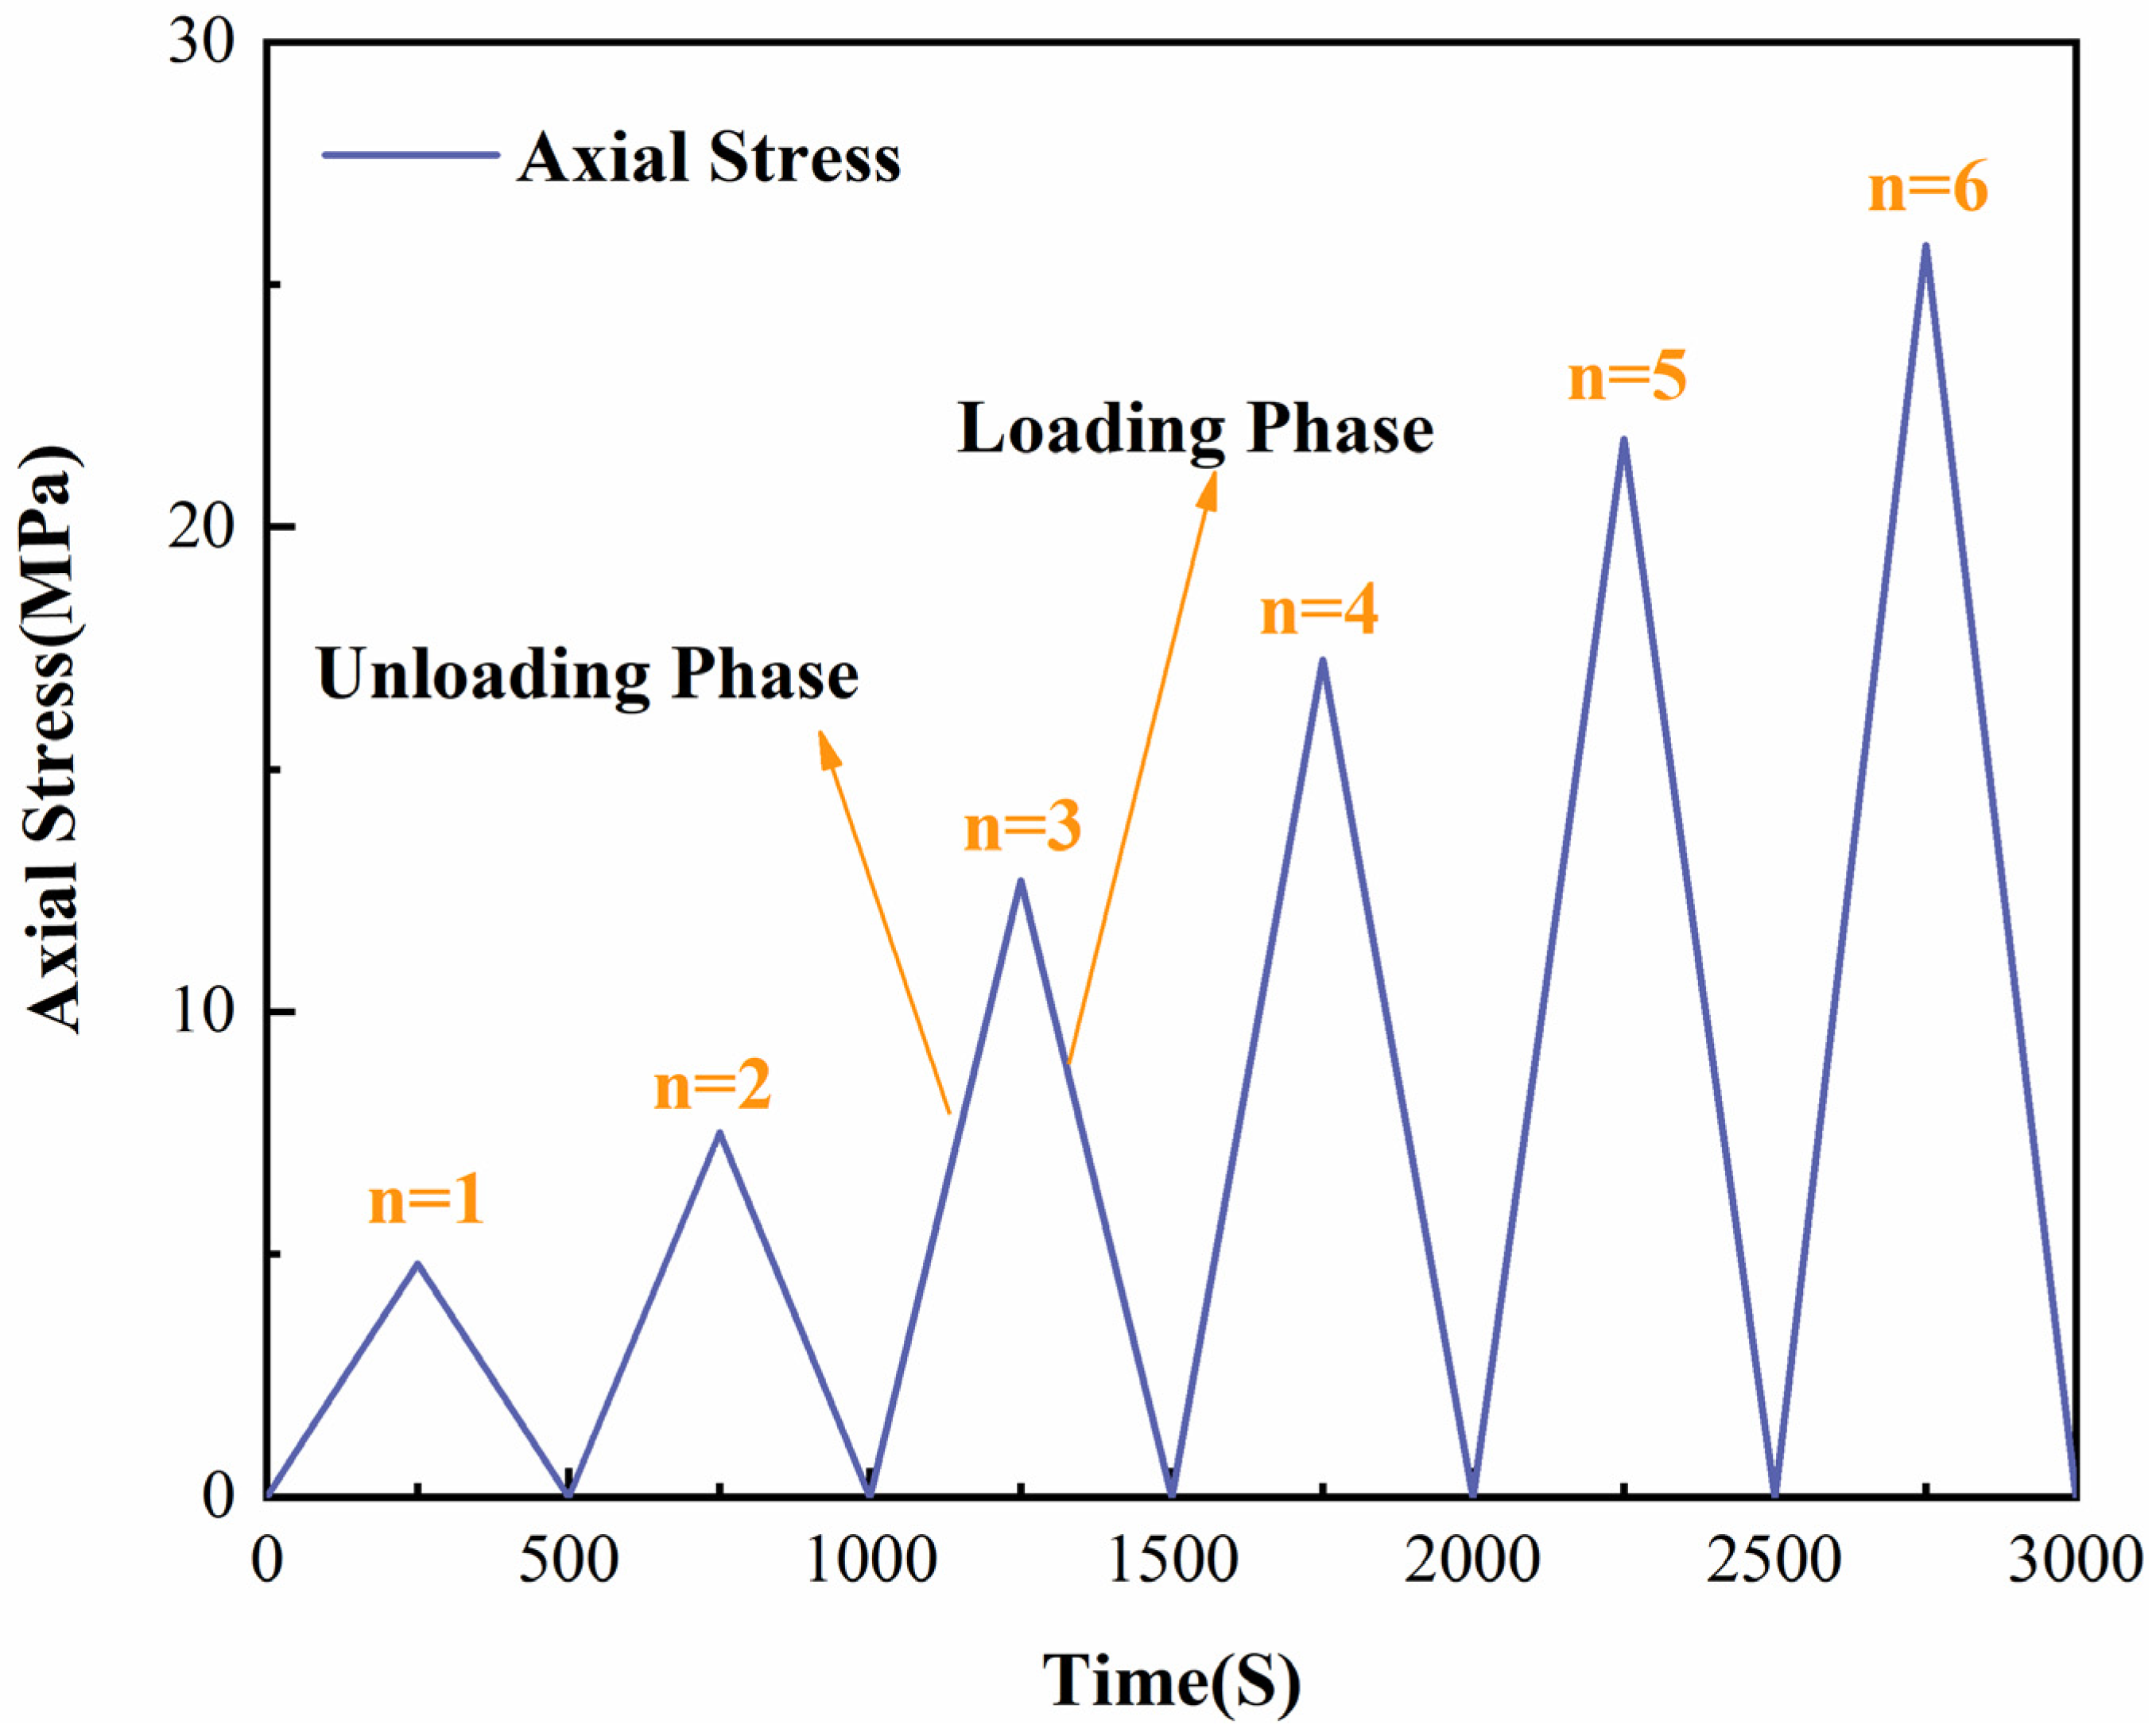
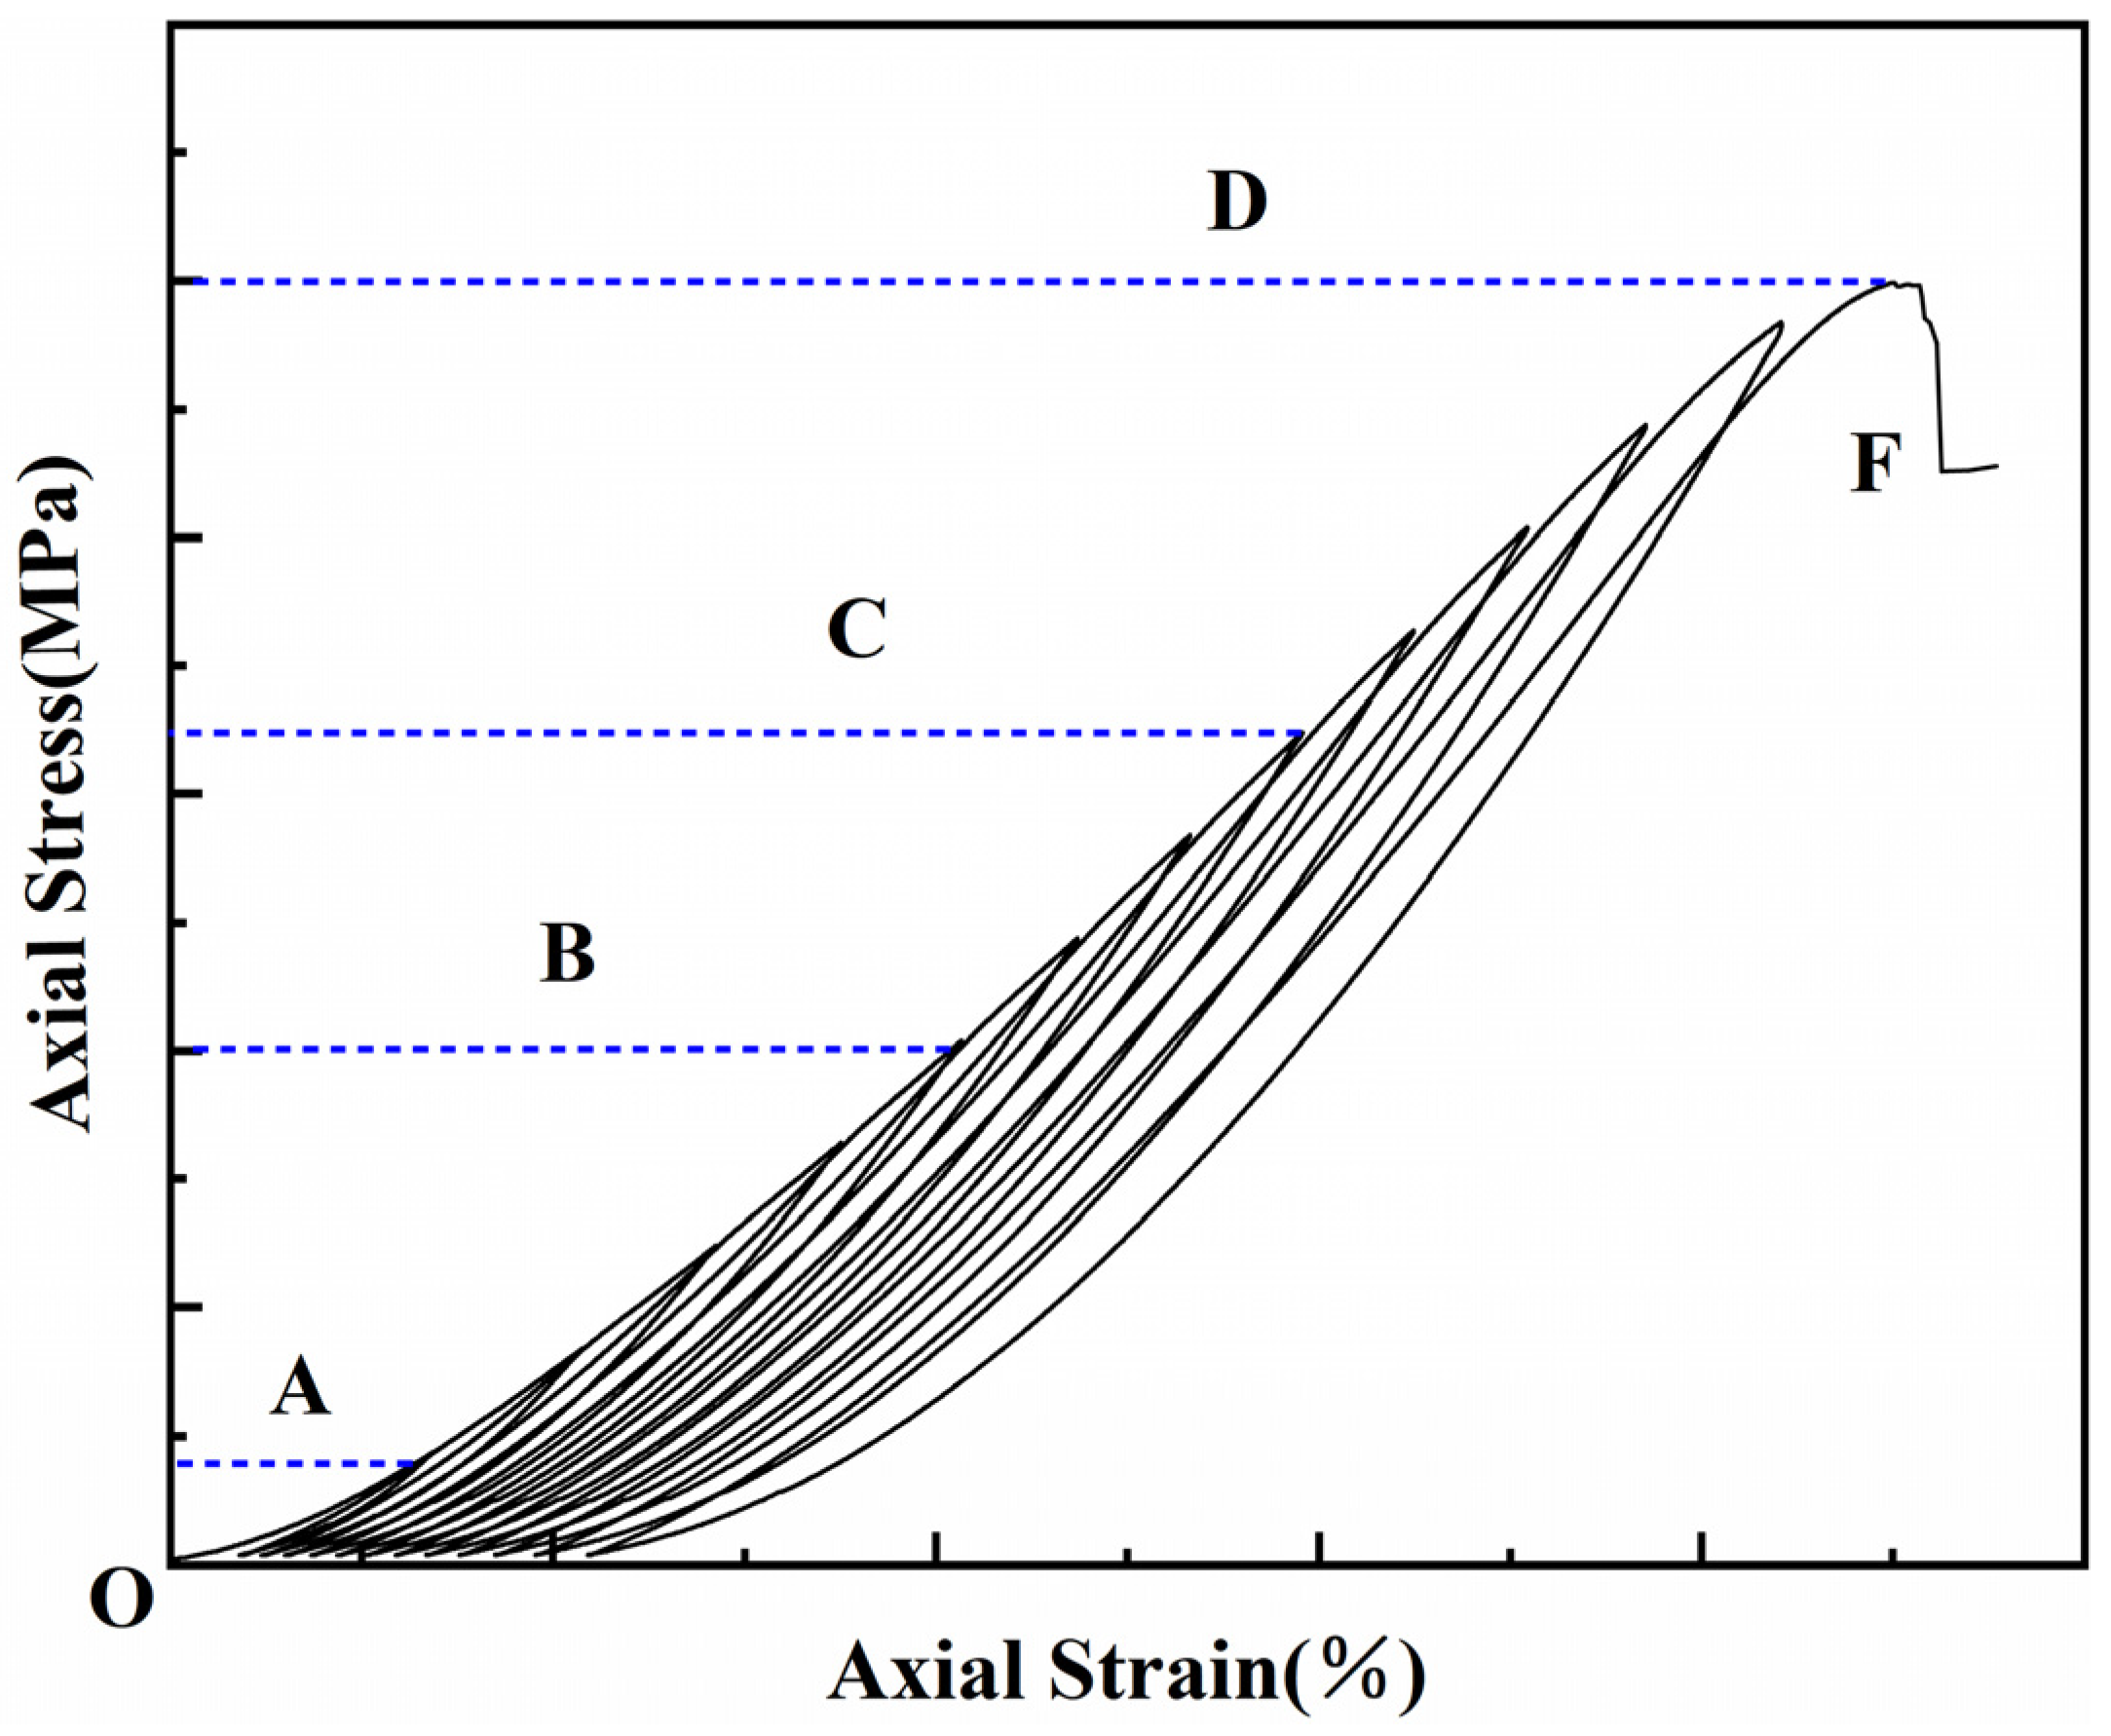
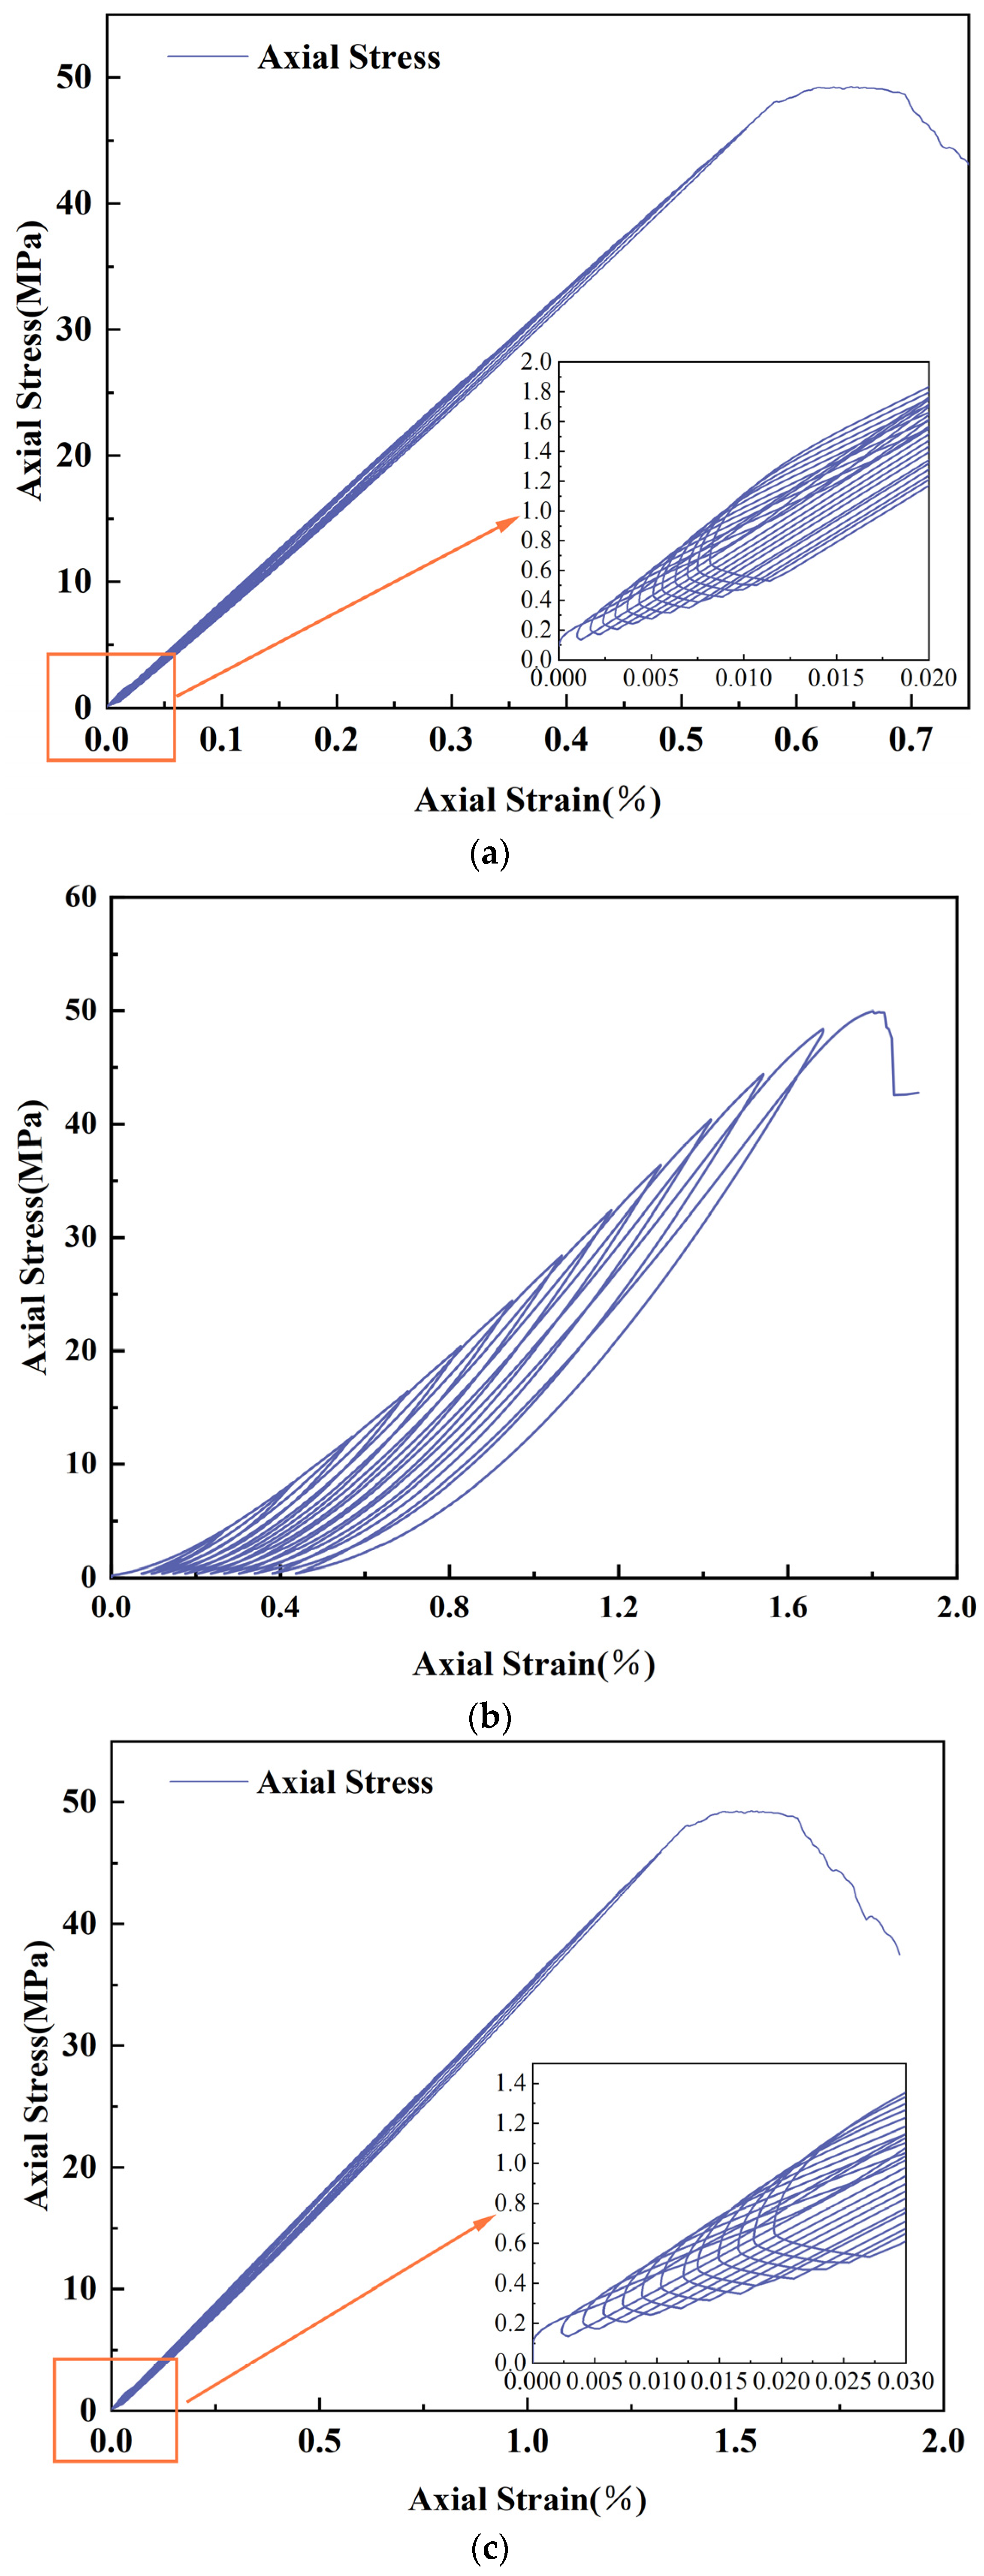
  • Cyclic loading leads to the accumulation of internal damage in the specimen, resulting in a gradual weakening of the load-bearing capacity of the specimen. The average value of the Cumulative Strain Difference ( ε c ) is calculated to be 20.57%, which is within a reasonable range. Moreover, the trend of Cumulative Strain Difference ( ε c ) reflects that the difference between simulated and measured plastic strains decreases with the increase in cycle level.
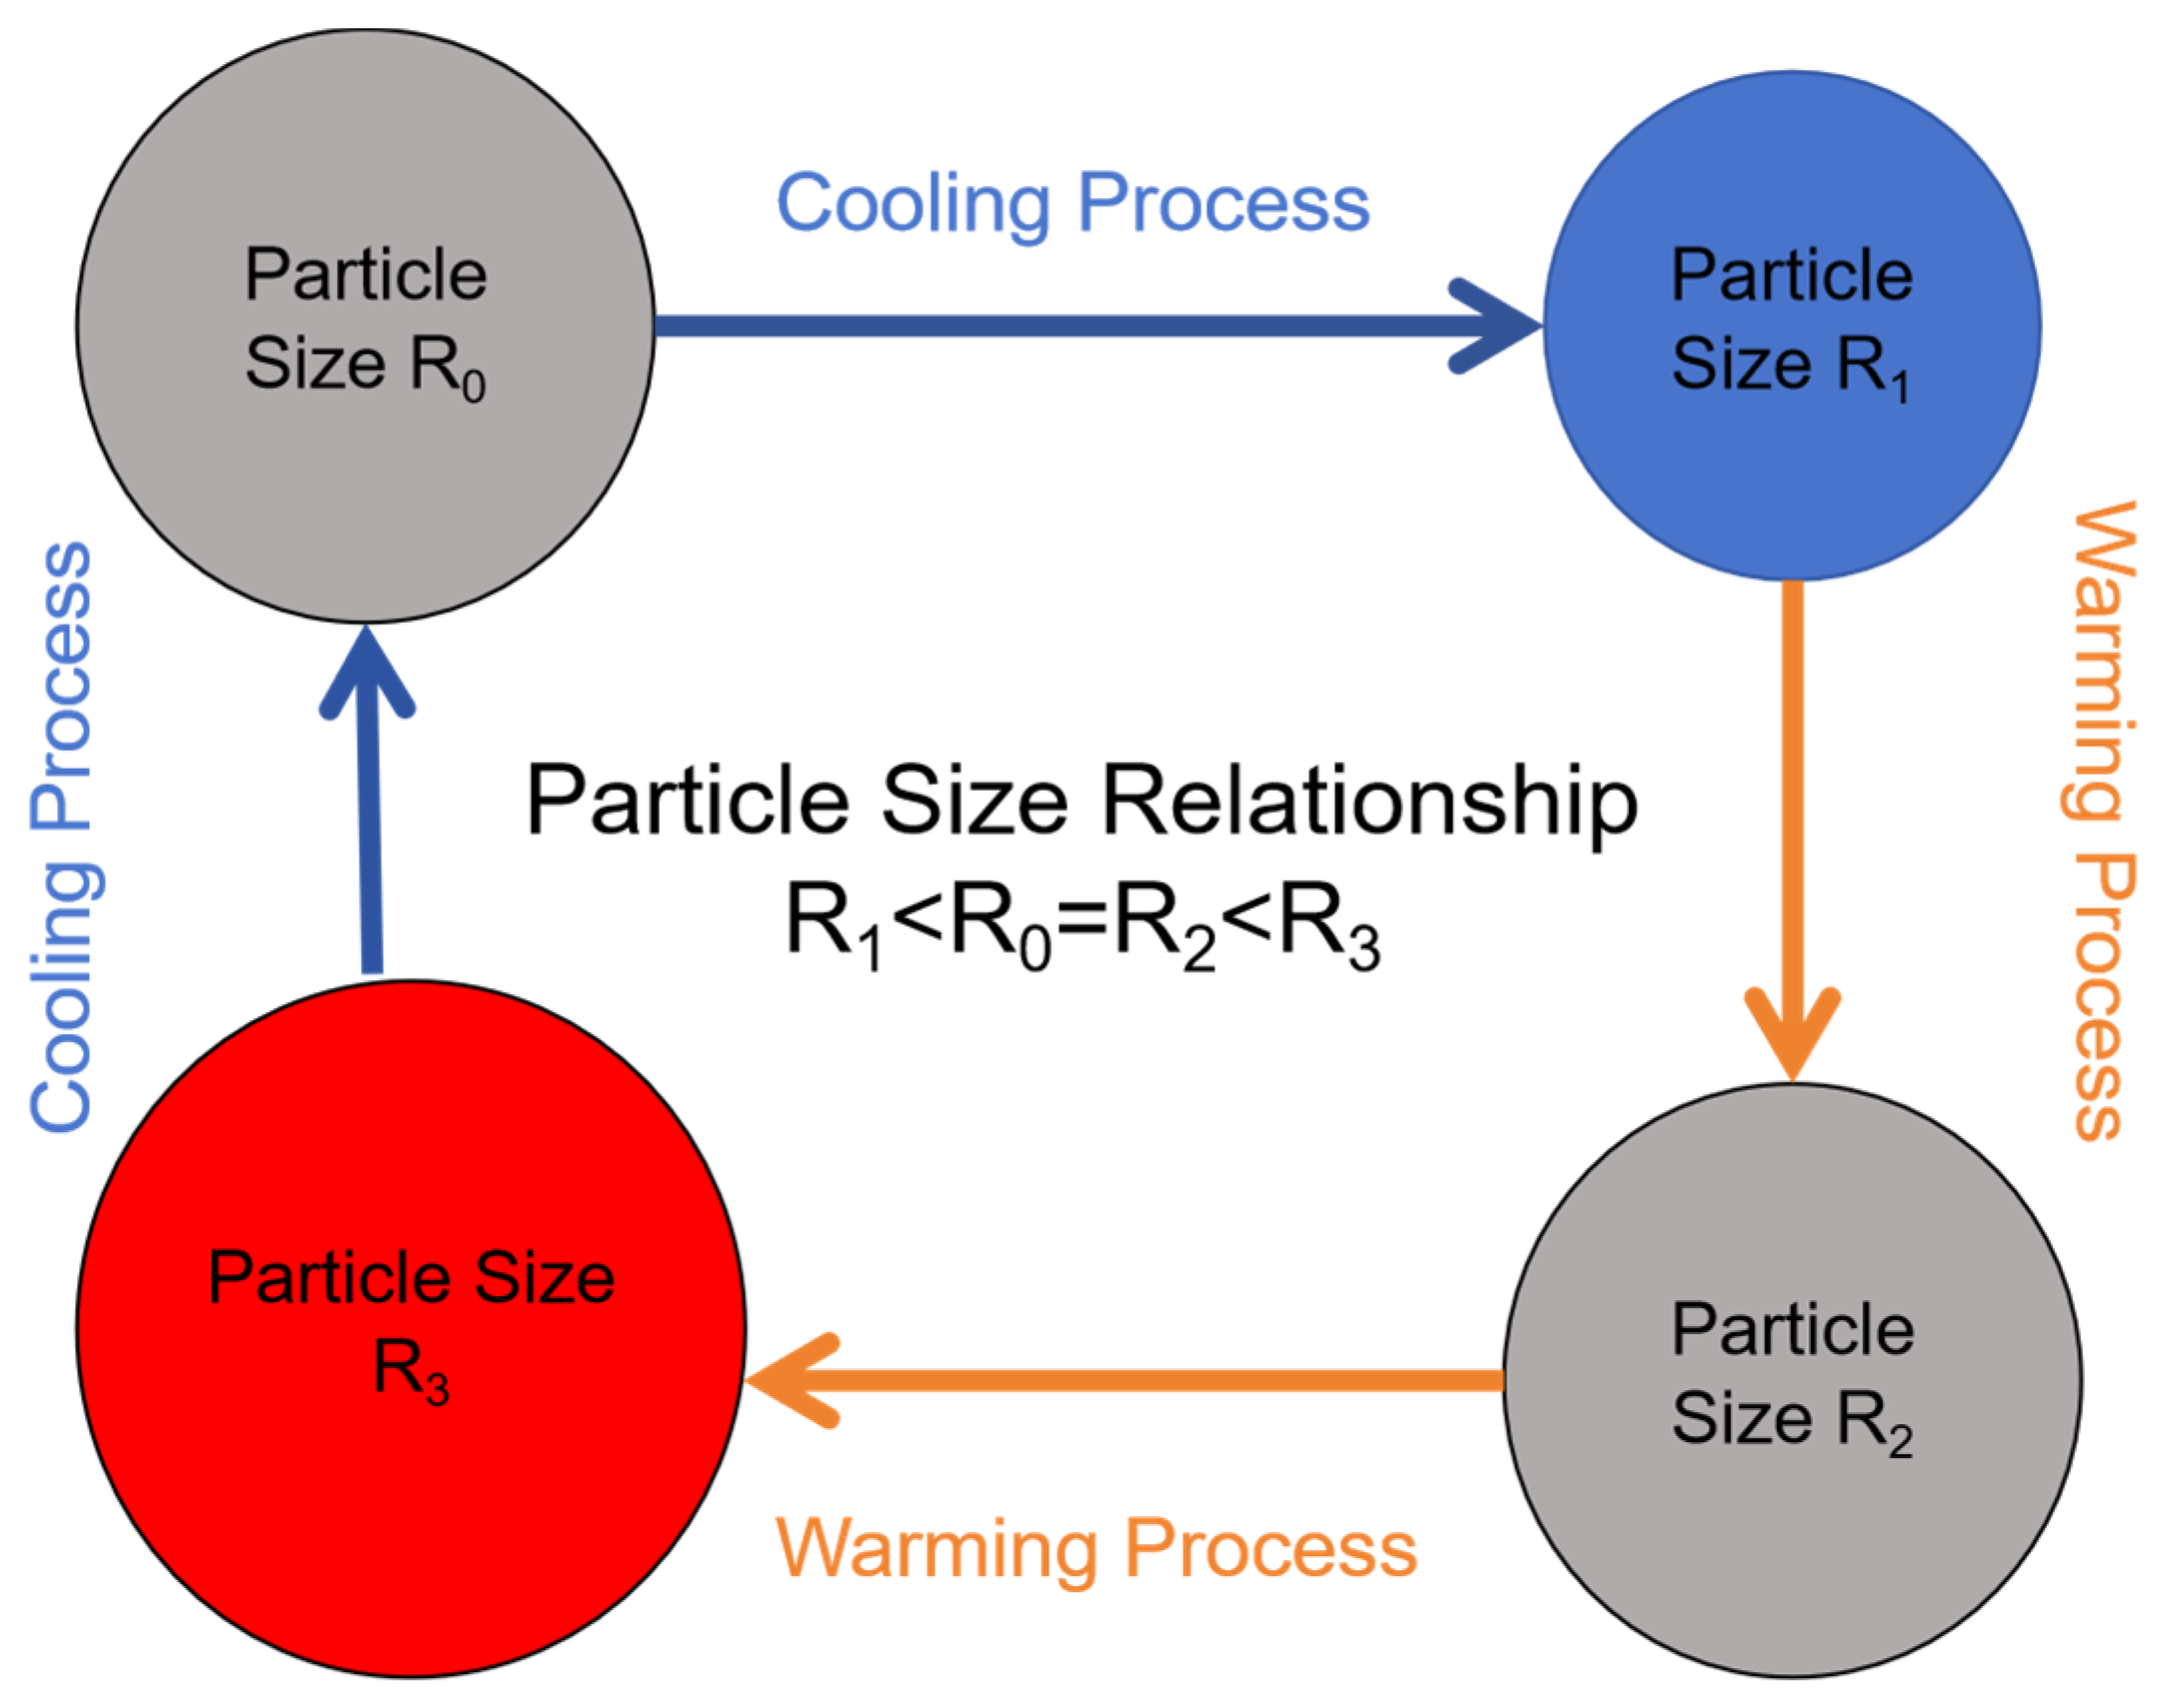
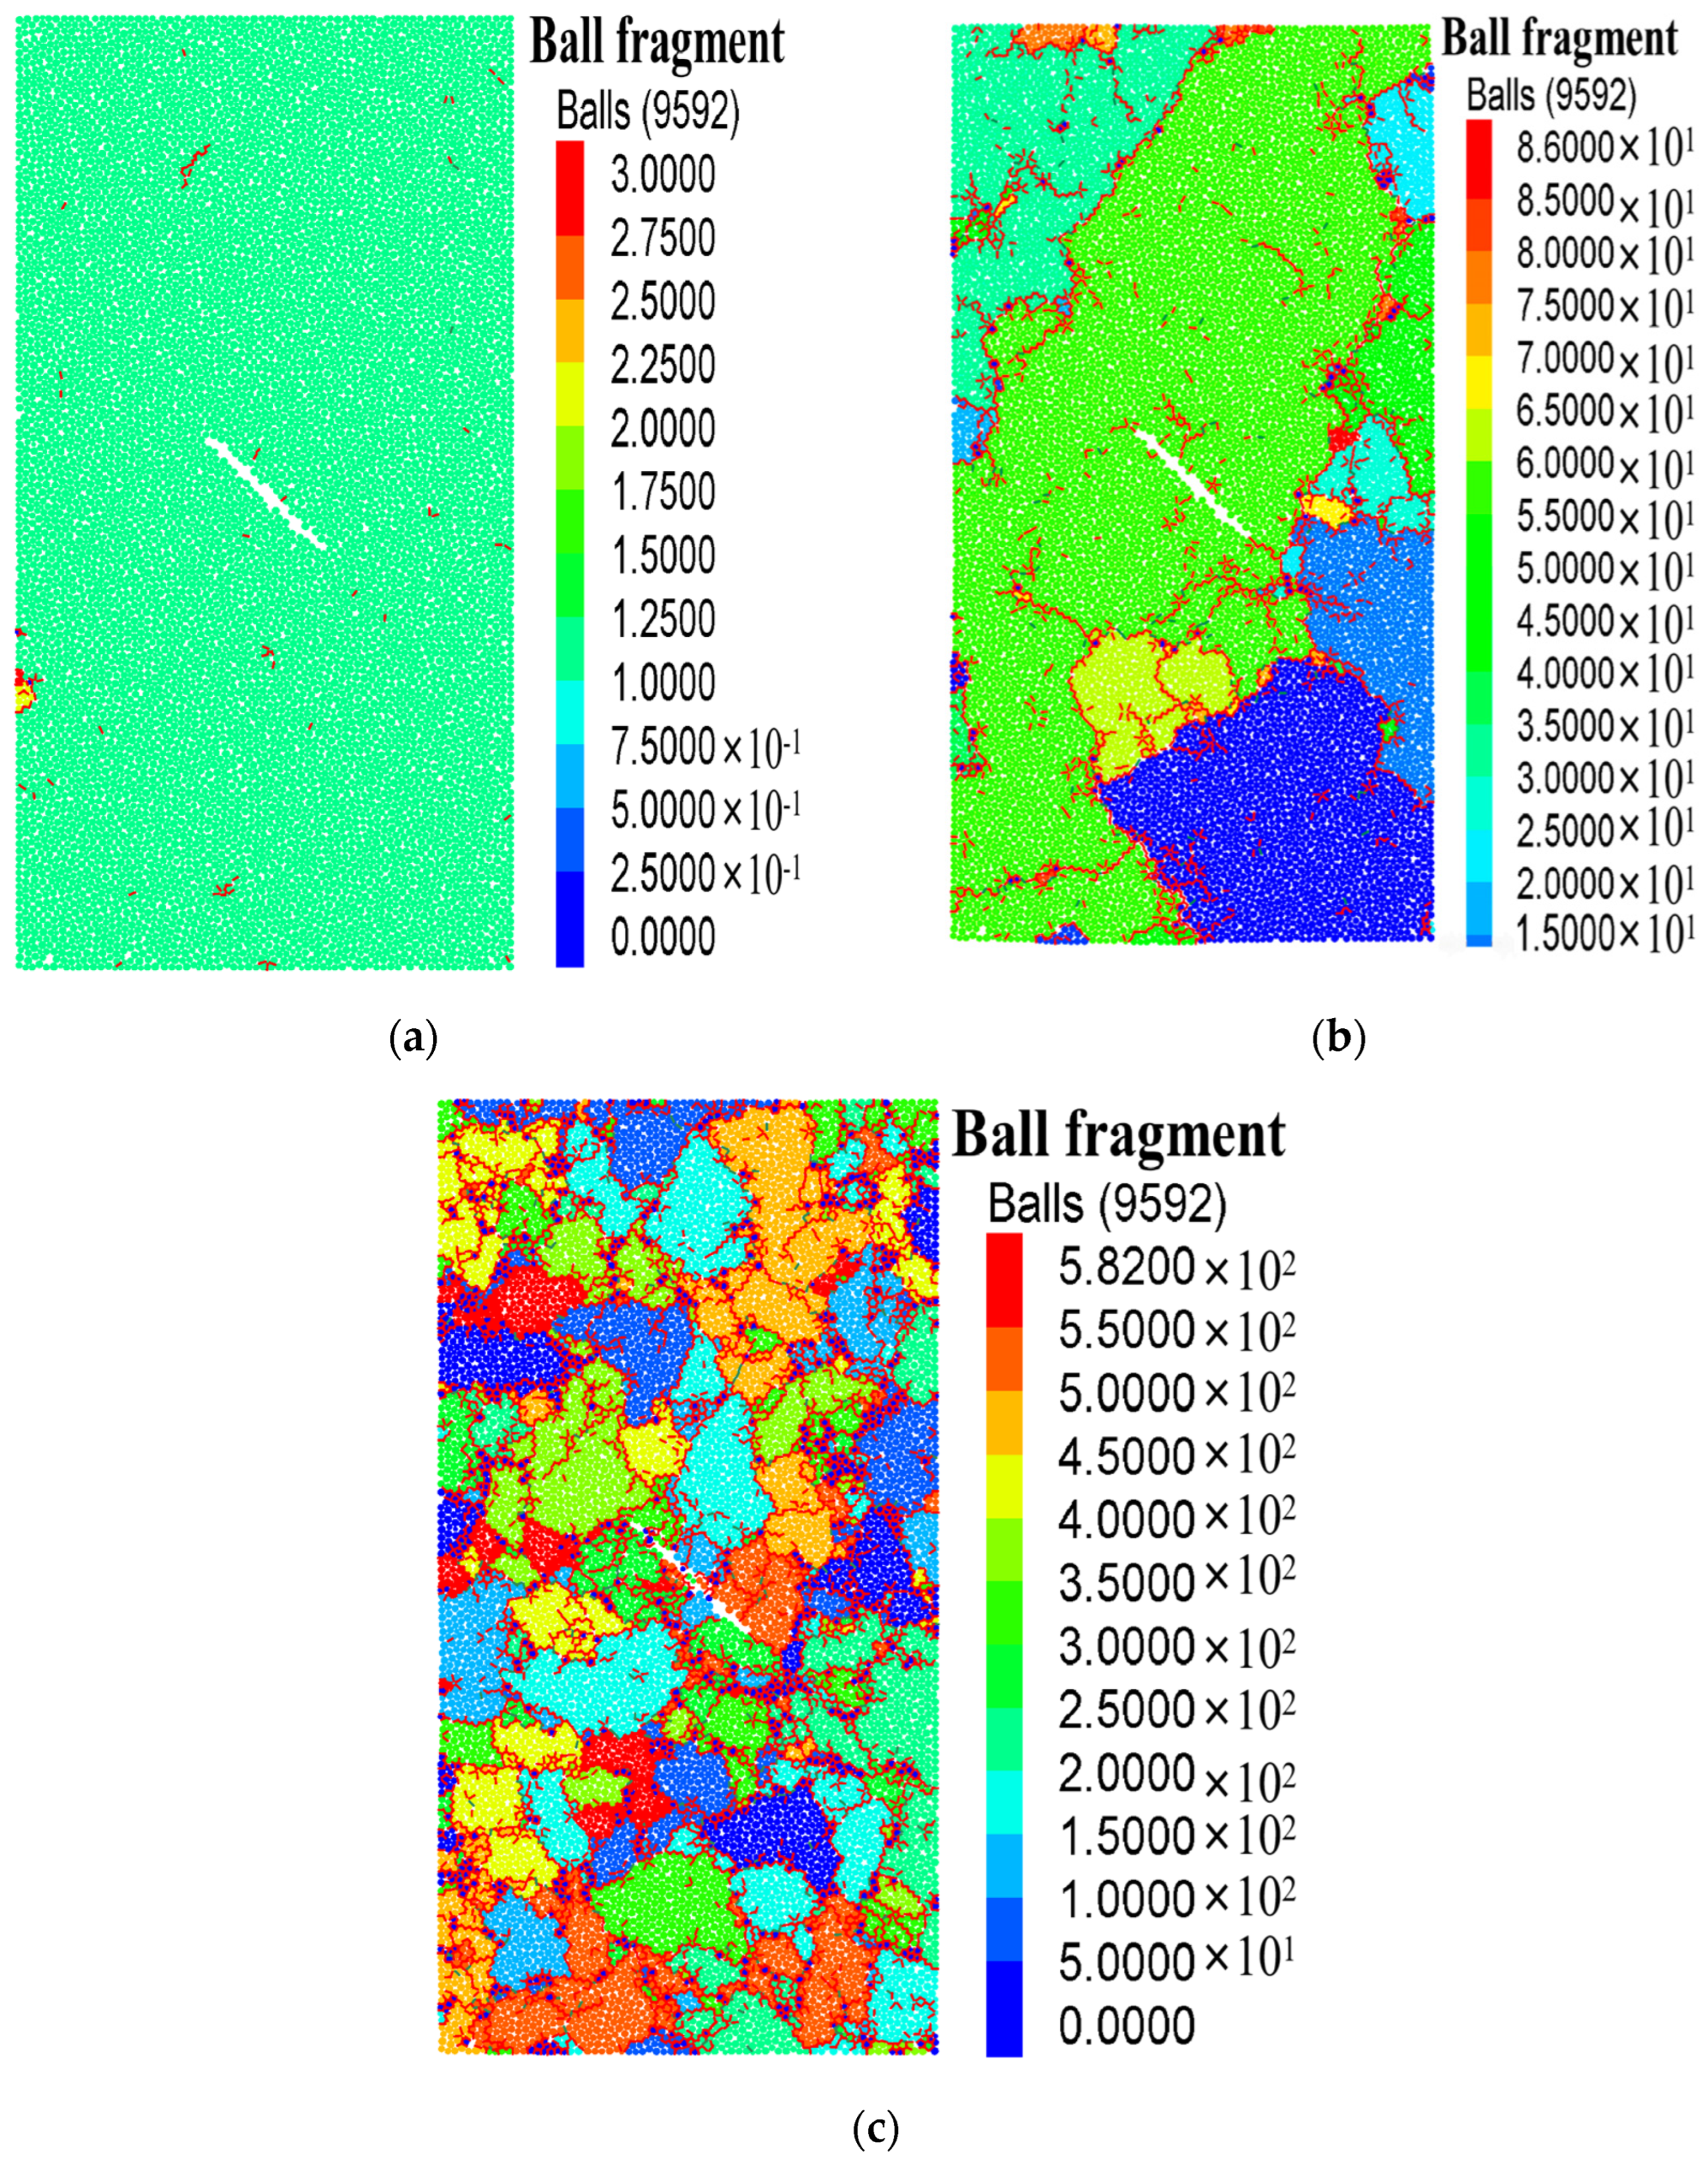
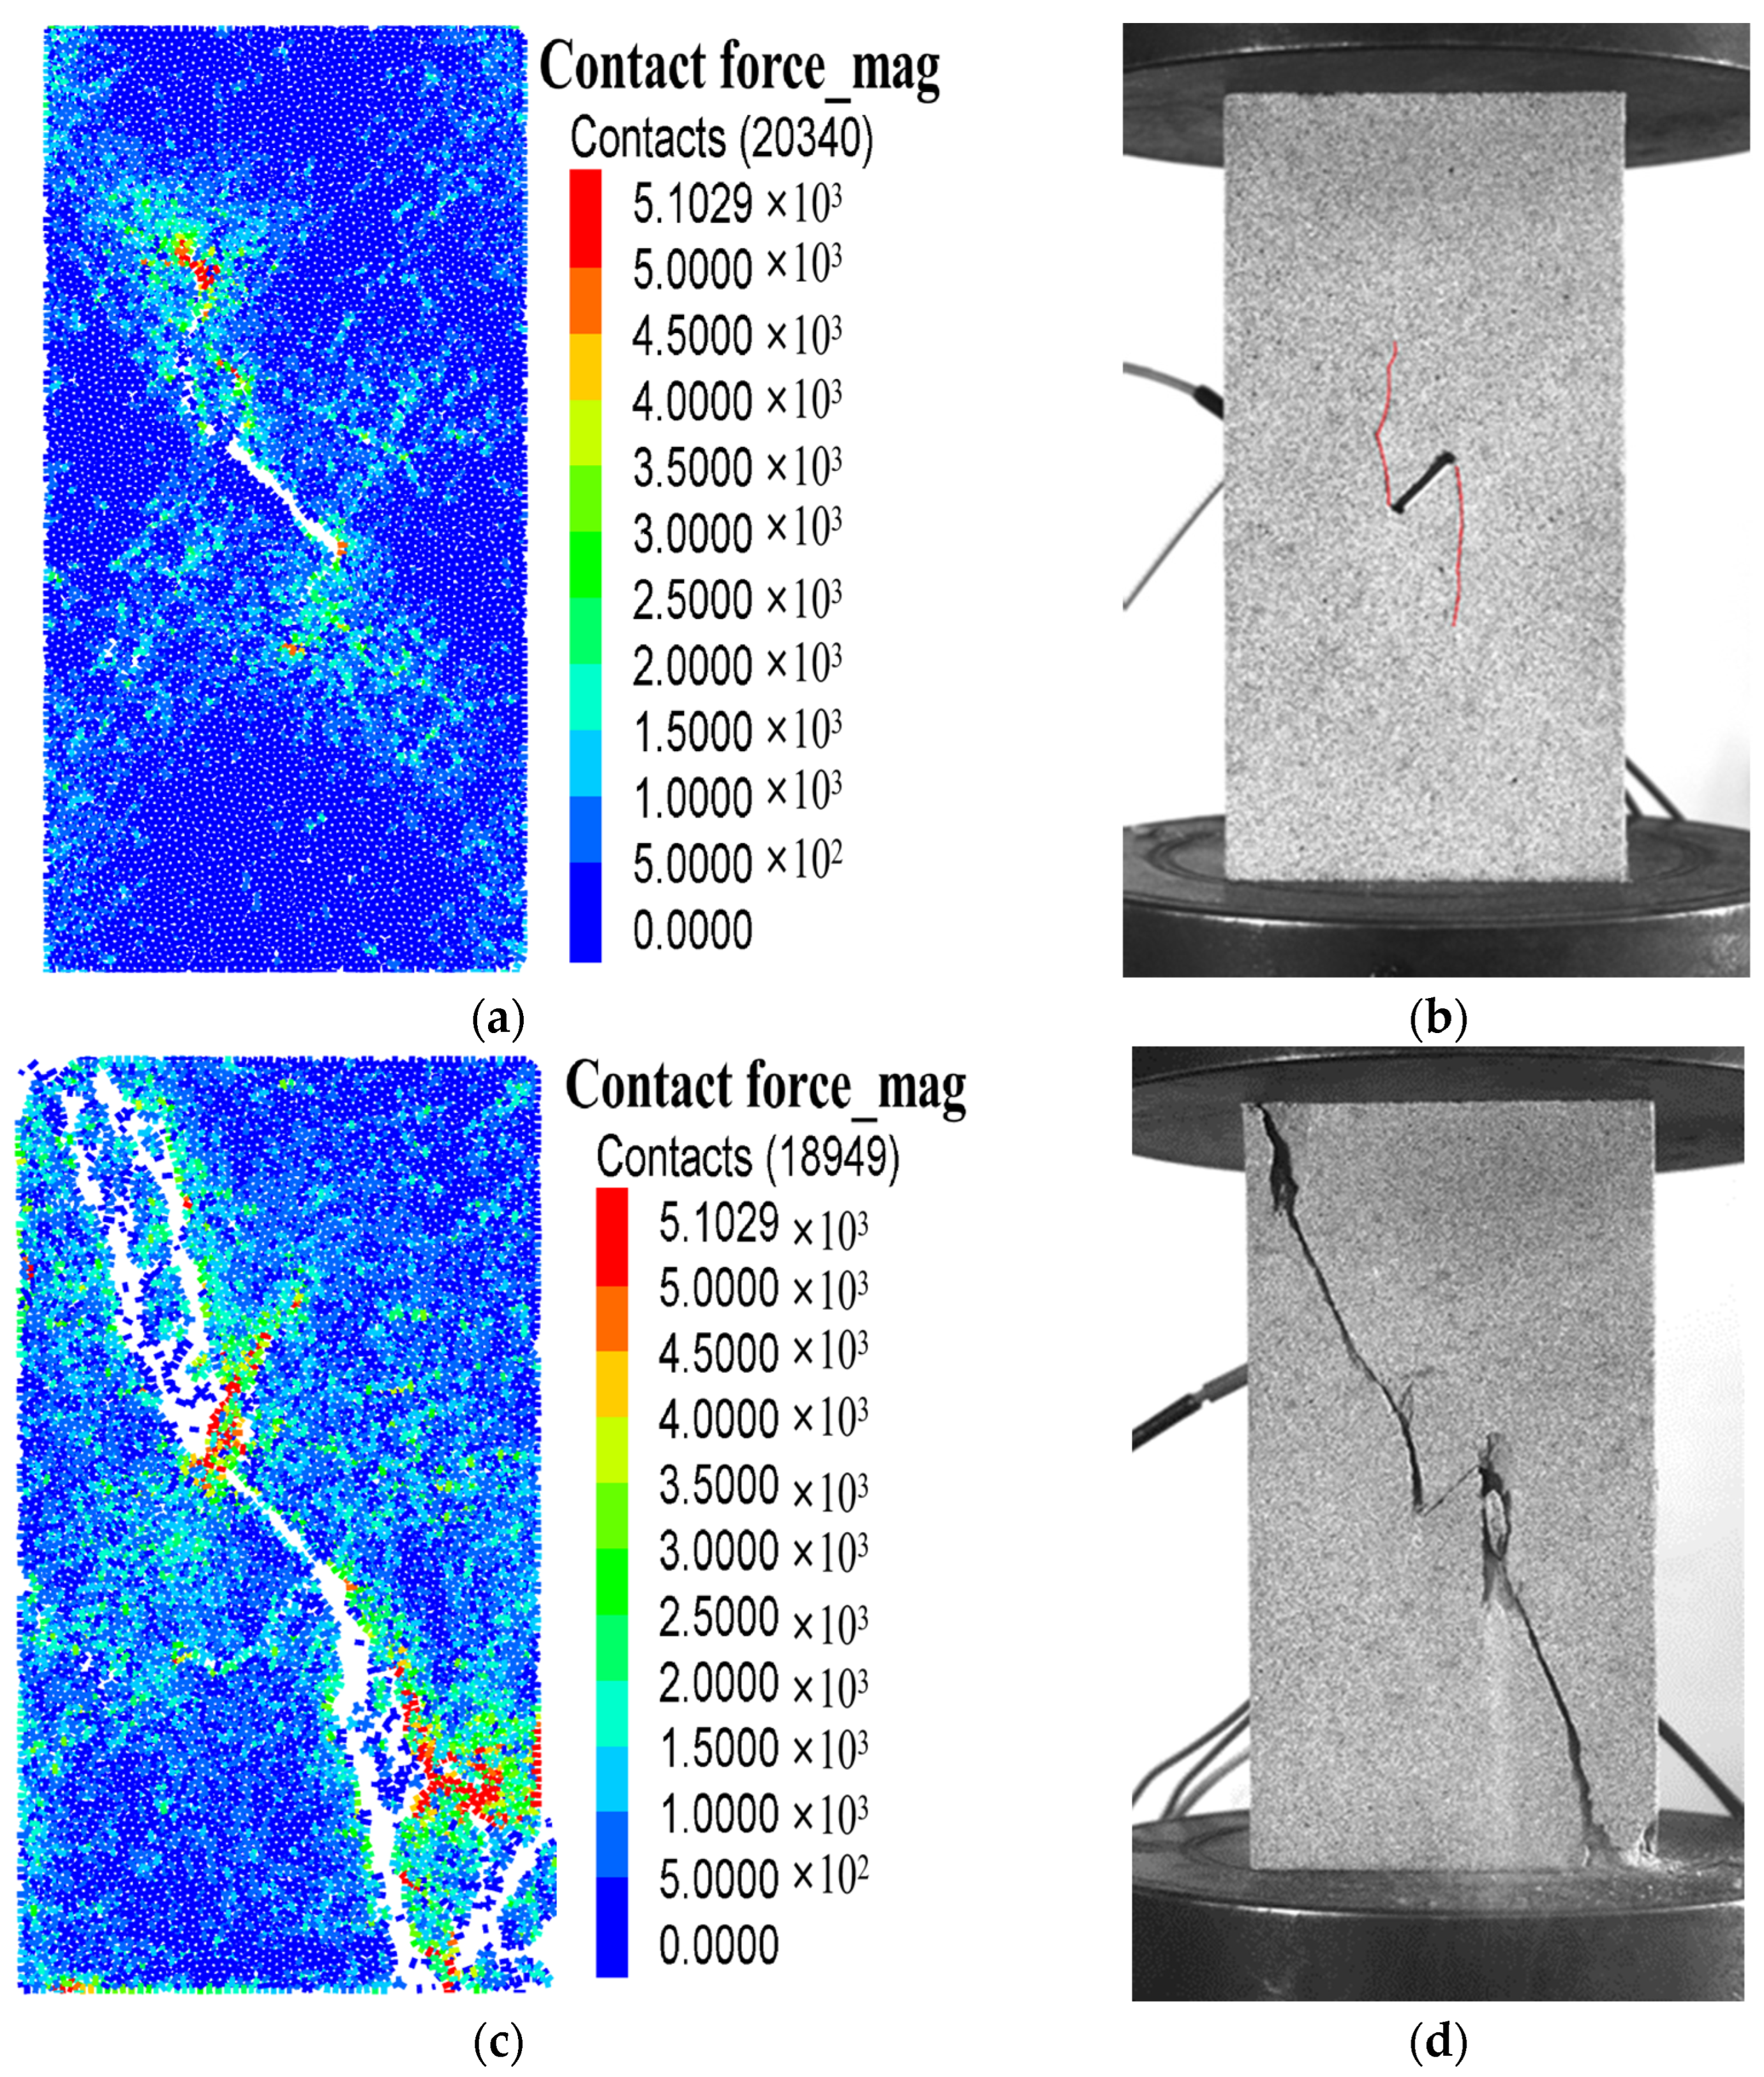
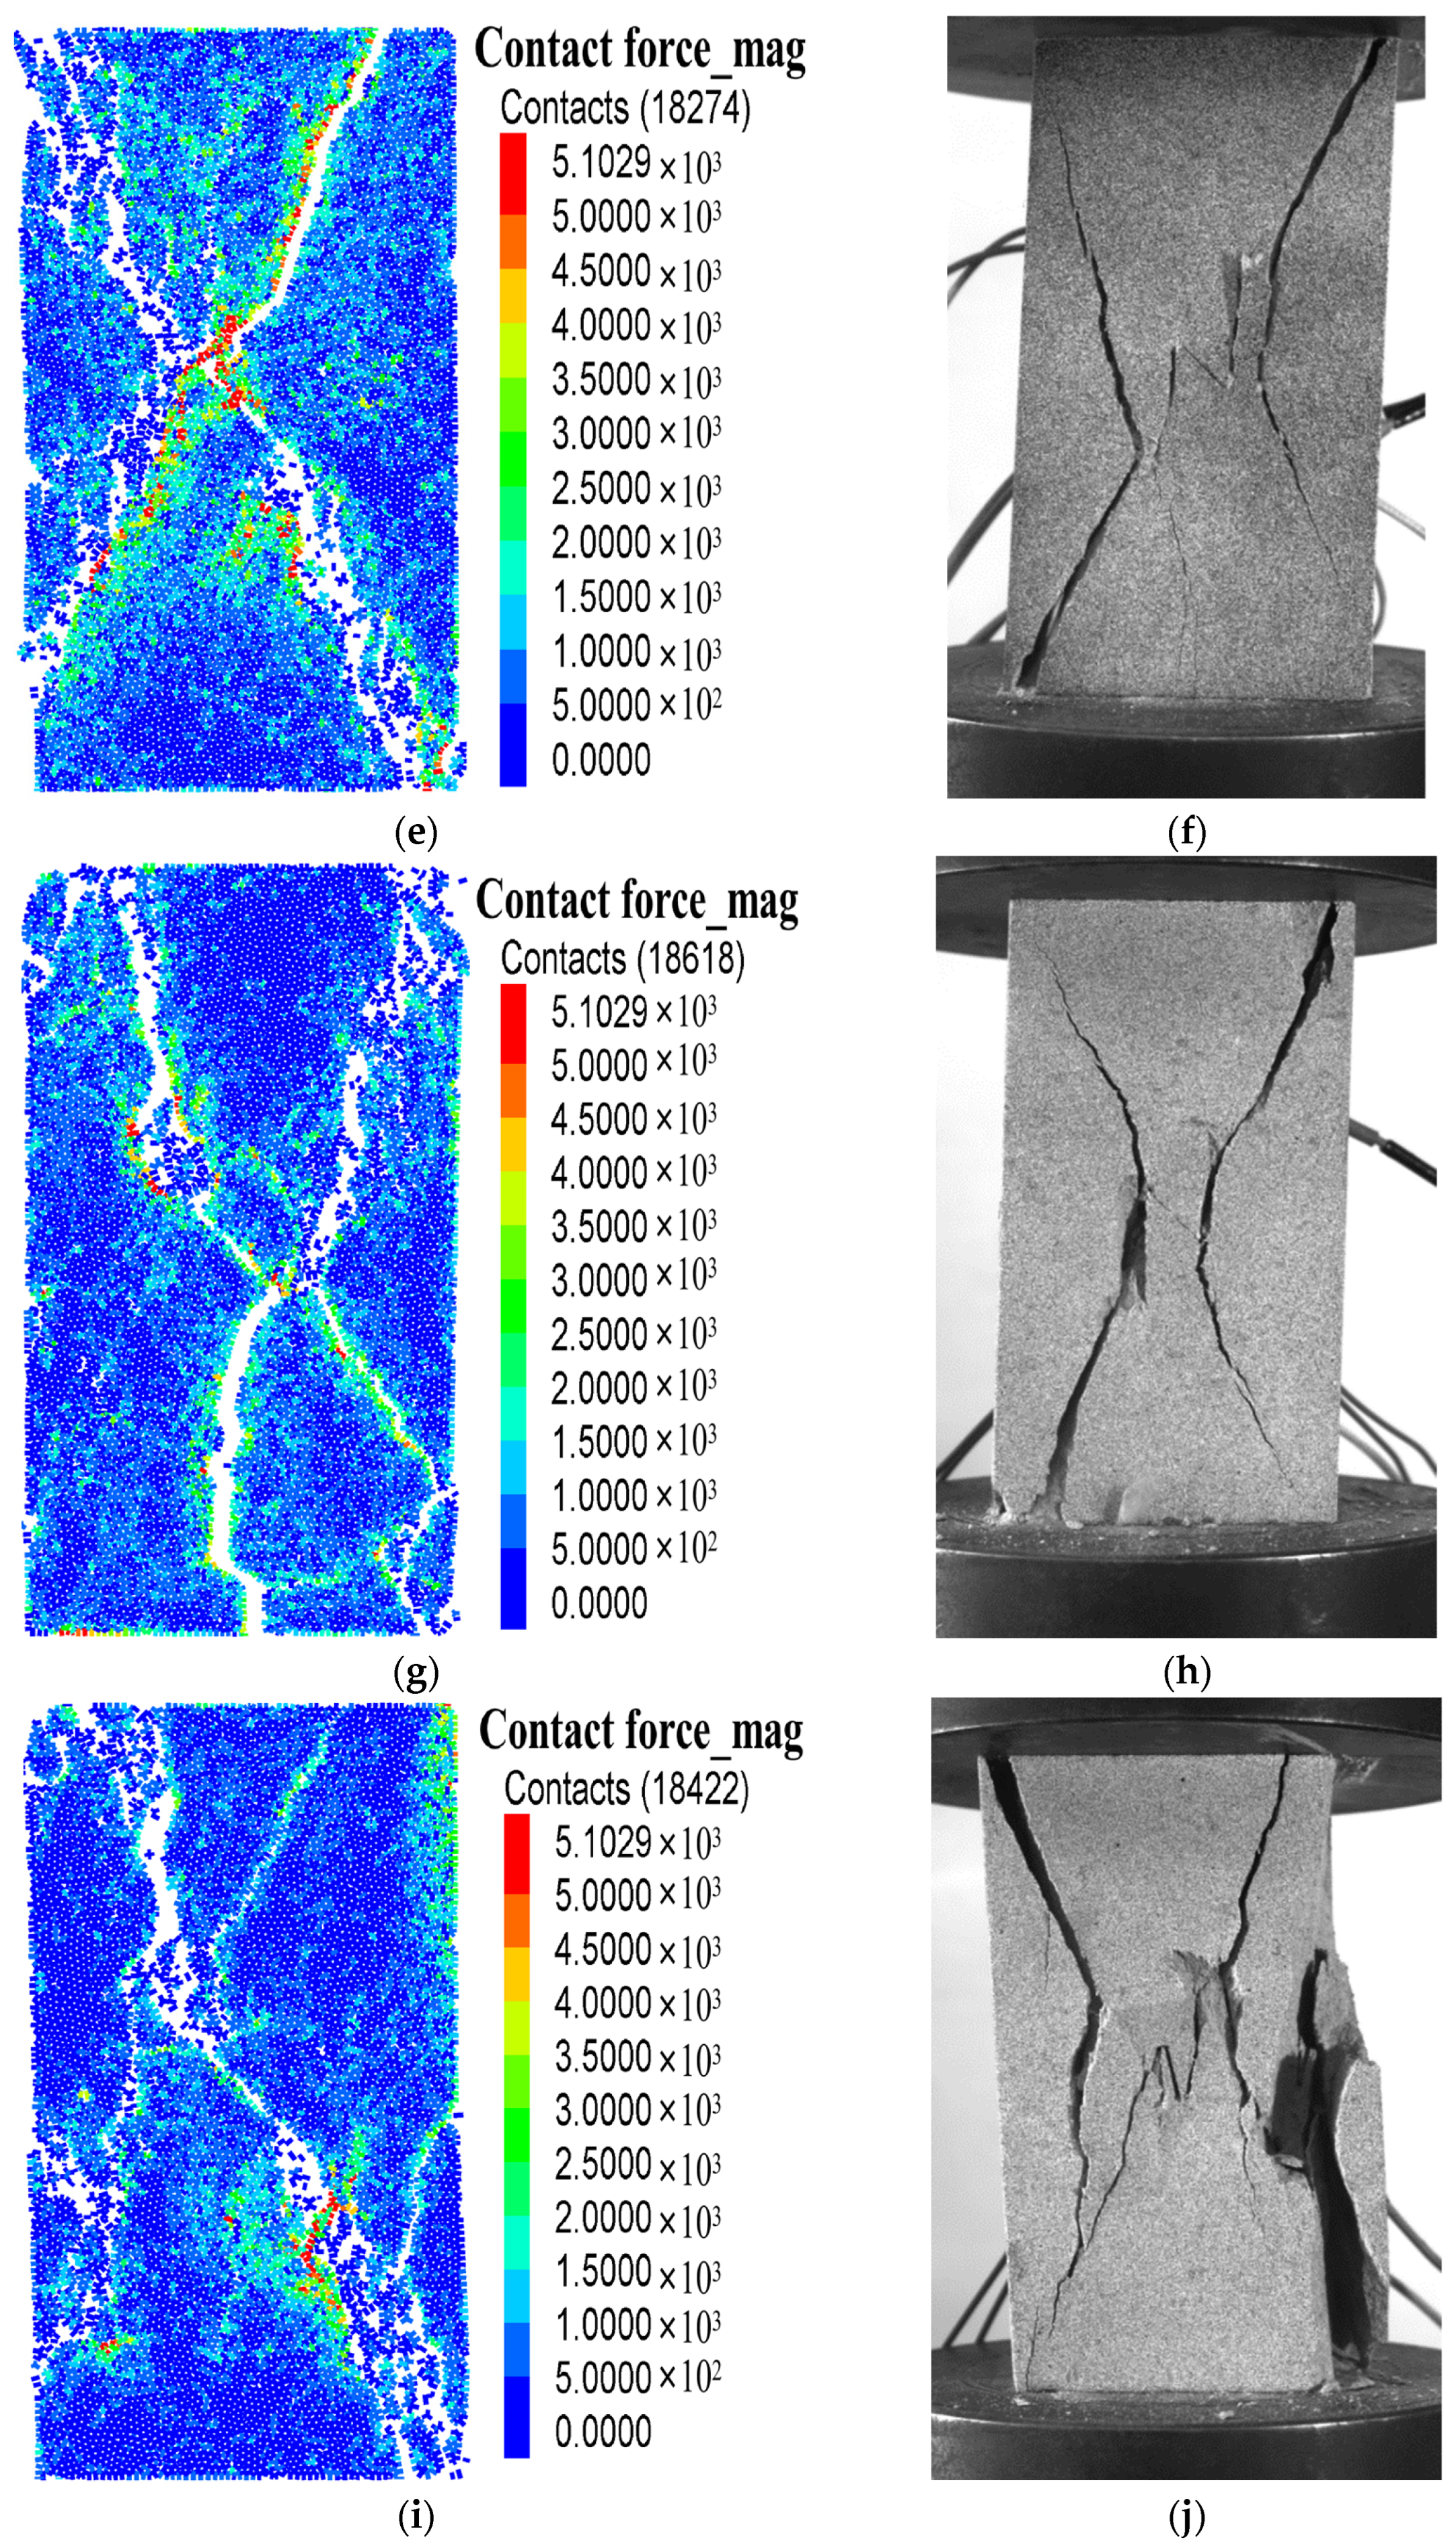
  • The crack extension pattern inside the specimen changes significantly with increased freeze–thaw cycles. When the number of freeze–thaw cycles is higher, the specimen is more likely to form X-shaped conjugate shear damage. When the number of freeze–thaw cycles is less, the specimen is more likely to have monoclinic shear damage. The freezing and swelling forces destroy the mineral particle cementation and reduce its strength. The freeze–thaw destroys the specimen from the outside to the inside, so the cracks are more inclined to expand to the outer surface, leading to block spalling on the outer surface of the specimen. These two factors combine to influence the damage pattern of the rock.
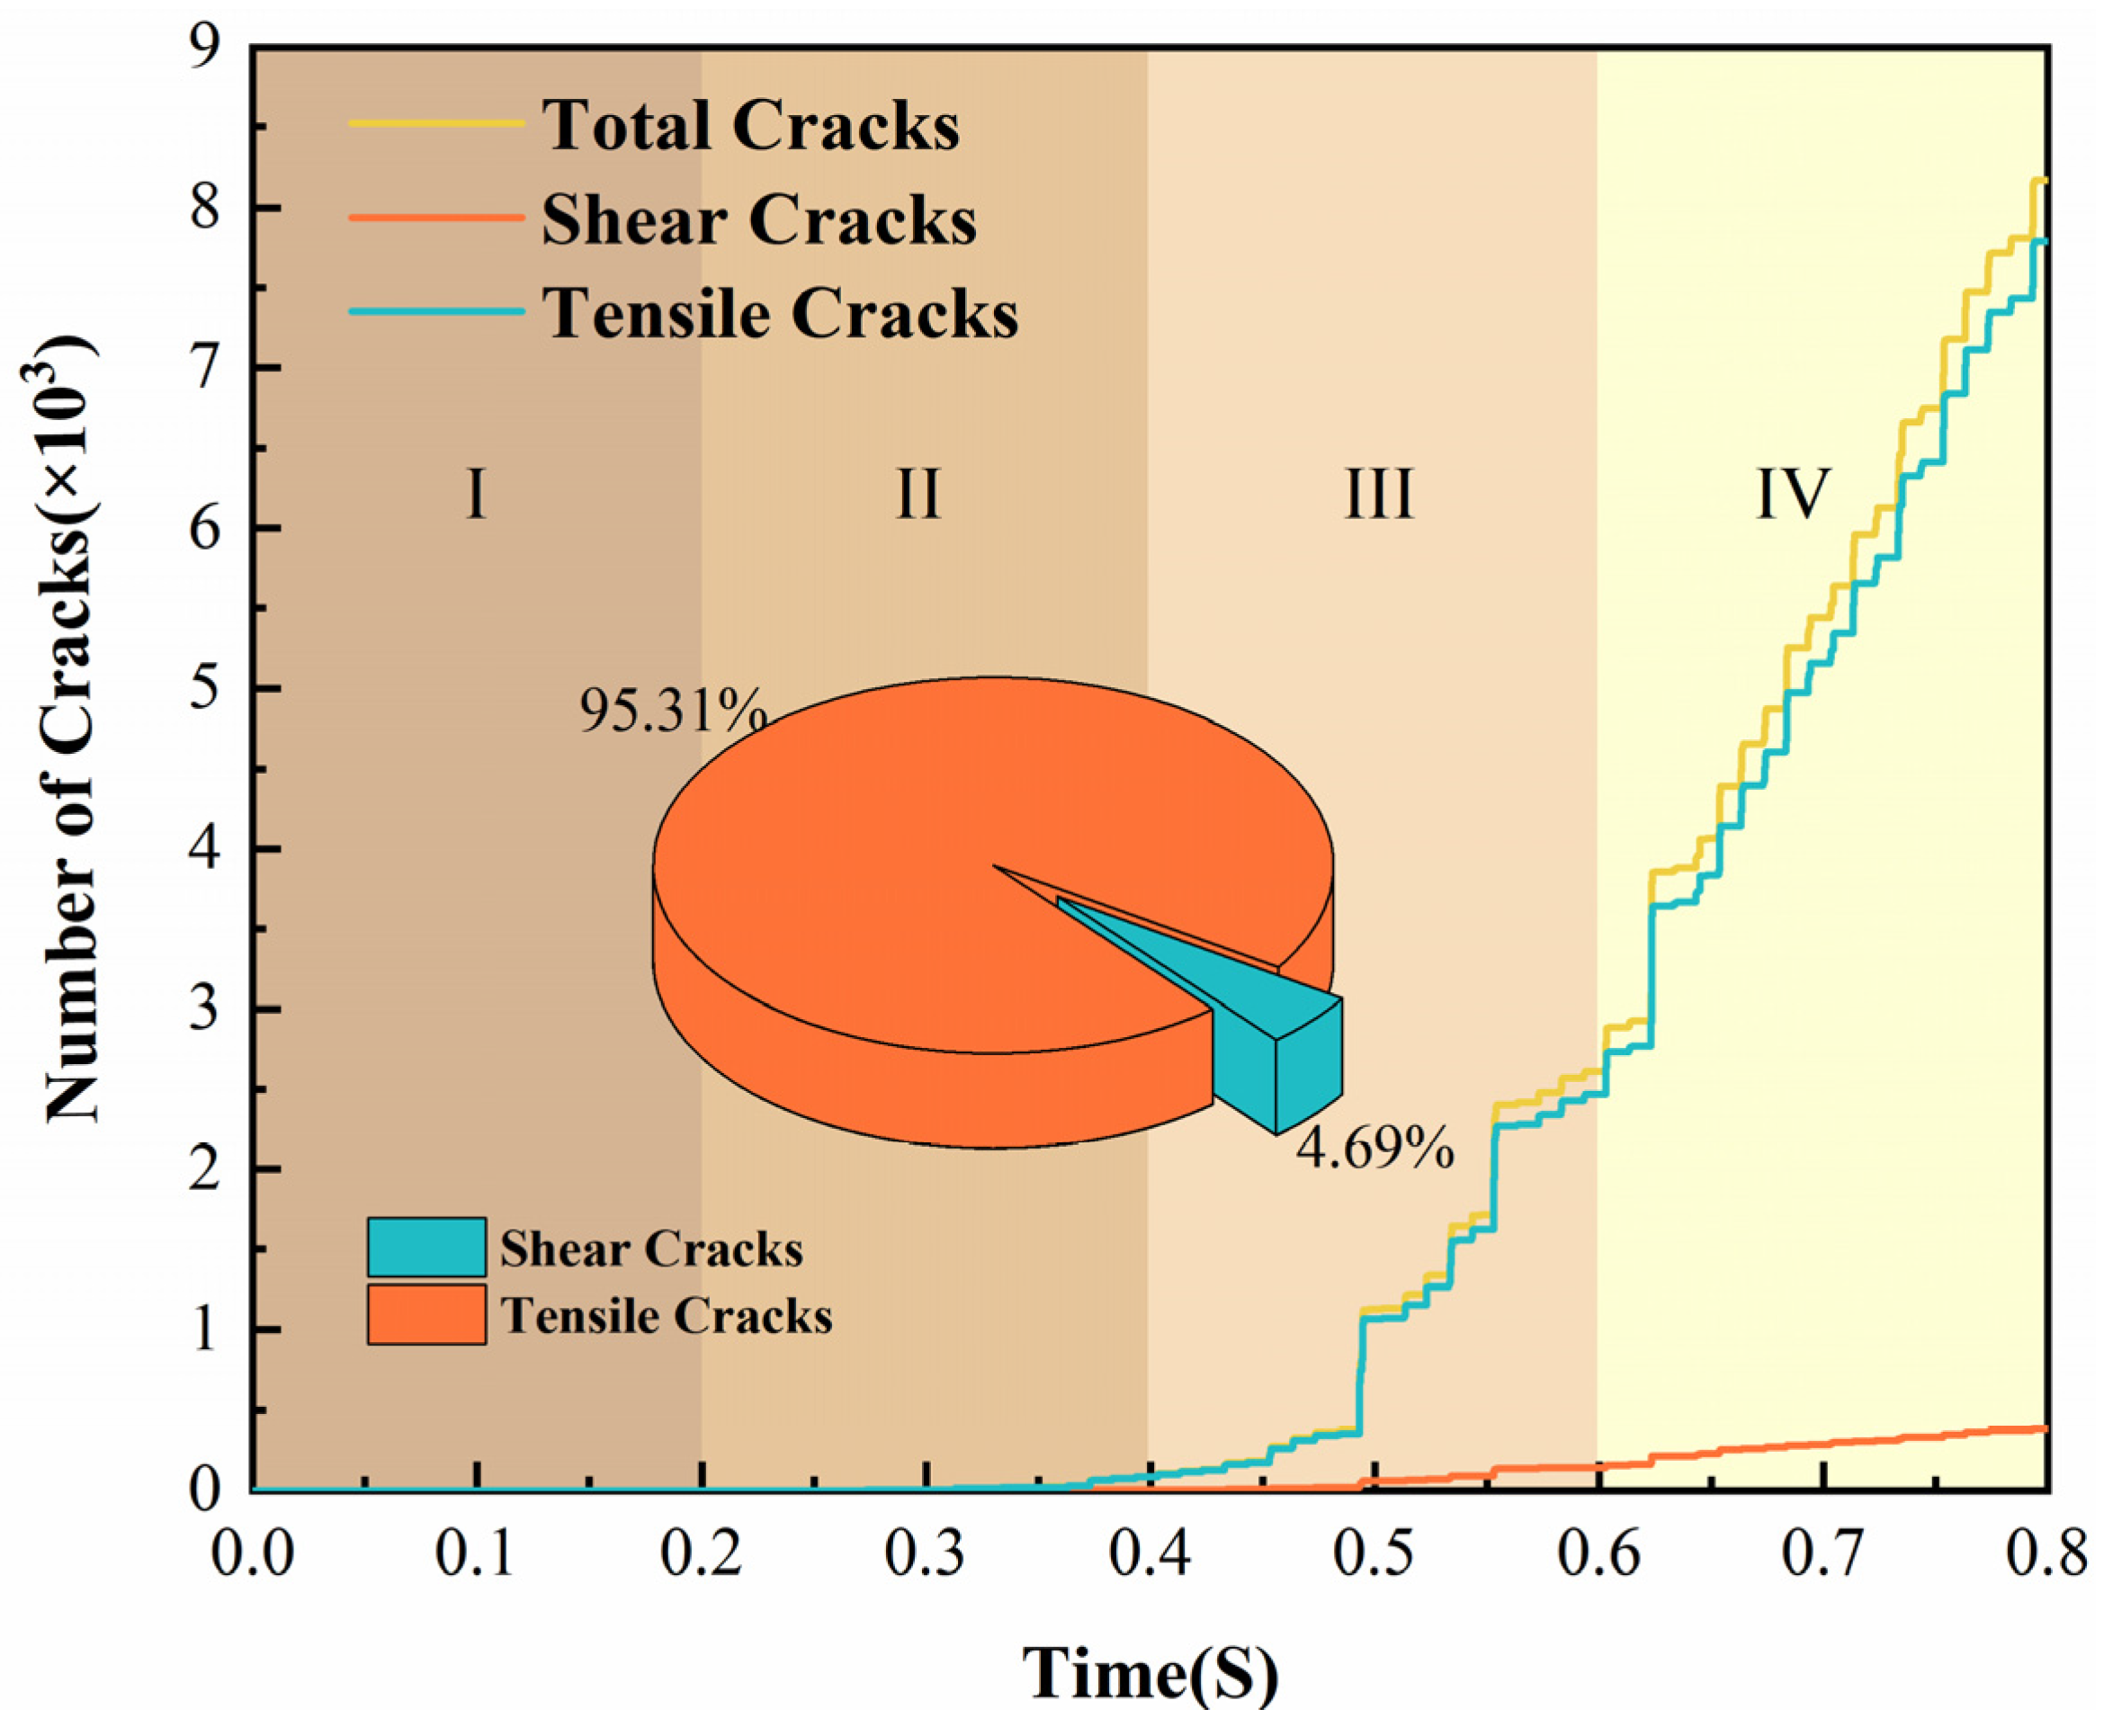
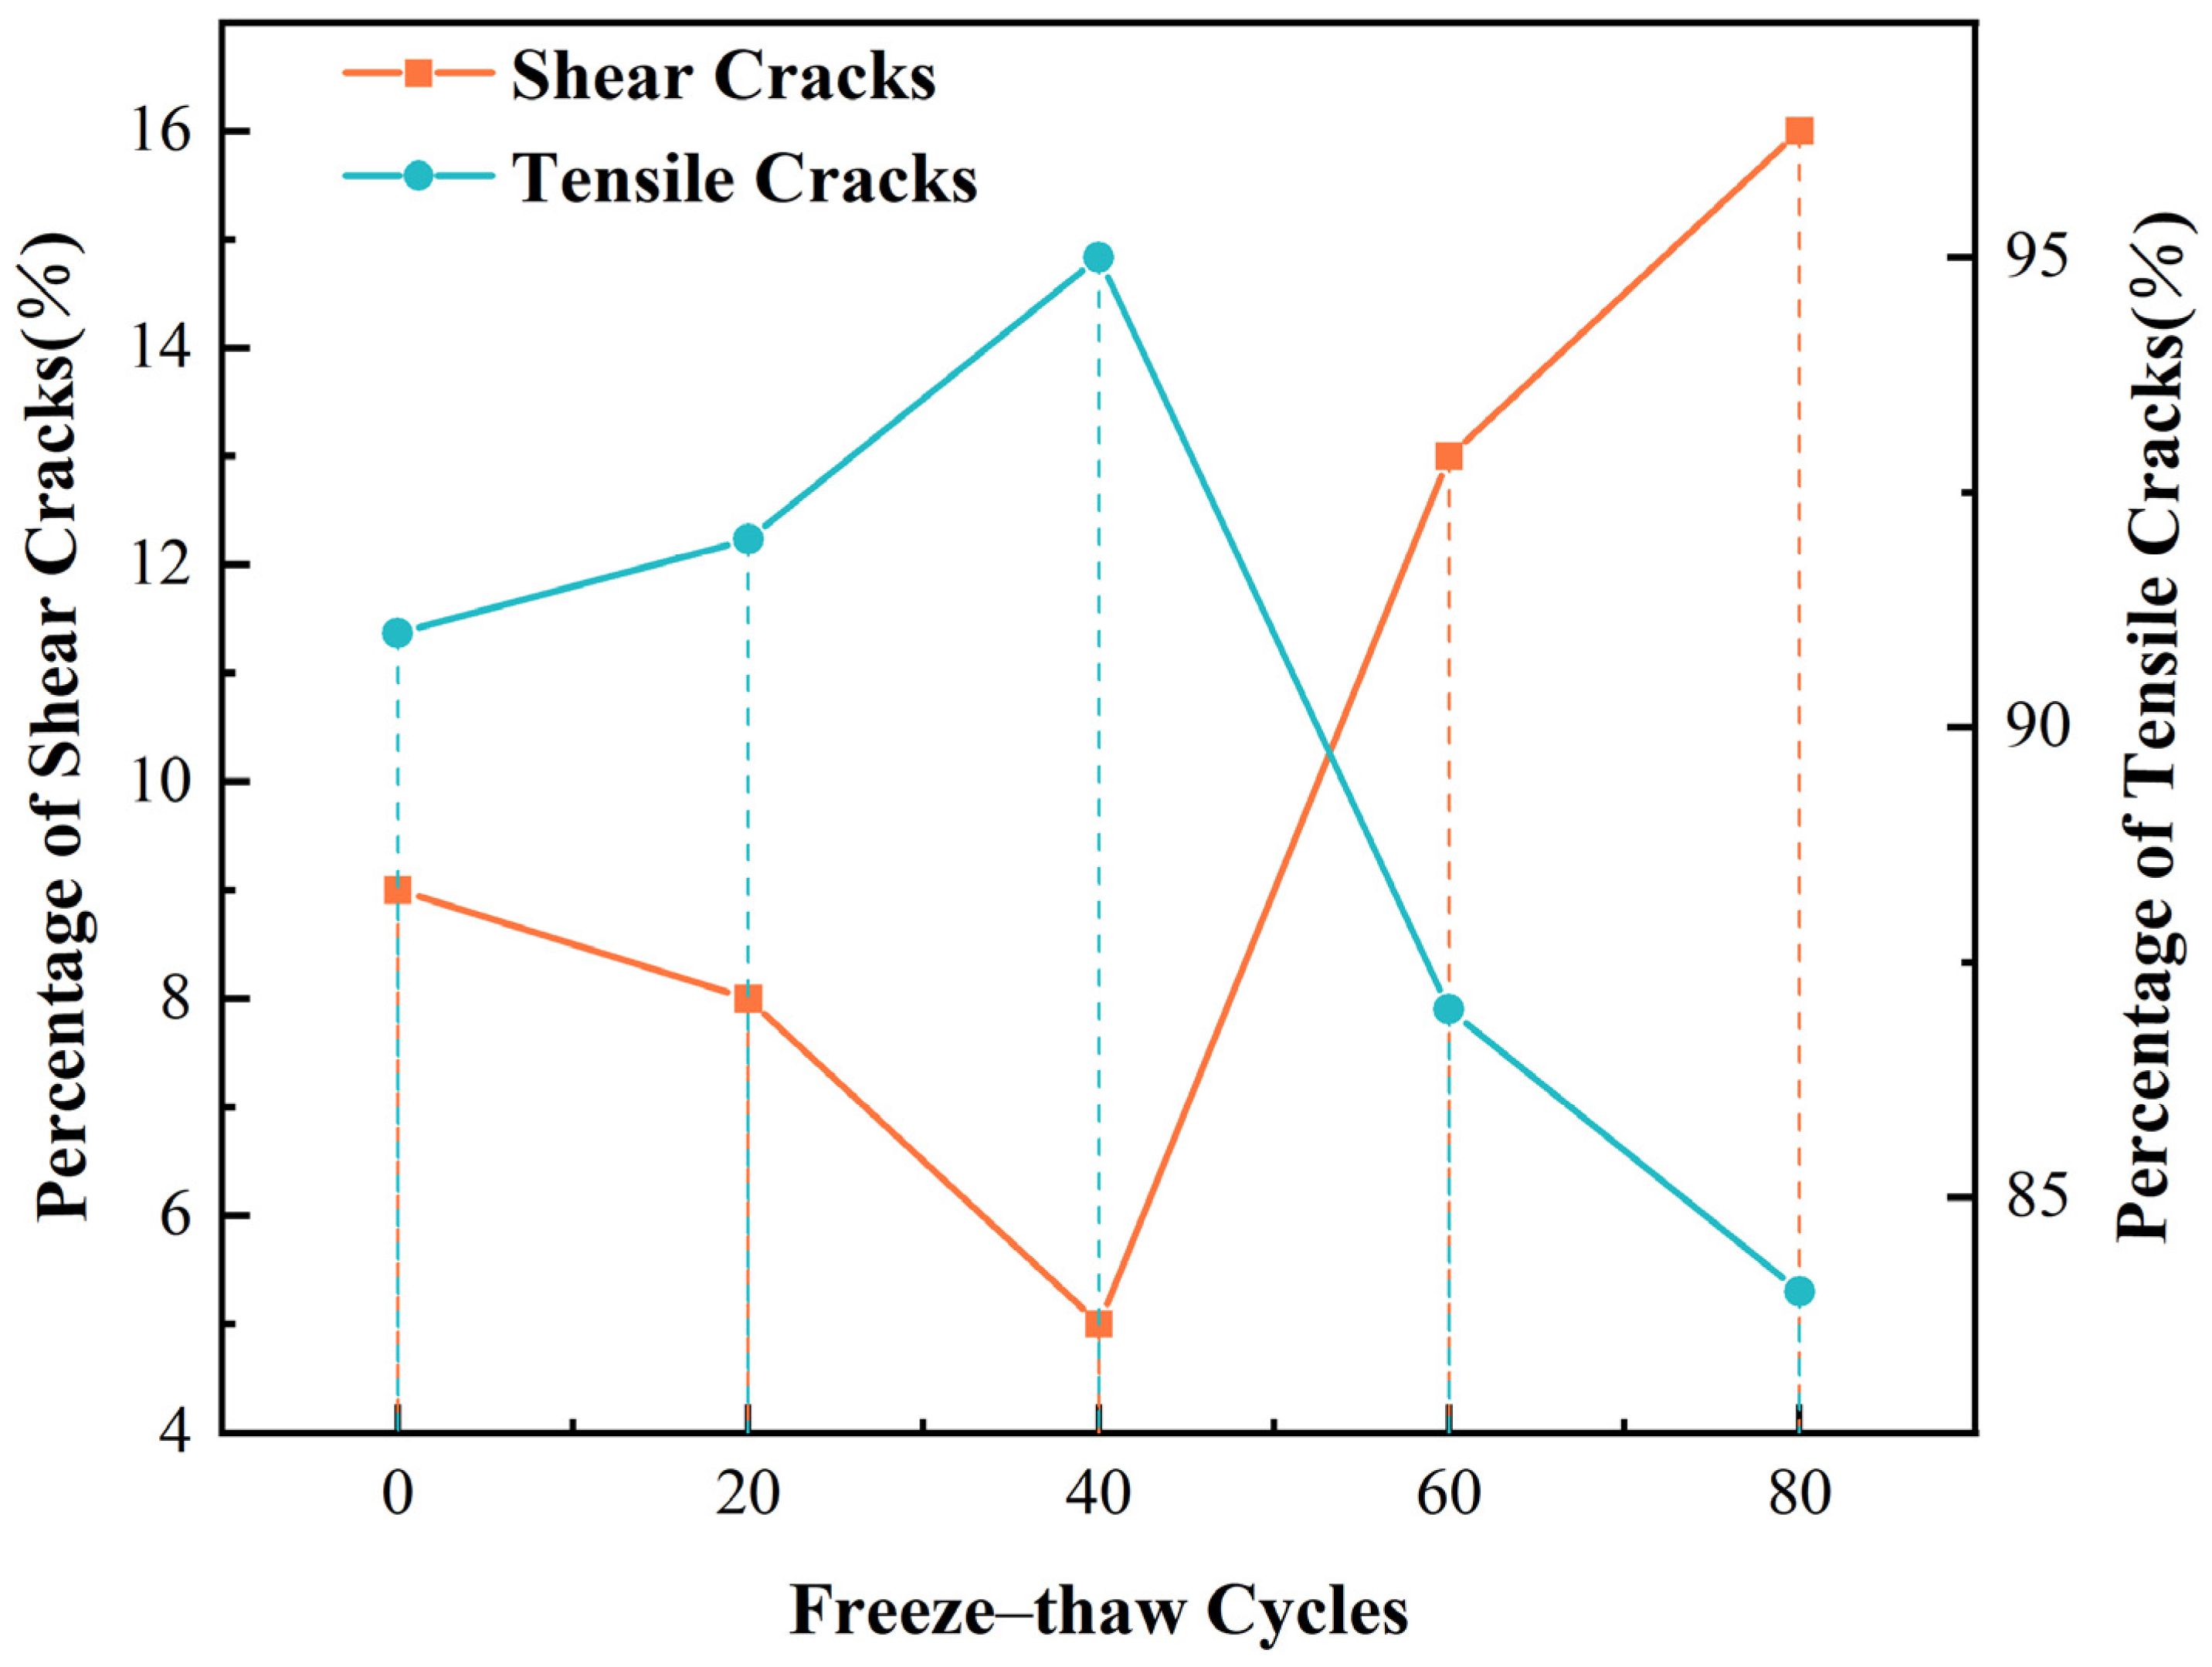
  • The emergence of cracks in the cyclic loading process shows a significant correlation with the magnitude of axial stress, and a large number of cracks appear in the late stage of cyclic loading. The number of tensile cracks dominated the whole loading and unloading process. However, after the 50th freeze–thaw cycle, the proportion of tensile cracks decreased, and the proportion of shear cracks gradually increased. It clarified that the sandstone was more prone to shear damage with increased freeze–thaw cycles.

Author Contributions

Conceptualization, T.L. and H.L.; formal analysis, P.C. and T.L.; writing—original draft, H.L.; writing—review and editing, T.L., L.D. and P.C. All authors have read and agreed to the published version of the manuscript.

Funding

This work was financially supported by the National Natural Science Foundation of China under Grant No. 52374108.

Institutional Review Board Statement

Not applicable.

Informed Consent Statement

Not applicable.

Data Availability Statement

The raw data supporting the conclusions of this article will be made available by the authors on request.

Conflicts of Interest

The authors declare no conflict of interest.

References

  1. Li, J.L.; Zhou, K.P.; Liu, W.J.; Deng, H.W. NMR research on deterioration characteristics of microscopic structure of sandstones in freeze-thaw cycles. Trans. Nonferr. Met. Soc. China 2016, 11, 2997–3003. [Google Scholar]
  2. Liu, Y.Z.; Cai, Y.T.; Huang, S.B.; Guo, Y.L.; Liu, G.F. Effect of water saturation on uniaxial compressive strength and damage degree of clay-bearing sandstone under freeze-thaw. Bull. Eng. Geol. Environ. 2020, 79, 2021–2036. [Google Scholar] [CrossRef]
  3. Martínez-Martínez, J.; Benavente, D.; Gomez-Heras, M.; Marco-Castaño, L.; García-del-Cura, M.Á. Non-linear decay of building stones during freeze–thaw weathering processes. Constr. Build. Mater. 2013, 38, 443–454. [Google Scholar] [CrossRef]
  4. Song, Y.; Tan, H.; Yang, H.; Shaojie, C.; Yongxin, C.; Jiaxing, C. Fracture evolution and failure characteristics of sandstone under freeze-thaw cycling by computed tomography. Eng. Geol. 2021, 294, 106370. [Google Scholar] [CrossRef]
  5. Jiang, D.-Y.; Zhang, S.-L.; Chen, J.; Yang, T.; Wang, X.-S.; Xie, K.-N.; Jiang, X. Low filed NMR and acoustic emission probability density study of freeze-thaw cycles damage for sandstone. Rock Soil Mech. 2019, 40, 436–444. (In Chinese) [Google Scholar]
  6. Chen, Y.-L.; Zhang, K.; Sun, H. Meso-research on the development of rock surface crack under freeze-thaw cycles. China Civ. Eng. J. 2019, 52 (Suppl. S1), 1–7. (In Chinese) [Google Scholar]
  7. Ke, B.; Zhang, C.Y.; Liu, C.J.; Ding, L.; Zheng, Y.; Li, N.; Wang, Y.; Lin, H. An experiment study on characteristics of impact compression of freeze-thaw granite specimens under four different states considering moisture content and temperature difference. Environ. Earth Sci. 2021, 80, 661. [Google Scholar] [CrossRef]
  8. Shi, Z.; Li, J.; Wang, J. Effect of creep load on fatigue behavior and acoustic emission characteristics of sandstone containing pre-existing crack during fatigue loading. Theor. Appl. Fract. Mech. 2022, 119, 103296. [Google Scholar] [CrossRef]
  9. Shi, Z.; Li, J.; Wang, J. Energy Evolution and Fracture Behavior of Sandstone Under the Coupling Action of Freeze–Thaw Cycles and Fatigue Load. Rock Mech. Rock Eng. 2023, 56, 1321–1341. [Google Scholar] [CrossRef]
  10. Shi, Z.; Li, J.; Wang, J.; Chen, J.; Lin, H.; Cao, P. Experimental and numerical study on fracture characteristics and constitutive model of sandstone under freeze-thaw-fatigue. Int. J. Fatigue 2023, 166, 107236. [Google Scholar]
  11. Liu, T.Y.; Zhang, C.Y.; Li, J.T.; Keping, Z.; Ping, C. Detecting freeze–thaw damage degradation of sandstone with initial damage using NMR technology. Bull. Eng. Geol. Environ. 2021, 80, 4529–4545. [Google Scholar] [CrossRef]
  12. Song, Y.-J.; Sun, Y.-W.; Li, C.-J.; Yang, H.M.; Zhang, L.T.; Xie, L.J. Meso-fracture evolution characteristics of freeze-thaw sandstone based on discrete element method simulation. Rock Soil Mech. 2023, 44, 3602–3616. (In Chinese) [Google Scholar] [CrossRef]
  13. Abdolghanizadeh, K.; Hosseini, M.; Saghafiyazdi, M. Effect of freezing temperature and number of freeze-thaw cycles on mode I and mode II fracture toughness of sandstone. Theor. Appl. Fract. Mech. 2020, 105, 102428. [Google Scholar] [CrossRef]
  14. Wang, Y.; Yi, X.F.; Li, P.; Cai, M.F.; Sun, T. Macro-meso damage cracking and volumetric dilatancy of fault block-in-matrix induced by freeze-thaw-multistage constant amplitude cyclic (F-T-MSCAC) loads. Fatigue Fract. Eng. Mater. Struct. 2022, 45, 2990–3008. [Google Scholar] [CrossRef]
  15. Song, Z.Y.; Konietzky, H.; Wu, Y.F.; Kun, D.; Xin, C. Mechanical behaviour of medium-grained sandstones exposed to differential cyclic loading with distinct loading and unloading rates. J. Rock Mech. Geotech. Eng. 2022, 14, 1849–1871. [Google Scholar] [CrossRef]
  16. Zhou, Y.; Zhao, D.; Li, B.; Wang, H.Y.; Tang, Q.Q.; Zhang, Z.Z. Fatigue Damage Mechanism and Deformation Behaviour of Granite Under Ultrahigh-Frequency Cyclic Loading Conditions. Rock Mech. Rock Eng. 2021, 54, 4723–4739. [Google Scholar] [CrossRef]
  17. Xiong, F.; Liu, X.; Zhou, X.; Lin, G.Y.; Liu, D.S.; Han, Y.F.; Xu, B.; He, C.M.; Wang, Z.J. Mechanical behaviours of sandstone containing intersecting cracks under uniaxial compression. J. Rock Mech. Geotech. Eng. 2022, 14, 460–476. [Google Scholar] [CrossRef]
  18. Bian, K.; Chen, Y.-A.; Liu, J.; Cui, D.S.; Li, Y.R.; Liang, W.D.; Han, X. The unloading failure characteristics of shale under different water absorption time using the PFC numerical method. Rock Soil Mech. 2020, 41 (Suppl. S1), 355–367. (In Chinese) [Google Scholar]
  19. Aliha, M.R.M.; Ayatollahi, M.R.; Smith, D.J.; Pavier, M.J. Geometry and size effects on fracture trajectory in a limestone rock under mixed mode loading. Eng. Fract. Mech. 2010, 77, 2200–2212. [Google Scholar] [CrossRef]
  20. Al-Shayea, N. Crack propagation trajectories for rocks under mixed mode I-II fracture. Eng. Geol. 2005, 81, 84–97. [Google Scholar] [CrossRef]
  21. Zhang, Z.H.; Deng, J.H. A new method for determining the crack classification criterion in acoustic emiss ion parameter analysis. Int. J. Rock Mech. Min. Sci. 2020, 130, 104323. [Google Scholar] [CrossRef]
  22. Aldandooh, M.A.A.; Bunnori, N.M. Crack classification in reinforced concrete beams with varying thicknesses by mean of acoustic emission signal features. Constr. Build. Mater. 2013, 45, 282–288. [Google Scholar] [CrossRef]
  23. Shi, Z.C.; Li, J.T.; Wang, J. Research on the fracture mode and damage evolution model of sandstone containing pre-existing crack under different stress paths. Eng. Fract. Mech. 2022, 264, 108299. [Google Scholar] [CrossRef]
  24. Wu, L.; Zhou, K.; Gao, F.; Gu, Z.Y.; Yang, C. Research on the Mechanical Characteristics of Cyclic Loading and Unloading of Rock Based on Infrared Thermal Image Analysis. Math. Probl. Eng. 2021, 2021, 5578629. [Google Scholar] [CrossRef]
  25. Zhuang, Y.; Cui, X.; Zhang, S.; Dai, G.L.; Zhao, X.L. The load transfer mechanism in reinforced piled embankment under cyclic loading and unloading. Eur. J. Environ. Civ. Eng. 2020, 26, 1364–1378. [Google Scholar] [CrossRef]
  26. Xiao, F.; Jiang, D.; Wu, F.; Zou, Q.L.; Chen, J.; Chen, B.; Sun, Z.G. Effects of prior cyclic loading damage on failure characteristics of sandstone under true-triaxial unloading conditions. Int. J. Rock Mech. Min. Sci. 2020, 132, 104379. [Google Scholar] [CrossRef]
  27. Zeng, P. Experimental Study on Macro-Meso Mechanical Properties of Limestone Under Multi-Level Cyclic Loading and Unloading. Master’s Thesis, Central South University, Changsha, China, 2022. (In Chinese). [Google Scholar]
  28. Wang, H.; Gao, Y.; Zhou, Y. Experimental and numerical studies of brittle rock-like specimens with unfilled cross fissures under uniaxial compression. Theor. Appl. Fract. Mech. 2022, 117, 103167. [Google Scholar] [CrossRef]
  29. Cao, K.W.; Ma, L.Q.; Wu, Y.; Khan, N.M.; Spearing, A.J.S.; Hussain, S.; Yang, J. Cyclic fatigue characteristics of rock failure using infrared radiation as precursor to violent failure: Experimental insights from loading and unloading response. Fatigue Facture Eng. Mater. Struct. 2020, 44, 584–594. [Google Scholar]
  30. Meng, Q.B.; Liu, J.F.; Ren, L.; Pu, H.; Chen, Y.L. Experimental Study on Rock Strength and Deformation Characteristics Under Triaxial Cyclic Loading and Unloading Conditions. Rock Mech. Rock Eng. 2020, 54, 777–797. [Google Scholar] [CrossRef]
  31. PFC Documentation, Version PFC 6.0; PFC 6.0 © 2019; Itasca: Minneapolis, MN, USA, 2019.
  32. Huang, G.; Yang, Y.; Liu, M.; Zhang, J.; Liu, F.; Mwangi, A.D.; Ye, H. Numerical Study on Mechanical Properties of the Freezing–Thawing Cycle of Tailings Based on Particle Discrete Element Method. Minerals 2022, 12, 904. [Google Scholar] [CrossRef]
  33. Mardoukhi, A.; Mardoukhi, Y.; Hokka, M.; Kuokkala, V.T. Effects of Test Temperature and Low Temperature Thermal Cycling on the Dynamic Tensile Strength of Granitic Rocks. Rock Mech. Rock Eng. 2020, 54, 443–454. [Google Scholar] [CrossRef]
  34. Xing, K.; Zhou, Z.; Yang, H.; Liu, B. Macro–meso freeze–thaw damage mechanism of soil–rock mixtures with different rock contents. Int. J. Pavement Eng. 2020, 21, 9–19. [Google Scholar] [CrossRef]
  35. Yue, Z.; Song, Y.; Li, P.; Tian, S.; Ming, X.; Chen, Z. Applications of Digital Image Correlation (DIC) and the Strain Gage Method for Measuring Dynamic Mode I Fracture Parameters of the White Marble Specimen. Rock Mech. Rock Eng. 2019, 52, 4203–4216. [Google Scholar] [CrossRef]
  36. Cao, P.; Cao, R.-H.; Zhao, Y.-L.; Zhang, K.; Pu, C.Z.; Fan, W.C. Propagation-coalescence and rheologic fracture behavior of rock cracks. Chin. J. Nonferr. Met. 2016, 26, 1737–1762. (In Chinese) [Google Scholar]
  37. Dong, L.J.; Zhang, Y.H.; Bi, S.J.; Ma, J.; Yan, Y.; Cao, H. Uncertainty investigation for the classification of rock micro-fracture types using acoustic emission parameters. Int. J. Rock Mech. Min. Sci. 2023, 162, 105292. [Google Scholar] [CrossRef]
  38. Tan, H.; Li, J.T.; Shi, Z.M.; Wang, M.; Wang, J.; Li, J. Damage evolution and failure characteristics of red sandstone with prefabricated crack under coupled dry-wet cycle-fatigue loading. Int. J. Fatigue 2023, 175, 107751. [Google Scholar] [CrossRef]
  39. Song, H.; Zhang, H.; Kang, Y.; Huang, G.; Fu, D.; Qu, C. Damage evolution study of sandstone by cyclic uniaxial test and digital image correlation. Tectonophysics 2013, 608, 1343–1348. [Google Scholar] [CrossRef]
  40. Liu, T.Y.; Zhang, C.Y.; Cao, P.; Zhou, K. Freeze-thaw damage evolution of fractured rock mass suing nuclear magnetic resonance technology. Cold Reg. Sci. Technol. 2020, 170, 102951. [Google Scholar] [CrossRef]
  41. Jensen, P.R.; Plesha, E.M.; Edil, B.T.; Bosscher, P.J.; Kahla, N.B. DEM Simulation of Particle Damage in Granular Media—Structure Interfaces. Int. J. Geomech. 2001, 1, 21–39. [Google Scholar] [CrossRef]
  42. Zhang, C.Y.; Liu, T.Y.; Jiang, C.; Chen, Z.; Zhou, K.; Chen, L. The Freeze-Thaw Strength Evolution of Fiber-Reinforced Cement Mortar Based on NMR and Fractal Theory: Considering Porosity and Pore Distribution. Materials 2022, 15, 7316. [Google Scholar] [CrossRef] [PubMed]
  43. Shi, Z.; Li, J.; Zhao, Y. Study on damage evolution and constitutive model of sandstone under the coupled effects of wetting-drying cycles and cyclic loading. Eng. Fract. Mech. 2021, 253, 107883. [Google Scholar] [CrossRef]
  44. Peng, K.; Wang, Y.; Zou, Q.; Liu, Z.; Mou, J. Effect of crack angles on energy characteristics of sandstones under a complex stress path. Eng. Fract. Mech. 2019, 218, 106577. [Google Scholar] [CrossRef]
Figure 1. Temperature changes during freeze−thaw.
Applsci 15 07942 g001
Figure 2. Damage pattern of rock samples after freeze–thaw.
Applsci 15 07942 g002
Figure 3. Wave velocity measuring instruments.
Applsci 15 07942 g003
Figure 4. Schematic diagram of loading method.
Applsci 15 07942 g004
Figure 5. Stress–strain curve of cyclic loading and unloading.
Applsci 15 07942 g005
Figure 6. Schematic diagram of particle force and damage mechanism.
Applsci 15 07942 g006
Figure 7. Comparison of uniaxial compression curves.
Applsci 15 07942 g007
Figure 8. Schematic diagram of particle changes.
Applsci 15 07942 g008
Figure 9. Heat transfer process diagram.
Applsci 15 07942 g009
Figure 10. Mass and wave velocity damage.
Applsci 15 07942 g010
Figure 11. Crack distribution for different freeze–thaw cycles. (a) 20, (b) 40, (c) 60, (d) 80.
Applsci 15 07942 g011
Figure 12. Freeze–thaw micro-mechanism diagram.
Applsci 15 07942 g012
Figure 13. Crack changes during the process of freeze–thaw.
Applsci 15 07942 g013
Figure 14. Internal fragment view of the model. (a) 40, (b) 60, (c) 80.
Applsci 15 07942 g014
Figure 15. Layout of measurement points.
Applsci 15 07942 g015
Figure 16. Variations in Porosity and Contact Force.
Applsci 15 07942 g016
Figure 17. Specimen Contact Force diagram. (a) 20, (b) 40, (c) 60, (d) 80.
Applsci 15 07942 g017
Figure 18. Comparison of stress–strain curves with different freeze–thaw times. (a) 0 freeze–thaw (simulation), (b) 0 freeze–thaw (measurement), (c) 20 freeze–thaw (simulation), (d) 20 freeze–thaw (measurement), (e) 40 freeze–thaw (simulation), (f) 40 freeze–thaw (measurement), (g) 60 freeze–thaw (simulation), (h) 60 freeze–thaw (measurement), (i) 80 freeze–thaw (simulation), (j) 80 freeze–thaw (measurement).
Applsci 15 07942 g018aApplsci 15 07942 g018bApplsci 15 07942 g018cApplsci 15 07942 g018d
Figure 19. Cumulative Strain Difference variation curve.
Applsci 15 07942 g019
Figure 20. Rock damage diagram for different freeze–thaw cycles. (a) 0, (b) 0, (c) 20, (d) 20, (e) 40, (f) 40, (g) 60, (h) 60, (i) 80 times, (j) 80 times.
Applsci 15 07942 g020aApplsci 15 07942 g020b
Figure 21. Variation of crack number with cycle level. (a) 0 times, (b) 20 times, (c) 40 times, (d) 60 times, (e) 80 times.
Applsci 15 07942 g021aApplsci 15 07942 g021bApplsci 15 07942 g021c
Figure 22. Variation of acoustic emission parameters during loading and unloading of specimens with different numbers of freeze–thaw cycles. (a) 0 times, (b) 20 times, (c) 40 times, (d) 60 times. (e) 80 times.
Applsci 15 07942 g022aApplsci 15 07942 g022bApplsci 15 07942 g022c
Figure 23. Change in percentage of crack types.
Applsci 15 07942 g023
Table 1. Rock specimen parameters.
Rock Specimen NumberUniaxial Compressive Strength/MPaModulus of Elasticity/GPa
145.703.56
244.473.71
343.993.90
Table 2. Simulation parameters.
Pb_fa/°Emod/GPaFricPb_ten/MPaPb_coh/MPa
44.723.720.552030
Table 3. Freeze–thaw parameters.
Particle TypeParameters
Coefficient   of   Linear   Expansion   α /(1 °C−1) Thermal   Resistance   η / ( ° C · W 1 · m−1) Specific   Heat   Capacity   C v / ( J · kg 1 · °C−1)
Rock particle0.0532.59878
Water particle2.0801.004216
Table 4. Comparison of damage before and after freeze–thaw.
Specimen NumberPre-Freeze–Thaw Mass/gPost-Freeze–Thaw Mass/gMass Loss/%Pre-Freeze–Thaw Wave Speed/m·s−1Post-Freeze–Thaw Wave Speed/m·s−1Wave Speed Loss/%
F-T-20-1589.56587.860.2883225.663212.760.4
F-T-20-2594.20592.520.2833456.983446.610.3
F-T-20-3591.89590.290.2703015.282994.170.7
Average value591.88590.220.2803232.643217.850.5
F-T-40-1595.66593.660.3363456.783415.301.2
F-T-40-2588.98587.180.3063598.583537.401.7
F-T-40-3590.27588.570.2883569.283515.741.5
Average value591.60589.800.3103541.553489.481.5
F-T-60-1589.75587.150.4413426.203350.822.2
F-T-60-2590.70588.30.4063265.103173.682.8
F-T-60-3592.30589.60.4563356.123295.711.8
Average value590.92588.350.4343349.143273.402.3
F-T-80-1590.22586.020.7123567.553446.253.4
F-T-80-2591.26586.760.7613055.122966.522.9
F-T-80-3595.10590.400.7903099.703000.513.2
Average value592.19587.730.7543240.793137.763.2
Table 5. Cumulative strain differential data.
Simulated Peak Stress/MpaMeasured Peak Stress/MpaSimulated Strain/%Measured Strain/%Stress Difference/MpaStrain Relief/%Single-Axis Simulated Strain Differential/%Uniaxial Simulation of Peak Stress/MPaCumulative Strain Difference/%
4.404.800.0010.0750.400.0740.234536.20
8.407.500.00250.100.900.097521.20
12.4012.700.00260.0530.300.050432.87
16.4017.250.0040.150.850.14633.61
20.4021.800.0050.1751.400.1723.76
24.4025.800.0060.211.400.20428.51
28.4032.500.0070.234.100.22310.64
32.2036.1250.00750.2753.9250.267513.33
36.4041.100.00850.304.700.291512.13
40.4049.000.010.348.600.337.51
44.4048.400.01050.384.000.369518.07
48.4040.000.01070.408.400.38929.07
Average cumulative strain difference/%20.57
Disclaimer/Publisher’s Note: The statements, opinions and data contained in all publications are solely those of the individual author(s) and contributor(s) and not of MDPI and/or the editor(s). MDPI and/or the editor(s) disclaim responsibility for any injury to people or property resulting from any ideas, methods, instructions or products referred to in the content.

