
Particle-Scale Insights into Extraction Zone Development During Block Caving: Experimental Validation and PFC3D Simulation of Gradation-Dependent Flow Characteristics


Abstract
1. Introduction
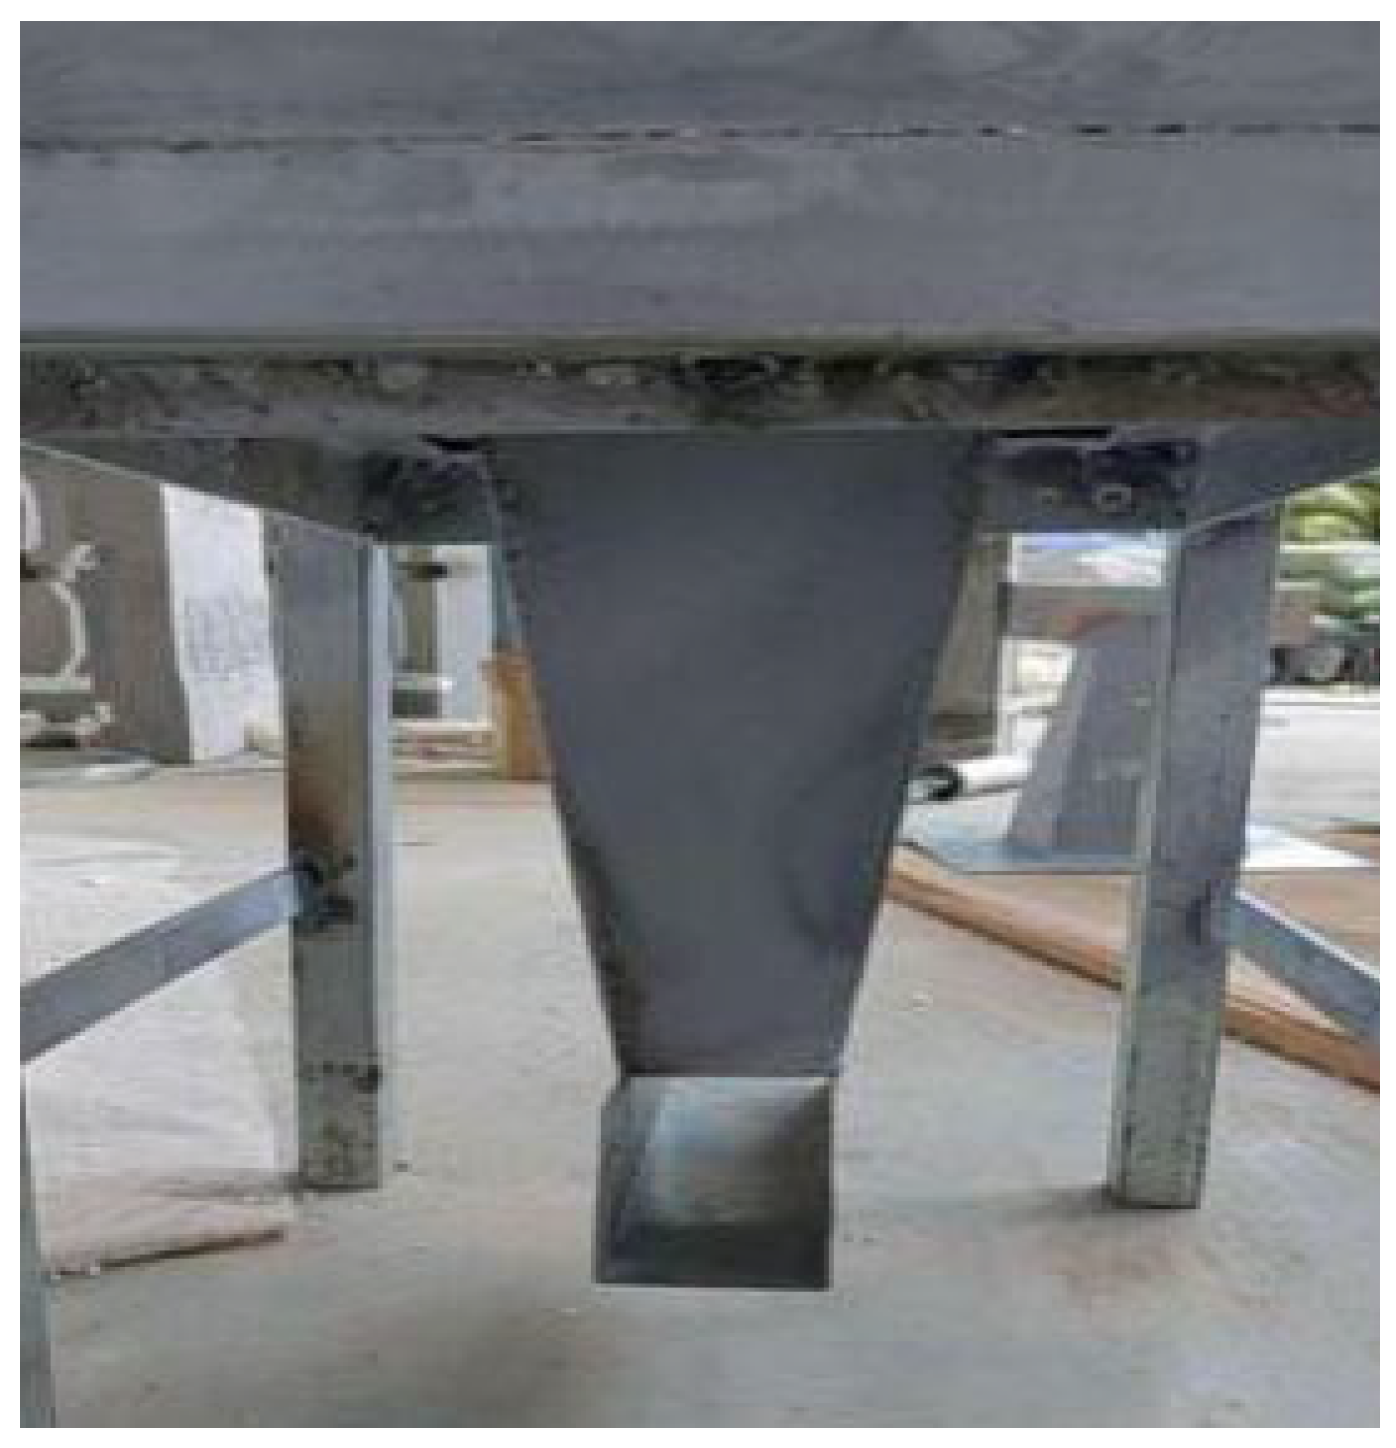
2. Description of the Isolated Draw Test
2.1. Experimental Materials
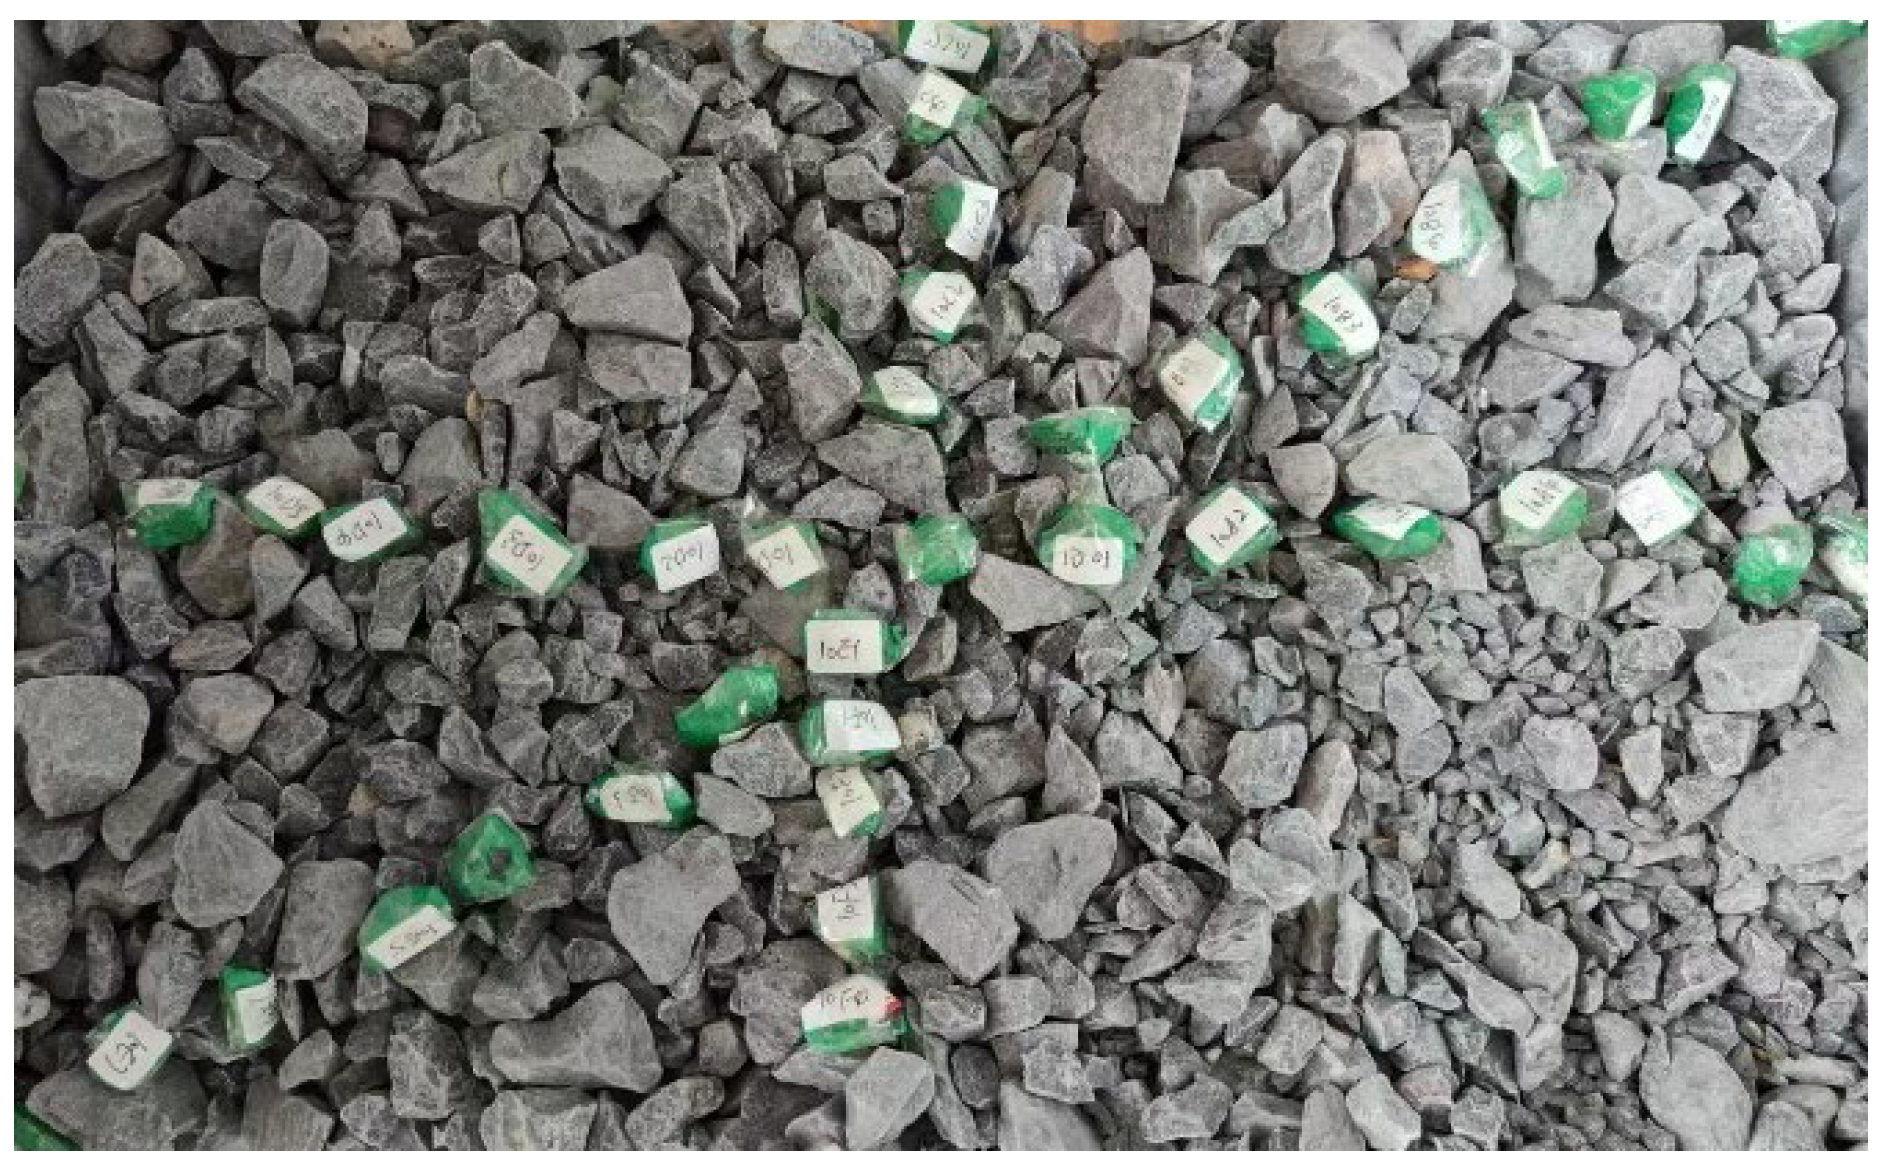
2.2. Experimental Process
3. Analysis of Experimental Results
3.1. 3D EZ Shapes with Different Particle Sizes
3.2. Relationship Between the Particle Size and Radius of the EZ
4. Numerical Simulation
4.1. Model Setup
4.2. Drawing Process and Characteristics
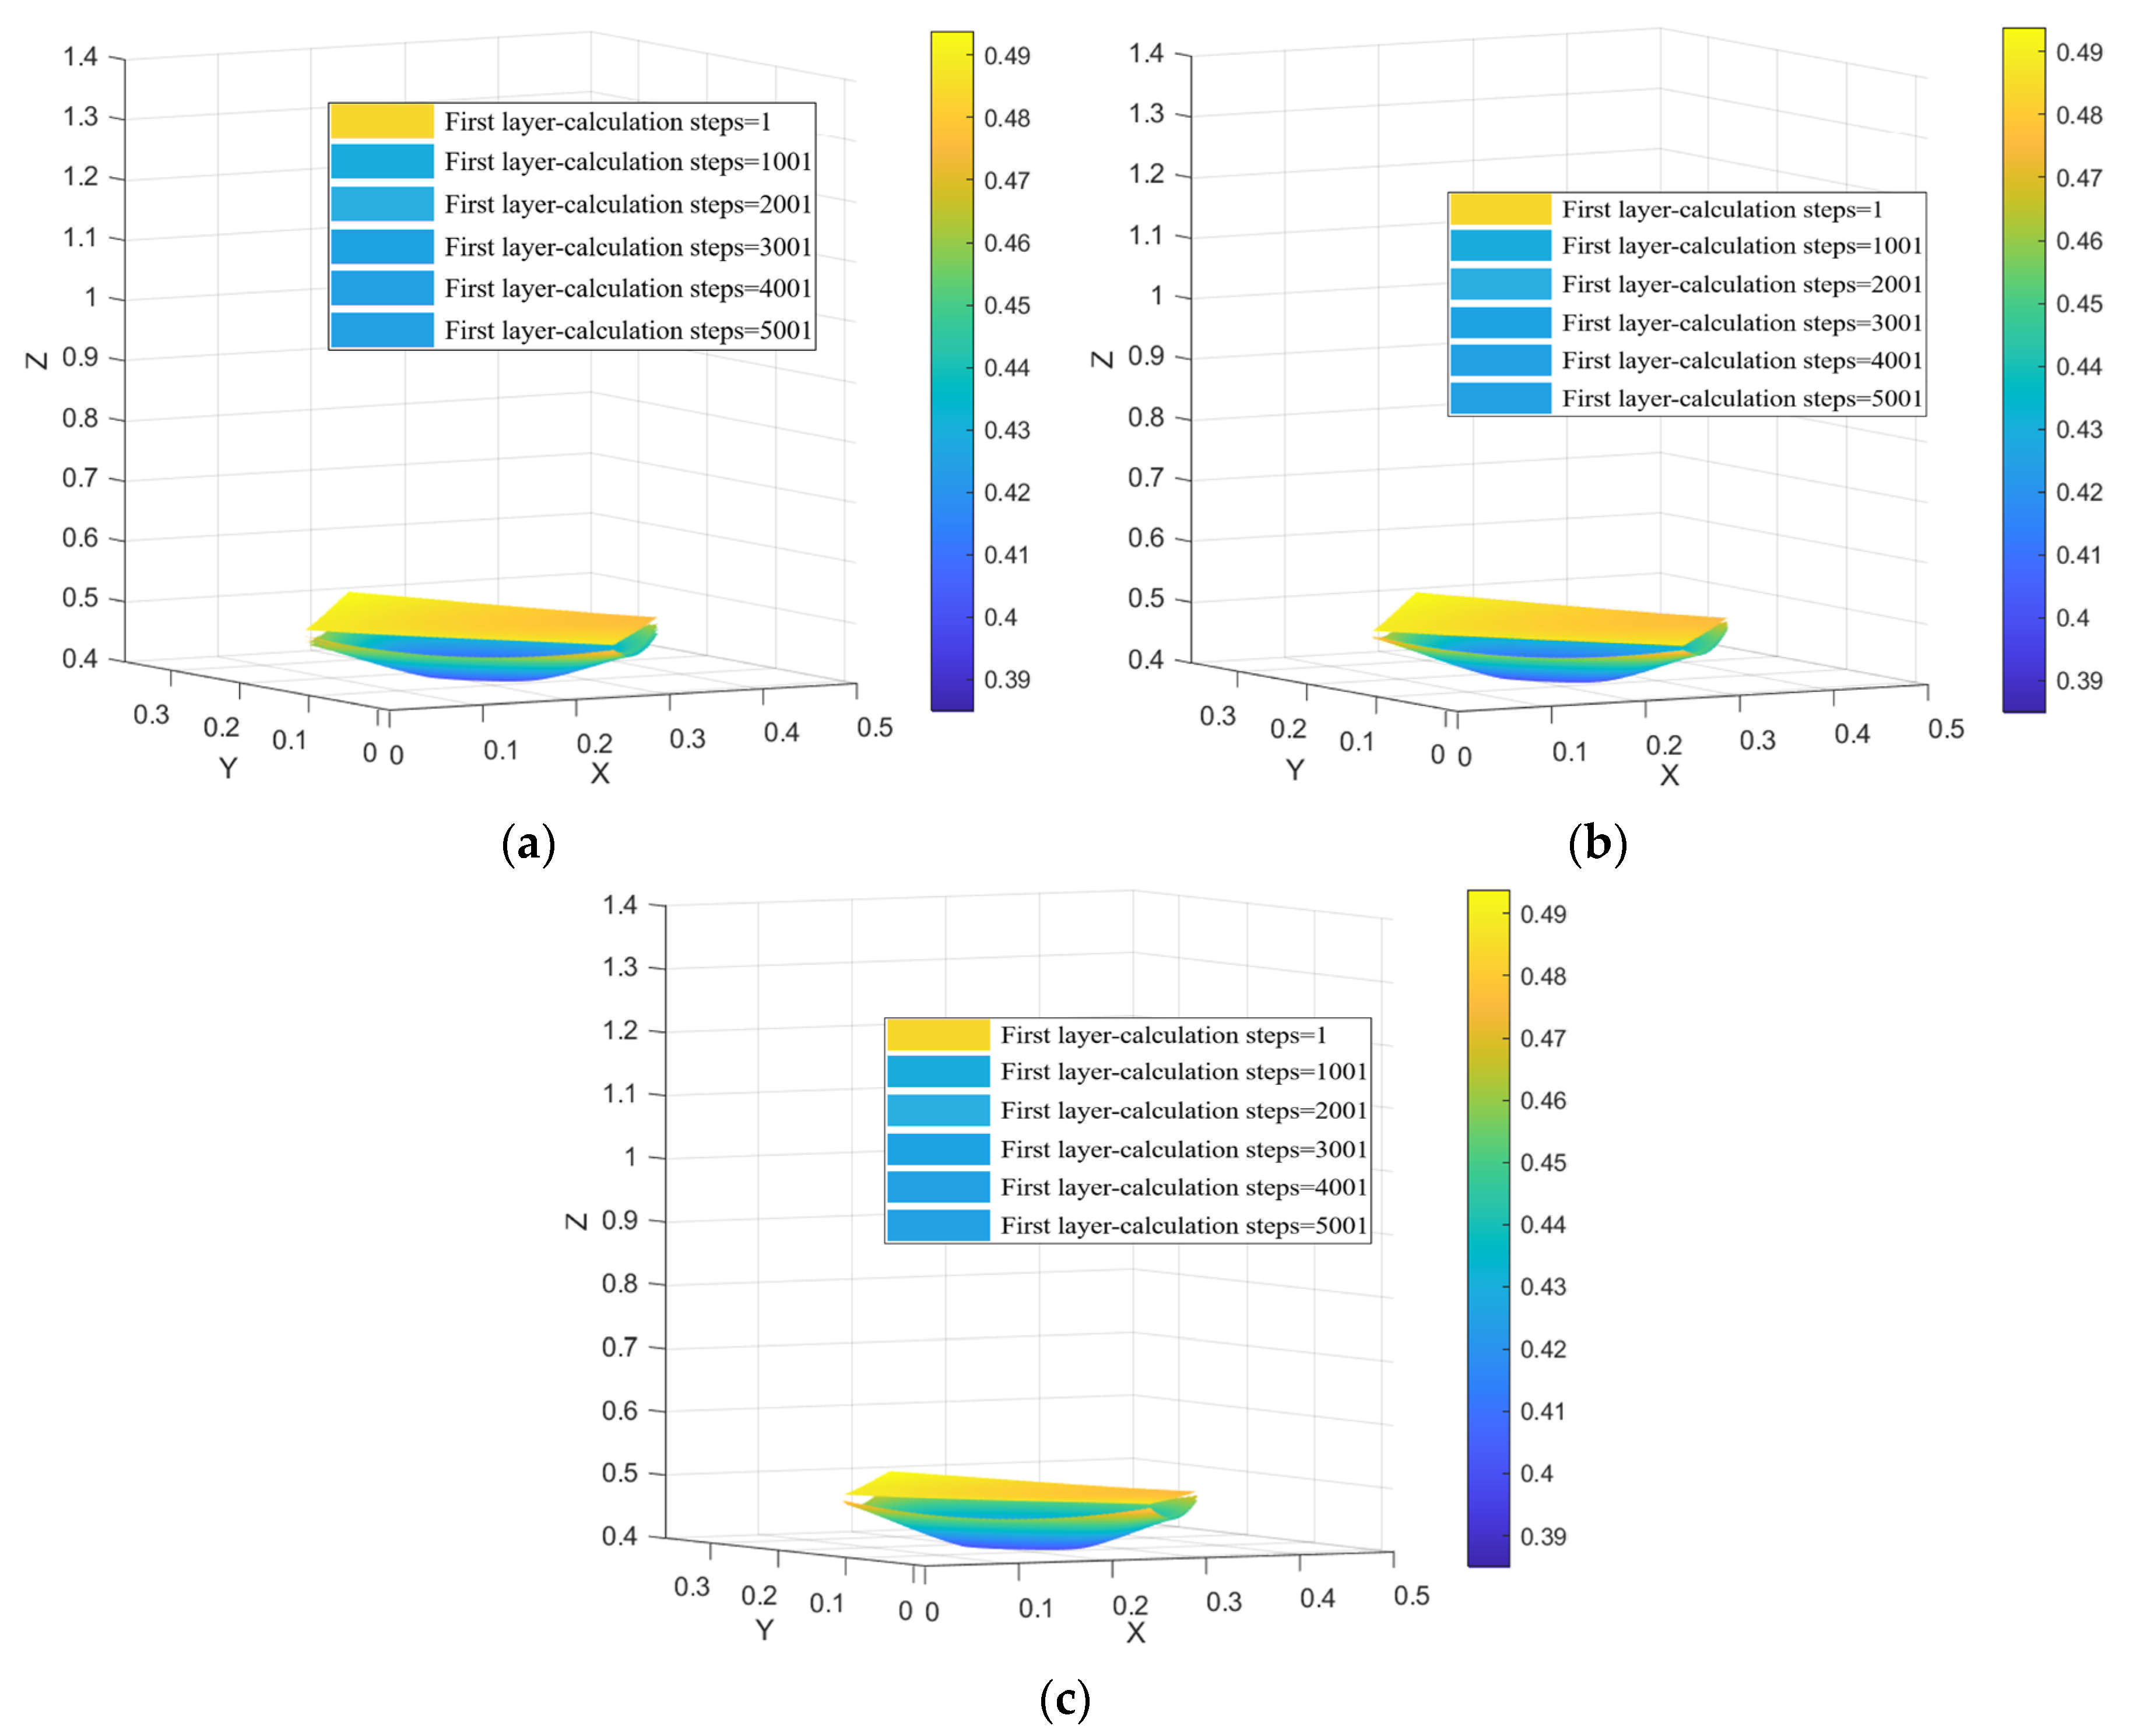
4.3. 3D Isolated Extraction Zones with Different Particle Sizes in the Numerical Simulation
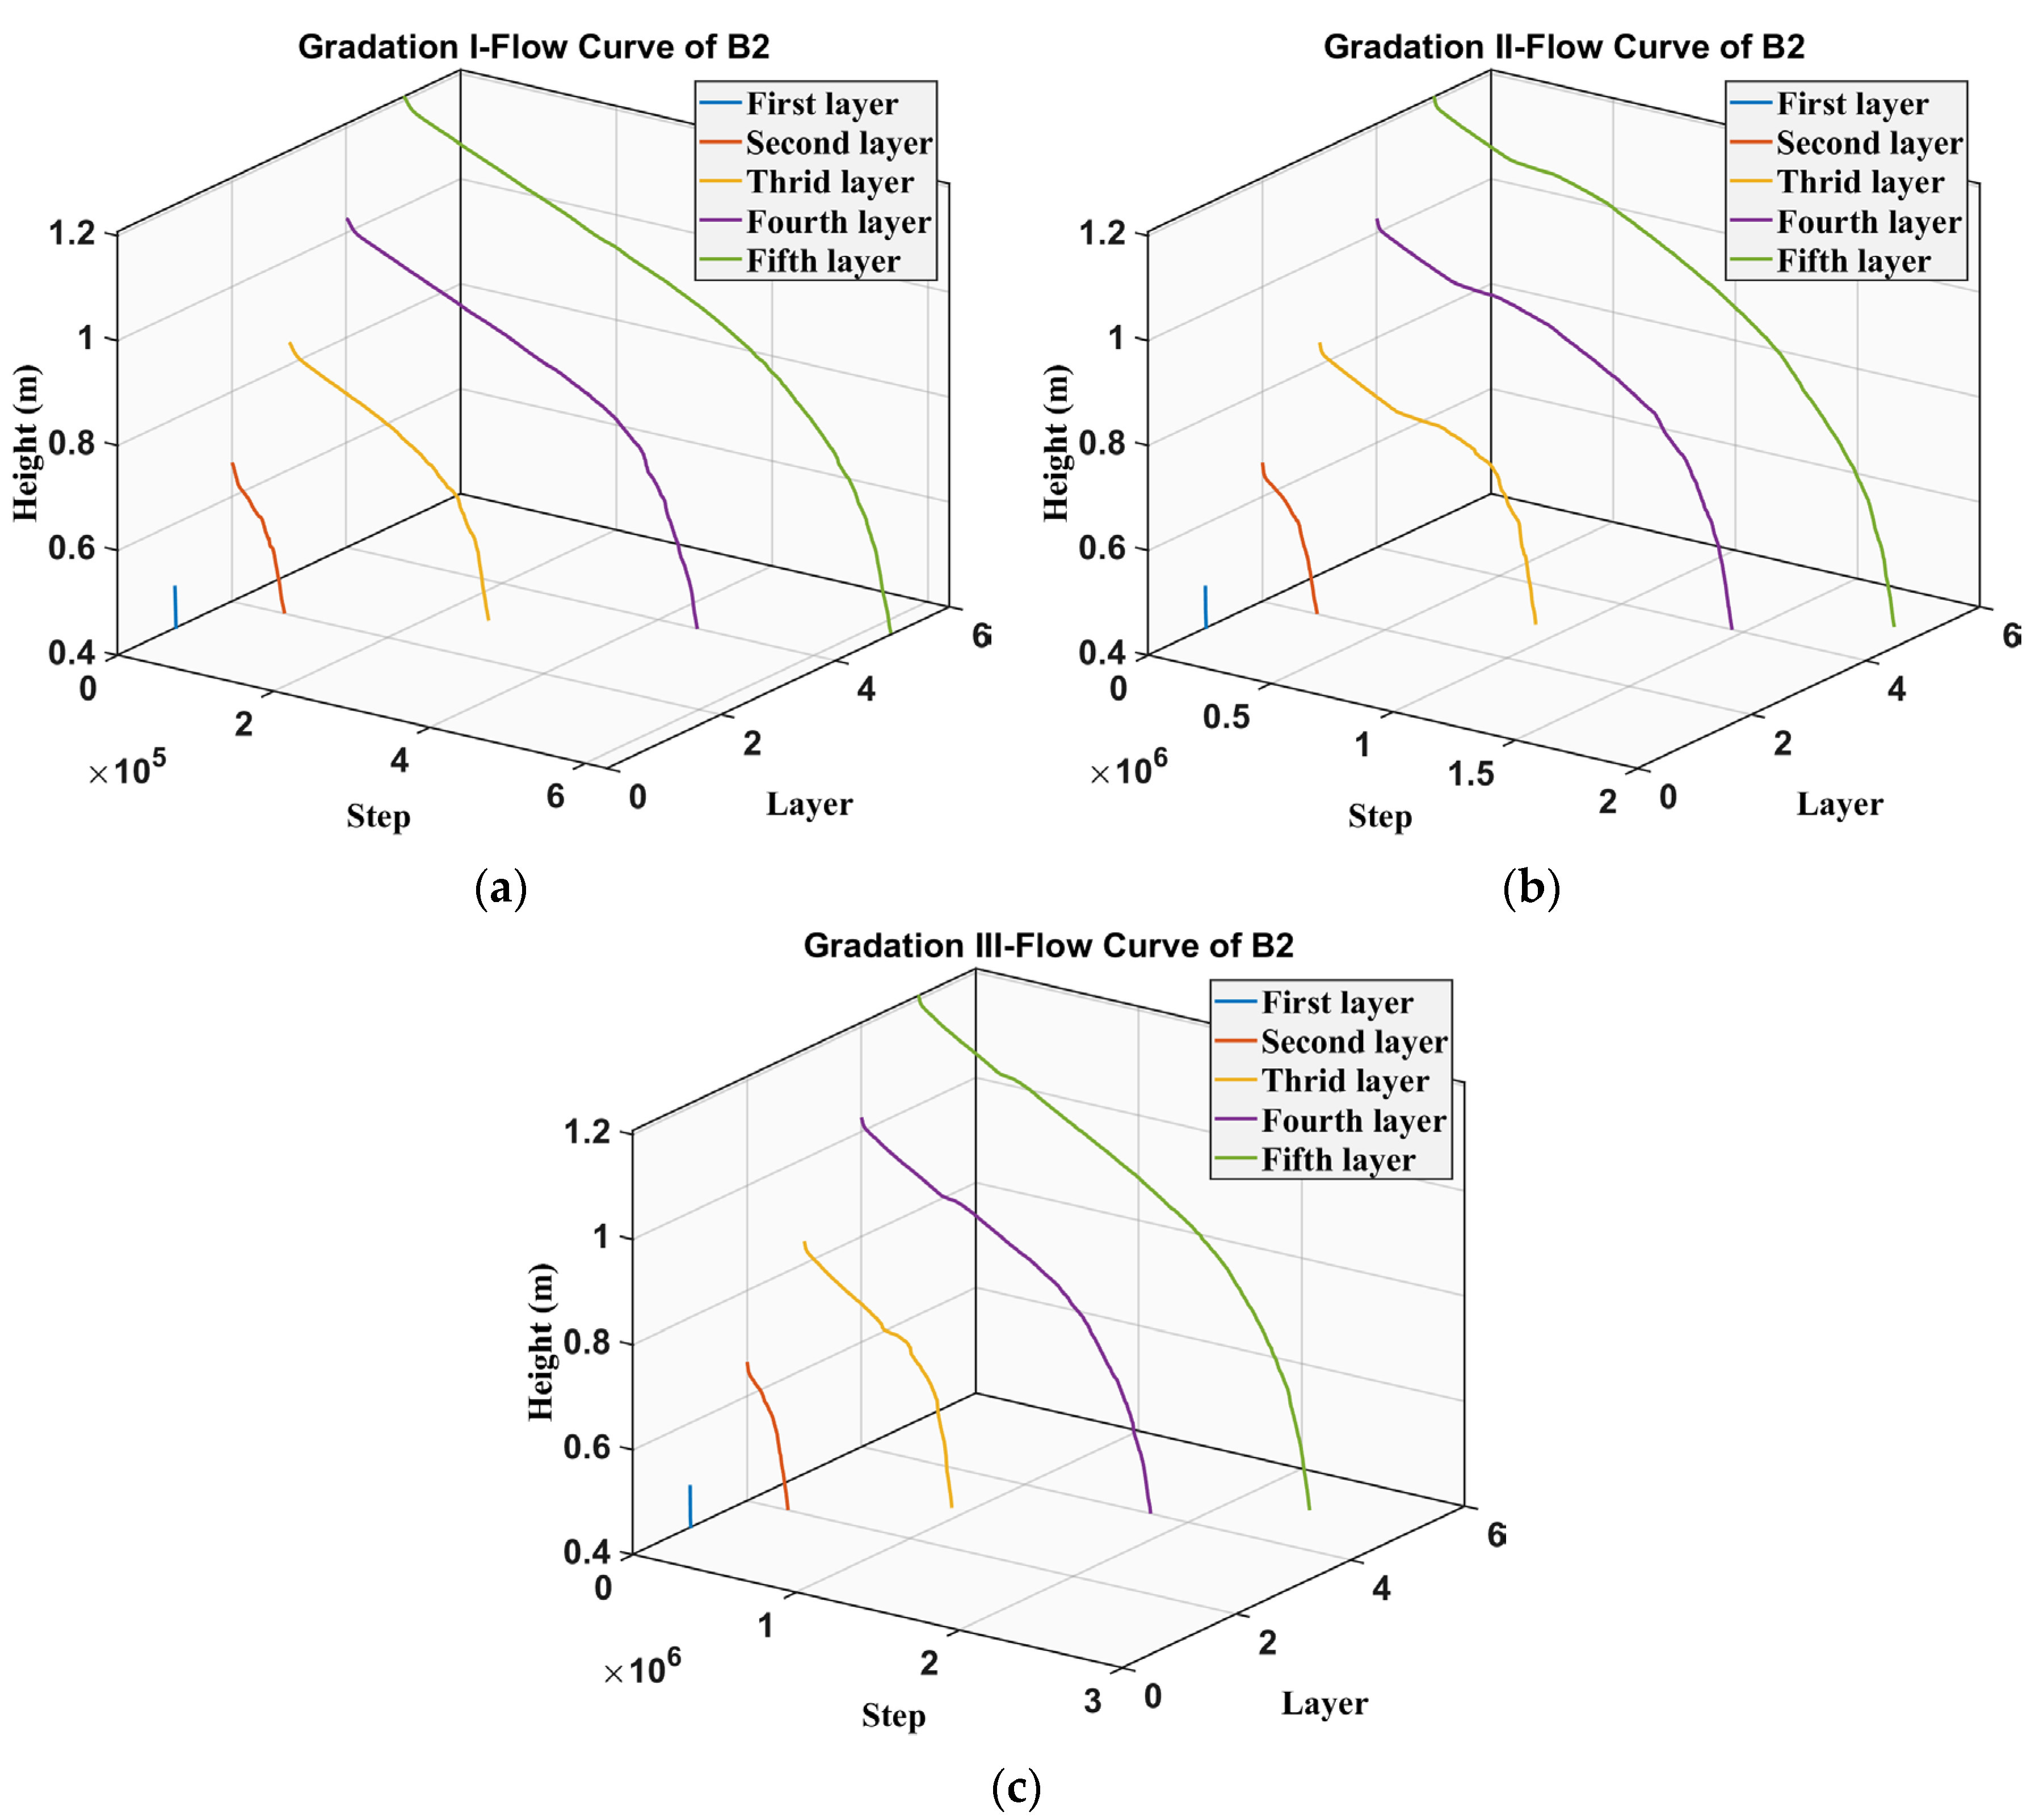
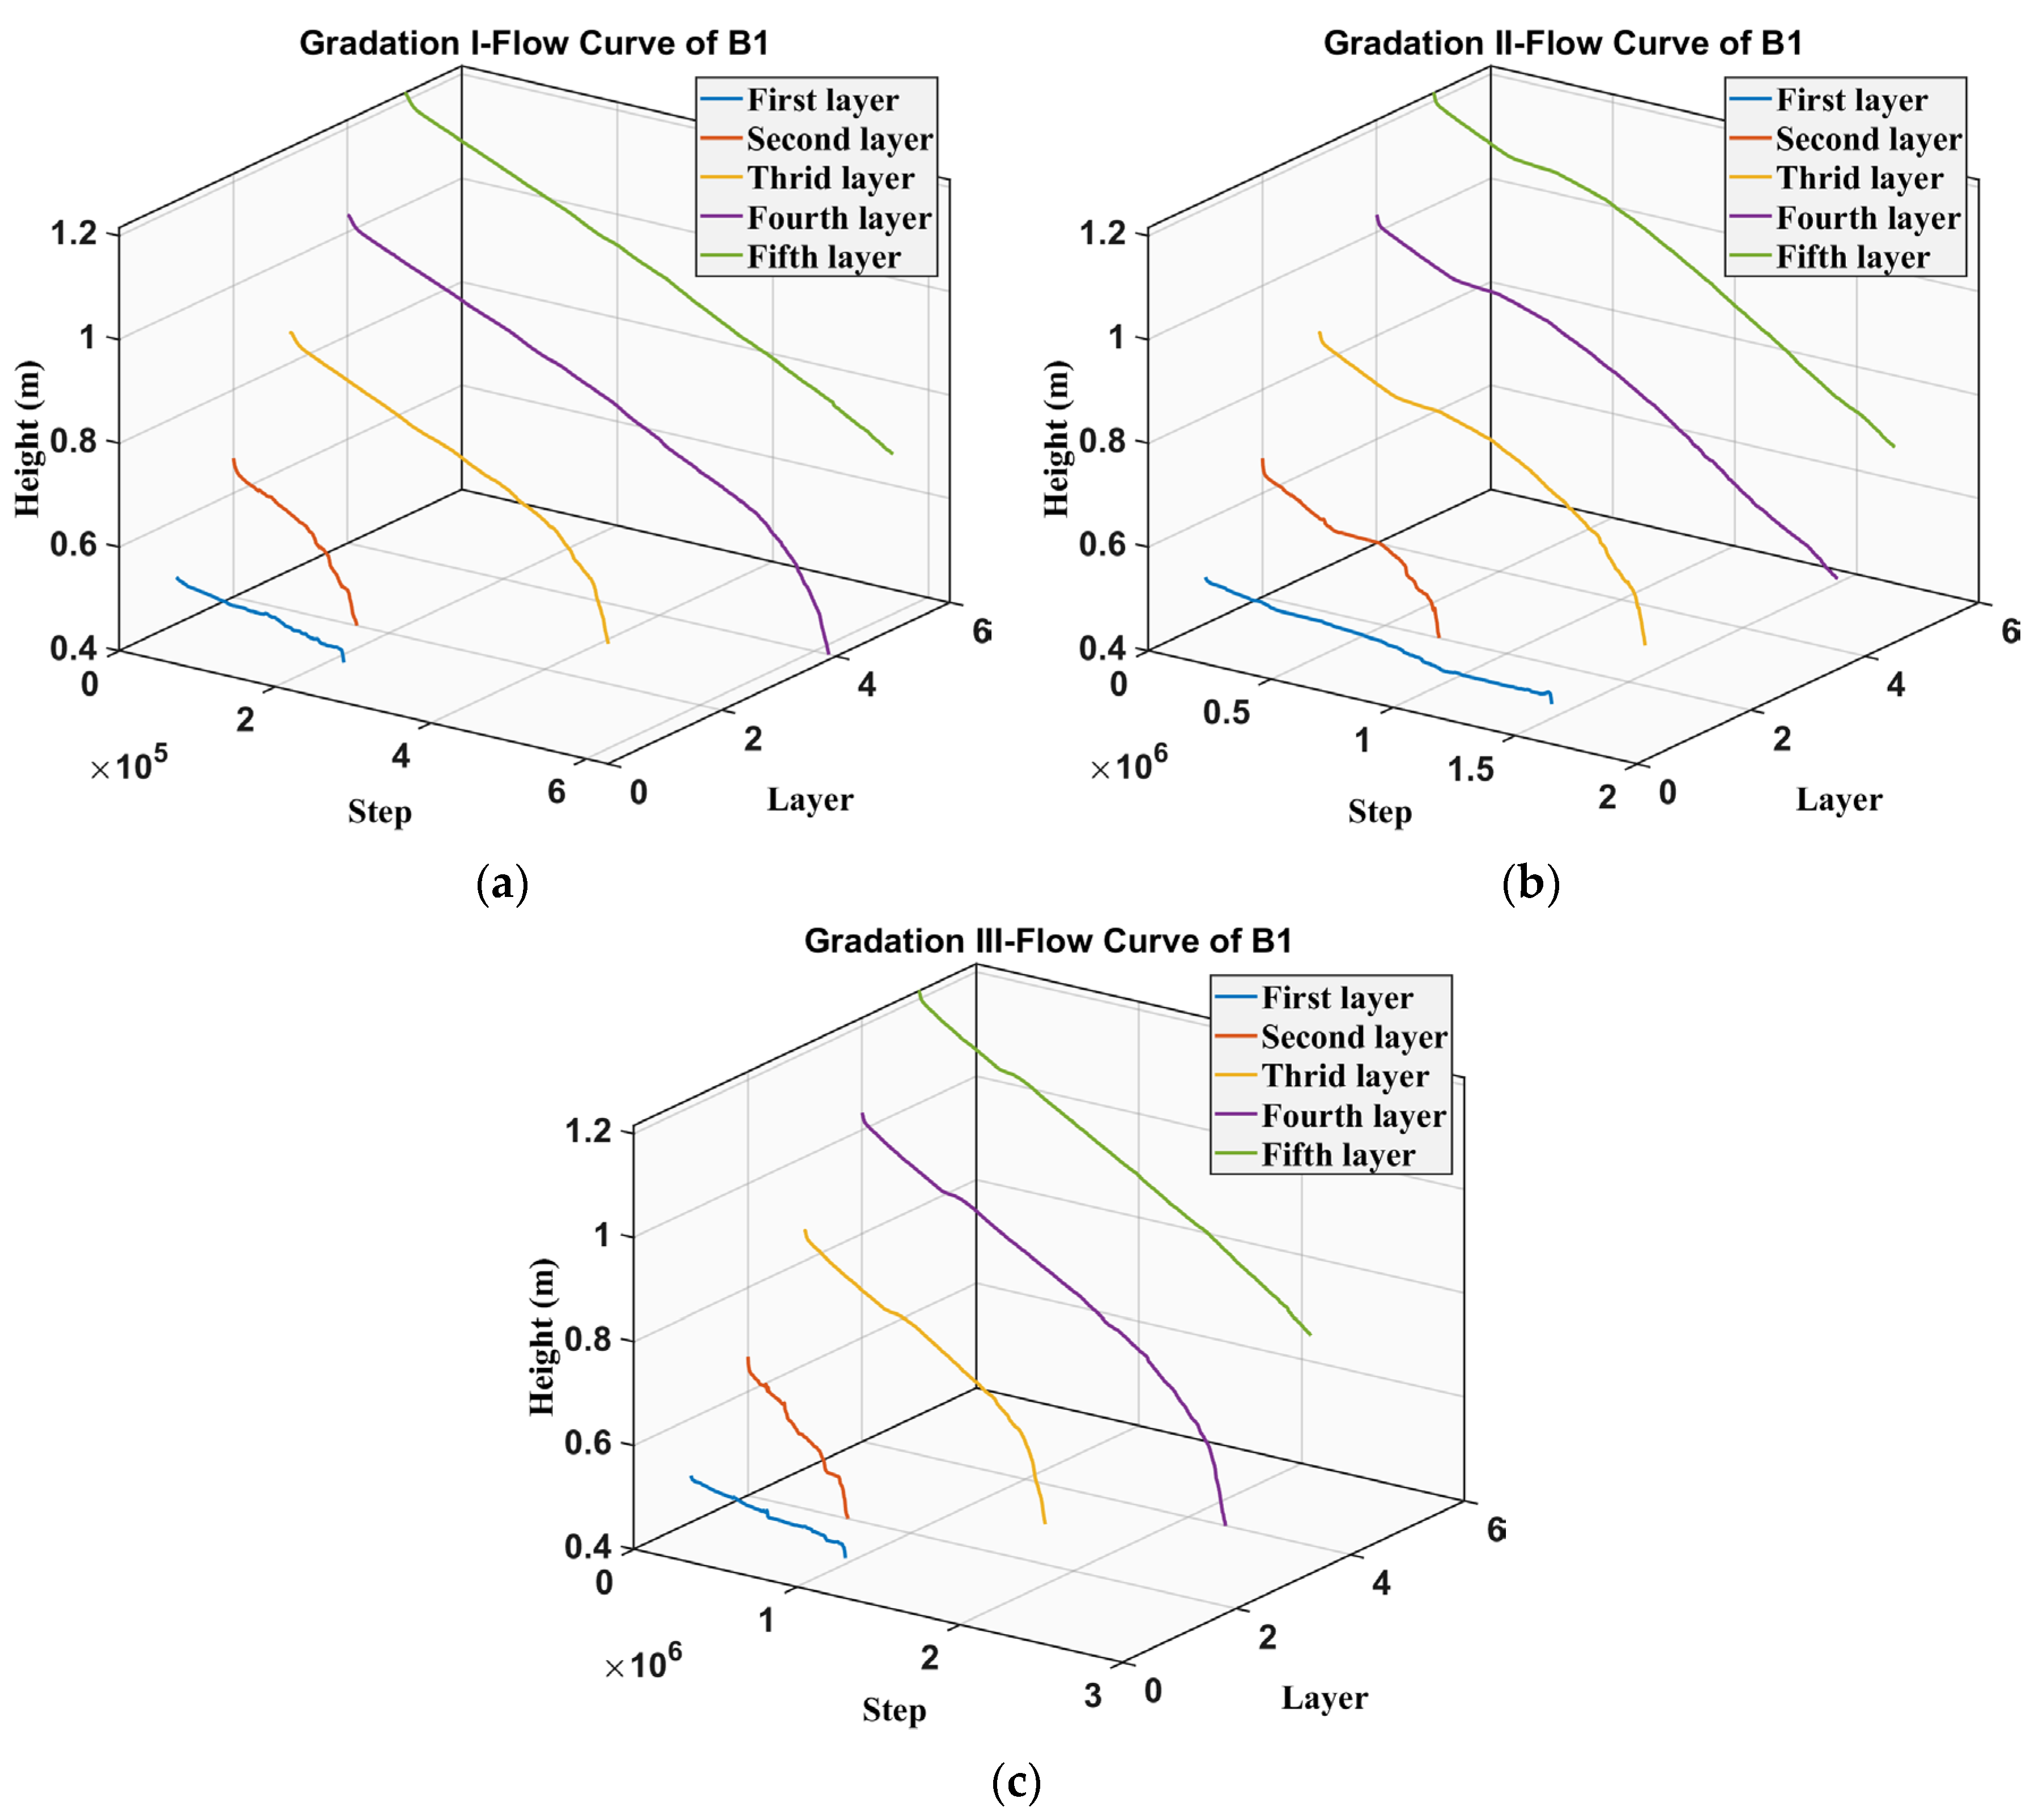
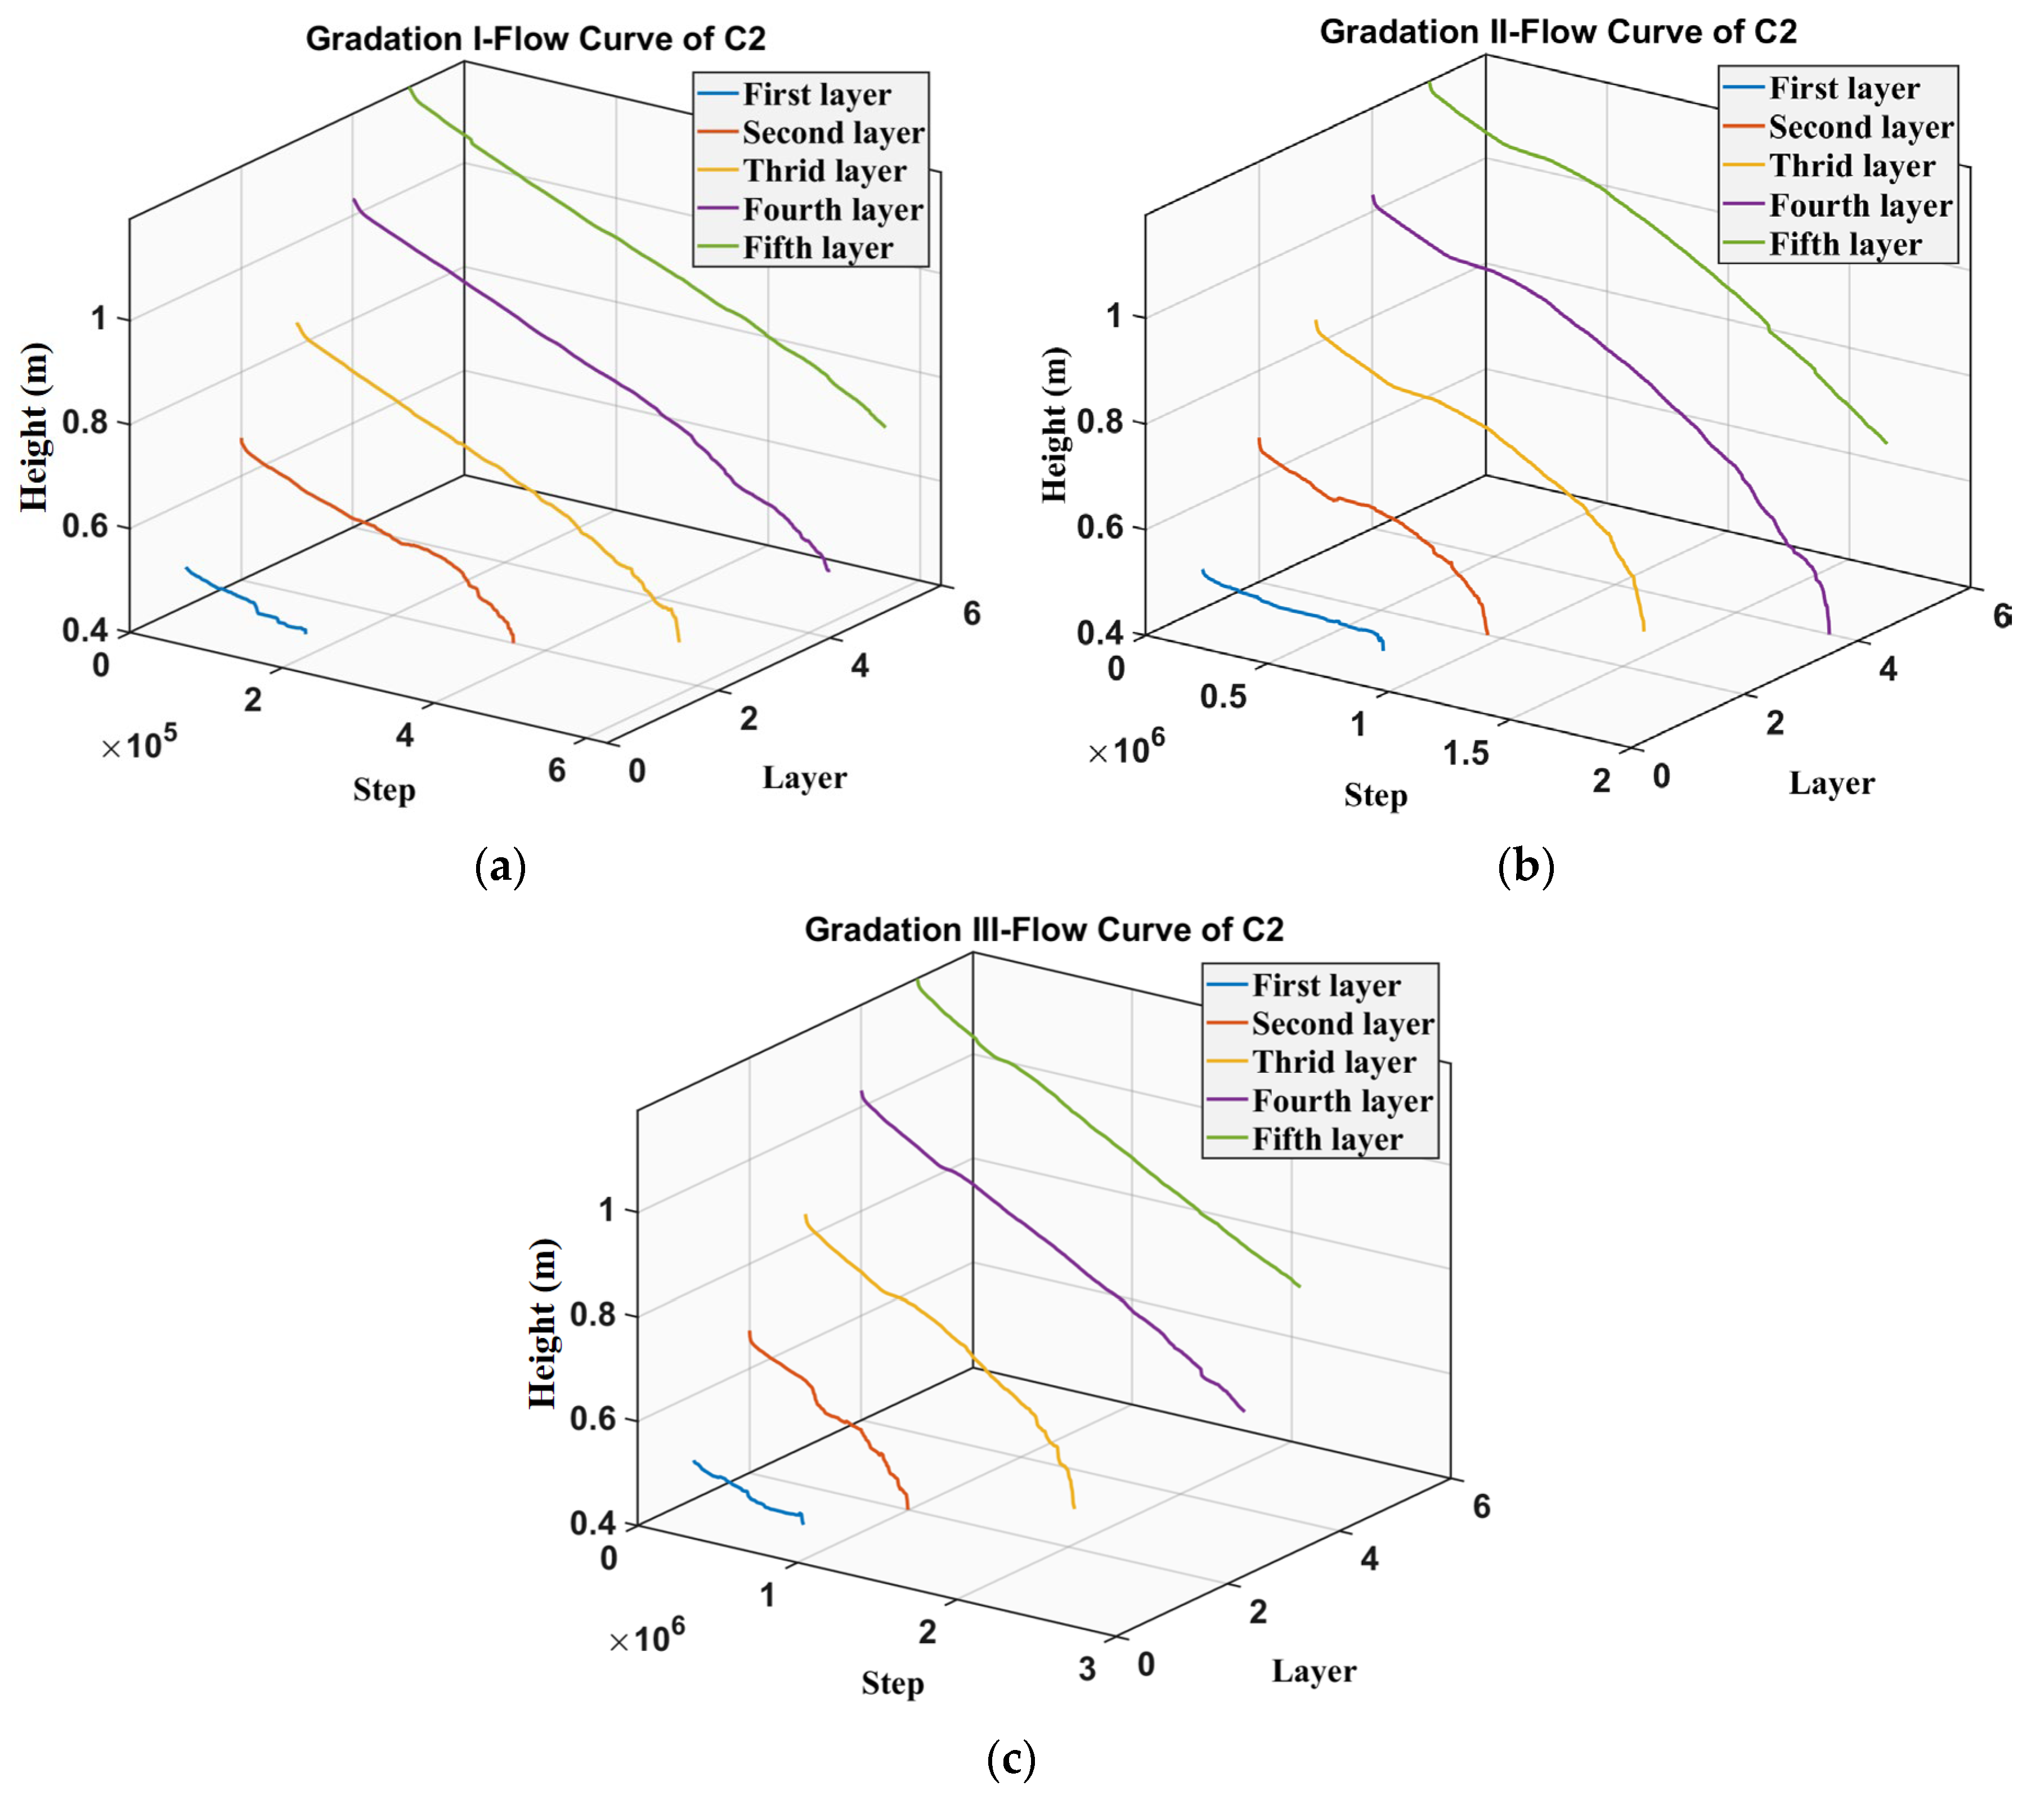
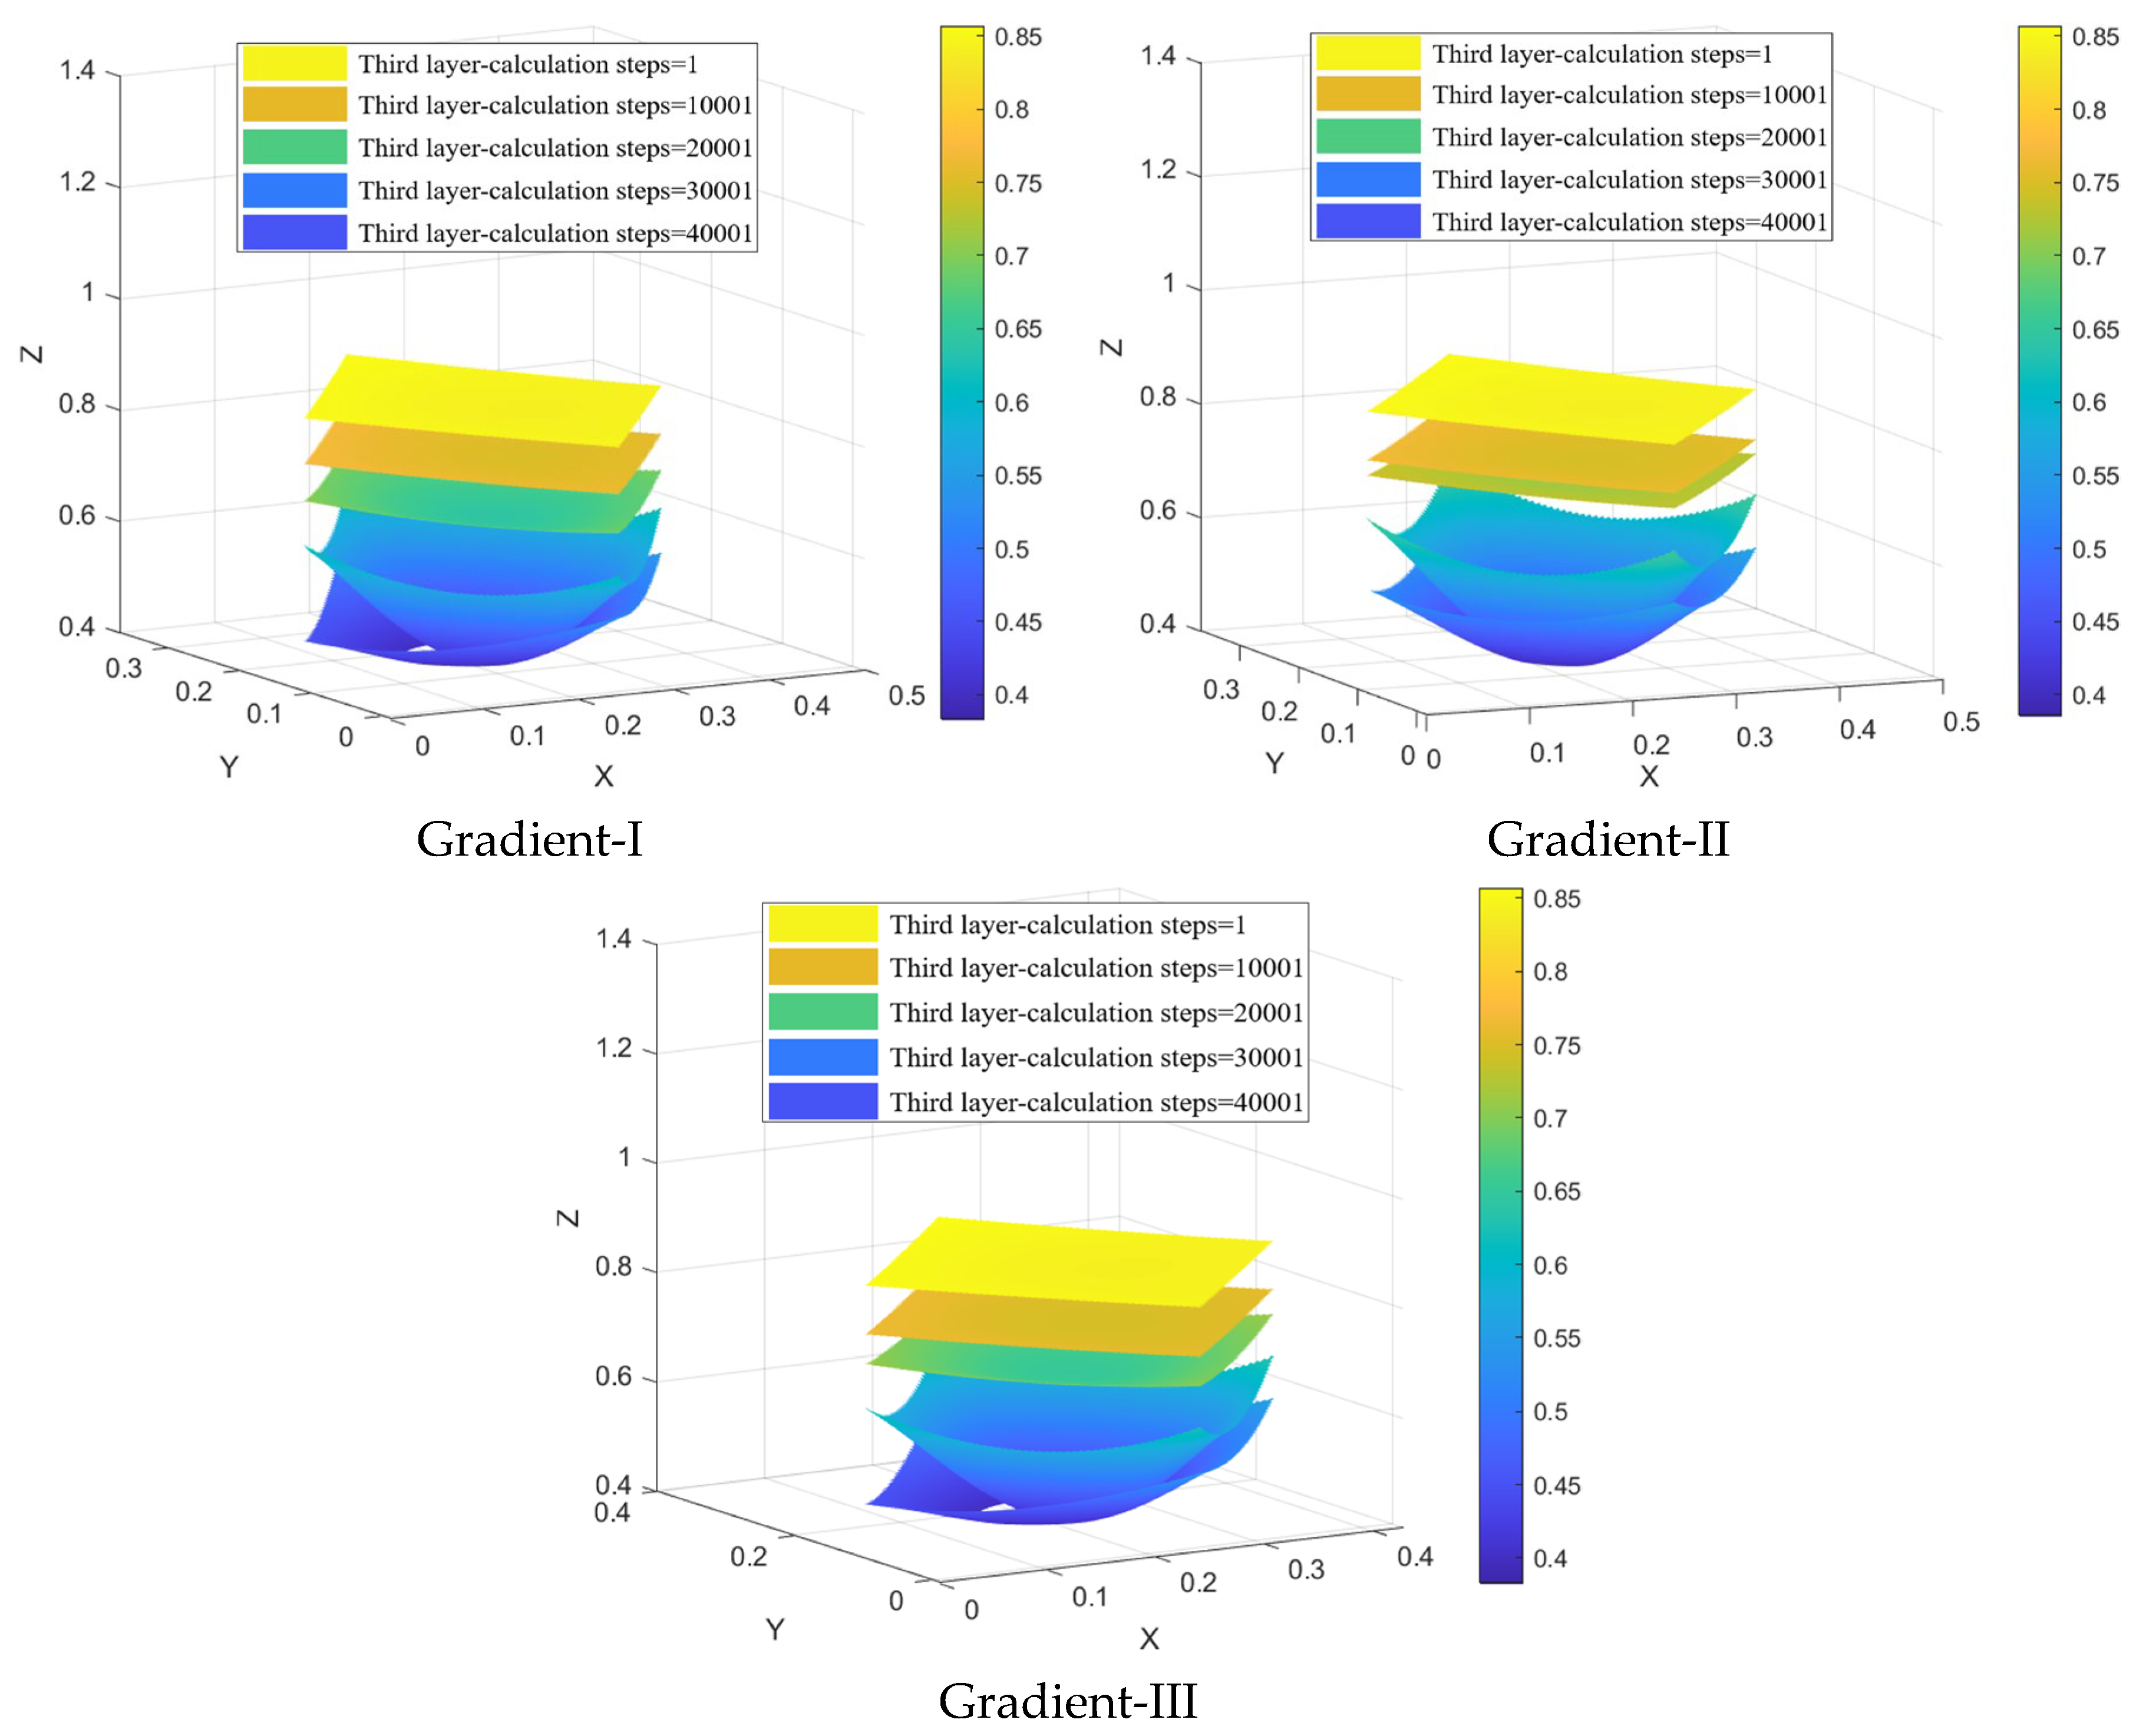
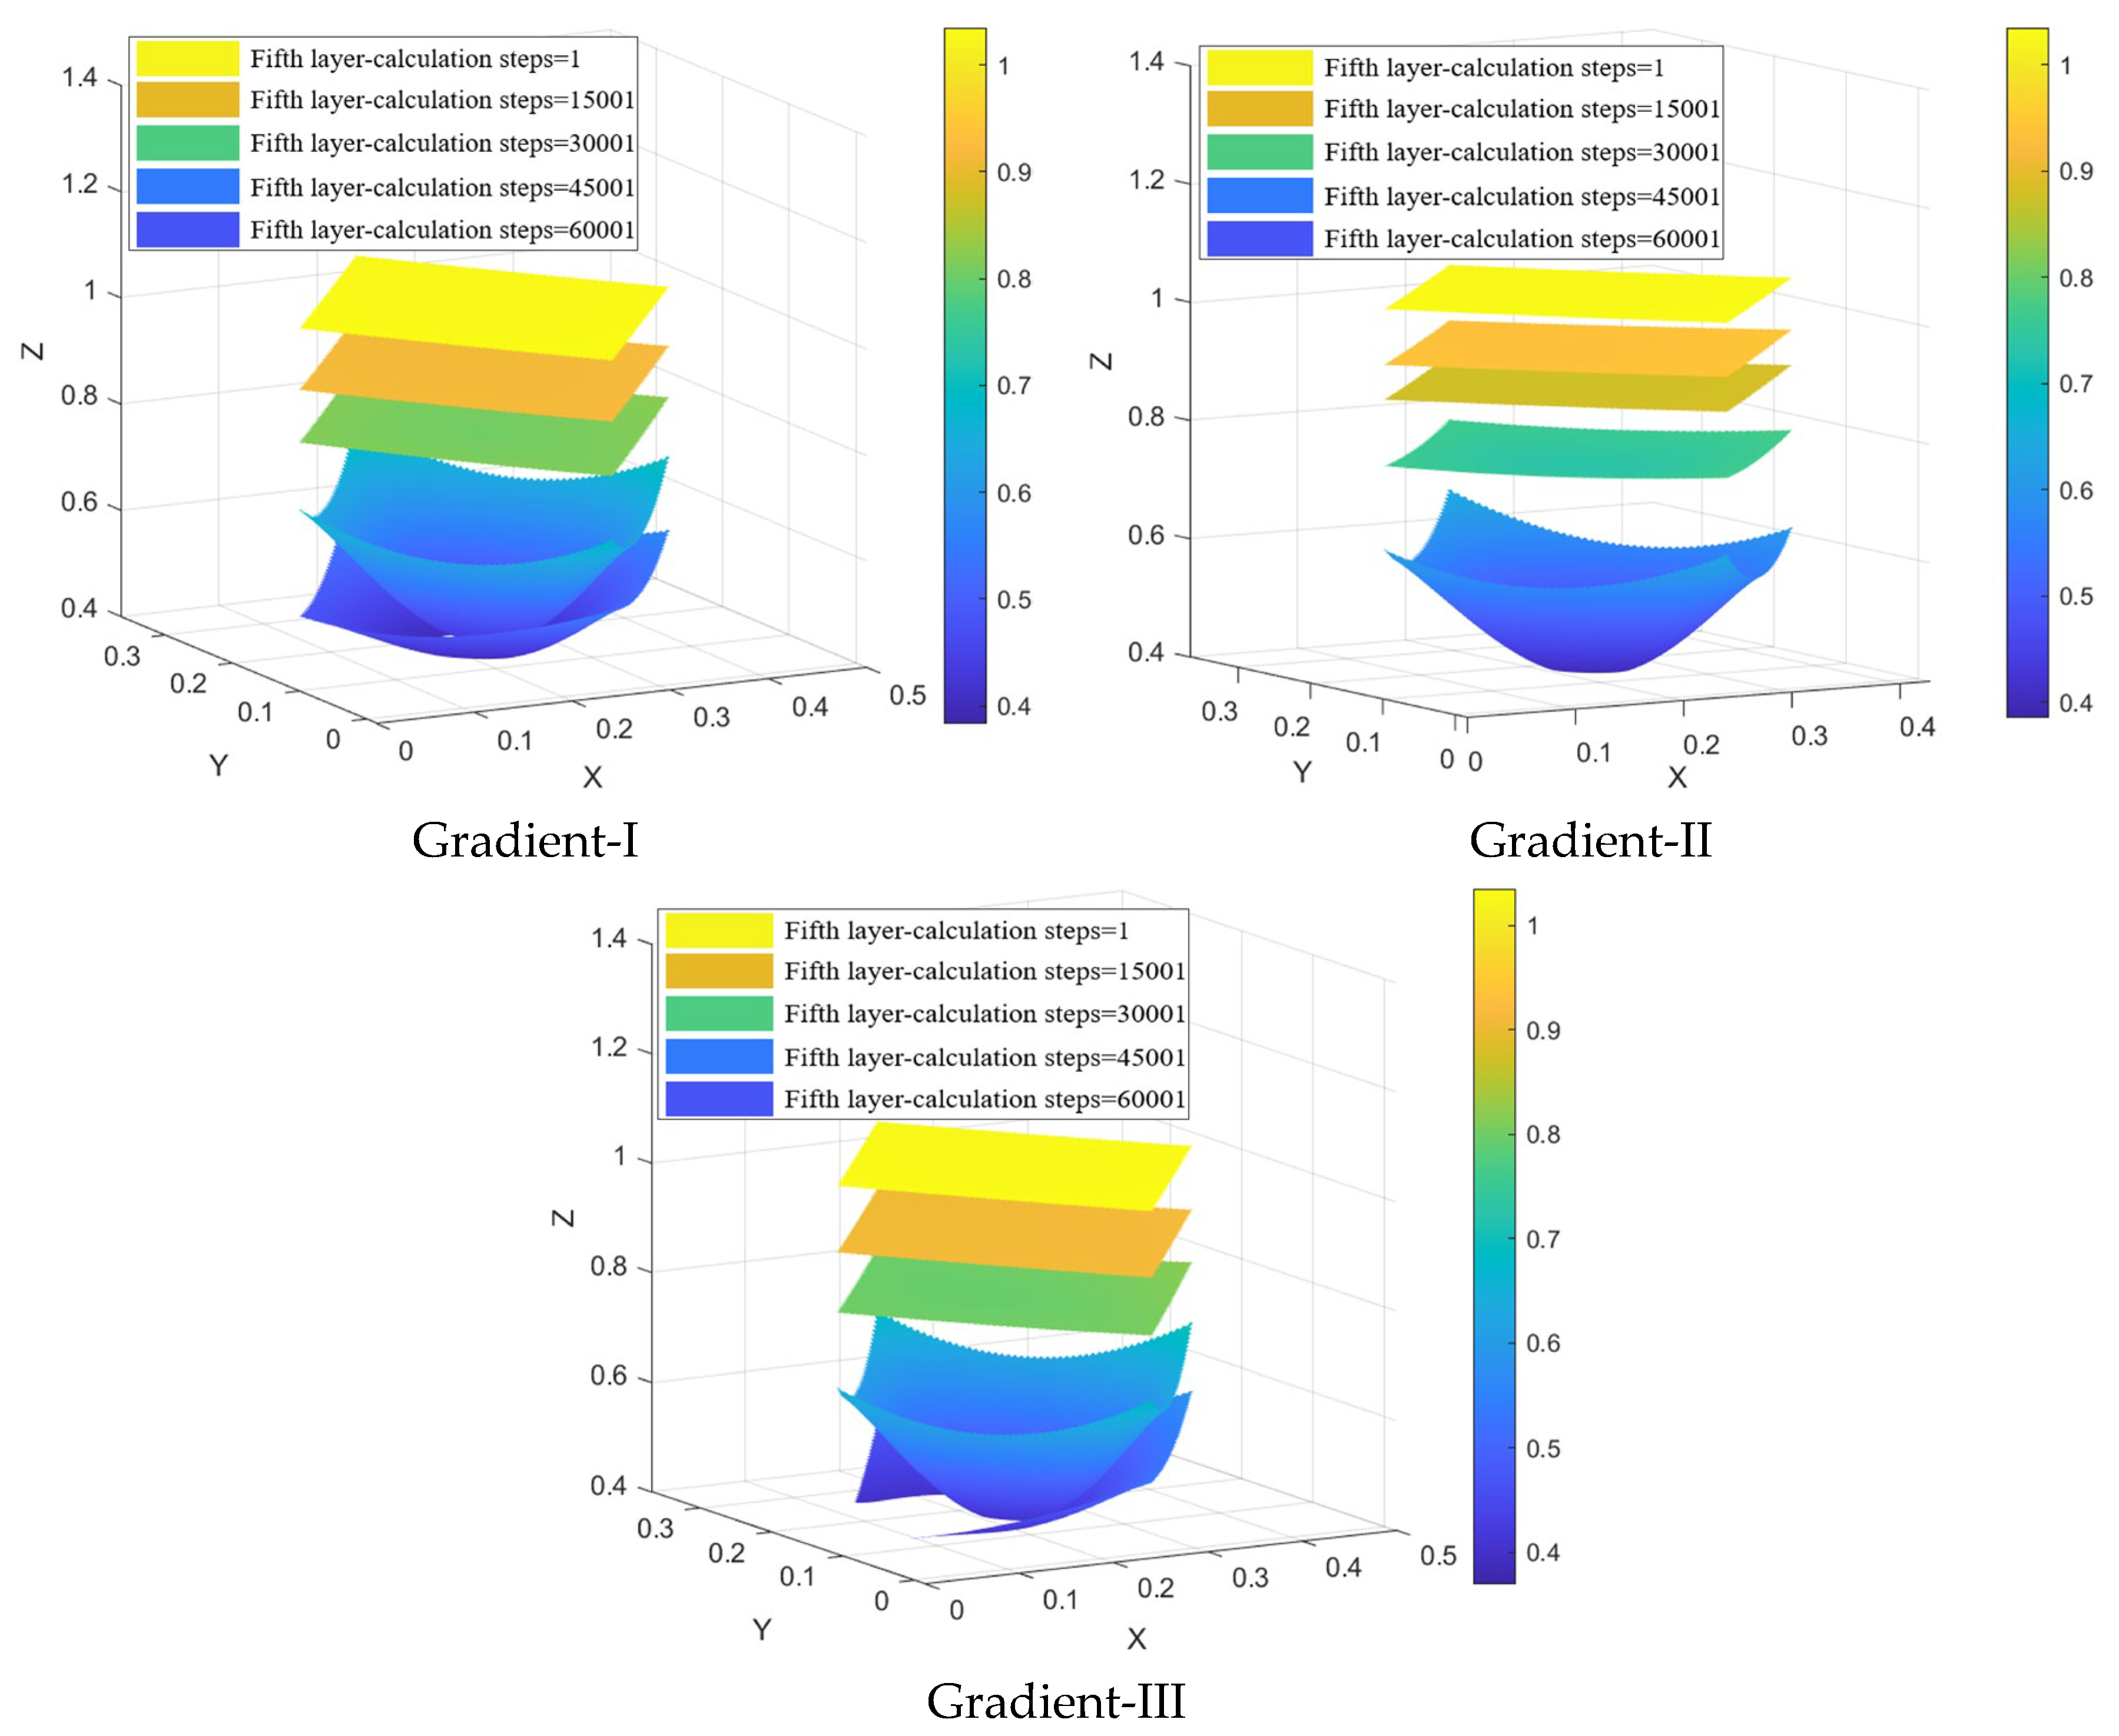
4.4. Particle Flow Characteristics Under Different Gradations
5. Conclusions
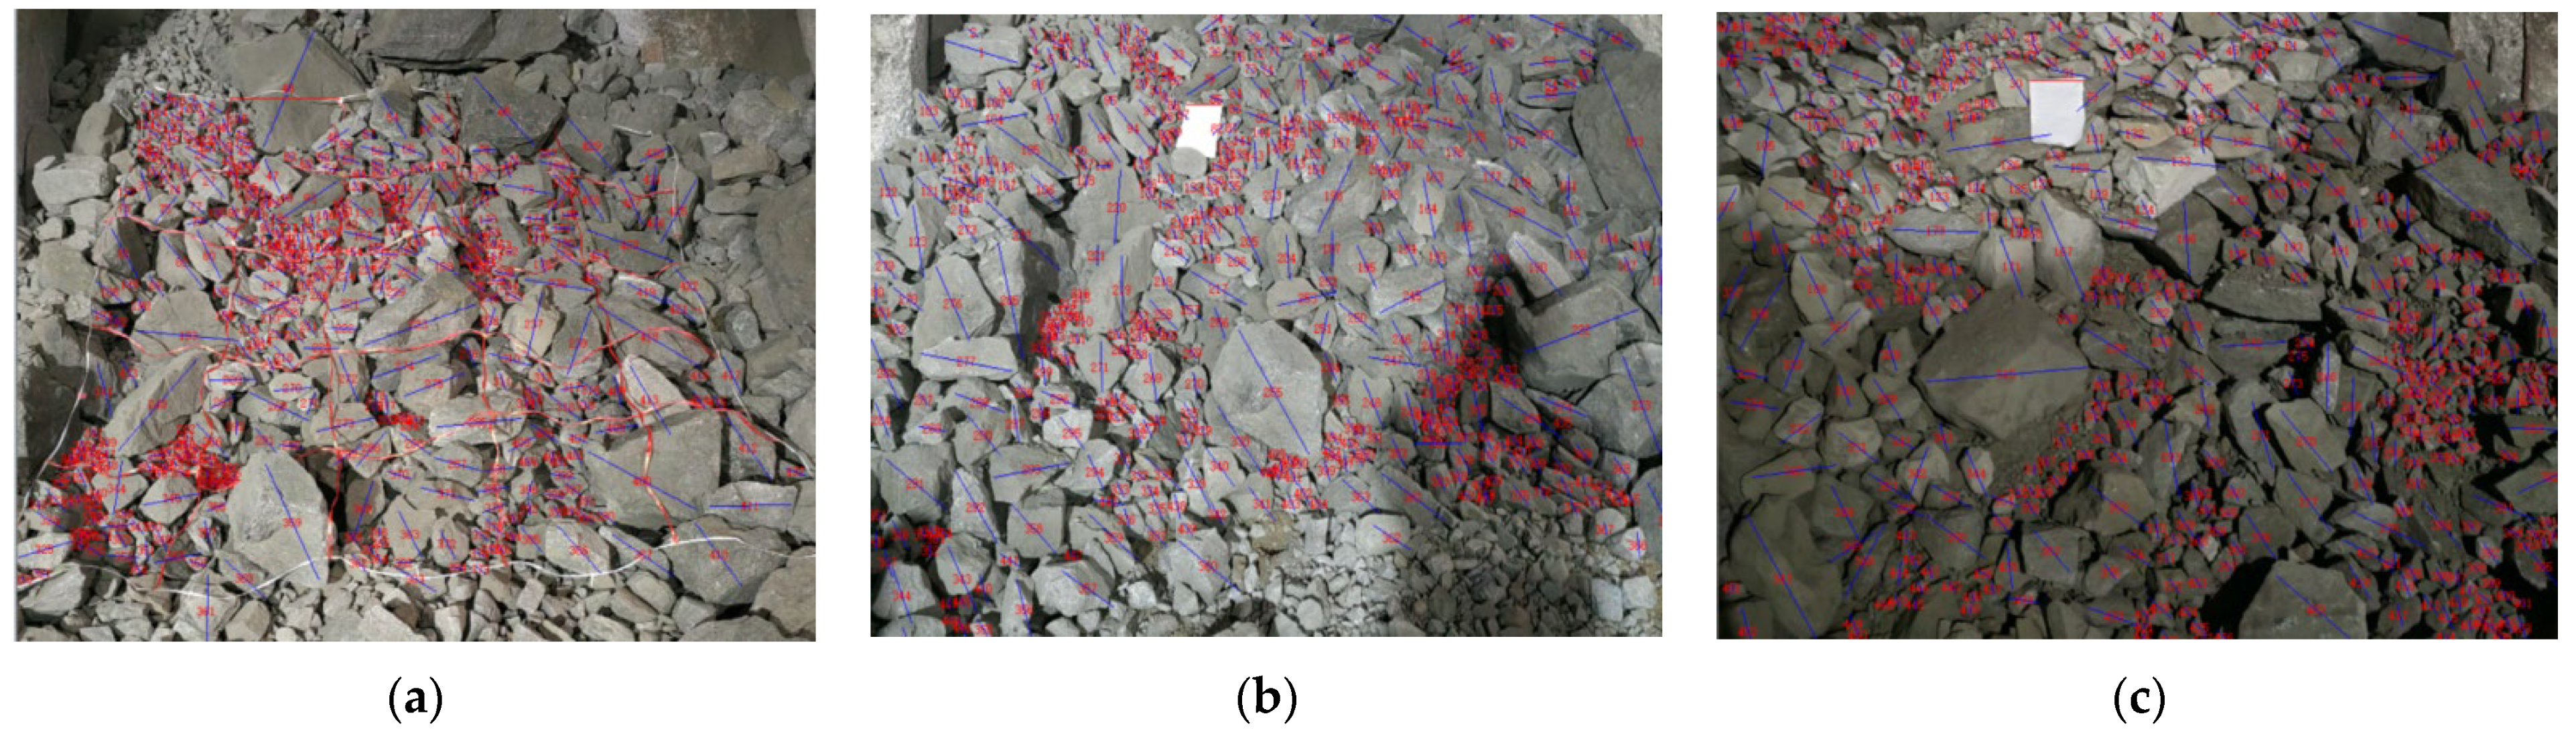
- (1)
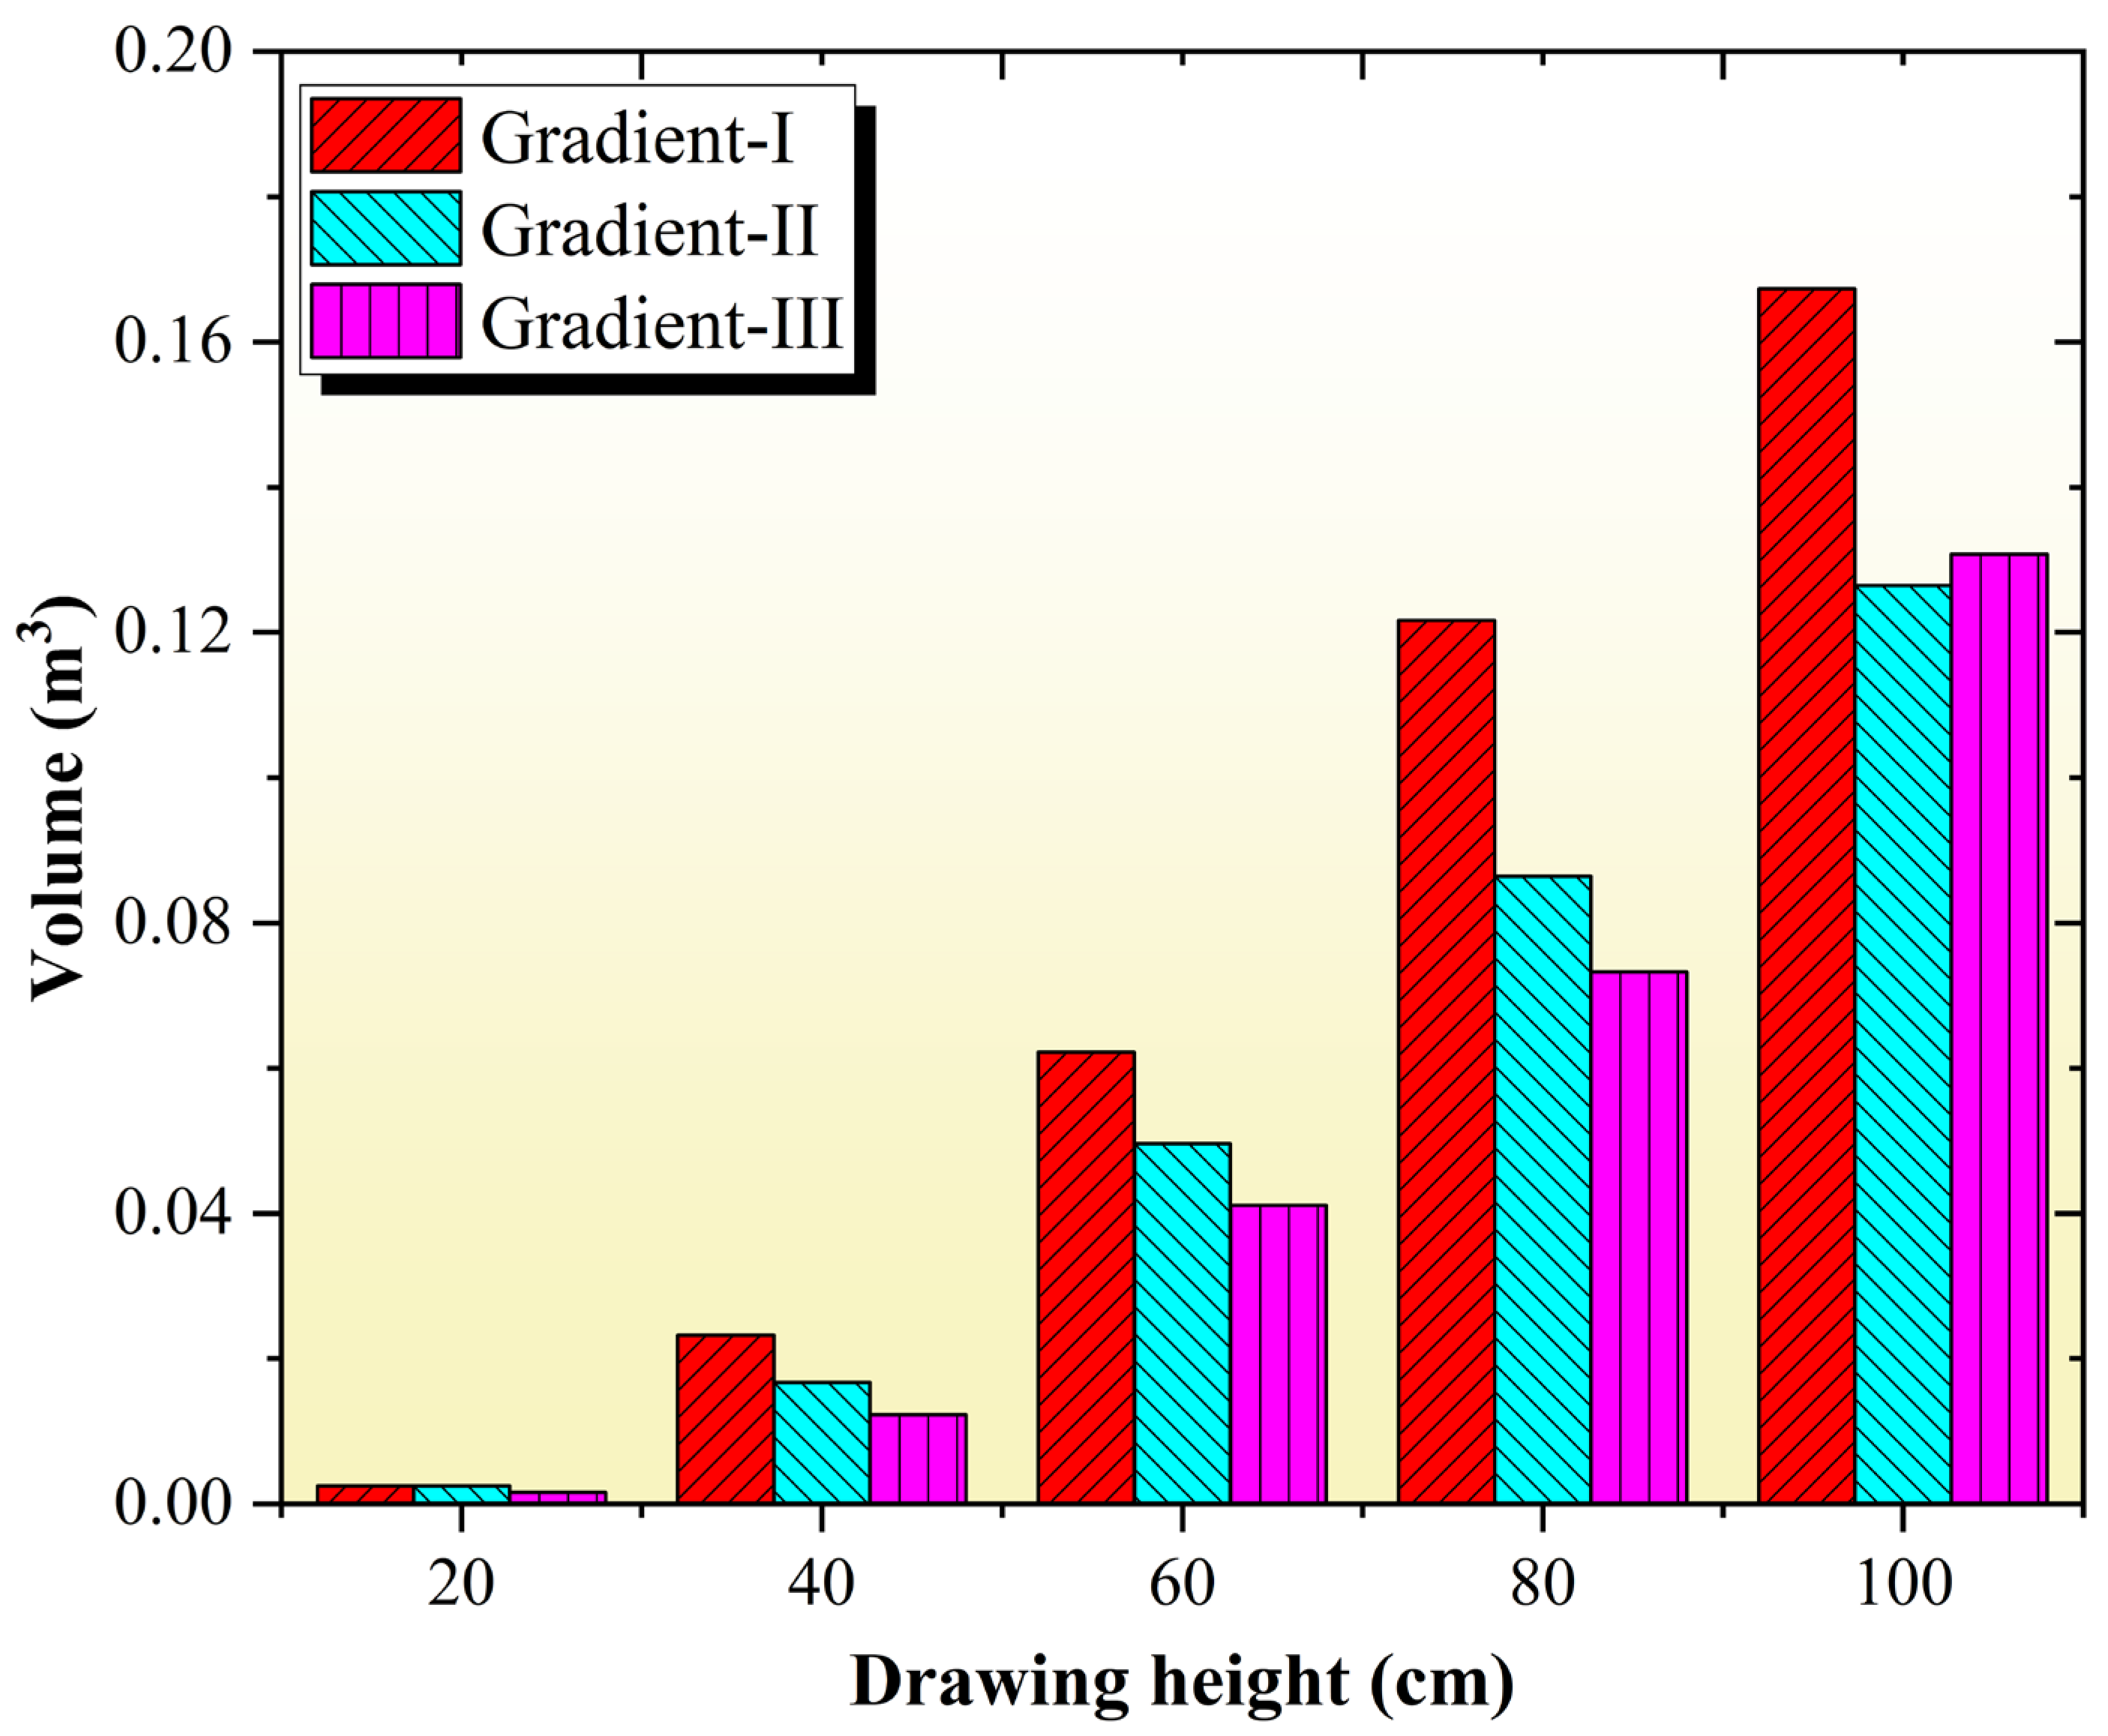
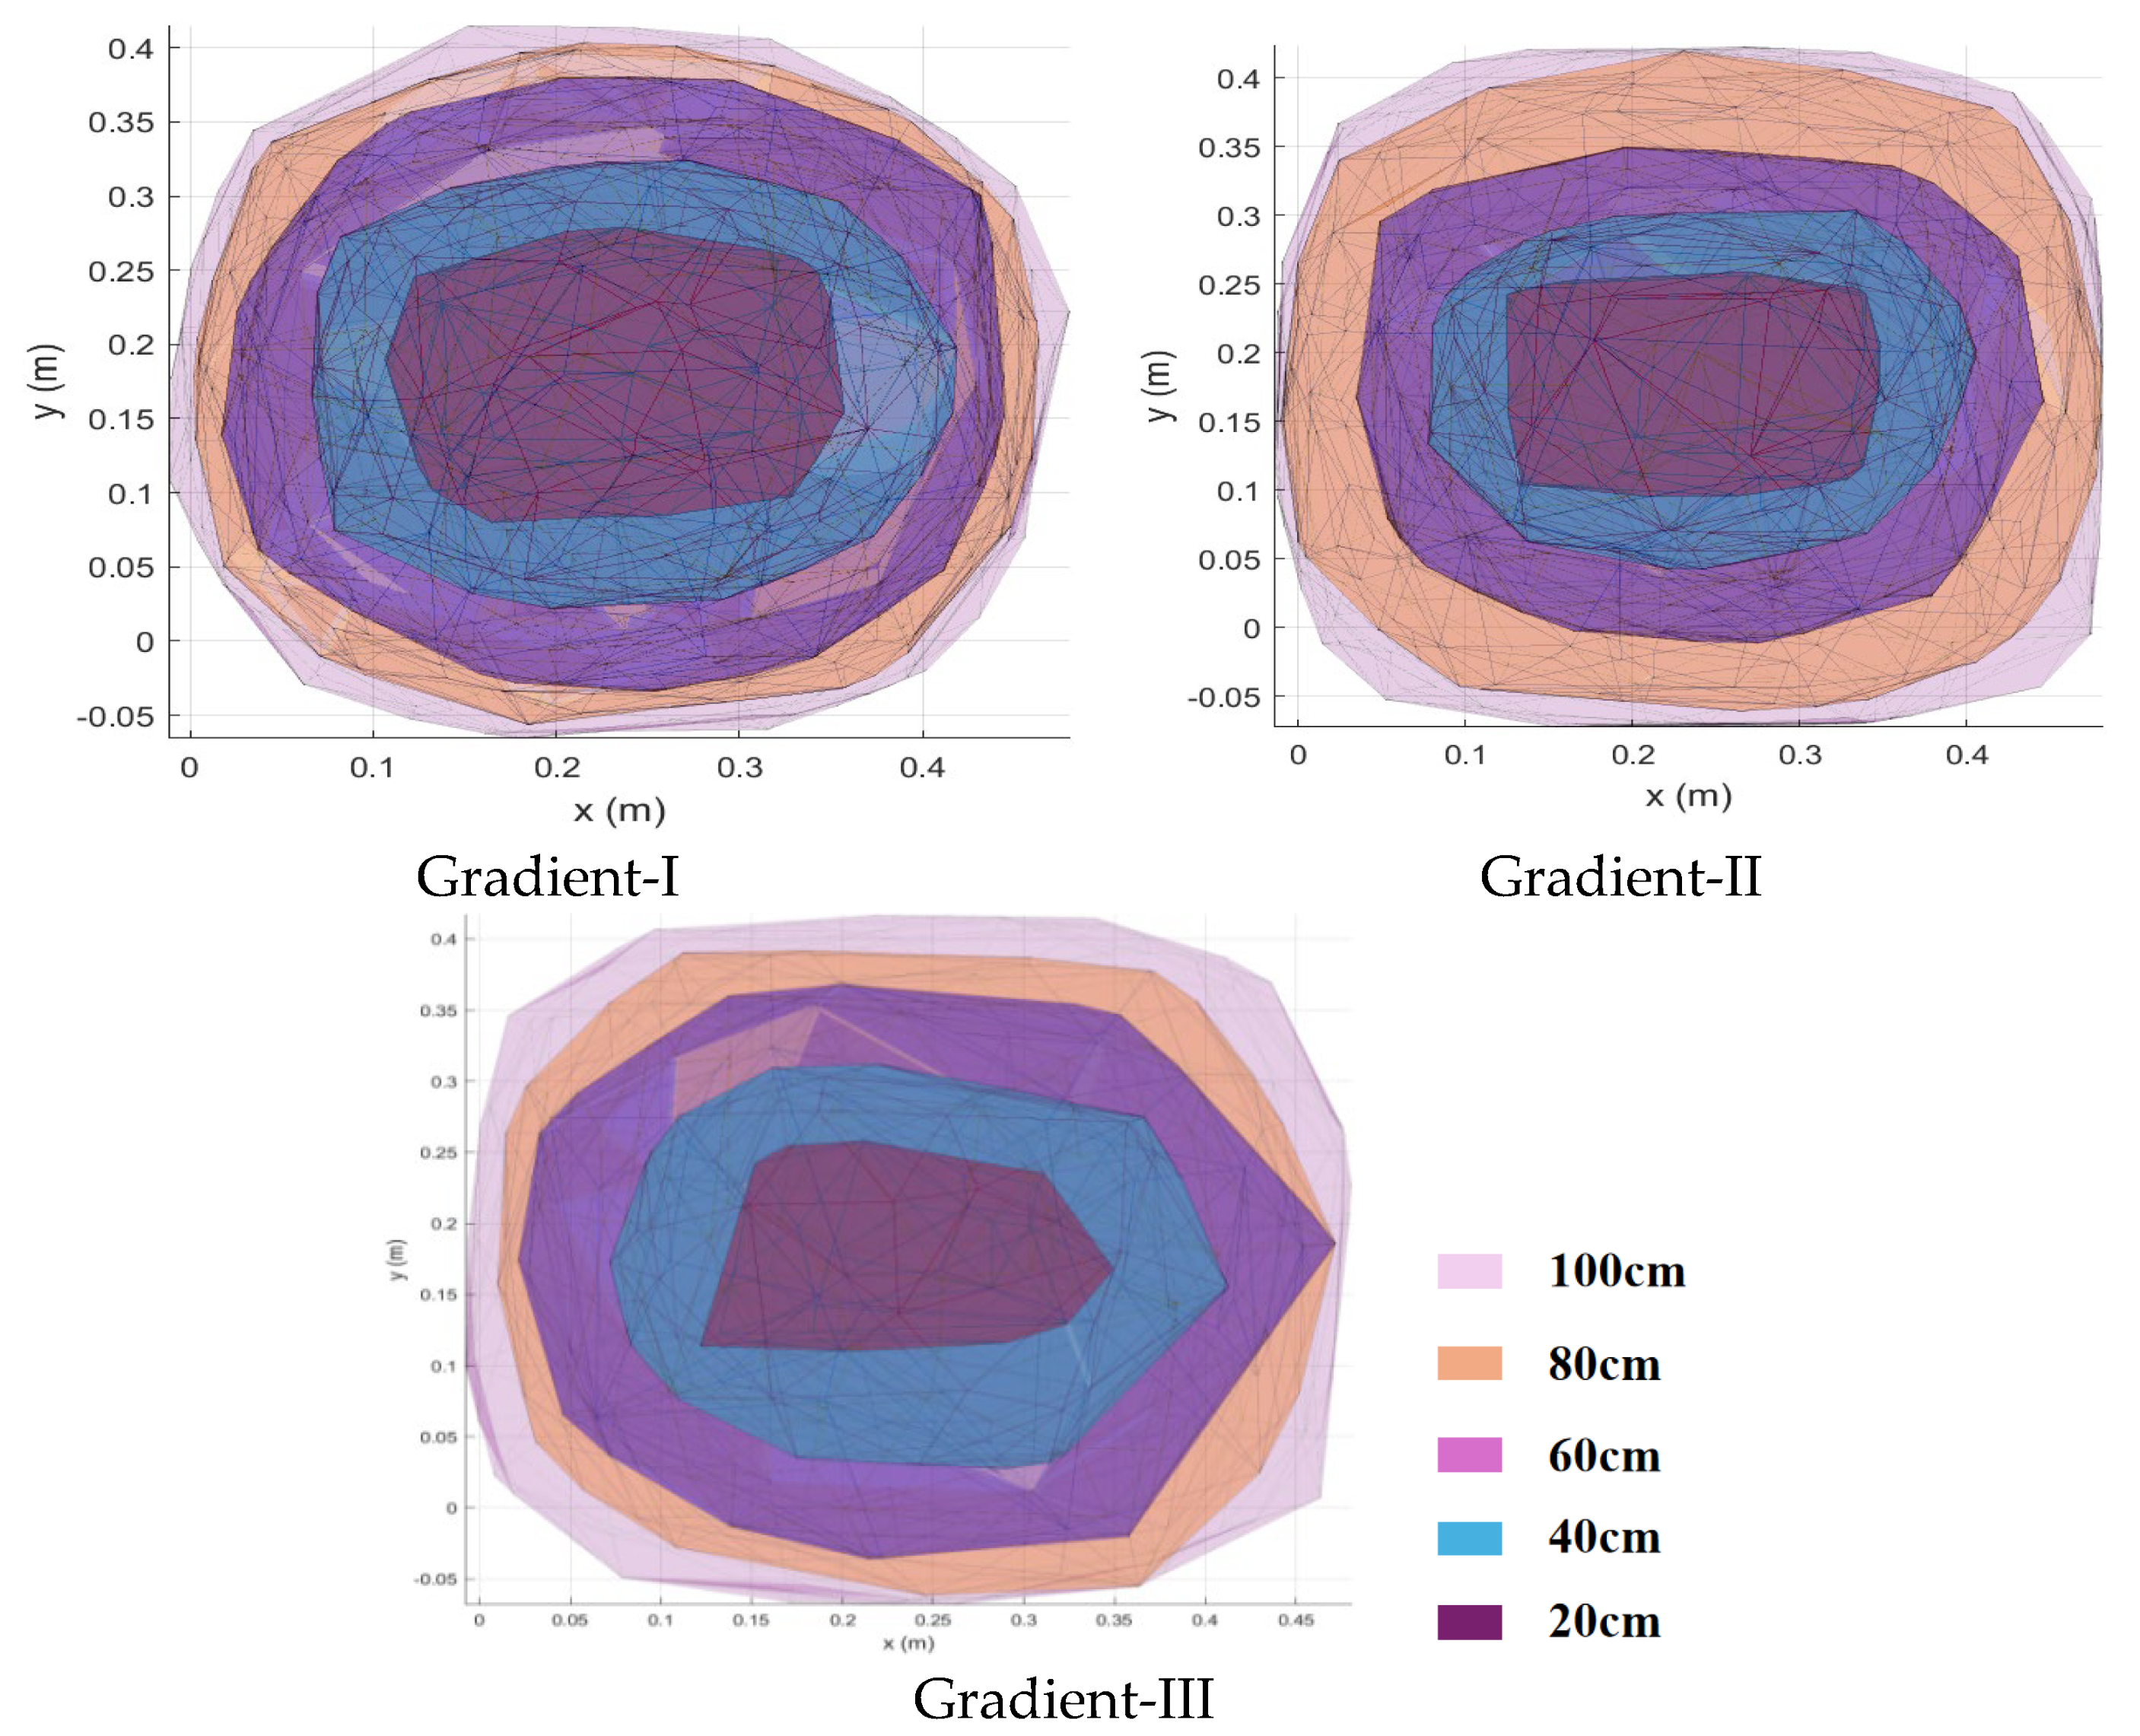
- Based on in situ fragmentation testing, three distinct particle gradations were established. From Gradation I to Gradation III, the average ore fragment size increased progressively. Experimental draw tests for these three gradations demonstrate that the extraction zone exhibits an ellipsoidal shape in the vertical direction, with elliptical cross-sections at different heights.
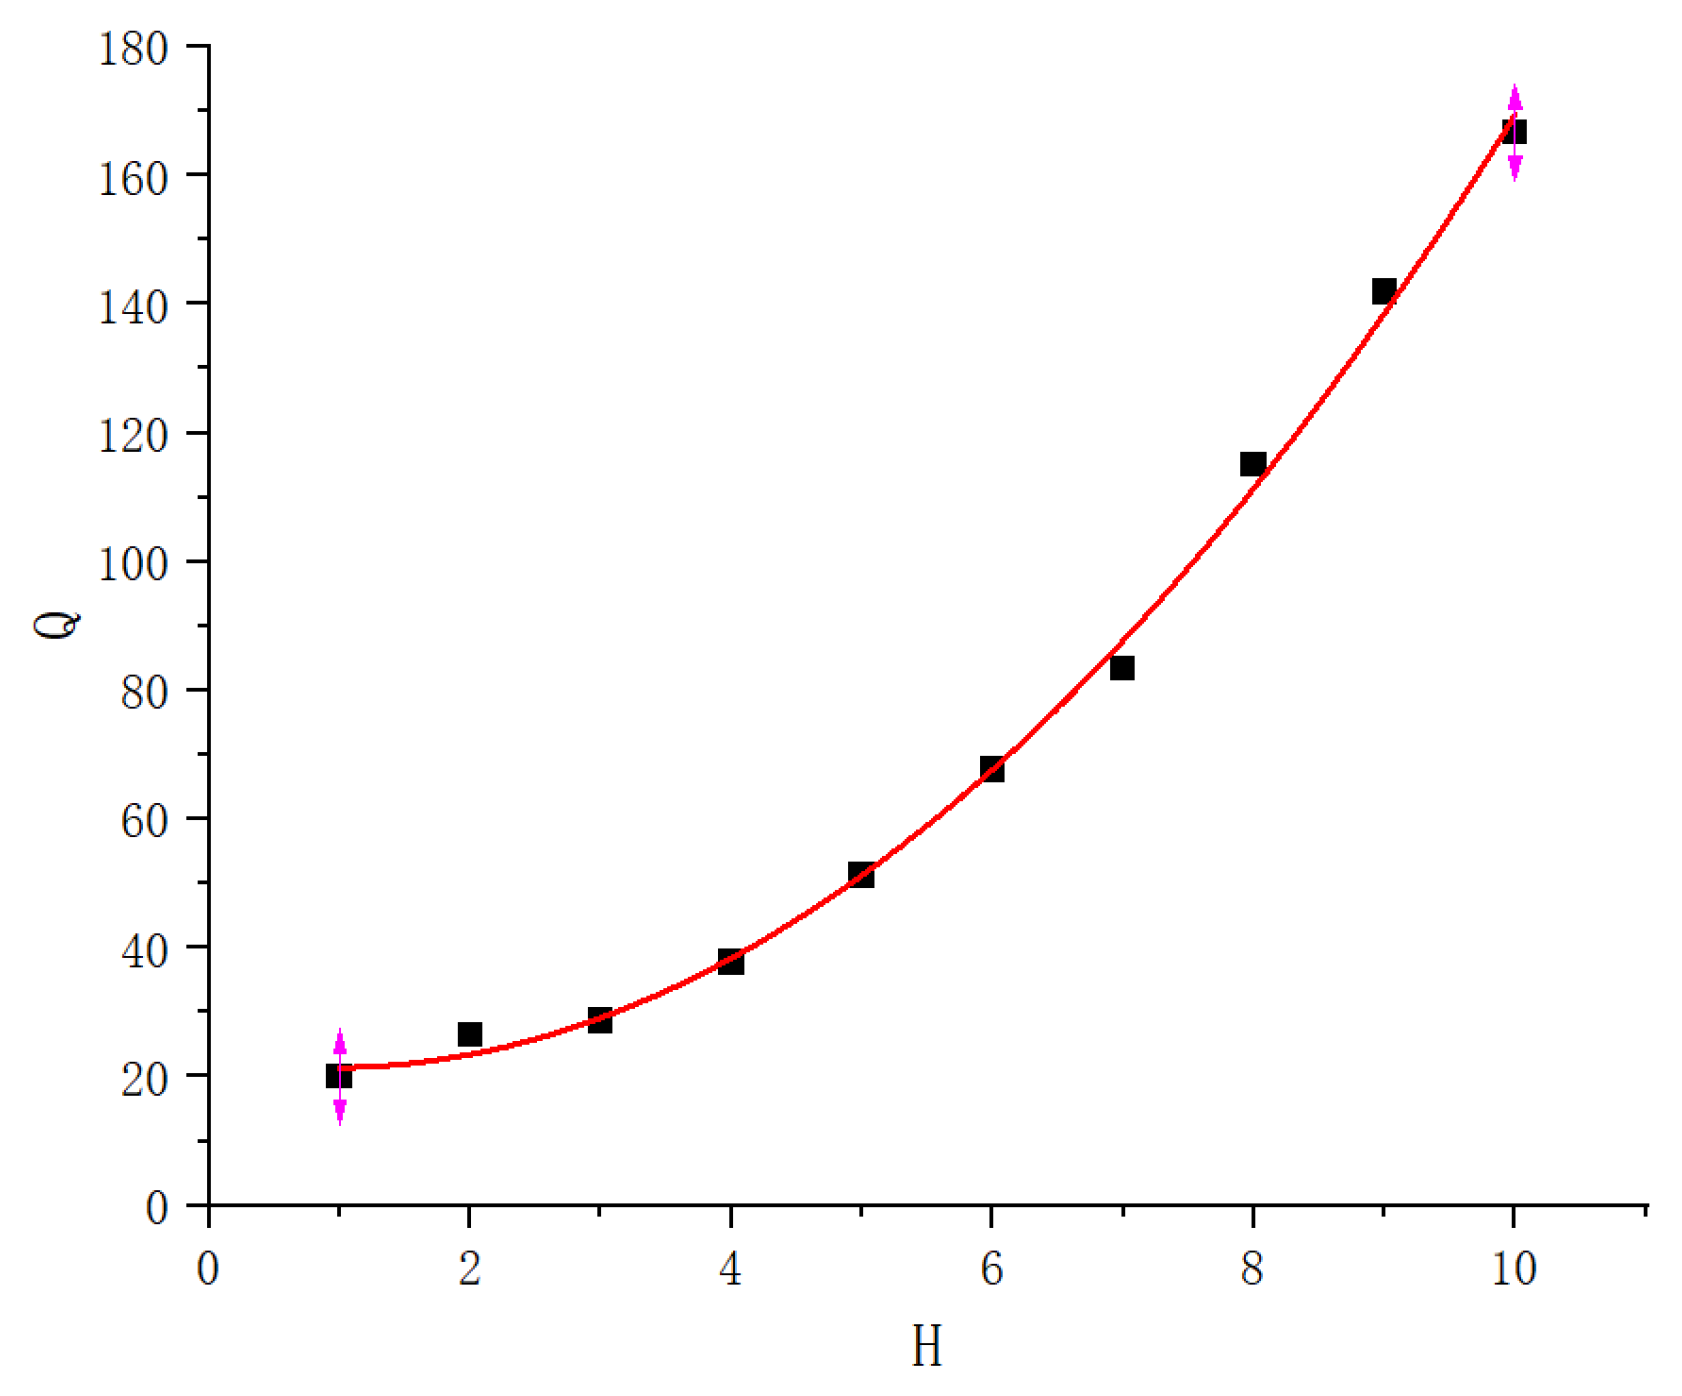
- (2)
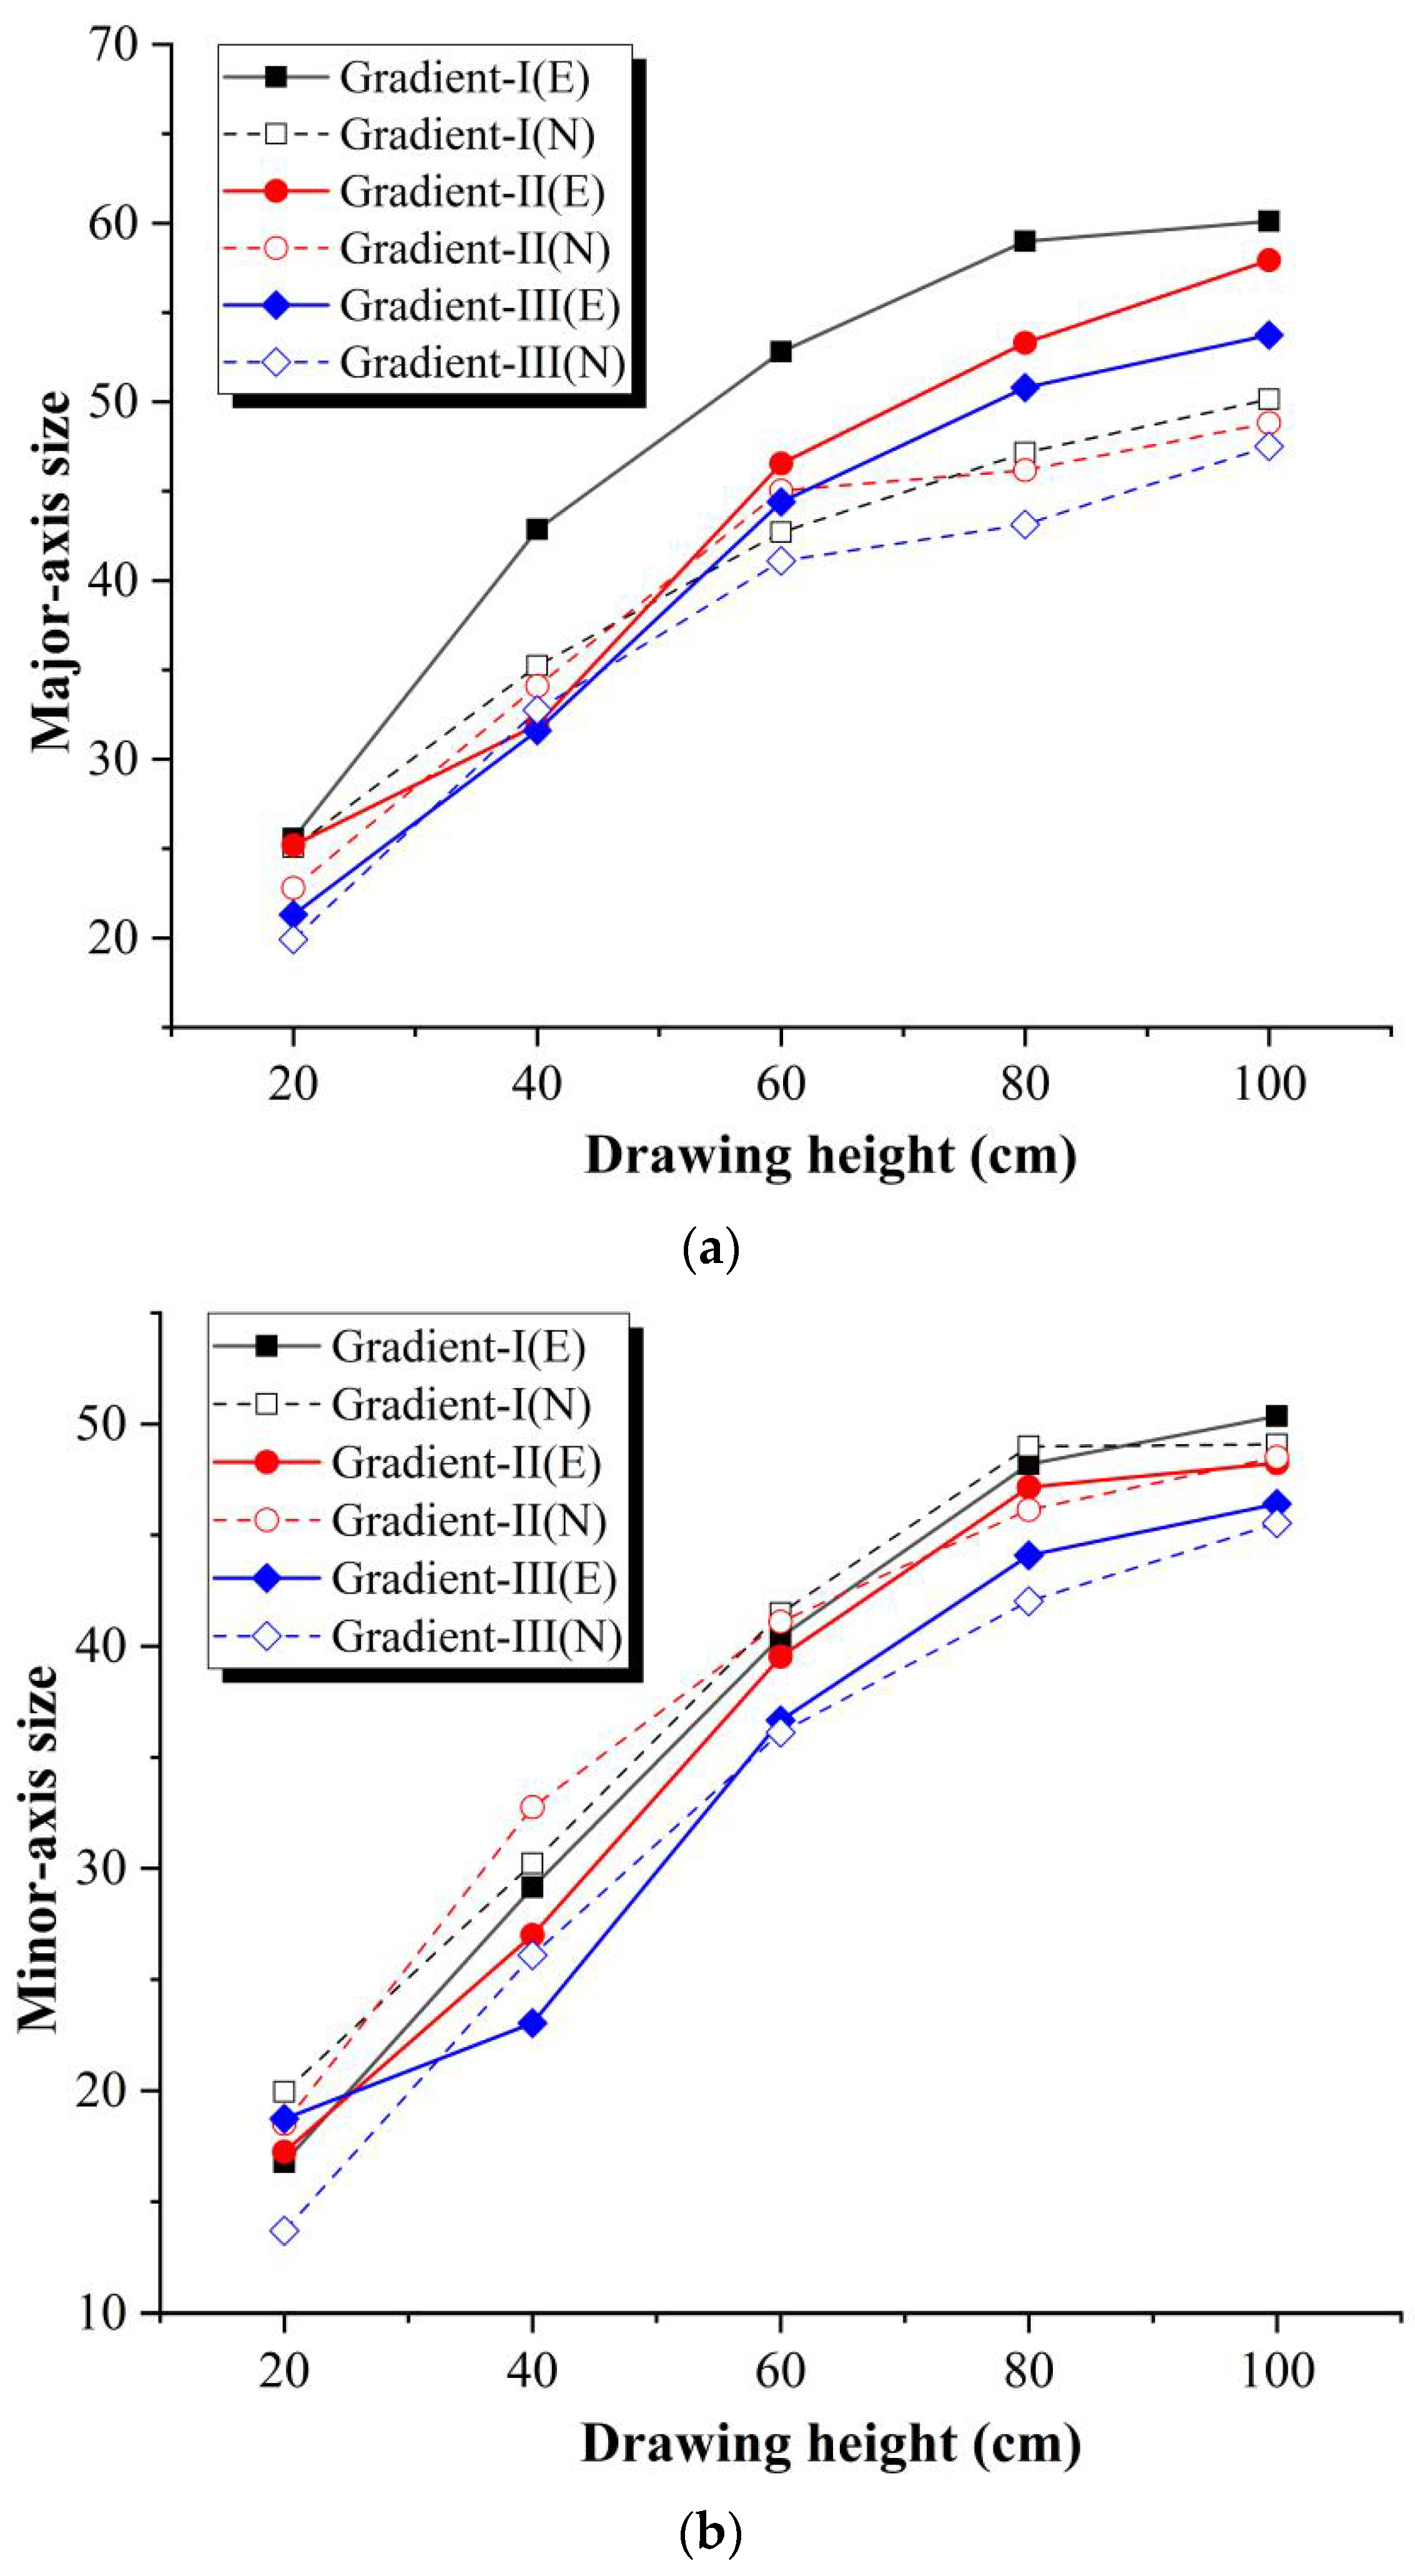
- The semi-major and semi-minor axis dimensions of the extraction zone cross-section increase with the draw height, stabilizing when a draw height of 80 cm is reached. The ore fragment size significantly impacts the size of the extraction zone. Gradation I, with the smallest average particle size, yields the largest extraction zone. Conversely, Gradation III, characterized by the largest average particle size, produces the smallest extraction zone.
- (3)
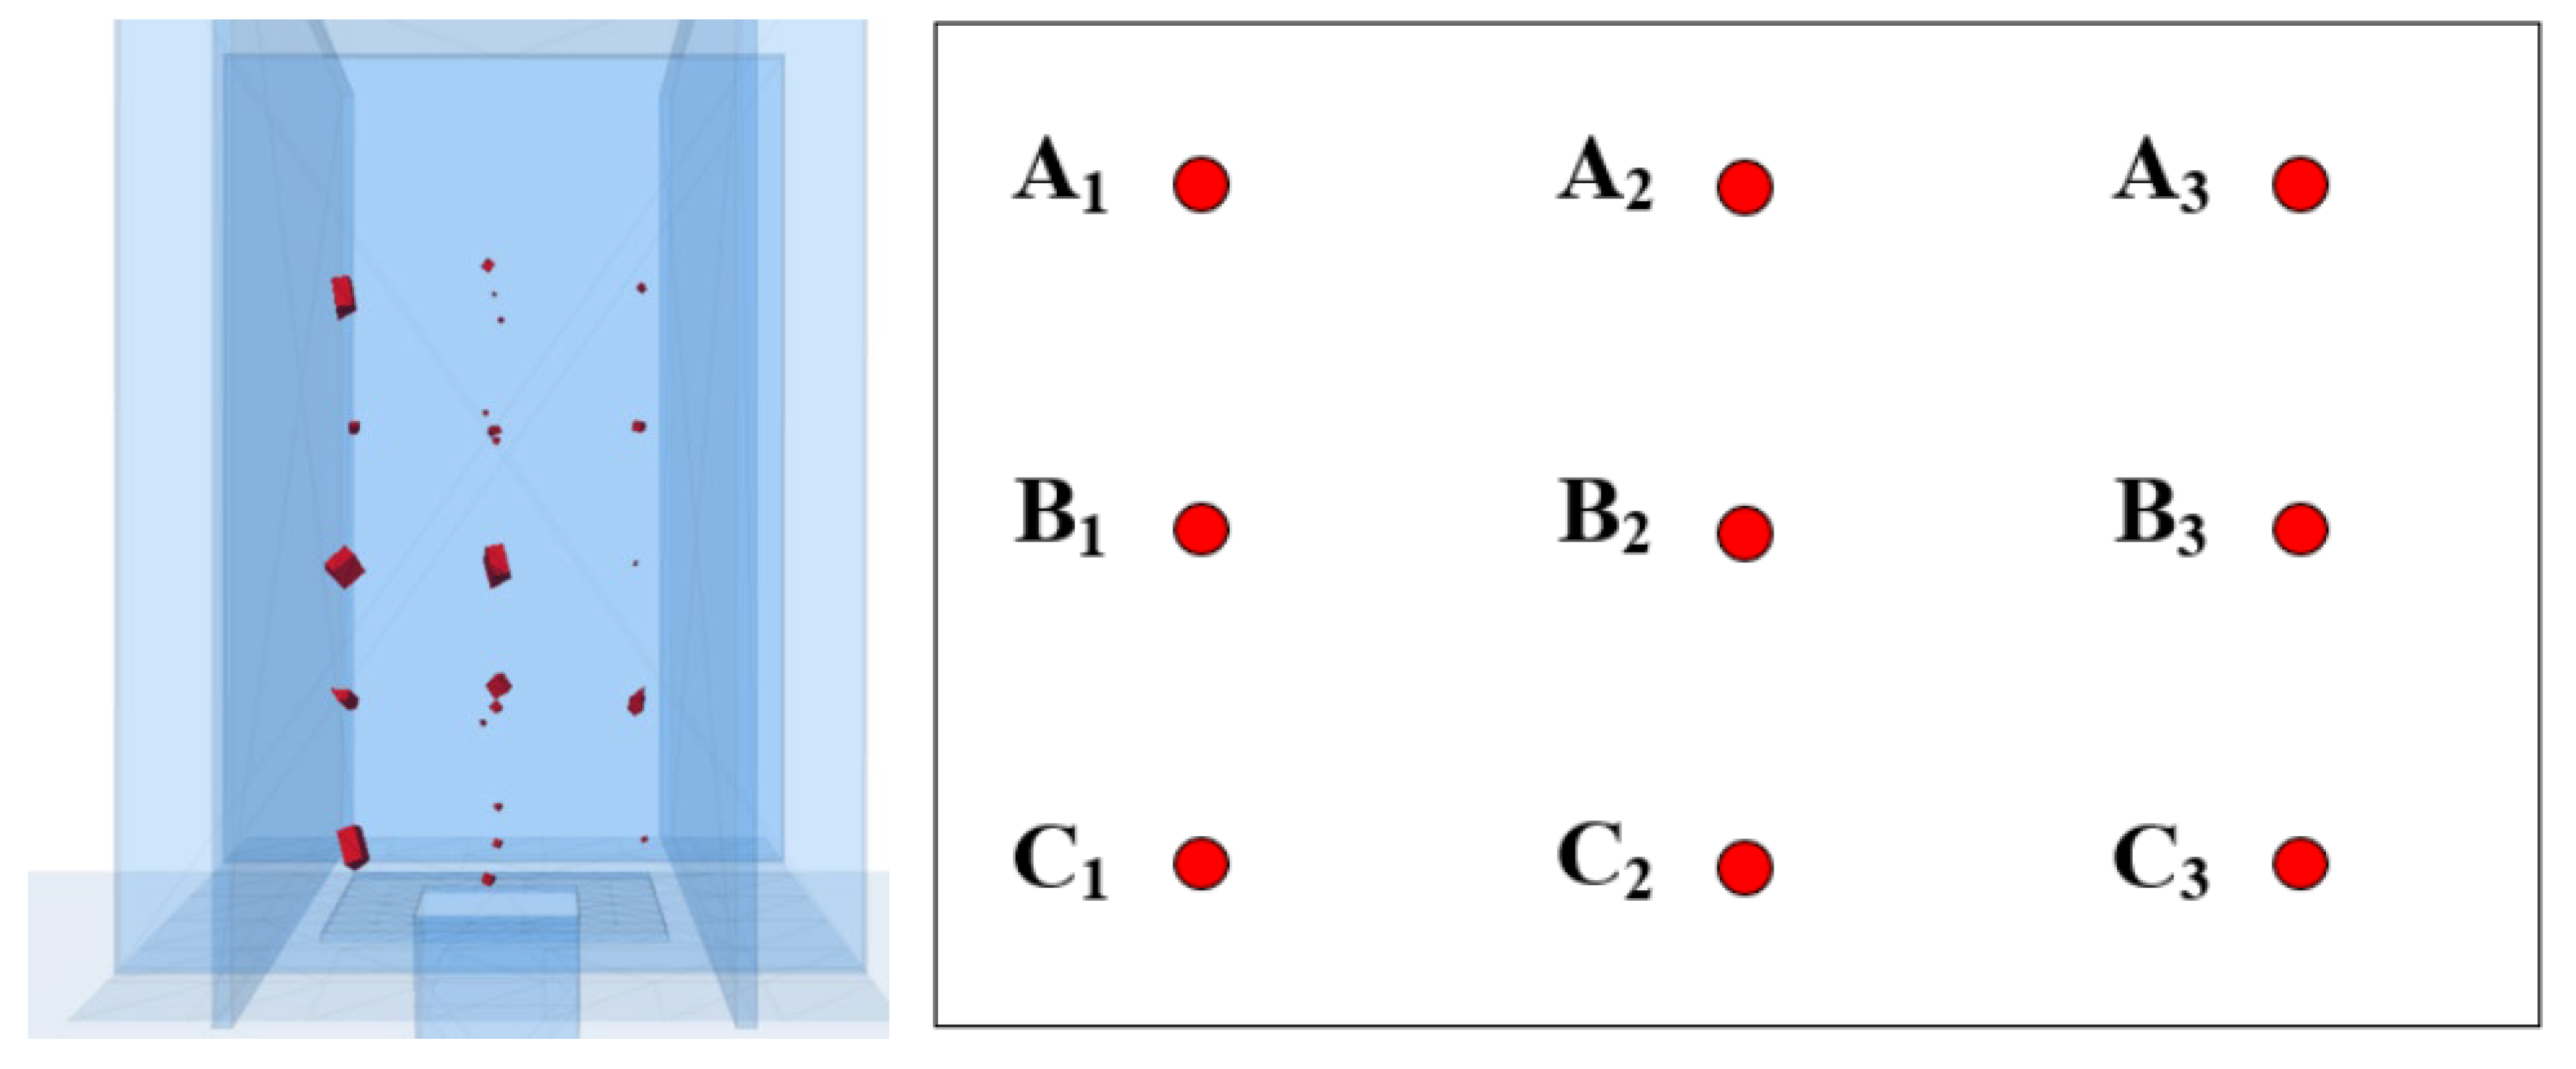
- The numerical simulation results show excellent agreement with the experimental findings. Flow characteristics of ore particles under different gradations were evaluated using multiple monitoring points within the model. The results indicate that Gradation I exhibits the best particle flowability, attributable to its smallest average particle size. As the particle size increases, the spatial extent of the movement surface derived from monitoring points diminishes. This signifies that smaller particle sizes correspond to larger flow ranges within different regions of the model.
6. Discussion
- (1)
- The predefined angles of drawbell orientations (parallel/perpendicular to the laneway) directly influence inclination and directional ore flow velocities, thereby modifying extraction zone morphology.
- (2)
- Practical mining scenarios involve simultaneous multi-drawbell operations where drift spacing and laneway intervals dynamically alter overlap characteristics, and multi-drawbell simulations are planned as part of ongoing work.
Author Contributions
Funding
Institutional Review Board Statement
Informed Consent Statement
Data Availability Statement
Conflicts of Interest
References
- Rafiee, R.; Ataei, M.; KhalooKakaie, R. A new cavability index in block caving mines using fuzzy rock engineering system. Int. J. Rock Mech. Min. Sci. 2015, 77, 68–76. [Google Scholar] [CrossRef]
- Laubscher, D.H. Block Cave Manual, Design Topic: Drawpoint Spacing and Draw Control; The University of Queensland: Brisbane, Australia, 2000. [Google Scholar]
- Castro, R.L. Study of the Mechanisms of Gravity Flow for Block Caving; University of Queensland: Brisbane, Australia, 2007. [Google Scholar]
- Eadie, B.A. A Framework for Modelling Fragmentation in Block Caving. Ph.D. Thesis, Julius Kruttschnitt Mineral Research Centre, The University of Queensland, Indooroopilly, Australia, 2003. [Google Scholar]
- Sanchez, V.S.; Castro, R.L.; Palma, S. Gravity flow characterization of fine granular material for Block Caving. Int. J. Rock. Mech. Min. Sci. 2019, 114, 24–32. [Google Scholar] [CrossRef]
- Power, G.R. Modelling Granular Flow in Caving Mines: Large Scale Physical Modelling and Full Scale Experiments; The University of Queensland: Brisbane, Australia, 2004. [Google Scholar]
- Castro, R.; Trueman, R.; Halim, A. A study of isolated draw zones in block caving mines by means of a large 3D physical model. Int. J. Rock. Mech. Min. Sci. 2007, 44, 860. [Google Scholar] [CrossRef]
- Castro, R.; Gómez, R.; Pineda, M.; Canales, J. Experimental quantification of vertical stresses during gravity flow in block caving. Int. J. Rock. Mech. Min. Sci. 2020, 127, 104237. [Google Scholar] [CrossRef]
- Jin, A.B.; Sun, H.; Wu, S.C.; Gao, Y.T. Confirmation of the upside-down drop shape theory in gravity flow and development of a new empirical equation to calculate the shape. Int. J. Rock. Mech. Min. Sci. 2017, 92, 91–98. [Google Scholar] [CrossRef]
- Bridgwater, J.; Utsumi, R.; Zhang, Z.; Tuladhar, T. Particle attrition due to shearing the effects of stress, strain and particle shape. Chem. Eng. Sci. 2003, 58, 4649–4665. [Google Scholar] [CrossRef]
- Hashim, M. Particle Percolation in Block Caving Mines; The University of New South Wales: Sydney, Australia, 2011. [Google Scholar]
- Janelid, I.; Kvapli, R. Sublevel caving. Int. J. Rock. Mech. Min. Sci. Geomech. Abstr. 1966, 3, 129. [Google Scholar] [CrossRef]
- Cundall, P.A.; Strack, O.D.L. A discrete numerical model for granular assemblies. Geotechnique 1979, 29, 47. [Google Scholar] [CrossRef]
- Elmo, D.; Rogers, S.; Dorador, L.; Eberhardt, E. An FEM-DEM numerical approach to simulate secondary fragmentation. In Computer Methods and Recent Advances in Geomechanics: Proceedings of the 14th International Conference of International Association for Computer Methods and Recent Advances in Geomechanics, 2014 (IACMAG 2014); Taylor & Francis Books Ltd.: Leiden, The Netherlands, 2015. [Google Scholar]
- Jin, A.; Sun, H.; Ma, G.; Gao, Y.; Wu, S.C.; Meng, X.Q. A study on the draw laws of caved ore and rock using the discrete element method. Comput. Geotech. 2013, 80, 59–70. [Google Scholar] [CrossRef]
- Sun, H.; Jin, A.B.; Elmo, D.; Wu, S.C.; Meng, X.Q. A numerical based approach tocalculate ore dilution rates using rolling resistance model and upside-down drop shape theory. Rock. Mech. Rock. Eng. 2020, 53, 4639. [Google Scholar] [CrossRef]
- Song, Z.Y.; Wei, W.J.; Zhang, J.W. Numerical investigation of effect of particle shape on isolated extracted zone(IEZ) in block caving. Arab. J. Geosci. 2018, 11, 310. [Google Scholar] [CrossRef]
- Rafiee, R.; Ataei, M.; KhalooKakaie, R.; Jalali, S.E.; Sereshki, F.; Noroozi, M. Numerical modeling of influence parameters in cavabililty of rock mass in block caving mines. Int. J. Rock. Mech. Min. Sci. 2018, 105, 22. [Google Scholar] [CrossRef]
- Dai, B.B.; Zhao, X.D.; Zhu, Z.H.; Tao, G.Q.; Yin, G. Feasibility of broken ore flow simulation in block caving mining method using attribute stochastic medium theory. Minerals 2022, 12, 576. [Google Scholar] [CrossRef]
- Chen, Q.; Wang, S.; Qin, S. Discrete element simulation for evolution characteristics of multi-funnel mineral-rock force chain under flexible isolation layer. Chin. J. Eng. 2020, 42, 1119–1129. [Google Scholar]
- Lapčević, V.; Torbica, S. Numerical investigation of caved rock mass friction and fragmentation change influence on gravity flow formation in sublevel caving. Minerals 2017, 7, 56. [Google Scholar] [CrossRef]
- Wu, A.X.; Wu, L.C.; Liu, X.H.; Sun, X.; Zhou, Y.; Yin, S. Study on structural parameters of sublevel caving. J. Cent. South Univ. (Sci. Technol.) 2012, 43, 1845–1850. [Google Scholar]


| Particle size | 0–1.5 mm | 1.5–4.5 mm | 4.5–7.5 mm | 7.5–10.5 mm | 10.5–15 mm | 15–45 mm |
| Percentage | 4% | 23% | 21% | 22% | 10% | 20% |
| Particle size | 0–3.0 | 3.0–6.0 | 6.0–10.5 | 10.5–15 | 15–45 | 45–90 |
| Percentage | 10% | 30% | 23% | 17% | 16% | 4% |
| Particle size | 0–3.0 | 3.0–6.0 | 6.0–10.5 | 10.5–15 | 15–45 | 45–90 |
| Percentage | 8% | 11% | 16% | 15% | 40% | 10% |
| Parameters | Value |
|---|---|
| Normal stiffness/shear stiffness | 1.2 |
| Solid density (kg/m3) | 2700 |
| Elastic modulus (GPa) | 7.1 |
| Friction coefficient | 0.35 |
| Normal damping coefficient, βn | 0.5 |
| Tangential normal damping coefficient, βs | 0.1 |
Disclaimer/Publisher’s Note: The statements, opinions and data contained in all publications are solely those of the individual author(s) and contributor(s) and not of MDPI and/or the editor(s). MDPI and/or the editor(s) disclaim responsibility for any injury to people or property resulting from any ideas, methods, instructions or products referred to in the content. |
© 2025 by the authors. Licensee MDPI, Basel, Switzerland. This article is an open access article distributed under the terms and conditions of the Creative Commons Attribution (CC BY) license (https://creativecommons.org/licenses/by/4.0/).
Share and Cite
Yang, C.; Li, G.; Gan, D.; Cao, R.; Lin, H.; Gao, R. Particle-Scale Insights into Extraction Zone Development During Block Caving: Experimental Validation and PFC3D Simulation of Gradation-Dependent Flow Characteristics. Appl. Sci. 2025, 15, 7916. https://doi.org/10.3390/app15147916
Yang C, Li G, Gan D, Cao R, Lin H, Gao R. Particle-Scale Insights into Extraction Zone Development During Block Caving: Experimental Validation and PFC3D Simulation of Gradation-Dependent Flow Characteristics. Applied Sciences. 2025; 15(14):7916. https://doi.org/10.3390/app15147916
Chicago/Turabian StyleYang, Chaoyi, Guangquan Li, Dengjun Gan, Rihong Cao, Hang Lin, and Rugao Gao. 2025. "Particle-Scale Insights into Extraction Zone Development During Block Caving: Experimental Validation and PFC3D Simulation of Gradation-Dependent Flow Characteristics" Applied Sciences 15, no. 14: 7916. https://doi.org/10.3390/app15147916
APA StyleYang, C., Li, G., Gan, D., Cao, R., Lin, H., & Gao, R. (2025). Particle-Scale Insights into Extraction Zone Development During Block Caving: Experimental Validation and PFC3D Simulation of Gradation-Dependent Flow Characteristics. Applied Sciences, 15(14), 7916. https://doi.org/10.3390/app15147916