1. Introduction
The rapid evolution of sensor, communication, and computing technologies has initiated a new era of connectivity and innovation, with 5G networks at the forefront of this transformation. With the development of Beyond 5G (B5G) and 6G networks, the demand for precise, high-accuracy positioning is increasing [
1]. Location-based services have emerged as a cornerstone application of 5G systems, offering transformative potential across a wide range of industries. In the context of the retail sector, the advent of location data has precipitated a significant evolution in the shopping experience, thereby facilitating the provision of personalized services, targeted promotions, and the optimization of store layouts [
2].
The evolution of 5G wireless communication [
3] has expanded services and applications to meet the demands of an increasingly dynamic and interconnected society. Network-assisted positioning is a fundamental element of 5G and will retain its significance in 6G, particularly with regard to vehicle localization. Recent advancements in 4G LTE and 5G technologies have enabled the development of high-precision positioning services, prompting 3GPP to prioritize localization for emerging industries [
4]. Consequently, 3GPP is advancing 5G and radio access technologies to meet more stringent accuracy requirements than earlier generations [
5]. Nevertheless, attaining the key performance indicator (KPI) levels stipulated by 3GPP for localization accuracy poses considerable challenges [
6]. S. Bartoletti [
7] presents a comprehensive overview of 5G positioning in the context of recent advancements and standardization efforts. The researcher begins with key performance indicators (KPIs) and subsequently undertakes an analysis of cellular positioning technologies from 1G to 4G, as well as advancements in 5G. Recent research [
8] proposes positioning solutions for 5G and next-generation networks by using deep learning techniques and radio fingerprinting in 5G NR.
Release 16 introduces significant advancements to the SRS specification. SRS positioning can be modified through the adjustment of the initial comb offset and cycle period. It has been determined that the SRS resource occupies a portion of the orthogonal frequency division multiplexing (OFDM) subcarriers. The adaptable nature of the 5G NR signal optimizes the design of the Positioning Reference Signal, making it more suitable for localization than its predecessor [
9]. The PRS was originally standardized in 3GPP Release 9 to support LTE positioning capabilities and form the basis of this approach. A substantial body of research has focused on exploring its implementation in LTE and 4G systems.
The primary reference for NR positioning is 3GPP TR 38.855. In Release 16, PRS was refined to achieve a positioning accuracy of less than 5 m in outdoor environments and less than 3 m in indoor environments. Release 17 introduced additional enhancements, thereby enabling centimeter-level accuracy to support high-precision applications. Release 18 expands localization support by incorporating sidelink-based positioning and ranging, improving performance in scenarios with insufficient coverage [
10]. Hyun-Su Cha proposes a system for ultra-high-accuracy positioning in 5G New Radio (NR), enabled by new standardization features introduced in Release 18. The incorporation of carrier phase positioning, sidelink-based ranging, bandwidth aggregation techniques, and low-power solutions tailored for RedCap UE constitutes a key component of the proposed approach [
11].
Yu Ge proposes a solution to the V2X sidelink tracking challenge. The proposed approach utilizes a Kalman filter to address the challenge, incorporating estimated error covariance lower bounds (EECLBs) to enhance tracking accuracy. A gating mechanism is also proposed to improve LOS detection and strengthen the robustness of the tracking framework [
12]. A recent study proposes the CCM-SPS scheme to enhance resource allocation in sidelink-based joint communication and sensing systems. The objective of this scheme is to mitigate consecutive collisions and enhance both sensing accuracy and communication reliability under varying traffic conditions [
13]. Researcher Evangelos Bitsikas proposes an analysis of 3GPP NR V2X sidelink communication, focusing on key physical-layer and security procedures [
14]. Most analyses of 5G positioning performance have been conducted through simulation-based methods [
15], employing standardized propagation models [
16] and proprietary tools [
17,
18]. However, experimental validation of these systems using 5G signal transmissions remains limited, with only a few studies available [
19].
As stated in [
20], research was conducted to assess the effect of various PRS allocations within a slot on localization. Similarly, Ref. [
21] explored the performance of PRS in supporting Observed Time Difference of Arrival (OTDOA). Research works such as [
22] and [
23] explore 5G NR-based indoor positioning, while [
24,
25] examine positioning in urban canyon environments. A range of scenarios, including indoor office and factory environments [
26], have been examined through the application of diverse positioning methodologies, including TDOA and TOA. Siyu Huang [
27] proposes a 5G positioning performance evaluation and examines the design and detection of DL-PRS, emphasizing its application in TDOA-based positioning.
Chao Sun and H. Zhao propose a GNSS–5G hybrid positioning technique that integrates TOA and AOA measurements [
28]. Researchers Lu Bai and Chao Sun propose a joint positioning and synchronization method that addresses the challenge of inter-base station synchronization errors in imperfectly synchronous 5G mm-wave systems [
29]. Yingzhe He and Chao Sun propose a Variational Bayesian Adaptive Kalman Filter (VBAKF) to enhance the accuracy of 5G positioning in environments with significant noise changes, addressing the limitations of current methods like the Extended Kalman Filter (EKF) [
30].
In the context of dense urban deployments, sub-meter level mean positioning accuracy is expected due to the presence of favorable propagation conditions and the implementation of advanced signal processing methodologies [
31]. Time Division Duplexing (TDD) systems facilitate uplink channel estimation through UL-SRS transmitted by the UE, enabling base stations (BS) to infer downlink propagation characteristics via channel reciprocity. A number of studies have examined 5G positioning methods that utilize SRS signals for localization purposes [
32]. Radio signal-based positioning is commonly performed using estimation methods that extract features from signal properties. The environmental multipath characteristics are inherently captured in Channel State Information (CSI) [
33], which can be used to describe and exploit the radio environment for positioning [
34]. Additional studies examine localization using beam information and Reference Signal Received Power (RSRP) [
35].
In radio-based positioning, specialized signals are typically required to enable a receiver to estimate relevant propagation characteristics. This process is commonly referred to as channel sounding [
36]. In a TDD system, the uplink propagation environment is estimated using SRS transmitted by each UE. This allows the BS to infer the downlink propagation conditions by leveraging channel reciprocity [
37]. The process of uplink channel estimation requires the determination of critical parameters, including the TOA and AOA, which function as pivotal metrics for the estimation of the position of the UE. While research on uplink-based positioning approaches remains limited, a researcher in [
38] proposes a novel framework. This framework utilizes simulated UL-SRS channel measurements to assess the feasibility of 3D localization through joint angle-time estimation and expectation-maximization techniques.
B. Tan and Wang [
39] propose an alternative UL-centric strategy tailored for indoor environments. This strategy employs simulated UL-SRS transmissions to address localization challenges. Despite these efforts, comprehensive evaluations of positioning performance using UL-SRS and DL-PRS remain to be explored. A review of the existing literature reveals that the majority of prior research has focused on either downlink PRS or simulated uplink conditions. However, a unified performance comparison is lacking. To address this gap, our work presents a detailed evaluation and comparison of UL-SRS and DL-PRS positioning accuracy under LOS and NLOS conditions, highlighting the practical implications of using both signals for enhanced 5G localization. The main contributions of this paper are as follows
Assess the performance of UL-SRS and DL-PRS signals for 5G UE positioning, particularly in urban environments under LOS conditions.
Examine the behavior of UL-SRS and DL-PRS signals in NLOS scenarios by identifying key challenges and quantifying their impact on positioning accuracy.
Analyze and compare the effectiveness of UL-SRS and DL-PRS to establish a reliable performance benchmark for 5G positioning.
This research contributes to the field by expanding the understanding of their functionalities, providing a novel perspective on 5G UE localization. The findings of this study indicate that there is considerable potential for the substantial improvement of positioning accuracy and robustness in future 5G networks.
The structure of this paper is as follows: In
Section 2, the methodology is presented in detail, with comprehensive discussions on various aspects of the proposed approach. Specifically,
Section 2.1 and
Section 2.2 outline the 5G signal structure and configuration, thereby defining the key parameters for UL-SRS and DL-PRS transmission.
Section 2.3 focuses on the design of NR SRS, explaining its structure, resource allocation, and signal properties tailored for precise uplink positioning. In
Section 2.4, the design of the NR PRS is discussed in detail, including its role in downlink-based positioning. In
Section 2.5, the TOA measurement is described. Finally,
Section 4 presents the simulation results, providing an analysis of the proposed methodology.
2. Methodology
2.1. The 5G Signal Structure and the Role of SRS and PRS for Positioning
The proposed method evaluates 5G positioning performance by utilizing UL-SRS and DL-PRS in both LOS and NLOS scenarios. The methodology involves the transmission of SRS signals from the UE to the gNBs for uplink-based positioning and the transmission of PRS signals from the gNBs to the UE for downlink-based positioning. The performance of SRS and PRS transmission was evaluated through the implementation of a MATLAB R2022b-based simulation, which utilized the nrSRSConfig and nrPRSConfig tools. The utilization of TOA measurements facilitates the estimation of the UE location by determining the propagation delay of the received signals. For the purposes of simulation, it is assumed that the gNBs and UE are synchronized. The impact of synchronization errors on TOA-based estimation is beyond the scope of this study and is not considered. The positioning accuracy is determined by varying the comb size and inter-site distance, particularly highlighting performance variations between LOS and NLOS scenarios. The methodology is visually presented in
Figure 1.
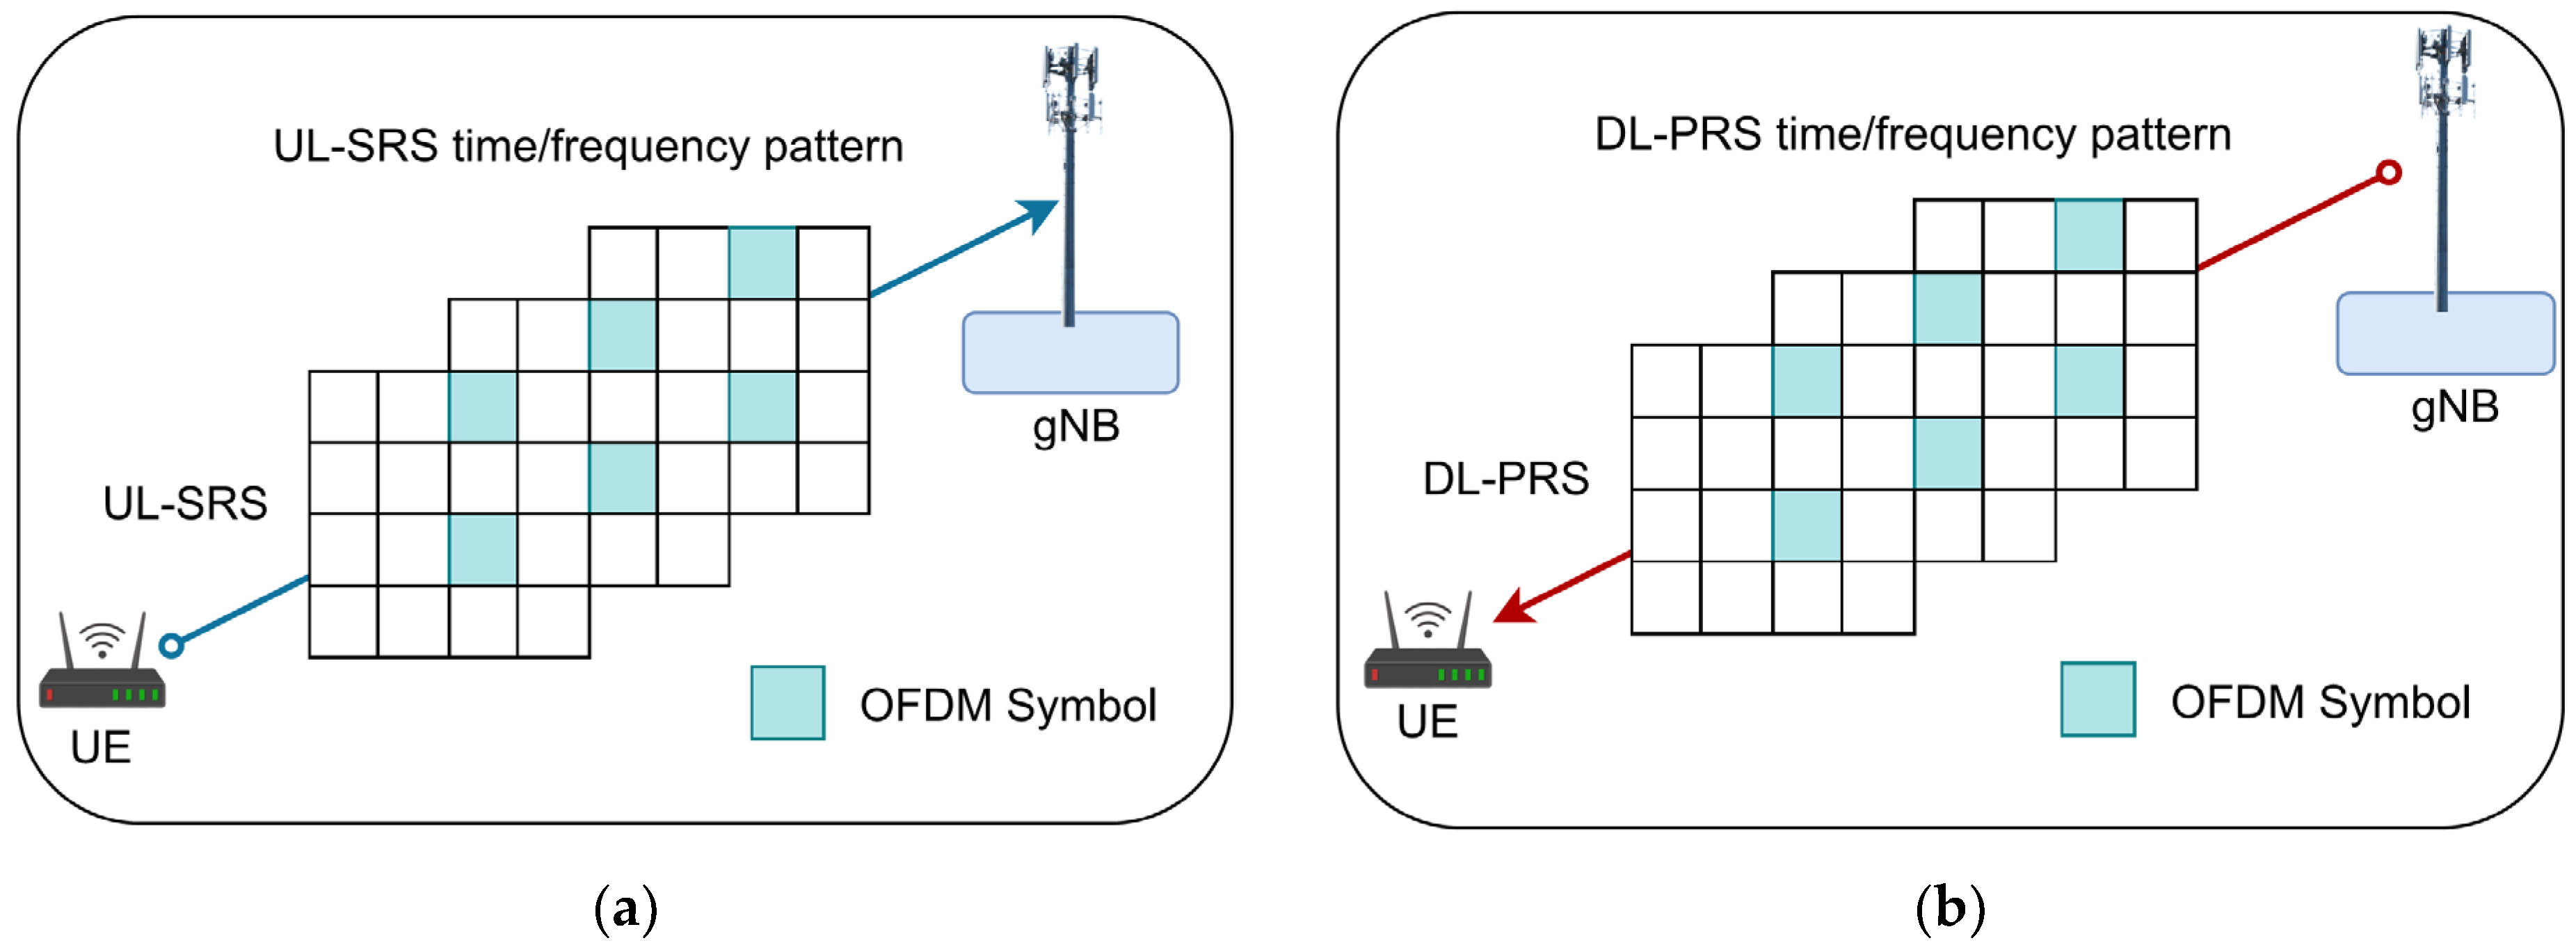
The proposed methodology is validated through a simulation setup that emulates a realistic urban environment with inter-site distances of 100 and 150 m between gNBs. The UE remains in motion at 3 km/h, relying on these gNBs for positioning. The distribution of resource elements across different symbols is intended to span all subcarriers, thereby resulting in an SRS/PRS design that follows a comb-pattern structure, as illustrated in
Figure 2a,b. This approach ensures a comprehensive evaluation of positioning performance by using both uplink and downlink reference signals. The methodology is characterized by a systematic approach involving the simulation of urban scenarios under both LOS and NLOS conditions, along with variations in inter-site distances.
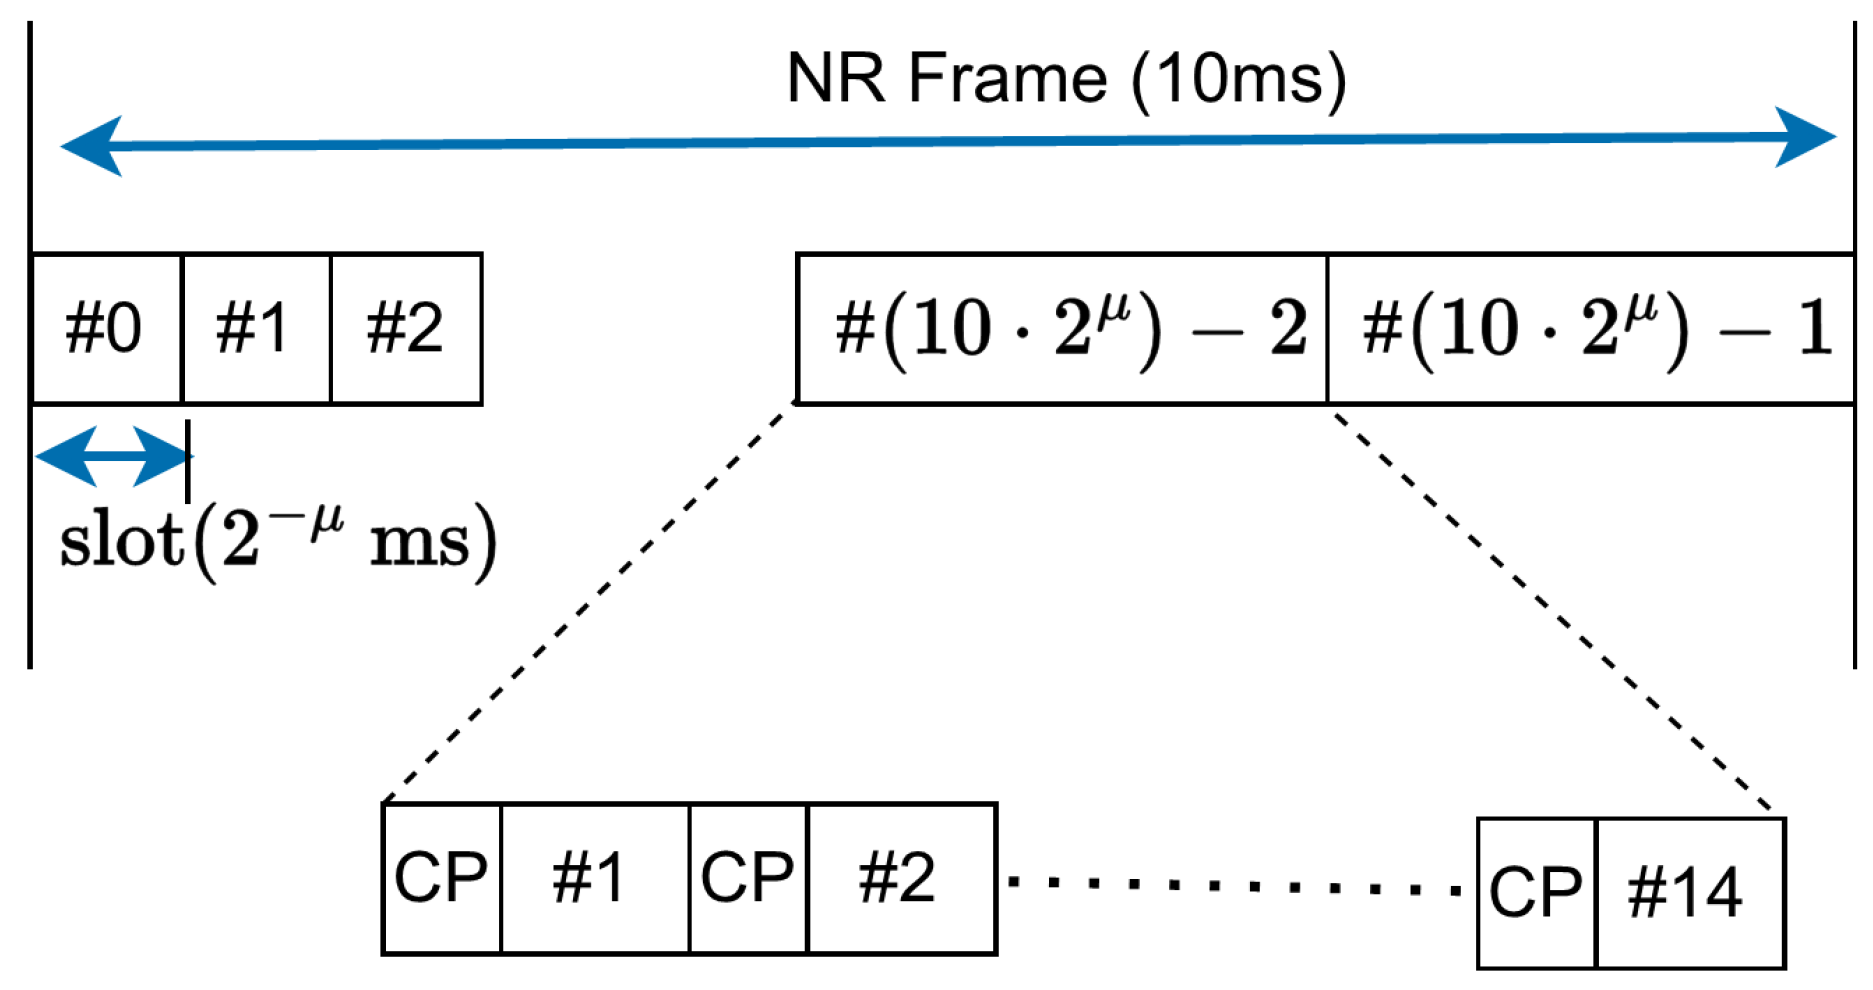
The frame structure employed in this research is illustrated in
Figure 3 according to the 5G NR standard. The frame is characterized by a duration of 10 milliseconds (ms), subdivided into 10 subframes, with each subframe spanning 1 millisecond (ms). These subframes are further subdivided into slots, with the number of slots per subframe varying based on the subcarrier spacing (SCS) defined by 5G NR numerology. At a sampling rate of 15 kHz, the SCS is equivalent to (
). This configuration results in a slot duration of 1 ms, which corresponds to one slot per subframe. Increasing the SCS to 30 kHz (
) has the effect of reducing the slot duration to 0.5 ms. Consequently, this doubles the number of slots per subframe to two. Similarly, for the highest numerology level considered, 240 kHz (
), the slot duration is 62.5 microseconds, resulting in sixteen slots per subframe [
40].
The 5G standard [
5] employs OFDM symbols with a Cyclic Prefix (CP) as a guard interval to mitigate inter-symbol interference. In the time domain, OFDM is a method of decomposing a high-speed data stream into multiple parallel streams with reduced transmission rates. In the frequency domain, OFDM partitions a wideband signal into narrowband subcarriers, with each subcarrier carrying a fraction of the data. The configuration of SCS and CP duration plays a pivotal role in defining the temporal resolution required for high-precision positioning, particularly in TOA-based methods.
In normal CP mode, each slot comprises 14 OFDM symbols, whereas in extended CP mode, each slot contains 12 symbols. The CP duration, although overhead in throughput terms, provides critical robustness against multipath distortion. This, in turn, improves the reliability of delay-based positioning in both urban canyons and indoor scenarios. As illustrated in
Figure 4, the NR frame structure is composed of
equally sized slots. In the case of lower numerologies, specifically when (
), a subframe is comprised of a single slot. Conversely, higher numerologies allow the allocation of up to 16 slots, with all subframes employing a CP to ensure reliable communication. Higher numerologies enable shorter slot durations and finer time granularity. Accordingly, this contributes to better positioning resolution, particularly in latency-sensitive or high-mobility applications. These flexible structures enable 5G to adapt to various use cases, ensuring efficient spectrum utilization and minimizing interference. The optimization of SCS and CP usage by 5G enables the achievement of high data rates and low latency.
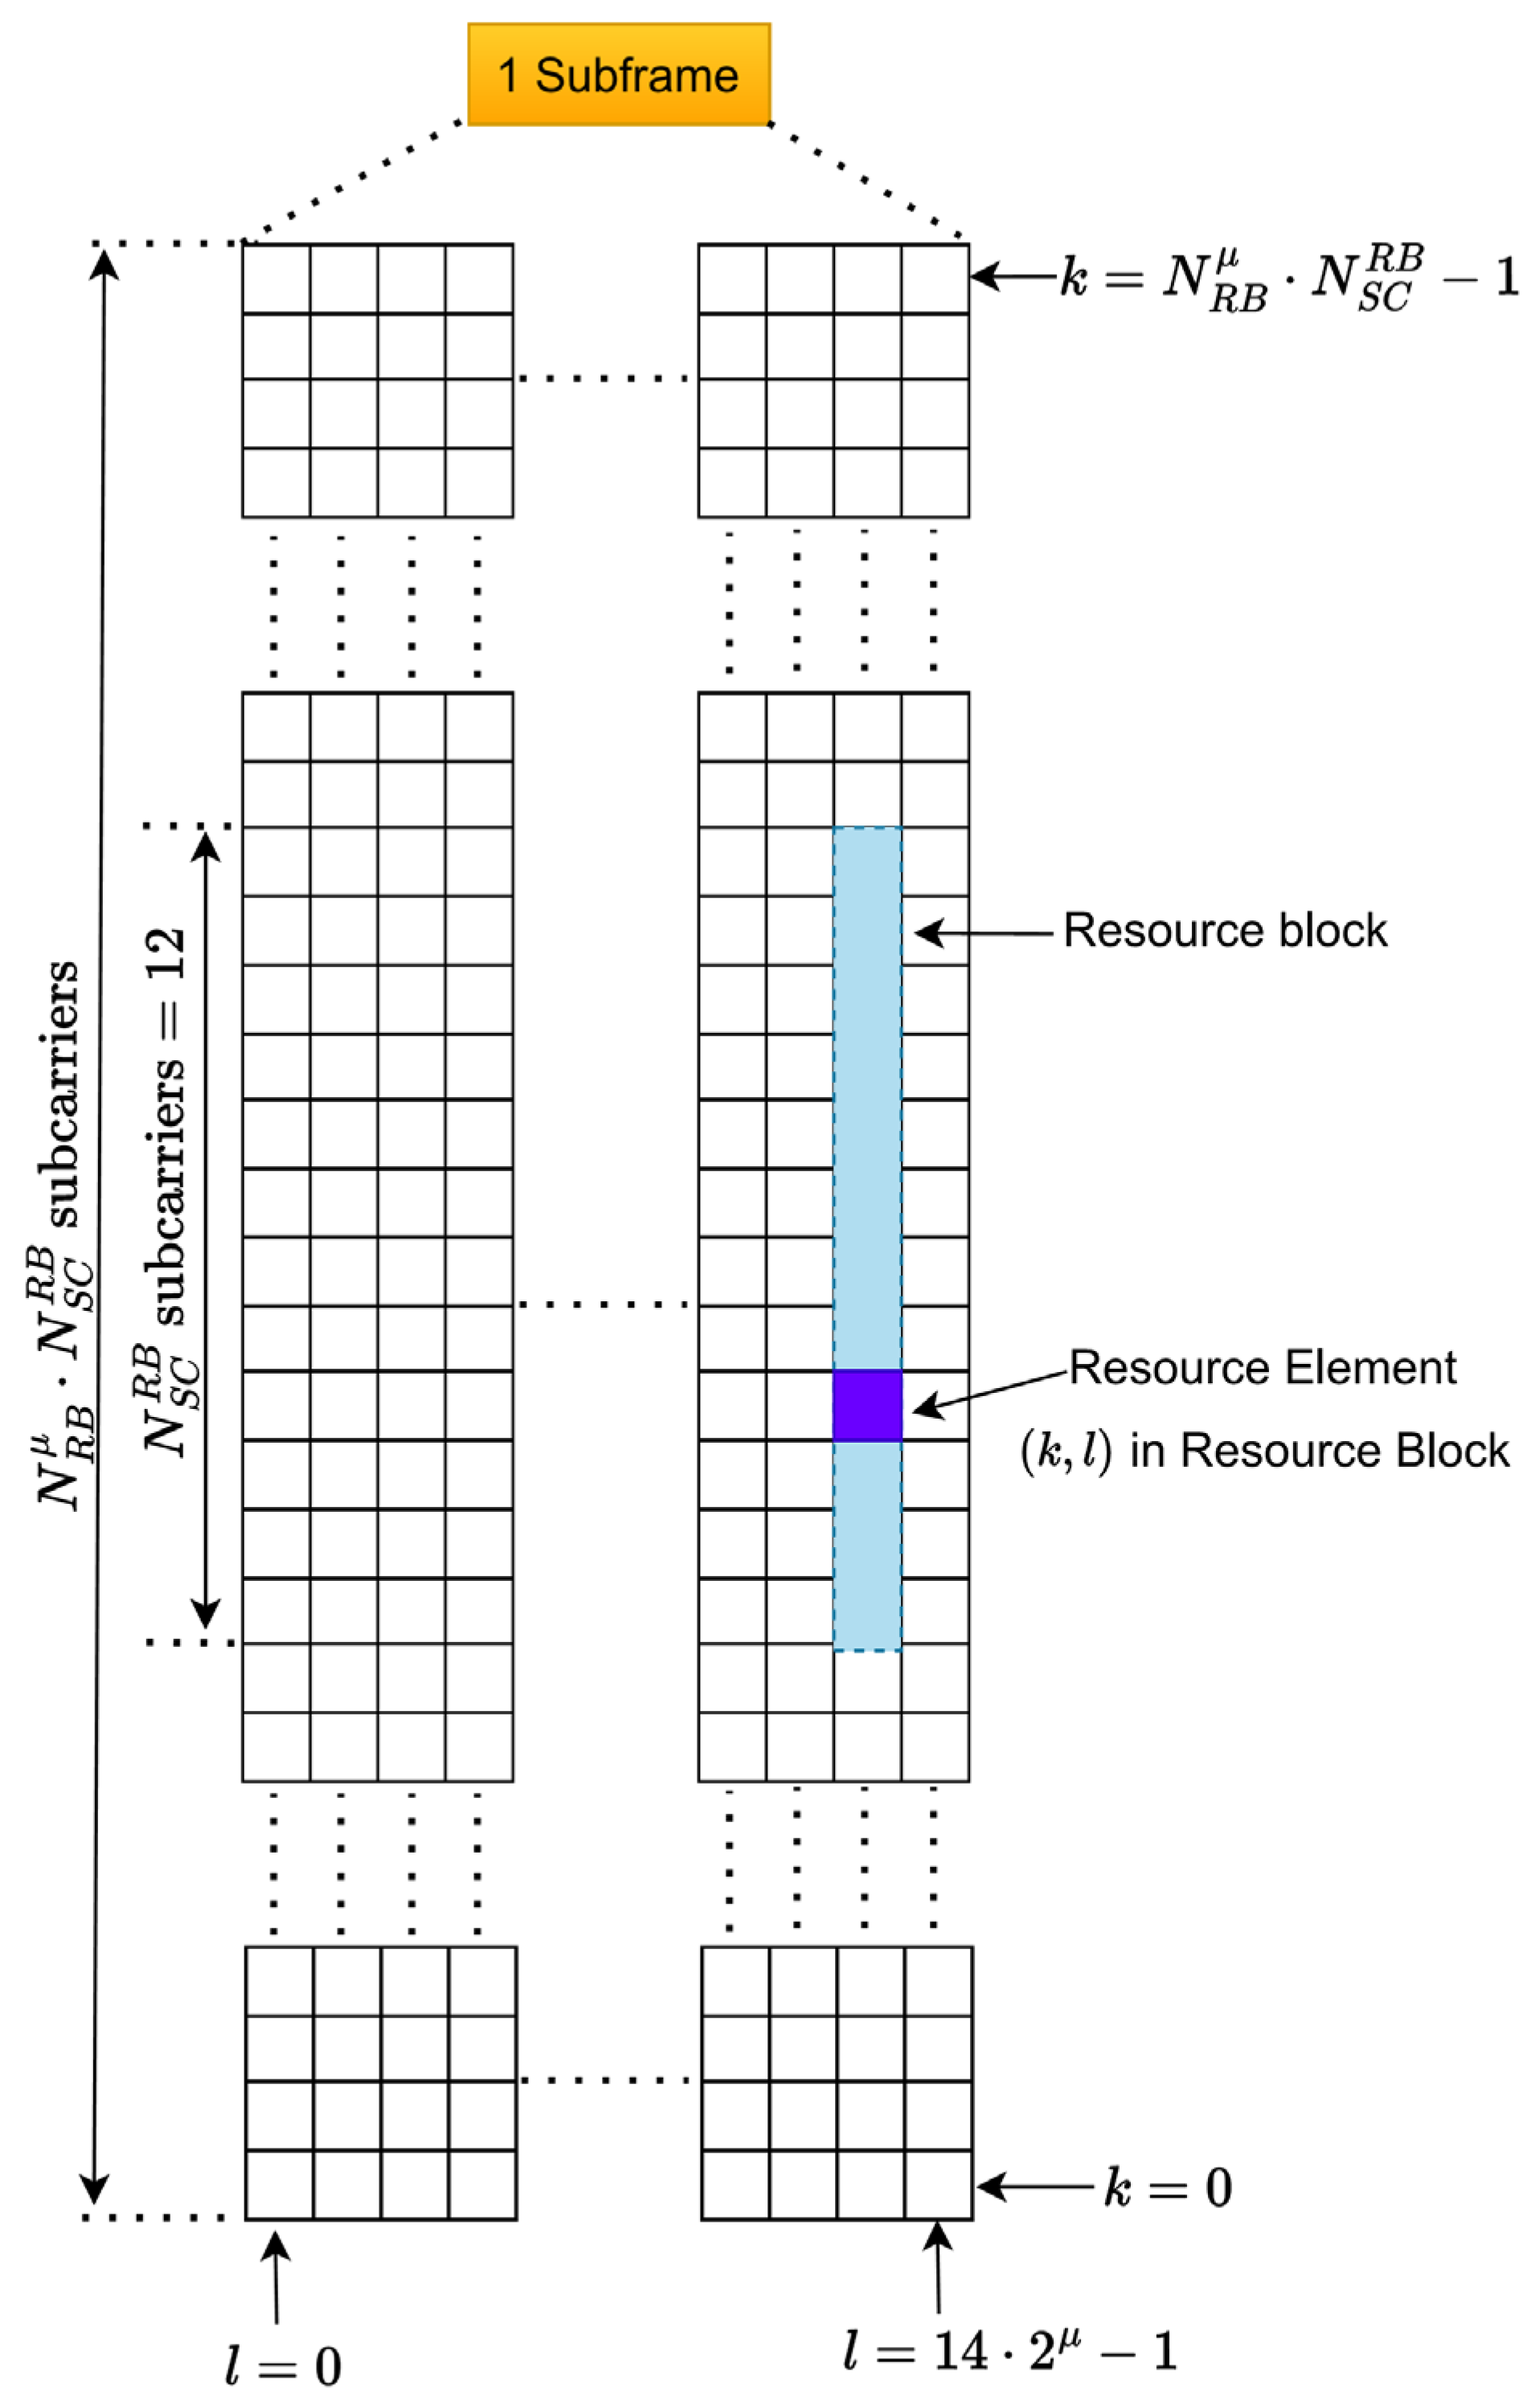
The 5G resource grid is a two-dimensional framework in which one axis denotes time and the other represents frequency, forming a matrix of OFDM symbols and subcarriers. It serves as the foundation for allocating transmission resources between the gNBs and the UE. The resource grid (RG) is segmented into multiple resource blocks (RBs), each consisting of a group of subcarriers. Each RB is comprised of a predetermined number of consecutive subcarriers. The number of subcarriers within an RB is contingent upon the subcarrier spacing, a parameter determined by the numerology μ defined in 3GPP NR standards. To illustrate, in a configuration with a 15 kHz spacing, each RB includes 12 subcarriers.
As the numerology increases, the duration of OFDM symbols decreases, thereby enhancing time resolution at the expense of frequency resolution. In the time-frequency domain, an OFDM symbol for each numerology is defined over an RG, spanning one subframe in time and the entire allocated carrier bandwidth in frequency. Within this structure, the Resource Element (RE), the smallest unit, is uniquely identified by its frequency index (
) and symbol position (
ℓ). The total number of subcarriers in the RG is given by
, where
represents the number of RBs for a given numerology
, and
denotes the number of subcarriers per RB. The highest subcarrier index denoted by
, is determined by the following relationship
. This indicates that subcarrier indexing begins at
and ends at this maximum value. As illustrated in
Figure 5, the RG, RBs, and RE are depicted.
2.2. SRS and PRS Signal Configuration
This research analyzes the influence of PRS and SRS signal configurations on positioning accuracy by identifying and tuning key parameters for efficient signal transmission. Accurate configuration of these parameters is essential to ensure reliable communication and high-precision localization. The research establishes a robust framework for evaluating 5G positioning performance by systematically modifying signal characteristics. The parameters are selected with great care to ensure the maintenance of signal integrity and enhancement of synchronization across the network. This, in turn, serves to strengthen the foundation for accurate localization and improved network efficiency. This advancement is instrumental in facilitating the development of high-accuracy 5G positioning systems.
The selected configuration parameters support the evaluation of UL-SRS and DL-PRS signals for 5G positioning. This comparative framework provides critical insight into the trade-offs between uplink and downlink-based positioning methods, as well as their robustness in challenging environments. Within the 5G NR standard, these signals are precisely structured to facilitate accurate time and frequency synchronization, which is essential for reliable UE localization. The critical role of key configuration parameters in TOA measurements is essential to the effectiveness of positioning algorithms. These elements, which include subcarrier spacing, symbol duration, cyclic prefix, resource block allocation, transmission periodicity, comb size, and signal-to-noise ratio, play a crucial role in determining the accuracy of the 5G measurements. This configuration strategy enables the research to deliver a comprehensive performance evaluation, thus offering applicable insights for the deployment and optimization of 5G positioning systems.
Table 1 outlines the PRS and SRS configuration parameters along with their respective values and descriptions.
2.3. The 5G Signal Design of SRS
According to the 3GPP standard TS 138.211 V17.1.0 [
41], SRS originates according to the Zadoff-Chu sequence, with each sequence entry assigned to a particular period and bandwidth unit based on set configurations. Once a Zadoff-Chu sequence has been selected, its entries are allocated to the physical resource unit within an RB. The Zadoff-Chu-based SRS maintains a constant amplitude and zero-autocorrelation property, which minimizes the peak-to-average power ratio and enhances its robustness against interference. This renders the SRS well-suited for high-precision positioning via time-based measurements. According to 3GPP Release 17, the SRS is designated as the primary uplink positioning signal. The SRS functions as a Physical Reference Signal, enabling mmWave gNBs to assess channel quality and dynamically adjust uplink transmission parameters. The flexibility of the system is further demonstrated through configurable timing and subcarrier allocation within the subframe.
The configuration of SRS resources is subject to the oversight of higher-layer parameters. The number of consecutive occupied OFDM symbols, denoted by
serve as the index of the OFDM symbol within a slot allocated for SRS transmission.
where
counting the OFDM symbols backward from the end of the slot, and starting from the frequency domain position
, defining the initial resource element. These parameters facilitate precise regulation of the SRS pattern. The SRS is mapped to OFDM symbols within a slot by assigning it to symbol indices
. This mapping employs a Gold sequence
generated through a rotational transformation of a base sequence, where
. The Gold sequence is subsequently mapped to physical resource elements according to the established relation.
For , the sequence initialization begins at the RE indexed by and denotes an amplitude scaling factor.
As illustrated in
Figure 6, a potential resource grid allocation of SRS and comb size is presented. The comb size is a critical factor in determining the spacing of tones across the frequency domain, thereby shaping the density of reference signals and their effectiveness in positioning applications. The term “comb-2” indicates that SRS tones are positioned at the rate of every second subcarrier, thereby resulting in a higher density of occupied subcarriers. Conversely, a comb-4 reduces the density of occupied subcarriers, as SRS tones are placed at every fourth subcarrier, impacting the granularity of positioning measurements. The selection of comb size is contingent upon a delicate equilibrium between signal overhead, positioning precision, and robustness against multipath effects. In densely populated urban areas, a finer comb (e.g., comb-2) may be advantageous to enhance resolution and mitigate NLOS-induced errors.
The SRS resource comprises symbols transmitted through the NR grid. Analogous to DL-PRS, UL-SRS resources for positioning are transmitted through a single antenna port and can initiate from the NR uplink slot. These SRS elements can span 1, 2, 4, 8, or 12 consecutive OFDM symbols, which is appropriate for all TRPs participating in positioning procedures. The comb size for the SRS placement, it is 2, 4, and 8 according to 3GPP R17 V17.1.0. The configuration of resource element offset patterns can be developed in accordance with the parameters and , where the comb offset can range from .
2.4. The 5G Signal Design of PRS
In the context of downlink transmission, the implementation of a dedicated PRS signal is required for the purpose of localization. The technology utilizes a multi-carrier waveform, primarily based on the OFDM scheme. The design of the PRS sequence necessitates the assurance of both interference randomization and strong sequence correlation across different TRPs [
42]. The PRS beam structure has been demonstrated to enhance coverage, particularly in mm-wave deployments. The PRS technique is contingent upon the utilization of Gold sequences, defined as pseudo-random sequences characterized by constant amplitude and orthogonal properties with respect to each other. According to the 3GPP TS 138.211 version 16.2.0 standard, PRS is defined as
r(
m), which is given by
where
j is the imaginary part,
m denotes the subcarrier spacing, and
is the pseudo-random sequence that uses the 31st-order Gold sequence given by
Sequence
of length
, where
n = 0, 1, 2, …,
—1,
is the offset applied to the sequence
and
The equation used to generate the initial sequence of
is
where
denotes the seed value for the Gold sequence, and
is the PRS pattern ID that identifies a PRS part.
is the number of symbols in the time slot, and
is the number of time slots. The range of slot numbers is from 0 to
, and the number of slots in the structure is determined by μ, which is
. The indices of the OFDM symbols within the allocated space vary from 0 to
.
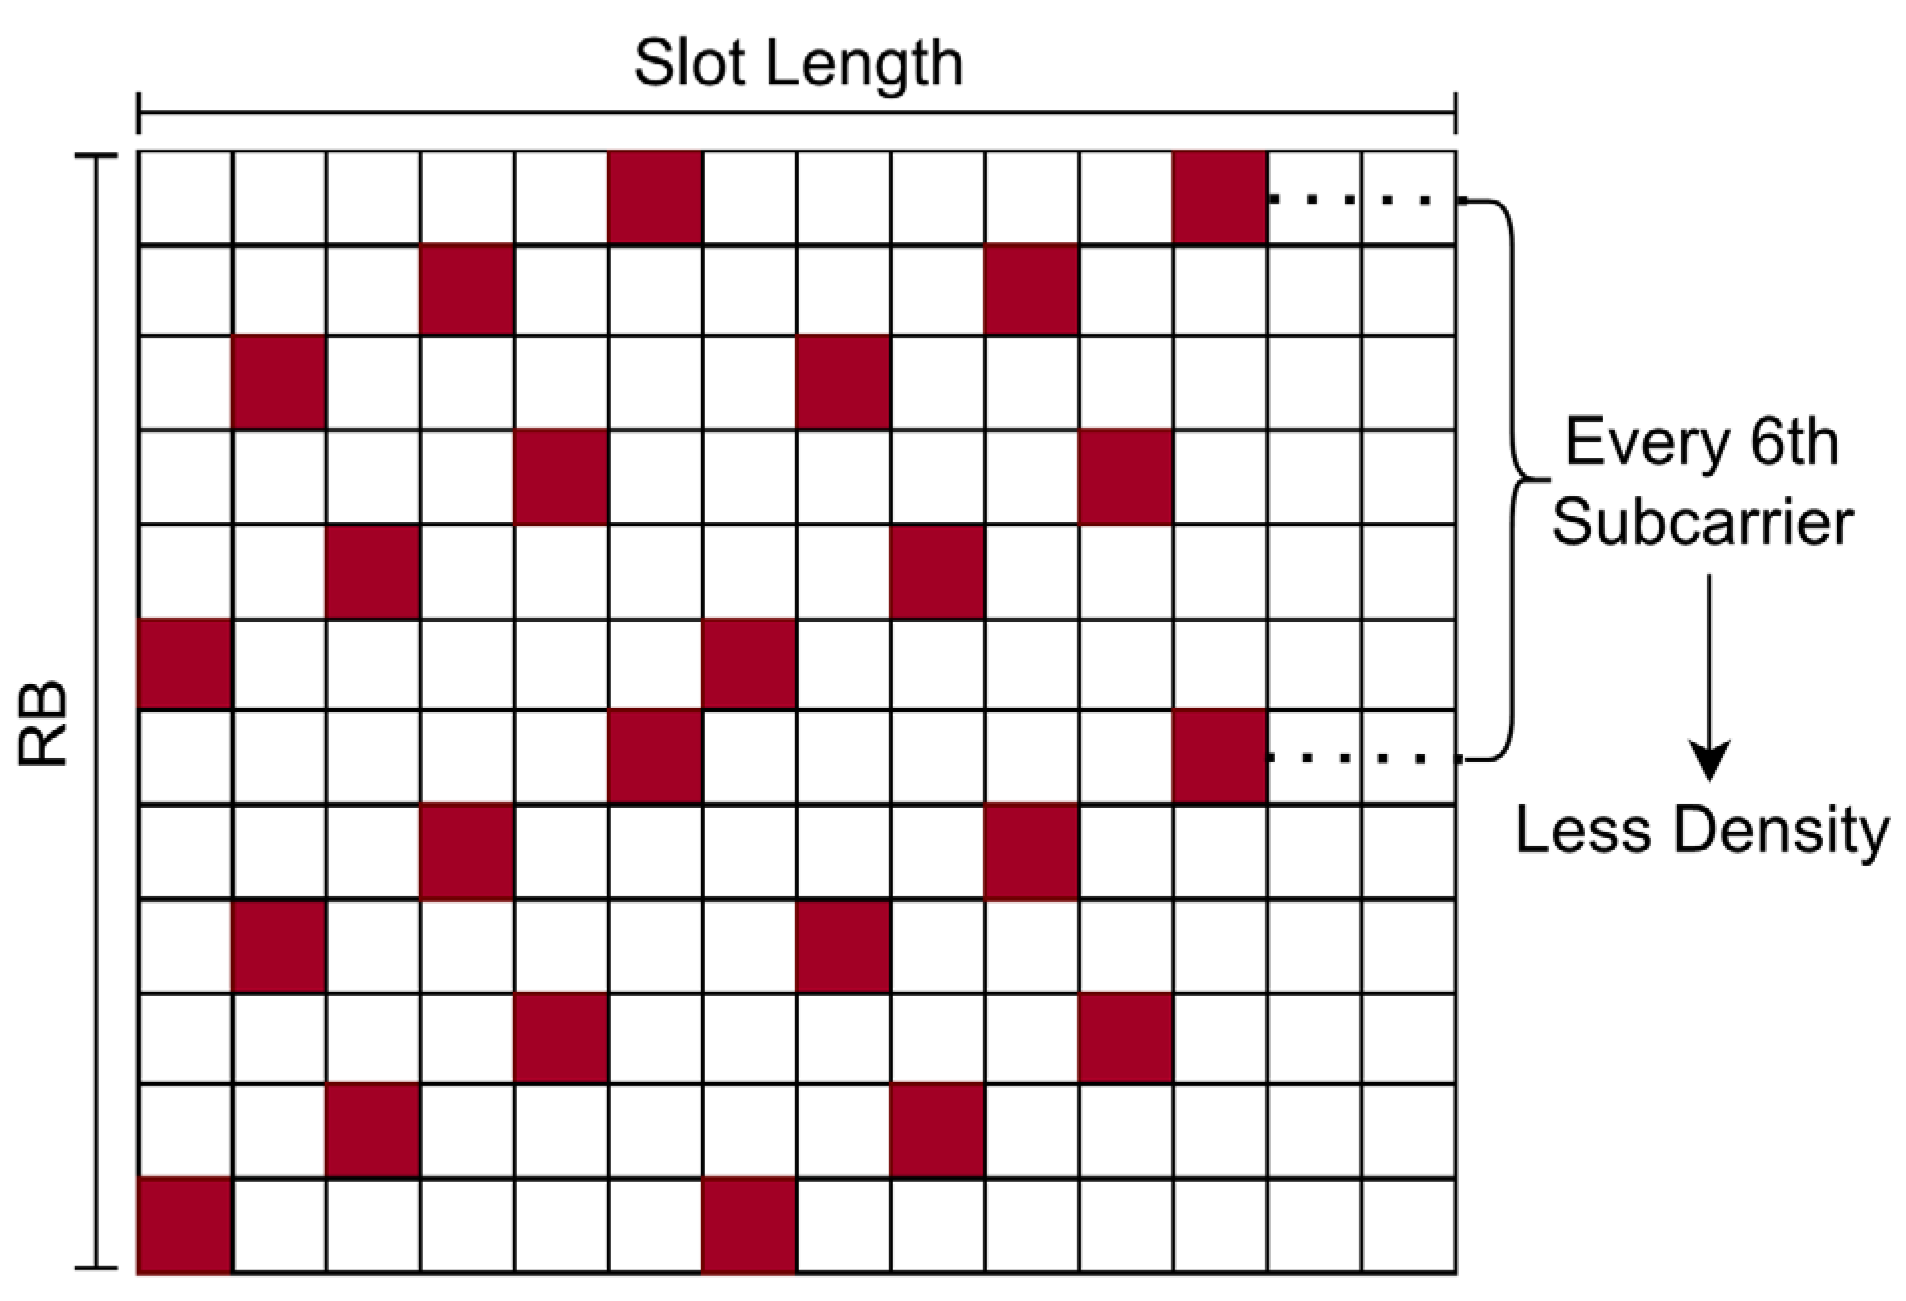
As illustrated in
Figure 7, PRS is allocated within the RG, which is structured across the time-frequency domain. The horizontal axis of this grid represents OFDM symbols, while the vertical axis denotes RB. PRS mapping follows 3GPP specifications, restricting its placement to specific RBs and OFDM symbols rather than spreading it uniformly across the grid. A comb-6 maps PRS tones to every sixth subcarrier, resulting in a lower density of tones. While this approach mitigates spectral overhead and reduces interference, it may also adversely affect positioning accuracy by diminishing the availability of reference signals. Furthermore, distinct pseudo-random sequences are utilized by different cells, based on the PRS sequence ID
to mitigate inter-cell interference. The PRS comb-like structure has been shown to help mitigate inter-cell interference. This is due to the PRS’s ability to transmit signals concurrently from multiple gNBs. The gNB utilizes distinct, non-overlapping resource elements of the resource grid.
The size of the downlink PRS resource in the time domain, denoted by
, can assume values of 2, 4, 6, or 12. The specific value employed is determined by the higher layer, and it corresponds to the number of the first symbol.
For each value of
, a distinct initial seed value
is assigned, which in turn generates a unique sequence. For each configured downlink PRS resource, the user will assume that the sequence
is multiplied by an amplitude scaling factor
and mapped to the resource elements as given by
The maximum value of index m is constrained by the requirement that all resource elements
associated with the PRS must be located within the resource blocks assigned for the downlink PRS resource.
Furthermore, an additional frequency offset, denoted by , can be introduced to diversify subcarrier allocations across symbols in the time domain. In order to mitigate the issue of mutual interference between PRS transmissions from neighboring base stations or sectors, a frequency offset will be applied. The resource-element offset parameter, denoted by , which is defined within the range of enables up to distinct PRS configurations within a single PRS resource. This configurable offset facilitates flexible frequency planning and orthogonal PRS allocation, thereby improving positioning accuracy and minimizing cross-correlation among PRS signals.
2.5. Time of Arrival Measurement
The TOA measurements are used to determine the distance between a UE and a gNB by estimating the signal propagation time, as electromagnetic waves propagate at the constant speed of light. TOA is generally determined by generating a replica of the known prior signal and subsequently comparing it with the received signal. This method is applied to a specific segment of the sent signal to achieve precise TOA measurements. The accuracy of TOA measurements is contingent upon the synchronization between the UE and the gNB, as well as the resolution of the correlation function employed to detect the arrival time of the signal. The distance between the UE and each gNB is calculated by the following equation:
when the gNB
sends a signal at a time
and the UE receives at the time
later, then it can be written as
The TOA measurements, represented as
, are susceptible to ranging errors
where
follows the probability distribution
where
with
represents the median delay spread,
is the path loss exponent, and
is the lognormal variable. The precise values of these parameters are shown in
Table 2.
The TOA values as a function of the position
and
represents the ranging errors in the TOA measurements.
The
represents the vector of TOA measurements from
N different transmitters. Each element of
in the vector corresponds to the TOA measurement from the
i-th transmitter.
The function is employed to calculate the TOA measurements. This function first computes the Euclidean distance between the transmitter and the receiver. Then, it converts these distances into time measurements by dividing them by the speed of light c.
3. Simulation Results
Performance Evaluation
This section describes the simulation results evaluating the positioning performance of the proposed method under LOS and NLOS conditions. The obtained results illustrate the impact of signal attenuation on positioning performance, particularly in NLOS scenarios. The positioning error, derived from the deviation between the estimated and actual UE positions, highlights the effectiveness of UL-SRS and DL-PRS. Furthermore, we analyzed the positioning error in both LOS and NLOS environments, along with a comprehensive evaluation of the ranging error and overall UE positioning accuracy. The correlation of the SRS and PRS signals is also performed to extract precise timing estimates, which play a critical role in enhancing the accuracy of the proposed positioning technique.
As shown in
Figure 8, the variations in PRS correlations cause each gNB to select a distinct PRS ID, ensuring that different PRS sequences are transmitted. The PRS correlations fluctuate over time, thereby demonstrating their utility in tracking UE movement. The PRS correlation between
and
is notably high and undergoes a gradual decrease over time. A higher PRS correlation indicates a greater similarity between the PRS signals transmitted by the respective gNBs. The precise PRS correlation values depend on the 5G NR network configuration and the spatial arrangement of the gNBs. These correlations are essential for enhancing the precision of UE positioning within the network, providing valuable insights into the dynamic behavior of signal propagation and the interactions among gNBs.
Figure 9 illustrates distinct peaks at specific time intervals, corresponding to significant SRS correlation values and indicating moments when the UE had a strong communication link with the respective gNBs. To avoid interference, each gNB allocates a distinct SRS ID, thereby facilitating the transmission of unique SRS sequences. For instance,
identified by Ncell ID 134, displays two prominent peaks, suggesting a strong correlation at those specific times. Similarly, analysis of the data reveals a peak pattern exhibited by
(Ncell ID 953) that corresponds to
possibly indicating the primary serving cell. Conversely,
(Ncell ID 938) exhibits a different peak pattern, reflecting a distinct interaction with the UE, potentially influenced by variations in distance. This analysis highlights the importance of SRS in enhancing handover strategies, resource allocation, and overall network optimization.
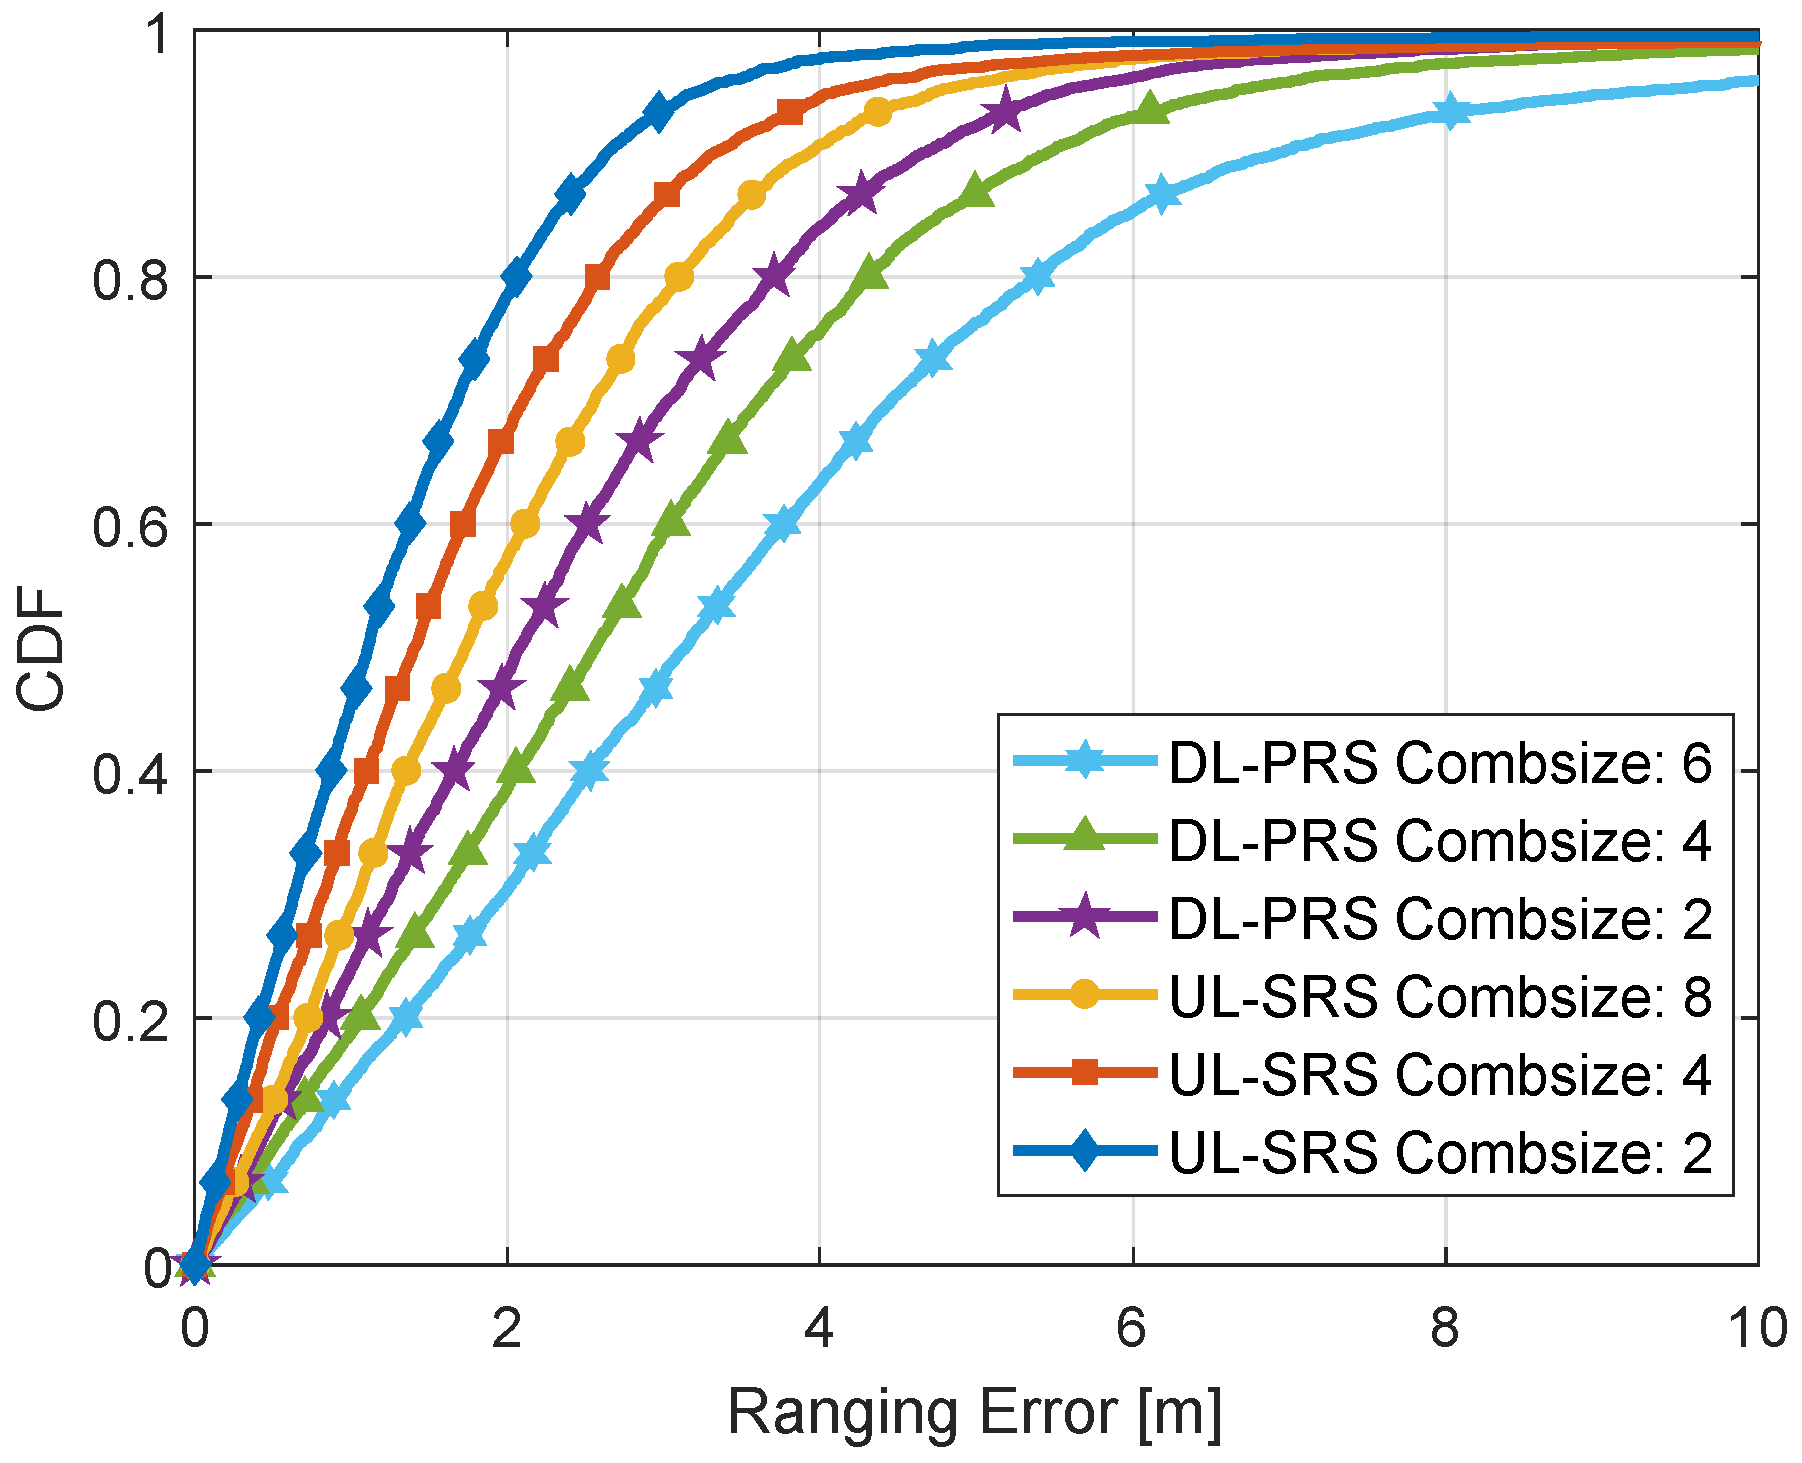
As illustrated in
Figure 10, the ranging error represents the error in estimating the distance between the UE and the gNB. The ranging errors are observed under varying comb sizes within DL-PRS and UL-SRS signal configurations, particularly in NLOS conditions. According to 3GPP TS 138.211 V16.2.0, PRS is compatible with comb sizes of 2, 4, and 6. Similarly, according to 3GPP TS 138 211 V17.1.0, SRS employs comb sizes of 2, 4, and 8, following similar principles of subcarrier allocation. A smaller comb size, such as comb-2, transmits on every second subcarrier. This increases the number of subcarriers per symbol, enhances signal density, and improves TOA accuracy, thereby reducing positioning error.
Conversely, a larger comb size, such as comb-8, transmits on every eighth subcarrier, thereby reducing the number of occupied subcarriers. The results emphasize the importance of selecting the appropriate signal and comb size based on environmental conditions to optimize positioning accuracy. The optimal comb size must be selected based on deployment conditions, balancing the need for improved localization precision with maintaining spectral efficiency.
Figure 11 illustrates the cumulative distribution function (CDF) of the positioning error to evaluate the performance of the proposed method. The statistical metrics, including the mean error and standard deviation (SD), were computed across 100 Monte Carlo trials for both UL-SRS and DL-PRS. At a gNB separation of 100 m, DL-PRS exhibited notably lower positioning errors under LOS scenarios. For instance, with Comb Size 2 (C2), the mean positioning error was 1.943 m (SD = 0.304 m), increasing to 10.435 m (SD = 0.983 m) under NLOS. Similarly, for Comb Sizes 4 and 6, LOS mean errors exhibited a modest increase with comb size (2.531 m for C4 and 3.064 m for C6), whereas NLOS conditions led to significantly higher errors of 11.281 m and 11.313 m, respectively.
In comparison, UL-SRS under the 100-m spacing also demonstrated strong LOS performance, with slightly higher mean errors than DL-PRS. The mean error for UL-SRS LOS at C2 was 2.055 m (SD = 0.303 m), which increased to 3.414 m at C8. As the distance between gNBs was augmented to 150 m, both UL-SRS and DL-PRS exhibited an anticipated escalation in error. DL-PRS LOS positioning errors grew from 2.222 m at C2 to 3.472 m at C6, while NLOS errors increased from 11.592 m to 13.139 m, with standard deviations consistently above 0.98 m. For UL-SRS, LOS performance remained competitive (e.g., 2.447 m at C2, 3.602 m at C8), while NLOS errors ranged from 9.694 m to 10.446 m, reinforcing the signal stability. Therefore, the numerical results presented in
Table 3 and
Table 4, along with the graphical representations in
Figure 11 show strong alignment. This validates the accuracy and robustness of the positioning error analysis under the LOS and NLOS conditions.
As illustrated in
Figure 12, the positioning error performance of UL-SRS and DL-PRS signals varies with both LOS and NLOS conditions, depending on the comb sizes (2, 4, 6 and 8), and the site distance of BS-BS. According to 3GPP specifications, PRS supports comb size 6 but not comb size 8, whereas SRS supports comb size 8 but not comb size 6. It has been observed that DL-PRS under LOS consistently achieves the lowest positioning error, measured at 1.94 m, compared to UL-SRS. Conversely, UL-SRS performs better under NLOS conditions, exhibiting a positioning error of 10.37 m, while DL-PRS under NLOS exhibits a higher error of 13.20 m. The results emphasize the importance of selecting the appropriate signal and comb size based on environmental conditions to optimize positioning accuracy. These findings clearly demonstrate that DL-PRS performs better in LOS environments, whereas UL-SRS exhibits superior resilience in NLOS scenarios. This analysis confirms that exploiting the respective strengths of each signal type, DL-PRS under LOS conditions and UL-SRS in NLOS environments, facilitates a more context-aware and accurate UE localization strategy.
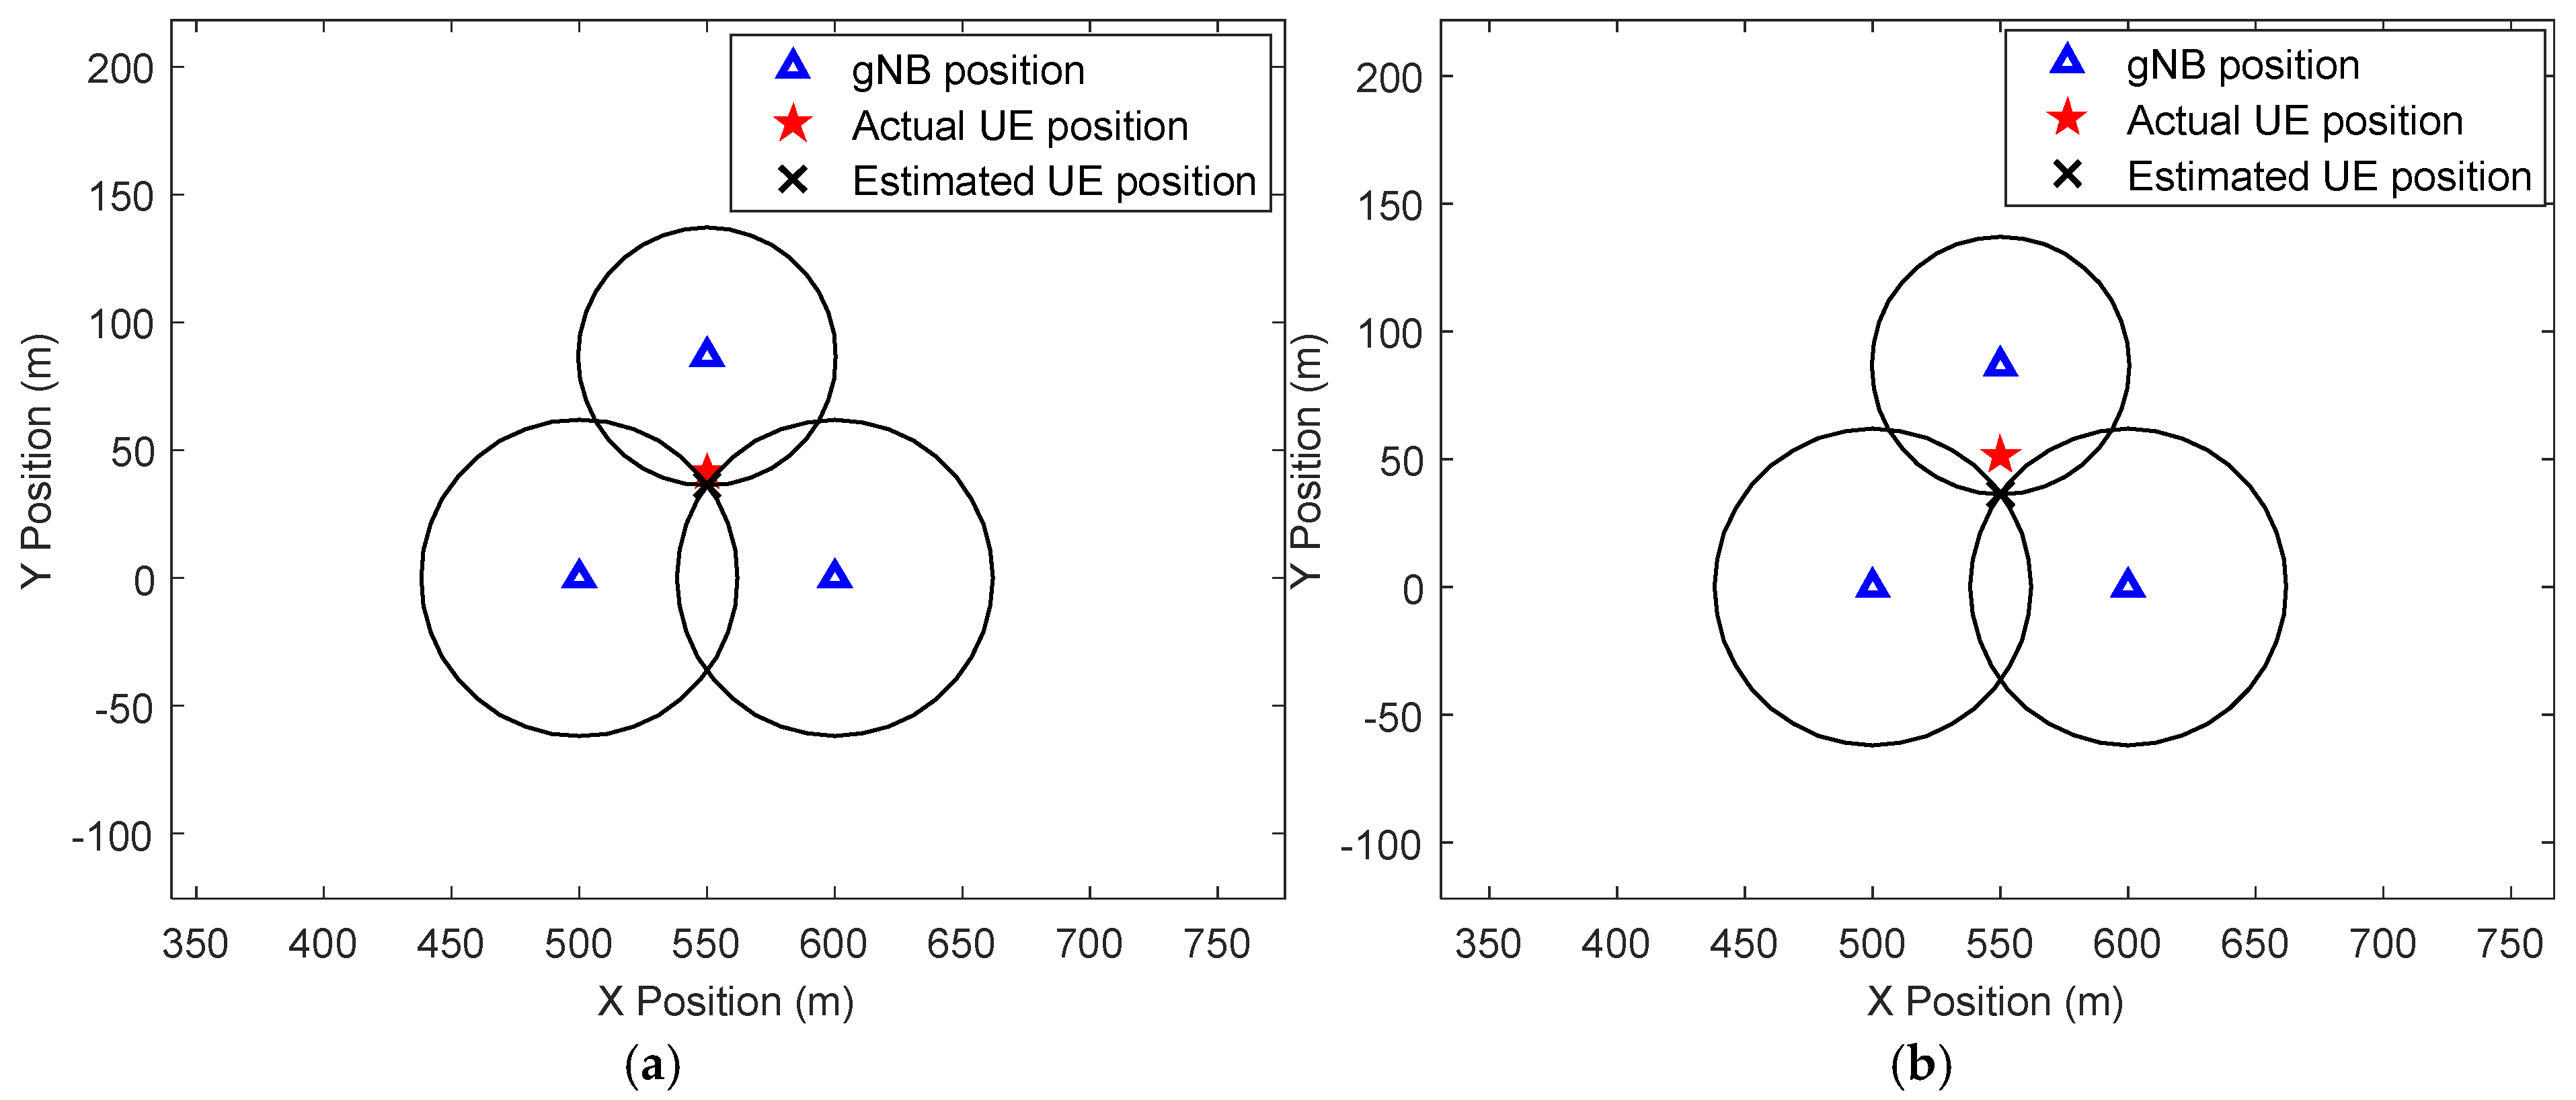
Figure 13 illustrates the trilateration principle for determining the UE position using the known locations of the gNBs as estimated through UL-SRS. The gNBs are represented by blue triangles, with their respective distances to the UE as shown by circles. The actual position of the UE is marked by a red star. The estimated position of the UE, determined by the intersection of the circles, is indicated by a black “‘x’”. The deviation between the estimated and actual positions indicates potential inaccuracies in the trilateration.
Figure 13a demonstrates the positioning performance of 5G in a LOS scenario. In this case, the observed positioning error is 2.06 m, indicating a high level of accuracy due to the direct propagation of the signal between the gNBs and the UE, with minimal interference. As the comb size increases from 2 to 8, the positioning error also rises from 2.06 to 3.41 m. This reflects the trade-off between comb size and time resolution, where larger comb sizes reduce time resolution and thus degrade accuracy.
Conversely,
Figure 13b depicts the same environment under an NLOS condition, where the lack of a direct signal path leads to an increased positioning error of 8.48 m. In this scenario, the signal encounters multiple reflections, causing distortion of its trajectory and an associated delay in its arrival at the receiver. Furthermore, with increasing comb size from 2 to 8, the NLOS positioning error increases from 8.48 to 9.20 m. The consistent performance of the SRS under challenging propagation conditions highlights its effectiveness for precise 5G positioning.
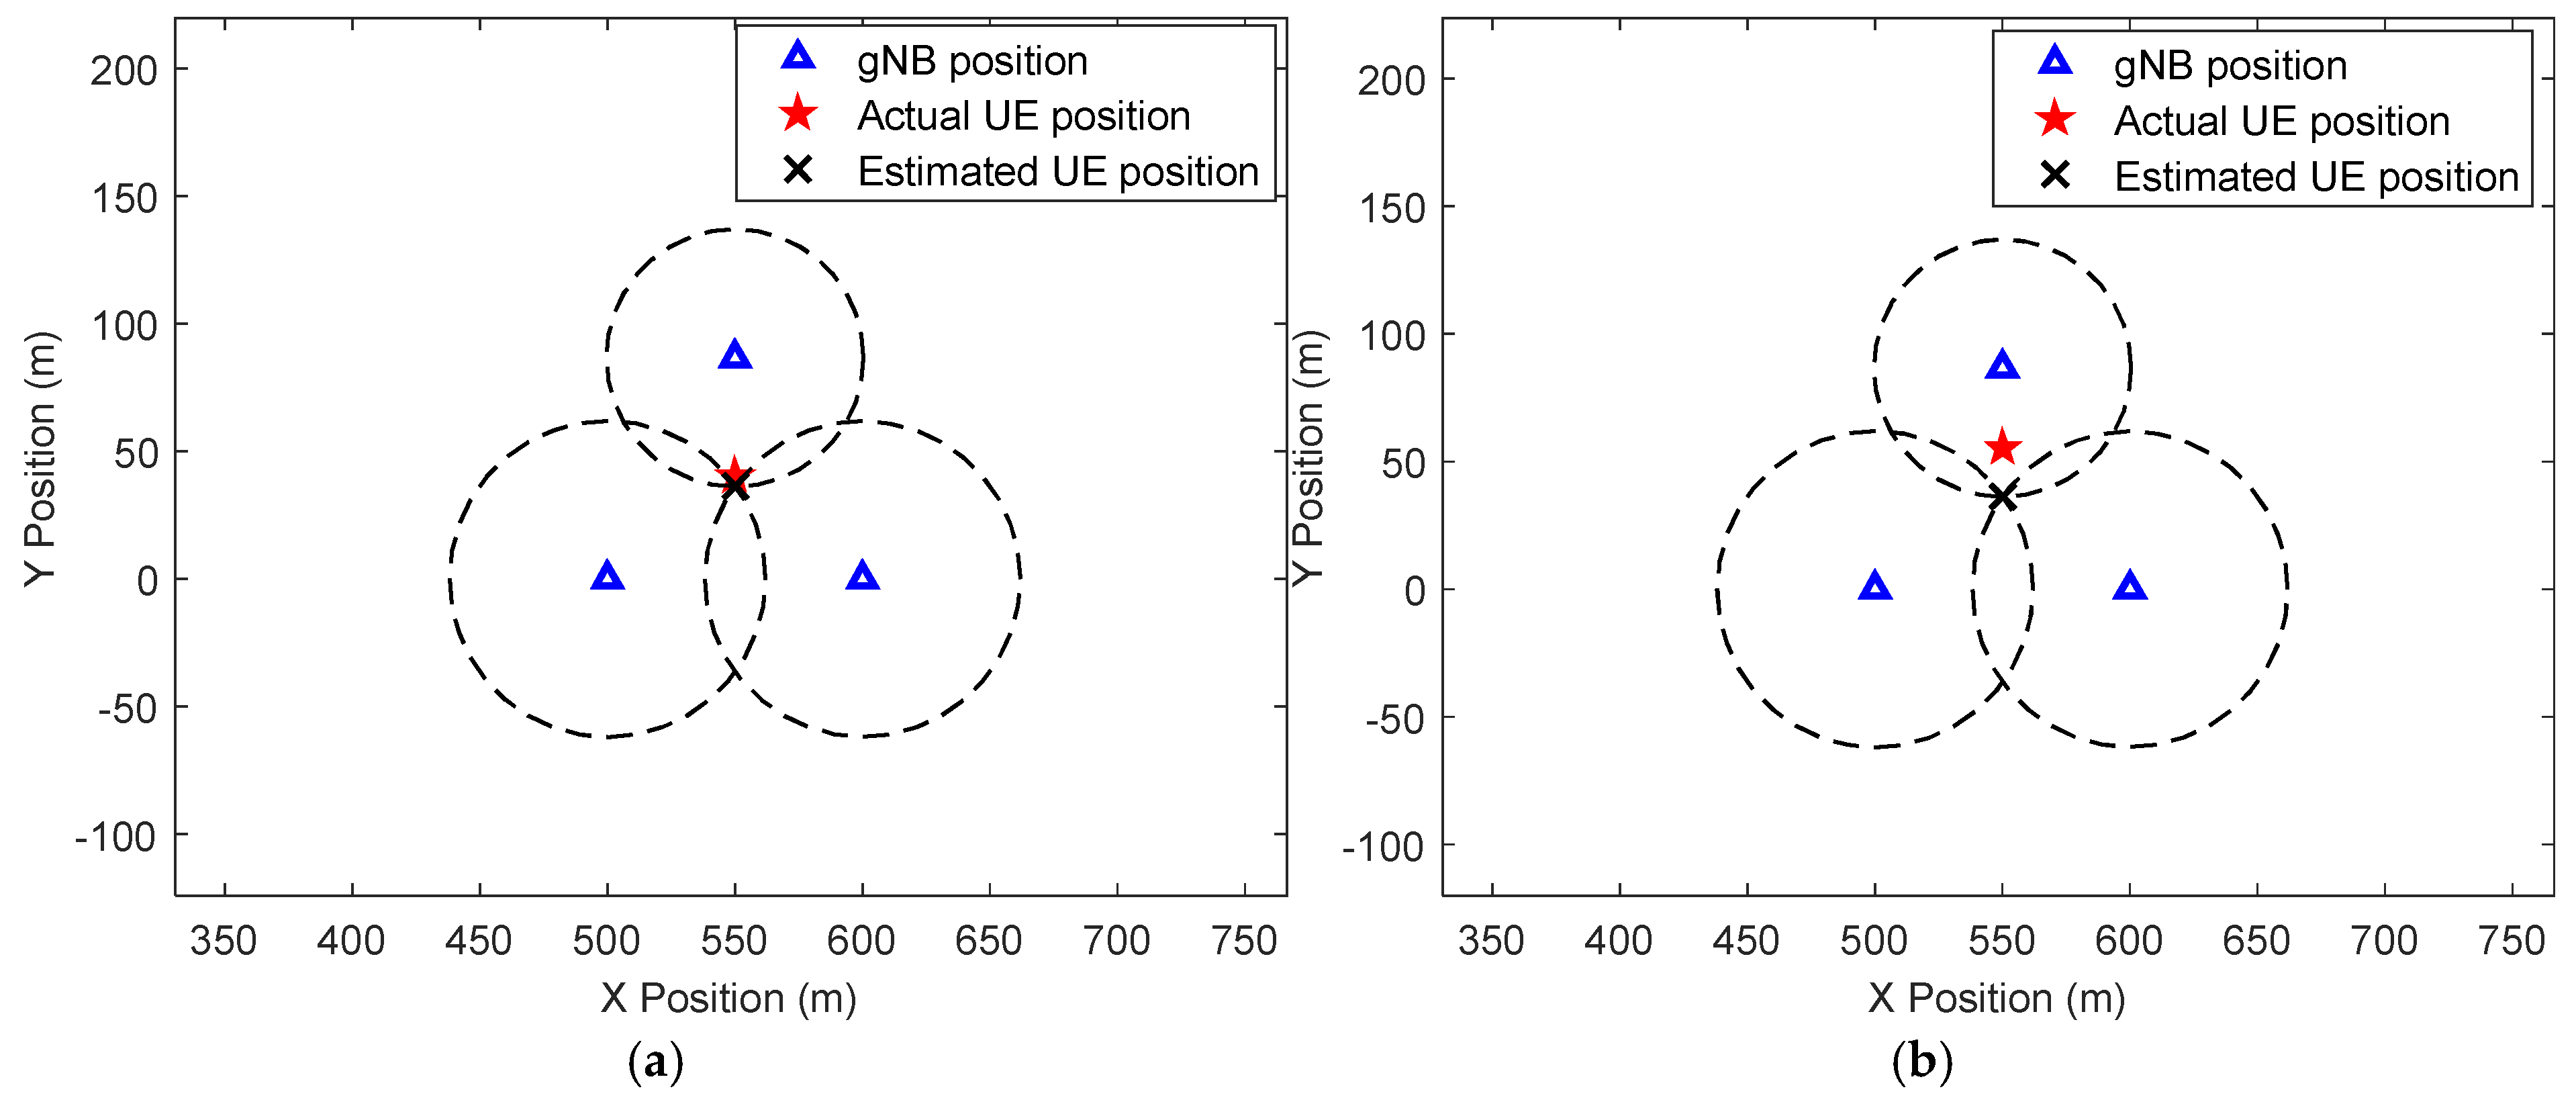
Figure 14 illustrates the performance of DL-PRS-based positioning in both LOS and NLOS scenarios. The estimated and actual UE positions relative to gNBs are displayed, with the impact of comb size on localization accuracy. The positioning accuracy varies depending on the comb size, influencing the trade-off between spectral efficiency and time delay resolution. A lower comb size, particularly comb-2, provides high-accuracy positioning by providing better time delay resolution and improved TOA estimation. This approach enables precise localization, even in challenging environments.
As illustrated in
Figure 14a, PRS positioning in the LOS scenario demonstrated a high degree of precision, with a minimal deviation of 1.94 m between the actual and estimated UE positions. However, as the comb size increases from 2 to 6, the positioning error in LOS conditions also rises from 1.94 to 3.09 m. This accuracy is attributed to the direct propagation of PRS signals, ensuring reliable TOA measurements. The well-defined intersection point of TOA circles further reinforces the precision of PRS-based localization under LOS conditions.
In contrast,
Figure 14b presents the NLOS scenario, where PRS accuracy degrades significantly due to the presence of obstacles and obstructions. The positioning error increases to 10.47 m, primarily due to signal reflections and additional propagation delays. Similarly, the NLOS positioning error increases with larger comb sizes, rising from 10.47 m at comb-2 to 11.30 m at comb-6, highlighting the greater challenge of maintaining accuracy in obstructed environments.
4. Discussion
The performance analysis of UL-SRS and DL-PRS reveals distinct behaviors under both LOS and NLOS conditions. Initially, the correlation results of UL-SRS and DL-PRS are examined, where each gNB selects a unique SRS and PRS ID to ensure the transmission of orthogonal sequences.
Figure 10 illustrates the ranging error, emphasizing the discrepancy in estimating the distance between the UE and the gNB under varying comb sizes. The positioning error performance and its accuracy are further evaluated through CDF and bar charts, depicted in
Figure 11 and
Figure 12, respectively.
Table 3 and
Table 4 present a summary of the final results, including positioning errors (in meters) for UL-SRS and DL-PRS across various comb sizes and inter-site distances. These results highlight the respective strengths and limitations of UL-SRS and DL-PRS, shaped by their distinct transmission structures and processing mechanisms. According to 3GPP TS 138.211 V16.2.0, clause 7.4.1.7.3 PRS supports comb sizes of 2, 4, and 6, while SRS supports comb sizes of 2, 4, and 8, as per 3GPP TS 138.211 V17.1.0, clause 6.4.1.4.2.
In LOS scenarios, DL-PRS consistently outperforms UL-SRS, achieving lower positioning errors. For example, at a comb-2 and BS-BS distance of 100 m, DL-PRS achieves a positioning accuracy of 1.94 m, which is slightly better than UL-SRS at 2.06 m. This advantage arises because, in LOS conditions, the UE receives a strong, direct signal from the gNB, enabling accurate TOA estimation. An increase in the BS-BS distance to 150 m has been shown to result in substantial alterations. In the LOS scenario, the DL-PRS positioning error increased to 2.25 m while the UL-SRS exhibited a positioning error of 2.44 m. However, DL-PRS performance significantly deteriorates in NLOS environments, with positioning errors increasing from 10.47 m to 11.30 m. This degradation highlights the UE’s limited ability to process weak or reflected signals in the absence of a direct path, making TOA estimation more susceptible to errors caused by obstacles.
In contrast, UL-SRS exhibits enhanced robustness in NLOS conditions, with a BS-BS distance of 100 m, maintaining lower positioning errors as compared to DL-PRS. The range of positioning errors, from 8.48 m at comb-2 to 9.20 m at comb-8, reflects the system’s adaptability to urban environments. It has been demonstrated that a significant change occurs when the BS-BS distance is increased to 150 m. The UL-SRS positioning error under NLOS ranges from 9.62 m to 10.37 m, a significant improvement over the DL-PRS. The DL-PRS positioning error under NLOS ranges from 11.64 m to 13.20 m. This resilience stems from the uplink transmission approach, where the signal is transmitted from the UE to the gNB. The gNB is equipped with advanced signal processing capabilities, higher precision, and better time synchronization, which can effectively mitigate errors. Uplink transmissions are enhanced by timing advance adjustments, where the gNB tightly controls the UE transmission timing to compensate for propagation delays. In contrast, DL-PRS relies on UE-based processing, where the presence of obstacles in NLOS conditions leads to positioning errors.
Table 3 and
Table 4 present the final positioning results for both UL-SRS and DL-PRS. It is important to note that the entries marked with a “---” indicate configurations that are not applicable in this context. According to 3GPP specifications, PRS supports comb size 6 but not comb-8, whereas SRS supports comb size 8 and does not include comb-6. The findings highlight the efficacy of DL-PRS in high-accuracy positioning within LOS environments, where the transmission of a robust, direct signal facilitates precise UE estimation. In contrast, UL-SRS demonstrates superior performance in NLOS scenarios due to the advanced processing capabilities of the gNB. This research validates the complementary roles of UL-SRS and DL-PRS, offering critical insights for optimizing positioning strategies in diverse 5G deployment scenarios.


 ,
, 


