Article

Operational Reliability of Steel Ropes in Terms of Mechanical Properties of Wires Using Control Charts

by
Marcela Malindzakova
* and
Pavel Peterka
Institute of Logistics and Transport, Faculty of Mining, Ecology, Process Control and Geotechnologies, Technical University of Košice, 042 00 Košice, Slovakia
*
Author to whom correspondence should be addressed.
Appl. Sci. 2025, 15(14), 7875; https://doi.org/10.3390/app15147875
Submission received: 23 June 2025 / Revised: 8 July 2025 / Accepted: 11 July 2025 / Published: 14 July 2025

Abstract

The objective of this paper is to evaluate the capability of various steel rope manufacturers to maintain the desired variability within the strength class of wires used in the production of steel ropes. From a service life perspective, it is optimal to achieve the narrowest possible strength class interval for wires integrated into steel ropes. However, the applicable EN 12385 standards permit a relatively wide interval of allowable strength class dispersion. The analysis encompasses 112 steel ropes tested over the period from 2000 to 2025. For the purpose of evaluating rope quality in terms of wire strength variability, the ropes were categorized into four quality classes. The assessment of wire strength was conducted using statistical quality control methods, specifically through the application of control charts. Based on these methods, the stability and capability of wire strength within each rope were verified. The results highlight the differences in wire strength performance across the evaluated quality classes.

1. Introduction

The aim of this study is to examine the relationship between wire strength uniformity and the operational reliability of steel ropes, a topic motivated by recurring field observations of early rope failure despite compliance with nominal strength values. The work seeks to fill a gap in current standards, which often overlook internal wire strength dispersion as a critical factor influencing service life. An optimal service life and operational reliability of steel wire ropes are essential expectations in modern engineering applications. Premature degradation of ropes is often caused by improper handling during installation, which may introduce torque and internal stresses that reduce service life. Additional factors such as the selection of an unsuitable rope design, operational overloading, and insufficient rope dimensioning can significantly shorten the rope’s duty cycle. Furthermore, poor or absent maintenance—both of the rope itself and of the associated hoist system—can accelerate wear through various damage mechanisms, ultimately leading to the rope’s removal from service.

2. Literature Review

Previous studies have shown that the interaction between the rope and the rope sheave can cause deformation, surface abrasion, and internal friction, particularly under conditions of inadequate lubrication or misalignment [1,2]. These effects are further compounded by the wear of the outer wire layers, which are in constant contact with the sheave during operation [3,4]. Overall, the operational reliability of a steel rope is critically linked to the mechanical properties of its individual wires. These ropes are typically exposed to complex loading conditions—such as tension, bending, torsion, and cyclic wear—which cumulatively affect their structural integrity and longevity. These loading modes act simultaneously in real-world operations, particularly in mining and lifting applications, where ropes are subjected to thousands of cycles across varying sheave diameters and winding configurations. Čereška et al. [5] identified the main causes of rope damage as bending fatigue, mechanical abrasion, corrosion, and overloading. The damage typically initiates at stress concentration points and progresses via sequential wire breakage, disrupting the internal stress distribution and increasing the likelihood of dynamic instability during use. Their findings underscore the importance of controlling wire-level properties—especially tensile strength—before and after the rope is woven.
Pawar et al. [6] emphasized the safety-critical role of steel wire ropes in cranes, elevators, mining hoists, and aerial transport systems. Their high tensile strength allows them to carry substantial loads while operating over relatively small-diameter sheaves. As a result, ongoing research continues to explore improvements to the physical and mechanical properties of ropes to ensure reliability under these demanding conditions.
The mechanical characteristics of rope strands including wire diameter and material strength play a decisive role in determining operational behavior. Coarser wires typically offer better resistance to abrasion, while finer wires enhance flexibility. Advanced constructions, such as compacted or plastic-filled (PVF) strands, have been shown to improve fatigue resistance by reducing internal friction and mitigating secondary bending effects [7]. Fatigue and corrosion remain the dominant degradation mechanisms limiting rope service life. Mazurek reported that fatigue failures frequently initiate at wire contact points, with the degradation process accelerating after approximately 60,000 load cycles. He also noted that wear progression depends on the transverse contact angle between adjacent wires, which influences stress distribution [8]. Da Silva [9] showed that rope core design and lay direction (e.g., Lang lay vs. regular lay) significantly affect fatigue resistance, with Lang lay ropes outperforming others in terms of longevity.
The broad dispersion of tensile strength values, particularly in Classes III and IV, is likely a consequence of inconsistent wire sourcing and inadequate process monitoring. As shown by Mazurek and da Silva, such heterogeneity leads to uneven load distribution and accelerates the onset of internal fatigue, ultimately reducing operational lifespan. Nonetheless, neither Mazurek nor Da Silva quantified the impact of variations in tensile strength class within a single rope, which is the focal point of this study [8,9]. In terms of diagnostics, Wang et al. [10] developed fusion-based signal models that improve defect detection sensitivity, particularly in complex environments where traditional wire break counting is insufficient. Rosaa et al. [11] addressed process instability in wire rope production, identifying inconsistencies related to trimming operations in casting lines. Improvements to upstream manufacturing systems significantly reduced material waste and improved rope reliability. Their work supports the need for statistical quality control in production—but does not address the impact of dispersion in input wire properties. The current study builds on this by applying control charts and capability analysis directly to wire strength data.
Ultimately, the mechanical performance of individual wires under real operating conditions governs the reliability of the entire rope system. This is particularly important in industries such as mining and materials handling, where mechanical failures can result in serious safety hazards. Slesarev and Vorontsov [12] emphasized the importance of residual load-bearing capacity, highlighting the number of broken wires and metallic cross-sectional loss due to abrasion or corrosion as key indicators of rope health. Mouradi et al. [13] likewise described steel wire ropes as dynamic mechanical systems exposed to progressive damage. Their multiscale simulations confirmed that localized fatigue accumulates over time, eventually leading to full-system failure. Mazumder et al. [14] compared PVF and non-PVF ropes in mining applications and found that wear was the leading factor in degradation, especially in multi-layer winding systems. PVF ropes demonstrated better performance in terms of bending fatigue and corrosion resistance, supporting their use in heavy-duty applications. In a long-term monitoring study, Yordanova and Yankova [15] found that although the total breaking force of ropes decreased after each six-month service interval, values remained within safe limits—further emphasizing the importance of regular mechanical testing as part of preventive maintenance protocols.
While previous studies have addressed rope degradation trends—including fatigue, corrosion, and mechanical wear—they do not classify ropes based on the internal uniformity of mechanical properties, particularly tensile strength. This research advances the field by introducing a novel wire-level classification system for steel ropes, grounded in real operational data from 112 ropes. Unlike conventional evaluations, which often overlook internal strength dispersion, our method applies statistical control charts and capability indices to assess wire strength variability. Most notably, the paper proposes a new classification approach based on an empirically validated ±4% tolerance for wire strength class dispersion. This threshold represents an optimal balance between manufacturing feasibility and mechanical reliability and is supported by long-term monitoring of ropes used in demanding industrial environments. To our knowledge, no existing standard, including EN 12385 [16], prescribes such a narrow dispersion range for internal wire strength variability

3. Problem Formulation

The relationship between the mechanical properties of individual wires and the operational lifespan of steel ropes has gained increasing recognition through empirical observations. This includes non-destructive testing during service and tensile testing carried out before rope installation. However, existing theoretical models that describe the mechanical behavior of steel ropes under tensile and bending loads often fail to account for the variability in the strength class of the wires that comprise the rope [17].
Empirical observations from real-world operations have highlighted the critical importance of input material quality, specifically, the uniformity of wire strength within each rope. Historically, this issue was addressed by the now obsolete DIN 21 254 standard for mining ropes, which, in Article 4.1.3, specified that the maximum allowable dispersion of wire strength class should be within ±10% of the mean strength value of all tested wires. A similar requirement was adopted by the former Slovak standard STN 02 4301 [18,19].
Žitkov et al. [20] further contributed to this topic by introducing a classification system for steel ropes based on empirical findings from long-term operational monitoring. Their work underscores the importance of wire strength uniformity as a key determinant of rope quality and reliability. To classify steel ropes into three quality categories, the method originally proposed by Molnár et al. [21] involves comparing the mean strength of all tested wires to the average of a subset of wires whose strength values fall below that mean. This model provides a practical tool for evaluating the internal consistency and mechanical quality of wires within a rope.
Subsequent studies by Molnár et al. [21] and Boroška et al. [22] expanded this framework and applied it to ropes used in the Slovak mining industry. Their analyses further confirmed that consistency in wire strength is crucial to overall rope reliability. In contrast, currently valid European standards, specifically the EN 12385 series, do not mandate strict tolerances for wire strength class dispersion in finished ropes. On the contrary, EN 12385-1, Annex B, paragraph B.3.1.1, defines the allowable strength class tolerance for new wires (prior to incorporation into the rope) within the range of <0%, +15%>. Furthermore, paragraph B.3.3 of the same annex permits a post-weaving strength class deviation of −50 MPa to +15 MPa for wires extracted from a finished rope. This standard essentially acknowledges a potential reduction in wire strength due to deformation and stress introduced during the rope weaving process [16].
However, such a broad permissible interval may allow manufacturers to incorporate wires of varying strength classes into a single rope, potentially undermining overall rope reliability. Laboratory analyses conducted as part of this study confirmed the inadequacy of the tolerances prescribed in Annex B.3.3 of EN 12385-1 for evaluating ropes used in demanding applications. Extensive testing of mining ropes from multiple manufacturers revealed that some producers continue to adhere to stricter quality standards—specifically, by maintaining a narrow dispersion interval for wire strength class—thereby preserving the mechanical integrity and consistency of their rope products [16].
In an ideal scenario, all wires within a steel rope would belong to the same strength class, ensuring maximum uniformity and predictable mechanical performance. However, such uniformity is not practically attainable due to inherent material and manufacturing variations. The closest approximation to this ideal can be achieved through the careful and targeted selection of input wire materials used in the construction of rope strands. Given the mechanical impracticality of achieving absolute uniformity, our investigation focused on analyzing the dispersion of wire strength classes based on real-world rope samples that exhibited the narrowest observed strength intervals. To evaluate wire quality, we established a classification criterion centered on strength class dispersion. Specifically, we adopted a tolerance of ±4% from the mean strength value as the benchmark for high-quality wire consistency within a rope structure. This threshold was derived from long-term empirical observations of ropes demonstrating superior performance and minimal wire strength dispersion. Although not defined in current standards, this reflects the best practices observed in high-grade industrial applications.
For the purpose of this analysis, steel ropes from actual industrial applications were selected, all operating under comparable conditions during the period from 2000 to 2025. This extended time frame was chosen to assess the practical impact of the implementation of the EN 12385 standard, introduced in 2008. A total of 112 steel wire ropes were evaluated. Tensile strength tests were conducted on 100% of the wires from each rope. Based on the results, the ropes were classified into four quality classes. For classification purposes, a rope was permitted to have a maximum of three wires outside the specified tolerance interval without disqualifying it from a given class. The classification of rope classes is as follows [16]:
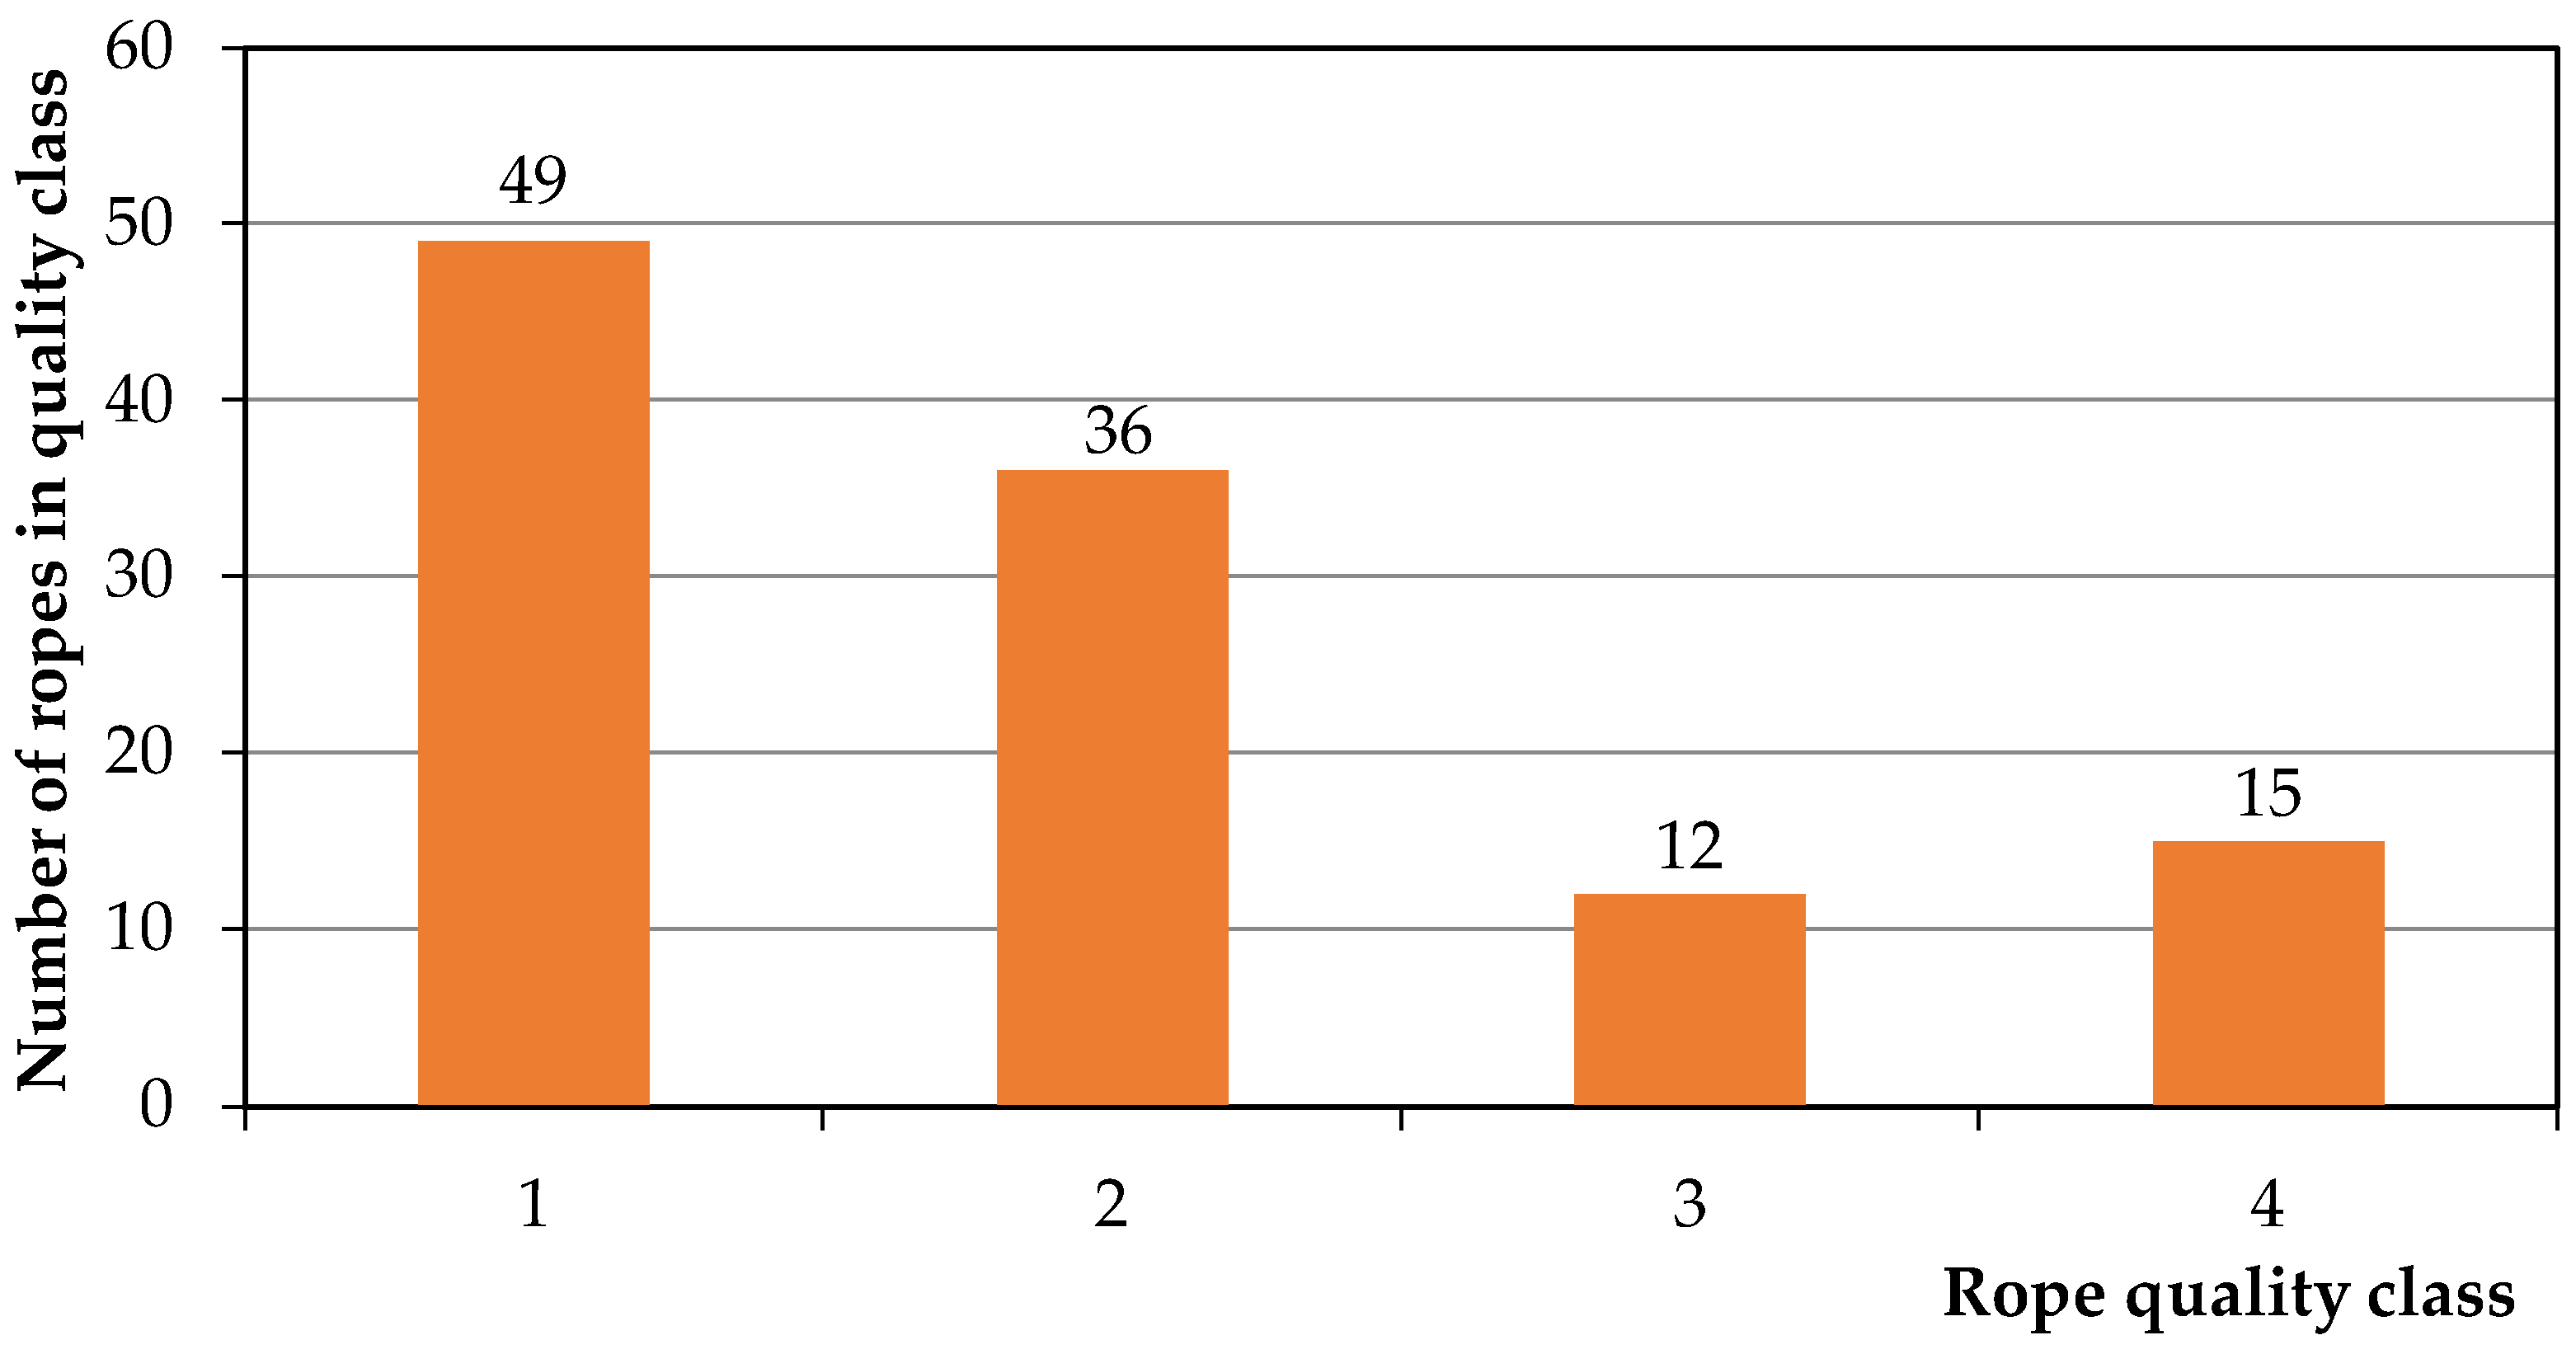
  • Class I included ropes that met the highest quality standard, with wire strength class dispersion within ±4% of the mean—representing optimal selection of input material;
  • Class II comprised ropes that conformed to the criteria set by the now obsolete DIN 21254 or STN 02 4301 standards, with a strength class dispersion tolerance of ±10%;
  • Class III included ropes meeting the current EN 12385-1 requirements, which allow for a dispersion range of −50 MPa to +15%;
  • Class IV consisted of ropes that failed to meet the minimum requirements defined by EN 12385-1.
The distribution of ropes across these quality classes is illustrated in Figure 1.
Figure 1 illustrates the distribution of ropes into quality class. Nearly 44% were categorized into Class I, while around 24% fell into the lowest quality categories (Class III and IV), reflecting broader dispersion in wire strength.
This chart illustrates the distribution of steel rope quality classes by year of production (Figure 2). It highlights a significant increase in lower-quality ropes (Classes III and IV) after the adoption of the EN 12385-1 standard in 2008, suggesting an impact of broader tolerance thresholds on manufacturing quality. Notably, 27 ropes (24.1%) exhibited strength class dispersion wider than the limits prescribed by the now obsolete standards (DIN 21254 and STN 02 4301), and were thus considered to be of lower quality. A key finding from the analysis is the significant increase in the number of ropes falling into Classes III and IV following the implementation of EN 12385-1 in 2008, which introduced a broader tolerance for wire strength class dispersion. Of the 27 ropes classified in Classes III and IV, 22 were manufactured after 2008, and only 5 were produced before that year. Specifically, among the 22 post-2008 ropes, 11 were classified as Class III and 11 as Class IV. In contrast, only 5 out of 67 ropes tested prior to 2008 were deemed non-compliant. After 2008, 11 out of 45 ropes tested fell into the non-compliant Class IV category. These results suggest that the expanded dispersion interval permitted by EN 12385-1 has contributed to an increased prevalence of ropes with inferior mechanical consistency. This trend was further corroborated by non-destructive testing conducted in mining operations, which revealed that ropes classified in Class III demonstrated significantly reduced service life compared to those in higher quality classes.
For the purpose of detailed statistical analysis, representative steel ropes were selected from each of the four quality classes. All selected samples originated from mining applications and shared the same rope construction, specified in Table 1.
The significance of addressing this issue lies in the need to accurately assess the quality and mechanical strength of individual wires within steel ropes. The applicable standards, particularly EN 12385-1, define the nominal strength requirements for wires used in ropes designed for both material handling and passenger transport systems. Ensuring compliance with these strength specifications is critical for operational safety and rope longevity. The term target value refers to the intended design strength specified for a wire rope, while nominal accuracy denotes the permissible deviation range accepted under standard manufacturing tolerances, as defined in EN 12385 [16].
The present study applies statistical quality management methods to evaluate the tensile strength and consistency of steel wire ropes, as illustrated in Figure 3.
This conceptual diagram outlines the applied methodology, including descriptive statistics, normality testing (Anderson–Darling), and Shewhart control charts for assessing process stability and capability indices (Cp, Cpk) for evaluating production consistency.

4. Materials and Method

The primary objective of this section is to calculate the fundamental statistical characteristics of a selected variable. Let us consider a single random variable X, whose observed values V form a finite dataset of size n, denoted as V {xi}n. The observed data may originate from various domains. Qualitative data are expressed in a nominal form, while quantitative data are expressed in metric units. These values may be presented either in unordered form, as they were recorded, or as a variational series, i.e., arranged in ascending or descending order. Depending on the context, the values may be dimensional (e.g., measured in Newtons or millimeters), dimensionless (e.g., percentages), or proportional (e.g., normalized to a reference value). The fundamental statistical measures calculated in this analysis include the following characteristics:
Descriptive statistics such as mean, range, and standard deviation were used to quantify wire strength variability, following the standard definitions [23].

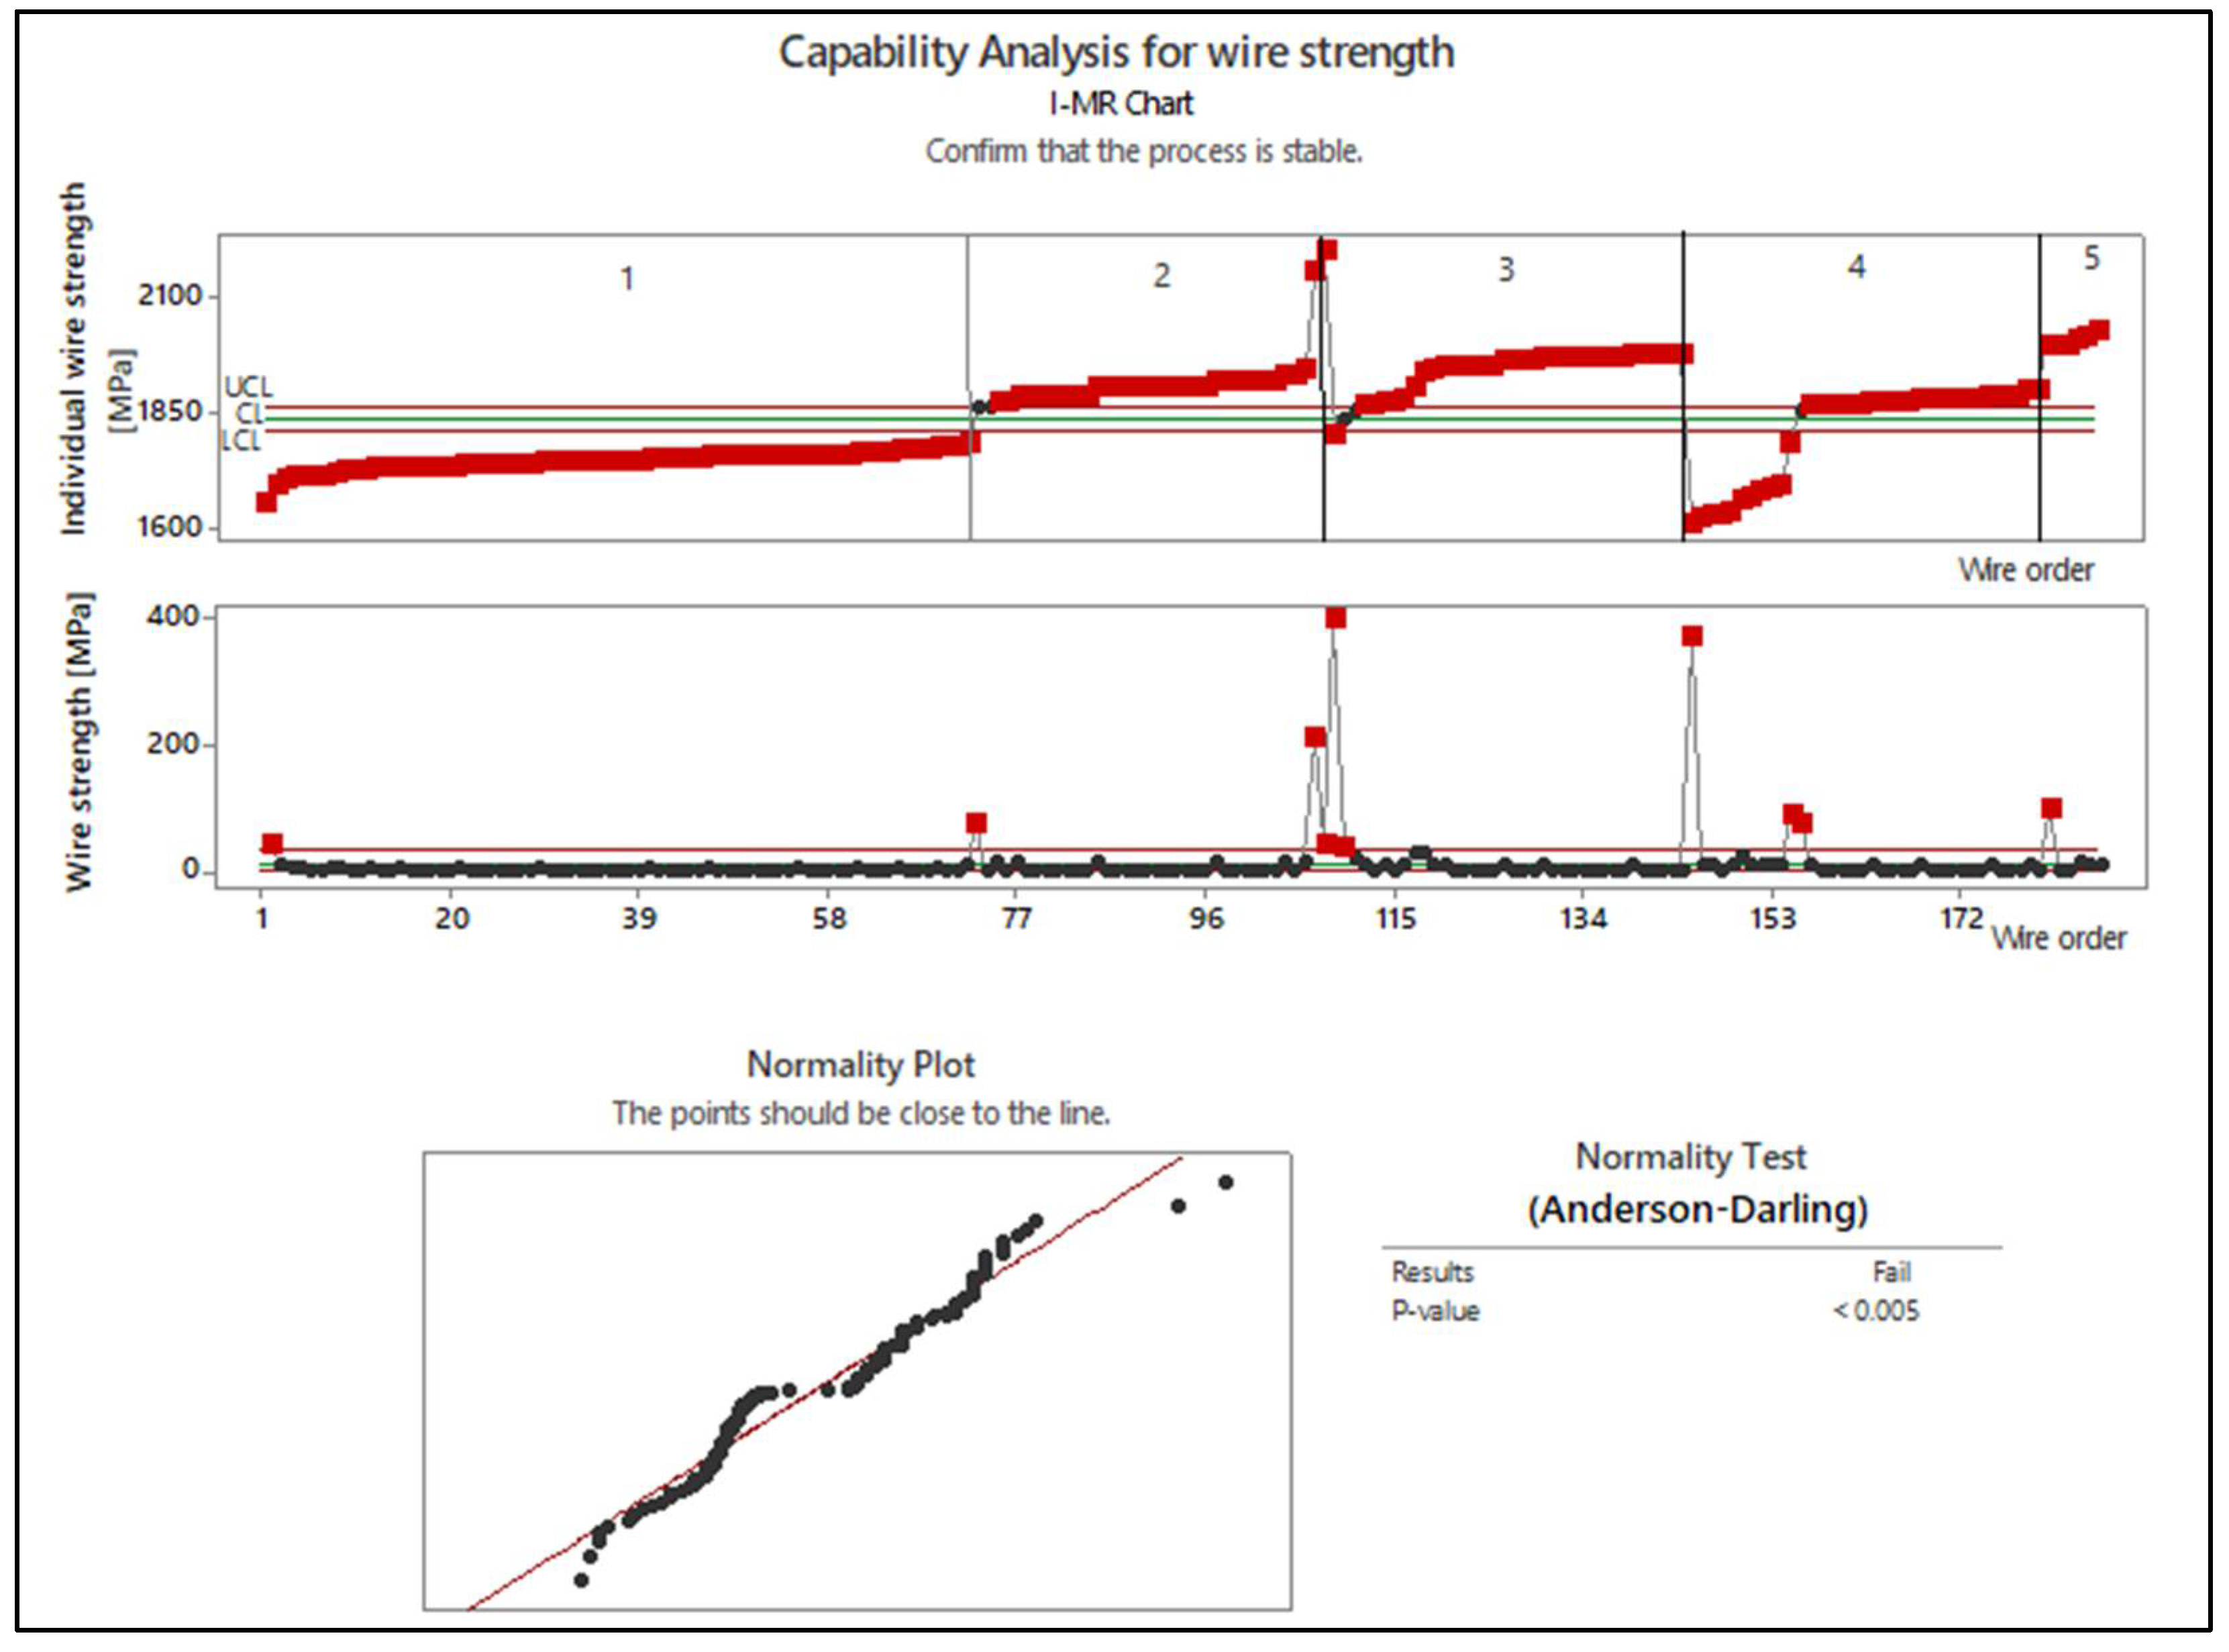
4.1. Application of Statistical Quality Control Methods

SQC methods, including control charts and capability indices, were applied to monitor wire strength variability and assess the stability of rope manufacturing processes [24]. From these tools, control charts are particularly effective for monitoring regularly recurring processes. They facilitate the identification of random variations or non-random signals that may indicate process instability or non-compliance with quality standards. To ensure the proper application and interpretation of control charts, several key assumptions must be validated [24,25]:
  • Verification of the normality of the measured data using normality tests, such as the Anderson–Darling test;
  • Constancy of the process mean across the observed dataset;
  • Constancy of the process standard deviation, indicating homoscedasticity;
  • Independence of observations, ensuring that the data points are not autocorrelated.

4.1.1. Anderson–Darling Test for Normality Assessment

To verify whether the observed data follow a normal distribution, the Anderson–Darling test was applied.
  • The significance level was set at α = 0.05.
  • Establishing the null hypothesis H0: The data are normally distributed.
  • The test statistic (AD) is calculated using the formula [25,26]
A D = 1 n ·   i = 1 n 2 · i 1 · ln Φ · x i x ¯ s + l n 1 Φ · x n + 1 i x ¯ s n
where
x ¯ : arithmetic mean of the sample,
s: standard deviation,
Φ: cumulative distribution function of the standard normal distribution NORM.DIST,
x(i): i-th ordered observation.
4.
The critical value for the test is determined by the p-value:
  • If AD > 0.05, the null hypothesis is not rejected, and the data are considered to follow a normal distribution;
  • If AD < 0.05, the null hypothesis is rejected, indicating that the data do not follow a normal distribution.

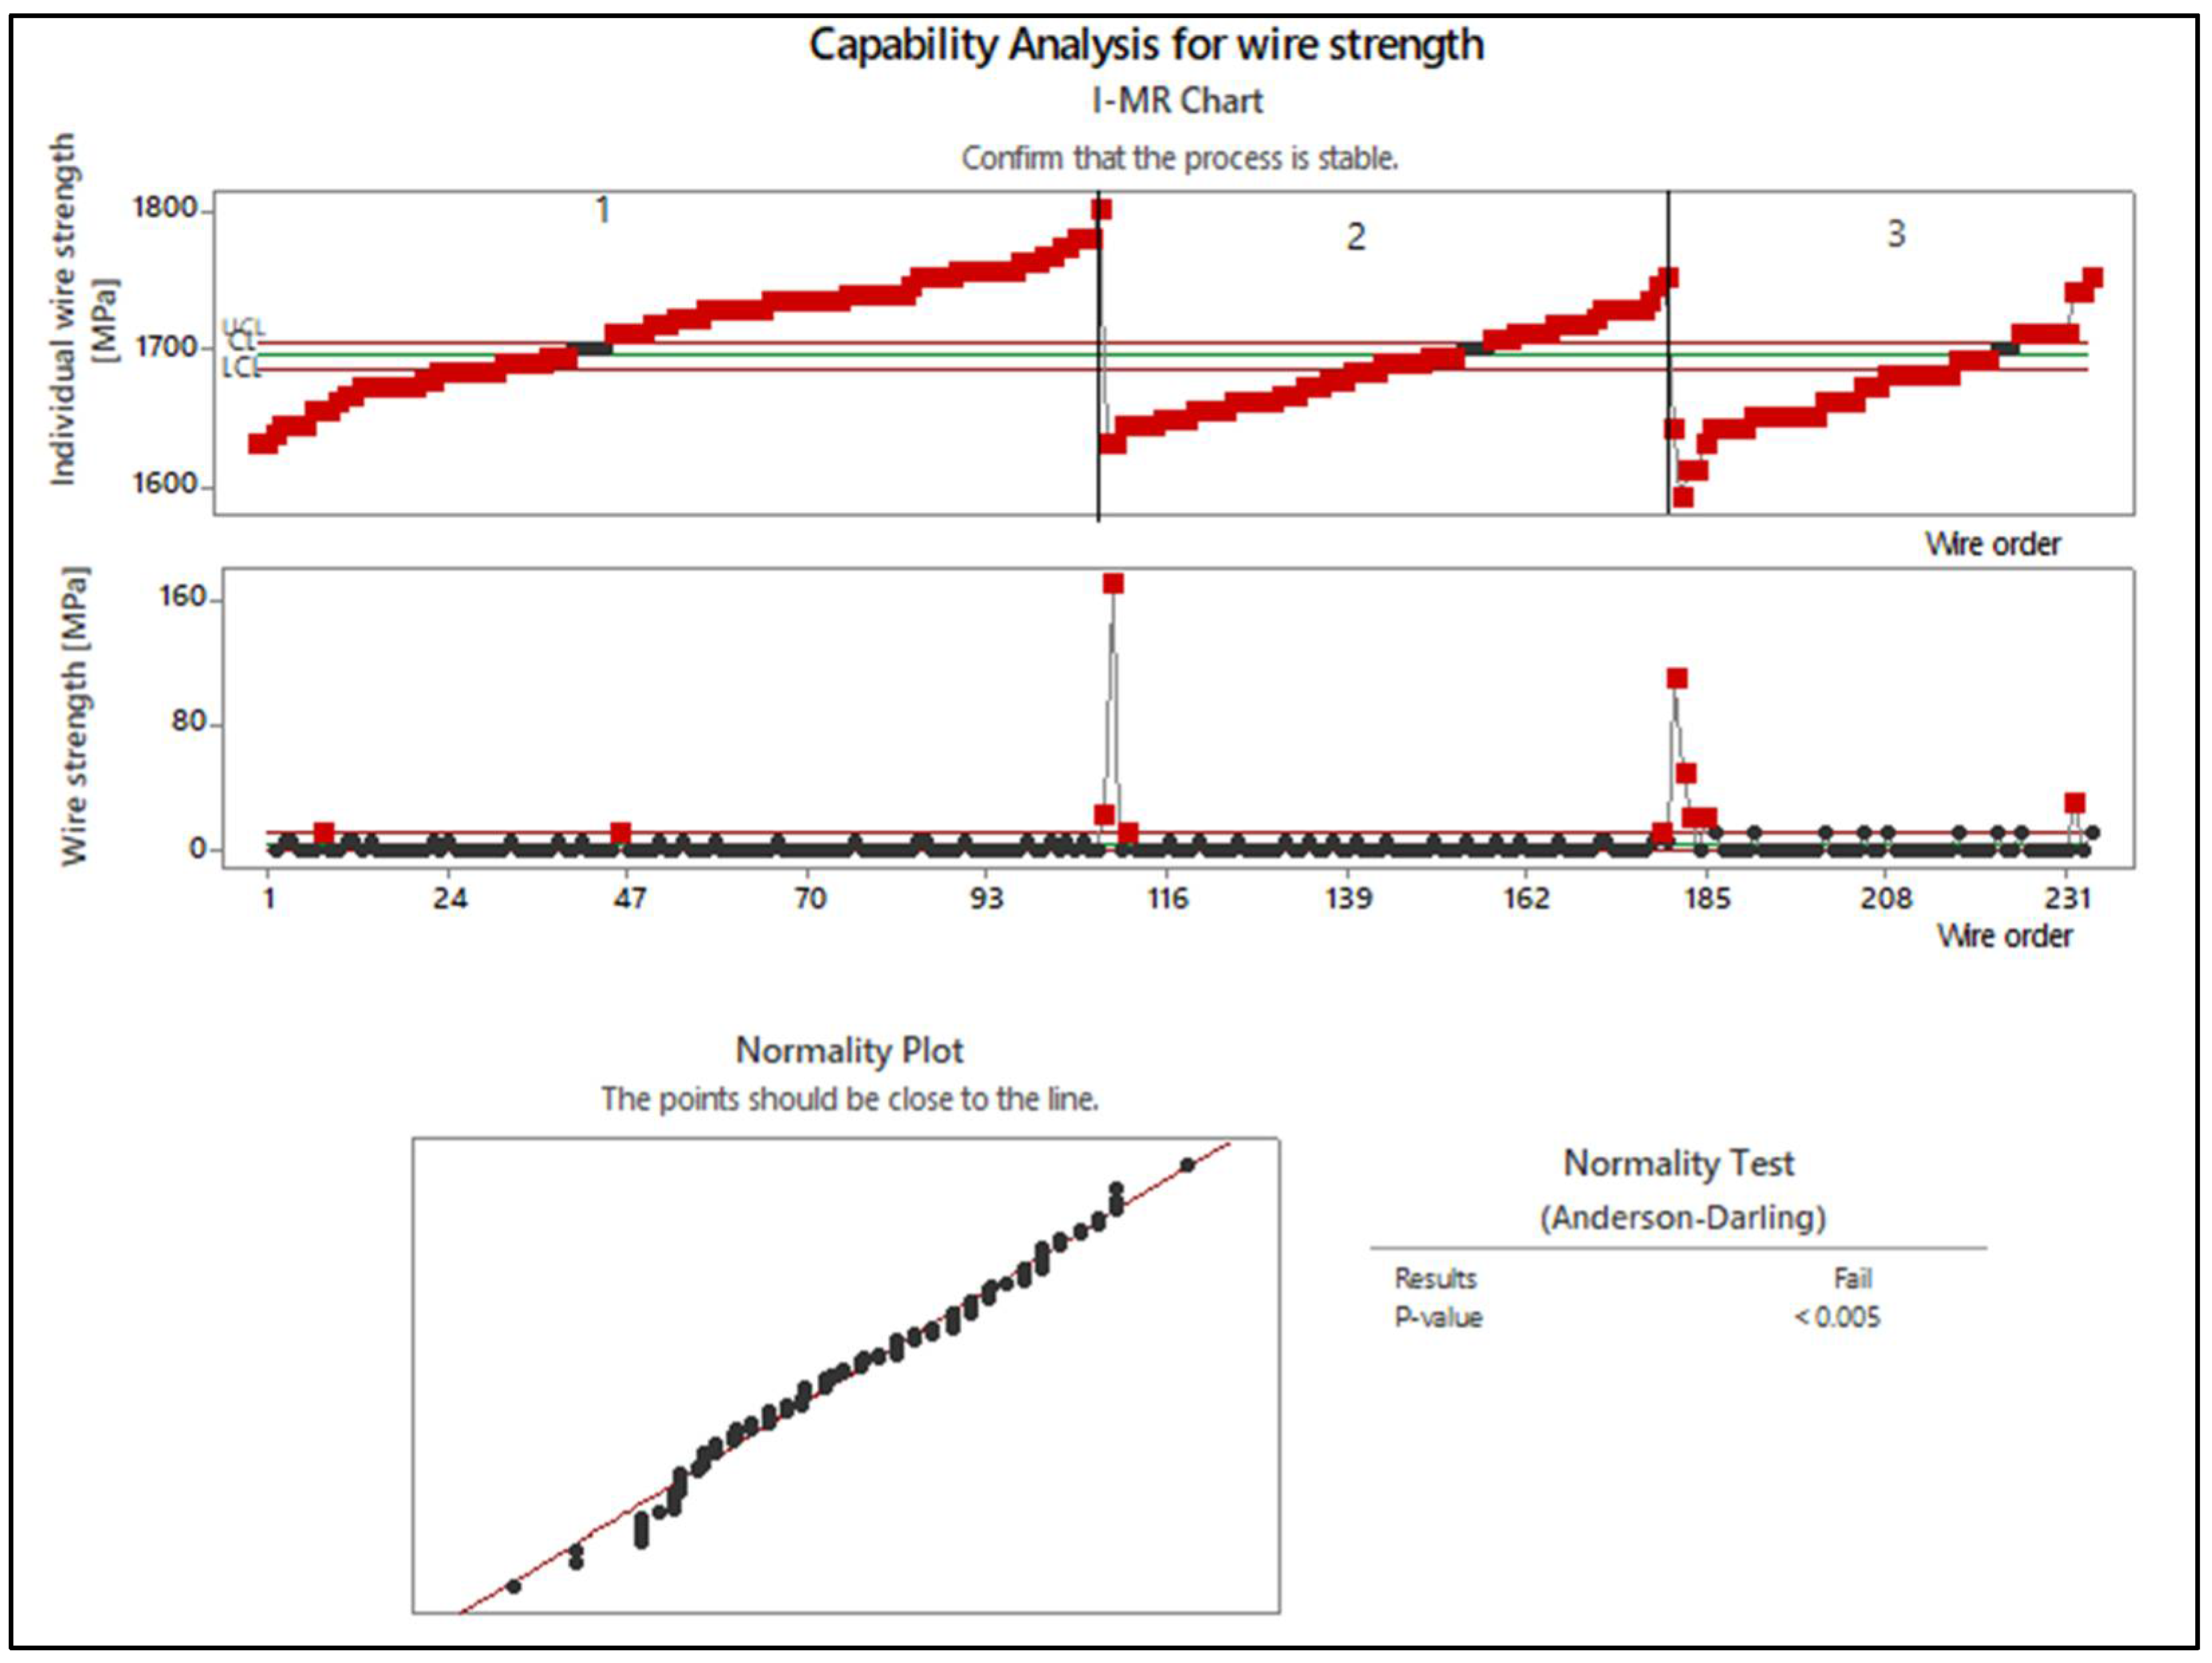
4.1.2. Implementation of Control Charts for Process Monitoring

Once the assumption of normality has been confirmed, the next step involves the application of control charts. These charts, similar in structure to time series or trend graphs, are designed to visualize the behavior of data over time. The primary objective of control charts is to detect the presence of “special causes of variability”, which may indicate shifts or disturbances in the process. Control charts play a key role in monitoring process stability, assessing process improvement, and identifying process variability. Among the available methods, Shewhart control charts are particularly suitable for evaluating process stability in real time. These charts are updated at regular intervals, providing a continuous overview of the current process state and allowing for early detection of deviations from expected behavior [27,28].
In the present study, Shewhart control charts were constructed for the sample arithmetic mean, with control limits calculated according to established statistical principles [29].
The test statistic for the control chart of the sample mean is defined as follows [29]
Test criterion is
x ¯ j = 1 n · i = 1 n x i j
C L = x ̿ = 1 k · j = 1 k x ¯ j
C L = x ̿ A 2 · R ¯
U C L = x ̿ + A 2 · R ¯
where
x ̿ j : sample mean value,
A2: constant for a certain range of a subgroup [30],
R ¯ : calculation of the average spread,
UCL: Upper Control Line,
LCL: Lower Control Line,
CL: Central Line.
In conjunction with control chart analysis, it is appropriate to evaluate process capability indices (PCIs) to further assess the quality and consistency of the manufacturing process. These indices offer quantitative insight into how effectively a process operates within predefined specification limits. Assessing process capability requires determining whether the process is properly centered within the tolerance range and quantifying its inherent variability. Such analysis is essential for verifying whether the process can consistently produce outputs that meet required specifications. The process capability indices include Cp, Cpk, Pp, and Ppk. The indices Cp and Cpk are used to quantify process capability, which reflects the degree to which a process meets the required quality specifications for a given product. Determining true process capability requires continuous and long-term monitoring under stable operating conditions. For capability indices to be valid, the process must be under statistical control, meaning that all systematic influences are identified and consistently managed. During capability assessment, the dominant factors influencing variability are typically those inherent to the production equipment and environment [28,29].
In cases where the process is not statistically controlled, it is more appropriate to calculate process performance indices rather than capability indices. These performance indices reflect only the current behavior of the process, without assuming long-term stability. While the formulas remain the same, the indices are denoted by the letter P (for Performance) instead of C (for Capability), indicating that the values apply to a process that may still be influenced by uncontrolled or unquantified sources of variation.
Pp and Ppk are indices based on samples collected in equally sized subgroups over a long-term time interval. These are indices of process potential and represent long-term process performance. These indices characterize past results; they cannot be used to predict future process behavior but only indicate the current state of the process [29].
A potential issue is the verification of normality when assessing process performance with respect to the required quality. The cause may be definable sources of variability that result in a non-normal data distribution. Process capability indices (Cp, Cpk) were calculated to assess how consistently wire strength measurements remained within specification limits [29].

5. Results

Most steel ropes are evaluated using tensile testing, which is used to determine their mechanical strength. For customers using steel wire ropes, service life is, in addition to the specified strength, a key performance criterion. The lifespan of steel ropes significantly influences the economic efficiency of the equipment in which they are installed. The quality of steel ropes can be assessed based on the inspection and testing results of the individual steel wires that compose the rope. The aim of this paper is to evaluate the operational reliability of steel ropes in relation to the mechanical properties of the wires, with a focus on wire tensile strength as the key quality parameter. The analysis is based on four quality classes of ropes, as follows:
  • First quality class—30 8x26 WS IWRC 1960 B sZ;
  • Second quality class—22.4 6x27 NS SFC 1570 U sZ;
  • Third quality class—42.5 6x39 NFC 1570 B zZ;
  • Fourth quality class—25 6x31 WS SFC 1770 B sZ.
For the rope in the fourth quality group, 186 measured values were recorded. The third quality group rope includes 234 measurements, the second quality group has 162, and the first quality group was assessed using 327 measured values. According to the defined ±4% criterion, the nominal strength interval for ropes in groups 4 and 2 is <1770; 1911.6> MPa. For the third quality group, the nominal interval is <1570; 1695.6> MPa, while the first quality group—reflecting the highest strength classification—has a nominal range of <1960; 2116.8> MPa. A statistical analysis of wire strength was conducted for each rope type to evaluate compliance with the defined mechanical property standards. To assess the statistical validity of the control charts and capability indices, the Anderson–Darling test for normality was applied to all rope samples, following the procedure described in Section 4.1.1.

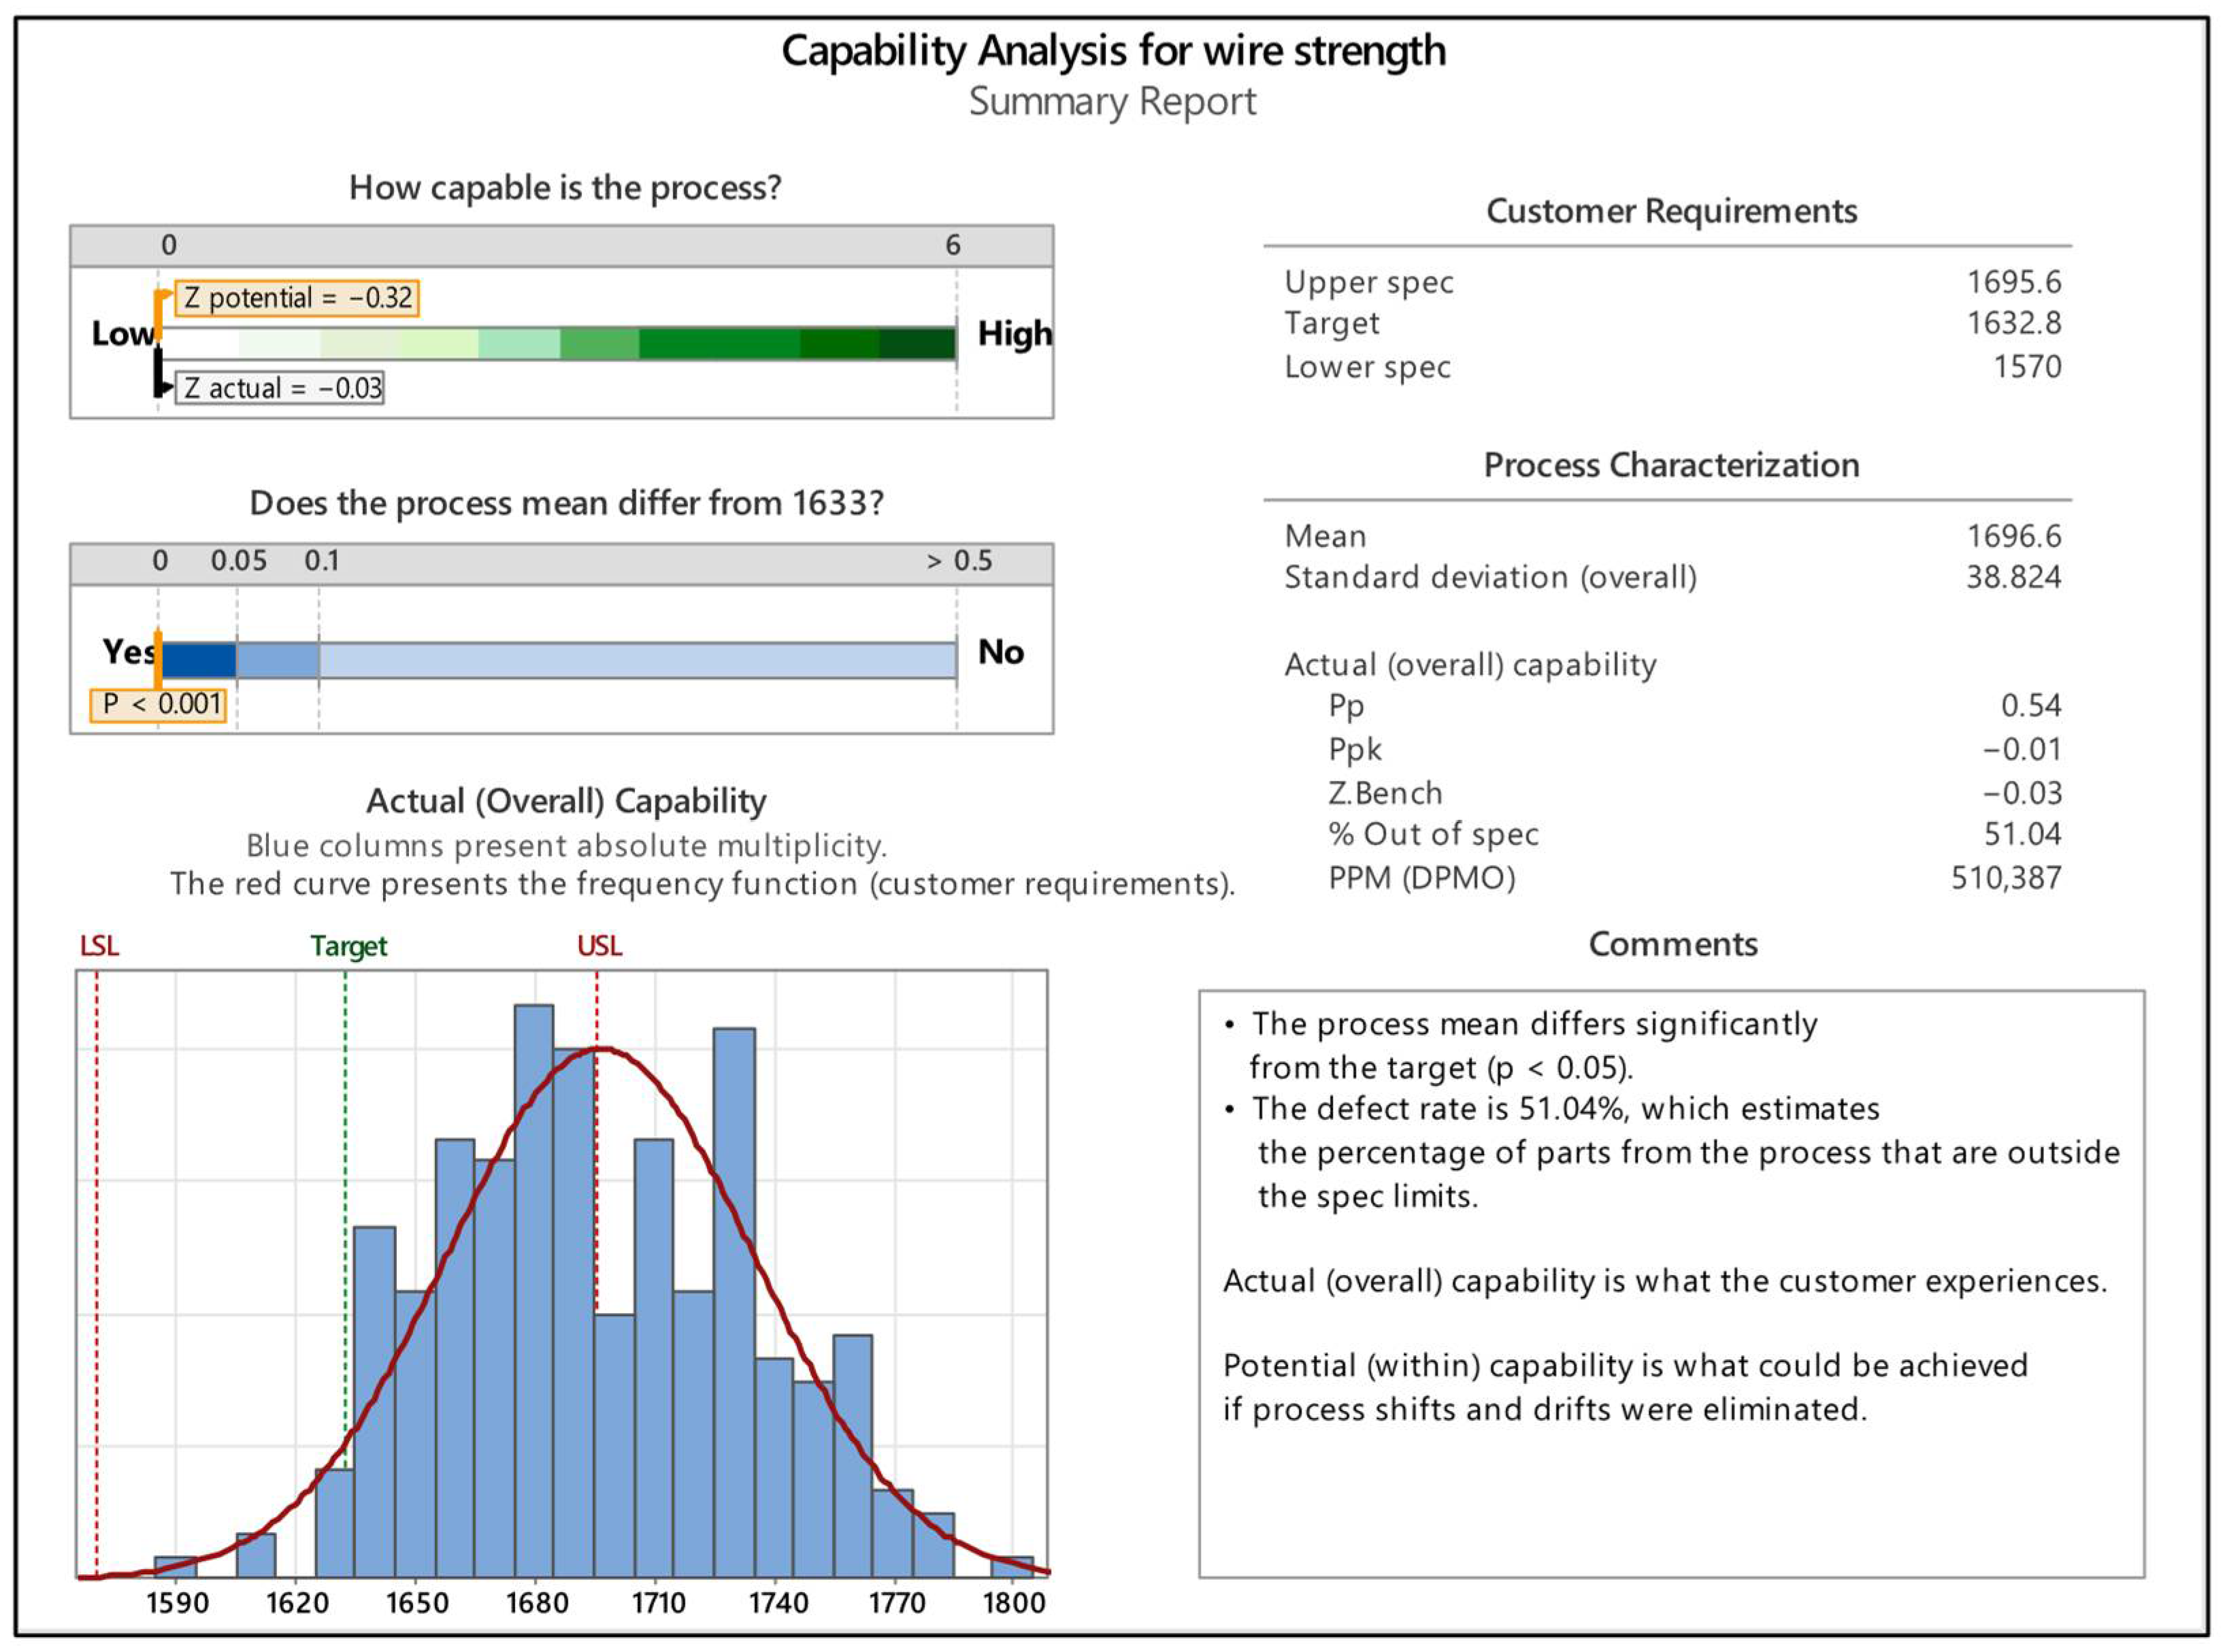
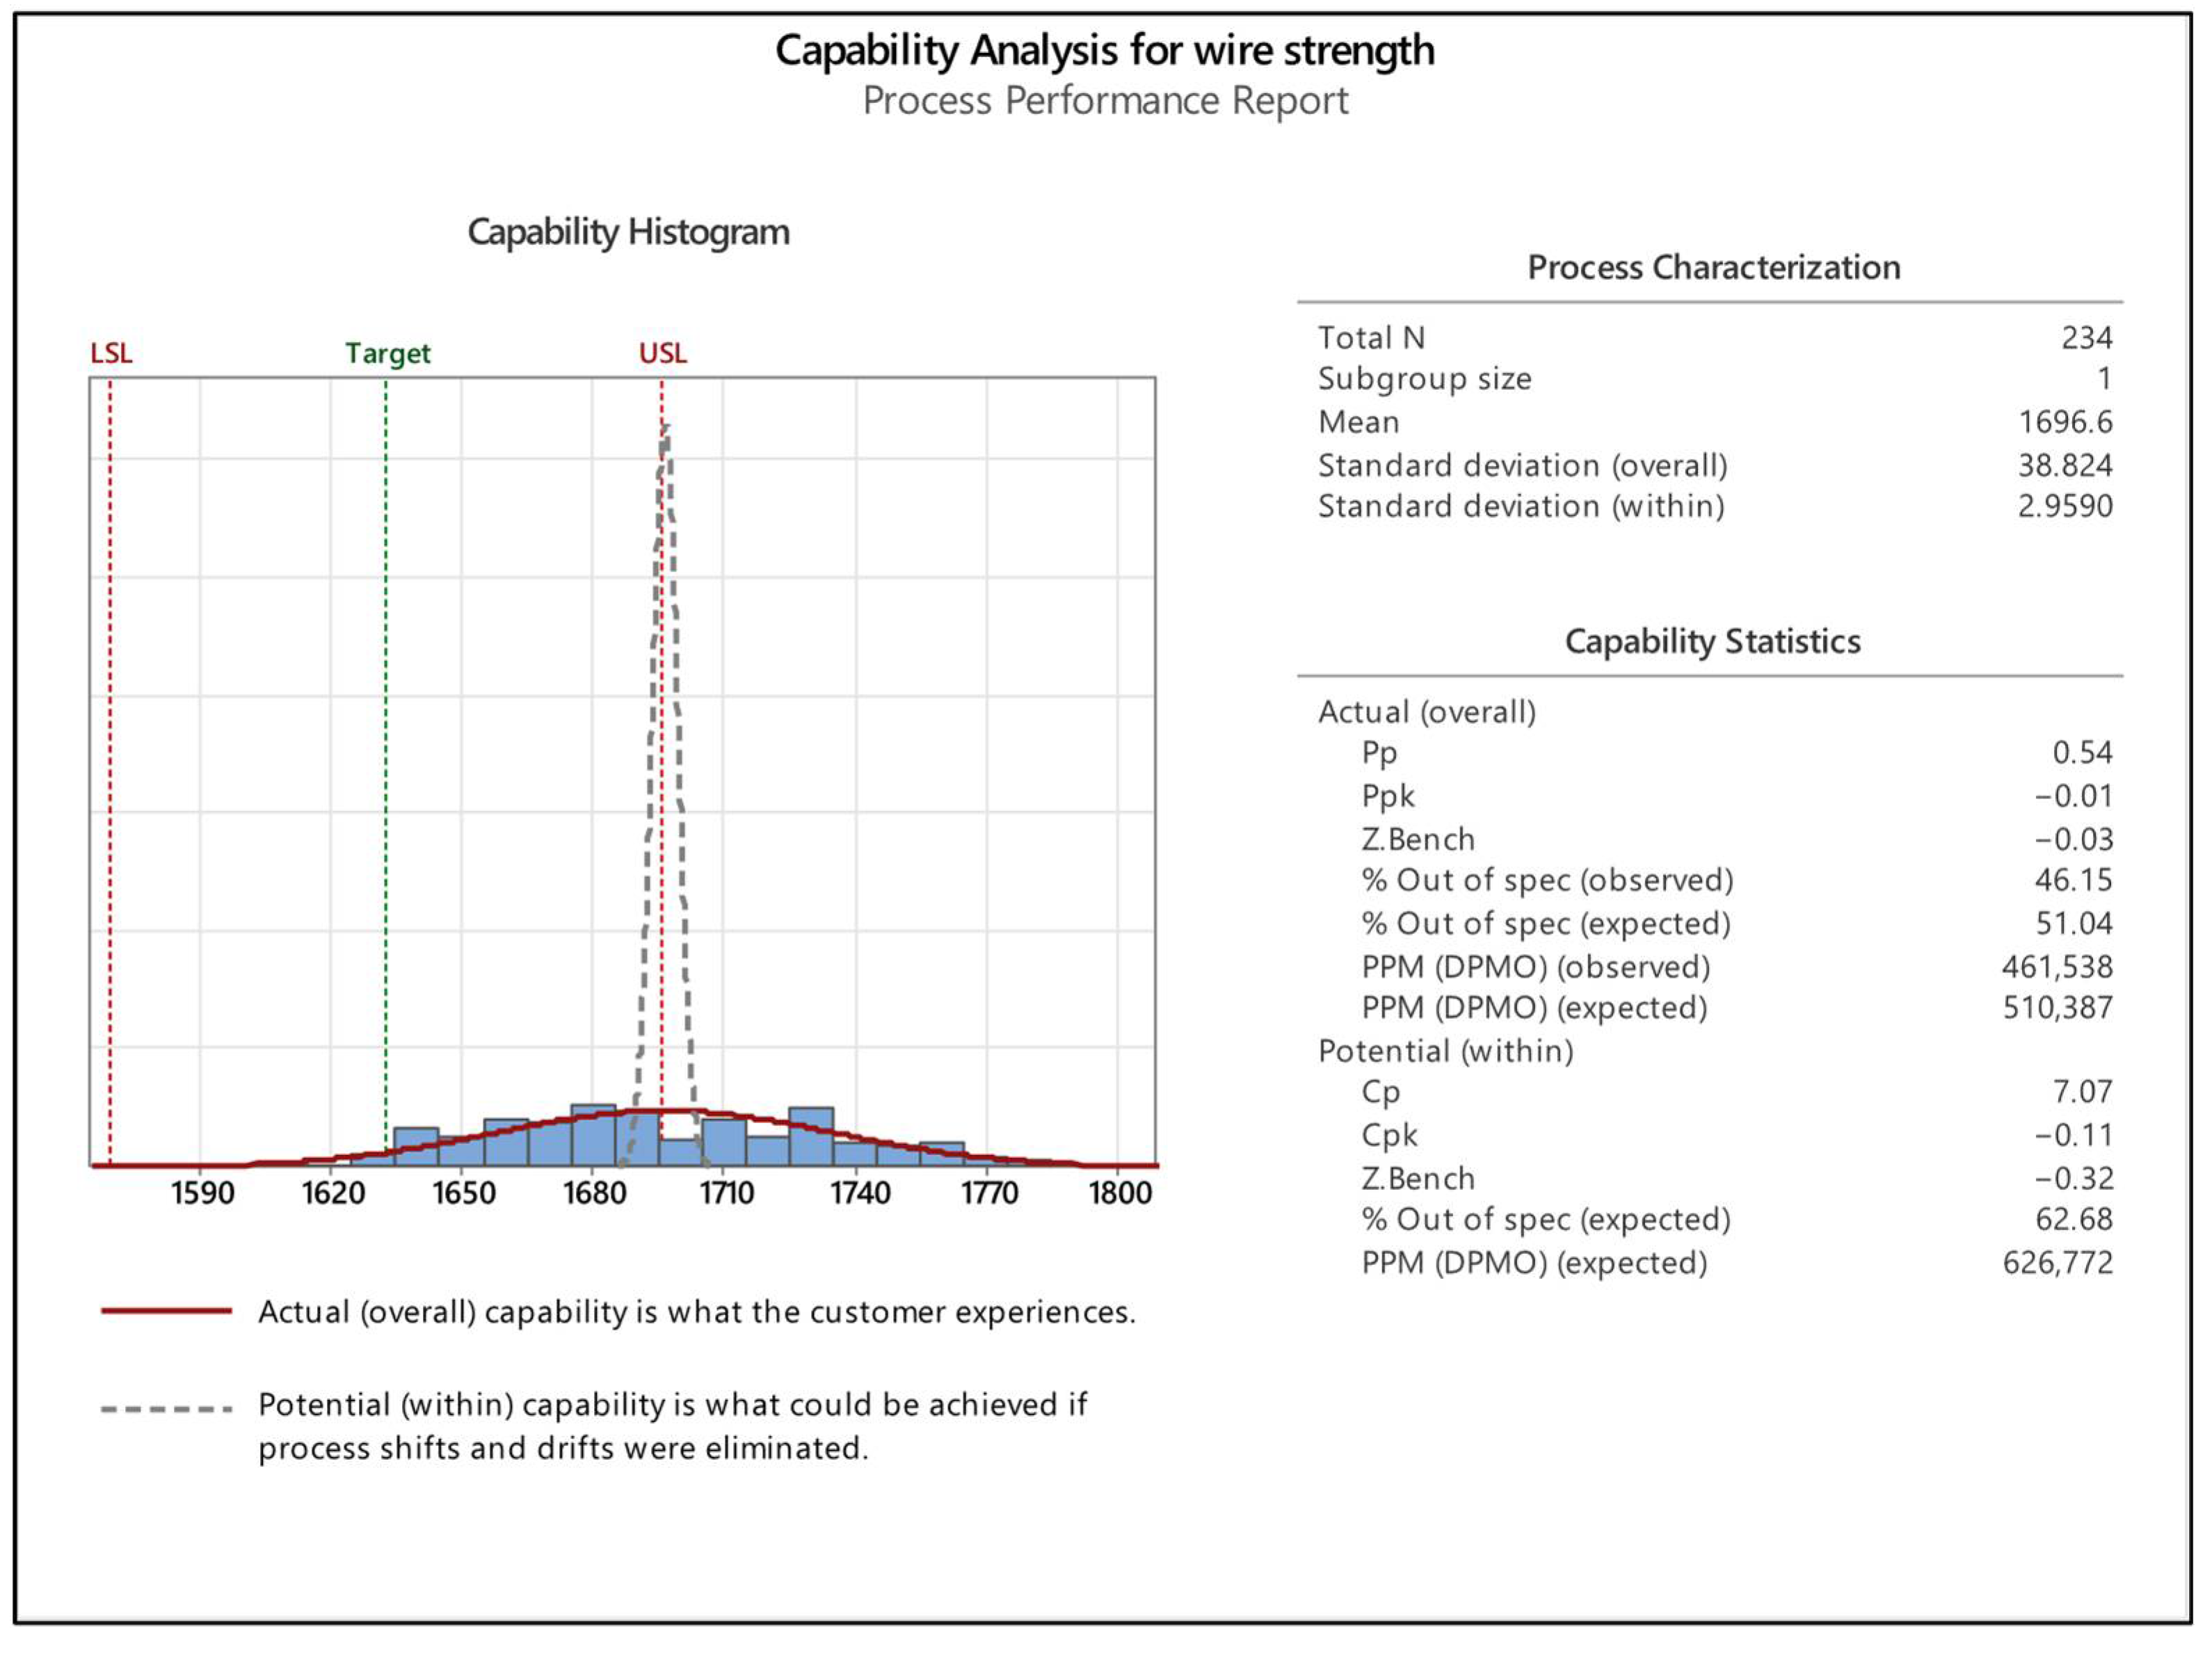
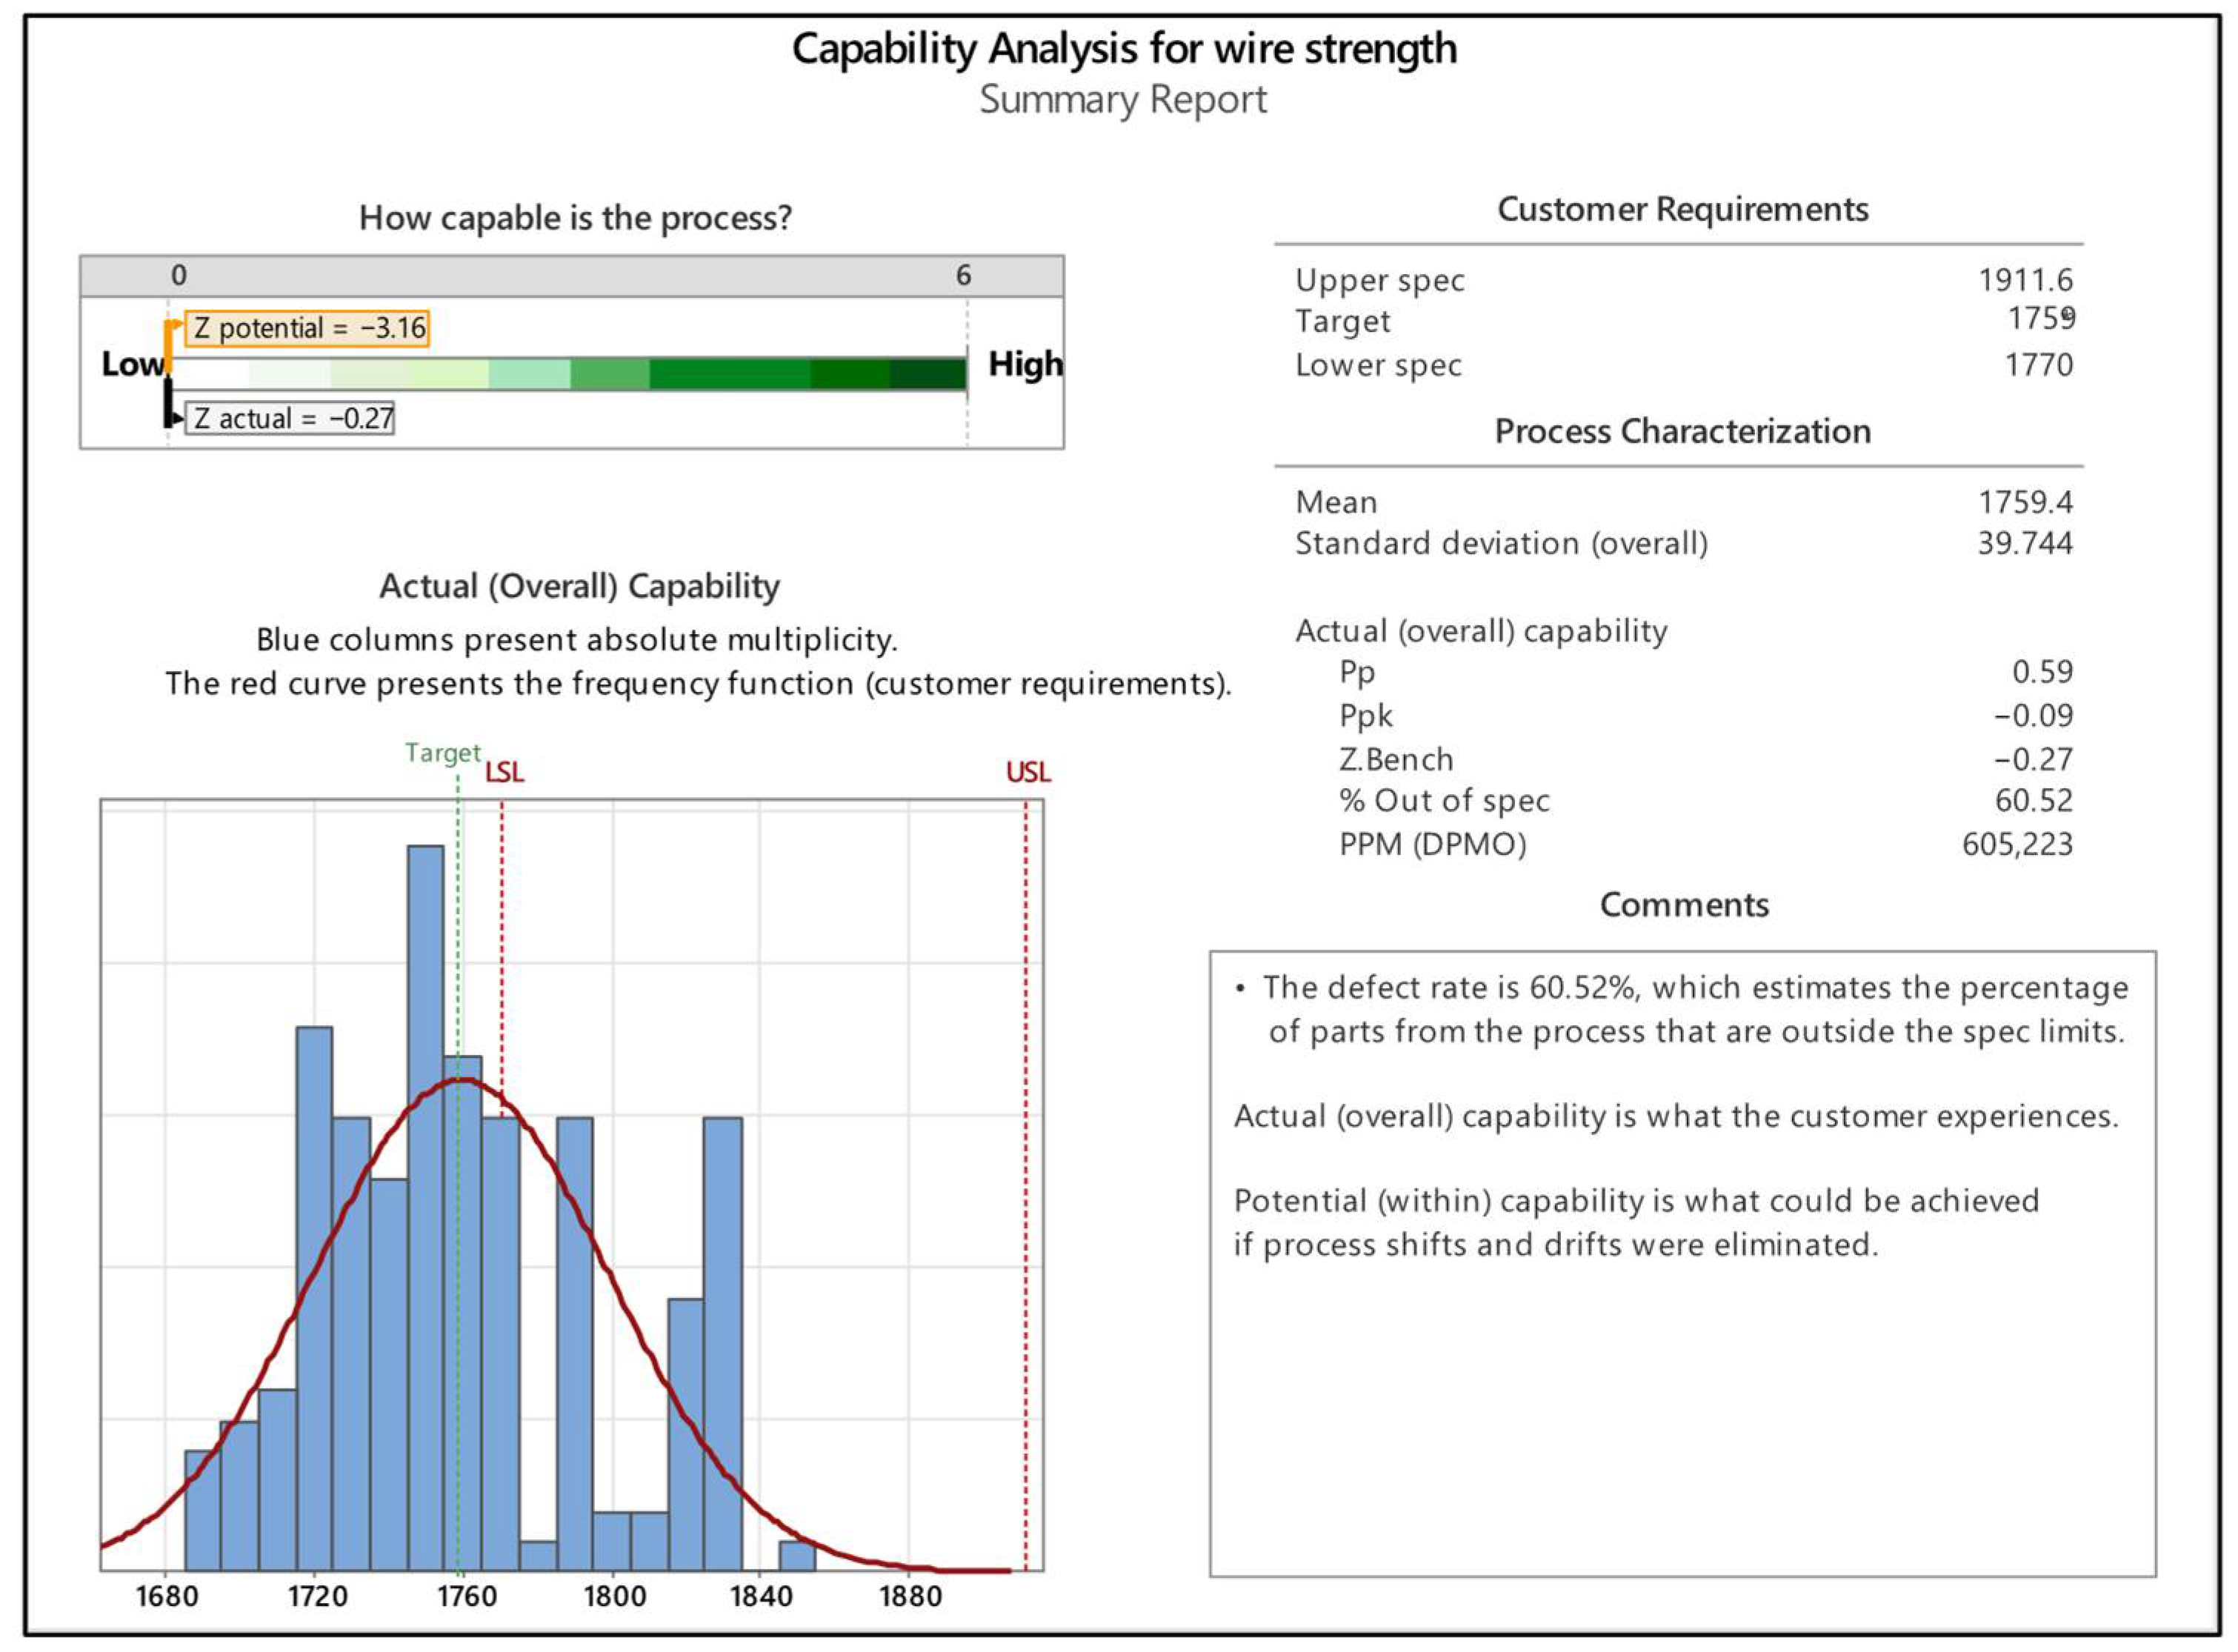
5.1. Analysis of Rope in the Fourth Quality Class

As shown in Table 2, the majority of wire strength values fall outside the nominal accuracy interval of 1770 ;   1911.6 MPa. The target value of the nominal accuracy of the rope is 1839 MPa. From Table 2, it is possible to see significant differences in the average values of the nominal accuracy for wires No. 2, No. 3, and No. 5. The average values for these wires are significantly higher than the specified target accuracy value, namely 1839 MPa. The highest variation range is observed in wire No. 2 (Vx = 338.76), which is also accompanied by a relatively high standard deviation (s = 67.02). Similarly, wire No. 4 exhibits a considerable variation range (Vx = 285.35) and an even higher standard deviation (s = 103.70). The notably elevated variance (s2 = 10 754.72) for wire No. 4 reflects substantial fluctuations in the measured strength values. From the perspective of mechanical performance, it can be concluded that the majority of measured values lie outside the nominal strength tolerance for the fourth-quality-class rope type (25 6x31 WS SFC 1770 B sZ).
The shape of the constructed histogram, as shown in Figure 4, clearly contradicts the assumption of normality. Most of the measured values fall within the interval 1725 ;   1775 . The test data obtained from the respective steel wires, together with the specified limits—namely the lower specification limit (LSL) = 1770 and the upper specification limit (USL) = 1911.6—demonstrate that a substantial portion of the values lie outside these boundaries. Specifically, a significant number of values fall both below the LSL and above the USL, indicating a lack of process control.
The target value (1839), which lies within the ±4% tolerance interval, is not adequately represented in the measured data. Only 6 values fall within the interval 1775 ;   1825 , while 13 values are observed in the range 1825 ;   1875 . This highlights a clear issue with process centering, as the distribution of values is skewed and fails to align with the defined specification limits.
The control chart depicted in Figure 5 reveals that the measured values fall outside the bounds of the specified nominal accuracy interval 1770 ;   1911.6 . This deviation indicates that the process does not conform to the established quality requirements. Furthermore, since the assumption of normal distribution is not satisfied, the calculation of capability indices is not recommended, as it may lead to erroneous conclusions.
It can thus be concluded that the process is neither statistically stable nor capable. The capability analysis results presented in Figure 6 further support this finding. Due to the failure to meet the assumption of normality, capability indices were not considered valid and are excluded from further evaluation.
From the perspective of capability assessment, the evaluated rope must be deemed unsuitable and unfit for use. The analysis clearly demonstrates statistical instability and process incapability of the corresponding steel wires, which ultimately confirms non-compliance with the customer’s quality requirements.
Despite visualizing Cp and Cpk values, this figure illustrates the limitation of such indices under non-normal data conditions. These values are presented for completeness but are not valid indicators due to the failed normality assumption (Figure 6). Their presence in Figure 6 is for illustrative purposes only and should not be interpreted as reliable indicators of process quality.

5.2. Analysis of Rope in the Third Quality Class

Table 3 shows that the maximum tensile strength values of all three tested wires exceed the upper specific limit (USL = 1695.6 MPa). The defined nominal accuracy for ropes in the third quality group is set within the interval 1570 ;   1695.6 MPa. The target value of nominal accuracy for the third quality class is 1632.8 MPa.
Wire No. 1 exhibits the highest variation range (Vx = 170.06 MPa) and also the highest standard deviation (s = 38.95 MPa), indicating considerable variability in wire strength. The corresponding dispersion value (s2 = 1516.77) confirms significant fluctuations in the measured tensile strength values. The average strength value for wire No. 1 is 1714.38 MPa; it can be stated that it significantly exceeds the target value of nominal accuracy. Similarly, Wire No. 3 also shows elevated variability, with a variation range of Vx = 159.24 MPa and a standard deviation of s = 32.75 MPa.
From the perspective of tensile strength performance, the measured values reflect the characteristic strength associated with steel ropes of the third quality class, specifically type 42.5 6x39 NFC 1570 B zZ.
To assess the statistical validity of the control charts and capability indices, the Anderson–Darling test for normality was applied to all rope samples, following the procedure described in Section 4.1.1. Figure 7 shows the strength distribution of wires from a Class III rope (42.5 6x39 NFC 1570 B zZ). A considerable portion of values exceed the upper specification limit (1695.6 MPa), indicating poor centering and high variability. The shape of the histogram clearly rejects the hypothesis of a normal distribution, and this is further supported by the p-value < 0.005 reported in Figure 8, which confirms a statistically significant deviation from normality.
Figure 7 illustrates that the majority of values are concentrated within the interval 1675 ;   1685   MPa. Although the measured wire strength values fall within the specified specific limits 1570 ;   1695.6   MPa, the nominal accuracy interval is not entirely satisfied, as only 126 values lie within this range. The target value of 1632.8 MPa, which falls within the ±4% tolerance band, highlights a centering issue in the data. In total, 46.15% of the measured values (108 values) lie outside the specified limits, suggesting a significant misalignment of the process center and potential quality nonconformities in the rope’s performance.
Figure 8 clearly indicates that the measured wire strength values fall outside the nominal accuracy interval of 1570 ;   1695.6   MPa. Given that the assumption of normal distribution is not fulfilled, the calculation of capability indices (Cp, Cpk) is not recommended, as it would yield misleading or invalid results.
Based on the data presented in Figure 7 and Figure 8, it can be concluded that the measured strength values for wires No. 1 and No. 3 exceed the upper specific limit (USL = 1695.6 MPa). This further confirms the misalignment and inconsistency in the strength distribution of the assessed wires.
Due to the violation of the normal distribution assumption, the calculation of capability indices yields misleading and inaccurate results, as demonstrated in Figure 9. Specifically, the Cpk index assumes a negative value (Cpk = −0.11), indicating that 108 measured values—representing 46.15% of the dataset—exceed the upper specific limit (USL = 1695.6 MPa). Please note that capability indices shown in Figure 9 are for illustration purposes only. Values are invalid due to violation of normality assumption.
This outcome highlights a significant deviation in process centering and distribution. All three evaluated wires in the rope of the third quality class exhibit strength values above the USL, confirming a lack of process capability and a failure to meet the required specifications.

5.3. Analysis of Rope in the Second Quality Class

Table 4 shows that the majority of wire strength values fall outside the nominal accuracy range, specifically outside the interval 1770 ;   1911.6 MPa. The target accuracy value for the second quality accuracy class is 1759 MPa. The highest variation range (Vx = 152.87) is observed for Wire No. 2, which also exhibits the highest standard deviation (s = 42.07). The corresponding variance (s2 = 1769.66) confirms notable variability in wire strength.
Similarly, Wire No. 3 presents a higher variation range (Vx = 99.52) and a standard deviation of 23.49, further indicating inconsistency in mechanical properties. A higher accuracy dispersion value indicates significant differences in the measured accuracy values of the respective wires. From the perspective of tensile performance, these values highlight the characteristic strength behavior of wires used in steel ropes of the second quality class (construction type: 22.4 6x27 NS SFC 1570 U sZ.
The histogram presented in Figure 10 clearly confirms a deviation from normal distribution, as indicated by its irregular shape. Most of the observed values lie within the interval 1745 ;   1755 , which is significantly below the acceptable range. Furthermore, the target strength value of 1759 MPa falls outside the specified tolerance limits (Lower Specification Limit—LSL = 1770 MPa; Upper Specification Limit—USL = 1911.6 MPa), confirming that the measured tensile strengths are generally insufficient. This deficiency in wire strength directly impacts the overall quality and performance of the steel rope. Additionally, the majority of the strength measurements are below both the LSL and the target value, as shown in Figure 10. The uneven distribution of data, particularly in intervals below the LSL, further supports the conclusion of inadequate process control and non-compliance with the specified quality requirements.
Figure 11 illustrates that the measured tensile strength values of the wires fall outside the nominal accuracy interval of 1770 ;   1911.6   MPa. Given that the assumption of normal distribution is not satisfied, the application of capability indices (e.g., Cp, Cpk) is not justified and may lead to misleading conclusions. Based on the findings from Figure 10 and Figure 11, it can be concluded that the process lacks both stability and capability. The distribution of the measured strength values clearly reveals a deficiency in wire strength, further reinforcing concerns about the quality and reliability of the steel rope in the second quality group.
Figure 11 reveals that wires No. 1, No. 2, and No. 3 exhibit minimum tensile strength values below the nominal threshold of 1770 MPa. Given that the manufacturer specifies a nominal accuracy interval of 1770 ;   1911.6 MPa, the measured values fall outside the defined specification limits.
As a result, due to the substandard values below the lower specification limit (LSL = 1770 MPa), it can be concluded that the customer’s requirements for wire strength are not fulfilled. This deviation underscores a deficiency in product quality and process capability for the evaluated wires in the second-quality-class rope.
Since the assumption of normal distribution is not satisfied, the calculation of the process capability indices provides misleading results. As illustrated in Figure 12, the Cpk index assumes a negative value (Cpk = −1.05), which clearly indicates that more than 50% of the measured wire strength values fall below the lower specification limit (LSL).
This result confirms the inadequacy of the rope’s mechanical properties, demonstrating poor process centering and high variability. Consequently, the evaluated steel rope exhibits low process stability and insufficient capability, ultimately resulting in non-compliance with customer strength requirements.

5.4. Analysis of Rope in the First Quality Class

For the purpose of verifying process stability and capability, a steel rope of the first quality group type 30 8x26 WS IWRC 1960 B sZ was subjected to mechanical strength testing.
Table 5 presents the statistical characteristics calculated for the wires of the steel rope belonging to the first quality group 30 8x26 WS IWRC 1960 B sZ. Wires No. 1 to No. 7 represent the external wires, while wires No. 8 to No. 11 constitute the internal wires. In terms of strength, as indicated by the standard deviation values, the most favorable results are observed for wires No. 1, No. 2, No. 3, No.4, No. 5, and No. 6. The target accuracy value for the first qualitative grade is 2036 MPa.
Wire No. 3 exhibits the lowest standard deviation, suggesting that its strength values fall within the interval 2013.92 ;   2102.93   MPa, confirming the consistent mechanical performance of the wire.
Wire No. 5 demonstrates the best overall result, as it has the smallest variation range, with strength values distributed within the interval 2046.1 ;   2121.88 MPa, indicating minimal variability and high-quality manufacturing. The highest variation range is observed for wire No. 7, with a standard deviation of 49.99. The variation range of 252.70 indicates a substantial difference between the maximum and minimum values, with measurements falling within the interval 1920.56 ; 2173.26 MPa.
Notably, the maximum value for wire No. 7 significantly exceeds the upper specific limit of 2116.8 MPa, highlighting a deviation from the expected mechanical performance. Similarly, wire No. 8 shows considerably higher variance and standard deviation values in comparison with the other wires, suggesting pronounced inconsistency in tensile strength. The variation range of 202.08 further confirms large discrepancies among the measured values for wire No. 8. From the calculated accuracy dispersion values in Table 5, it can be seen that wires No. 7, No. 8, No. 9, and No. 10 have high dispersion values, which indicates significant differences in the measured strength values of the wires.
The control diagrams presented in Figure 13 reveal several values that lie outside the specified limits. Despite these deviations, the diagrams indicate that the process remains statistically controlled, thereby fulfilling the necessary prerequisite for process capability evaluation. Furthermore, the Anderson–Darling test yields a p-value of <0.051, which is very close to the critical threshold of 0.05, suggesting marginal adherence to the assumption of normality.
Therefore, it can be concluded that the process is stable, and therefore, the application of capability index calculations is deemed appropriate.
Figure 14 presents the measured strength values for the steel rope classified in the first quality class. The associated graph demonstrates significantly improved variability results within the defined specification limits (USL and LSL) when compared to the rope of the second quality group. However, a centering issue in the process is apparent, as the majority of the values, while remaining within the specified limits, are concentrated above the target value.
For a more accurate representation of a normal distribution, it would be preferable if fewer values appeared in the interval 2025 ;   2035 , currently comprising 38 values in the 13th class, than in the adjacent interval 2035 ;   2045 , which includes 30 values in the 14th class).
The standard-defined requirements for the nominal strength of the rope are set within the interval 1960 ;   2116.8 MPa, based on the ±4% criterion. The majority of measured values fall within the interval <2045; 2055>, indicating a strong clustering around this range. A notable discrepancy is observed between the long-term and short-term variability, as reflected by the capability indices (Ppk = 0.64; Cpk = 3.29).
The calculated values of Cp = 3.38 and Cpk = 3.29 demonstrate a high process capability, confirming that the wire strength is consistently maintained within the required specifications (Figure 15). From the manufacturer’s perspective, these results clearly indicate compliance with customer requirements, as validated by both the control charts and capability index evaluations.

6. Conclusions

Steel rope manufacturers declare the mechanical properties of the ropes, which also include the strength class. The variation in the strength class of the wires woven into the steel ropes has a proven effect on the quality of the rope. An analysis focused on compliance with the qualitative selection of wires was conducted on 112 steel ropes tested in the period from 2000 to 2025. The analyses showed a significant change in the quality of the ropes, especially after 2008, when the standard allowing a wider variation in the quality of the wires woven into the rope came into force. It was shown that companies that were able to produce high-quality ropes after the introduction of quality tolerances adapted their production to the new, looser rules and reduced the quality of their products. This study evaluated steel ropes from four distinct quality classes, specifically:
  • Rope of quality class No. 1—25 6x31 WS SFC 1770 B sZ;
  • Rope of quality class No. 2—42.5 6x39 NFC 1570 B zZ;
  • Rope of quality class No. 3—22.4 6x27 NS SFC 1570 U sZ;
  • Rope of quality class No. 4—30 8x26 WS IWRC 1960 B sZ.
Based on the statistical evaluation and tests of the relevant wires in steel ropes, the high quality of the dispersion of the strength class for the first group rope 30 8x26 WS IWRC 1960 B sZ is clearly confirmed. The steel rope of the first quality class has a nominal accuracy in the interval 1960 ;   2116.8 MPa, which indicates a narrow dispersion of the strength class of the wires and at the same time a higher quality of the steel rope. The values of the capability indices Cp and Cpk confirmed a significantly good capability of the strength of the wires in the steel rope. Considering the specified limits 1770 ;   1911.6 MPa for the rope in second quality class and the specific limits 1570 ;   1695.6 MPa for the third quality class of strength, it is possible to see differences in the strength of the relevant wires. Due to the larger number of wires in the rope of the second quality class compared to the number of wires in the third quality class, it can be stated that 60.52% of the measured values are within the nominal accuracy interval of the second quality class, and 51.04% are within the nominal accuracy interval of the third quality class. In case of non-compliance with the nominal accuracy, i.e., specific limits, as the values are below the lower specific limit, the relevant wires in the rope will wear out earlier.

Author Contributions

Conceptualization, M.M.; methodology, P.P. and M.M.; software, M.M.; validation, M.M. and P.P.; formal analysis, M.M.; investigation, P.P. and M.M.; resources, P.P.; data curation, M.M.; writing—original draft preparation, M.M. and P.P.; writing—review and editing, M.M.; visualization, P.P.; supervision, M.M.; project administration, M.M. and P.P.; funding acquisition, M.M. All authors have read and agreed to the published version of the manuscript.

Funding

This article was supported by the Slovak Cultural and Educational Agency under the grant KEGA 020TUKE-4/2024 Adaptability of education with a focus on strategic support of companies to ensure the sustainable quality of processes and project VEGA 1/0114/25 Study of utility properties and sustainability of active logistic elements of belt transport.

Institutional Review Board Statement

Not applicable.

Informed Consent Statement

Not applicable.

Data Availability Statement

References to the literature review are paraphrased from the original publications of the respective authors.

Acknowledgments

The authors would like to thank the anonymous referees for their valuable comments that improved the quality of the manuscript.

Conflicts of Interest

The authors declare no conflicts of interest.

Abbreviations

The following abbreviations are used in this manuscript:
PVFPlastic valley filled
NDTNon-destructive testing
SQCStatistical quality control
ADAnderson–Darling
SPCStatistical process control
CDFCumulative distribution function

References

  1. Hrabovsky, L.; Fries, J.; Kudrna, L.; Gaszek, J. Determination of the coefficient of friction in a pulley groove by the indirect method. Coatings 2022, 12, 606. [Google Scholar] [CrossRef]
  2. Hrabovsky, L.; Ucen, O.; Kudrna, L.; Cepica, D.; Frydrysek, K. Laboratory device detecting tensile forces in the rope and coefficient of friction in the rope sheave groove. Machines 2022, 10, 590. [Google Scholar] [CrossRef]
  3. Wang, D.; Chong, H.; Ge, S.; Wu, K.; Wang, B.; Li, C.; Ji, W.; Zhang, J.; Chen, J.; Deng, H.; et al. Bending tribo-fatigue behaviors between steel wire rope and rope groove material of offshore rig winch drum. Tribol. Int. 2025, 204, 110477. [Google Scholar] [CrossRef]
  4. Chen, Y.; Wang, S.; Tan, H.; Xu, J.; He, Y.; Wang, S. Study on the tribological performance at the interface between a steel wire rope and groove during a twisting process. J. Non-Linear Mech. 2024, 166, 104829. [Google Scholar] [CrossRef]
  5. Čereška, A.; Zavadskas, E.K.; Bucinskas, V.; Podvezko, V.; Sutinys, E. Analysis of steel wire rope diagnostic data applying multi-criteria methods. Appl. Sci. 2018, 8, 260. [Google Scholar] [CrossRef]
  6. Pawar, G.; Qureshi, U. Review of wire rope analysis, construction and testing. Int. J. Sci. Prog. Res. (IJSPR) 2018, 43, 54–56. [Google Scholar]
  7. Changsha Aulone Construction Machinery Co., Ltd. What Is Wire Rope? Understanding the Specifications and Construction. Available online: https://loadmate.in/blog/what-is-wire-rope-understanding-the-specifications-and-construction/ (accessed on 18 May 2025).
  8. Mazurek, P. A Comprehensive Review of steel wire rope degradation mechanisms and recent damage detection methods. Sustainability 2023, 15, 5441. [Google Scholar] [CrossRef]
  9. da Silva, F.A.C. Steel wire ropes service life. Limitations of the application of ISO 4308 on the design of storage and retrieval machines. J. Fail. Anal. Prev. 2022, 22, 1924–1935. [Google Scholar] [CrossRef]
  10. Wang, H.; Zheng, H.; Tian, J.; He, H.; Ji, Z.; He, X. Research on quantitative identification method for wire rope wire breakage damage signals based on multi-decomposition information fusion. J. Saf. Sustain. 2024, 1, 89–97. [Google Scholar] [CrossRef]
  11. Rosaa, C.; Silvaa, F.J.G.; Ferreiraa, L.P. Improving the quality and productivity of steel wire-rope assembly lines for the automotive industry. In Proceedings of the 27th International Conference on Flexible Automation and Intelligent Manufacturing, FAIM2017, Modena, Italy, 27–30 June 2017. [Google Scholar]
  12. Slesarev, D.; Vorontsov, A. Consideration of NDT results ambiguity while estimating rope residual strength by an example of drilling rig rope monitoring system. In Proceedings of the 19th World Conference on Non-Destructive Testing, Munich, Germany, 13–17 June 2016. [Google Scholar]
  13. Mouradi, H.; El Barkany, A.; El Biyaali, A. Reliability estimation of non-rotating ropes based on cumulative damage. Int. J. Perform. Eng. 2016, 12, 471–480. [Google Scholar]
  14. Mazumder, S.; Paul, A.; Chandra Dey, N.; Chakraborty, K.; Banerjee, S. Performance analysis of PVF and Non-PVF ropes using Statistical Process Control (SPC) and Customer Value Management (CVM) techniques in respect of opencast mines. J. Inst. Eng. Ser. D 2021, 102, 461–472. [Google Scholar] [CrossRef]
  15. Yordanova, R.; Yankova, S. Evaluation of the mechanical properties of steel wire rope during its operation in the mining industry. J. Chem. Technol. Metall. 2025, 60, 163–172. [Google Scholar] [CrossRef]
  16. EN 12385; Steel Wire Ropes—Safety—Part 1: General Requirements. DIN: Berlin, Germany, 2009.
  17. Costello, G.A. Theory of Wire Rope, 2nd ed.; Springer Sciences and Business Media: New York, NY, USA, 1997; pp. 87–98. [Google Scholar]
  18. DIN 21 254; Förderseile, Technische Lieferbedingungen, Invalid Standard. DIN: Berlin, Germany, 1969.
  19. STN 02 4301; Oceľové Laná, Technické Dodacie Predpisy, Invalid Slovak Standard. SUTN: Bratislava, Slovakia, 1974.
  20. Žitkov, E.I.; Pospechov, F.P. Staľnyje Konaty Dlja Podzemnotransportnych Mašin, 1st ed.; Metalurgizdet: Moscow, Russia, 1953; pp. 48–56. [Google Scholar]
  21. Molnár, V.; Boroška, J.; Dečmanová, J. Mechanical properties of steel rope wires—Quality test assurance. Acta Montan. Slovaca 2010, 15, 23–30. [Google Scholar]
  22. Boroška, J.; Krešák, J.; Peterka, P. Estimation of quality for steel wire ropes according to their mechanical properties. Acta Montan. Slovaca 1997, 2, 37–42. [Google Scholar]
  23. Andrejiova, M. Statistical Methods in Practise, [Štatistické Metódy v Praxi], 1st ed.; Technical University of Košice: Košice, Slovakia, 2016; pp. 249–271. [Google Scholar]
  24. Das, K.R.; Rahmatullah Imon, A.H.M. A Brief Review of Tests for Normality. Am. J. Theor. Appl. Stat. 2016, 5, 5–12. [Google Scholar]
  25. Jäntschi, L.; Bolboaca, S.D. Computation of Probability Associated with Anderson–Darling Statistic. Mathematics 2018, 6, 88. [Google Scholar] [CrossRef]
  26. Berlinger, M.; Stefan Kolling, S.; Schneider, J. A generalized Anderson–Darling test for the goodness-of-fit evaluation of the fracture strain distribution of acrylic glass. Glass Struct. Eng. 2021, 6, 195–208. [Google Scholar] [CrossRef]
  27. Malindzakova, M.; Garaj, P.; Trpčevská, J.; Malindzak, D. Setting MRP parameters and optimizing the production planning process. Processes 2022, 10, 690. [Google Scholar] [CrossRef]
  28. Malindzakova, M.; Čulková, K.; Trpčevská, J. Shewhart Control Charts implementation for quality and production management. Processes 2023, 11, 1246. [Google Scholar] [CrossRef]
  29. Plura, J. Quality Planning and Continuous Quality Improvement, [Plánování a Neustálé Zlepšování Jakosti], 1st ed.; Computer Press: Praha, Czech Republic, 2001; pp. 107–113. [Google Scholar]
  30. EN 8258:1995; Shewhart Control Charts. SUTN: Bratislava, Slovakia, 1995.
Figure 1. Classification of ropes into quality classes.
Applsci 15 07875 g001
Figure 2. Classification of ropes according to the years of their production.
Applsci 15 07875 g002
Figure 3. Combination of methods for evaluating the quality of steel wire rope strength.
Applsci 15 07875 g003
Figure 4. Histogram and capability analysis of wire strength in a fourth-quality-class rope (5 wires).
Applsci 15 07875 g004
Figure 5. Shewhart control chart for stability verification in a fourth-quality-class rope (5 wires).
Applsci 15 07875 g005
Figure 6. Capability indices analysis of a fourth-quality-class rope (5 wires).
Applsci 15 07875 g006
Figure 7. Histogram and capability analysis of wire strength in a third-quality-class rope (3 wires).
Applsci 15 07875 g007
Figure 8. Control chart showing process stability for a third-quality-class rope (3 wires).
Applsci 15 07875 g008
Figure 9. Process capability indices for a third-quality-class rope (3 wires).
Applsci 15 07875 g009
Figure 10. Histogram and capability analysis of wire strength in a second-quality-class rope (4 wires).
Applsci 15 07875 g010
Figure 11. Control chart for assessing stability in a second-quality-class rope (4 wires).
Applsci 15 07875 g011
Figure 12. Capability analysis of a second-quality-class rope (4 wires).
Applsci 15 07875 g012
Figure 13. Histogram and capability assessment of a first-quality-class rope (11 wires).
Applsci 15 07875 g013
Figure 14. Control chart indicating process stability in a first-quality-class rope (11 wires).
Applsci 15 07875 g014
Figure 15. Process capability indices for a first-quality-class rope (11 wires).
Applsci 15 07875 g015
Table 1. Ropes selected for detailed statistical analysis of wire strength variance.
Quality ClassRope ConstructionNominal Accuracy
Class I30 8x26 WS IWRC 1960 B sZ 1960 ;   2116.8
Class II22.4 6x27 NS SFC 1570 U sZ 1770 ;   1911.6
Class III42.5 6x39 NFC 1570 B zZ 1570 ;   1695.6
Class IV25 6x31 WS SFC 1770 B sZ 1770 ;   1911.6
Table 2. Statistical analysis of the strength of three wires from fourth-quality-class rope.
Wire 1Wire 2Wire 3Wire 4Wire 5
Mean [MPa]1746.411919.261941.511814.012008.82
Maximum value [MPa]1786.432201.951981.601899.622027.66
Minimum value [MPa]1657.051863.191804.671614.271997.51
Variation range (Vx) [MPa]129.38338.76176.93285.351230.15
Standard deviation (s) [MPa]20.5367.0248.34103.701313.27
Variance (s2) [MPa]421.604491.172336.5410,754.72176.14
Table 3. Statistical analysis of the strength of three wires from third-quality-class rope.
Wire 1Wire 2Wire 3
Arithmetic mean [MPa]1714.381686.461674.37
Maximum value [MPa]1802.671751.651751.59
Minimum value [MPa]1632.601632.601592.36
Variation range (Vx) [MPa]170.06119.04159.24
Standard deviation (s) [MPa]38.9529.9832.75
Variance (s2) [MPa]1516.77898.871072.45
Table 4. Statistical analysis of the strength of four wires from second-quality-class rope.
Wire 1Wire 2Wire 3Wire 4
Arithmetic mean [MPa]1725.841782.171769.841804.67
Maximum value [MPa]1754.351847.131791.401831.21
Minimum value [MPa]1692.641694.271691.881771.50
Variation range (Vx) [MPa]61.71152.8799.5259.71
Standard deviation (s) [MPa]14.7342.0723.4924.11
Variance (s2) [MPa]217.001769.66551.83581.07
Table 5. Statistical analysis of the strength of four wires from first-quality-class rope.
Wire 1Wire 2Wire 3Wire 4Wire 5Wire 6Wire 7Wire 8Wire 9Wire 10Wire 11
Arithmetic mean [MPa]2035.222035.812066.492045.122072.152033.402010.061987.162045.272022.162023.68
Maximum value [MPa]2124.322070.092102.932111.152121.882069.042173.262113.462098.162084.262023.68
Minimum value [MPa]1940.821947.922013.921988.082046.101930.131920.561911.381957.111950.97
Variation range (Vx) [MPa]183.50122.1789.01123.0775.78138.91252.70202.08141.05133.30
Standard deviation (s) [MPa]34.5124.1018.1741.1526.6724.3949.9983.1842.1547.35
Variance (s2) [MPa]1190.84581.02330.061693.62711.44595.082498.916919.741776.432241.95
Disclaimer/Publisher’s Note: The statements, opinions and data contained in all publications are solely those of the individual author(s) and contributor(s) and not of MDPI and/or the editor(s). MDPI and/or the editor(s) disclaim responsibility for any injury to people or property resulting from any ideas, methods, instructions or products referred to in the content.

