Article

SE-TransUNet-Based Semantic Segmentation for Water Leakage Detection in Tunnel Secondary Linings Amid Complex Visual Backgrounds

1
School of Civil Engineering, Central South University, Changsha 410075, China
2
National Engineering Laboratory for Construction Technology of High-Speed Railway, Central South University, Changsha 410075, China
3
Shandong Provincial Communications Planning and Design Institute Group Co., Ltd., Jinan 250101, China
*
Author to whom correspondence should be addressed.
Appl. Sci. 2025, 15(14), 7872; https://doi.org/10.3390/app15147872 (registering DOI)
Submission received: 26 June 2025 / Revised: 8 July 2025 / Accepted: 11 July 2025 / Published: 14 July 2025

Abstract

Traditional manual inspection methods for tunnel lining leakage are subjective and inefficient, while existing models lack sufficient recognition accuracy in complex scenarios. An intelligent leakage identification model adaptable to complex backgrounds is therefore needed. To address these issues, a Vision Transformer (ViT) was integrated into the UNet architecture, forming an SE-TransUNet model by incorporating SE-Block modules at skip connections between the encoder-decoder and the ViT output. Using a hybrid leakage dataset partitioned by k-fold cross-validation, the roles of SE-Block and ViT modules were examined through ablation experiments, and the model’s attention mechanism for leakage features was analyzed via Score-CAM heatmaps. Results indicate: (1) SE-TransUNet achieved mean values of 0.8318 (IoU), 0.8304 (Dice), 0.9394 (Recall), 0.8480 (Precision), 0.9733 (AUC), 0.8562 (MCC), 0.9218 (F1-score), and 6.53 (FPS) on the hybrid dataset, demonstrating robust generalization in scenarios with dent shadows, stain interference, and faint leakage traces. (2) Ablation experiments confirmed both modules’ necessity: The baseline model’s IoU exceeded the variant without the SE module by 4.50% and the variant without both the SE and ViT modules by 7.04%. (3) Score-CAM heatmaps showed the SE module broadened the model’s attention coverage of leakage areas, enhanced feature continuity, and improved anti-interference capability in complex environments. This research may provide a reference for related fields.

1. Introduction

Secondary tunnel linings frequently develop construction quality defects such as vault voids during construction. Over time, these may evolve into various lining deteriorations during operation [1,2,3,4]. Among these, water leakage represents one of the most prevalent tunnel defects, accelerating corrosion of the lining and internal reinforcement, reducing load-bearing capacity, and ultimately compromising operational safety [5,6,7]. Consequently, timely detection and precise treatment of tunnel lining leakage are critical for tunnel safety management.
Conventional leakage detection primarily relies on visual inspection and periodic monitoring. While operationally simple, these methods face inherent limitations: stains on lining surfaces and inadequate tunnel lighting often impede reliable differentiation between leakage zones and stained areas. During large-scale, long-term monitoring—exemplified by the Khimti Headrace Tunnel (Nepal) where geological logs were recorded at 5–20 m intervals over its 7.88 km length—inspectors encounter substantial accuracy challenges [8]. Moreover, methodological subjectivity stems from inter-inspector variability [9,10]. As tunnel construction scales expand and monitoring requirements intensify, traditional approaches increasingly fail to meet modern demands for precision and efficiency.
Recent advances in deep learning for medical image segmentation have prompted applications in structural defect detection [11,12,13,14,15]. Current tunnel leakage identification predominantly employs CNN-based semantic segmentation. Although CNNs effectively integrate multi-level features for object recognition, studies indicate their bias toward local textures over global shapes [16], hindering accurate leakage detection in complex tunnel environments. Similarly, standalone Transformer-based models exhibit degraded local feature representation due to absent CNN-like inductive biases [17]. Thus, most existing leakage detection models demonstrate constrained capability in segmenting target fine contours under complex conditions.
To overcome the subjectivity and inefficiency of manual inspection, as well as the inadequate recognition accuracy of existing models in challenging environments, a Vision Transformer (ViT) was integrated into the UNet architecture. By embedding SE-Block modules at both the encoder-decoder skip connections and the ViT output layers, the SE-TransUNet model is proposed. The model is trained on a hybrid leakage dataset comprising mountain drill-and-blast tunnels and shield tunnels. Ablation studies and Score-CAM heatmaps confirm the effectiveness and contribution of the SE-Block and ViT modules. This work proposes a novel approach for tunnel leakage identification, offering methodological insights for related research.

2. SE-TransUNet Water Seepage Detection Model

This section details the tunnel lining leakage identification methodology. The SE-Block serves as the integrated attention mechanism module, performing channel-wise weighting on the global semantic features output by the Vision Transformer (ViT). These weighted features are subsequently incorporated during skip connections between the encoder and decoder. Consequently, the network architecture comprises three core components: (1) a TransUNet-based encoder for leakage identification, (2) a TransUNet-based decoder for leakage identification, and (3) skip connections enhanced with the SE-Block module.

2.1. Overall Model Architecture of Water Seepage Recognition

The TransUNet network forms the foundational architecture, leveraging both UNet’s capability to extract leakage region features and ViT’s capacity to encode global feature positions in tunnel lining images. This dual mechanism enables TransUNet to accurately capture global contextual information of leakage areas. The proposed architecture consists of three key elements: an encoder, a decoder, and skip connections. The proposed model structure is illustrated in Figure 1. Specifically, Transformers excel at extracting global features through their self-attention mechanism, but are intrinsically limited to unidirectional positional awareness, neglecting multi-faceted perspectives of local features. Conversely, traditional CNN-based UNet architectures demonstrate proficiency in local feature extraction but lack comprehensive capacity for capturing fine-grained details.
To address these limitations, Vision Transformer (ViT) layers were integrated into the UNet framework, forming a TransUNet architecture. This integration refines leakage feature maps within the Transformer module, enabling more nuanced and precise global feature extraction. Furthermore, the SE-Block incorporated in skip connections optimizes feature transmission from the encoder, facilitating more accurate reconstruction of leakage feature maps during decoding.
Consequently, the SE-TransUNet architecture synergizes the advantages of Vision Transformer and UNet frameworks. By enhancing both local and global information processing, it yields a comprehensive leakage identification model capable of effective feature extraction from leakage images.

2.2. SE Channel Attention Mechanism

The SE-Block (Squeeze-and-Excitation block), proposed by Hu et al. [18] in 2017, establishes dependencies among feature channels. Beyond conventional CNN properties like local connectivity and weight sharing, the SE-Block module learns inter-channel relationships to derive channel-wise weights, highlighting informative feature channels while suppressing less relevant ones for the target task. This mechanism enhances neural network performance [19] and enables effective extraction of critical features from leakage images. The SE-Block structure comprises four components, as illustrated in Figure 2.
(1)
Transformation
A standard convolutional operation generates uncalibrated feature maps U R H × W × C , where H, W, and C denote the height, width, and channel dimensions, respectively.
(2)
Squeeze Operation
Global Average Pooling (GAP) aggregates spatial information within each channel to produce channel-wise statistics z R C . For the c-th channel:
z c = F squeeze ( u c ) = 1 H × W i = 1 H j = 1 W u c ( i , j ) .
This eliminates spatial interference while preserving inter-channel relationships, forming a compressed descriptor that can capture global contextual information for the identification of water leakage in tunnel secondary lining.
(3)
Excitation Operation
A gating mechanism with two fully connected (FC) layers learns nonlinear channel dependencies:
s = F excitation ( z , W ) = σ [ g ( z , W ) ] = σ [ W 2 δ ( W 1 z ) ] .
where W 1 R ( C / r ) × C and W 2 R C × ( C / r ) are learnable weights, δ() denotes ReLU activation, σ() is the sigmoid function, and r is a reduction ratio controlling model complexity.
(4)
Scale Operation
The learned channel-wise weights s are applied to the original feature map U via element-wise multiplication across channels, generating the recalibrated output X ˜ :
x ˜ c = F scale u c , s c = s c u c .
X ˜ = [ x 1 ˜ , , x c ˜ , , x c ˜ ] .

2.3. Encoder of Water Seepage Recognition Model

The encoder component of the model primarily integrates ResNet50 and Vision Transformer (ViT). ResNet50, a classical residual network, mitigates the vanishing gradient problem in deep network training through residual blocks, enabling effective training with increased convolutional layer depth. Tunnel leakage scenarios exhibit complex and diverse features that require deep networks to hierarchically extract low-level to high-level features. The residual architecture of ResNet50 ensures effective deep feature learning, providing high-quality foundational feature inputs for subsequent modules (e.g., ViT).
Upon image input, features are initially processed through ResNet50’s first three convolutional layers for progressive local feature extraction, followed by deep feature extraction via the Vision Transformer module. This establishes an encoding paradigm where ResNet captures multi-scale local features while ViT extracts global semantic representations, as depicted in the left structure of Figure 1.
(1)
ResNet50 Submodule Analysis
In the leakage identification encoder, ResNet50 is divided into four submodules (encoder1–encoder4). Taking a 512 × 512-pixel RGB image as an input example, the output feature dimensions, and channel counts of each submodule are specified in Table 1.
(2)
ViT Module Analysis
The ViT module processes higher-level features from ResNet within the encoder through patch partitioning, embedding, Transformer encoding, and upsampling to generate global semantic-enhanced features. The detailed procedural steps are provided in Table 2.

2.4. Decoder of Water Seepage Recognition Model

The decoder part of the model mainly includes upsampling layers, SENet channel attention modules, and VGGBlock convolution blocks. The upsampling layer uses bilinear interpolation (scale_factor = 2) to gradually enlarge the size of the feature map. The SENet module is used to suppress redundant channels and enhance key semantic channels. The VGGBlock convolution block is used to fuse the spliced multi-scale features and extract local details. Assuming that the four-level feature layers output by the encoder are x1 (output by encoder1), x2 (output by encoder2), x3 (output by encoder3), and xvit (output by ViT), the specific data processing flow is shown in Table 3.

3. Construction of Tunnel Water Seepage Dataset

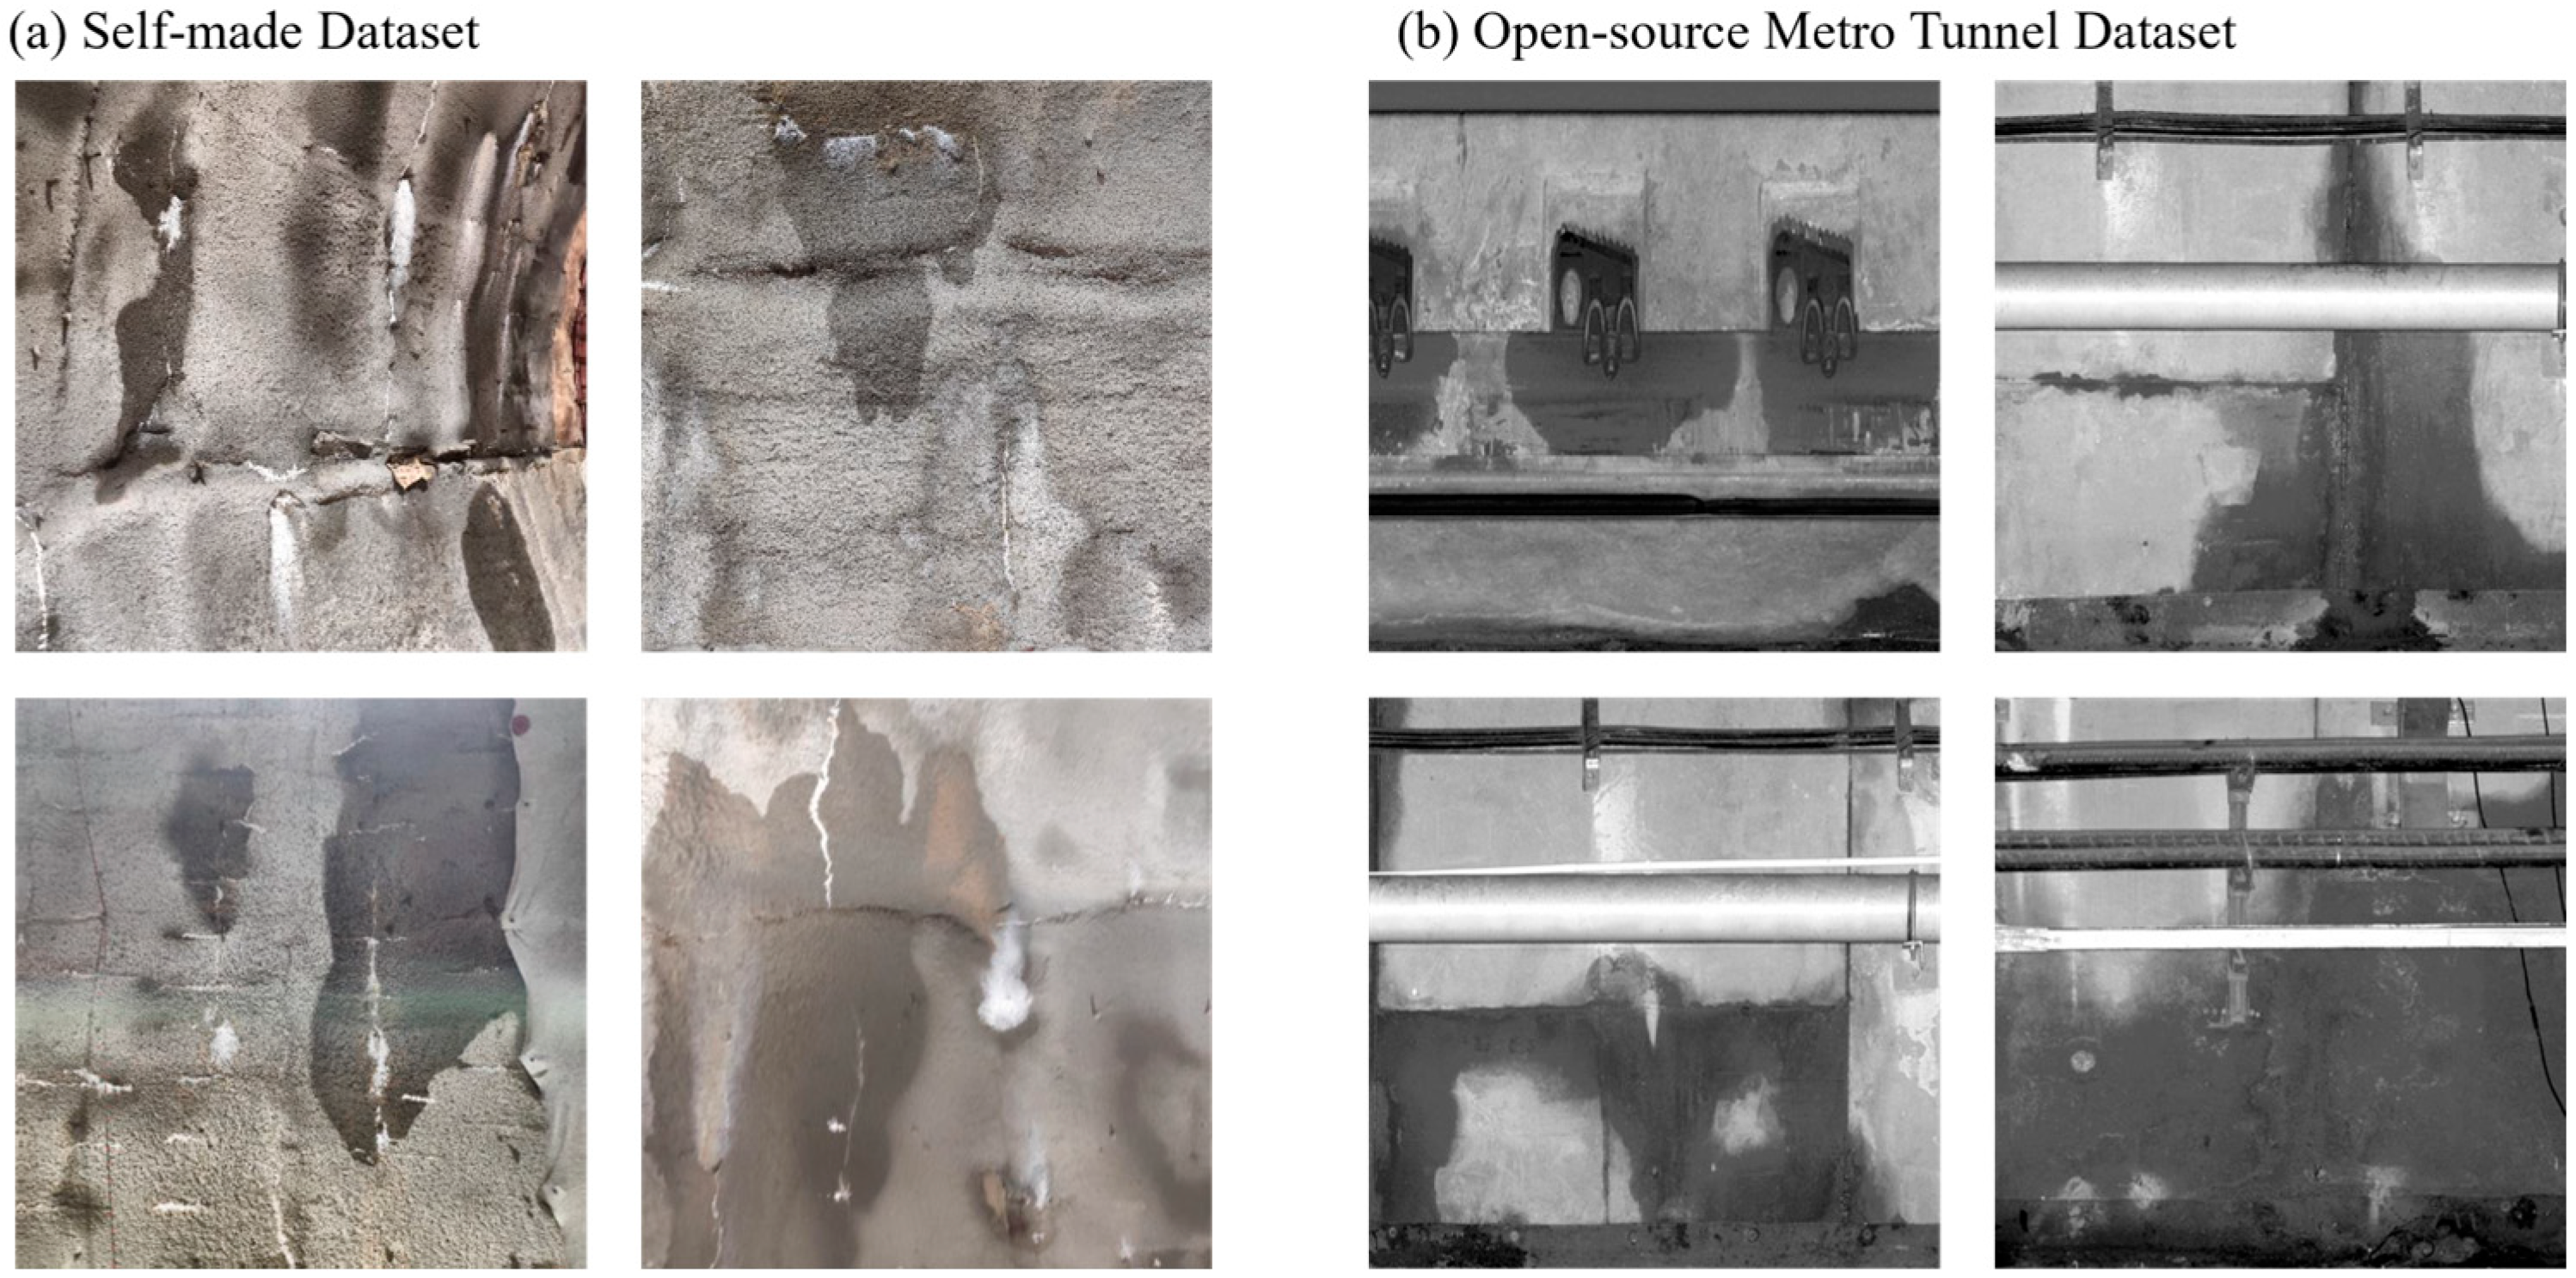
3.1. Collection of Tunnel Water Seepage Images

The leakage dataset was collected from the full-scale mountain drill-and-blast tunnel model at Central South University’s Pingtang Experimental Base and a public shield tunnel leakage dataset (https://data.mendeley.com/datasets/xz2nykszbs/1 accessed on 11 June 2020) [20]. Incorporating data from both mountain drill-and-blast tunnels and metro shield tunnels enhances model generalization capability. Representative leakage images are shown in Figure 3.
The collected leakage images exhibit spot leakage, linear leakage, and large-area leakage phenomena. Secondary lining images from mountain tunnels present challenges including blurred leakage boundaries, extensive shadows, surface irregularities, and high-intensity lighting interference—all complicating image segmentation. Shield segment images from metro tunnels contain confounding elements such as pipelines, bolt holes, lighting fixtures, and cables, coupled with uneven illumination distributions that impede segmentation accuracy.

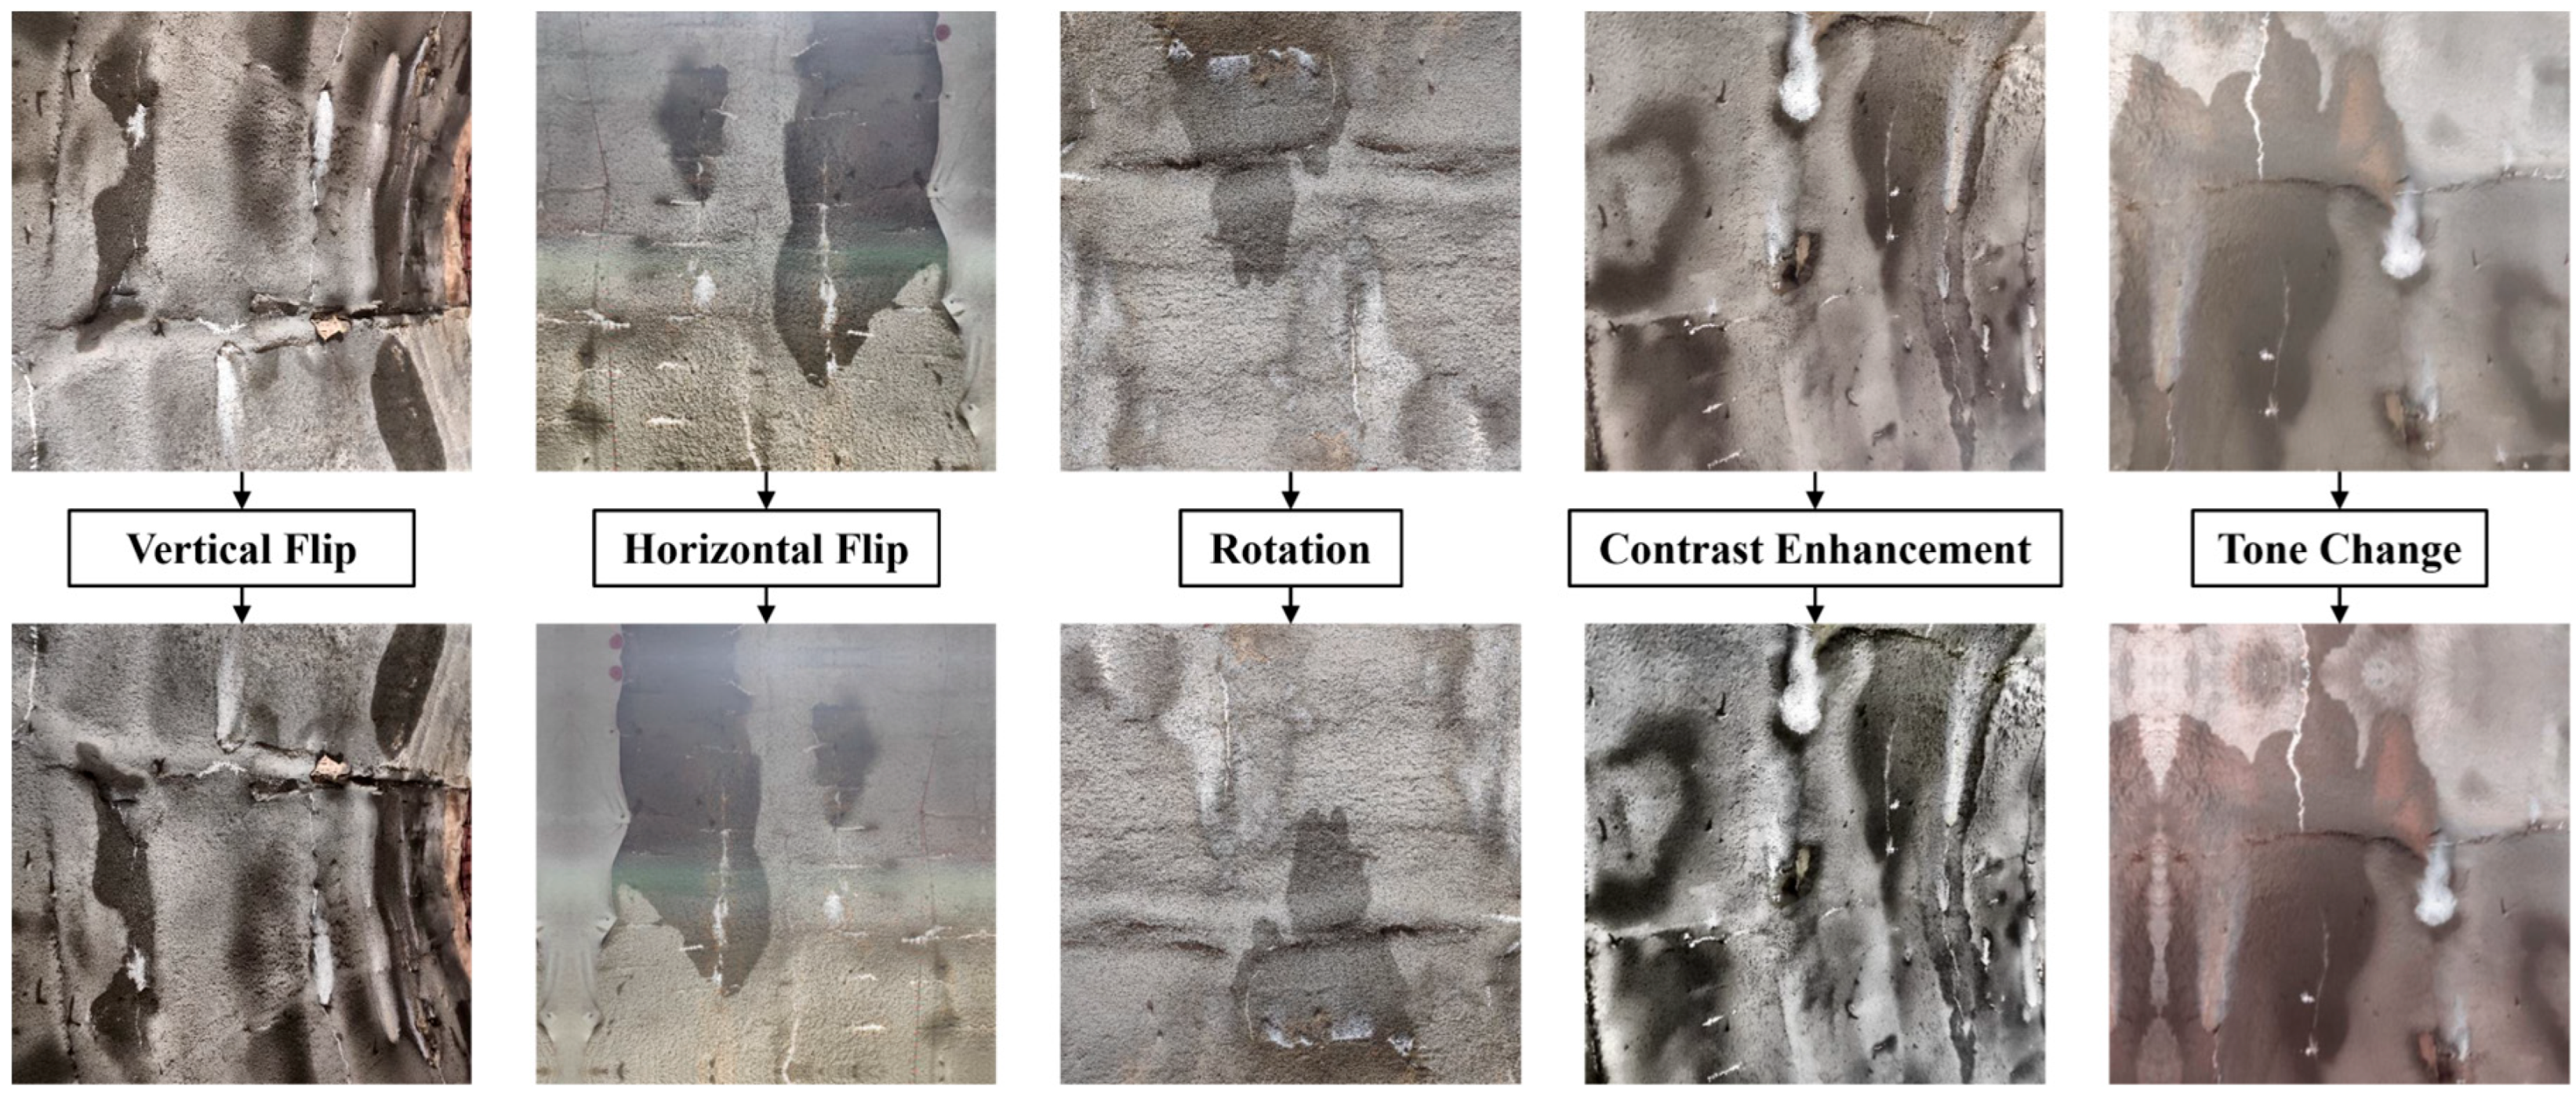
3.2. Data Enhancement Method

Employing Python’s albumentations library, data augmentation was performed through random flipping, rotation, cropping, scaling, contrast enhancement, and hue modification. This process yielded a diversified leakage dataset of 1520 images to enhance model generalization capability and robustness. The data augmentation methodology is illustrated in Figure 4.

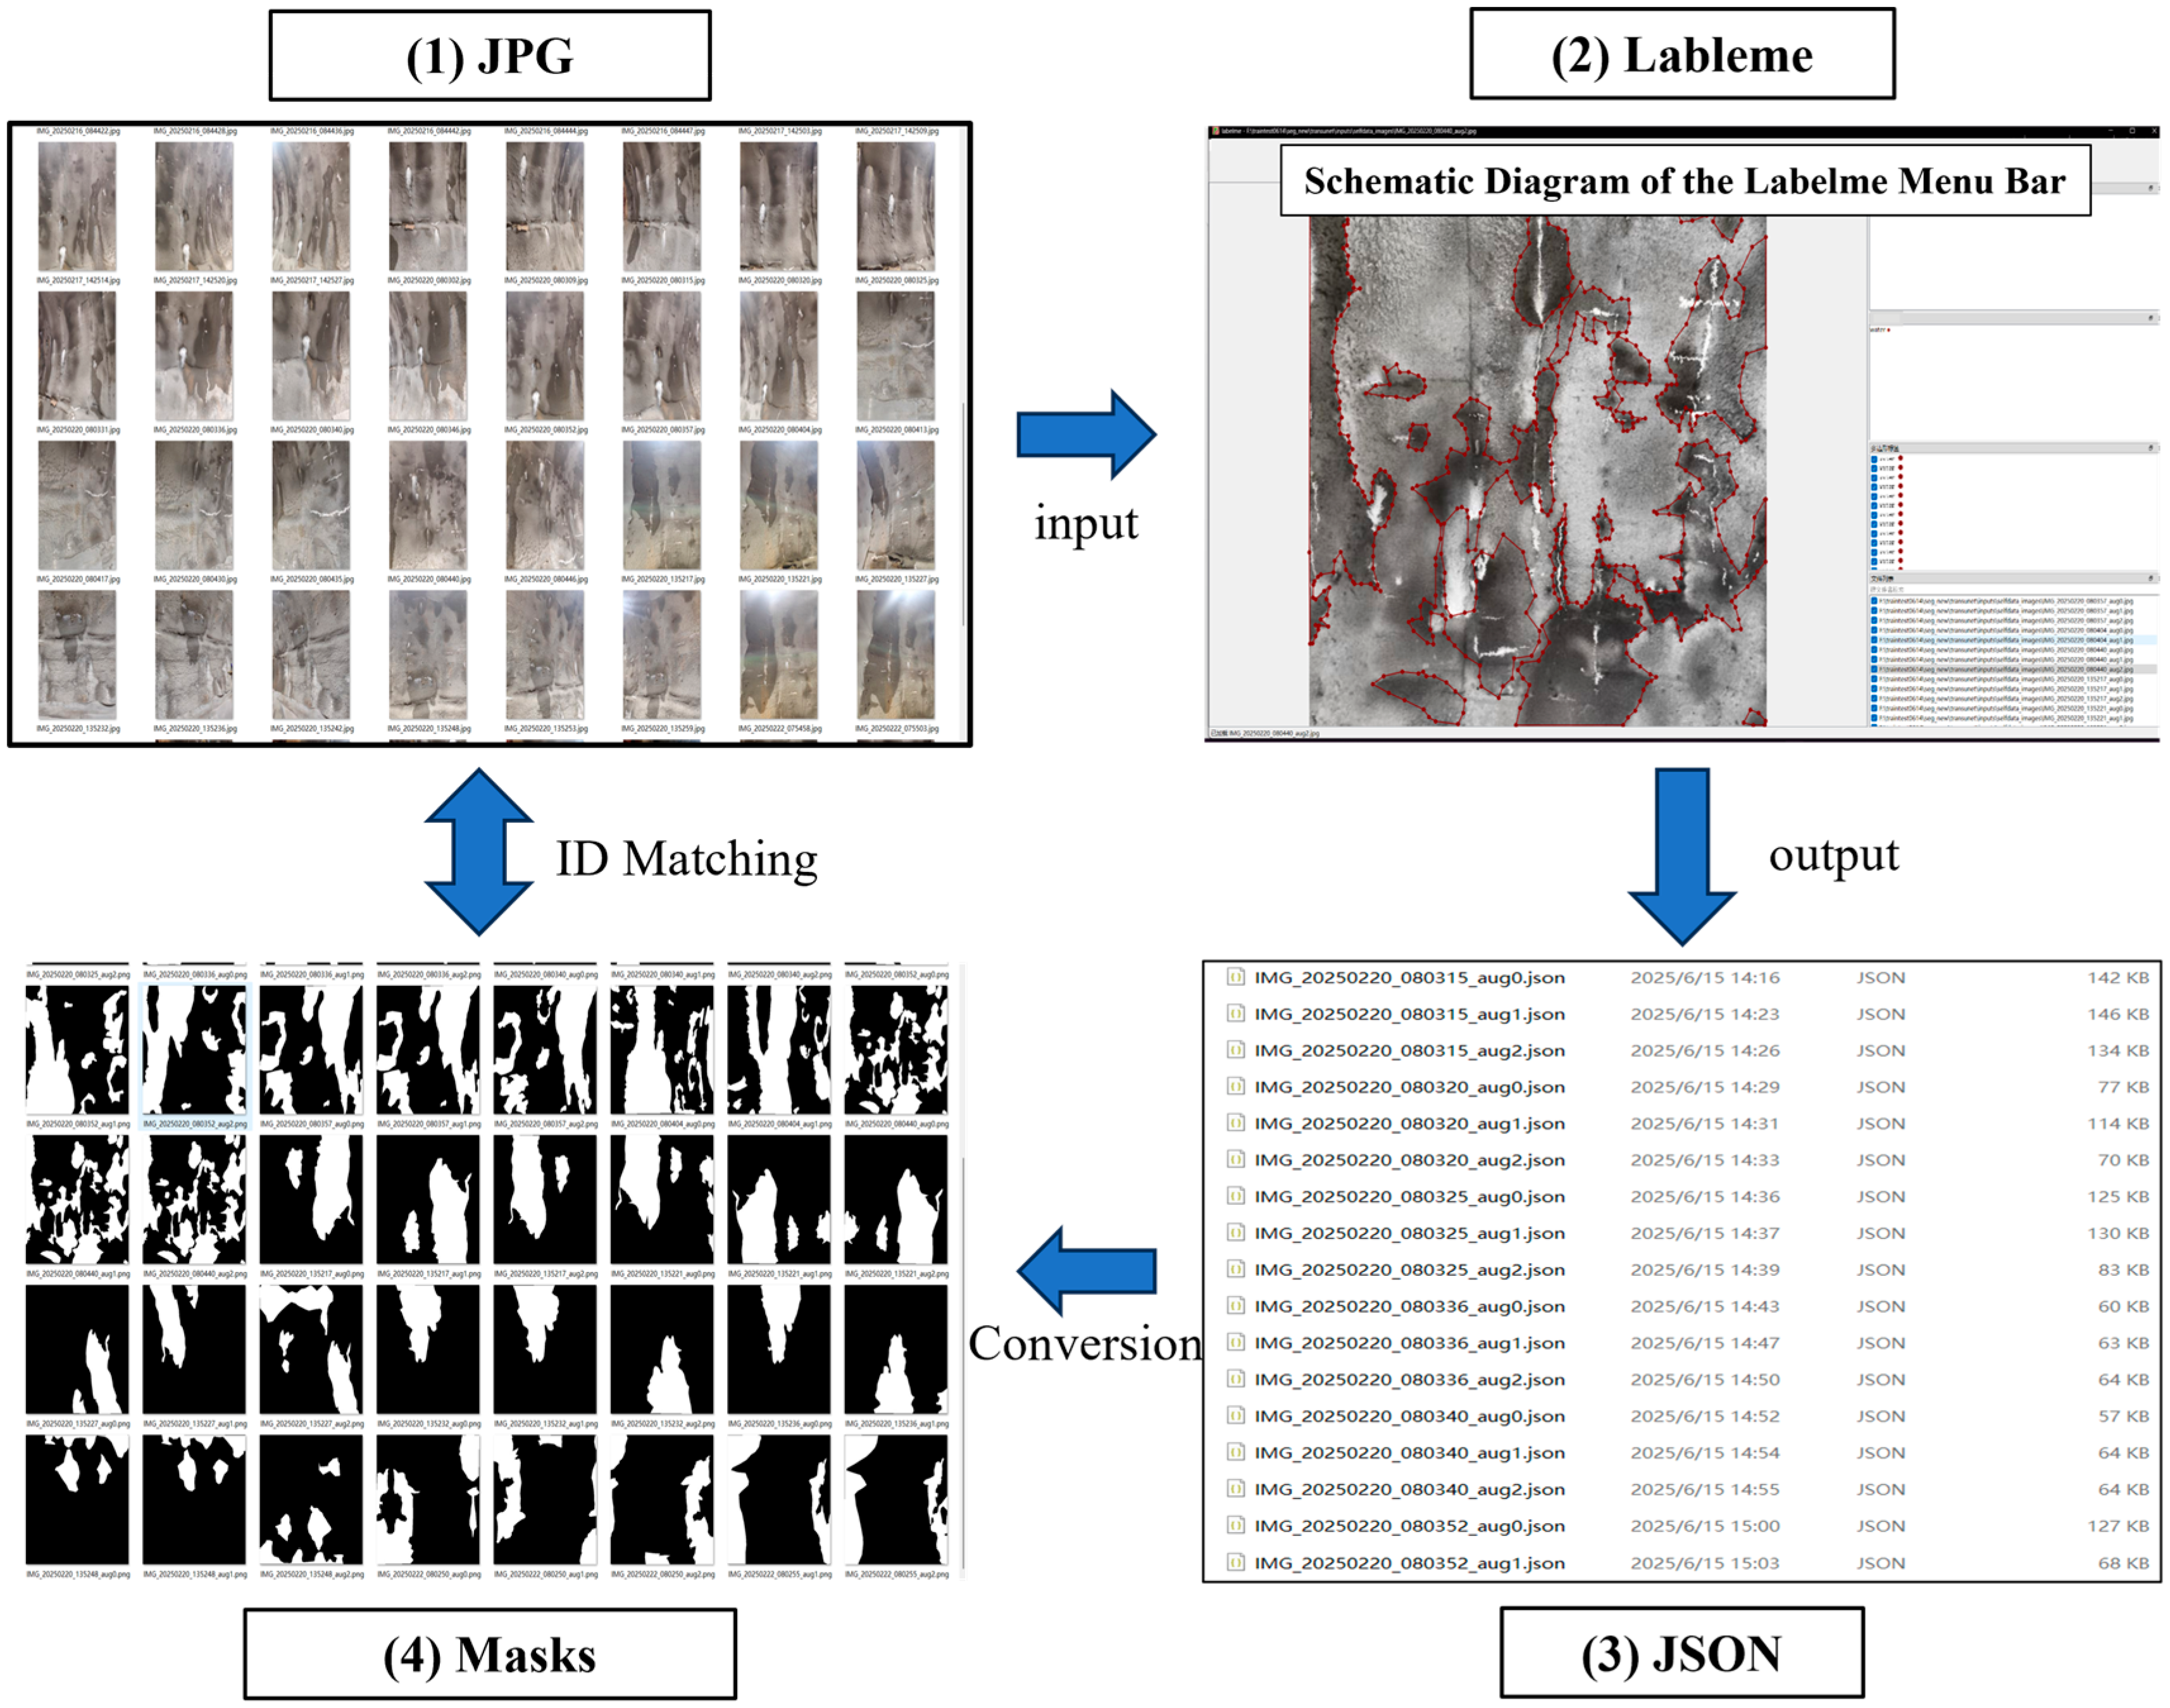
3.3. Image Annotation

The augmented images in JPG format were annotated using Labelme, which generated corresponding JSON files. A custom Python script then converted these JSON files into the required format, ultimately producing mask files suitable for training. The complete image transformation workflow is depicted in Figure 5. Finally, statistical analysis was performed on the leakage types within the augmented dataset, with results presented in Table 4.

4. Model Training

4.1. Training Environment

The experiments were conducted on a Windows 11 64-bit operating system using Python v3.11.9 and CUDA v12.6. Model training and testing were implemented in PyCharm 2024.2.1 (Community Edition) IDE based on the PyTorch 2.4.1 deep learning framework. The computational hardware comprised: 32 GB RAM operating at 2133 MHz, a 12th generation Intel® Core™ i5-12600KF CPU (3.70 GHz), and an NVIDIA GeForce RTX 3070-8G graphics processing unit (GPU).

4.2. k-Fold Cross-Validation Setup

k-fold cross-validation maximizes data utilization for model evaluation [21]. This method reserves a portion of samples as the test set, while randomly partitioning the remainder into k mutually exclusive subsets of equal size. For each iteration, k-1 subsets serve as the training set, with the remaining subset used for validation—rotating this process k times. Considering the dataset size and computational costs, 5-fold cross-validation (k = 5) was adopted. The dataset was divided into 5 subsets via stratified sampling, with 4 subsets constituting the training set and 1 subset as the test set. Each subset maintained identical leakage type distributions as the original dataset without sample duplication: spot-type leakage (21.45%), linear leakage (22.70%), area-type leakage (19.47%), and mixed-type leakage (36.38%). This prevented data distribution bias from influencing the results. Each subset contained 304 images, yielding 1216 training images (4 folds) and 304 validation images (1 fold). The 5-fold cross-validation scheme is illustrated in Figure 6.
During validation, model weights were reinitialized before each experimental run while maintaining identical hyperparameters, ensuring data partitioning remained the sole variable. To guarantee sufficient model convergence, the training epoch count was set to 100. Within memory constraints, the batch size was fixed at 8. The Adam optimizer with cosine annealing decay was employed during training: The initial learning rate was set to 1 × 10⁻⁴, and weight decay (L2 regularization coefficient) to 1 × 10⁻³ to constrain the parameter scale, preventing overfitting to tunnel background noise while preserving sensitivity to faint leakage features. The learning rate decayed following a cosine curve, decreasing to a minimum of 1 × 10⁻⁵. Additionally, an adaptive learning rate adjustment strategy was implemented: If validation loss failed to decrease for three consecutive epochs, the learning rate was halved.

4.3. BCE-Dice Loss Function

The binary cross-entropy loss (BCE) and Dice loss are combined to form the loss function of this study. The BCE loss focuses on the classification correctness of each pixel and provides strong supervision for the prediction of foreground and background, while the Dice loss pays more attention to the overlap between the predicted area and the real area and is more robust to the problem of class imbalance. For a single sample, LossBCE is defined as:
Loss BCE ( p , t ) = [ t log ( p ) + ( 1 t ) log ( 1 p ) ] .
where p is the predicted probability, which is converted to [0, 1] by the sigmoid function; t is the target label (0 or 1).
The Dice coefficient is an index to measure the overlap of two sets, defined as:
Dice = 2 | X Y | | X | + | Y |
where X is the predicted area and Y is the real area. In the semantic segmentation task, the Dice coefficient can be expressed as:
Dice = 2 i p i · t i + ε i p i + i t i + ε .
where ε is added to avoid the denominator being zero, and ε is taken as 1 × 10⁻⁵. Then the Dice loss is defined as:
Loss Dice = 1 Dice .
Finally, the BCE-Dice loss function can be obtained as:
Loss BCE - Dice ( p , t ) = α · Loss BCE ( p , t ) + β · Loss Dice ( p , t ) .
where α is the weight of BCE, and the value is 0.5; β is the weight of Dice, and the value is 1. The weight configuration (α = 0.5, β = 1) integrates Dice loss advantages in handling class imbalance and optimizing region overlap with BCE loss’s strong pixel-wise supervision. This dual approach addresses tunnel leakage identification requirements—small targets, strong interference, and precise boundary delineation—thereby enhancing model segmentation performance.

4.4. Evaluation Indicators

Model evaluation indicators are used to quantitatively analyze the segmentation results of lining water seepage, and each evaluation indicator is calculated through the test set samples. The evaluation indicators mainly include: IoU (Intersection over Union), Dice (Dice coefficient), Recall, Precision, AUC (Area Under the Curve), MCC (Matthews Correlation Coefficient), and F1-score. The specific calculation formula of IoU is as follows:
IoU = | A B | | A B | .
where A represents the prediction result area, B represents the real label area, |AB| is the size of the intersection area of the two, and |A U B| is the size of the union area of the two. The specific calculation formula of AUC is as follows:
AUC = 1 2 i = 1 n ( F P R i F P R i 1 ) ( T P R i + T P R i 1 ) .
where the false positive rate (FPR) is the abscissa of the ROC curve, and the true positive rate (TPR, that is, Recall) is the ordinate of the ROC curve. The formula involves the calculation of TPR and FPR under different thresholds, and AUC is the integral approximation of the area under the ROC curve. The specific calculation formulas of the remaining indicators are as follows:
Recall = T P T P + F N .
Precision = T P T P + F P .
MCC = T P × T N F P × F N ( T P + F P ) ( T P + F N ) ( T N + F P ) ( T N + F N ) .
F 1 - Score = 2 × Precision × Recall Precision + Recall .
where TP represents the positive samples correctly classified; TN represents the negative samples correctly classified; FP represents the negative samples incorrectly classified; FN represents the positive samples incorrectly classified.

5. Analysis of Training Results

5.1. Performance Analysis of the SE-TransUnet Model

(1)
loss function
The loss function for each training epoch is shown in Figure 7, indicating that the model converges around epoch 85.
(2)
Analysis of k-fold cross-validation results
Various metrics of the validation set from five rounds of experiments are presented in Table 5. Some of these metrics are visualized as boxplots in Figure 8, where the mean values are marked with red asterisks and the median values are indicated by red lines. As shown in Table 5, the mean values of IoU, Precision, F1-score, and FPS for the model are 0.8318, 0.8480, 0.9218, and 6.53, respectively. The standard deviations of the model’s various accuracy metrics are generally around 0.02, indicating a low overall level of variability.
As shown in Figure 8, among the precision metrics, Recall achieved a mean value of 0.9394 (SD = 0.0221) with the largest interquartile range (0.92–0.97), reflecting effective false-negative control. Precision attained a mean of 0.8480 and exhibited the second-smallest box height after Recall, indicating robust accuracy. However, its performance was marginally lower than Recall due to limited false-positive introductions accompanying high recall rates. IoU and Dice demonstrated narrower box distributions (ensuring prediction consistency) but lower mean values. Their mean scores were similar (0.8318 and 0.8304, respectively), with distributions generally below Recall and Precision. Dice showed the most compact box distribution (SD = 0.0204), indicating stable regional similarity assessment. Conversely, IoU displayed the largest dispersion among all metrics (SD = 0.0224), suggesting greater susceptibility to interference in intersection-over-union predictions between actual leakage regions and masks.

5.2. Comparison of Results of Various Models on the Test Set

To evaluate the performance of SE-TransUNet, comparative experiments were conducted against several commonly used semantic segmentation models, including TransUNet [22], UNet [23], DeeplabV3plus [24], SegNet [25], BiSeNetV2 [26], FPN [27], DoubleUNet [28], NestedUNet [29], and Swin-UNet [30]. All models were trained and tested under the same hyperparameter settings and loss functions, with the model architecture being the only variable. The average values of various evaluation metrics on the test set for each model are summarized in Table 6. To assess the effect of incorporating the SE module into the original TransUNet architecture, a paired t-test was conducted between SE-TransUNet and TransUNet. The statistical results are presented in Table 7, with the degrees of freedom (df) of the paired t-test equal to 4. A significance level of α = 0.05 was used, and p-values below this threshold were considered statistically significant.
As shown in Table 6, notable performance differences are observed among the models. SE-TransUNet achieves the highest IoU and Recall, indicating improved overall coverage and reduced omission in leakage detection compared to other models such as UNet and DeepLabV3plus. UNet reports the highest Dice score (0.8631), reflecting its strength in boundary-level similarity segmentation. FPN outperforms others in terms of Precision and AUC, suggesting more stable probabilistic predictions. In terms of inference efficiency and computational complexity, there is a clear inverse relationship between model parameter size and FPS. BiSeNetV2 has the fewest parameters and the highest FPS, but its segmentation accuracy is relatively lower. SE-TransUNet, with the highest parameter count and lowest FPS, exhibits slightly better accuracy metrics.
Table 7 further indicates that SE-TransUNet shows a statistically significant improvement over TransUNet in IoU and Recall, which reflects more complete leakage detection and better control of missed areas, albeit at the cost of reduced inference speed. No significant differences were found in other metrics such as Dice. In practical applications, model selection should be guided by the trade-off between detection accuracy and computational efficiency, depending on the specific requirements of the deployment scenario.

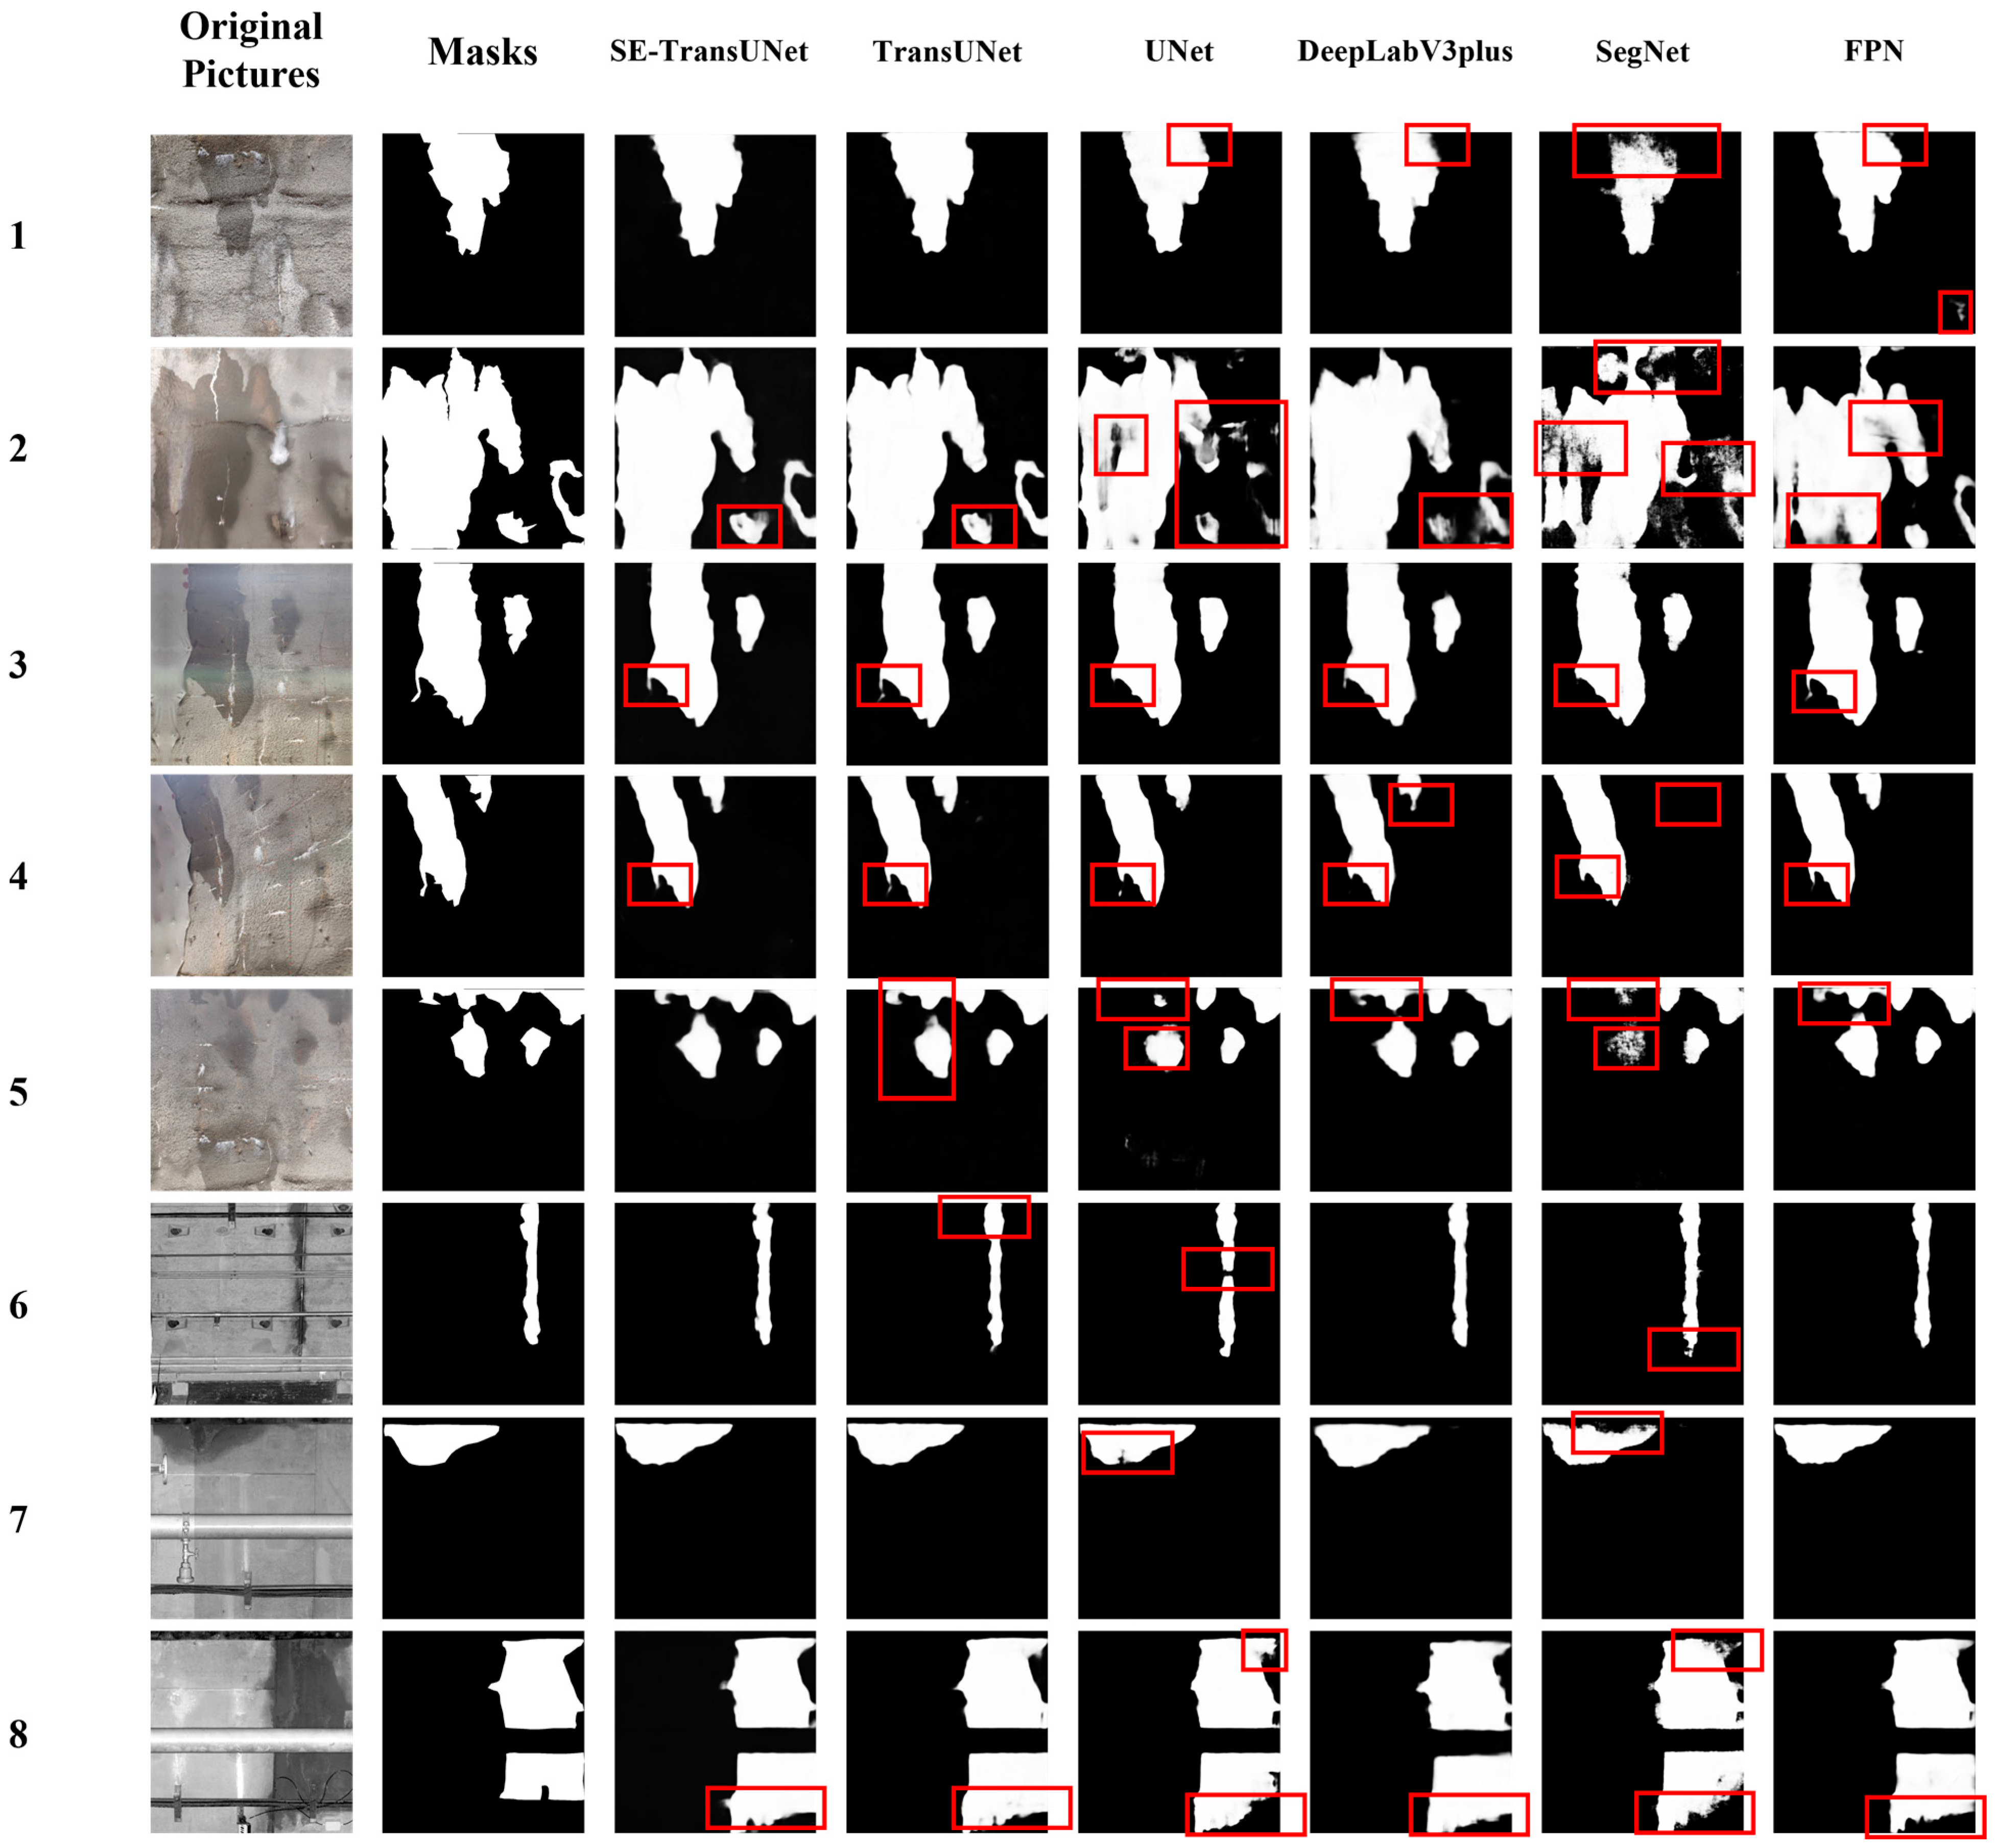
5.3. Analysis of Visual Segmentation Results

To visually assess the semantic segmentation performance of the models on leakage regions, this study compared the prediction results of SE-TransUNet with those of TransUNet, UNet, DeepLabV3plus, SegNet, and FPN using real annotated masks as the ground truth, as shown in Figure 9. Deviations between the predicted outputs and ground truth masks were highlighted with red bounding boxes to illustrate the differences among models.
The results show that in Case 1, where the lining surface contains shadowed indentations, SE-TransUNet, TransUNet, and UNet all demonstrated relatively accurate segmentation, whereas SegNet exhibited noticeable edge blurring. In Case 2, characterized by surface contamination such as white spots and color patches, only SE-TransUNet and TransUNet maintained effective segmentation, while the other models exhibited false negatives and false positives. In Case 5, where the water stain was faint and poorly contrasted with the background, TransUNet produced blurred edges, while SE-TransUNet achieved more precise segmentation. For Case 6, involving linear water leakage, SE-TransUNet produced segmentation results that better preserved fine details and more closely aligned with the ground truth than those of TransUNet. In Case 8, which featured partially occluded block-shaped leakage areas, both SE-TransUNet and TransUNet presented varying degrees of deviation but were able to correctly identify the occluded regions.
Overall, across all cases, the segmentation outputs of SE-TransUNet were more closely aligned with the annotated masks compared to those of the other models evaluated.

6. Ablation Experiments

To evaluate the effectiveness of the SE-Block modules integrated into SE-TransUNet, ablation experiments were conducted by progressively removing the SE-Block components from the model. The ViT module was also removed in the final step to assess the overall impact of the proposed modifications relative to the original architecture. The ablation experiment procedure is illustrated in Figure 10.

6.1. Analysis of Ablation Experiment Results

The evaluation indicators of the benchmark SE-TransUNet model and each ablated model in the test set are shown in Table 8.
As shown in Table 8, the removal of the shallow SE-Block1 led to a decrease in IoU to 0.8159, accompanied by slight declines in Recall and other related metrics, indicating its supportive role in low-level feature extraction. When the intermediate SE-Block2 and SE-Block3 were removed, the IoU dropped further to 0.7974 and 0.7948, respectively, suggesting a substantial reduction in segmentation performance and highlighting the importance of mid-level feature enhancement and global context integration. The removal of the deepest SE-Block4 resulted in a marginal decrease in IoU to 0.7864, while the Dice coefficient increased to 0.8471. Upon removing the ViT module, IoU further declined to 0.7614, while Dice increased to 0.8631, indicating that ViT primarily contributes to global region segmentation, whereas its removal may lead the model to focus more on boundary precision.
Overall, the integration of SE and ViT modules into the baseline model contributes positively to the accuracy of leakage detection in tunnel linings. The baseline model achieves an IoU that is 4.50% higher than the variant without SE modules, and 7.04% higher than the variant with both SE and ViT modules removed.

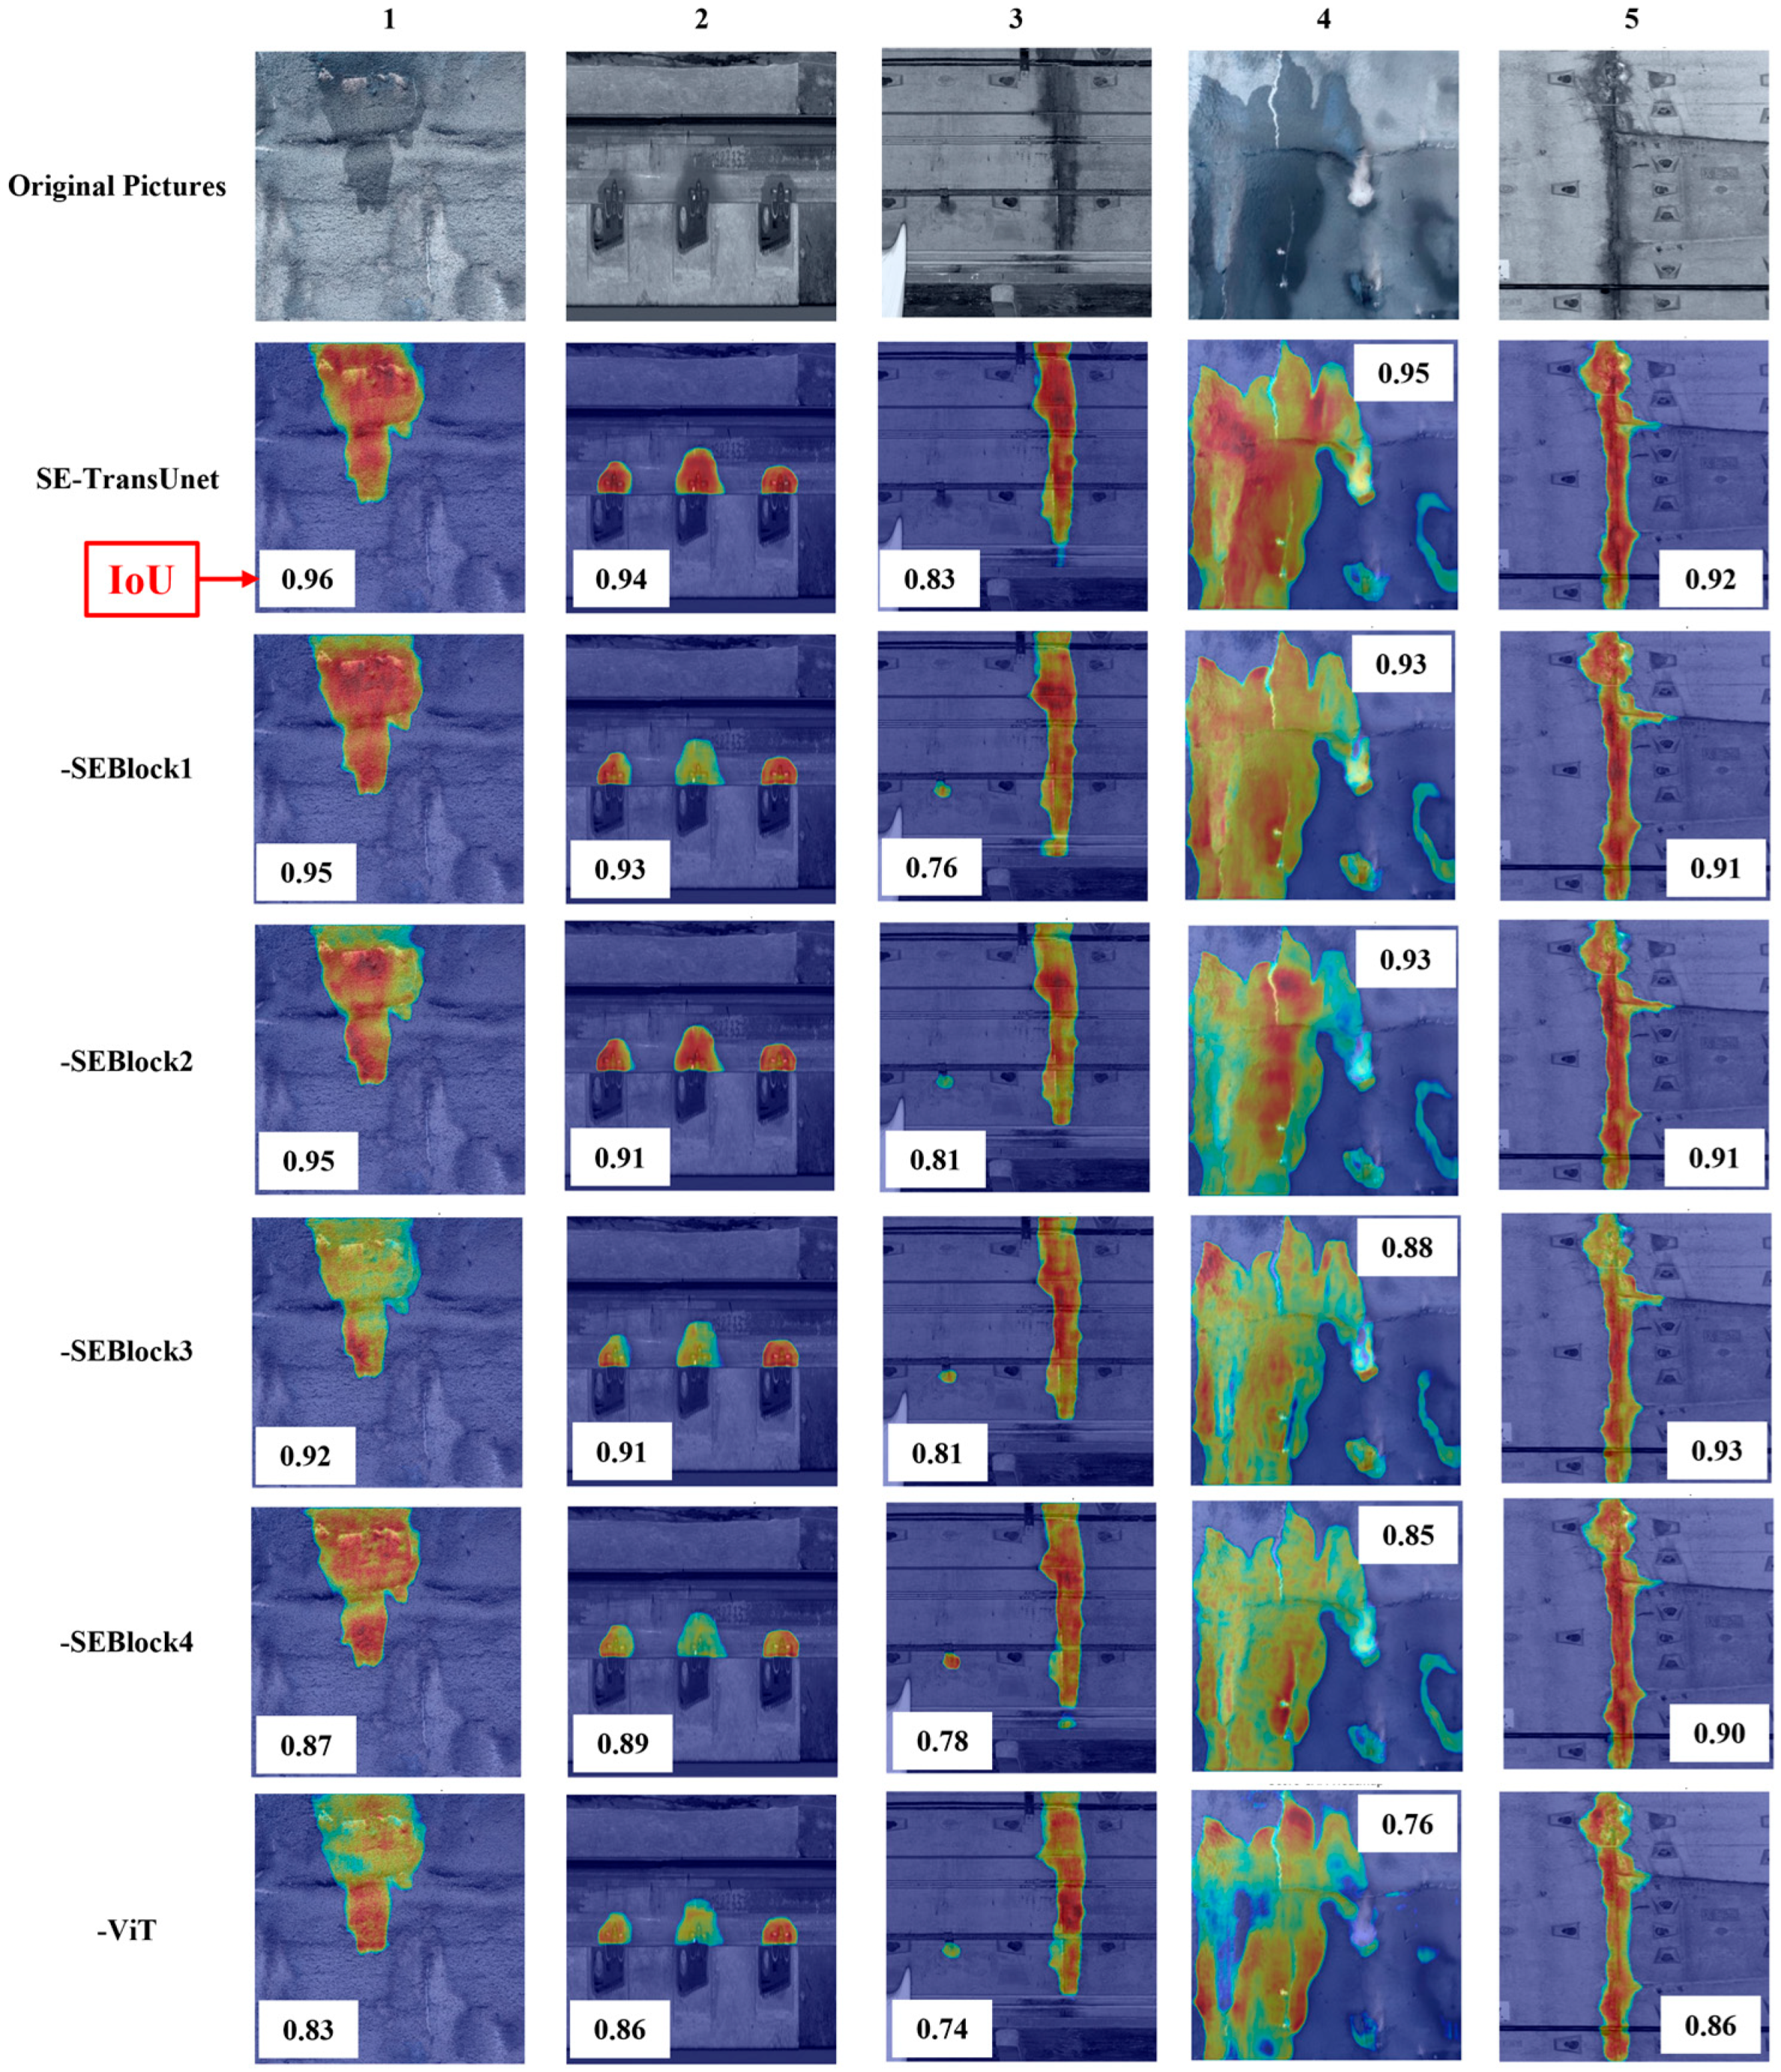
6.2. Analysis of Heatmaps from Ablation Experiments

Score-CAM [31] is a heatmap generation technique used for neural network visualization, aiming to accurately localize the regions in an image that contribute most to the model’s prediction, without relying on gradient information from backpropagation. Compared to traditional Class Activation Mapping (CAM) methods, Score-CAM offers the advantage of replacing gradient-based weighting with a combination of activation maps, thereby reducing dependency on feature gradients and enhancing the stability and interpretability of the visualization results [32]. The computation principle is defined in Equation (16):
H l k = σ U P A l k C l k = f X H l k f ( X )   .
where A l k represents the size of the output feature map; l represents the output feature level; k represents the number of channels corresponding to each feature layer; σ ( ) is the sigmoid activation function, which is used to normalize the value interval of the feature map; H l k represents the size of the original output image; f ( X ) is the input feature map, and f ( X H l k ) is the weighted result of the input feature map. C l k is the attention area of the model for the input image.
Finally, the Score-CAM heatmap of the baseline SE-TransUNet model is presented in Figure 11. The values within the white boxes indicate the corresponding IoU scores. In the heatmap, regions with more intense red coloration represent areas that the model identifies as contributing more significantly to the prediction, indicating higher attention.
(1)
Heatmap Analysis of Image 1: Area-Type Leakage
This scene involves area-type leakage at the arch-waist region of the tunnel, where the leakage appears as irregular patches with blurred boundaries against the surrounding damp concrete. The background also contains distinct construction textures. The baseline SE-TransUNet model achieved an IoU of 0.95. In the heatmap, the leakage area is continuously covered by red and dark yellow regions, and the edges align well with the ground truth, indicating the model’s ability to distinguish leakage from damp background areas. After removing SE-Block components, the IoU of the variant models decreased. In particular, when SE-Block3 was removed, the high-confidence regions in the heatmap shrank to light green. When the ViT module was removed, the IoU dropped to 0.82, and evident omissions were observed along the leakage boundaries in the heatmap.
(2)
Heatmap Analysis of Image 2: Spot-Type Leakage
This scenario contains three discrete spot-type leakages, each approximately 2–5 cm in diameter. The grayscale contrast between the leakage spots and the surrounding concrete is low, and the background includes surface defects such as honeycombs, which may interfere with detection. The SE-TransUNet model achieved an IoU of 0.94. Each leakage spot is clearly enclosed by a distinct dark yellow region in the heatmap, with well-defined boundaries and minimal background interference, indicating the model’s ability to focus on small-scale leakage features. After removing SE-Block modules, the IoU decreased to 0.89, and the middle leakage spot’s yellow activation region disappeared. When the ViT module was removed, the IoU further dropped to 0.86, and the leakage regions in the heatmap appeared with blurred edges.
(3)
Heatmap Analysis of Image 3: Linear Leakage
This scenario involves linear leakage distributed along a concrete joint. The leakage path is narrow and continuous, with rough textures present on both sides of the joint, increasing the risk of confusion with non-leakage joints. The SE-TransUNet model achieved an IoU of 0.83. In the heatmap, the linear leakage is visualized as a continuous dark yellow strip, maintaining high confidence even at joint bends. After removing all SE-Block modules, the IoU decreased to 0.78. The heatmap showed interruptions in the leakage representation at the joint bends, and false positive responses in the form of spot-like leakages appeared on the left side.
(4)
Heatmap Analysis of Image 4: Mixed-Type Leakage
This case presents a mixed-type leakage scenario in the tunnel arch-waist region, characterized by irregular patch-shaped leakage with blurred boundaries and strong background textures from construction. The baseline SE-TransUNet model achieved an IoU of 0.95, and the leakage area was continuously highlighted in red and dark yellow in the heatmap, closely matching the actual leakage boundaries. After SE-Block components were removed, all variant models showed decreased IoU. In particular, removal of SE-Block3 led to a shrinkage in the high-confidence regions to light green, suggesting that this module plays an important role in enhancing semantic features of area-type leakage through channel attention mechanisms, helping suppress background texture interference. Without SE-Block3, the model struggled to differentiate leakage from damp regions. The ViT-removed variant achieved an IoU of only 0.82, and its heatmap showed fragmented and dispersed yellow activations.
In summary, SE-TransUNet exhibited favorable recognition performance across typical tunnel leakage scenarios, including area-type, linear, spot-type, and mixed-form leakages. Compared with ablation variants, its heatmaps provided more complete coverage of the leakage regions. The high-response areas (in red and yellow) showed greater alignment with the annotated leakage boundaries and exhibited stronger spatial continuity, allowing for a more accurate depiction of the spatial distribution characteristics of leakages in various forms.

7. Limitations

Although the proposed SE-TransUNet model achieved relatively high detection accuracy on the constructed hybrid dataset, several limitations remain and require further investigation in future work.

7.1. Limitations of the Dataset and Annotations

The dataset used in this study is primarily composed of images from drill-and-blast tunnels and shield tunnels, with sample distributions concentrated in common leakage patterns such as area-type and linear seepage. Rare forms of leakage, such as honeycomb-like seepage or intermittent dripping, are underrepresented, potentially limiting the model’s generalization capability. Additionally, manual annotation introduces subjectivity, especially in cases involving mixed-form leakage where seepage and efflorescence coexist. In such cases, significant inter-annotator variation in IoU was observed, which can affect training accuracy. Future work should focus on constructing a multi-source heterogeneous dataset that incorporates tunnel images under various geological conditions and construction methods, alongside implementing expert consensus-based annotation to improve data quality.

7.2. Limitations in Computational Resources and Real-Time Performance

The SE-TransUNet model has a parameter count of 223 million, which is substantially higher than most of the comparative models. Classical segmentation models such as UNet (23M) and SegNet (14M) have parameter counts approximately one-tenth that of SE-TransUNet. Even compared with similar Transformer-based models like TransUNet (176M), SE-TransUNet has approximately 20% more parameters. This results in significantly longer training times and increased demands on GPU memory. In real-time detection scenarios, the model’s inference speed is approximately 6.53 frames per second (FPS), considerably lower than that of the comparison models. Lightweight models such as UNet and SegNet achieve 16–17 FPS, which is more than 2.5 times faster than SE-TransUNet. Even among Transformer-based models, TransUNet exhibits an FPS approximately 2.2 times higher than SE-TransUNet.
Thus, while SE-TransUNet meets the accuracy requirements for tunnel leakage detection, its high parameter count and low inference speed result in high training costs and challenges in real-time deployment. Future studies should explore model lightweighting strategies to better balance accuracy and computational efficiency, thereby promoting practical engineering applications.

7.3. Gaps in Interpretability and Engineering Applicability

Although heatmap visualizations aid in analyzing leakage regions, the decision-making process of the model lacks transparency. For example, the mechanism by which SE-Blocks adjust weights across specific channels is not directly linked to physical parameters such as concrete porosity or moisture gradients. This limits engineers’ ability to interpret the model’s reasoning in detecting concealed leakages. Furthermore, the model currently lacks integrated leakage severity assessment functions, such as water volume estimation or trend prediction. Future work should aim to build an end-to-end damage management system by incorporating fluid dynamics models or Internet of Things (IoT) sensor data.

7.4. Limitations in Experimental Design

The ablation study conducted in this work only validated the necessity of SE-Blocks and the ViT module but did not systematically explore other potential improvement directions. For instance, recent architectures such as Swin Transformer and ConvNeXt variants were not included in the comparative experiments, leaving the model’s performance upper bound unclear. In addition, the current study did not consider the impact of varying lighting conditions (e.g., backlight, low-light environments) on recognition accuracy. Future work will incorporate robustness testing under diverse environmental conditions.

8. Conclusions

(1)
Based on the SE channel attention mechanism, an SE-TransUNet model was proposed for tunnel lining leakage detection. Trained on a constructed hybrid leakage dataset, the model achieved average values of 0.8318 (IoU), 0.8304 (Dice), 0.9394 (Recall), 0.8480 (Precision), 0.9733 (AUC), 0.8562 (MCC), 0.9218 (F1-score), and 6.53 FPS. The model demonstrated strong generalization and robustness under challenging conditions, including shadowed indentations on the lining surface, surface contamination such as white spots and stains, shallow leakage marks with low contrast against the background, and partial occlusions.
(2)
Ablation experiments were conducted by progressively removing the SE-Block and ViT modules from the SE-TransUNet model. All evaluation metrics declined to varying extents. The variant with all SE-Blocks and the ViT module removed showed a substantial performance gap from SE-TransUNet, with an IoU difference of up to 7.04%.
(3)
Score-CAM heatmap analysis across different leakage patterns revealed that SE-TransUNet performed consistently well in detecting area-type, linear, spot-type, and mixed-form tunnel leakage. Compared with ablation variants, its heatmaps provided more complete coverage of the leakage regions, with high-activation areas more closely aligned with the true leakage boundaries and exhibiting stronger spatial continuity, thereby enabling more accurate characterization of leakage spatial distributions across diverse forms.
Although the SE-TransUNet model demonstrated relatively high accuracy in leakage detection, this study still has several limitations in terms of dataset and annotation quality, computational demands and real-time performance, model interpretability and engineering applicability, as well as experimental design. These limitations will be addressed in future work.

Author Contributions

Conceptualization, S.S. and H.W.; methodology, R.S., and L.W.; software, R.S.; validation, S.S. and H.W.; formal analysis, S.S. and H.W.; investigation, Y.W. and L.W.; resources, R.S.; data curation, S.S., H.W., and Y.W.; writing—original draft preparation, R.S.; writing—review and editing, R.S.; visualization, R.S.; supervision, Y.W.; project administration, Y.W.; funding acquisition, Y.W. and L.W. All authors have read and agreed to the published version of the manuscript.

Funding

This research was supported by Shandong Provincial Communications Planning and Design Institute Group Co., Ltd. through the Shandong Provincial Enterprise Technology Innovation Program (Grant No. 2024537010000680) and the Science and Technology Project of Shandong Provincial Communications Planning and Design Institute Group Co., Ltd. (Grant No. KJ-2023-SJYJT-16).

Institutional Review Board Statement

Not applicable.

Informed Consent Statement

Not applicable.

Data Availability Statement

Data are available from the corresponding author upon reasonable request.

Acknowledgments

The authors express special thanks to the editors and anonymous reviewers for their constructive comments.

Conflicts of Interest

Author Li Wan was employed by the company Shandong Provincial Communications Planning and Design Institute Group Co., Ltd. The authors declare that this study received funding from Shandong Provincial Communications Planning and Design Institute Group Co., Ltd. The funder was not involved in the study design, collection, analysis, interpretation of data, the writing of this article or the decision to submit it for publication. The remaining authors declare that the research was conducted in the absence of any commercial or financial relationships that could be construed as a potential conflict of interest.

References

  1. Wang, L.; Guan, C.; Wu, Y.; Feng, C. Impact Analysis and Optimization of Key Material Parameters of Embedded Water-Stop in Tunnels. Appl. Sci. 2023, 13, 8468. [Google Scholar] [CrossRef]
  2. Zhai, J.; Wang, Q.; Wang, H.; Xie, X.; Zhou, M.; Yuan, D.; Zhang, W. Highway Tunnel Defect Detection Based on Mobile GPR Scanning. Appl. Sci. 2022, 12, 3148. [Google Scholar] [CrossRef]
  3. Jin, Y.; Yang, S.; Guo, H.; Han, L.; Su, S.; Shan, H.; Zhao, J.; Wang, G. A Novel Visual System for Conducting Safety Evaluations of Operational Tunnel Linings. Appl. Sci. 2024, 14, 8414. [Google Scholar] [CrossRef]
  4. Lin, C.; Wang, X.; Li, Y.; Zhang, F.; Xu, Z.; Du, Y. Forward Modelling and GPR Imaging in Leakage Detection and Grouting Evaluation in Tunnel Lining. KSCE J. Civ. Eng. 2020, 24, 278–294. [Google Scholar] [CrossRef]
  5. Gong, C.; Wang, Y.; Ding, W.; Lei, M.; Shi, C. Waterproof Performance of Sealing Gasket in Shield Tunnel: A Review. Appl. Sci. 2022, 12, 4556. [Google Scholar] [CrossRef]
  6. Feng, Z.; Li, D.; Wang, F.; Zhang, L.; Wang, S. Field Test and Numerical Simulation Study on Water Pressure Distribution and Lining Deformation Law in Water-Rich Tunnel Crossing Fault Zones. Appl. Sci. 2024, 14, 7110. [Google Scholar] [CrossRef]
  7. Dohyun, P. Numerical Investigation on the Effect of Water Leakage on the Ground Surface Settlement and Tunnel Stability. Tunn. Undergr. Space Technol. 2024, 146, 105656. [Google Scholar] [CrossRef]
  8. Panthi, K.K.; Nilsen, B. Uncertainty Analysis for Assessing Leakage Through Water Tunnels: A Case from Nepal Himalaya. Rock Mech. Rock Eng. 2010, 43, 629–639. [Google Scholar] [CrossRef]
  9. Türkmen, S. Water leakage from the power tunnel of Gezende Dam, southern Turkey: A case study. Environ. Earth Sci. 2010, 61, 419–427. [Google Scholar] [CrossRef]
  10. Lin, C.; Wang, X.; Nie, L.; Sun, H.; Xu, Z.; Du, Y.; Liu, L. Comprehensive Geophysical Investigation and Analysis of Lining Leakage for Water-Rich Rock Tunnels: A Case Study of Kaiyuan Tunnel, Jinan, China. Geotech. Geol. Eng. 2020, 38, 3449–3468. [Google Scholar] [CrossRef]
  11. Liu, X.; Hong, Z.; Shi, W.; Guo, X. Image-Processing-Based Subway Tunnel Crack Detection System. Sensors 2023, 23, 6070. [Google Scholar] [CrossRef] [PubMed]
  12. Zhao, L.; Xu, Q.; Song, Z.; Meng, S.; Liu, S. Dynamic wave tunnel lining GPR images multi-disease detection method based on deep learning. NDT E Int. 2024, 144, 103087. [Google Scholar] [CrossRef]
  13. Zhou, Z.; Li, H.; Zhou, S.; Yan, L.; Yang, H. A deep learning-based algorithm for fast identification of multiple defects in tunnels. Eng. Appl. Artif. Intell. 2025, 145, 110035. [Google Scholar] [CrossRef]
  14. Xiong, L.; Zhang, D.; Zhang, Y. Water leakage image recognition of shield tunnel via learning deep feature representation. J. Vis. Commun. Image Represent. 2020, 71, 102708. [Google Scholar] [CrossRef]
  15. Wang, B.; He, N.; Xu, F.; Du, Y.; Xu, H. Visual detection method of tunnel water leakage diseases based on feature enhancement learning. Tunn. Undergr. Space Technol. 2024, 153, 106009. [Google Scholar] [CrossRef]
  16. Zhou, Z.; Zhang, J.; Gong, C. Hybrid semantic segmentation for tunnel lining cracks based on Swin Transformer and convolutional neural network. Comput.-Aided Civ. Infrastruct. Eng. 2023, 38, 2491–2510. [Google Scholar] [CrossRef]
  17. Zhou, H.; Xiao, X.; Li, H.; Liu, X.; Liang, P. Hybrid Shunted Transformer embedding UNet for remote sensing image semantic segmentation. Neural Comput. Appl. 2024, 36, 15705–15720. [Google Scholar] [CrossRef]
  18. Hu, J.; Shen, L.; Sun, G. Squeeze-and-excitation Networks. In Proceedings of the 2018 IEEE/CVF Conference on Computer Vision and Pattern Recognition, Salt Lake City, UT, USA, 18–22 June 2018; IEEE: Piscataway, NJ, USA, 2018; pp. 7132–7141. [Google Scholar] [CrossRef]
  19. Greff, K.; Srivastava, R.K.; Koutník, J.; Bas, R.S.; Jürgen, S. LSTM: A Search Space Odyssey. IEEE Trans. Neural Netw. Learn. Syst. 2017, 28, 2222–2232. [Google Scholar] [CrossRef]
  20. Xue, Y.; Cai, X.; Shadabfar, M.; Shao, H.; Zhang, S. Deep learning-based automatic recognition of water leakage area in shield tunnel lining. Tunn. Undergr. Space Technol. 2020, 104, 103524. [Google Scholar] [CrossRef]
  21. Yan, T.; Shen, S.L.; Zhou, A.N.; Chen, X. Prediction of Geological Characteristics from Shield Operational Parameters by Integrating Grid Search and k-Fold Cross Validation into Stacking Classification Algorithm. J. Rock Mech. Geotech. Eng. 2022, 14, 1292–1303. [Google Scholar] [CrossRef]
  22. Chen, J.; Mei, J.; Li, X.; Lu, Y.; Yu, Q.; Wei, Q.; Luo, X.; Xie, Y.; Adeli, E.; Wang, Y.; et al. TransUNet: Rethinking the U-Net architecture design for medical image segmentation through the lens of transformers. Med. Image Anal. 2024, 97, 103208. [Google Scholar] [CrossRef] [PubMed]
  23. Ronneberger, O.; Fischer, P.; Brox, T. U-Net: Convolutional Networks for Biomedical Image Segmentation. In Medical Image Computing and Computer-Assisted Intervention—MICCAI 2015, Munich, Germany, 5–9 October 2015; Navab, N., Hornegger, J., Wells, W., Frangi, A., Eds.; MICCAI 2015, Lecture Notes in Computer Science; Springer: Cham, Switzerland, 2015; Volume 9351. [Google Scholar] [CrossRef]
  24. Chen, L.C.; Zhu, Y.; Papandreou, G.; Schroff, F.; Adam, H. Encoder-Decoder with Atrous Separable Convolution for Semantic Image Segmentation. In Computer Vision—ECCV 2018, 5th European Conference, Munich, Germany, 8–14 September 2018; Ferrari, V., Hebert, M., Sminchisescu, C., Weiss, Y., Eds.; ECCV 2018. Lecture Notes in Computer Science; Springer: Cham, Switzerland, 2018; Volume 11211. [Google Scholar] [CrossRef]
  25. Badrinarayanan, V.; Kendall, A.; Cipolla, R. SegNet: A Deep Convolutional Encoder-Decoder Architecture for Image Segmentation. IEEE Trans. Pattern Anal. Mach. Intell. 2017, 39, 2481–2495. [Google Scholar] [CrossRef] [PubMed]
  26. Yu, C.; Gao, C.; Wang, J.; Yu, G.; Shen, C.; Sang, N. BiSeNet V2: Bilateral Network with Guided Aggregation for Real-Time Semantic Segmentation. Int. J. Comput. Vis. 2021, 129, 3051–3068. [Google Scholar] [CrossRef]
  27. Lin, T.Y.; Dollár, P.; Girshick, R.; He, K.; Hariharan, B.; Belongie, S. Feature Pyramid Networks for Object Detection. In Proceedings of the 2017 IEEE Conference on Computer Vision and Pattern Recognition (CVPR), Honolulu, HI, USA, 21–26 July 2017; pp. 936–944. [Google Scholar] [CrossRef]
  28. Jha, D.; Riegler, M.A.; Johansen, D.; Halvorsen, P.; Johansen, H.D. DoubleU-Net: A Deep Convolutional Neural Network for Medical Image Segmentation. In Proceedings of the 2020 IEEE 33rd International Symposium on Computer-Based Medical Systems (CBMS), Rochester, MN, USA, 28–30 July 2020; pp. 558–564. [Google Scholar] [CrossRef]
  29. Zhou, Z.; Rahman Siddiquee, M.M.; Tajbakhsh, N.; Liang, J. UNet++: A Nested U-Net Architecture for Medical Image Segmentation. In Deep Learning in Medical Image Analysis and Multimodal Learning for Clinical Decision Support; Stoyanov, D., Taylor, Z., Carneiro, G., Syeda-Mahmood, T., Martel, A., Maier-Hein, L., Tavares, J.M.R.S., Bradley, A., Papa, J.P., Belagiannis, V., et al., Eds.; DLMIA ML-CDS 2018 2018. Lecture Notes in Computer Science; Springer: Cham, Switzerland, 2018; Volume 11045. [Google Scholar] [CrossRef]
  30. Cao, H.; Wang, Y.; Chen, J.; Jiang, D.; Zhang, X.; Tian, Q.; Wang, M. Swin-Unet: Unet-like Pure Transformer for Medical Image Segmentation. In Proceedings of the European Conference on Computer Vision Workshops, Tel Aviv, Israel, 23–27 October 2022; Avidan, S., Brostow, G., Cissé, M., Farinella, G.M., Hassner, T., Eds.; ECCVW 2022. Lecture Notes in Computer Science; Springer: Cham, Switzerland, 2022; Volume 13673. [Google Scholar] [CrossRef]
  31. Wang, H.; Wang, Z.; Du, M.; Yang, F.; Zhang, Z.; Ding, S. Score-CAM: Score-Weighted Visual Explanations for Convolutional Neural Networks. In Proceedings of the 2020 IEEE/CVF Conference on Computer Vision and Pattern Recognition Workshops (CVPRW), Seattle, WA, USA, 14–19 June 2020; IEEE: Piscataway, NJ, USA, 2020; pp. 111–119. [Google Scholar] [CrossRef]
  32. Huang, G.; Zheng, Z.; Li, J.; Zhang, M.; Liu, J.; Zhang, L. Dual Attention Equivariant Network for Weakly Supervised Semantic Segmentation. Appl. Sci. 2025, 15, 6474. [Google Scholar] [CrossRef]
Figure 1. SE-TransUNet model architecture for water seepage detection.
Applsci 15 07872 g001
Figure 2. Squeeze-and-Excitation block structure.
Applsci 15 07872 g002
Figure 3. Partial image display of the dataset.
Applsci 15 07872 g003
Figure 4. Examples of dataset augmentation methods.
Applsci 15 07872 g004
Figure 5. The process of converting the original image into a mask.
Applsci 15 07872 g005
Figure 6. Five-fold cross-validation schematic diagram.
Applsci 15 07872 g006
Figure 7. The loss function of each round of experiments for the SE-TransUNet model.
Applsci 15 07872 g007
Figure 8. Box plot of model IOU, Dice, Recall, and Precision metrics.
Applsci 15 07872 g008
Figure 9. Segmentation results of various models for water leakage images.
Applsci 15 07872 g009
Figure 10. Key module ablation steps.
Applsci 15 07872 g010
Figure 11. The comparison results of Score-CAM heatmaps for the model after removing the SE module and ViT module.
Applsci 15 07872 g011
Table 1. Input and output dimensions and feature types of modules in the encoder.
Module NameInput SizeOutput SizeNumber of ChannelsFeature Type
encoder1512 × 512 × 3256 × 256 × 6464Edges, Textures (Low-Level Features)
encoder2256 × 256 × 64128 × 128 × 256256Textures, Simple Shapes (Mid-Low-Level Features)
encoder3128 × 128 × 25664 × 64 × 512512Object Parts (Mid-Level Features)
encoder464 × 64 × 51232 × 32 × 10241024Holistic Semantics (High-Level Features)
ViT32 × 32 × 102416 × 16 × 10241024Global Semantic Enhanced Features
Table 2. Data processing flow of the ViT module in the leakage identification model encoder.
Process NumberProcess FunctionProcess Explanation
1Input Feature MapThe output feature size of ResNet needs to match the input feature size of ViT. If they do not match, additional upsampling is required
2Patch PartitioningEach patch has a size of 8 × 8. If the output feature map of encoder4 is 32 × 32, then 16 patches are partitioned
3Global Semantic EnhancementBased on the self-attention mechanism of Transformer, long-range dependencies among 16 patches are captured
4Resolution AdaptationTransform the feature size to reduce the resolution difference with the shallow features in the decoder, facilitating subsequent splicing and fusion
Table 3. Data processing flow of the decoder in the leakage identification model.
Process NumberProcess FunctionProcess Explanation
1Input Feature and Attention EnhancementThe decoder first applies SENet attention to each feature layer.
2Layer 1 DecodingUpsample xvit, and splice and fuse the upsampled xvit with x3 through VGGBlock.
3Layer 2 DecodingUpsample the output of the first layer decoding, and splice and fuse it with x2 through VGGBlock.
4Layer 3 DecodingUpsample the output of the second layer decoding, and splice and fuse it with x1 through VGGBlock.
5Final Upsampling and OutputAfter upsampling and convolution processing by VGGBlock; the output is performed by the segmentation head
Table 4. Summary table of various types of water seepage in the dataset.
Leakage TypeNumber of ImagesProportion (%)
Spot-Type Leakage32621.45
Linear Leakage34522.70
Area-Type Leakage29619.47
Mixed-type Leakage55336.38
Total1520100
Table 5. Statistical table of various metrics for the validation set in 5 rounds of experiments.
Experiment RoundIoUDiceRecallPrecisionAUCMCCF1-ScoreFPS
10.84250.84250.96410.86740.98280.87280.93826.45
20.85420.84830.96260.87010.98400.88330.94936.50
30.80250.81140.92030.84560.97530.83810.90356.56
40.84620.82930.92880.83080.98670.85440.91666.59
50.81390.81060.92120.82630.93750.83260.90136.57
Mean0.83180.83040.93940.84800.97330.85620.92186.53
Standard Deviation0.02240.02040.02210.02020.02040.02180.02130.057
Table 6. Statistical table of mean values of evaluation metrics for various leakage detection models in the test set.
Model NameIoUDiceRecallPrecisionAUCMCCF1-ScoreFPSParameter Count (M)
SE-TransUNet0.83180.83040.93940.84800.97330.85620.92186.53223
TransUNet0.78640.84710.91420.84810.97300.85230.871414.64176
UNet0.76140.86310.89850.82130.97120.84400.891116.6423
Swin-Unet0.81590.81840.92420.83100.94830.84720.89938.33134
DeepLabV3plus0.75150.84300.85420.84200.97900.83140.854415.7250
SegNet0.67610.79180.77400.84730.94990.73460.803617.3214
BiSeNetV20.57910.69040.69610.78230.91490.64050.727919.138
FPN0.78730.87380.88930.89680.98530.85400.892316.5125
DoubleUnet0.75000.82160.82060.89860.97350.80570.854314.4740
NestedUNet0.73200.81940.87490.81970.96390.77910.840915.3330
Table 7. Statistical table of paired t-test results for SE-TransUNet and TransUNet models.
MetricsSE-TransUNet
(Mean ± SD)
TransUNet
(Mean ± SD)
Difference (d)t-Valuep-Value
IoU0.8318 ± 0.02240.7864 ± 0.02130.04543.250.031
Dice0.8304 ± 0.02040.8471 ± 0.0202−0.0167−2.100.095
Recall0.9394 ± 0.02210.9142 ± 0.02410.02522.870.042
Precision0.8480 ± 0.02020.8481 ± 0.0215−0.0001−0.010.992
AUC0.9733 ± 0.02040.9730 ± 0.02010.00030.030.977
MCC0.8562 ± 0.02180.8523 ± 0.02210.00390.410.698
F1-score0.9218 ± 0.02130.9218 ± 0.02110.00000.001.000
FPS6.53 ± 0.05714.64 ± 0.031−8.11−120.5<0.001
Table 8. The evaluation indicators of the water leakage detection model in the ablation experiment.
Step NumberAblation ModuleIoUDiceRecallPrecisionF1-Score
0None0.83180.83040.93940.84800.9218
1SE-Block10.81590.83850.92100.86680.8847
2SE-Block20.79740.82420.91170.85750.8817
3SE-Block30.79480.82210.91000.84230.8742
4SE-Block40.78640.84710.91420.84810.8714
5ViT0.76140.86310.89850.82130.8911
Disclaimer/Publisher’s Note: The statements, opinions and data contained in all publications are solely those of the individual author(s) and contributor(s) and not of MDPI and/or the editor(s). MDPI and/or the editor(s) disclaim responsibility for any injury to people or property resulting from any ideas, methods, instructions or products referred to in the content.

