Article

Embedding Security Awareness in IoT Systems: A Framework for Providing Change Impact Insights

Department of Computer Science, Oklahoma State University, Stillwater, OK 74078, USA
*
Author to whom correspondence should be addressed.
Appl. Sci. 2025, 15(14), 7871; https://doi.org/10.3390/app15147871 (registering DOI)
Submission received: 9 June 2025 / Revised: 8 July 2025 / Accepted: 10 July 2025 / Published: 14 July 2025
(This article belongs to the Special Issue Trends and Prospects for Wireless Sensor Networks and IoT)

Abstract

The Internet of Things (IoT) is rapidly advancing toward increased autonomy; however, the inherent dynamism, environmental uncertainty, device heterogeneity, and diverse data modalities pose serious challenges to its reliability and security. This paper proposes a novel framework for embedding security awareness into IoT systems—where security awareness refers to the system’s ability to detect uncertain changes and understand their impact on its security posture. While machine learning and deep learning (ML/DL) models integrated with explainable AI (XAI) methods offer capabilities for threat detection, they often lack contextual interpretation linked to system security. To bridge this gap, our framework maps XAI-generated explanations to a system’s structured security profile, enabling the identification of components affected by detected anomalies or threats. Additionally, we introduce a procedural method to compute an Importance Factor (IF) for each component, reflecting its operational criticality. This framework generates actionable insights by highlighting contextual changes, impacted components, and their respective IFs. We validate the framework using a smart irrigation IoT testbed, demonstrating its capability to enhance security awareness by tracking evolving conditions and providing real-time insights into potential Distributed Denial of Service (DDoS) attacks.

1. Introduction

The rapid advancement of Internet of Things (IoT) technology has profoundly trans-formed modern life, reshaping how we interact with our surroundings and driving innovation across numerous sectors [1]. IoT systems are particularly effective at automating processes and optimizing resource utilization in areas such as smart homes, healthcare, agriculture, and industrial automation. By seamlessly interconnecting a wide range of de-vices—collectively referred to as “things”—over the internet, these systems are designed to sense, analyze, and intelligently respond to both operational and environmental conditions. Continuous monitoring of system attributes enables IoT devices to generate actionable insights, significantly enhancing task management and decision-making processes [1,2,3].
As IoT adoption continues to expand, the exponential increase in connected heterogeneous devices and their complex interactions introduces significant challenges, particularly in terms of security and system resilience. IoT ecosystems comprise a broad spectrum of components, ranging from resource-constrained sensors to high-performance cloud platforms, each characterized by distinct computational capabilities, functionalities, and communication protocols [4,5]. This inherent heterogeneity results in divergent security requirements and protection mechanisms, which can create vulnerabilities exploitable by adversaries. The high degree of interconnectedness within these systems further amplifies the risk; a compromise in a single weak component or an unexpected environmental disturbance can cascade through the network, jeopardizing the overall system’s security and functionality [4]. Moreover, suboptimal security practices by IoT users, coupled with the unpredictable nature of threats stemming from interconnected devices and services, further exacerbate these vulnerabilities.
Conventional static, rule-based decision-making strategies are inadequate for addressing the dynamic and unpredictable nature of IoT environments. In contrast, effective dynamic decision-making requires the ability to accurately interpret changes in the operational environment, reason about their implications for system security and functionality, and adapt strategies accordingly. Researchers [6,7,8] emphasize that embedding security awareness into IoT systems is essential to enable them to reason effectively about appropriate mitigation responses in the face of uncertainty. Security awareness, conceptualized as an extension of self-awareness, empowers IoT systems to detect changes in both environmental conditions and internal system attributes while concurrently assessing their implications for the system’s overall security posture [6,9,10]. This capability involves the real-time extraction of security-relevant insights by analyzing variations in the system’s behavior and operating context [6,10].
A key challenge in embedding security awareness lies in processing the large volumes of heterogeneous data generated in real time. In this regard, advanced machine learning (ML) and deep learning (DL) techniques, combined with powerful computational resources, have emerged as critical enablers, driving IoT systems toward greater levels of autonomy [11,12,13]. However, while ML/DL models excel at detecting and predicting changing conditions, data processing alone is insufficient to realize full security awareness. True security awareness must go beyond detection by incorporating robust methods for interpreting the effects of uncertain or unforeseen changes on the system‘s security profile. This involves identifying the specific functionalities and security requirements affected by such changes and evaluating their significance within the broader application context [6,14,15]. Achieving this level of interpretability requires a formal articulation of the system’s security profile, which includes abstract representations of its security requirements, operational constraints, and the interdependencies among internal components [16].
In this paper, we propose a framework to embed security awareness into IoT systems. This security awareness is a crucial component, providing insights into the system’s security state and changes. These insights are essential for reasoning about appropriate countermeasures to defend against potential threats. Recent advances in ML/DL models have significantly improved the detection and classification of uncertain or anomalous conditions by leveraging domain-specific training data for proactive threat prediction [17,18]. At the same time, explainable artificial intelligence (XAI) techniques have enhanced the interpretability of ML/DL outputs, revealing which system and environmental attributes influence security outcomes. This interpretability helps uncover the root causes of operational anomalies and deviations [19,20].
Despite recent advancements, integrating XAI outputs with a system‘s security profile remains a significant challenge. Without this integration, the insights generated by XAI lack the contextual grounding necessary to support informed security decisions. In our previous work [6], we proposed a mapping technique and developed a component capable of extracting and interpreting XAI insights from a trained DL model within the context of the system’s security profile. We represent the system’s security profile using a Security Assurance Case (SAC) [16,21], which structures security claims and supporting evidence to demonstrate compliance with defined security requirements. In an SAC, high-level security requirements are articulated as top-level goals, which are then refined into sub-goals, strategies, and solutions. This hierarchical structure enables traceable reasoning about how the system satisfies its security requirements. Strategy nodes define the mechanisms or processes employed to fulfill specific security goals or functions, while solution nodes provide supporting evidence—such as test cases, analysis results, or system logs—that verify the correct operation of these mechanisms. To model the SAC, we use the Goal Structuring Notation (GSN) [22], which explicitly captures the relationships between system goals, implemented security mechanisms, operational processes, and the corresponding evidence that underpins assurance arguments.
The mapping technique from [6] extracts relevant attributes from the XAI output of each prediction instance, maps them to the attribute lists included in the evidence nodes in the SAC, and uses metadata to trace affected components. This allows us to identify which functionalities and security requirements are impacted by changed conditions. However, identifying the affected components alone does not provide a complete picture. To fully understand the impact of these changes, we must also determine the operational significance of the affected components in maintaining system functionality.
In this paper, we introduce a metric called the Importance Factor (IF) as part of our security awareness framework. Each component within the IoT system is assigned an IF value that quantifies its significance in maintaining the system’s overall operation. Identifying affected components alongside their respective IF values provide actionable insights into the impact of changes on system operation and can support the prioritization of protection measures and resource allocation. This ensures that critical functionalities receive prompt attention compared to less essential ones.
Determining the significance of a component in an IoT system is a non-trivial challenge. While components with explicitly critical functionalities are clearly important, seemingly minor components may also play pivotal roles due to the tightly coupled and interconnected nature of IoT architecture. For example, the failure of an ostensibly insignificant sensor could trigger cascading effects across the network, potentially disrupting key security mechanisms or operational processes. Therefore, systematically assigning IF values based on both functional significance and system interdependence is crucial for enhancing resilience, strengthening security, and improving autonomous decision-making in uncertain, dynamic environments.
To address this challenge, we propose a procedural approach for deriving the IF of processes within IoT systems. We model the system’s interconnections as a directed call graph [23,24], which captures structural relationships between processes by representing their invocation dependencies. To assess the criticality of each process, we adopt a weighted PageRank centrality algorithm [25], incorporating both degree centrality [26,27] and PageRank centrality [28]. We develop a procedural method to compute the IF of each process while considering the multi-layer architecture of the IoT system. Building upon our prior work [6], we extend the security profile to incorporate IF values and generate interpretation reports that include both the affected functionalities and their corresponding importance. These enriched interpretation reports serve as the foundation for security awareness, enabling intelligent, prioritized, and context-sensitive responses to evolving threats. However, designing a complete mitigation strategy in response to evolving threats is beyond the scope of this paper. The key contributions of this paper are twofold:
  • We develop a procedural approach to assign an Importance Factor (IF) to each system component based on its significance to the system’s overall operation.
  • We enhance the security profile by incorporating IF values and extend the security awareness framework to generate enriched interpretations that provide insights into the affected components, their functionalities, and their operational significance.
To evaluate the effectiveness of our approach, we implemented a testbed based on an IoT-enabled smart irrigation system and deployed the developed component. The experimental results demonstrate the component’s effectiveness in extracting information from XAI outputs and generating interpretations that align with the system’s security profile, thereby validating the proposed methodology.

2. Background

The advent of the IoT has transformed interactions between humans and the physical world by enabling seamless connectivity among heterogeneous devices [1]. However, the dynamic and distributed nature of IoT environments presents significant challenges to secure system management [29]. The integration of resource-constrained devices, diverse communication protocols, and vendor-specific technologies has significantly expanded the attack surface [4,29]. Common vulnerabilities stem from unsecured communication channels, physically exposed devices, and inconsistent security practices—particularly in remote or under-resourced deployments. These risks are further exacerbated by dependence on third-party services and the lack of standardized security policies.
IoT systems typically follow a multi-layered architecture, each layer responsible for distinct operational functions—from data sensing to processing, transmission, and end-user services [30,31]. A common five-layer architecture includes the following:
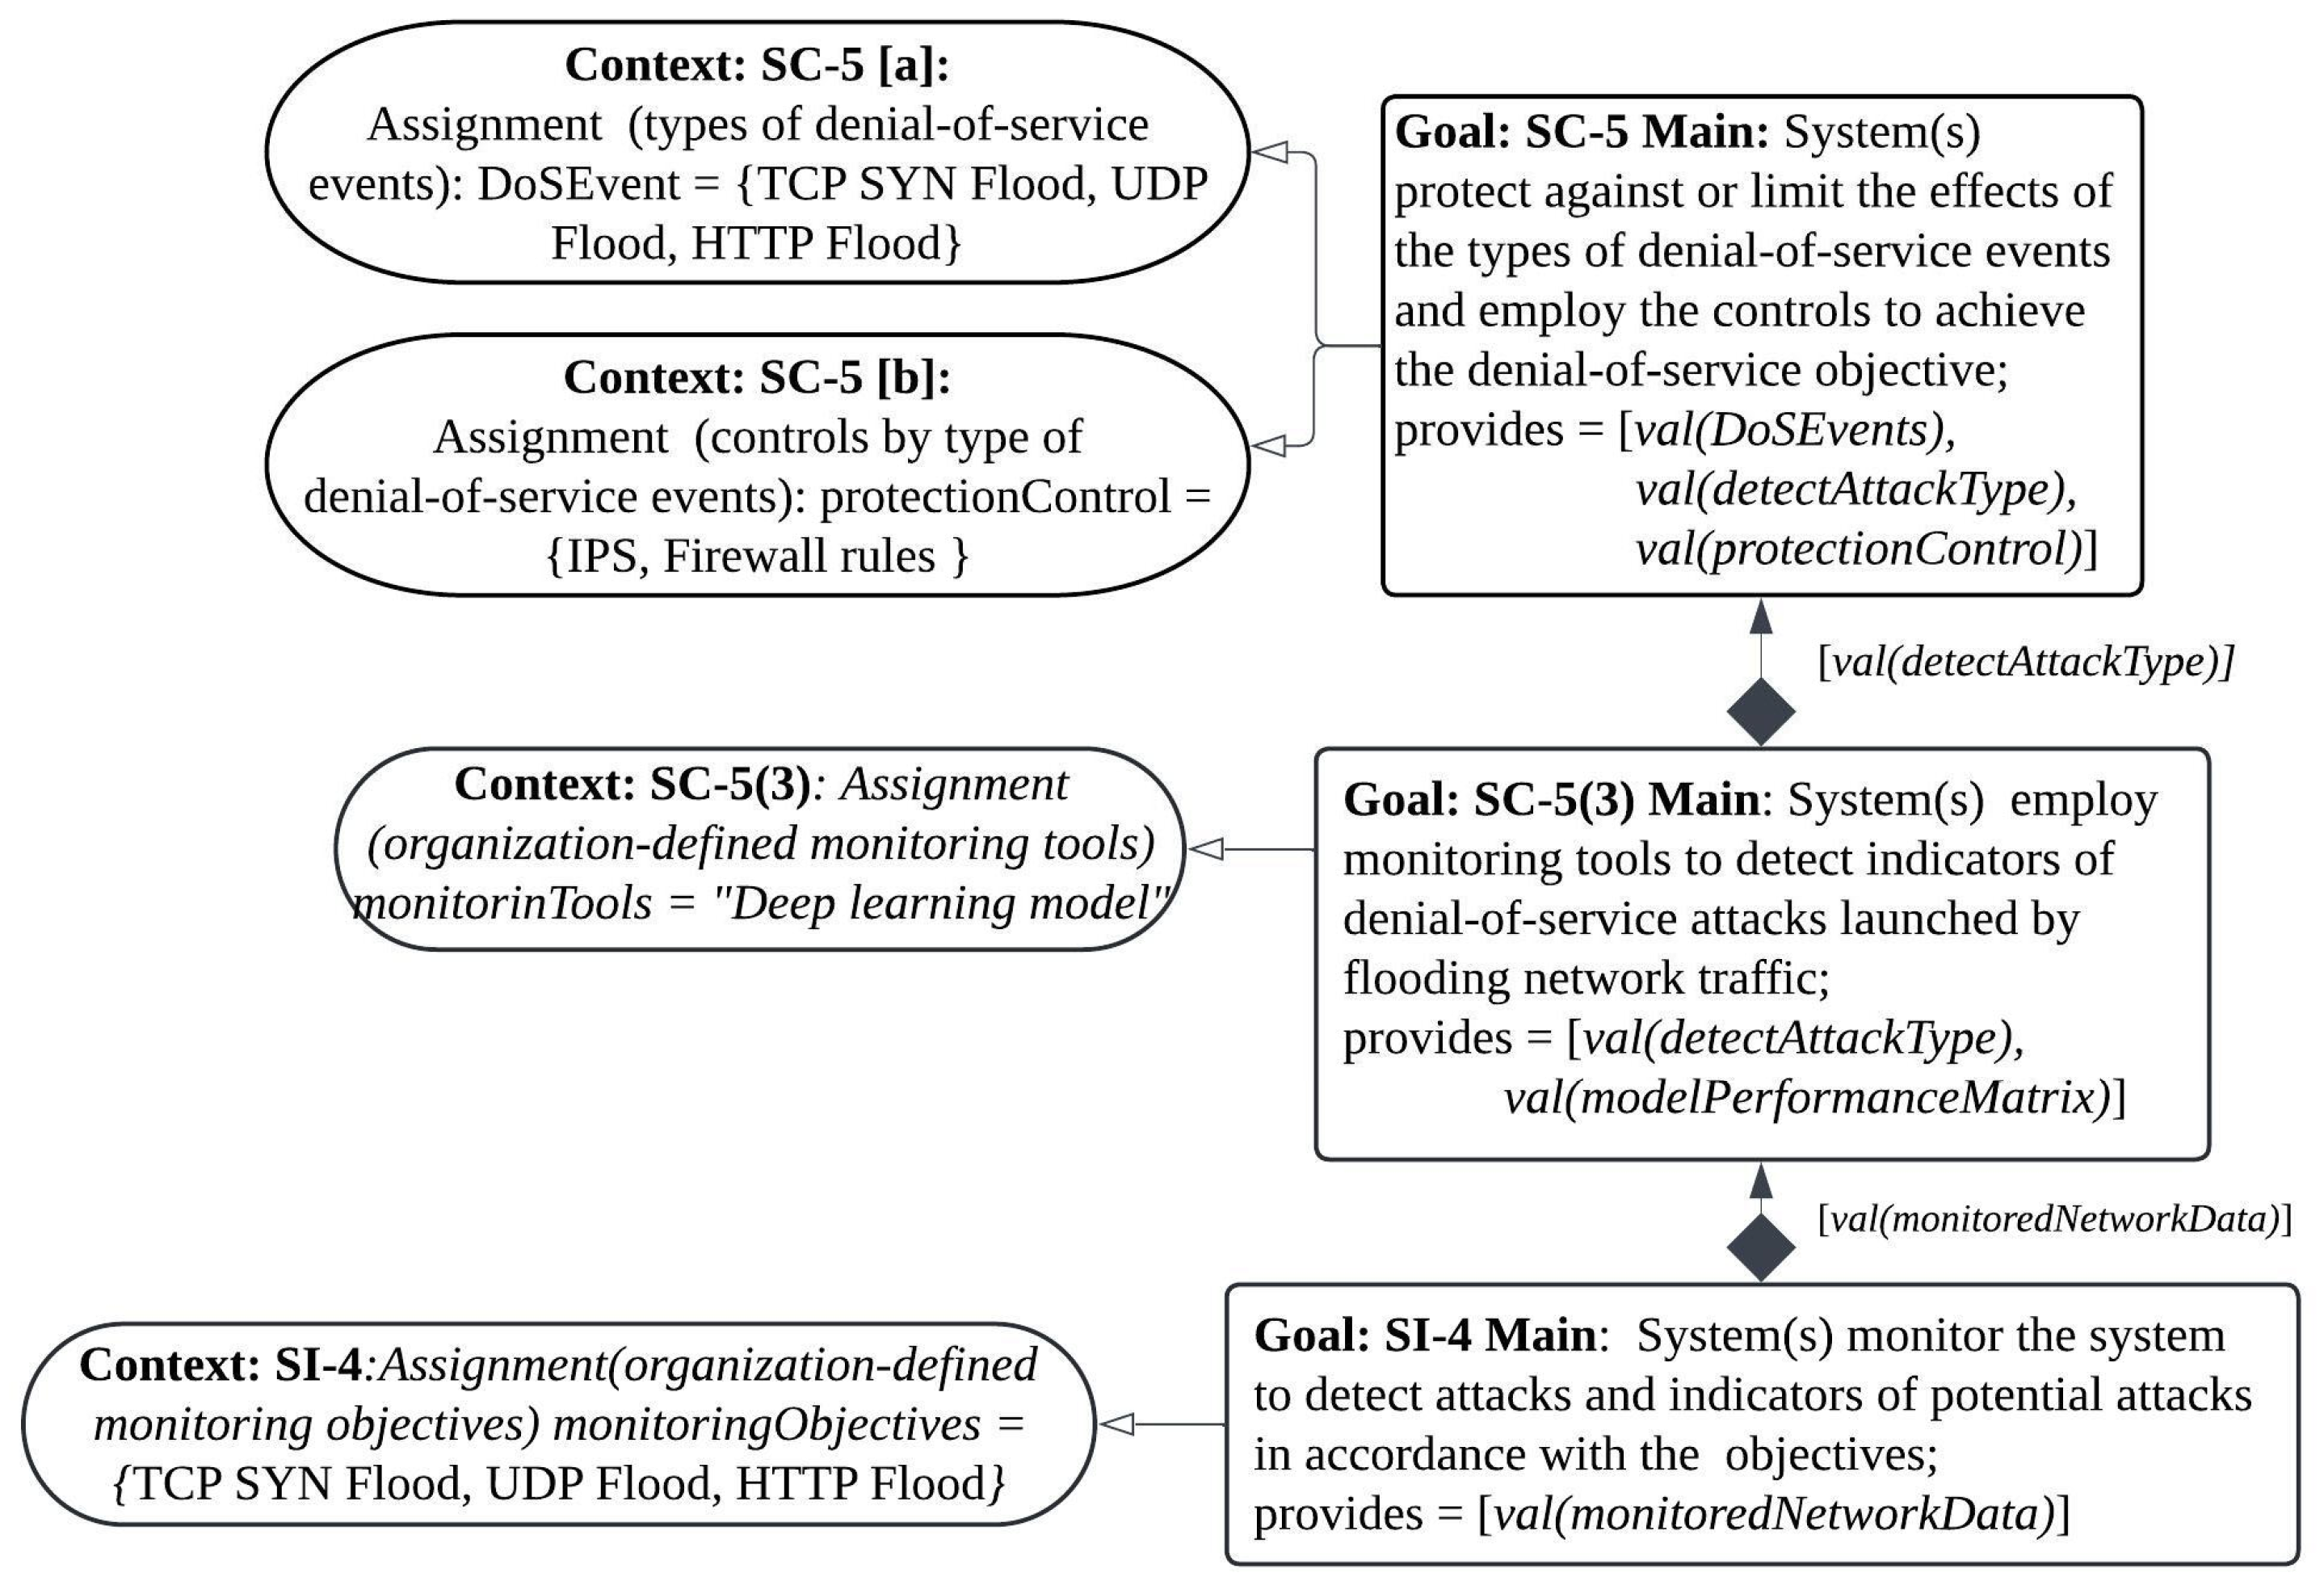
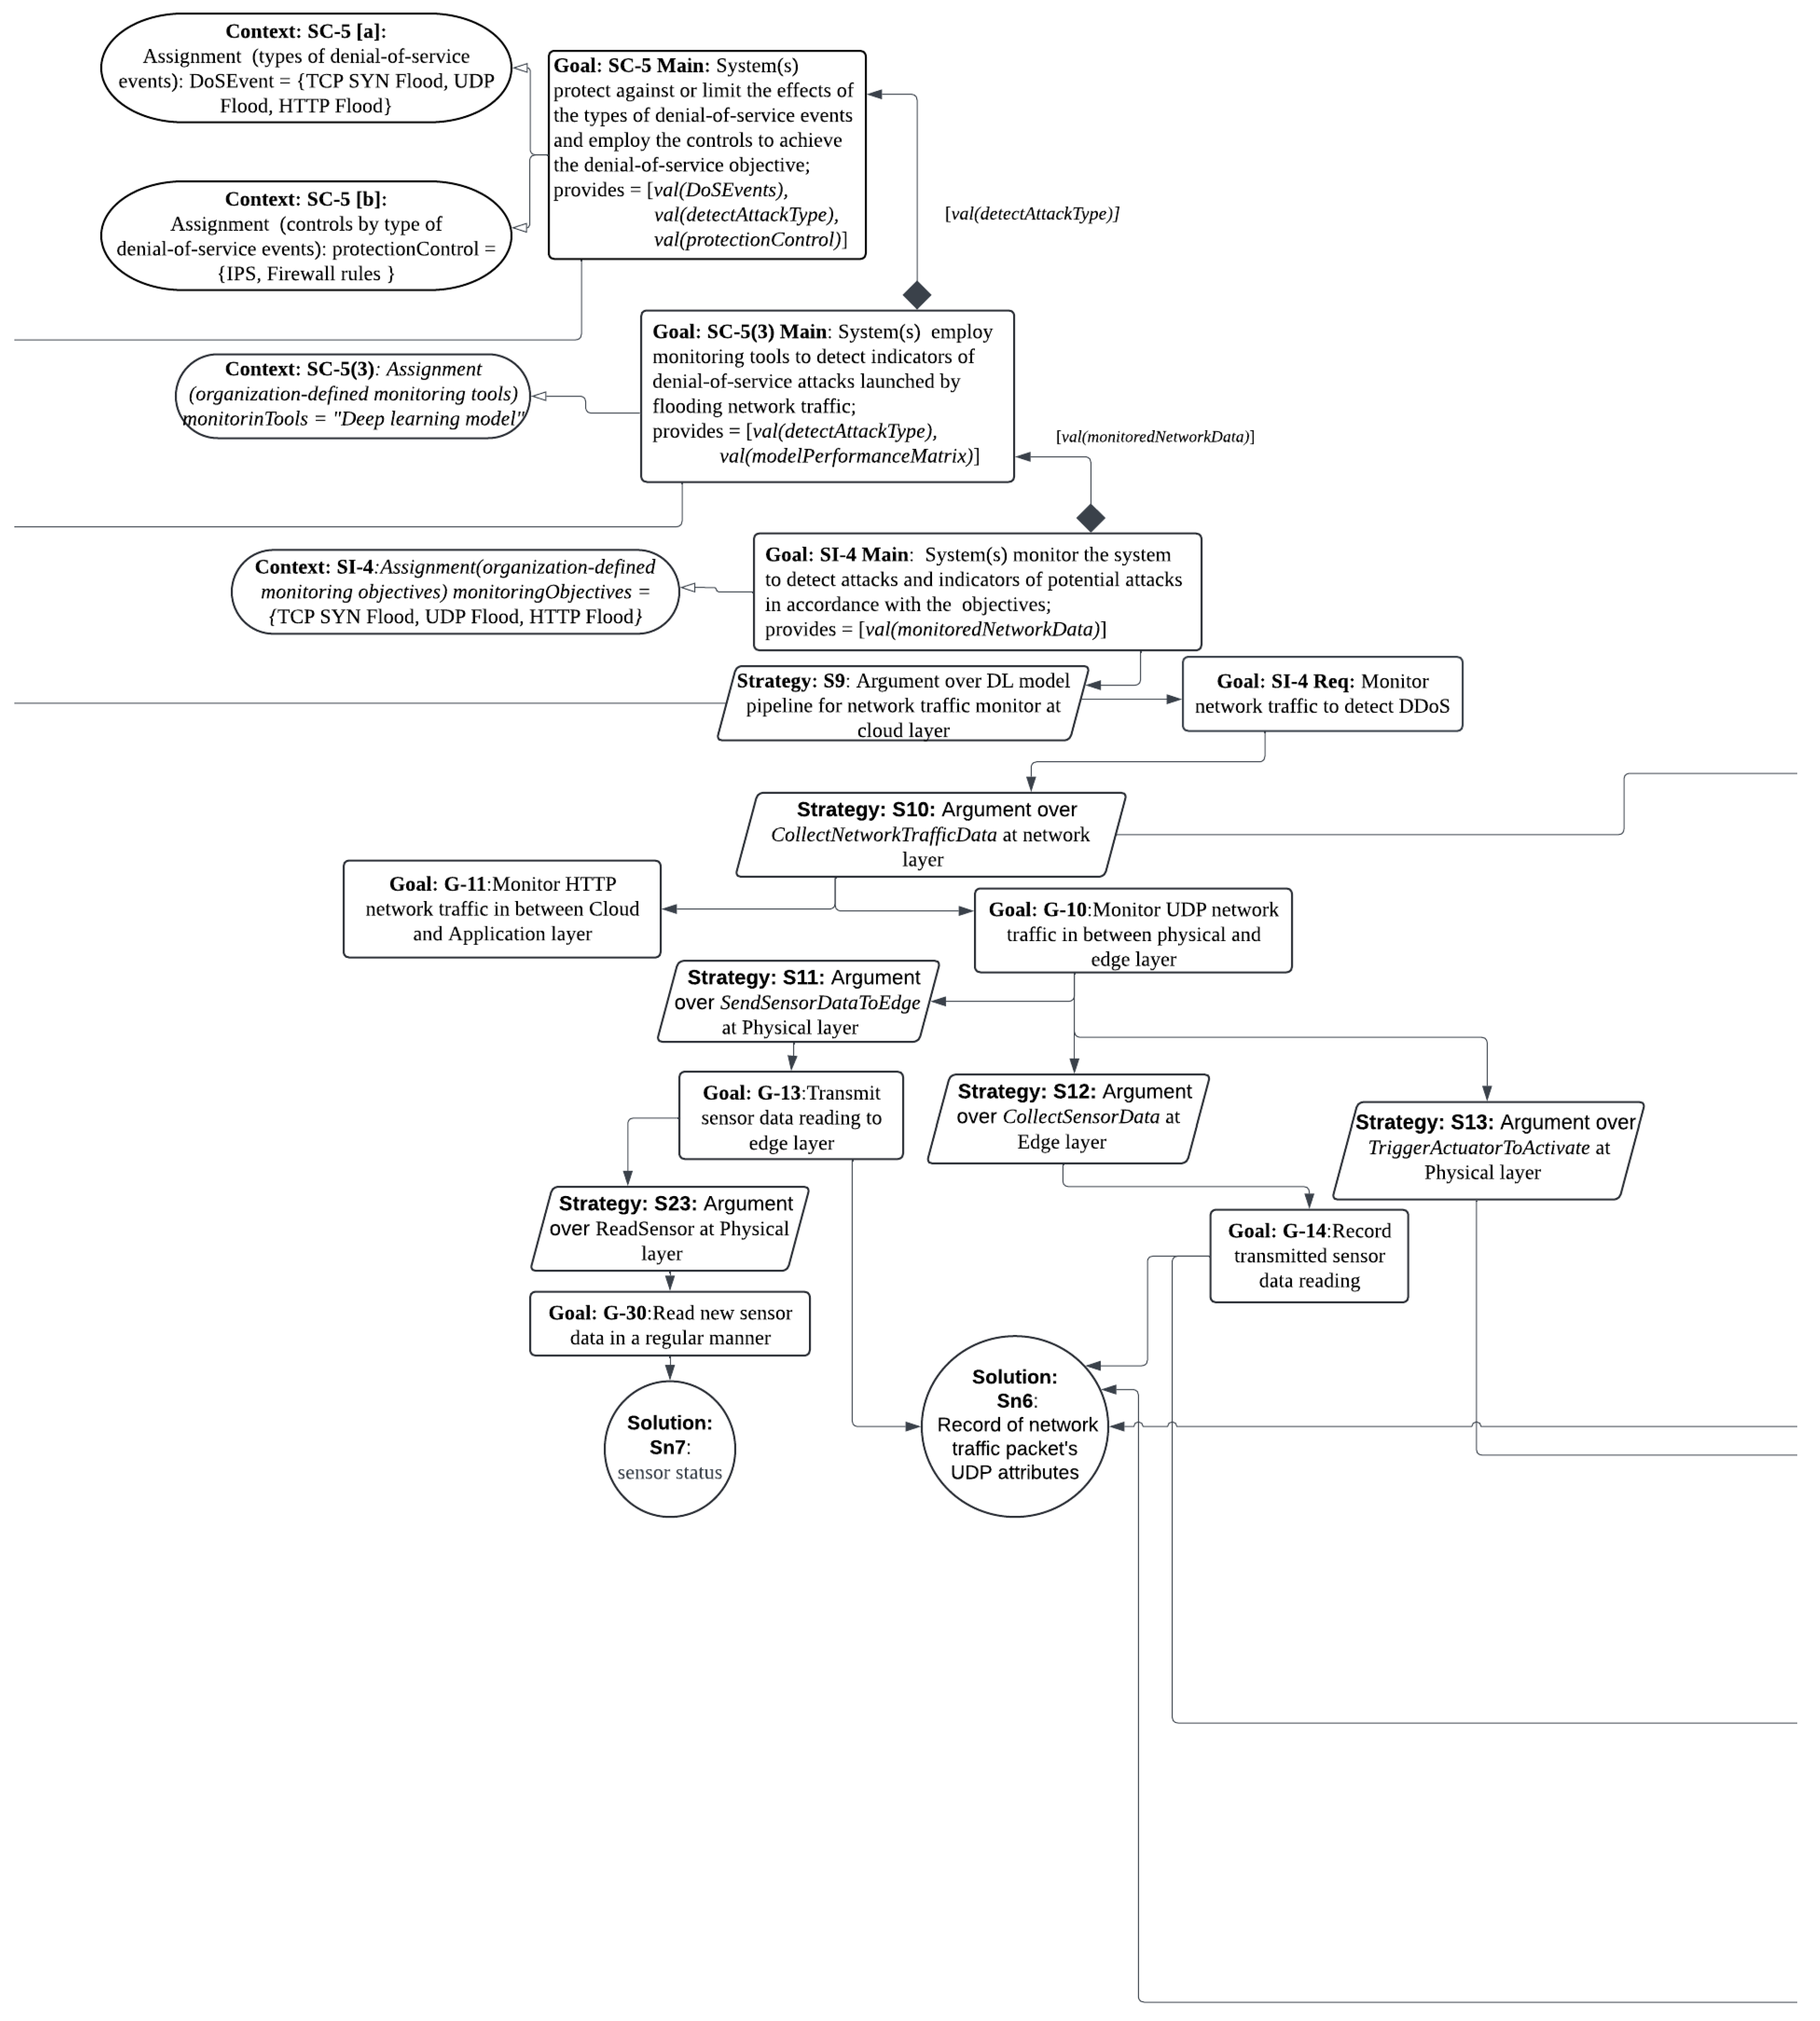
  • Perception (or Physical) Layer: Houses sensing devices and collects raw data.
  • Edge/Fog Layer: Offers localized computing resources to reduce latency and offload processing from the cloud.
  • Cloud Layer: Manages large-scale data processing, analysis, and storage using heterogeneous cloud services [31].
  • Network (or Transport) Layer: Ensures data transmission between layers.
  • Application Layer: Delivers services and interfaces to end users.
While this layered architecture improves scalability and performance, it also introduces security risks at each level. For example, the Perception Layer is vulnerable to node capture, replay attacks, eavesdropping, and physical tampering. The Network Layer faces threats such as DDoS attacks, man-in-the-middle attacks, spoofing, Sybil, and sinkhole attacks [32]. Numerous studies have emphasized security as one of the most critical and unresolved challenges in IoT systems [33,34].
Given these challenges, there is a clear need for adaptive and robust security frameworks that can not only protect data and infrastructure but also respond effectively to the evolving threat landscape in IoT environments. Recent literature underscores the critical need to embed security awareness into IoT systems to address the growing complexity and evolving threat landscape [35]. Security awareness builds upon the concept of system self-awareness by enabling autonomous systems to detect and reason about changes in both environmental conditions and internal states—and to assess how these changes impact the system’s security posture [6,7,8,9,10]. Achieving this requires continuous monitoring of functional, network, and environmental attributes, along with dynamic assessment of their variations to generate actionable insights. These insights are vital for implementing adaptive and resilient security responses capable of mitigating emerging threats [36]. In [37], the authors introduce Prov-IoT, an IoT provenance model that captures the complete lifecycle of data records by documenting their processing and aggregation alongside embedded security metadata. This metadata encompasses evidence of active security controls, communication security protocols, user authentication methods, as well as device configuration and software information. The resulting data provenance graph illustrates the transformation of data from its origin through various modifications, processing steps, and eventual aggregation into its final form. While the model emphasizes linking security information to contextual details such as user-data relationships, device identities, timestamps, locations, or environmental factors, it falls short of specifying how these contextual elements can be integrated effectively to provide comprehensive insights for validating the data‘s trustworthiness. Another research group developed a Security Awareness and Protection System for 5G-enabled Smart Healthcare [38], grounded in a predefined threat model specific to 5G networks. Their framework identifies four core dimensions of access control—subject, object, environment, and behavior—and incorporates a risk assessment mechanism based on prior knowledge of potential threats and their severity. The system features a continuous trust evaluation process and a dynamic access control model that performs fine-grained, session-based access decisions, guided by situational awareness of potential risks. However, its reliance on a static, predefined threat model limits its adaptability to unforeseen changes and hinders its ability to fully capture the implications of dynamic, real-world threats in complex healthcare environments.
However, the inherent complexity of IoT ecosystems—combined with the vast volume of heterogeneous and multimodal data—poses significant challenges to achieving effective security awareness. Extracting actionable insights from raw data demands advanced analytical capabilities. Machine learning (ML) and deep learning (DL) techniques have demonstrated considerable success in tasks such as threat prediction and anomaly detection within IoT environments [17,18]. Despite their effectiveness, these models often operate as “black boxes”, which limits their applicability in security-critical domains where trust, transparency, and accountability are paramount.
Explainable AI (XAI) seeks to address this limitation by enhancing the interpretability of ML/DL models, providing insights into which input features influence predictions and why [19,20]. XAI methods are generally categorized into model-specific and model-agnostic approaches. Model-specific techniques are tailored to particular types of models that are inherently more transparent, such as decision trees or linear models [39]. In contrast, model-agnostic methods can be applied to any black-box model regardless of its internal architecture, making them suitable for interpreting complex models like deep neural network (DNN). These methods typically rely on surrogate models to approximate and explain the behavior of the original black-box models [40].
For instance, Local Interpretable Model-Agnostic Explanations (LIME) [41,42,43] constructs simple, locally faithful surrogate models that mimic the behavior of the complex model around a specific instance. Similarly, SHapley Additive exPlanations (SHAP) [44,45], grounded in cooperative game theory, assigns importance to input features by calculating their marginal contributions to a model’s prediction. Beyond merely justifying predictions, XAI can reveal hidden data patterns and offer deeper contextual insights [46]. These insights are critical, as mitigation strategies based on opaque or misunderstood model behavior may inadvertently introduce new vulnerabilities [6,47].
Despite its promise, effectively integrating XAI into autonomous IoT systems remains a significant challenge. The interpretation of XAI outputs often requires human expertise, limiting opportunities for automation and scalability. To truly embed security awareness into autonomous IoT environments, there is a need for an automated mechanism that can extract, interpret, and map XAI-derived insights to the system’s security profile. This would enable the identification of affected security requirements, components, or functionalities and support adaptive security decision-making [6]. While advances in XAI have enhanced interpretability, a critical gap remains in contextualizing these insights with respect to a system’s security profile. A security profile defines the system’s security requirements and abstracts the interrelationships among those requirements, along with the corresponding security mechanisms and system functionalities designed to fulfill them [16]. To systematically represent this profile, a structured methodology is required.
Security Assurance Cases (SACs) [16,21], typically modeled using Goal Structuring Notation (GSN) [22], provide a formal framework for articulating and evaluating a system’s security assurance. SACs are hierarchical and traceable structures composed of interrelated elements that collectively demonstrate the argument why a system can be considered secure, supported by both evidence and logical rationale. A SAC begins with high-level Goals that state the system’s primary security claims or objectives. These are incrementally decomposed into Subgoals and Strategies, which outline how the claims will be achieved—often by pointing to specific components, mechanisms, or design decisions. Solutions represent evidence or artifacts (e.g., test results, certificates) that support the claims. Additional elements, such as Context, Justification, and Assumptions, provide relevant environmental information, rationale for decomposition choices, and any underlying assumptions of the argument, respectively. By tracing SAC, stakeholders can clearly understand how the system satisfies its security requirements and identify dependencies between functional and security objectives, associated controls, and the supporting evidence [16,21]. GSN offers a graphical representation of SACs, using standardized shapes and links: Goals and Subgoals are rectangles, Strategies are parallelograms, Solutions are circles, and Contexts are ellipses. These elements are connected using SupportedBy (solid arrow) and InContextOf (hollow arrow) relationships [22]. A SAC template built on GSN, such as the one proposed in [16], formalizes security claims and control statements, providing a robust foundation for modeling a system’s security profile. This structured abstraction is a crucial step toward embedding security awareness into autonomous IoT systems.
Nevertheless, effective security awareness requires more than just interpreting how uncertainty impacts the system’s security profile—it also demands an understanding of how these changes influence overall system functionality. Mapping XAI-generated insights into SAC structures helps bridge the interpretability gap by aligning model decisions with defined system behaviors and security objectives [6]. This alignment strengthens the precision of component-level impact assessments and provides a clearer picture of the system’s evolving security posture. However, merely identifying which components are affected offers a limited view. It is equally important to assess the operational significance of those components within the system. Node centrality measures—widely used in network flow analysis to estimate the importance of nodes—offer a quantitative means to evaluate component criticality [25,27]. To apply these metrics, the system architecture can be modeled as a directed graph using a call graph representation [23,24], which captures process-level interactions between components. Centrality metrics such as Degree Centrality and PageRank [25,26,27,28] can then be employed to evaluate each component‘s influence and priority in sustaining system operations. Real-world IoT systems typically comprise a large number of components whose interactions dynamically evolve due to contextual changes—components may be activated or deactivated depending on operational needs. Thus, estimating component significance must account for these dynamic shifts and continuously update assessments of criticality. Researchers [48,49] have recommended the PageRank algorithm as a powerful method for identifying important nodes in evolving graphs. While traditional centrality measures [50] such as Degree, Closeness, and Betweenness Centrality evaluate importance based on direct or shortest-path connections between nodes, the PageRank algorithm leverages the concept of random walks to capture more nuanced influence patterns. This makes it particularly effective for uncovering cascading effects that may result from the failure of a single component, illuminating how disruptions can propagate through the system. Prior research has applied PageRank in IoT contexts to optimize energy consumption [51], data streaming [52], and device management [53]—further demonstrating its effectiveness in identifying critical nodes within dynamic, evolving graphs. This graph-based approach enables more informed and strategic threat response by not only identifying affected components, but also understanding the potential ripple effects of disruptions—how failures may propagate and impact other parts of the system.

3. Approach

This paper presents a systematic approach for determining an Importance Factor (IF) to each component within an IoT system, along with its incorporation into the security awareness framework. We detail the key elements of the proposed framework designed to embed security awareness into the IoT infrastructure. To validate our approach, we have implemented a smart irrigation system testbed and demonstrate the effectiveness of the framework using this real-world scenario.

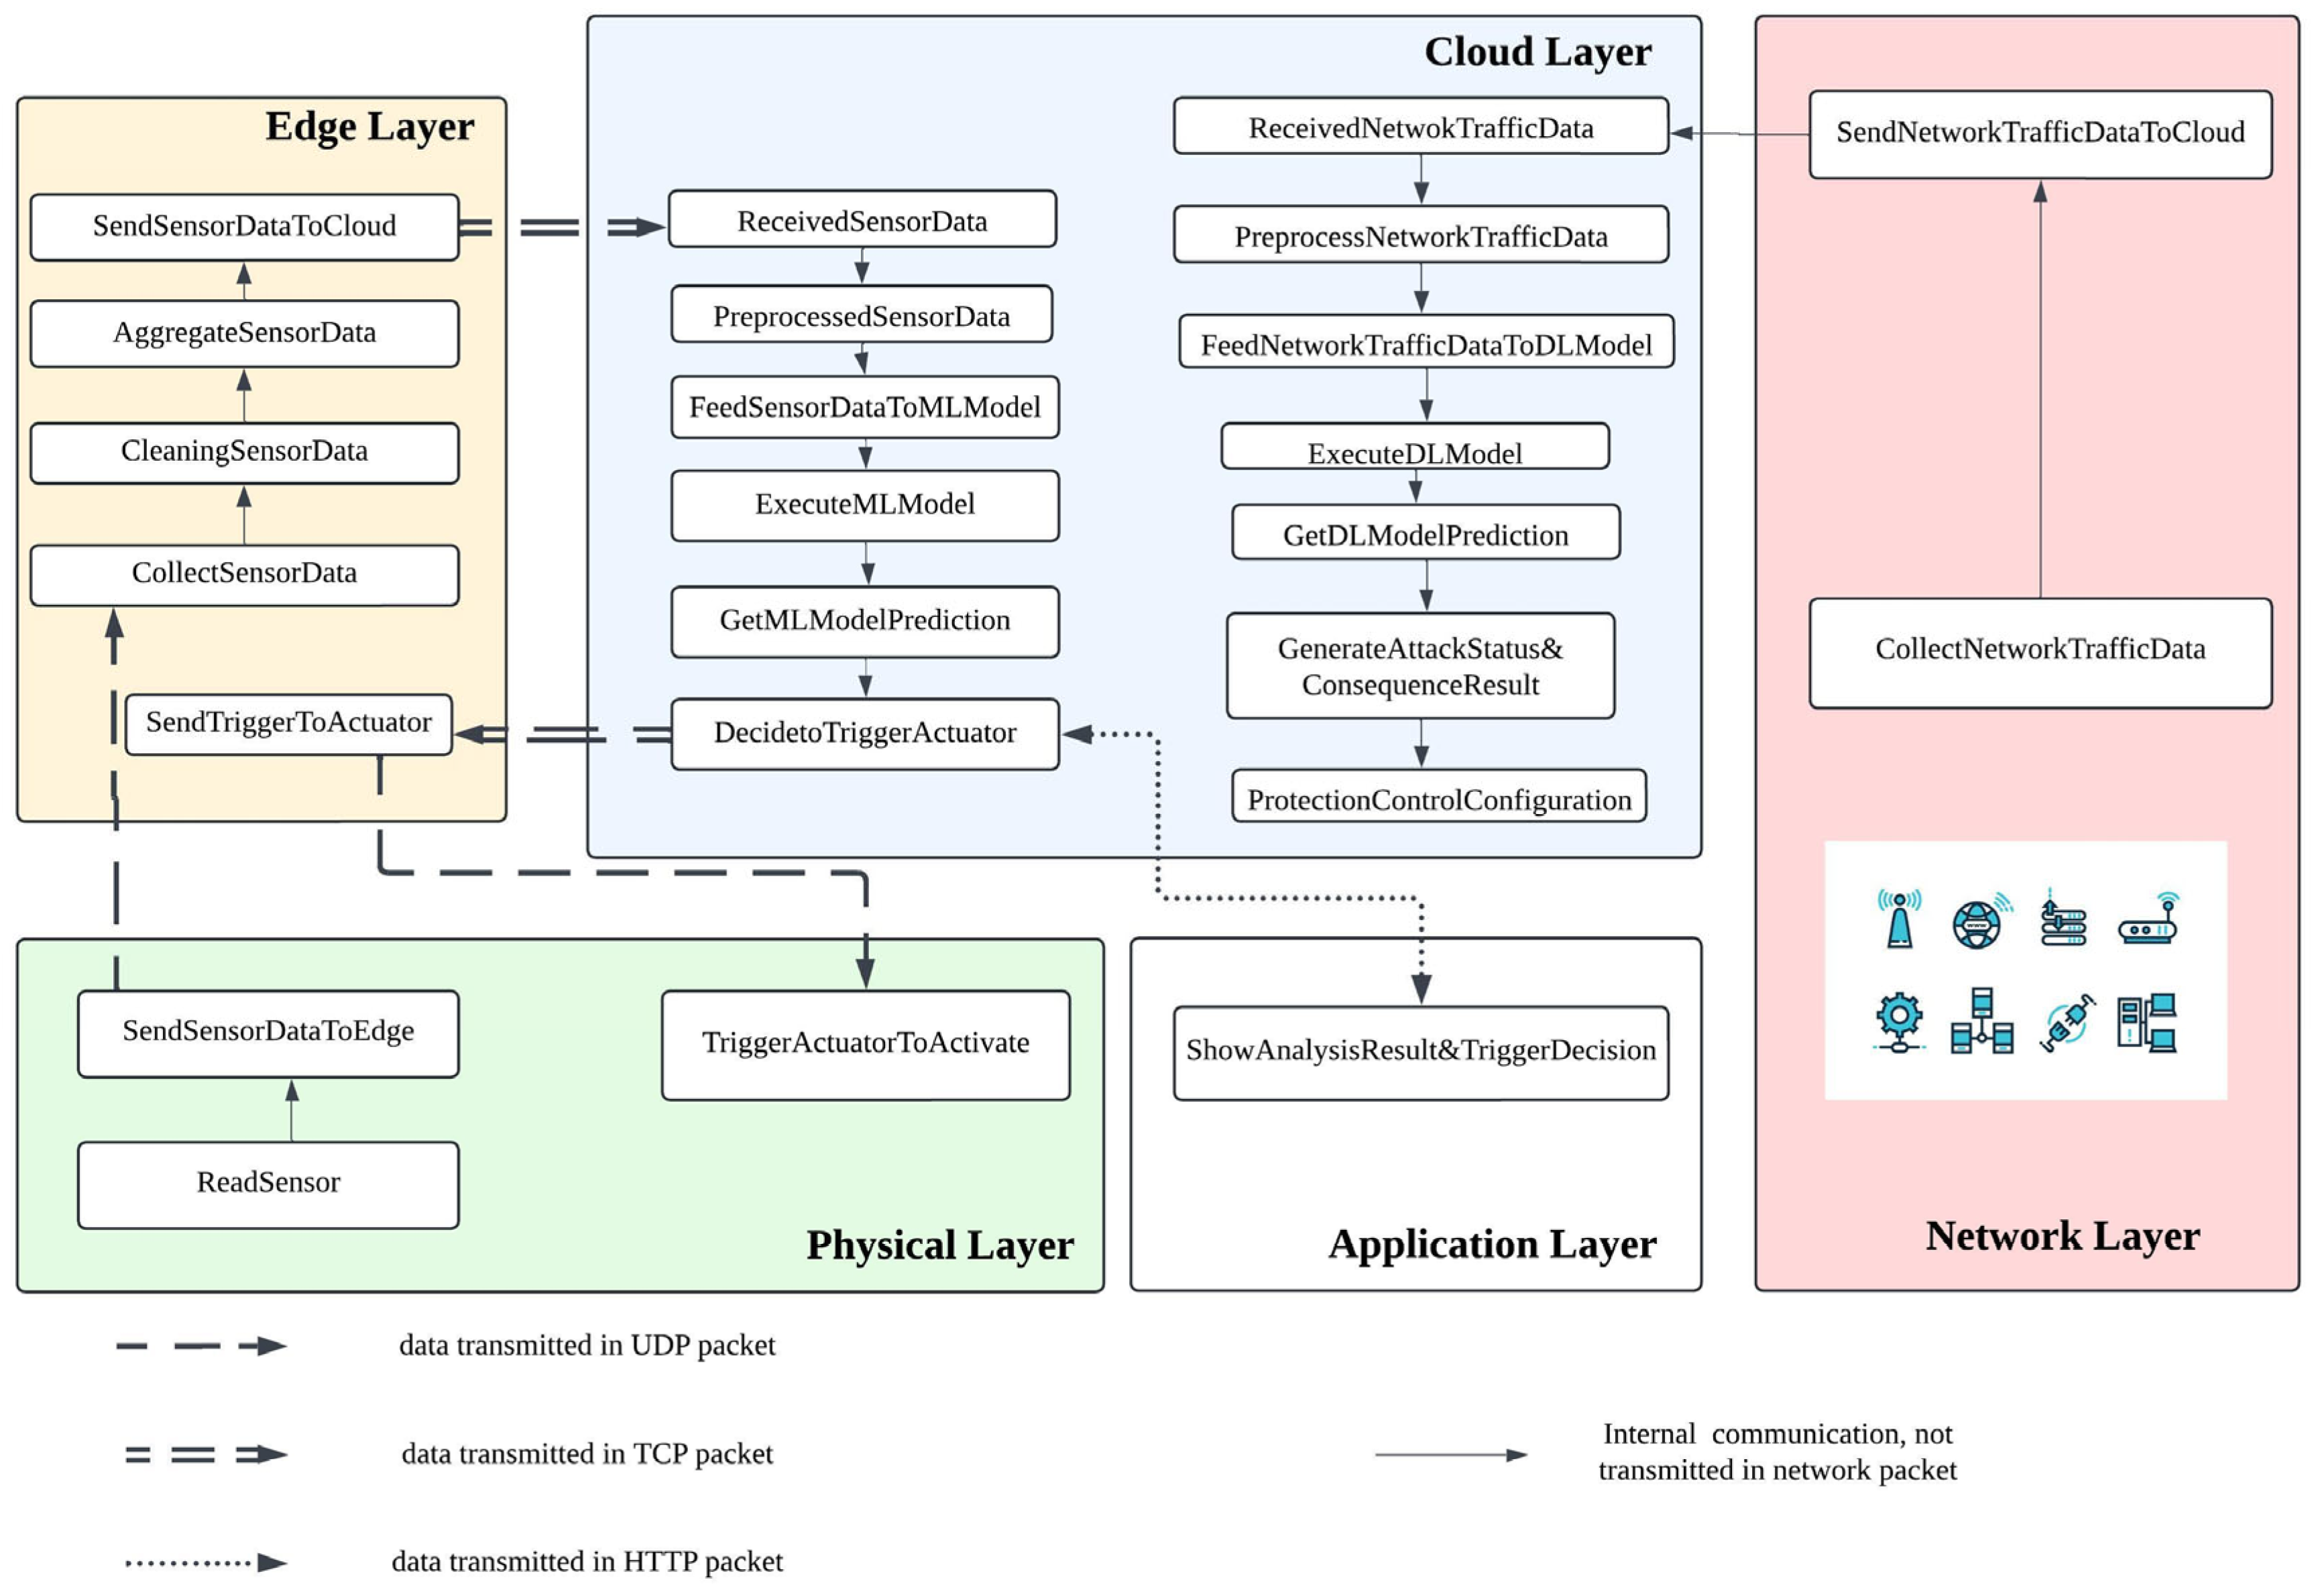
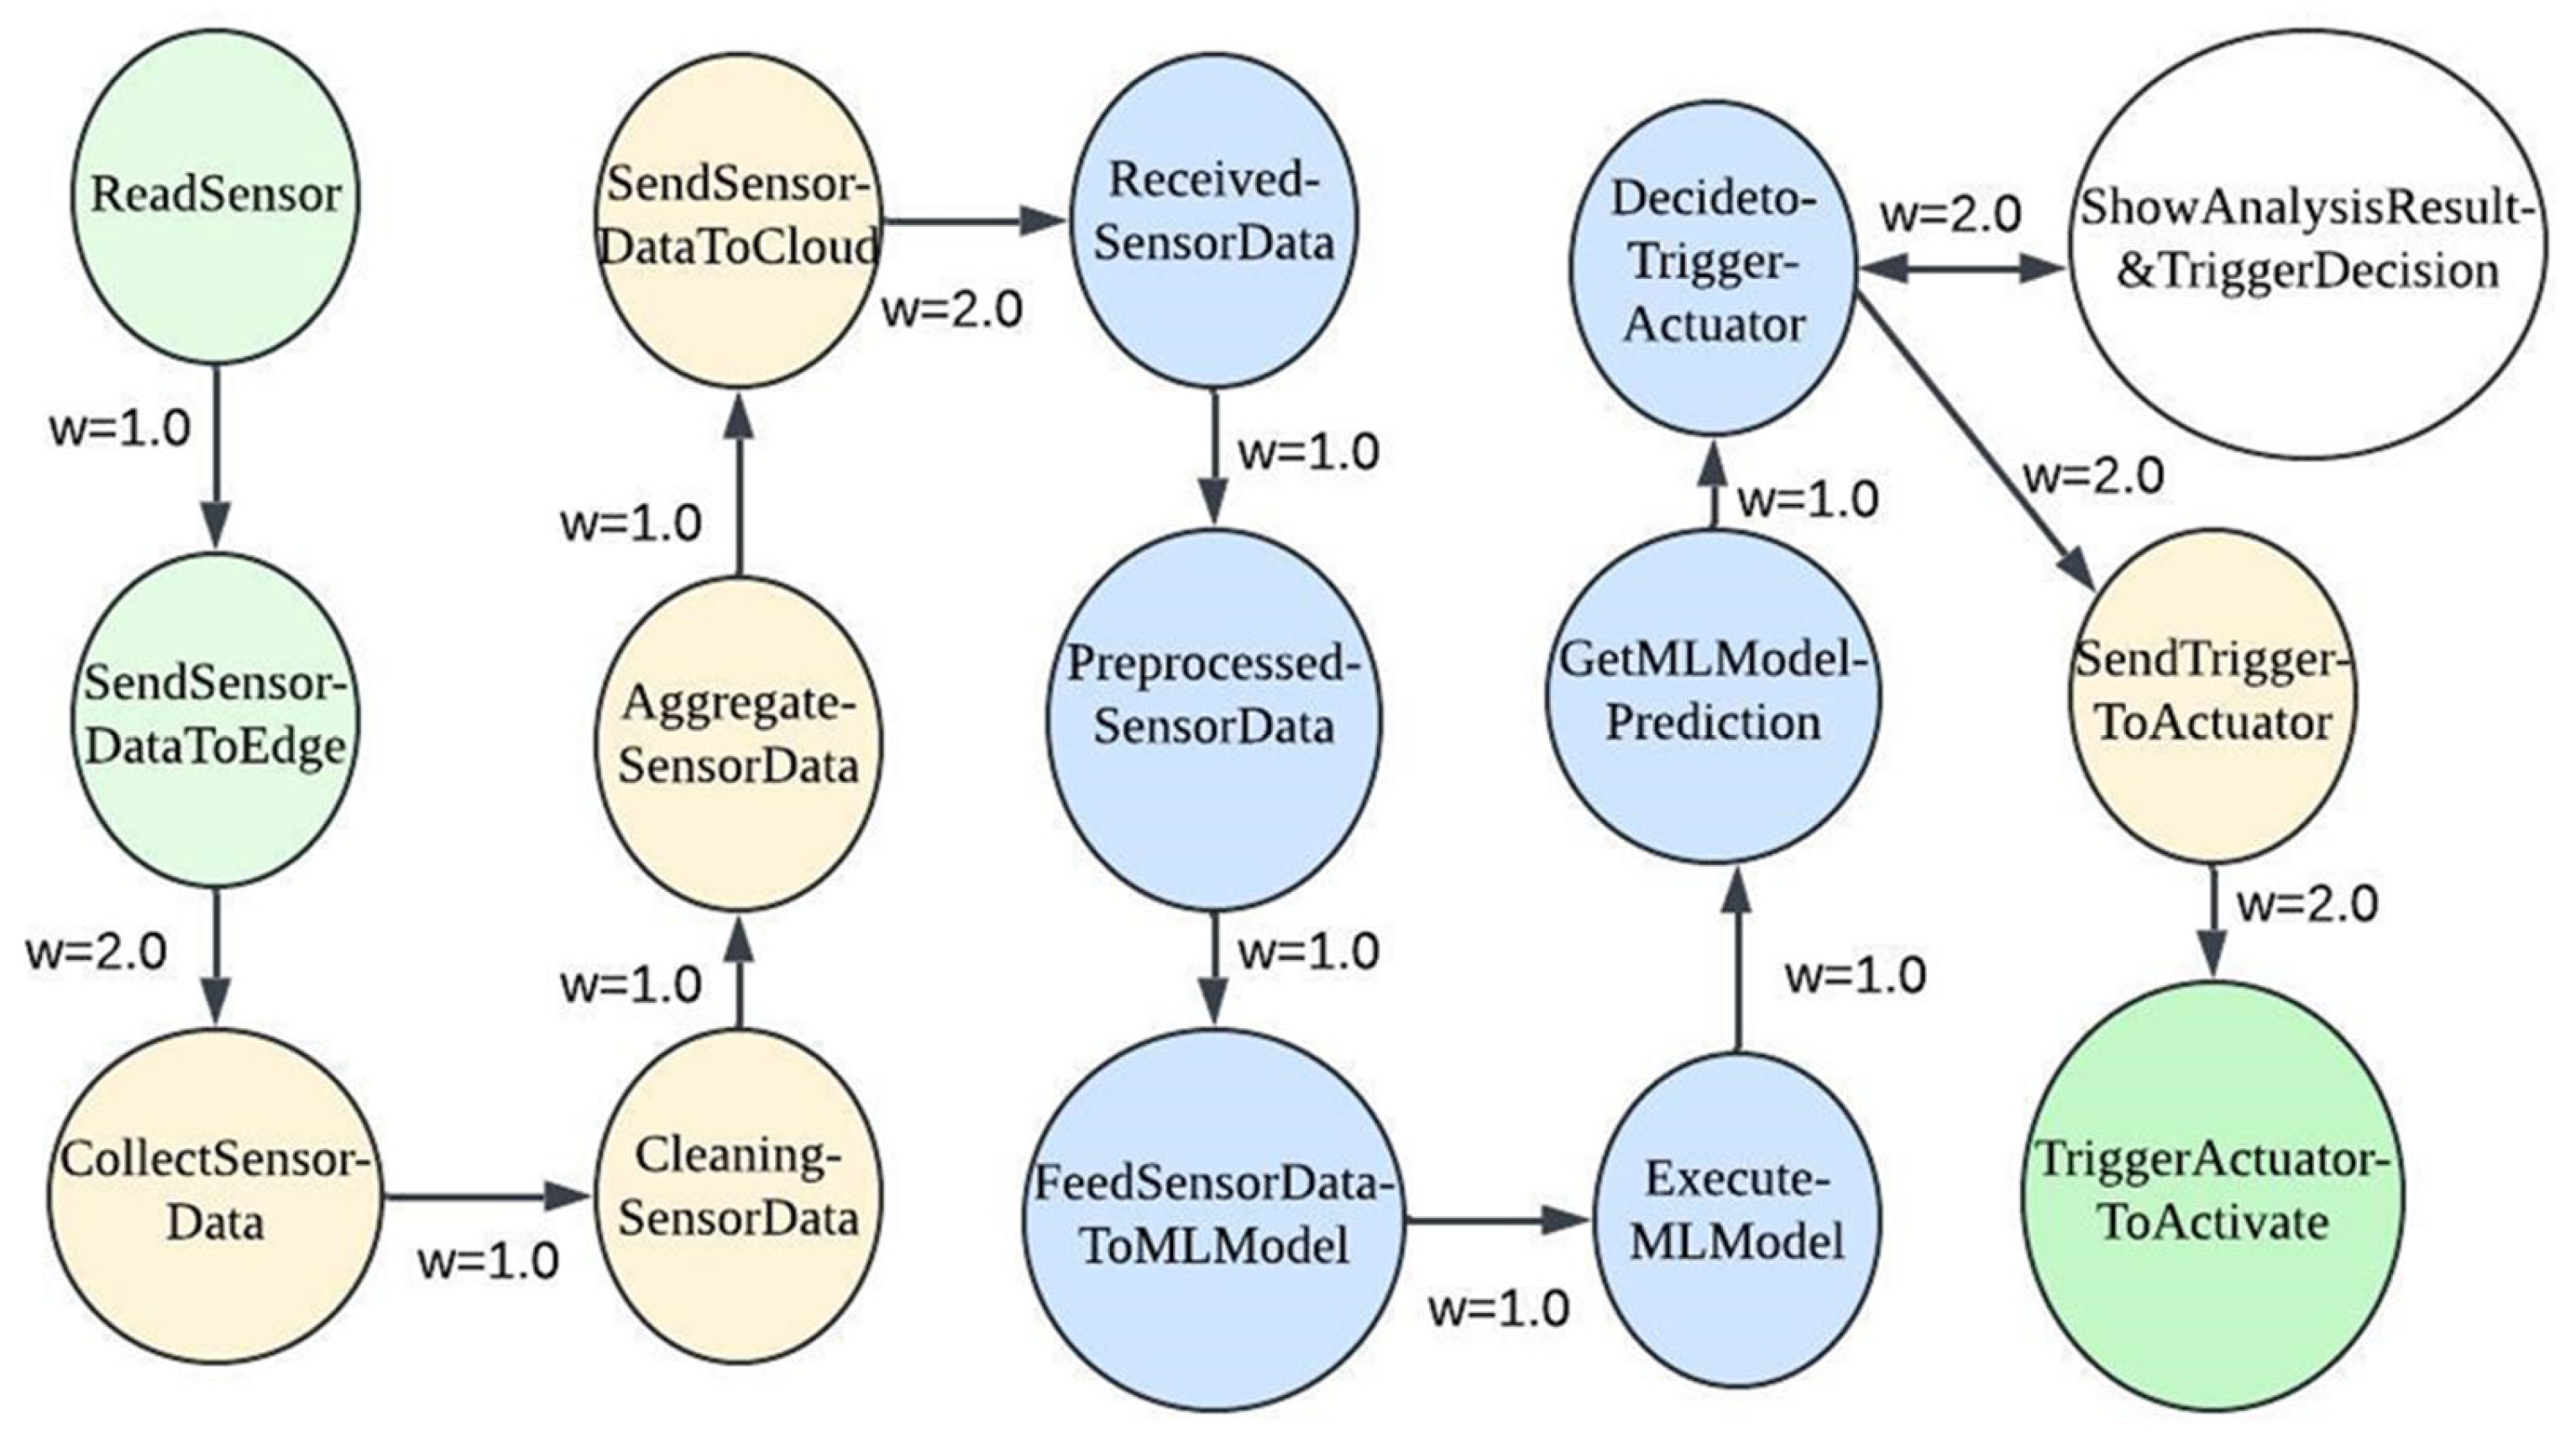
3.1. IoT Based Smart Irrigation System Testbed

Our designed IoT based Smart Irrigation System testbed has five layers, by adopting general IoT architecture [30,31], as shown in Figure 1. The Physical Layer consists of soil moisture sensors for monitoring soil water content, along with temperature and humidity sensors to capture ambient environmental conditions. These sensors are integrated through a hardware circuit centered around a Raspberry Pi, enabling real-time data acquisition and control. In the testbed environment, a buzzer is used as an actuator to simulate the behavior of an irrigation mechanism. This configuration supports controlled testing and validation of automated decision-making and response strategies within the system. To support data acquisition, the hardware circuit incorporates an Analog-to-Digital Converter (ADC) that converts the analog signals generated by the sensors into digital data. This conversion enables Raspberry Pi devices, positioned at the Edge Layer, to collect and process sensor input effectively. Within the Physical Layer, two primary processes are executed: ReadSensor, which captures real-time data from the sensors, and SendSensorDataToEdge, which transmits the digitized data to the Edge Layer. Communication between the Physical and Edge Layers is facilitated using the User Datagram Protocol (UDP), a lightweight and efficient protocol well-suited for real-time, low-overhead sensor data transmission.
The Edge Layer comprises Raspberry Pi devices responsible for collecting, preprocessing, and aggregating sensor data before forwarding it to a centralized server in the Cloud Layer. Upon receiving sensor data, each Raspberry Pi executes a sequence of processes, illustrated in Figure 1. The CollectSensorData process temporarily stores raw sensor readings for a predefined time window to support temporal analysis. The CleaningSensorData process enhances data integrity by filtering out anomalies such as null values, duplicate entries, and corrupted records. Next, the AggregateSensorData process computes statistical summaries (including average, minimum, and maximum values) to represent prevailing environmental conditions (e.g., soil moisture) over the specified interval. The final step in this layer, SendSensorDataToCloud, transmits the aggregated data to the Cloud Layer using the Transmission Control Protocol (TCP), which ensures reliable and ordered data delivery, and incorporates basic security mechanisms to protect data during transmission.
The Cloud Layer functions as the computational core or “brain” of the IoT system, responsible for executing advanced analytics and managing sensitive data. On the server side, a ML model is deployed to predict soil moisture levels and inform automated control decisions. We designed an automated pipeline that manages the end-to-end flow from data reception to actuator decision-making based on the model’s output. The pipeline initiates with the ReceivedSensorData process, which stores aggregated data from the Edge Layer into a local repository and logs the status of each transaction. The subsequent PreProcessSensorData stage formats and encodes the data, transforming it into a valid input instance for the ML model. This instance is then processed by FeedSensorDataToMLModel, which forwards the data to the prediction model. The ExecuteMLModel process activates the model to generate a prediction, which is logged by GetMLModelPrediction. The final stage, DecideToTriggerActuator, evaluates the prediction outcome and determines whether the irrigation valve actuator should be activated or not. The resulting decision is communicated along two paths:
  • To ShowAnalysisResult&TriggerDecision at the Application Layer, where the user is notified of the prediction and actuator decision.
  • To the Edge Layer, where the SendTriggerToActuator process relays the command to the Physical Layer. In this layer, the TriggerActuatorToActivate process initiates actuator activation, which is simulated in the testbed using a buzzer that represents the irrigation valve.
Communication from the Cloud to the Edge Layer also uses TCP to ensure reliable data transmission, whereas communication from the Edge to the Physical Layer uses UDP, favoring low-latency, lightweight messaging suitable for real-time actuation. The Application Layer hosts the ShowAnalysisResult&TriggerDecision process, which provides a user-friendly interface for visualizing analysis outcomes and system decisions. This interface also supports manual control, allowing users to override or trigger actuators as needed. Data exchange between Cloud and Application Layers is conducted over the Hypertext Transfer Protocol (HTTP), enabling seamless web-based interaction.
The Network Layer forms the foundational infrastructure of the system, comprising routers, Wi-Fi access points, and a network server responsible for managing traffic flow and facilitating end-to-end communication across all layers. To strengthen the system’s resilience against cyberattacks and security threats, it is crucial to secure the communication channels between different layers of the IoT architecture. However, the inherent heterogeneity of IoT ecosystems—characterized by diverse devices, communication protocols, and varying security configurations—introduces vulnerabilities that adversaries can exploit to disrupt system operations.
Addressing these risks requires embedding security awareness into the system, enabling it to detect anomalous changes and assess their potential impact in accordance with the unique characteristics and operational constraints of each architectural component. In our IoT-based smart irrigation system testbed, we focus on uncertain and potentially disruptive events such as Distributed Denial of Service (DDoS) attacks to prevent seamless communication among different layers in the IoT architecture. To mitigate these threats, the testbed integrates a DL model that predicts potential DDoS attacks by analyzing critical attributes of network traffic. The CollectNetworkTraffic process is responsible for capturing traffic data, extracting relevant features, and generating monitoring instances for further analysis.
The testbed leverages the publicly available Edge-IIoTset dataset [54], a comprehensive and heterogeneous collection of IoT cybersecurity traffic data that spans multiple layers of IoT applications. This dataset includes both benign and malicious traffic and features a wide range of DDoS attack scenarios targeting protocols such as TCP, UDP, and HTTP. Within the testbed, the CollectNetworkTraffic process is responsible for loading and preparing instances from the dataset for further analysis by the DL-based detection model. The SendNetworkTrafficDataToCloud process then transmits the preprocessed instances to a deep learning model hosted in the Cloud Layer, where the data is analyzed and classified as either benign or malicious.
This workflow is supported by a dedicated prediction pipeline, which comprises several processes—ranging from ReceivedNetworkTrafficData to GetDLModelPrediction—as illustrated in Figure 1. The pipeline in Figure 1 represents the operational phase of the system, during which the model is deployed and the testbed is actively running.
To ensure the adaptability and accuracy of predictions over time, we maintain separate retraining pipelines for both the pre-trained ML model (used to predict soil moisture) and the DL model (used to detect DDoS attacks). These pipelines use the latest batches of data for retraining. While not depicted in the process flow diagram for the sake of simplicity, these retraining routines are executed at regular intervals. Once retrained, the updated model artifacts are deployed to the ExecuteMLModel and ExecuteDLModel processes, respectively. We acknowledge that these retraining pipelines are crucial for maintaining model performance—particularly for discovering new or evolving attack patterns, including zero-day attacks. Currently, the DL model is not effective to handle the zero-day attack and is only retrained using a batch of 100 randomly selected samples from the Edge-IIoTset dataset [54], comprising both normal and attack traffic. In future work, we aim to generate ML-based synthetic data to simulate a diverse set of zero-day attack variants, which will be used to further retrain and improve the model’s robustness.
Returning to the prediction pipeline, this component serves not only as a real-time DDoS detection mechanism but also as a security awareness module. It provides interpretive insights into the network traffic features that contribute to anomalous behavior and assesses the potential impact of such anomalies on the system’s functionality and security posture. At the core of this capability lies the GenerateAttackStatus&ConsequenceResult process, which synthesizes comprehensive reports detailing the detected attack, the resulting system condition changes, and the potential consequences of the threat on the system’s operational behavior and overall security profile. This testbed configuration forms the foundation for describing and validating our proposed methodology for building intelligent, security-aware IoT systems.

3.2. IoT DDoS Dataset and DNN Model

As previously outlined, the testbed incorporates a DL pipeline specifically designed to detect DDoS attacks and generate actionable insights that embed security awareness into the testbed. At the core of this pipeline is a deep neural network (DNN) model, trained using 19 carefully selected features from the Edge-IIoTset dataset [54], which contains labeled IoT network traffic spanning three communication protocols. To optimize detection across different DDoS attack types—namely TCP, UDP, and HTTP—protocol-specific feature subsets were identified based on expert recommendations from [55]. For example, in the case of TCP-based DDoS attacks, which exploit the TCP three-way handshake by flooding the target with SYN packets, a set of critical features (referred to as TCP attributes) is selected, as detailed in Table 1. Corresponding feature sets were also derived for UDP and HTTP-based attacks.
The DL pipeline consists of several components starting from ReceivedNetworkTrafficData, which captures traffic data. For simulation purposes within our testbed environment, traffic instances are passed sequentially from the dataset [54]. Next, PreprocessNetworkTrafficData filters out irrelevant or noisy features from the network traffic instance and only includes the selected 19 features. Categorical variables like http.request.method, http.referer are label-encoded to facilitate numerical processing. Continuous features are normalized using the MaxAbsScaler, ensuring efficient training convergence. Finally, the FeedNetworkTrafficDataToDLModel module feeds the preprocessed data into the DNN for inference. The model is trained to classify three distinct DDoS attack types, as summarized in Table 2.
For DDoS attack detection, we employ a modified ResNet50-1D-CNN model, an adaptation of the well-established ResNet50 architecture tailored for one-dimensional network traffic data. ResNet50 is widely recognized for its deep residual learning capabilities [56], which allow the construction of very deep networks without suffering from vanishing gradient issues. Training is performed over 50 epochs, with early stopping and learning rate reduction applied to prevent overfitting and enhance generalization. The final trained model achieves a high accuracy of 99%, demonstrating strong performance and robustness across different DDoS attack types. We selected this model due to its high detection accuracy and its effectiveness on our dataset. However, this work does not advocate for ResNet50-1D-CNN as a universal solution. The choice of ML/DL models should be determined by each organization’s specific security requirements and the nature of their datasets.
Once deployed in the testbed, the ResNet50-1D-CNN model continuously analyzes incoming network traffic through the ExecuteDLModel process within the pipeline (as illustrated Figure 1). When a potential DDoS attack is detected, both the model’s prediction and the corresponding network traffic instance are passed to the GenerateAttackStatus&ConsequenceResult process. This process generates a structured and insightful report on the system’s current security state. The resulting output can be leveraged to assess system vulnerability and prioritize appropriate responses. While the actual development of mitigation strategies is beyond the current scope of this paper, this structured awareness output lays the foundation for future work in dynamic and informed risk mitigation planning.

3.3. Local Explanation of the DNN Model and Information Extraction

LIME (Local Interpretable Model-Agnostic Explanations) [41,42,43] is an XAI technique that provides local explanations for individual model predictions. In the context of DDoS detection, LIME highlights the specific attributes and their values that most influenced the model’s decision for a given network traffic instance. LIME operates by perturbing the input data instance in the vicinity of its original attribute values, generating a neighborhood of synthetic samples. It then fits a sparse linear surrogate model to approximate the behavior of the complex model (in this case, our ResNet50-1D-CNN) within that local region. Each perturbed sample is weighted based on its proximity to the original instance, ensuring the surrogate model focuses on the most relevant variations.
The resulting LIME explanation identifies which attributes had the most significant impact on the model’s prediction, along with the specific conditions under which they influence the outcome. These insights help uncover patterns or anomalies that may indicate uncertain or suspicious behaviors potentially leading to a DDoS attack. Thus, LIME not only enhances interpretability but also contributes to a deeper understanding of the factors underlying security threats, as illustrated in Figure 2:
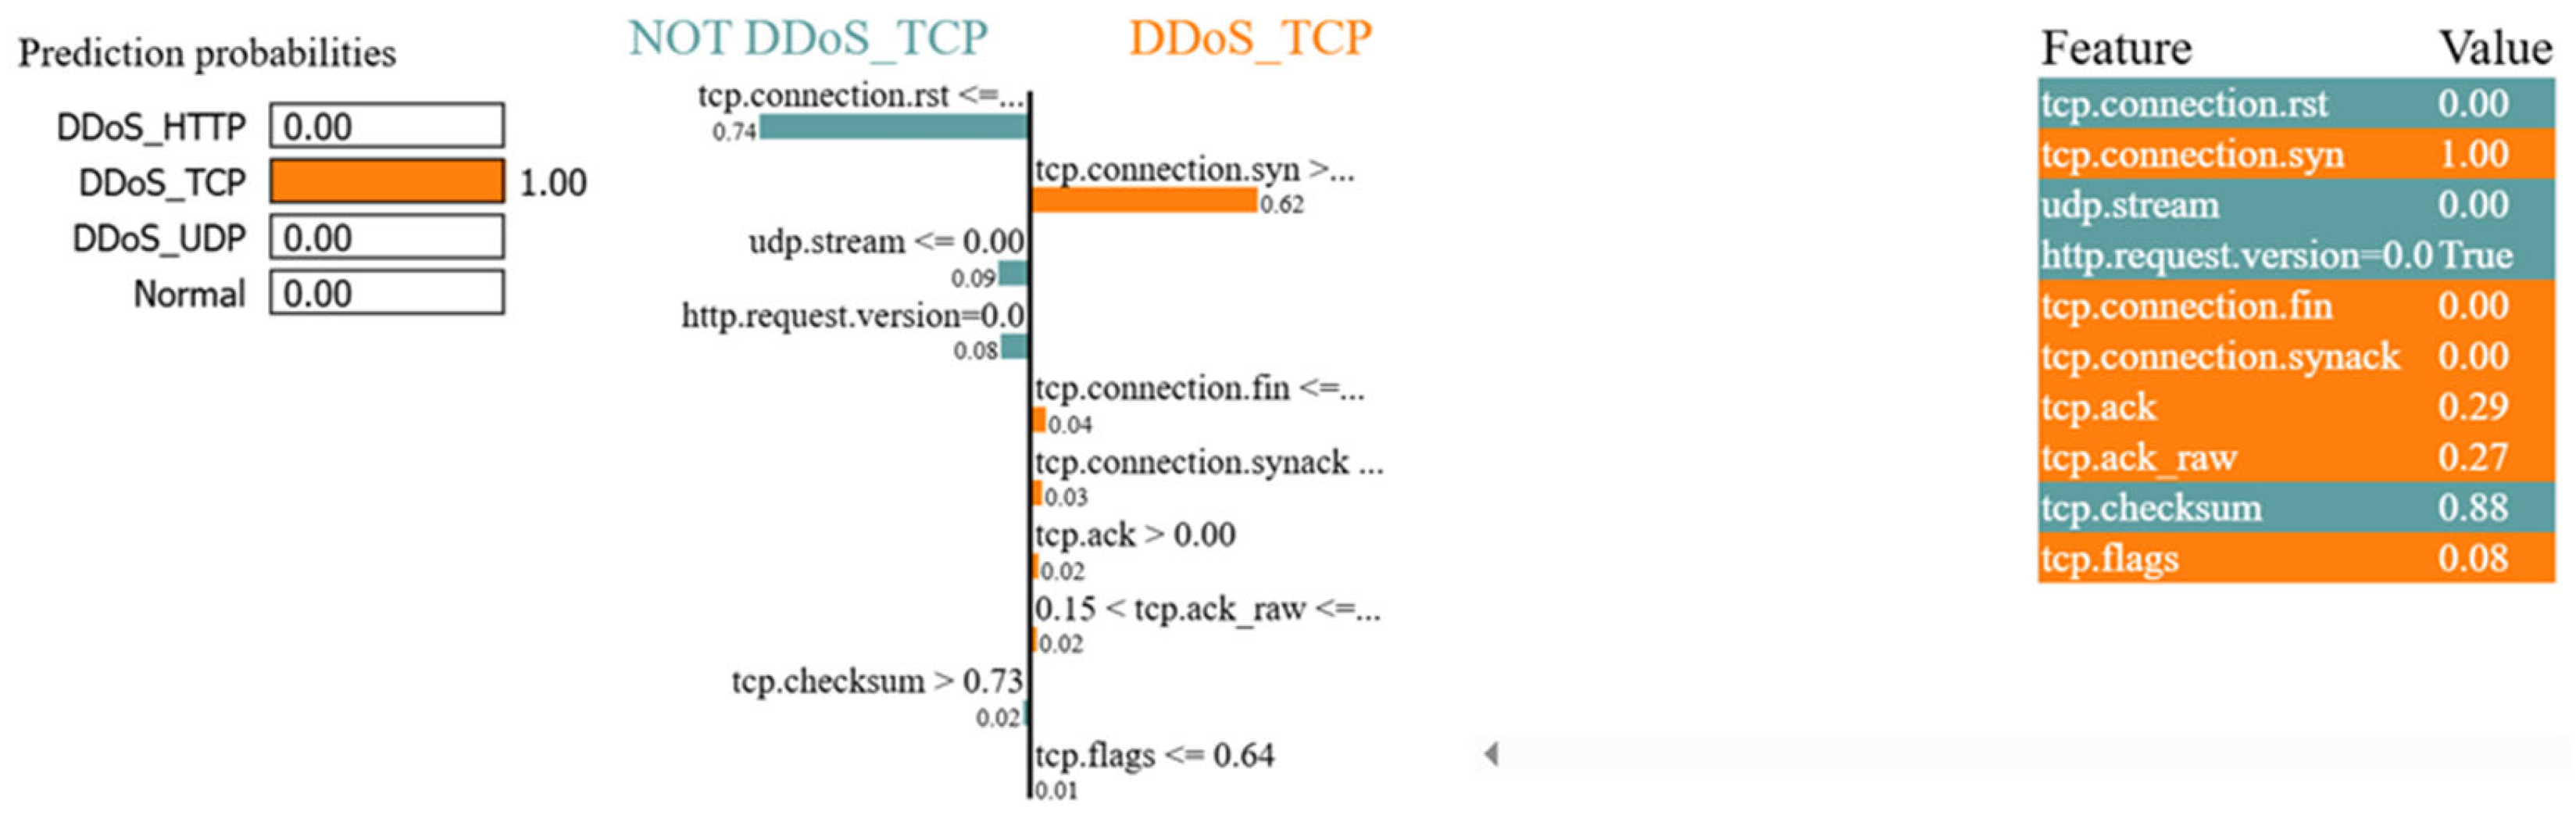
  • Left Side (NOT DDoS_UDP): Displays attributes that contributed to the prediction that the instance is not a DDoS_UDP attack.
  • Right Side (DDoS_UDP): Highlights attributes that pushed the prediction toward a DDoS_UDP classification.
Each horizontal bar represents an attribute, where the length indicates the magnitude of its influence and the direction shows whether it supports or opposes the predicted class. For example, udp.stream > 0.00 (0.01): Indicates that a high volume of UDP packets (where the original value is 0.73) contributes positively to a DDoS_UDP classification. This may reflect an attempt to overwhelm servers through excessive UDP traffic.
While LIME provides valuable instance-level explanations, it does not fully address how these changing conditions affect the system’s broader security posture. To bridge this gap, we integrate an automated interpretation generator within the GenerateAttackStatus&ConsequenceResult process. This component enriches local explanations by mapping them into the system’s overarching security profile, offering higher-level insights into how specific attribute variations impact both system functionality and overall risk exposure.
The GenerateAttackStatus&ConsequenceResult takes two primary inputs: (i) local explanations generated by LIME from DNN prediction instances, and (ii) a Security Assurance Case (SAC), which serves as the system’s security profile, as illustrated in Figure 3. A parsing module, parseExplanation, processes each explanation and generates a set of ordered attribute-state pairs by considering the top 10 attributes, which positively contributes to the prediction, denoted as
S e x p = { ( a t t r , s t ) }
Here, a t t r refers to an attribute from the explanation, and s t denotes its corresponding condition. For instance, based on the LIME explanation of a DDoS_UDP attack shown in Figure 2, parseExplanation would produce the set:
S e x p = { ( u d p . s t r e a m ,   u d p . s t r e a m   >   0 ) , ( t c p . c o n n e c t i o n . f i n ,   t c p . c o n n e c t i o n . f i n = <   0 ) ,                   ( t c p . a c k . r a w , t c p . a c k . r a w < =   0.15 ) ,                   ( t c p . a c k ,   t c p . a c k < =   0 ) }
This parsing step is repeated for every prediction instance to capture the behavior patterns reflected in the explanation. The GenerateAttackStatus&ConsequenceResult process also takes as input a corresponding SAC instance, which articulates security compliance arguments tied to the system’s security requirements. Within this step, the ExtractGoalAttributeRelation process extracts dependencies between SAC goals and system attributes. The output is a set of tuples
S s a c = { ( G , P r o c , a t t r , I m p o r t a n c e ) }
where G   is a goal defined within the SAC,
  • P r o c 
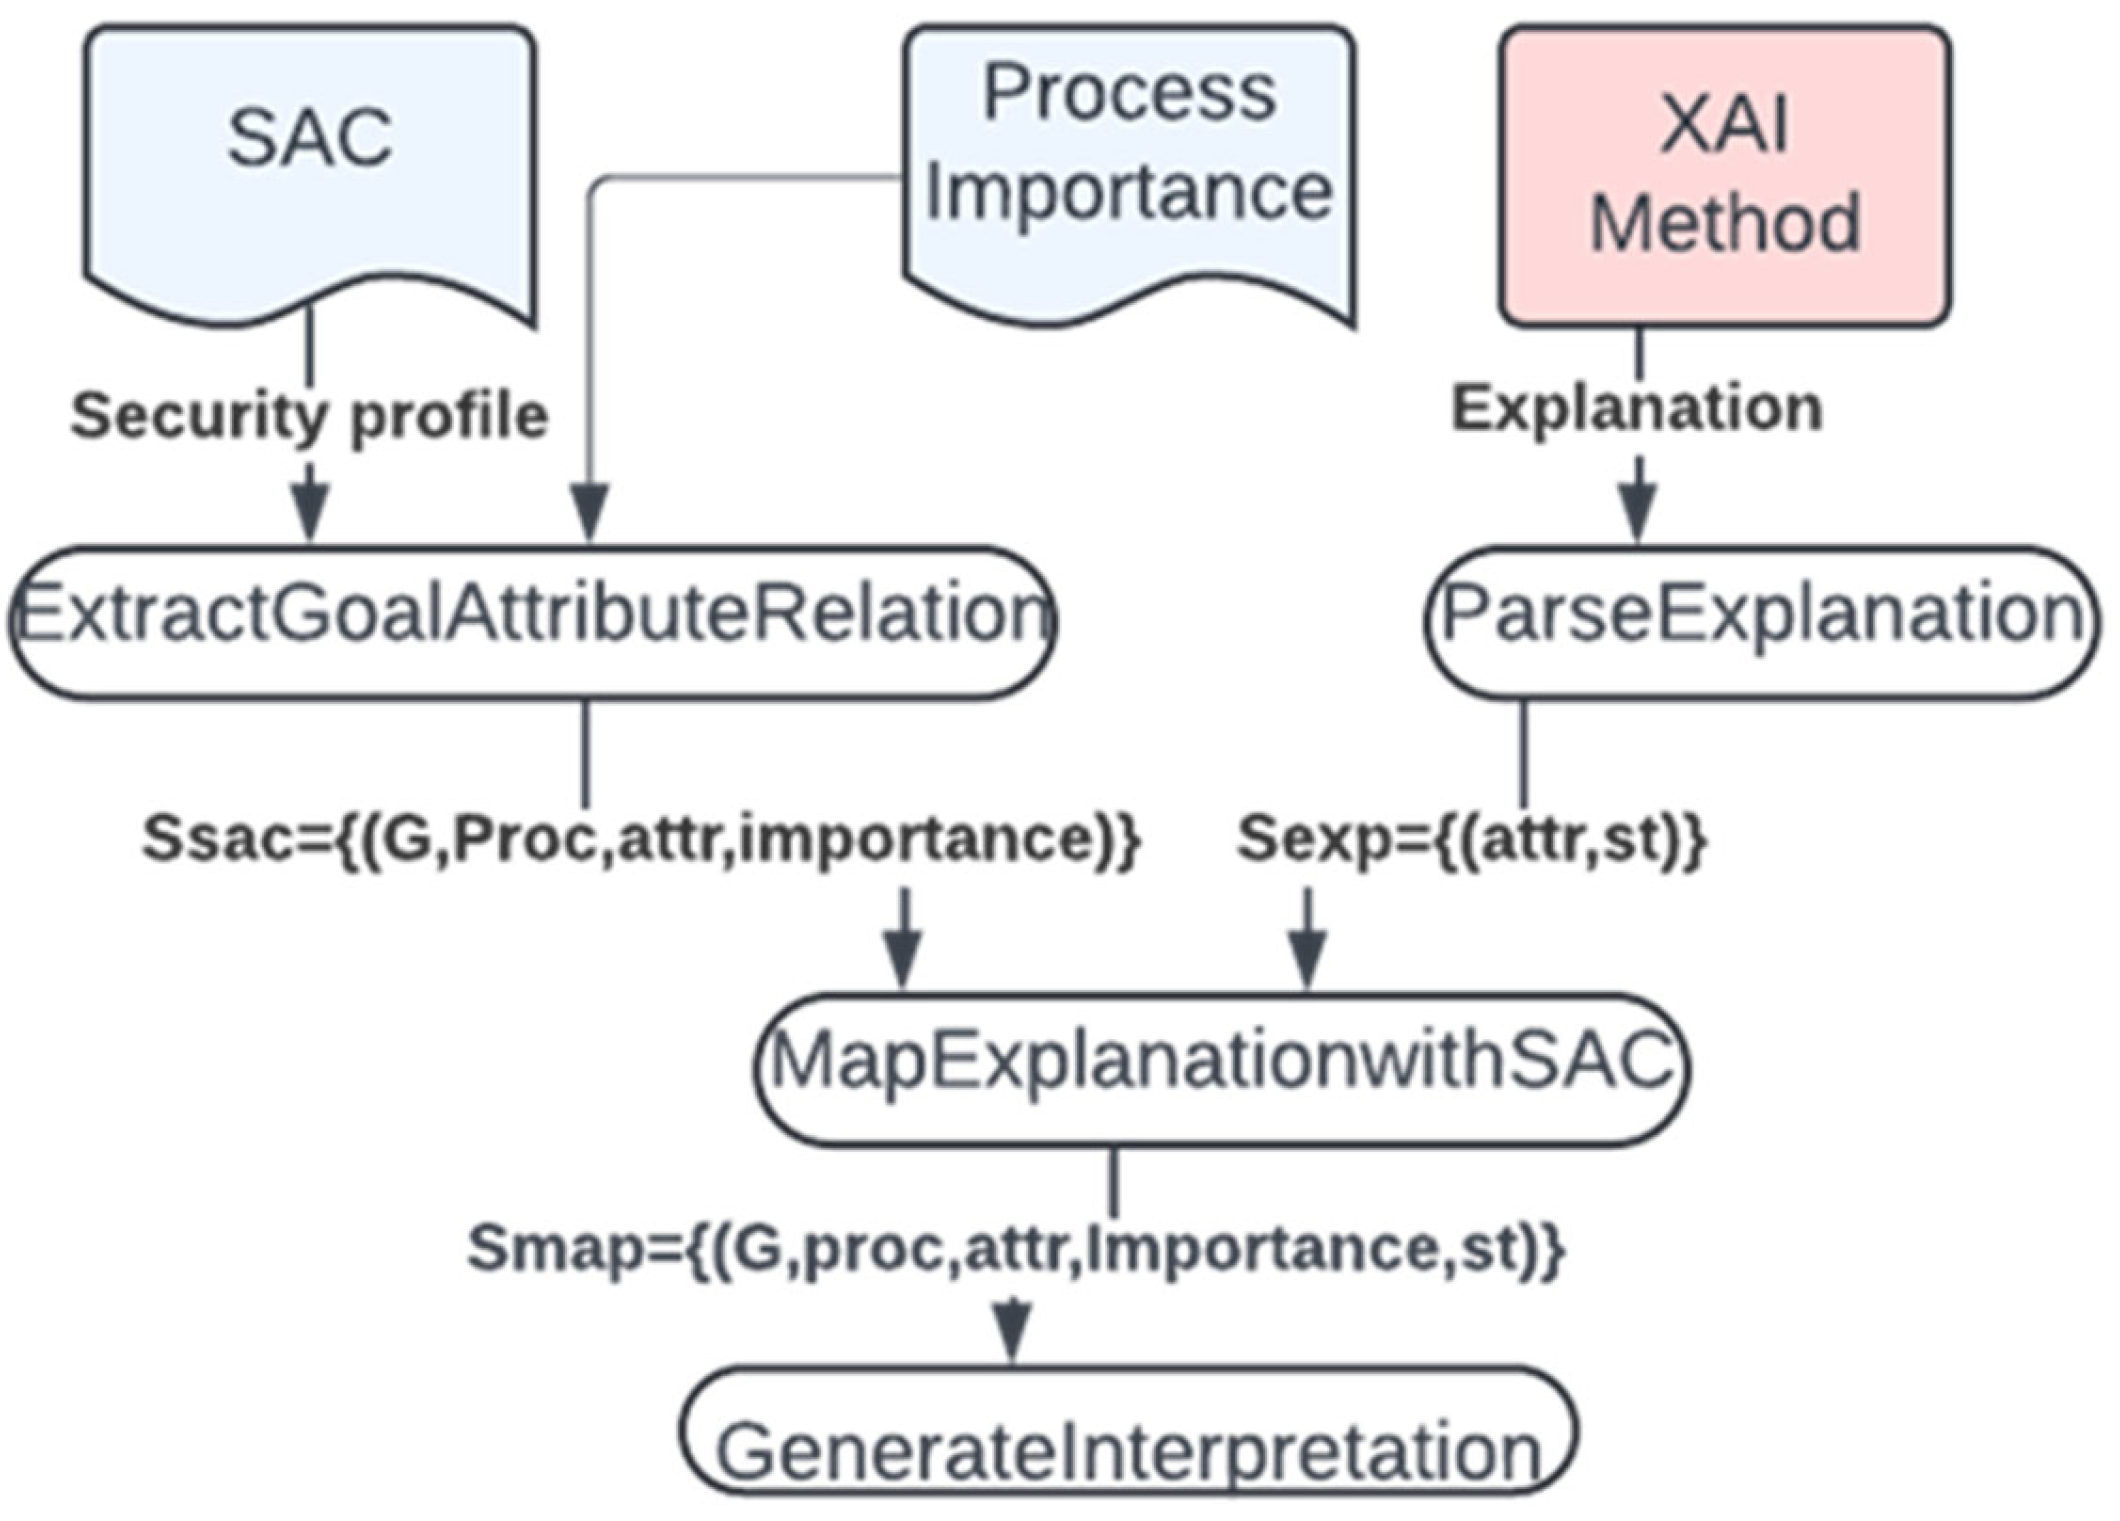
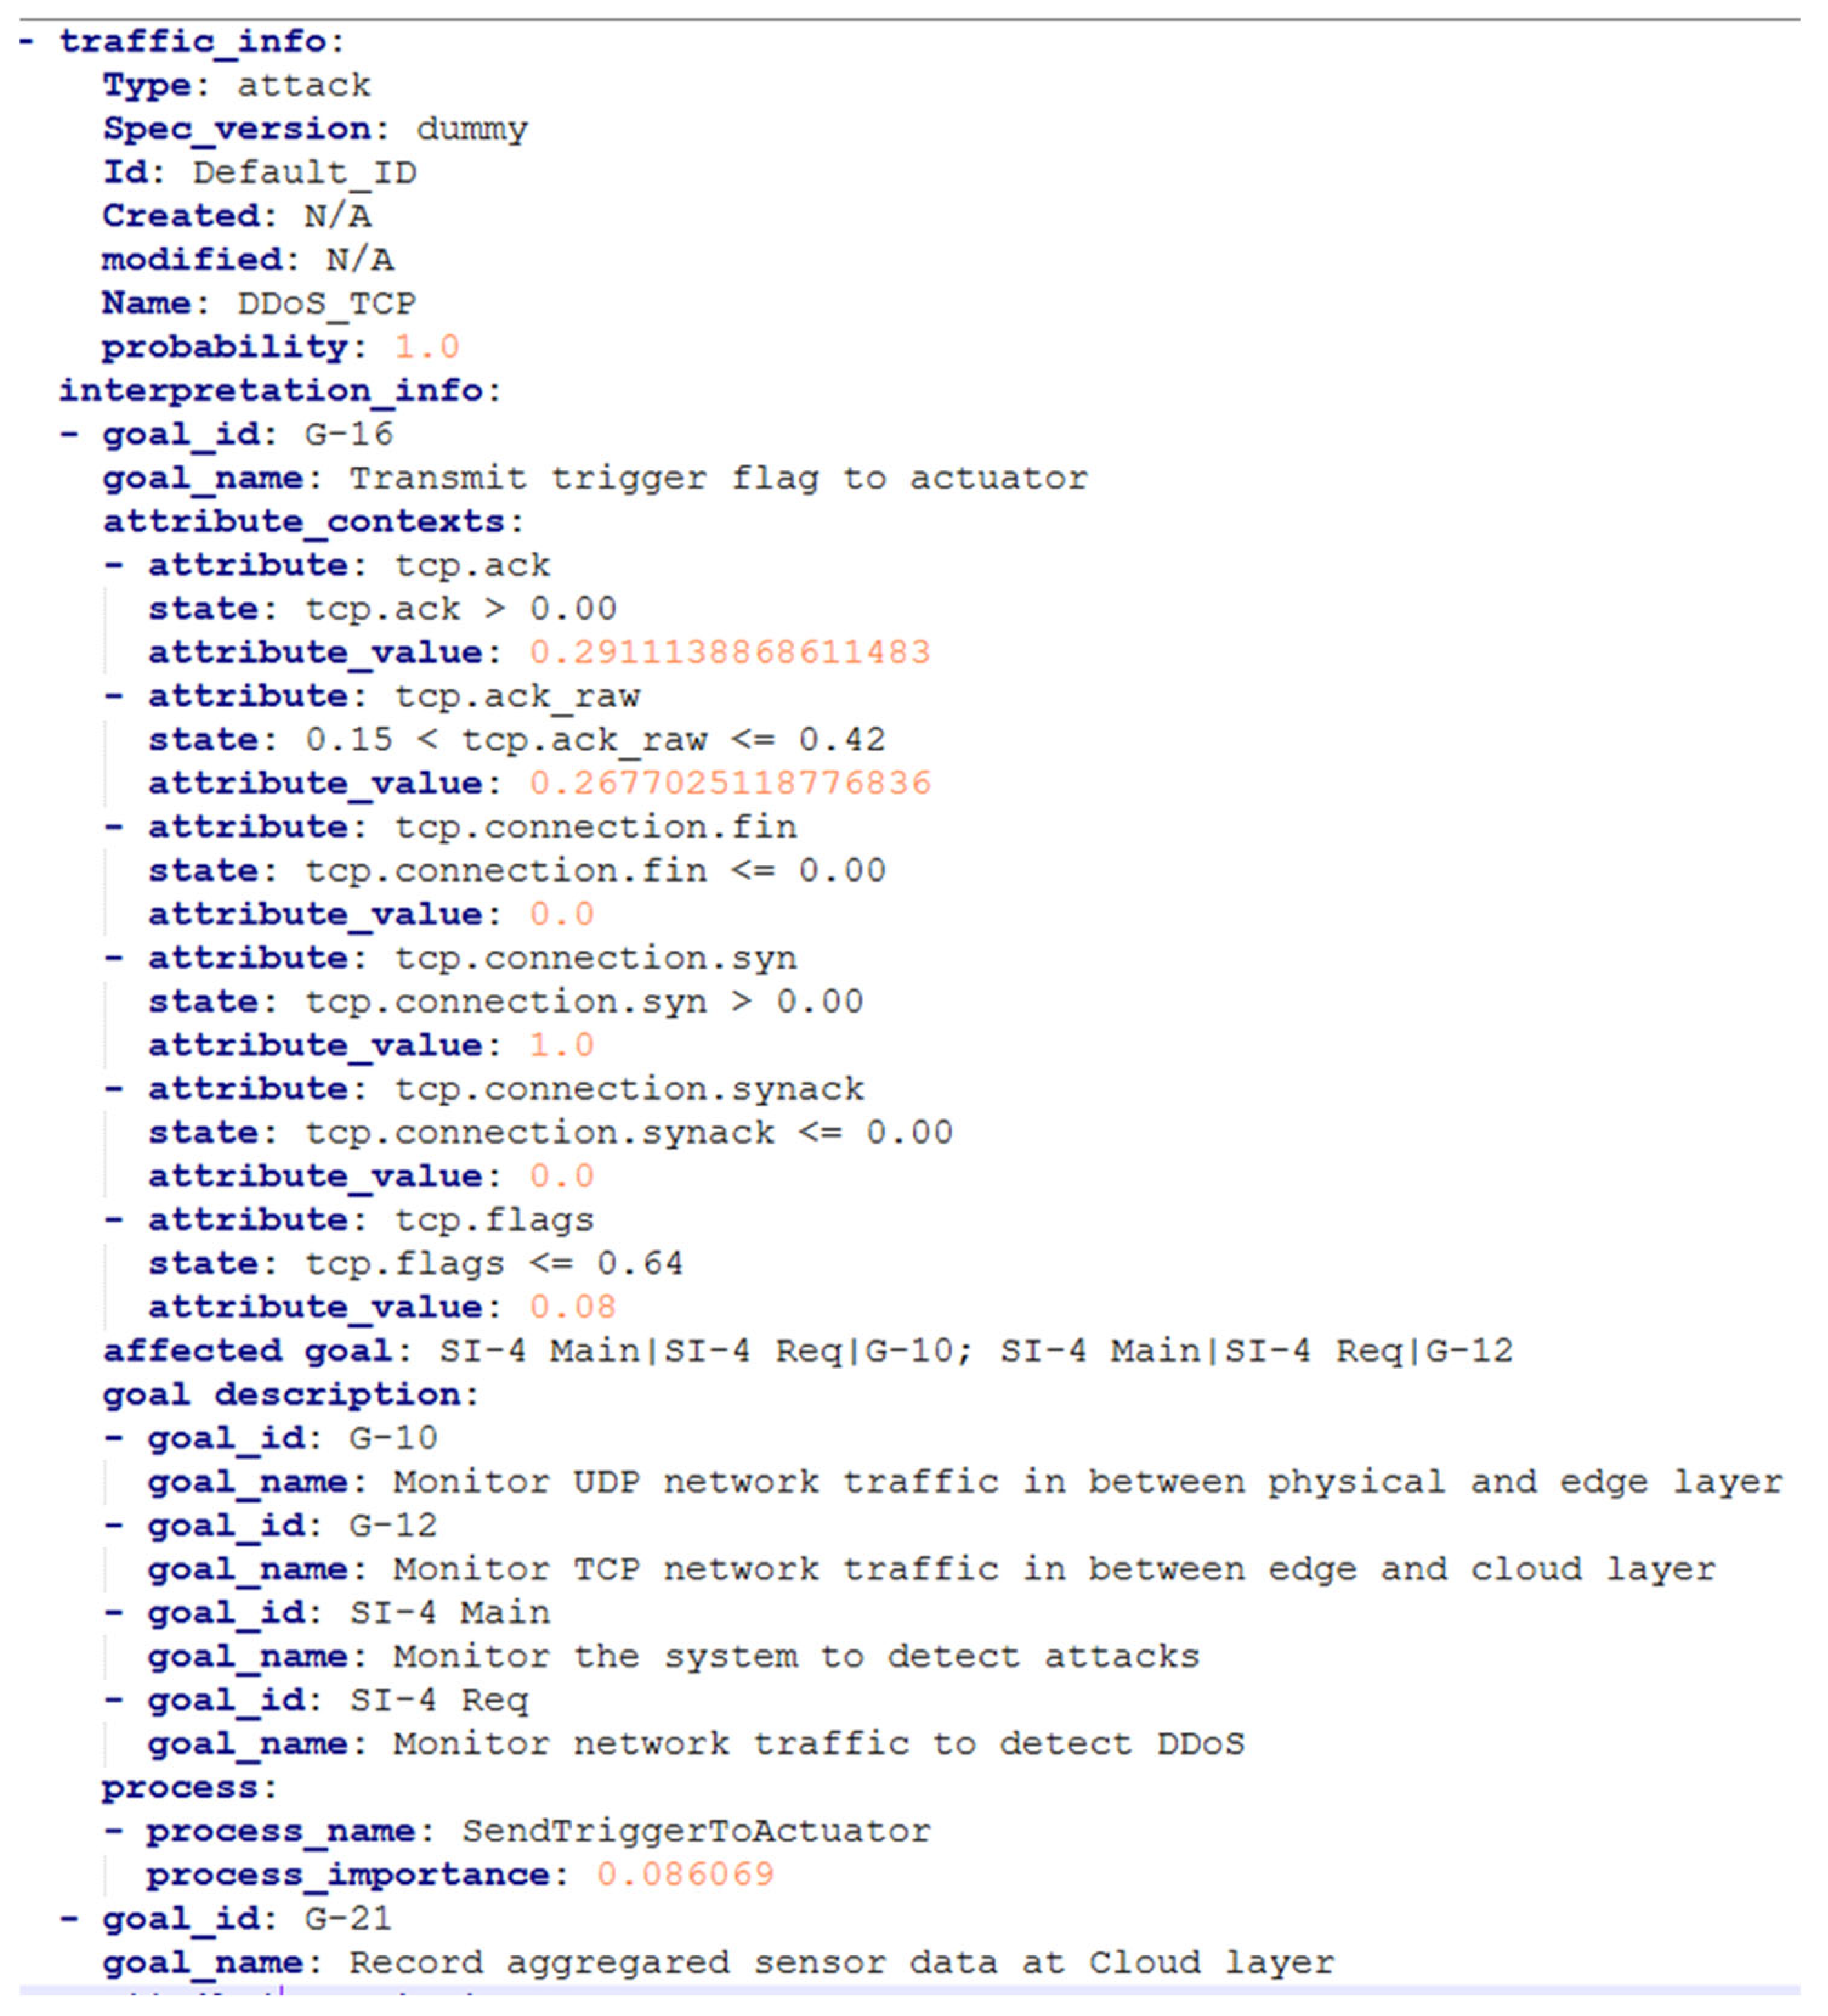
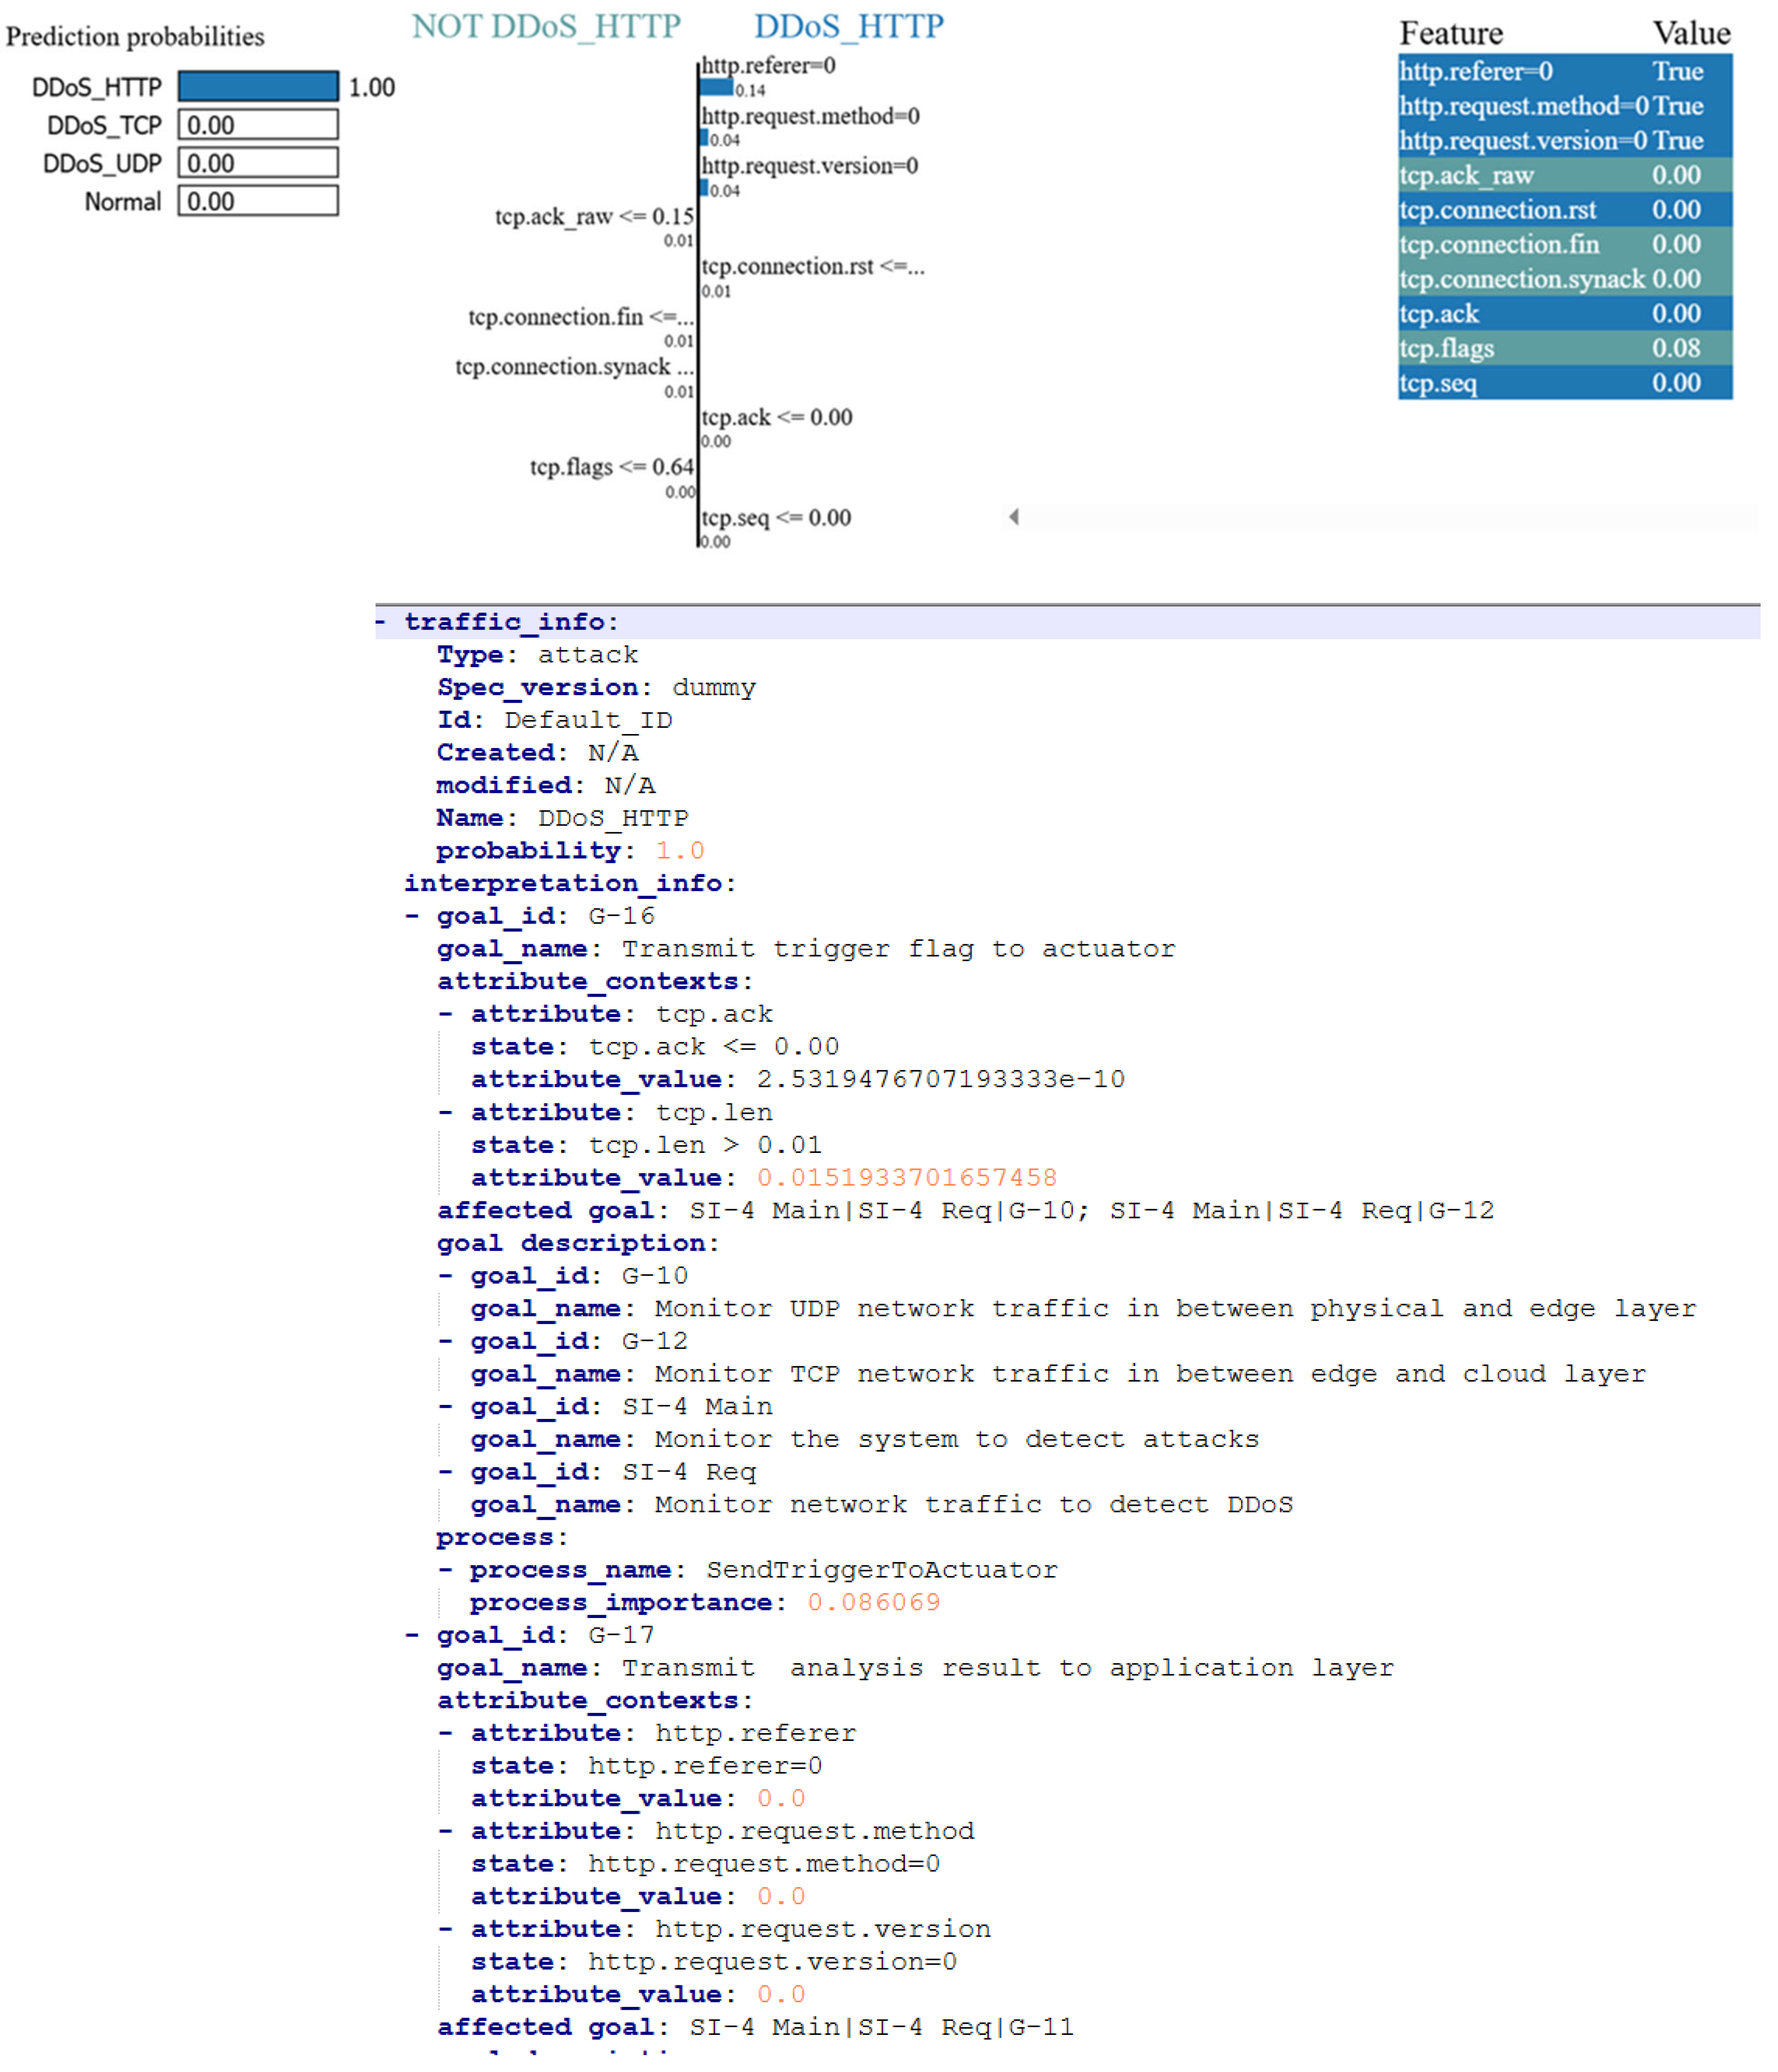
is the system process responsible for fulfilling that goal,
  • a t t r is the set of attributes linked to the goal via solution nodes in the SAC and used within P r o c ,
  • I m p o r t a n c e is the Importance Factor (IF) assigned to each process based on its contribution to the overall system’s operation. Details on how IF is computed are provided in a later section.
The relationships among processes and their respective goals are modeled through SupportedBy links in the SAC structure.
For the testbed, we choose three security controls from the NIST SP 800-53 [57] framework as security requirements with the aim of mitigating DDoS threats. The statements of those security controls are expressed as the top-level goal in the SAC, as shown in Figure 4. Those goals are as follows:
SC-5: “System(s) protect against or limit the effects of denial-of-service events and employ the necessary controls to achieve this objective”.
This goal is supported by two related security control goals:
SC-5(3): “System(s) employ monitoring tools to detect indicators of denial-of-service attacks initiated via network traffic flooding”.
SI-4: “System(s) continuously monitor to detect attacks and potential indicators of compromise in alignment with security objectives”.
We adopt the GSN [22] template and initialization methodology for constructing SAC as introduced by Jahan et al. in [16]. The SAC instance, structured using GSN, organizes the assurance argument hierarchically to demonstrate compliance with the specified security controls. A partial view of this argument structure is illustrated in Figure 5. In GSN, goals, represented as rectangles, articulate the security requirements that must be satisfied. Each top-level goal is further refined into one or more strategies (parallelograms) or sub-goals, capturing the logical decomposition and interdependencies among system processes involved in fulfilling the requirement. These interdependencies are represented using SupportedBy relationships, visualized as filled arrows connecting related nodes. Solution nodes (circles) provide supporting evidence that specific system processes are functioning as intended and are capable of meeting the corresponding goals. This structured approach allows the SAC to trace how individual processes contribute to overall system assurance and facilitates the integration of explainable AI insights into the broader security argument.
In the ExtractGoalAttributeRelation process, the SAC instance is encoded into a tree structure based on the SupportedBy relationships defined in the GSN model. In this tree, top-level goals act as root nodes, and the leaf nodes represent solution nodes providing evidence. The objective is to trace all possible dependency paths from each root goal to its corresponding solution nodes. To achieve this, a depth-first search (DFS) [58] traversal is employed. For each root node, a stack is maintained, where each stack item holds a list representing the current path from the root to a given node. If a node has no children, it is considered a leaf node, and the path is stored in the set AllPaths. Otherwise, the current path is extended to each child node and pushed back onto the stack for further traversal.
An example of a path extracted through this traversal is as follows:
SI-4 Main | S9 | SI-4 Req | S10 | G-10 | S11 | G-13 | Sn6
This path illustrates that the solution node Sn6, which monitors UDP traffic attributes, provides evidence about behaviors in network traffic conforming to the UDP. From this, it can be inferred that a potential DDoS_UDP attack is launched by manipulating UDP attributes and could compromise goal G-13, which ensures functionality—“Transmit sensor data readings to the edge layer.” This, in turn, would affect the SendSensorDataToEdge process (linked via strategy S11), demonstrating how such manipulation cascades through the assurance case, eventually impacting the top-level security control goals such as SI-4 Main. This kind of dependency tracing is critical for understanding the cascading effects of component compromise and identifying affected goals and processes.
The ExtractGoalAttributeRelation process outputs a set of dependencies in the following form:
S s a c =   { (   G 13 , S e n d S e n s o r D a t a T o E d g e , u d p . s t r e a m , 0.016 ) } .
Here, the tuple indicates that goal G-13 could be degraded because the process SendSensorDataToEdge, which is associated with the attribute udp.stream, has been impacted by the change in udp.stream attribute’s state. And assigned an IF to SendSensorDataToEdge is 0.016.
Next, the MapExplanationWithSAC process maps attributes from the local explanation set S e x p   to entries in S s a c . It extracts and compiles information about which goals and processes are affected by the current states of attributes (denoted by st in each S e x p tuple). The output of this step is
S m a p   =   { ( G , P r o c , A t t r , I F , s t ) }
This mapping forms the basis for generating a high-level interpretation. The GenerateInterpretation process uses mapped information to generate a structured interpretation of the explanation, illustrated in Figure 6, in JSON format. The resulting JSON object contains two major substructures:
  • interpretation_info: A nested object outlining affected attributes and their states, associated processes, corresponding goals, and IFs.
  • traffic_info: A summary of the model’s prediction (e.g., DDoS_UDP with 99% confidence) and the relevant attack context.
In the example scenario, the interpretation confirms a DDoS_UDP attack with 99.99% confidence. The attack targets the SendSensorDataToEdge process (identified under the process object), which has an IF of 0.016, by manipulating the udp.stream attribute with the condition udp.stream > 0. The objective of this attack is to disrupt the functionality of the SendSensorDataToEdge process, whose purpose is defined in Goal G-13 as “transmit sensor data reading to edge layer,” as indicated in the interpretation_info object of the JSON report.
Due to the interdependencies within the system, this attack also affects other goals—specifically G-10, SI-4 Req, and SI-4 Main—as illustrated in Figure 6 and listed under the affected_goal attribute in the JSON report. These cascading impacts highlight the interconnected nature of system goals within the security profile and the broader consequences of a targeted process disruption.

3.4. Generate System-Call Dependency Graph (ScD Graph) and Calculate Importance Factor (IF) Assigned to Each Process

The outcome of the mapping technique pinpoints the affected functionalities and security requirements due to the changes in the conditions of the system’s attributes. It also includes process importance, which is the IF of the process. IF is defined as the significance of those processes in continuing the system’s operation.
We model the IoT system’s internal architecture and interdependencies among the processes as a form of call graph, G = ( V , E ) where V is the set of nodes in the graph representing the processes in IoT system, and E is the set of directed edges connecting the nodes, expressing the calling relationship among the processes, and thus the control flow from process to process. An edge e i j   in E is an ordered pair of nodes v i   , v j   V , representing the control flow from node v i   to v j   .
To construct the call graph, we collect the execution traces of the processes in the IoT system, which is the IoT-based smart irrigation testbed in our case. The execution trace records all the processes being invoked and the flow of control, starting from the sensor reading data to finally activating the actuators after analyzing the data if needed. Our testbed call graph includes 15 processes, as shown in the graph in Figure 7, in which there are three processes involved in the Physical Layer, so three nodes are included in the call graph (represented in green circles). Similarly, there are five nodes (yellow circles) representing the processes in the Edge Layer, six nodes from the Cloud Layer (blue circles), and one node for the process from the Application Layer (no fill circle). The edges reflect how the processes are interconnected in the entire architecture from the Physical Layer to the Application layer.
For example, the node, v D e c i d e t o T r i g g e r A c t u a t o r represents the process DecidetoTriggerActuator from the Cloud Layer and is connected both with the node v S e n d T r i g g e r T o A c t u a t o r from the Edge Layer and v S h o w A n a l y s i s R e s u l t & T r i g g e r D e c i s i o n from the Application Layer, since the DecidetoTriggerActuator process is used for both notifying the application user about the farm condition and the activation of actuator via ShowAnalysisResult&TriggerDecision process and, on the other hand, transmitting signal to the Edge Layer’s process SendTriggerToActuator to enable the actuator residing in the Physical Layer. So, an edge, e D e c i d e t o T r i g g e r A c t u a t o r S h o w A n a l y s i s R e s u l t & T r i g g e r D e c i s i o n , is connecting nodes v D e c i d e t o T r i g g e r A c t u a t o r and v S h o w A n a l y s i s R e s u l t & T r i g g e r D e c i s i o n . And another edge, e D e c i d e t o T r i g g e r A c t u a t o r S e n d T r i g g e r T o A c t u a t o r , is connecting nodes v D e c i d e t o T r i g g e r A c t u a t o r and v S e n d T r i g g e r T o A c t u a t o r . The direction of the edge reflects how the control flows in the operation. Since the DecidetoTriggerActuator process notifies the user about the decision of activating actuator, the control flows from DecidetoTriggerActuator to ShowAnalysisResult&TriggerDecision process. On the other hand, the DecidetoTriggerActuator process also receives a command from the user when the user tries to override the activation of actuator decision. Thus, there is a control flow from ShowAnalysisResult&TriggerDecision to DecidetoTriggerActuator. So, the edge e D e c i d e t o T r i g g e r A c t u a t o r S h o w A n a l y s i s R e s u l t & T r i g g e r D e c i s i o n   is bi-directional. But, the edge e D e c i d e t o T r i g g e r A c t u a t o r S e n d T r i g g e r T o A c t u a t o r   is unidirectional, reflecting the control flow from DecidetoTriggerActuator to SendTriggerToActuator.
We have assigned weight to each edge based on how many layers in IoT are merged together via this edge and what is that layer’s priority. As we know, IoT architecture includes multiple layers to accommodate diverse components, each of which is responsible for specific needs [2]. There are some processes involved in connecting one layer with another layer in order to ensure a seamless and efficient operation of the IoT system. For example, the edge connecting SendSensorDataToEdge from the Physical Layer with CollectSensorData from the Edge Layer is crucial for the control flow and seamless operation of our IoT system; it also represents a potential attack surface for attackers targeting the Edge Layer by manipulating sensor data from the Physical Layer. We have assigned higher priority to those edges than to the edges managing the control flow within a single layer. So, the weight is assigned to the edge e i j connecting the nodes v i   a n d   v j , as follows:
w ( e i j ) = L P + L E + L C + L A + L N
Here,
  • L P = 1   i f   e i t h e r   o r   b o t h   v i   a n d   v j   a r e   t h e   p o r c e s s   i n   P h y s i c a l   l a y e r ,   o t h e r w i s e   0 .
  • L E = 1   i f   e i t h e r   o r   b o t h   v i   a n d   v j   a r e   t h e   p o r c e s s   i n   E d g e   l a y e r ,   o t h e r w i s e   0 .
  • L C = 1   i f   e i t h e r   o r   b o t h   v i   a n d   v j   a r e   t h e   p o r c e s s   i n   C l o u d   l a y e r ,   o t h e r w i s e   0 .
  • L A = 1   i f   e i t h e r   o r   b o t h   v i   a n d   v j   a r e   t h e   p o r c e s s   i n   A p p l i c a t i o n   l a y e r ,   o t h e r w i s e   0 .
  • L N = 1   i f   e i t h e r   o r   b o t h   v i   a n d   v j   a r e   t h e   p o r c e s s   i n   N e t w o r k   l a y e r ,   o t h e r w i s e   0 .
For example, in our testbed’s call graph, there is an edge, e D e c i d e t o T r i g g e r A c t u a t o r S h o w A n a l y s i s R e s u l t & T r i g g e r D e c i s i o n , connecting nodes v D e c i d e t o T r i g g e r A c t u a t o r and v S h o w A n a l y s i s R e s u l t & T r i g g e r D e c i s i o n . This DecidetoTriggerActuator node is a process from the Cloud Layer and ShowAnalysisResult&TriggerDecision is a process from the Application Layer. So, the weight of that edge, e D e c i d e t o T r i g g e r A c t u a t o r S h o w A n a l y s i s R e s u l t & T r i g g e r D e c i s i o n , will be
w ( e D e c i d e t o T r i g g e r A c t u a t o r S h o w A n a l y s i s R e s u l t & T r i g g e r D e c i s i o n ) = 0 + 0 + 1 + 1 + 0 = 2
The call graph serves as the foundational structure for calculating the IF of each process in the IoT system. To derive IF values systematically, we developed a procedural approach leveraging the PageRank algorithm [28], which evaluates node importance based on incoming links, their respective PageRank scores, and the number of outgoing connections. The standard PageRank formula used is:
P R   u =   1   α   N +   α v   ln u P R   v d v
Here P R u is the PageRank value of node u,
α is Damping factor (in my method, there is no random teleportation, just pure link-following. So, I consider α = 1),
N is the total number of nodes in the graph,
ln u is the set of nodes linking to node u, incoming node to u,
d v is out-degree (number of outgoing links) of node v.
Since our call graph is a weighted, directed graph, we extended this model using the Weighted PageRank algorithm [25]. This approach better captures the varying significance of edges by incorporating edge weights. For each node, edge weights are normalized by the total weight of all outgoing edges from that node. The formula for the Weighted PageRank becomes
W P R   u =   1   α   N +   α v   ln u   W P R   v w   ( v ,   u ) z   ϵ   o u t ( v ) w ( v ,   z )
Here W P R ( u ) is the weighted PageRank of node u,
w ( v , u ) is the weight of the edge from node v to node u ,
and z   ϵ   o u t ( v ) w ( v ,   z ) is the total weight of all outgoing edges from node v .
By applying this algorithm to the call graph, we calculated the IF for each process, treating each process as a graph node. The resulting importance of scores reflects how central a process is to system continuity and overall resilience. A higher IF indicates a more critical process in sustaining secure and functional operations. The complete list of processes with their corresponding IFs is provided in Table 3.
The estimated IFs of the processes align well with our expectations, given that the system’s primary functionality is to activate the irrigation actuator upon detecting low soil moisture, while the key security requirement is to prevent DDoS attacks to ensure timely responsiveness of testbed processes. Based on our implementation knowledge, we recognize that the DecideToTriggerActuator process plays a pivotal role by seamlessly connecting three layers of the IoT architecture. Deployed in the Cloud Layer, it transmits the trigger signal to both the Edge and Application layers, as illustrated in Figure 1. A failure in DecideToTriggerActuator results in a breakdown of inter-layer communication, thereby disrupting the timely execution of two other critical processes: SendTriggerToActuator in the Edge Layer and ShowAnalysisResult&TriggerDecision in the Application Layer. Following DecideToTriggerActuator, the processes TriggerActuatorToActivate and GetMLModelPrediction are identified as the second and third most critical nodes, respectively, as listed in Table 3. The TriggerActuatorToActivate process is responsible for linking the Edge and Physical layers and directly facilitating actuator activation based on low soil moisture detection. Meanwhile, GetMLModelPrediction is a foundational process upon which DecideToTriggerActuator depends. A failure in GetMLModelPrediction cascades to disrupt DecideToTriggerActuator, which in turn affects ShowAnalysisResult&TriggerDecision, SendTriggerToActuator, and TriggerActuatorToActivate, thereby impacting all three architectural layers. Failures in either ShowAnalysisResult&TriggerDecision or SendTriggerToActuator compromise data transmission across two layers, undermining seamless system coordination. Other processes such as ExecuteMLModel, FeedSensorDataToMLModel, PreprocessedSensorData, and ReceivedSensorData are confined to the Cloud Layer but are integral to the data pipeline on which DecideToTriggerActuator relies. The process SendSensorDataToCloud connects the Edge and Cloud layers and is primarily responsible for data collection and transmission. However, given that the architecture supports multiple edge devices transmitting data in parallel, the failure of a single device does not critically impair overall testbed functionality. A similar assessment applies to the SendSensorDataToEdge process. Their failure is not considered critical based on our domain knowledge and implementation experience.
The list of IFs for each process in the systems is stored as Process Importance in GenerateAttackStatus&ConsequenceResult component, as illustrated in Figure 3, and is utilized by the ExtractGoalAttributeRelation process during the generation of the outcome set, S s a c . In the final JSON report generated for any detected attack incident, the affected process along with its corresponding IF is included, as shown in Figure 6. By examining a process’s IF, we gain insight into the potential impact of uncertain changed conditions on the system’s overall functionality. This metric serves as a valuable indicator of a process’s significance within system operations and provides critical insight for fostering security awareness. It helps identify potential degradation in the system’s security state resulting from the compromise of affected processes. The generated report is a foundational component for promoting security awareness and can be instrumental in evaluating the system’s confidence in meeting its defined security requirements.

4. Experiment and Result

To evaluate the framework’s effectiveness in interpreting and generating reports across various attack scenarios, we conducted experiments using several instances from three primary DDoS attack types. The framework successfully generates detailed reports by parsing the LIME outputs, offering insights into which system components and associated security requirements are impacted. These reports also include the IFs of the affected components.
As illustrated in Figure 8, the LIME explanation for a DDoS_TCP instance highlights that the most influential features in the model’s prediction originate from the DDoS_TCP feature set. Notably, these features include the activation of the TCP SYN flag (tcp.connection.syn = 1.0) and the absence of normal connection termination indicators such as FIN, RST, and SYN-ACK flags, all of which were set to zero. This combination is characteristic of a TCP SYN flood—a common DDoS technique that overwhelms the target system by initiating numerous incomplete TCP handshakes. Additional contributing features included minimal acknowledgment values (tcp.ack, tcp.ack_raw) and a low composite flag value (tcp.flags = 0.08). Although some features slightly contradicted the prediction—such as the presence of a valid checksum or the absence of UDP-related fields—they were insufficient to override the dominant SYN-based attack signature. This instance demonstrates the model’s capacity to identify protocol-specific patterns and effectively differentiate malicious TCP behaviors from legitimate network traffic.
The framework successfully generates a report that pinpoints the affected security goals and system components based on the condition changes in the DDoS_TCP feature set, as illustrated in Figure 9 (partial report). The directly impacted goals include G-16, G-21, G-22, and G-23. Due to the interdependencies within the SAC, the SendTriggerToActuator process in the Edge Layer is also affected. This component has an IF of 0.086, as detailed in Table 3. The degradation of the SendTriggerToActuator functionality subsequently affects additional goals due to the hierarchical and functional linkages. These include G-12, G-10, SI-4 Requirement, and SI-4 Main, all of which are listed as affected goals in the generated report (see Figure 9).
Similarly, we conducted an experiment on a DDoS_HTTP attack scenario, and the framework successfully generated a corresponding report, as in the instance shown in Figure 10.
The experimental results demonstrate that our developed security awareness component can generate interpretation reports by incorporating relevant attributes and their dynamic conditions, as identified by the integrated deep learning (DL) model. This overcomes a key limitation of the approach proposed in [38], which depends on a predefined threat model to interpret uncertain changes. Furthermore, the generated report not only identifies the affected functionalities but also includes their Importance Factors (IFs), reflecting their significance within the overall system. This provides valuable insights for conducting change impact analysis—an aspect not addressed by the approach in [37].
This work lays the foundation for building intelligent, secure, and trustworthy IoT infrastructures capable of recognizing uncertain environmental changes and reasoning over potential mitigation strategies based on contextual insights. However, the highly dynamic nature of IoT system operations, along with the diverse techniques employed in DDoS attacks, makes devising effective mitigation strategies particularly challenging. A comprehensive survey on DDoS mitigation in IoT applications [59] categorizes such attacks into three primary types: (i) application-layer attacks; (ii) resource exhaustion attacks; and (iii) volumetric attacks. The survey emphasizes that a single mitigation strategy is unlikely to be effective across all categories—nor is a fixed strategy consistently effective even within a specific category. For instance, volumetric attacks may be mitigated using techniques such as flow filtering, rate limiting, or request prioritization. Flow filtering aims to block traffic identified as malicious, rate limiting imposes caps on traffic volume, and request prioritization allows service only to requests from highly trusted sources.
Consider the previously discussed DDoS_UDP attack, which floods the network with UDP packets to exhaust bandwidth. In this scenario, both flow filtering and rate limiting can be effective, while request prioritization is less suitable due to the difficulty and overhead of assessing the reliability of sensor-generated UDP packets, potentially introducing new vulnerabilities. Between the two effective techniques, choosing flow filtering could risk disrupting critical system operations by inadvertently blocking essential data from certain components. In contrast, rate limiting allows continued operation, albeit with possible exposure to noisy or malicious traffic. On the other hand, flow filtering provides better data integrity by eliminating unwanted traffic more precisely.
Therefore, selecting an appropriate mitigation strategy depends heavily on contextual awareness and the specific security and operational requirements of the system. Understanding these contextual and security factors is essential for strategizing effective mitigation. Our approach to extracting such insights plays a valuable role in supporting this strategy development—whether implemented autonomously or used by a human system administrator.

5. Performance Analysis

5.1. Execution Time

To evaluate the performance of our proposed framework for embedding security awareness into IoT systems, we conducted a detailed analysis of the deep learning (DL) pipeline. This evaluation measured the average execution time for three key components: model prediction, XAI-based explanation generation, and the mapping of XAI outcomes to the system’s security profile via the GenerateAttackStatus&ConsequenceResult process. The experiments were performed on a personal computer running Microsoft Windows 10 Pro, equipped with a 12th Gen Intel(R) Core(TM) i9-12900H CPU @ 2.50 GHz and 32 GB of RAM (Intel, Santa Clara, CA, USA). A summary of the execution time analysis is presented in Table 4.
We also assessed performance across different attack types and observed that all three components of the DL pipeline maintained consistent execution times, regardless of the specific attack scenario. However, the XAI explanation generation consistently incurred significantly higher processing time compared to the other components.
We recognize that the high latency of the Generate Explanation process may not be practical for continuous monitoring of network traffic streams. To address this, we configure the explanation process to activate only when the model predicts an attack with a confidence level above 90%. Furthermore, we investigated the cause of the high computational overhead associated with explanation generation. LIME operates by creating numerous perturbed versions of the input instance, then training a surrogate model (a random forest in our case) on these samples using the predicted outputs from the black-box model. The surrogate model is weighted by similarity scores to ensure it accurately approximates the local decision boundary of the deep neural network (DNN). The goal is to identify which features are most influential in the model’s decision for that specific instance. However, performing perturbation and surrogate model training on a large dataset leads to significant computational costs.
To mitigate this, we conducted an additional experiment where the sample size was reduced to 100 perturbed instances. This optimization reduced the average execution time of the Generate Explanation process to 3.3392 s—an improvement over the initial configuration. While this is a step forward, we acknowledge that it still falls short of being suitable for real-time applications. We also experimented with SHAP as an alternative XAI technique to assess its effectiveness in generating explanations. However, SHAP demonstrated even longer execution times due to its more complex computation of feature attributions, particularly when compared to LIME’s relatively lightweight perturbation strategy. In future work, we aim to incorporate advanced ML/DL optimization techniques to enhance system efficiency and further reduce the latency associated with explanation generation, thereby moving closer to enabling real-time, interpretable threat detection.

5.2. Fidelity Assessment

However, we also recognize that the generated explanations require not only performance enhancements but also improvements in the fidelity of their outcomes. Like many post hoc interpretability methods, XAI techniques such as LIME can introduce unintended biases or reinforce spurious correlations. Although these explanations may appear visually or numerically convincing, they do not always reflect the true decision-making logic of the model or the underlying security semantics. In real-world deployments, such misalignments can mislead analysts or result in suboptimal response decisions if not properly validated. We conduct a fidelity assessment to evaluate how well the explanations generated by LIME align with known protocol-specific ground truth features associated with various DDoS attack types. The ground truth was manually constructed based on expert knowledge of critical features relevant to the TCP, UDP, and HTTP, as outlined in [55]. Each LIME explanation was transformed into a binary feature vector and compared against its corresponding ground truth vector using cosine similarity—a metric that captures directional alignment independent of vector magnitude [60,61]. In addition to cosine similarity, we computed precision, recall, and F1-score to assess the relevance and completeness of the features highlighted by LIME, as summarized in Table 5.
The results revealed several important insights:
  • DDoS_TCP explanations exhibited the highest fidelity, with a cosine similarity score of approximately 0.65. This strong alignment is attributed to the richer and more diverse set of TCP-specific features in the ground truth, increasing the likelihood of overlap with LIME-selected features. The model appears to have captured meaningful protocol-level patterns consistent with known attack behaviors.
  • DDoS_HTTP explanations achieved moderate fidelity, with a cosine similarity of around 0.47. This reflects partial alignment, likely influenced by the limited number of HTTP-specific features in the ground truth. Some LIME-identified features were weakly relevant or attributable to noise.
  • DDoS_UDP explanations demonstrated the lowest fidelity, with a cosine similarity of approximately 0.31. This suggests that the explanations either focused on less relevant features or failed to capture the protocol’s limited but critical attributes. The relative simplicity and minimal feature diversity of the UDP may have contributed to this outcome.
These findings underscore an important consideration: the quality of XAI explanations varies significantly across attack types and is influenced not only by the model’s learning capability but also by the structural richness and complexity of the protocol-specific feature space. While protocols like TCP provide ample opportunities for accurate attribution, simpler protocols such as UDP present greater challenges for generating meaningful and interpretable explanations. This variability highlights the need for protocol-aware interpretability validation and the development of tailored XAI strategies for different network contexts.

5.3. Robustness of the Framework

To validate the robustness and model-agnostic nature of our framework, we demonstrate its ability to operate independently of any specific deep learning (DL) model trained to detect security threats. To this end, we build and train a convolutional neural network (CNN) using a separate benchmark dataset—the CSE-CIC-IDS2018 dataset [62]—which focuses on intrusion detection, particularly application-layer attacks. We modify the SAC instance of the security profile, which primarily targets DDoS attack prediction. Specifically, we extract data relevant to DDoS attack types from the dataset and adapt the security profile to incorporate the attribute set used in the CNN model. We also update the interconnections between the profile and the corresponding processes within the system architecture to ensure consistency.
The trained CNN model is then deployed within the security awareness component, GenerateAttackStatus&ConsequenceResult, and the interpretation workflow is executed successfully. Notably, this integration is achieved without requiring any modifications to the core code of the framework, thereby reinforcing its flexibility, extensibility, and model-independence.

6. Conclusions

The rapid integration of IoT technologies holds transformative potential to enhance productivity, sustainability, and resilience across various domains. However, realizing these benefits presents significant challenges—particularly in managing the complexity, dynamism, and security sensitivity inherent in such environments. This paper addresses these challenges by proposing a novel security-aware framework for IoT systems. By integrating contextual intelligence, explainable artificial intelligence (XAI), and structured security assurance modeling, the framework enables real-time reasoning about environmental and operational changes and their implications for system security.
A key innovation of this study is the introduction of a graph-based procedural approach to quantify the importance of individual system components. This enhances the system’s ability to prioritize and adapt its security responses. As a proof of concept, we develop a prototype demonstrating that XAI outcomes can be effectively leveraged to extract insights on dynamic changes, and we introduce a methodology to map those outcomes to the system’s security profile, ensuring that the resulting insights align with established security objectives.
To support this, we generate a call graph based on the execution trace of process invocations. Our current testbed includes only 15 processes, so collecting execution traces and updating the call graph at regular intervals introduces minimal overhead. However, in larger and more complex deployments—such as those in industrial IoT, healthcare, smart cities, smart grids, or real-world smart agriculture systems—this approach could introduce notable resource overhead. Furthermore, due to the distributed and decentralized nature of many IoT architectures, collecting execution traces can be difficult or incomplete. In future work, we will explore alternative strategies for constructing process interaction graphs that are scalable and resilient to these challenges.
Another limitation lies in the framework’s reliance on a well-maintained and complete security profile, represented using Structured Assurance Cases (SACs). At present, this profile is static, and any changes to the system architecture must be manually updated in the SAC. Although a framework from [16] includes three operators that allow limited dynamic evolution of the SAC—such as replacing contextual values or modifying existing functionality—these operators are not sufficient to fully support architectural changes, such as adding or removing components or introducing new functionalities. Thus, there is a clear need to develop methodologies that enable the dynamic evolution of SACs in response to system-level changes. However, addressing this challenge is beyond the scope of this research. In summary, this work lays the foundation for building intelligent, secure, and trustworthy IoT infrastructures by synergistically combining interpretability, adaptability, and risk-awareness.
We acknowledge that the current implementation of the security awareness component introduces some performance overhead, highlighting the need for further optimization of computational processes. Additionally, the framework relies on XAI methods to produce actionable insights, which must be rigorously evaluated to ensure their fidelity, reliability, and practical utility. Future work will focus on optimizing performance and conducting thorough evaluations of the employed XAI techniques. Additionally, we recognize that the current centralized implementation may not align well with the inherently decentralized nature of IoT architectures. Addressing this limitation, along with incorporating mechanisms for data privacy protection, will be a key focus of our future efforts.
To the best of our knowledge, no existing approach directly maps XAI outcomes to system security profiles for generating insights about uncertain changes and their impact on the system’s security posture. Therefore, direct comparisons with existing methods are not feasible at this stage.
Finally, the successful implementation and evaluation of the proposed framework in a smart irrigation testbed demonstrate its practical feasibility and underscore its potential to guide the development of self-aware, security-conscious IoT systems across a wide range of critical application domains. In the future, we will work on validating the approach for larger and more complex applications.

Author Contributions

Conceptualization, M.B. and S.J., Methodology, M.B. and S.J., Validation, M.B., Writing—original draft, M.B. and S.J., Investigation, M.B. and S.J., Writing—reviewing and editing, S.J., Supervision, S.J. All authors have read and agreed to the published version of the manuscript.

Funding

This research was supported by startup funding provided by the Department of Computer Science at Oklahoma State University to promote young faculty research.

Institutional Review Board Statement

Not applicable.

Informed Consent Statement

Not applicable.

Data Availability Statement

The datasets and code used for conducting the experiments and supporting the conclusions of this study are available upon request from the authors.

Acknowledgments

During the preparation of this manuscript, the authors utilized ChatGPT-4.0 for grammar checking and improving the writing flow. The authors have thoroughly reviewed and edited the output and take full responsibility for the content of this publication.

Conflicts of Interest

The authors declare no conflicts of interest.

References

  1. Reggio, G.; Leotta, M.; Cerioli, M.; Spalazzese, R.; Alkhabbas, F. What are IoT systems for real? An experts’ survey on software engineering aspects. Internet Things 2020, 12, 100313. [Google Scholar] [CrossRef]
  2. Gubbi, J.; Buyya, R.; Marusic, S.; Palaniswami, M. Internet of Things (IoT): A vision, architectural elements, and future directions. Future Gener. Comput. Syst. 2013, 29, 1645–1660. [Google Scholar] [CrossRef]
  3. Taivalsaari, A.; Mikkonen, T. On the development of IoT systems. In Proceedings of the Third International Conference on Fog and Mobile Edge Computing (FMEC), Barcelona, Spain, 23–26 April 2018; IEEE: New York, NY, USA, 2018; pp. 13–19. [Google Scholar] [CrossRef]
  4. Tawalbeh, L.A.; Muheidat, F.; Tawalbeh, M.; Quwaider, M. IoT Privacy and security: Challenges and solutions. Appl. Sci. 2020, 10, 4102. [Google Scholar] [CrossRef]
  5. Alaba, F.A.; Othman, M.; Hashem, I.A.T.; Alotaibi, F. Internet of Things security: A survey. J. Netw. Comput. Appl. 2017, 88, 10–28. [Google Scholar] [CrossRef]
  6. Jahan, S.; Alqahtani, S.; Gamble, R.F.; Bayesh, M. Automated Extraction of Security Profile Information from XAI Outcomes. In Proceedings of the 2023 IEEE International Conference on Autonomic Computing and Self-Organizing Systems Companion (ACSOS-C), Toronto, ON, Canada, 25–29 September 2023; IEEE: New York, NY, USA, 2023; pp. 110–115. [Google Scholar] [CrossRef]
  7. Petrovska, A. Self-Awareness as a Prerequisite for Self-Adaptivity in Computing Systems. In Proceedings of the 2021 IEEE International Conference on Autonomic Computing and Self-Organizing Systems Companion (ACSOS-C), Washington, DC, USA, 27 September–1 October 2021; IEEE: New York, NY, USA, 2021; pp. 146–149. [Google Scholar] [CrossRef]
  8. Chattopadhyay, A.; Lam, K.Y.; Tavva, Y. Autonomous vehicle: Security by design. IEEE Trans. Intell. Transp. Syst. 2020, 22, 7015–7029. [Google Scholar] [CrossRef]
  9. Li, J.; Yi, X.; Wei, S. A study of network security situational awareness in Internet of Things. In Proceedings of the 2020 International Wireless Communications and Mobile Computing (IWCMC), Limassol, Cyprus, 15–19 June 2020; IEEE: New York, NY, USA, 2020; pp. 1624–1629. [Google Scholar] [CrossRef]
  10. Lei, W.; Wen, H.; Hou, W.; Xu, X. New security state awareness model for IoT devices with edge intelligence. IEEE Access 2021, 9, 69756–69765. [Google Scholar] [CrossRef]
  11. Hemmati, A.; Rahmani, A.M. The Internet of Autonomous Things applications: A taxonomy, technologies, and future directions. Internet Things 2022, 20, 100635. [Google Scholar] [CrossRef]
  12. Xu, R.; Nagothu, D.; Chen, Y.; Aved, A.; Ardiles-Cruz, E.; Blasch, E. A Secure Interconnected Autonomous System Architecture for Multi-Domain IoT Ecosystems. IEEE Commun. Mag. 2024, 62, 52–57. [Google Scholar] [CrossRef]
  13. Salehie, M.; Tahvildari, L. Self-adaptive software: Landscape and research challenges. ACM Trans. Auton. Adapt. Syst. (TAAS) 2009, 4, 1–42. [Google Scholar] [CrossRef]
  14. Hezavehi, S.M.; Weyns, D.; Avgeriou, P.; Calinescu, R.; Mirandola, R.; Perez-Palacin, D. Uncertainty in self-adaptive systems: A research community perspective. ACM Trans. Auton. Adapt. Syst. (TAAS) 2021, 15, 1–36. [Google Scholar] [CrossRef]
  15. Jahan, S.; Riley, I.; Gamble, R.F. Assessing adaptations based on change impacts. In Proceedings of the 2020 IEEE International Conference on Autonomic Computing and Self-Organizing Systems (ACSOS), Washington, DC, USA, 17–21 August 2020; IEEE: New York, NY, USA, 2020; pp. 48–54. [Google Scholar] [CrossRef]
  16. Jahan, S. An Adaptation Assessment Framework for Runtime Security Assurance Case Evolution. Ph.D. Dissertation, The University of Tulsa, Tulsa, OK, USA, 2021. Available online: https://www.proquest.com/docview/2637547876?pq-origsite=gscholar&fromopenview=true&sourcetype=Dissertations%20&%20Theses (accessed on 25 May 2025).
  17. Gheibi, O.; Weyns, D.; Quin, F. Applying machine learning in self-adaptive systems: A systematic literature review. ACM Trans. Auton. Adapt. Syst. (TAAS) 2021, 15, 1–37. [Google Scholar] [CrossRef]
  18. Janiesch, C.; Zschech, P.; Heinrich, K. Machine learning and deep learning. Electron. Mark. 2021, 31, 685–695. [Google Scholar] [CrossRef]
  19. Vilone, G.; Longo, L. Explainable artificial intelligence: A systematic review. arXiv 2020, arXiv:2006.00093. [Google Scholar] [CrossRef]
  20. Molnar, C. Interpretable Machine Learning; Lulu. com: Morrisville, NC, USA, 2020; Available online: https://books.google.com/books?hl=en&lr=&id=jBm3DwAAQBAJ&oi=fnd&pg=PP1&dq=Interpretable+machine+learning&ots=EhvWYjHDSY&sig=fJlg8xyZsauRhLjOYF_xUqr8khQ#v=onepage&q=Interpretable%20machine%20learning&f=false (accessed on 25 May 2025).
  21. Alexander, R.; Hawkins, R.; Kelly, T. Security Assurance Cases: Motivation and the State of the Art; High Integrity Systems Engineering, Department of Computer Science, University of York: Deramore Lane, UK, 2011; Available online: https://citeseerx.ist.psu.edu/document?repid=rep1&type=pdf&doi=623bb1c1ded3860ed1307d45a2a01823b13abff6 (accessed on 25 May 2025).
  22. Kelly, T.; Weaver, R. The goal structuring notation–a safety argument notation. In Dependable Systems and Networks 2004 Workshop on Assurance Cases; Citeseer: Princeton, NJ, USA, 2004; Volume 6, Available online: http://dslab.konkuk.ac.kr/class/2012/12SIonSE/Key%20Papers/The%20Goal%20Structuring%20Notation%20_%20A%20Safety%20Argument%20Notation.pdf (accessed on 25 May 2025).
  23. Averbukh, V.L.; Bakhterev, M.O.; Manakov, D.V. Evaluations of visualization metaphors and views in the context of execution traces and call graphs. Sci. Vis. 2017, 9, 1–18. Available online: https://www.researchgate.net/profile/Vladimir-Averbukh/publication/322070685_Evaluations_of_Visualization_Metaphors_and_Views_in_the_Context_of_Execution_Traces_and_Call_Graphs/links/5a4287690f7e9ba868a47bd5/Evaluations-of-Visualization-Metaphors-and-Views-in-the-Context-of-Execution-Traces-and-Call-Graphs.pdf (accessed on 25 May 2025). [CrossRef]
  24. Salis, V.; Sotiropoulos, T.; Louridas, P.; Spinellis, D.; Mitropoulos, D. Pycg: Practical call graph generation in Python. In Proceedings of the 2021 IEEE/ACM 43rd International Conference on Software Engineering (ICSE), Madrid, Spain, 25–28 May 2021; IEEE: New York, NY, USA, 2021; pp. 1646–1657. [Google Scholar] [CrossRef]
  25. Zhang, P.; Wang, T.; Yan, J. PageRank centrality and algorithms for weighted, directed networks. Phys. A Stat. Mech. Its Appl. 2022, 586, 126438. [Google Scholar] [CrossRef]
  26. Gómez, S. Centrality in networks: Finding the most important nodes. In Business and Consumer Analytics: New Ideas; Moscato, P., de Vries, N., Eds.; Springer: Cham, Switzerland, 2019. [Google Scholar] [CrossRef]
  27. Freeman, L.C. Centrality in social networks: Conceptual clarification. In Social Network: Critical Concepts in Sociology; Routledge: Londres, UK, 2002; Volume 1, pp. 238–263. Available online: https://books.google.com/books?hl=en&lr=&id=fy3m_EixWOsC&oi=fnd&pg=PA238&dq=Centrality+in+social+networks+conceptual+clarification&ots=unHaJzR81U&sig=hG9bkrrpA_B-kQ0r2iy7ISsLvts#v=onepage&q=Centrality%20in%20social%20networks%20conceptual%20clarification&f=false (accessed on 25 May 2025).
  28. Brin, S.; Page, L. The anatomy of a large-scale hypertextual web search engine. Comput. Netw. ISDN Syst. 1998, 30, 107–117. [Google Scholar] [CrossRef]
  29. Sarker, I.H.; Khan, A.I.; Abushark, Y.B.; Alsolami, F. Internet of things (IoT) security intelligence: A comprehensive overview, machine learning solutions and research directions. Mob. Netw. Appl. 2023, 28, 296–312. [Google Scholar] [CrossRef]
  30. Bouaouad, A.E.; Cherradi, A.; Assoul, S.; Souissi, N. The key layers of IoT architecture. In Proceedings of the 2020 5th International Conference on Cloud Computing and Artificial Intelligence: Technologies and Applications (CloudTech), Marrakesh, Morocco, 24–26 November 2020; IEEE: New York, NY, USA, 2020; pp. 1–4. [Google Scholar] [CrossRef]
  31. Mrabet, H.; Belguith, S.; Alhomoud, A.; Jemai, A. A survey of IoT security based on a layered architecture of sensing and data analysis. Sensors 2020, 20, 3625. [Google Scholar] [CrossRef]
  32. Tukur, Y.M.; Thakker, D.; Awan, I.U. Multi-layer approach to internet of things (IoT) security. In Proceedings of the 2019 7th International Conference on Future Internet of Things and Cloud (FiCloud), Istanbul, Turkey, 26–28 August 2019; IEEE: New York, NY, USA, 2019; pp. 109–116. [Google Scholar] [CrossRef]
  33. Hassija, V.; Chamola, V.; Saxena, V.; Jain, D.; Goyal, P.; Sikdar, B. A survey on IoT security: Application areas, security threats, and solution architectures. IEEE Access 2019, 7, 82721–82743. [Google Scholar] [CrossRef]
  34. Dargaoui, S.; Azrour, M.; El Allaoui, A.; Amounas, F.; Guezzaz, A.; Attou, H.; Hazman, C.; Benkirane, S.; Bouazza, S.H. An overview of the security challenges in IoT environment. Adv. Technol. Smart Environ. Energy 2023, 151–160. [Google Scholar] [CrossRef]
  35. Koohang, A.; Sargent, C.S.; Nord, J.H.; Paliszkiewicz, J. Internet of Things (IoT): From awareness to continued use. Int. J. Inf. Manag. 2022, 62, 102442. [Google Scholar] [CrossRef]
  36. Tariq, U.; Aseeri, A.O.; Alkatheiri, M.S.; Zhuang, Y. Context-aware autonomous security assertion for industrial IoT. IEEE Access 2020, 8, 191785–191794. [Google Scholar] [CrossRef]
  37. Jaigirdar, F.T.; Rudolph, C.; Bain, C. Prov-IoT: A security-aware IoT provenance model. In Proceedings of the 2020 IEEE 19th International Conference on Trust, Security and Privacy in Computing and Communications (TrustCom), Guangzhou, China, 29 December 2020–1 January 2021; pp. 1360–1367. [Google Scholar] [CrossRef]
  38. Chen, B.; Qiao, S.; Zhao, J.; Liu, D.; Shi, X.; Lyu, M.; Chen, H.; Lu, H.; Zhai, Y. A security awareness and protection system for 5G smart healthcare based on zero-trust architecture. IEEE Internet Things J. 2020, 8, 10248–10263. [Google Scholar] [CrossRef] [PubMed]
  39. Darias, J.M.; Díaz-Agudo, B.; Recio-Garcia, J.A. A Systematic Review on Model-agnostic XAI Libraries. In Proceedings of the ICCBR Workshops, Online, 13–16 September 2021; pp. 28–39. [Google Scholar]
  40. Lipton, Z.C. The mythos of model interpretability: In machine learning, the concept of interpretability is both important and slippery. Queue 2018, 16, 31–57. [Google Scholar] [CrossRef]
  41. Ribeiro, M.T.; Singh, S.; Guestrin, C. Why should I trust you? Explaining the predictions of any classifier. In Proceedings of the 22nd ACM SIGKDD International Conference on Knowledge Discovery and Data Mining, San Francisco, CA, USA, 13–17 August 2016; pp. 1135–1144. [Google Scholar]
  42. Ng, C.H.; Abuwala, H.S.; Lim, C.H. Towards more stable LIME for explainable AI. In Proceedings of the 2022 International Symposium on Intelligent Signal Processing and Communication Systems (ISPACS), Penang, Malaysia, 22–25 November 2022; IEEE: New York, NY, USA, 2022; pp. 1–4. [Google Scholar] [CrossRef]
  43. Dieber, J.; Kirrane, S. Why model why? Assessing the strengths and limitations of LIME. arXiv 2020, arXiv:2012.00093. [Google Scholar] [CrossRef]
  44. Lundberg, S.M.; Lee, S.I. A unified approach to interpreting model predictions. Adv. Neural Inf. Process. Syst. 2017, 30, 4765–4774. [Google Scholar]
  45. Li, M.; Sun, H.; Huang, Y.; Chen, H. Shapley value: From cooperative game to explainable artificial intelligence. Auton. Intell. Syst. 2024, 4, 2. [Google Scholar] [CrossRef]
  46. Miller, T. Explainable ai is dead, long live explainable ai! hypothesis-driven decision support using evaluative ai. In Proceedings of the 2023 ACM Conference on Fairness, Accountability, and Transparency, Chicago, IL, USA, 12–15 June 2023; pp. 333–342. [Google Scholar] [CrossRef]
  47. Saputri, T.R.D.; Lee, S.W. The application of machine learning in self-adaptive systems: A systematic literature review. IEEE Access 2020, 8, 205948–205967. [Google Scholar] [CrossRef]
  48. Bahmani, B.; Kumar, R.; Mahdian, M.; Upfal, E. Pagerank on an evolving graph. In Proceedings of the 18th ACM SIGKDD International Conference on Knowledge Discovery and Data Mining, Beijing, China, 12–16 August 2012; pp. 24–32. [Google Scholar]
  49. Sallinen, S.; Luo, J.; Ripeanu, M. Real-time pagerank on dynamic graphs. In Proceedings of the 32nd International Symposium on High-Performance Parallel and Distributed Computing, Orlando, FL, USA, 20–23 June 2023; pp. 239–251. [Google Scholar] [CrossRef]
  50. Zhang, J.; Luo, Y. Degree centrality, betweenness centrality, and closeness centrality in social network. In Proceedings of the 2017 2nd International Conference on Modelling, Simulation and Applied Mathematics (MSAM2017), Bangkok, Thailand, 26–27 March 2017; pp. 300–303. [Google Scholar] [CrossRef]
  51. Nesa, N.; Banerjee, I. SensorRank: An energy efficient sensor activation algorithm for sensor data fusion in wireless networks. IEEE Internet Things J. 2018, 6, 2532–2539. [Google Scholar] [CrossRef]
  52. Sun, Z.; Zeng, G.; Ding, C. Towards pagerank update in a streaming graph by incremental random walk. IEEE Access 2022, 10, 15805–15817. [Google Scholar] [CrossRef]
  53. Rangra, A.; Sehgal, V.K. Social Internet of Things: Their Trustworthiness, Node Rank, and Embeddings Management. Ph.D. Dissertation, Jaypee University of Information Technology, Solan, India, 2021. [Google Scholar]
  54. Ferrag, M.A. Edge-IIoTset Cyber Security Dataset of IoT IIoT. 2023. Available online: https://www.kaggle.com/datasets/mohamedamineferrag/edgeiiotset-cyber-security-dataset-of-iot-iiot (accessed on 25 May 2025).
  55. Ferrag, M.A.; Friha, O.; Hamouda, D.; Maglaras, L.; Janicke, H. Edge-IIoTset: A new comprehensive realistic cyber security dataset of IoT and IIoT applications for centralized and federated learning. IEEE Access 2022, 10, 40281–40306. [Google Scholar] [CrossRef]
  56. Saheed, Y.K.; Abdulganiyu, O.H.; Majikumna, K.U.; Mustapha, M.; Workneh, A.D. ResNet50-1D-CNN: A new lightweight resNet50-One-dimensional convolution neural network transfer learning-based approach for improved intrusion detection in cyber-physical systems. Int. J. Crit. Infrastruct. Prot. 2024, 45, 100674. [Google Scholar] [CrossRef]
  57. Joint Task Force. Security and Privacy Controls for Federal Information Systems; NIST Special Publication 800-53, Revision 5; NIST: Gaithersburg, MD, USA, 2020. [Google Scholar]
  58. Reif, J.H. Depth-first search is inherently sequential. Inf. Process. Lett. 1985, 20, 229–234. [Google Scholar] [CrossRef]
  59. Dantas Silva, F.S.; Silva, E.; Neto, E.P.; Lemos, M.; Venancio Neto, A.J.; Esposito, F. A taxonomy of DDoS attack mitigation approaches featured by SDN technologies in IoT scenarios. Sensors 2020, 20, 3078. [Google Scholar] [CrossRef]
  60. Guidotti, R. Evaluating local explanation methods on ground truth. Artif. Intell. 2021, 291, 103428. [Google Scholar] [CrossRef]
  61. Miró-Nicolau, M.; Jaume-i-Capó, A.; Moyà-Alcover, G. Assessing fidelity in XAI post-hoc techniques: A comparative study with ground truth explanations datasets. Artif. Intell. 2024, 335, 104179. [Google Scholar] [CrossRef]
  62. Canadian Institute for Cybersecurity. IDS 2018 Intrusion CSVs (CSE-CIC-IDS2018) [Data Set]; University of New Brunswick: Fredericton, NB, Canada, 2018; Available online: https://www.kaggle.com/datasets/solarmainframe/ids-intrusion-csv/data?select=02-20-2018.csv (accessed on 22 June 2025).
Figure 1. Process flow diagram of IoT-based Smart irrigation system testbed.
Applsci 15 07871 g001
Figure 2. LIME explanation for one network traffic instance.
Applsci 15 07871 g002
Figure 3. Dataflow diagram of GenerateAttackStatus&ConsequenceResult component.
Applsci 15 07871 g003
Figure 4. Security controls chosen as security requirements from NIST SP 800-53.
Applsci 15 07871 g004
Figure 5. Partial Security Assurance Case, representing the security profile of the system.
Applsci 15 07871 g005
Figure 6. Generated JSON report (partial) in a structured form.
Applsci 15 07871 g006
Figure 7. Call graph of IoT-based smart irrigation system (testbed).
Applsci 15 07871 g007
Figure 8. LIME explanation for one network traffic instance (TCP based DDoS attack).
Applsci 15 07871 g008
Figure 9. Generated JSON report (partial) in a structured form for a DDoS_TCP attack scenario.
Applsci 15 07871 g009
Figure 10. LIME explanation of DDoS_HTTP attack scenario (top) and corresponding generated report (partial) in JSON format (bottom).
Applsci 15 07871 g010
Table 1. TCP Attribute set.
TCP AttributesDescription
tcp.flagsFlags
tcp.ackAcknowledgment number
tcp.ack_rawAcknowledgment number (raw)
tcp.checksumchecksum
tcp.seqSequence number
tcp.flags.ackAcknowledgment
tcp.lenTCP segment length
tcp.connection.synConnection establish request (SYN)
tcp.connection.rstConnection reset (RST)
tcp.connection.finConnection finish (FIN)
tcp.connection.synackConnection establish request (SYN + ACK)
Table 2. DDoS Attack Types and Description.
Attack TypeDescription
TCP SYN Flood DDoS attackMake the victim’s server unavailable to legitimate requests
UDP flood DDoS attackOverwhelm the processing and response capabilities of victim devices
HTTP flood DDoS attackExploits seemingly legitimate HTTP GET or POST requests to
attack IoT application
Table 3. List of processes in IoT-based smart irrigation system (testbed) and their importance factors.
Process NameImportance Factor
DecidetoTriggerActuator0.156
TriggerActuatorToActivate0.094
GetMLModelPrediction0.09
ShowAnalysisResult&TriggerDecision0.086
SendTriggerToActuator0.086
ExecuteMLModel0.082
FeedSensorDataToMLModel0.074
PreprocessedSensorData0.066
ReceivedSensorData0.057
SendSensorDataToCloud0.049
AggregateSensorData0.041
CleaningSensorData0.033
CollectSensorData0.025
SendSensorDataToEdge0.016
ReadSensor0.008
Table 4. Performance analysis result.
Process NameAverage Execution Time (in s)
OverallModel Prediction0.154893
Generate Explanation8.426568
Mapping and Generate Report0.151432
DDoS_UDPModel Prediction0.159036
Generate Explanation8.082033
Mapping and Generate Report0.153765
DDoS_TCPModel Prediction0.152603
Generate Explanation8.802392
Mapping and Generate Report0.149118
DDoS_HTTPModel Prediction0.153175
Generate Explanation8.373173
Mapping and Generate Report0.151548
Table 5. Explanation’s fidelity assessment result.
Attack TypePrecisionRecallF1-ScoreCosine Similarity
DDoS_TCP0.850.510.630.65
DDoS_UDP0.190.500.270.31
DDoS_HTTP0.440.500.470.47
Disclaimer/Publisher’s Note: The statements, opinions and data contained in all publications are solely those of the individual author(s) and contributor(s) and not of MDPI and/or the editor(s). MDPI and/or the editor(s) disclaim responsibility for any injury to people or property resulting from any ideas, methods, instructions or products referred to in the content.

