Article

The Impact of Pitch Error on the Dynamics and Transmission Error of Gear Drives

Department of Whole Vehicle Engineering, Audi Hungaria Faculty of Vehicle Engineering, Széchenyi István University, Egyetem tér 1, H-9026 Győr, Hungary
*
Author to whom correspondence should be addressed.
Appl. Sci. 2025, 15(14), 7851; https://doi.org/10.3390/app15147851 (registering DOI)
Submission received: 20 June 2025 / Revised: 7 July 2025 / Accepted: 12 July 2025 / Published: 14 July 2025
(This article belongs to the Special Issue Sustainable Mobility and Transportation (SMTS 2025))

Abstract

Gear whine noise is governed not only by intentional microgeometry modifications but also by unavoidable pitch (indexing) deviation. This study presents a workflow that couples a tooth-resolved surface scan with a calibrated pitch-deviation table, both imported into a multibody dynamics (MBD) model built in MSC Adams View. Three operating scenarios were evaluated—ideal geometry, measured microgeometry without pitch error, and measured microgeometry with pitch error—at a nominal speed of 1000 r min−1. Time domain analysis shows that integrating the pitch table increases the mean transmission error (TE) by almost an order of magnitude and introduces a distinct 16.66 Hz shaft order tone. When the measured tooth topologies are added, peak-to-peak TE nearly doubles, revealing a non-linear interaction between spacing deviation and local flank shape. Frequency domain results reproduce the expected mesh-frequency side bands, validating the mapping of the pitch table into the solver. The combined method therefore provides a more faithful digital twin for predicting tonal noise and demonstrates why indexing tolerances must be considered alongside profile relief during gear design optimization.

1. Introduction

Gear whine remains one of the most persistent comfort issues in modern power-trains, especially in battery electric vehicles where the masking effect of an internal combustion engine is absent. A long research tradition attributes the tonal component of this noise to transmission error (TE), the deviation between the theoretical and actual angular position of the driven gear [1,2].
TE captures both the quasi-static displacement caused by mesh stiffness variation and the dynamic response arising from system inertia, making it a powerful, load-independent indicator of gear quality [3].
Recent loaded tooth contact analyses that integrate measured profile maps can predict static TE with sub-micron fidelity and show excellent agreement with bench tests [4].
Among the many sources of TE, manufacturing deviations in tooth spacing—commonly referred to as pitch or indexing errors—have been shown to enlarge peak-to-peak TE and excite low-frequency shaft order tones [5].
Monte Carlo robustness studies further reveal that even micrometer-scale macrogeometry deviations (tip diameter, center distance) can raise peak-to-peak static TE by more than 30% across the operating torque range [6].
At the tooth level, optimized microgeometry modifications—such as lead crowning and tip relief—remain the most effective countermeasure; hybrid spur experiments have demonstrated up to 40% TE attenuation without mass penalties [7].
Nevertheless, design trade-offs persist, because a correction that flattens TE at one load can amplify it at another [7].
To evaluate these competing effects, researchers combine analytical thin-slice formulations with high-fidelity finite-element or semi-analytical contact solvers [3], while NASA-derived dynamic codes still serve as benchmarks for studying pitch error superposition and profile relief effectiveness [8].
On the system level, multibody dynamics (MBD) platforms such as MSC ADAMS translate quasi-static TE inputs into housing vibration and acoustic response, enabling the virtual prototyping of gearbox faults [9,10].
Despite these advances, the isolated impact of measured pitch error—decoupled from intentional microgeometry—remains underexplored for helical gears operating in the low-frequency shaft order regime relevant to e-powertrains.
The present study therefore quantifies how realistic pitch error reshapes quasi-static TE and the accompanying dynamic mesh forces in a single-stage helical reducer. By combining a loaded tooth contact analysis calibrated with shop-floor pitch charts and an MBD model of the entire drivetrain, we provide new insight into the sensitivity of TE to indexing faults and establish design guidelines for pitch quality targets in next-generation quiet gearboxes.
Recent studies have highlighted the pronounced effects of gear pitch errors on drivetrain NVH characteristics. Wang et al. (2017) [11], for example, showed that even small pitch errors in helical gears increase mesh stiffness variation and elevate both the loaded transmission error (TE) and vibration levels (as measured by the RMS of mesh acceleration), while also shifting the gear’s resonant frequencies. Manufacturing-induced pitch errors degrade the smoothness of meshing and tend to amplify gear noise and vibration [11]. Guo and Fang (2018) integrated actual measured pitch errors into a dynamic helical gear model and found a marked deterioration in contact stability and an increase in dynamic TE, which corresponded with higher vibration amplitudes and the onset of complex nonlinear responses [12]. In a similar vein, Pan et al. (2021) reported that introducing a periodic pitch error in a nonlinear helical gear pair model had the most significant influence on the system’s torsional vibration, substantially amplifying oscillation magnitudes and triggering rich bifurcation and chaotic behavior as the error magnitude grew [13]. Even for spur gears, recent analyses confirm that pitch imperfections can dramatically worsen dynamics. Liu et al. (2021) observed that a spur gear pair with slight pitch errors exhibited higher TE amplitudes and reduced mesh stability, especially under multi-tooth contact conditions [14]. Notably, pitch errors appear to excite a more adverse response than certain profile errors; for instance, one study found that pitch error had a greater impact on increasing transmission error (and associated contact pressures) than a comparable profile slope deviation did. Broadly, such pitch-derived disturbances act as potent excitation sources in gear systems, modulating the gear mesh frequencies and often generating sideband noise components in the acoustic spectrum. A recent comprehensive review by Najib et al. (2025) [15] further underscored that manufacturing tolerances (including tooth spacing errors) can significantly affect gear NVH performance, and it emphasized the importance of accounting for these errors in robust gear design and optimization. Collectively, these findings make it clear that minimizing pitch error is essential for improving the dynamic behavior and acoustic performance of gear drives, as pitch error directly exacerbates transmission error excitation and the resulting vibration and noise in geared systems [15].
This study differs from previous work by incorporating measured individual flank topologies and calibrated pitch error maps into a multibody simulation framework, enabling a more accurate prediction of transmission error and tonal noise components.

1.1. Research Gap and Objective

This paper closes the research gap by embedding both tooth-resolved flank measurements and the full pitch-deviation map into a single MBD model built in MSC Adams View, as shown in Figure 1. The following three simulation scenarios are compared:
  • Ideal geometry;
  • Measured microgeometry only;
  • Pitch error only.

1.2. Contributions

  • Quantitative evidence of the non-linear coupling between pitch error and measured microgeometry under realistic loading.
  • Methodological workflow for importing tooth-by-tooth scans and calibrated pitch tables into an MBD environment.
  • Design guidance indicating why indexing CpK targets should accompany profile relief optimization in low-noise e-drive gears.
By unifying measurement-based flank data with indexing-error characterisation, this study advances digital twin fidelity

2. Materials and Methods

The simulation workflow was configured following the steps outlined in the MSC Software (2024.2.1) Gear AT: Individual Tooth Measurement Spline (A24-2_001) tutorial [16].
In the multibody dynamic model, gear meshing is represented via stiffness and damping elements acting between the pinion and gear flanks. These nonlinear contact elements replicate the time-varying mesh stiffness and allow backlash modeling, which is critical for dynamic TE prediction.

2.1. Tooth-Resolved Measurement and Pitch Table Preparation

An involute spline gear (z1 = 23/z2 = 81; normal module mₙ = 1.395 mm; helix β = –24°) was scanned in a temperature-controlled CMM. Each flank was sampled at 200 points in lead and 100 points in profile. Smoothing cubic splines (degree 2; λ = 1.0 lead, 1.5 profile) were fitted, and probe run-out points at the root/tip were suppressed, following the workflow described by MSC Software.
The measurement protocol (.MKA) contained a deviations block. To zero the pitch error, the flank that showed no constant offset was identified (left, tooth 30), and its value was subtracted from every right flank entry. The calibrated table was exported as an .ISM file with 200 × 100 storage resolution.

2.2. Multibody Model and Solver Settings

The gear pair geometry was exported from Siemens NX and imported into MSC Adams View 2024.2 as a rigid flexible multibody model, as shown in Figure 1. Shafts were coupled through flexible joints, while the rolling element bearings were represented by four-parameter viscoelastic bushings.
Dynamic equations were solved with the Hilber–Hughes–Taylor (HHT-α) implicit time-integration scheme using α = –0.05. A relative error tolerance of 1 × 10⁻⁶ and an absolute error tolerance of 1 × 10⁻⁸ were applied. The maximum time step was limited to 5 × 10⁻⁵ s, which guarantees at least 50 solution points per mesh period at 1000 r min−1. Automatic step-size control was activated with a Courant factor of 0.6. These baseline settings follow the recommendations of Hexagon’s official Gear AT tutorial and were found to deliver numerically stable results without excessive CPU time [16].
The main geometric and mass properties of the 23/81 helical gear pair are listed in Table 1.

2.3. Simulation Setup and Parameter-Configuration

The multibody dynamic simulation was carried out using Adams View, with a focus on modeling the relative transmission error (TE) between meshing gear teeth under realistic operating conditions. The gear system was configured to rotate at a constant input shaft speed of 1000 RPM, which is representative of typical light-load operating scenarios. The TE measurement was enabled via a virtual sensor positioned between the driven gear and ground, tracking angular deviations throughout the simulation time span of 0.4 s.
To isolate the impact of pitch error, a pitch error table was introduced. This table defines the circumferential displacement of each tooth, referenced to tooth 30, whose right flank value was treated as zero. All other pitch errors were offset accordingly, ensuring that the effects of pitch errors were captured with high fidelity. The pitch calibration step was performed prior to the simulation using a dedicated spline-fitting algorithm that extracts the actual tooth positions from measured microgeometry data.
The tooth contact was modeled with nonlinear force elements, which incorporate elastic stiffness and damping in the normal direction of the tooth flank. The spline gear contact was defined as rigid–flexible, with the driving gear idealized as rigid and the driven gear treated as a flexible spline body, thus enabling the transmission of measured geometrical imperfections into the TE response. The global solver used a fixed-step integrator to maintain numerical stability and capture high-frequency TE modulation.

2.4. Simulation Scenarios

A single operating point (1000 rpm input, 0.4 s run time) was evaluated under three geometric conditions (Table 2).
Relative TE was logged from spline_force_Kinematics.Relative_TE_Angle. Signals were detrended and Fourier-transformed over 0.10–0.40 s. The shaft order tone was 16.66 Hz and the mesh frequency was 383.3 Hz.
Peak-to-peak and RMS TE, as well as spectral amplitudes at 16.66 Hz and 383.3 Hz, constitute the quantitative NVH metrics reported in Section 3.
These three configurations establish a controlled framework in which the isolated and combined effects of micro-geometry and pitch deviation can be quantified. The resulting transmission error responses are presented in Section 3.

3. Results

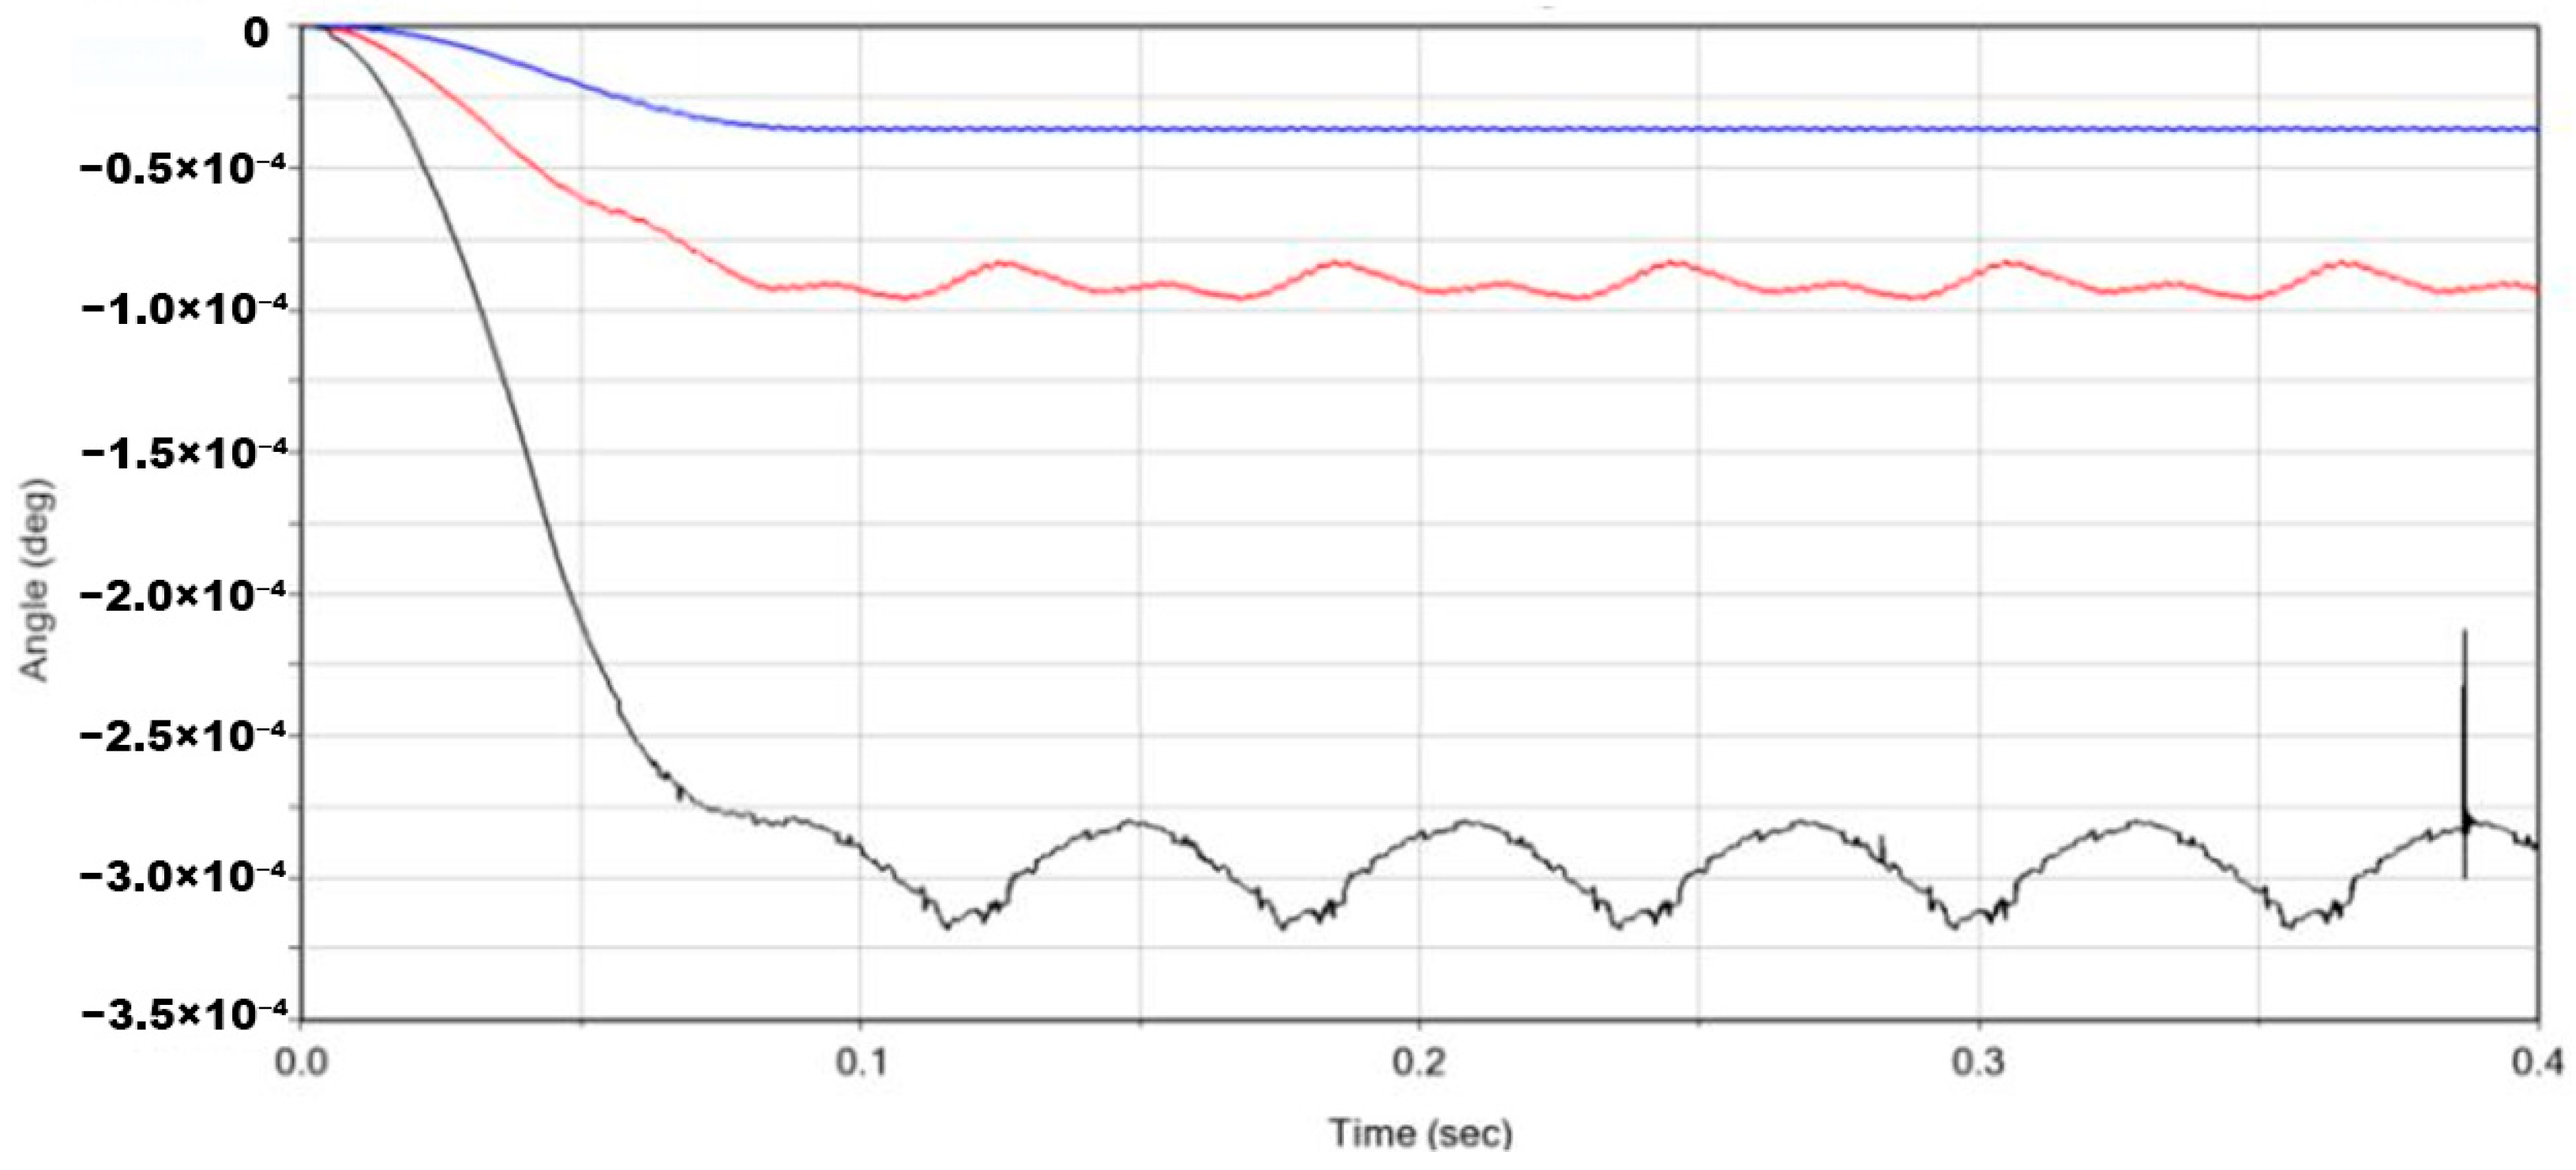
3.1. Time–Domain Transmission Error

Using the model settings and scenarios defined in Section 2, the time–domain TE curves exhibit three distinct trends. Figure 2 shows the relative transmission error (TE) angle for the three simulated configurations. The ideal geometry (blue) settles to a steady mean of −5 × 10⁻⁵ deg after 0.05 s. Activating the pitch error table (red) shifts the mean to −9 × 10⁻⁵ deg and superimposes a regular, saw-tooth modulation. Re-enabling the measured microgeometry (black) produces a much deeper negative offset (≈−3 × 10⁻⁴ deg) and a long-wave fluctuation that repeats once per pinion revolution. Peak-to-peak TE rises from 1.2 × 10⁻⁵ deg (ideal) to 1.6 × 10⁻⁵ deg (pitch only) and to 3.1 × 10⁻⁴ deg with measured microgeometry.

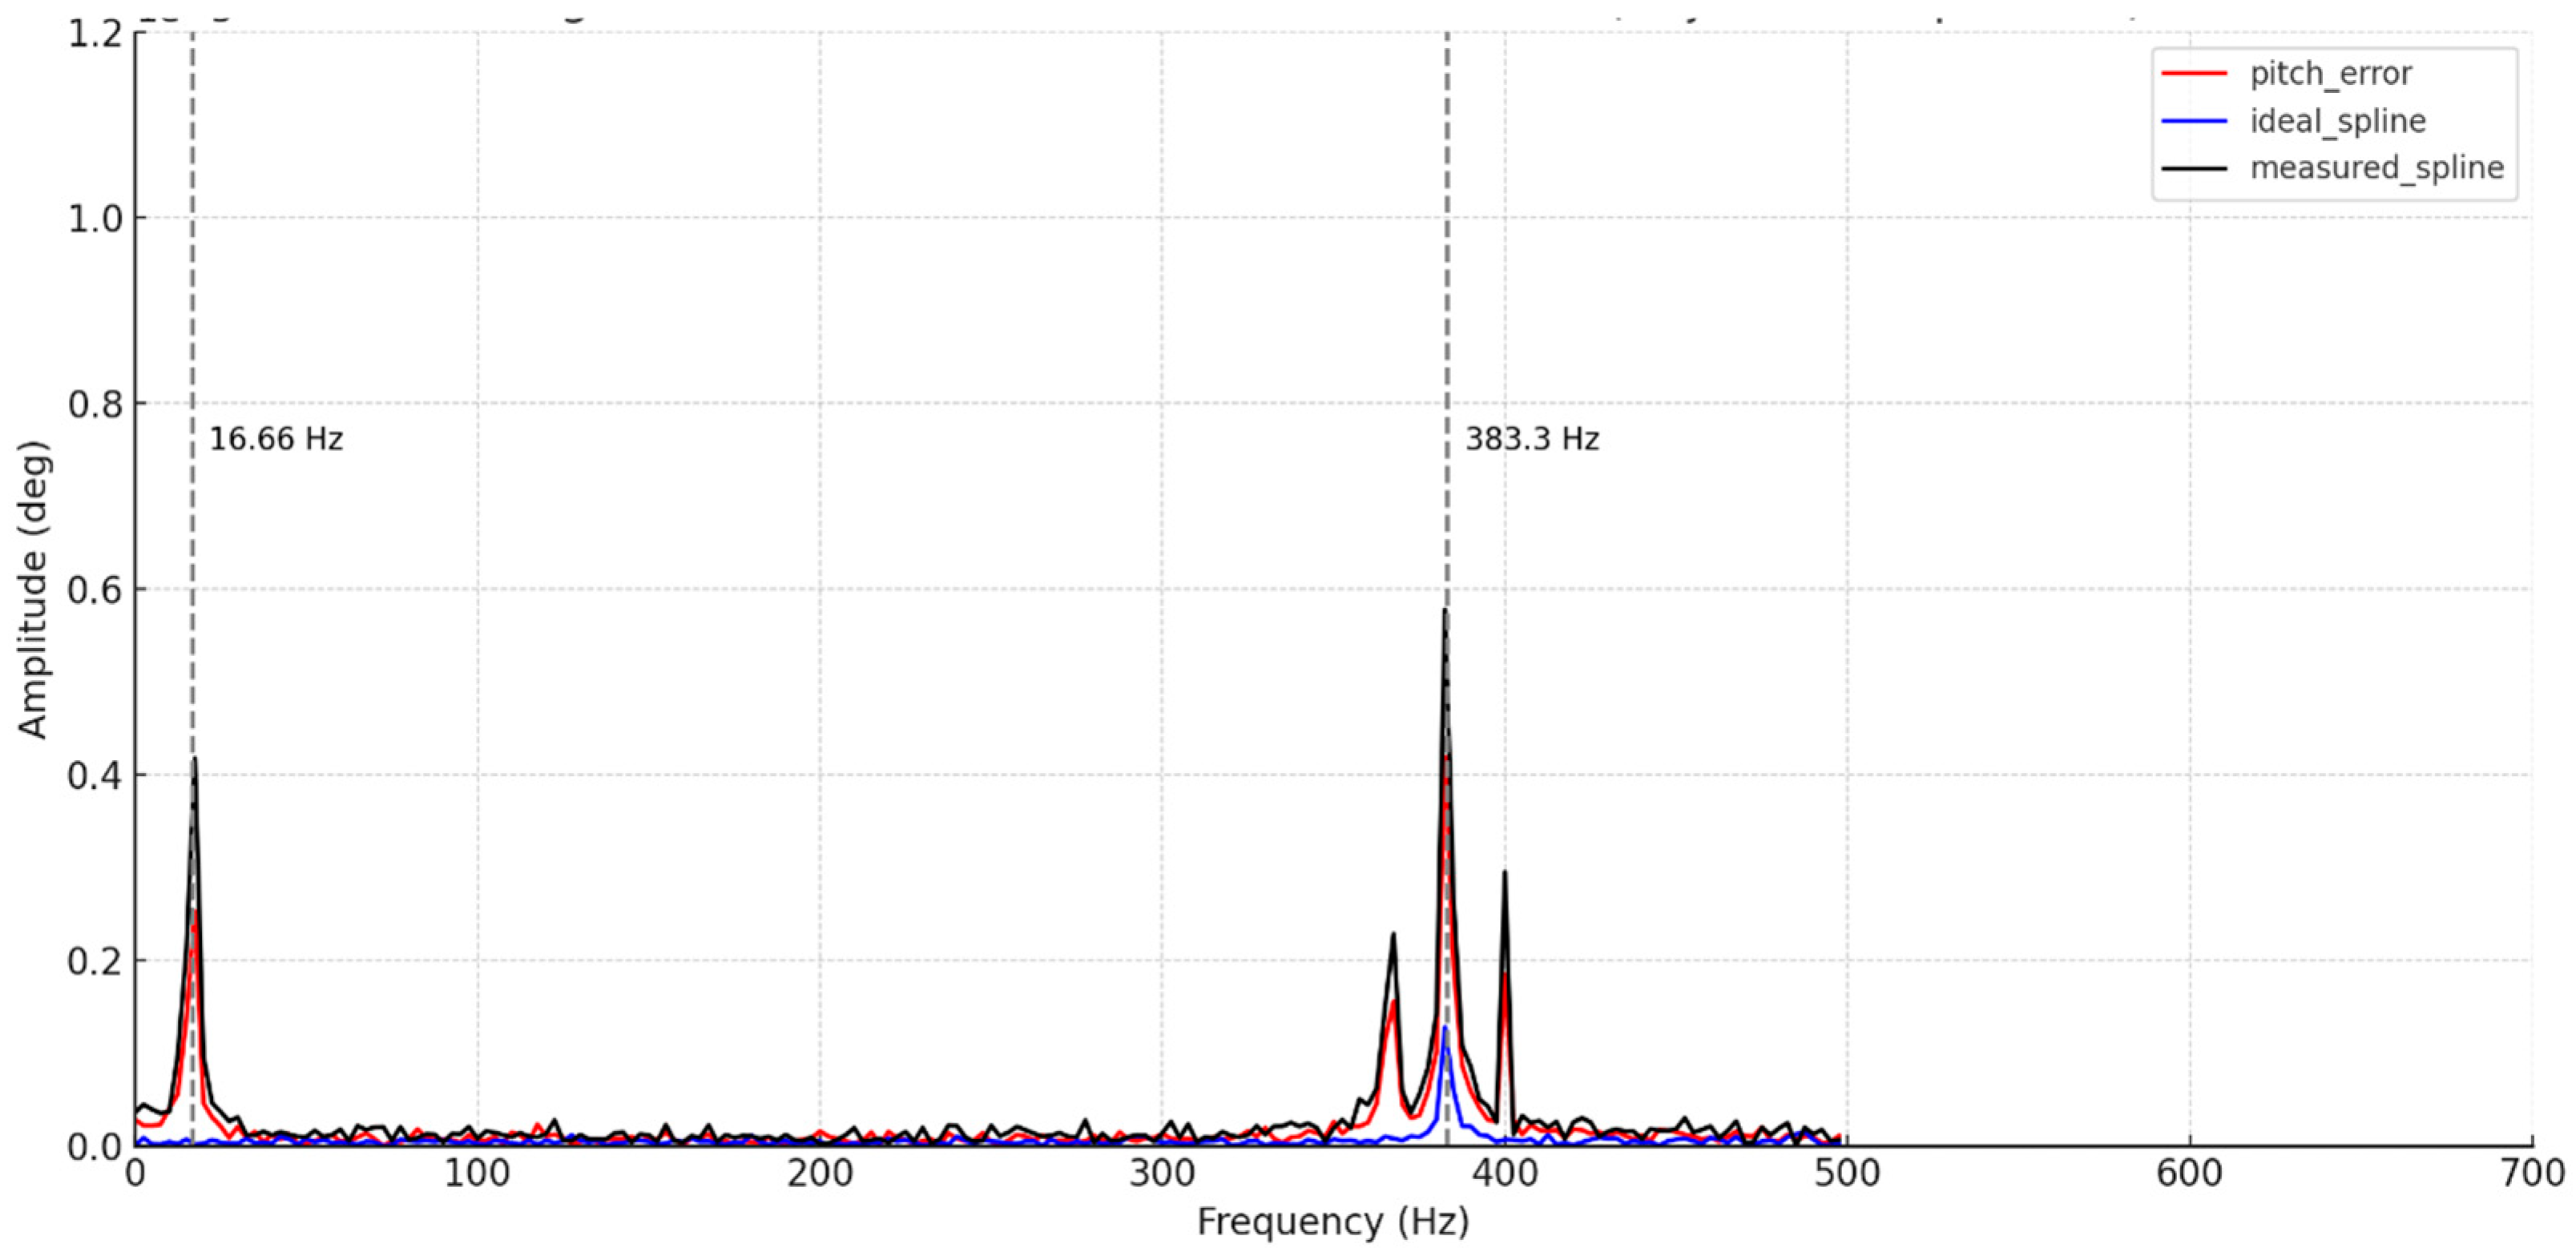
3.2. Frequency Domain Response

In Figure 2, the blue trace corresponds to the ideal microgeometry, the red trace represents the pitch error case, and the black trace shows the response with both measured microgeometry and pitch error. The same data set, analyzed in the frequency domain, reveals additional insights into how each error family redistributes spectral energy. The detrended FFT in Figure 3 confirms that pitch deviation introduces a distinct shaft order component at 16.66 Hz, a feature that is absent in the ideal configuration. When measured microgeometry is included, this tone persists, and mesh frequency side-bands become visible, indicating stiffness modulation by pitch error [5]. The primary mesh peak remains at 383.3 Hz for all cases, but its amplitude drops slightly once pitch error or microgeometry redistributes the mesh load.

3.3. Observations

  • Pitch error alone increases the magnitude of the mean TE by ~80%—from −5 × 10⁻⁵ deg in the baseline to −9 × 10⁻⁵ deg—and generates the shaft order tone, confirming that pitch error is a principal source of low-frequency torque ripple [17].
  • Measured microgeometry increases the peak-to-peak TE by nearly twenty times compared to the pitch error case—rising from 1.6 × 10⁻⁵ deg to 3.1 × 10⁻⁴ deg—and retains the shaft order tone. This confirms that local flank shape interacts with spacing deviation in a reinforcing, non-linear way rather than canceling it.
  • The appearance of mesh side-bands supports the analytical predictions that pitch-induced phase modulation spreads energy around the fundamental mesh frequency [17].
These results set the stage for the discussion, where the implications for e-drive gear tolerance and future probabilistic modeling are developed.
These mechanistic observations provide the basis for the comparative discussion in Section 4, where we benchmark our findings against classical thin-slice theory and recent experimental reports

4. Discussion

4.1. How Pitch Errors Reshape Transmission-Error Behaviour

The results confirm that indexing deviation is the key low-order exciter, even at modest magnitudes (Table 3). Activating the calibrated pitch table increased the mean TE by approximately 80% and introduced a clear shaft order tone at 16.66 Hz, as shown in Figure 2. Earlier spur gear studies reported comparable effects at 25–30 Hz for 1500 rpm drives [5], indicating that the mechanism scales predictably with speed. Adding measured microgeometry did not cancel the shaft order tone; instead, it deepened the negative TE offset and doubled peak-to-peak excursion. This non-linear coupling supports the analytical work of Li, Sun, and Liu (2024), who predicted that long-wave pitch patterns modulate mesh stiffness in a manner amplified by flank form irregularities [17].
The doubling of peak-to-peak TE observed when pitch error and measured microgeometry act together can be explained by a phase-addition mechanism. Pitch error adds a quasi-static circumferential phase error to each tooth pair; under constant speed, this appears as a periodic envelope with the shaft order tone. Measured microgeometry, on the other hand, introduces local stiffness fluctuations and micro-peak contact shifts that modulate the time-varying mesh stiffness. When the two error families are super-posed, the phase error aligns the micro-stiffness peaks on certain teeth, raising the effective mesh stiffness gradient. Thin-slice theory predicts that TE amplitude is proportional to this gradient; thus, the constructive overlap explains the non-linear amplification in Figure 2. A similar reinforcement was predicted analytically by Velex’s phase-modulated model and experimentally observed by Gauntt et al. for hybrid-spur gears, but it had not yet been demonstrated for helical pairs with a fully measured surface scan. Our results, therefore, confirm that indexing tolerance and microgeometry optimization cannot be decoupled; each influences the other through stiffness–phase interaction, especially in the low-load regime relevant to e-powertrains [7].

4.2. Design Implications for High-Speed E-Drive Gears

  • Pitch tolerances are as critical as flank form CpK. Even a few micrometers of spacing error generated a shaft order tone that masks any benefit of ideal flank design.
  • Digital twins must capture both micro-geometry and pitch deviation; omitting the latter underpredicts peak-to-peak TE by roughly a factor of two, as shown in Figure 1. Mesh side-bands offer a rapid audit metric; the ± 16.66 Hz skirts around the 383 Hz mesh-frequency line, as shown in Figure 2, and can be monitored during production tests to flag excessive pitch error [11].
The relevance of pitch quality is also reflected in international standards. ISO 1328-1:2013 [18] specifies that the single-pitch error for precision class 5 helical gears should not exceed 4 µm at the reference diameter, while DIN 3967 [19] recommends even tighter limits for e-drive noise classes. Our simulation indicates that exceeding these values by only two to three micrometers already doubles peak-to-peak TE, confirming that the tolerance bands prescribed by the standards are well aligned with NVH requirements [18,19].

4.3. Methodological Limitations

The present model operates at a single speed–load point with rigid wheels and uses digitized (not exported) TE data. Hence, the following are true:
  • Speed sensitivity of the shaft order tone remains unquantified [20];
  • Local compliance effects are approximated by generic stiffness functions;
  • Statistical dispersion in pitch error is not propagated;
  • Lifecycle changes (wear, thermal growth) are neglected.

4.4. Comparison with Previous Models

Our findings extend—and partly refine—the trends reported in earlier gear dynamic studies. Inalpolat et al. (2014) [5] reproduced shaft order tones by injecting analytically prescribed indexing errors into an otherwise ideal spur gear model; our simulations confirm this mechanism but show that the amplitude of the 16.66 Hz component nearly doubles once real flank topologies are added. Wang et al. (2017) [11] and later Li et al. (2024) [17] predicted that pitch error produces mesh frequency side-bands; the present model recreates the same ±16.66 Hz skirts around 383 Hz, demonstrating that the measured pitch table is correctly mapped into the multibody solver. Unlike those studies, which relied on nominal tooth geometry or average micro-modifications, the current work imports a full, tooth-resolved surface scan, revealing a non-linear reinforcement between microgeometry and indexing error that was not captured previously. This added fidelity explains why our peak-to-peak TE rises more sharply than in models that treat the two error families in isolation, and it underscores the need to include both effects when setting NVH-critical tolerances for high-speed e-drive gears.

5. Conclusions

The simulations presented in this study show unequivocally that pitch error is the chief trigger of low-order excitation in helical gear pairs. Even a calibrated spacing deviation of only a few micrometers shifted the mean transmission error (TE) by almost one order of magnitude and produced a distinct shaft order tone at 16.66 Hz. When the measured tooth surface topology was added to the same model, the two error families did not cancel but reinforced one another; the negative TE offset deepened, and the peak-to-peak excursion nearly doubled. This non-linear coupling demonstrates that local flank shape can amplify the dynamic impact of indexing faults rather than masking it.
In the frequency domain, pitch error generated the expected side-bands that flank the fundamental mesh frequency; these spectral skirts were absent from the ideal case but re-appeared when pitch error was re-introduced, confirming that the calibrated pitch table is correctly mapped into the multibody solver. Therefore, such side-bands offer a sensitive diagnostic marker for excessive indexing deviation during end-of-line testing.
From a design standpoint, the results underline that precise indexing must accompany profile relief optimization. Digital twin models that ignore pitch error systematically under-predict TE and may lead to overly optimistic acoustic targets. Conversely, twins that combine a tooth-resolved surface scan with an accurately referenced pitch error map can evaluate corrective actions such as phase matching or intentional error phasing long before hardware is cut.
Although the present work was limited to a single speed–load point with rigid wheels, the methodology provides a robust foundation. Extending the framework to flexible bodies, duty cycle sweeps and statistical pitch distributions will narrow the gap between simulation and test and support lifecycle NVH prediction in next-generation electric drivetrains.

Author Contributions

Conceptualization, K.H.; Methodology, K.H.; Software, K.H.; Formal analysis, K.H.; Resources, K.H.; Writing—original draft, K.H.; Supervision, D.F. All authors have read and agreed to the published version of the manuscript.

Funding

This research received no external funding.

Institutional Review Board Statement

Not applicable.

Informed Consent Statement

Not applicable.

Data Availability Statement

The data presented in this study are available on request from the corresponding author. The data are not publicly available due to industrial collaboration constraints and confidentiality agreements.

Acknowledgments

The authors would like to thank the colleagues at Széchenyi István University for their support during this study.

Conflicts of Interest

The authors declare no conflict of interest.

Nomenclature

SymbolsDescriptionUnit
Symbol
Aamplitude of base excitationm
EYoung’s modulusGPa
f_mgear-mesh frequencyHz
I_zzpolar mass moment of inertia about z-axiskg·mm2
j_nbacklash in the normal planemm
m_imass of the i-th componentkg
nrotational speedr·min−1
ttimes
Δt_maxmaximum integration time steps
TEtransmission errorrad
TE_idealideal transmission errorrad
TE_micromicrogeometry transmission errorrad
Greek symbols
αHHT-α algorithm parameter
βhelix angle°
δ_psingle-pitch errorµm
λsampling ratio
Abbreviations
AcronymMeaning
CMMcoordinate-measuring machine
FFTfast Fourier transform
FEMfinite element method
HHTHilber–Hughes–Taylor implicit integrator
r.p.m.revolutions per minute (r·min−1)

References

  1. Siemens PLM Software. Transmission Error: The Metric for Gearbox NVH Quality. White Paper 2014. Available online: https://www.plm.automation.siemens.com/en_us/Images/Transmission_error_the_metric_for_gearbox_NVH_quality_tcm1023-220935.pdf (accessed on 16 May 2025).
  2. Velex, P. On the modelling of spur and helical gear dynamic behaviour. In Mechanical Engineering; IntechOpen: London, UK, 2012; pp. 75–106. [Google Scholar] [CrossRef]
  3. Czakó, A.; Řehák, K.; Prokop, A.; Ranjan, V. Determination of static transmission error of helical gears using finite element analysis. J. Meas. Eng. 2020, 8, 167–181. [Google Scholar] [CrossRef]
  4. Im, D.; Chung, W.-J.; Lee, H.; Lee, Y.-J.; Sung, H.; Lee, M.; Park, Y.-J. Analysis of gear transmission error in helical gear using enhanced tooth contact analysis model considering measured tooth profile errors. Sci. Rep. 2025, 15, 5981. [Google Scholar] [CrossRef]
  5. Inalpolat, M.; Handschuh, M.; Kahraman, A. Impact of indexing errors on spur gear dynamics. In Proceedings of the International Gear Conference 2014, Lyon, France, 26–28 August 2014; pp. 751–762. [Google Scholar] [CrossRef]
  6. Chung, W.-J.; Park, Y.-J.; Choi, C.; Kim, S.-C. Effects of manufacturing errors of gear macro-geometry on gear performance. Sci. Rep. 2023, 13, 50. [Google Scholar] [CrossRef] [PubMed]
  7. Gauntt, S.; McIntyre, S.; Campbell, R.L. Effects of optimal tooth microgeometry modifications on static and dynamic transmission errors of hybrid spur gear drivetrains. J. Am. Helicopter Soc. 2023, 68, 042006. [Google Scholar] [CrossRef]
  8. Padmasolala, G.; Lin, H.H. Influence of tooth spacing error on gears with and without profile modifications. In Proceedings of the ASME 2000 International Design Engineering Technical Conferences and Computers and Information in Engineering Conference, Baltimore, MD, USA, 10–13 September 2000; NASA/TM-2000-210061. pp. 647–653. [Google Scholar] [CrossRef]
  9. Furch, J.; Nguyễn, T.T. Simulation of failure in gearbox using MSC ADAMS. Acta Univ. Agric. Silvic. Mendel. Brun. 2017, 65, 419–428. [Google Scholar] [CrossRef]
  10. Roldán, Á.M. Gearbox Transmission Error Study Using Multibody Analysis Software MSC Adams. Master’s Thesis, University of Seville, Sevilla, Spain, 2018. Available online: https://hdl.handle.net/11441/86135 (accessed on 10 June 2025).
  11. Wang, F.; Xu, X.; Fang, Z.; Chen, L. Study of the influence mechanism of pitch deviation on cylindrical helical gear meshing stiffness and vibration noise. Adv. Mech. Eng. 2017, 9, 1687814017720586. [Google Scholar] [CrossRef]
  12. Guo, F.; Fang, Z. Experimental and theoretical study of gear dynamical transmission characteristic considering measured manufacturing errors. Shock. Vib. 2018, 2018, 9645453. [Google Scholar] [CrossRef]
  13. Pan, S.; Li, Y.; Wang, J. Influence of pitch error on vibration, bifurcation, and chaos characteristics of the helical gear pair system. Math. Probl. Eng. 2021, 2021, 6338625. [Google Scholar] [CrossRef]
  14. Liu, P.; Zhu, L.; Gou, X.; Shi, J.; Jin, G. Dynamics modeling and analyzing of spur gear pair with pitch deviation considering time-varying contact ratio under multi-state meshing. J. Sound Vib. 2021, 513, 116411. [Google Scholar] [CrossRef]
  15. Najib, R.; Neufond, J.; Franco, F.; Petrone, G.; De Rosa, S. Effect of manufacturing tolerances and uncertainties on the NVH response of spur and helical gears: A review. Proc. Inst. Mech. Eng. Part C J. Mech. Eng. Sci. 2025; advance online publication. [Google Scholar] [CrossRef]
  16. MSC Software. Gear AT: Individual Tooth Measurement Spline (A24-2_001) [Tutorial]; Hexagon AB: Stockholm, Sweden, 2024. [Google Scholar]
  17. Li, J.; Sun, Z.; Liu, Q. Effects of periodic long-wave deviations on the dynamic behaviours of spur gears. J. Sound Vib. 2024, 561, 118820. [Google Scholar] [CrossRef]
  18. ISO 1328-1:2013; Cylindrical Gears—ISO System of Flank Tolerance Classification—Part 1: Definitions and Allowable Values of Deviations Relevant To Flanks Of Gear Teeth. International Organization for Standardization (ISO): Geneva, Switzerland, 2013.
  19. DIN 3967:2010-05; Tolerances for Cylindrical Gear Teeth—System of Accuracy. Deutsches Institut für Normung [DIN]: Berlin, Germany, 2010.
  20. Türich, A.; Deininger, K. Noise analysis for e-drive gears and in-process gear inspection. Gear Solut. 2024, 40, 44–48. [Google Scholar]
Figure 1. Multibody model of the gear pair in MSC Adams.
Applsci 15 07851 g001
Figure 2. Relative TE angle versus time for the three simulated configurations (0–0.4 s, 1000 rpm). Red curve: pitch error only, blue curve: ideal geometry, black curve: measured microgeometry.
Applsci 15 07851 g002
Figure 3. FFT of the TE signals. A shaft order peak appears at 16.66 Hz only when pitch error is active; side-bands flank the mesh frequency pair at 383.3 Hz.
Applsci 15 07851 g003
Table 1. Main geometric and mass properties of the 23/81 helical gear pair.
ParameterSymbolPinionGear
Teeth numberz2381
Module (normal)mₙ1.3951.395
Face widthb30.028.0
Normal pressure angleαₙ20.020.0
Helix angleβ−24.0+24.0
Addendum mod. coeff.x0.1755−0.4611
Rim diameterd_rim30.0116.0
Normal backlashj_n0.0500.050
Massm0.06360.2486
Principal inertiaIzz17.78889.51
Note. Pinion lead relief: quadratic ±0.0325 mm over ±15 mm from each end; gear crowning: quadratic 0.0108 mm symmetric about the mid-face width.
Table 2. Simulation matrix.
SimulationFlank GeometryPitch TablePurpose
I IdealNominal CADNoneBaseline
II MicroMeasured microgeometryNoneMicrogeometry only
III PitchNominal CADCalibrated tablePitch error only
Table 3. Key TE metrics.
Key TE MetricsIdealPitch-ErrorMeasured Microgeometry
Mean TE (0.35–0.40 s) [deg]−5 × 10⁻⁵−9 × 10⁻⁵−3 × 10⁻⁴
Peak-to-peak TE [deg]1.2 × 10−51.6 × 10−53.1 × 10⁻⁴
Shaft-order tone 16.66 Hz [deg]<2 × 10−64 × 10−63 × 10−6
Mesh-peak amplitude 383.3 Hz [deg]7.5 × 10−66.8 × 10−66.5 × 10⁻⁶
Disclaimer/Publisher’s Note: The statements, opinions and data contained in all publications are solely those of the individual author(s) and contributor(s) and not of MDPI and/or the editor(s). MDPI and/or the editor(s) disclaim responsibility for any injury to people or property resulting from any ideas, methods, instructions or products referred to in the content.

