Article

Model Test on Excavation Face Stability of Shallow-Buried Rectangular Pipe Jacking in Sand Layer

1
PowerChina Guiyang Engineering Corporation Limited, Guiyang 550081, China
2
School of Qilu Transportation, Shandong University, Jinan 250002, China
3
Faculty of Engineering, China University of Geosciences (Wuhan), Wuhan 430074, China
4
Engineering Research Center of Rock-Soil Drilling & Excavation and Protection, Ministry of Education, Wuhan 430074, China
*
Authors to whom correspondence should be addressed.
Appl. Sci. 2025, 15(14), 7847; https://doi.org/10.3390/app15147847 (registering DOI)
Submission received: 1 June 2025 / Revised: 23 June 2025 / Accepted: 30 June 2025 / Published: 14 July 2025

Abstract

This study addresses the critical challenge of excavation face instability in rectangular pipe jacking through systematic physical model tests. Utilizing a half-section symmetry apparatus with non-contact photogrammetry and pressure monitoring, the study investigates failure mechanisms under varying overburden ratios and sand densities. Key findings reveal that support pressure evolution follows a four-stage trajectory: rapid decline (elastic deformation), slow decline (soil arching development), slow rise (arch degradation), and stabilization (global shear failure). The minimum support pressure ratio Pmin decreases by 39–58% in loose sand but only 10–37% in dense sand due to enhanced arching effects. Distinctive failure mechanisms include the following: (1) failure angles exceeding 70°, substantially larger than theoretical predictions; (2) bimodal ground settlement characterized by without settlement followed by abrupt collapse, contrasting with gradual transitions in circular excavations; (3) trapezoidal settlement surfaces with equilibrium arch angles ranging 41°–48°. These new discoveries demonstrate that real-time support pressure monitoring is essential for risk mitigation, as ground deformation exhibits severe hysteresis preceding catastrophic rapid collapse. The experimental framework provides fundamental insights into optimizing excavation face support design in shallow-buried rectangular tunneling.

1. Introduction

Rectangular pipe jacking demonstrates 20–35% higher space utilization efficiency compared to circular alternatives by eliminating ground leveling requirements, making it particularly suitable for constructing shallow-buried underground infrastructures in sandy soil strata, such as utility tunnels, metro stations, and pedestrian passages [1,2,3]. However, the excavation process inevitably disrupts the original geostatic stress field. Given the low cohesion characteristics and weak soil arching effects inherent in sandy soils, shallow burial conditions significantly increase the risk of excavation face instability, potentially triggering substantial ground subsidence. Consequently, a comprehensive understanding of failure mechanisms, including support pressure variation patterns, soil failure modes, and soil arch evolution dynamics, during rectangular pipe jacking operations becomes crucial for both engineering safety assurance and environmental impact mitigation.
Xu et al. [4] investigated excavation face instability in sandy gravel strata during rectangular pipe jacking through numerical simulations, revealing soil plastic deformation characteristics and developing a wedge-shaped support pressure calculation model. Xie et al. [5] subsequently performed scaled model tests on pipe curtain box culverts in sandy layers, demonstrating the structural reinforcement effects on rectangular excavation faces. Pan et al. [6] systematically analyzed face stability under various reinforcement configurations through case studies of actual projects. Building on Mindlin′s displacement solution and stochastic medium theory, Wang et al. [7] established an analytical framework for stratum disturbance prediction during parallel rectangular pipe jacking operations. Ding et al. [8] further refined the wedge-shaped model by incorporating advanced numerical simulations of soil failure mechanisms ahead of excavation faces. Addressing operational safety concerns, Liu et al. [9,10] developed an optimized limit support pressure model through comprehensive analysis of pressure distribution patterns in earth pressure balance chambers during muck removal processes. Notably, Ding et al. [11] formulated a three-dimensional instability model using spatial discretization techniques and derived a support pressure calculation method based on limit analysis upper bound theory, although its computational complexity necessitates MATLAB-based numerical solutions. Qu et al. [12] extended the investigation to saturated sand conditions, conducting coupled hydro-mechanical analyses of support pressure evolution, pore water pressure distribution, and failure mode development in large-section rectangular pipe jacking projects.
While research on rectangular excavation face stability has gained momentum, current methodologies predominantly rely on theoretical assumptions and numerical simulations, with limited experimental validation through physical modeling. Furthermore, existing instability models and support pressure formulations frequently extrapolate from circular face research outcomes, inadequately addressing shape-induced mechanical differences. This methodological gap underscores the need for dedicated experimental investigations capturing the unique failure characteristics of rectangular geometries.
This study conducts systematic model tests investigating rectangular excavation face stability under varying overburden depths and soil compaction states. The instability process is physically simulated through controlled retraction of support plates, while employing non-contact photogrammetry and full-field deformation monitoring systems to capture. This is conducive to reducing the interference of monitoring equipment on soil deformation and force in previous studies: (1) real-time support pressure fluctuations, (2) deep soil displacement fields, and (3) ground settlement patterns. This experimental approach enables comprehensive visualization and quantitative analysis of critical failure mechanisms, including progressive support pressure redistribution, distinct soil failure mode development, and spatial–temporal evolution characteristics of soil arching effects during rectangular face instability.

2. Experimental Design

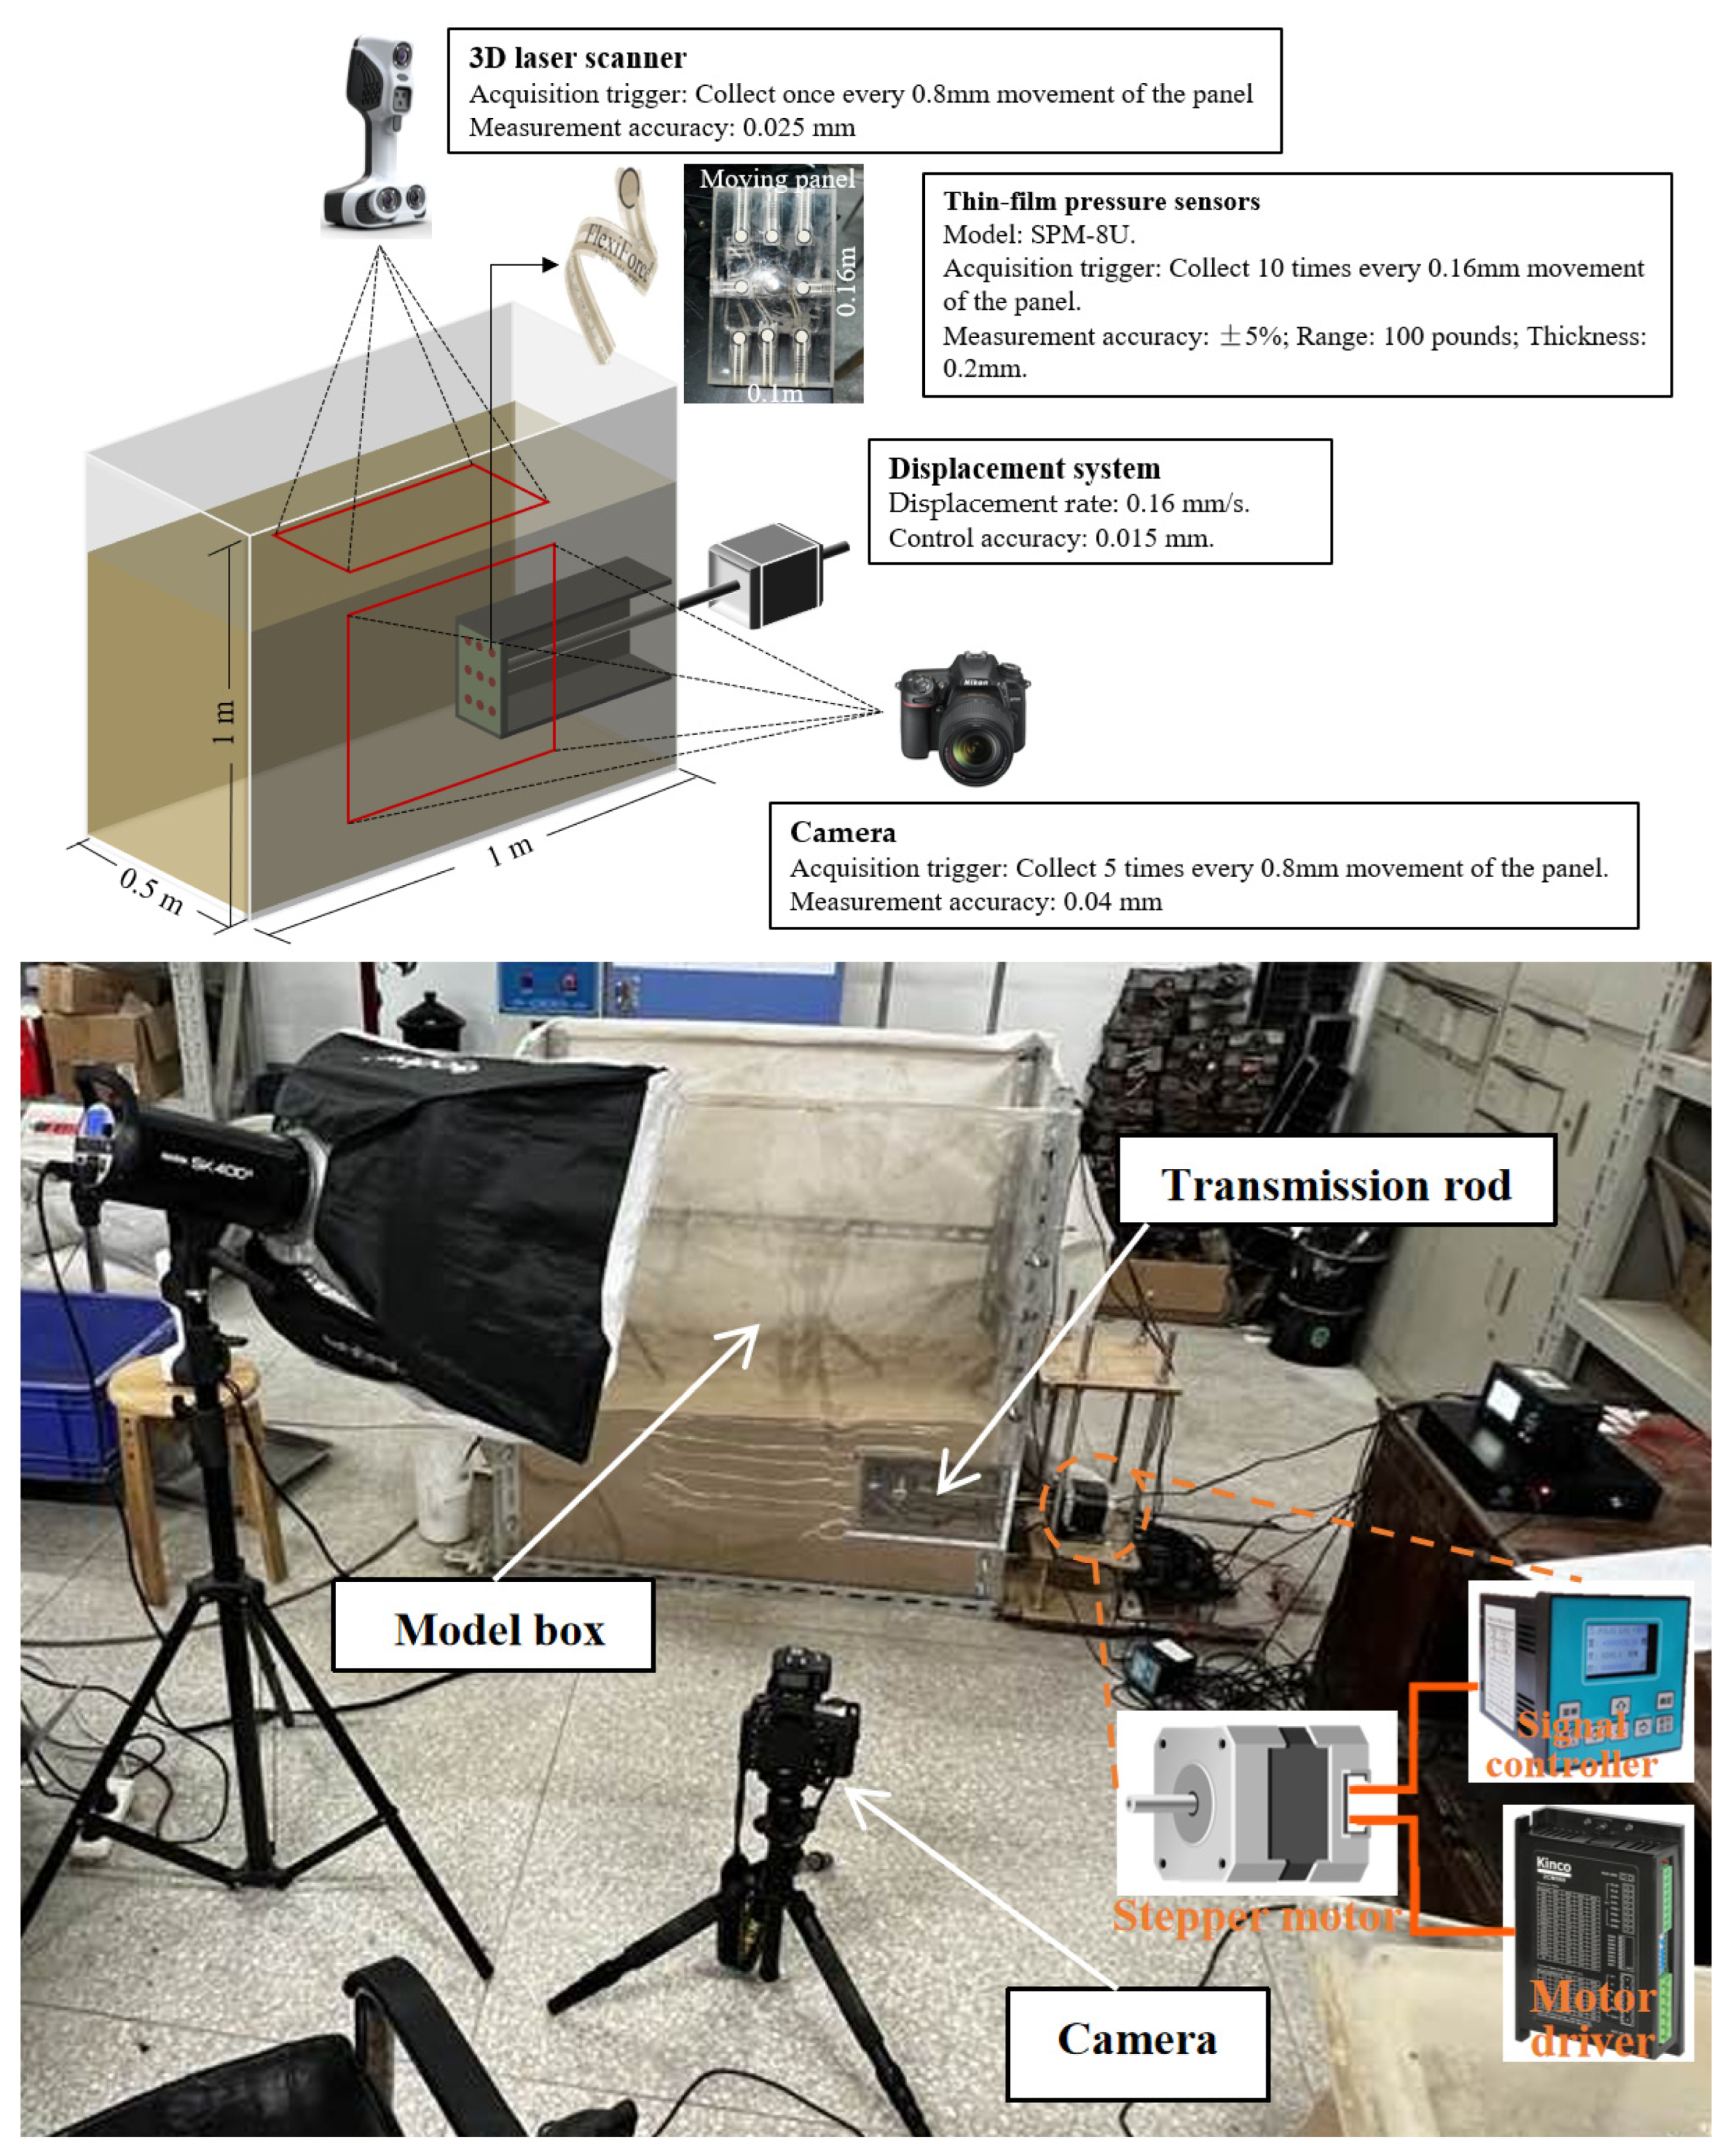
2.1. Experimental Device

The half-model symmetry method combined with excavation face displacement control enables direct visualization of deep soil deformation patterns during face instability [5,13,14,15,16]. As illustrated in Figure 1, the experimental setup comprises four primary components: (1) a model box with dimensions 1.0 m × 0.5 m × 1.0 m and constructed with 20 mm thick acrylic sheets to facilitate Particle Image Velocimetry (PIV) measurements; (2) based on the similarity criterion conditions, the geometric similarity ratio is set at 50, with a scaled rectangular pipe model measuring 0.10 m (W) × 0.16 m (H) positioned 0.16 m (1H) above the box base; (3) the excavation face movement system; (4) the monitoring system.
The excavation face displacement system includes a moving panel, transmission rod, and control module. The moving panel is a 20 mm thick rectangular acrylic plate. The control module includes a stepper motor, motor driver, and signal controller. The monitoring system includes cameras, handheld 3D laser scanner, and thin-film pressure sensors (Changzhou Tiance electronic technology Co., Ltd. (Changzhou, China); SPM-8U). The camera is placed directly in front of the rectangular pipe jacking model to capture soil displacement fields. The 3D laser scanner maps ground settlement. Nine single-point, thin-film pressure sensors are fixed on the moving panel surface to collect excavation face support pressure.

2.2. Materials and Methods

According to scaling principles in geotechnical modeling, the deformation trend of soil particles is basically consistent with prototype soil when the scale ratio between model dimensions and particle sizes exceeds 175 [17]. For the current experimental configuration with a 0.10 m × 0.16 m pipe model, this criterion dictates that the maximum particle diameter should be less than 0.57 mm. As shown in Figure 2, The selected medium sand (Figure 2) exhibits the following: (1) a small coefficient of uniformity (Cu = 2.07); (2) a steep gradation curve (91.7% soil particles ≤ 0.57 mm), collectively ensuring proper scaling fidelity and particle size compliance.
The experimental matrix systematically investigates two key parameters: (1) overburden ratios (Z/H = 0.5, 1.0, 1.5, 2.0) and (2) soil compactness (loose, medium-dense, and dense). Standard compaction and volumetric methods were employed to establish the soil’s maximum and minimum dry densities. Based on these benchmarks, three characteristic densities were selected as follows: 1.56 g/cm3 (loose), 1.65 g/cm3 (medium-dense), and 1.80 g/cm3 (dense), corresponding to distinct compactness states as summarized in Table 1. The model test of this study is the unstable deformation of the soil at the excavation face under the action of self-weight, as well as the density and internal friction angle meet the similarity ratio requirements.
The experimental procedure comprised seven sequential phases:
(1)
Instrument Configuration (Shanghai Saisu Motor Technology Co., Ltd., Shanghai, China)
  • Stereo cameras were configured for 1 Hz image acquisition over 5 s intervals.
  • Calibrated thin-film pressure sensors were surface-mounted on the moving panel with 10 Hz sampling.
  • Terrestrial laser scanning resolution was set to 0.025 mm.
  • Stepper motor displacement rate was programmed at 0.16 mm/s (0.1%H/s) through closed-loop control.
(2)
Specimen Preparation
Employing the sand raining technique, the predetermined soil mass was deposited layer-wise to achieve target density profiles corresponding to specific overburden ratios and soil compactness.
(3)
Baseline Measurement
Following 24 h pressure stabilization, initial condition documentation included the following:
  • Initial deep soil images.
  • Support pressure baseline values.
  • Reference ground topography.
(4)
Kinematic Testing
Synchronized data acquisition commenced with motor activation, maintaining constant face retreat velocity while monitoring the following:
  • Temporal pressure fluctuations.
  • Progressive soil displacement fields.
(5)
Intermittent Scanning
Automated test pauses at 0.5% displacement intervals enabled intermediate ground deformation quantification using a 3D laser scanner.
(6)
Termination Criteria
Cyclic testing continued until ground subsidence exceeded 5%H or catastrophic collapse morphology developed.
(7)
Post-processing
  • Particle Image Velocimetry (PIV) analysis was performed using MATLAB (R2022a)-integrated PIVlab plugin to quantify soil displacement fields during instability progression. High-resolution 2D image sequences were processed to generate time-dependent displacement contour maps.
  • Single point pressure test system SPM-8 was employed to process pressure–time histories.
  • 3D ground deformation analysis was conducted in Geomagic Wrap v2021 software through the following sequential steps: point cloud registration using the iterative closest point algorithm; differential surface modeling; and deformation vector field visualization.

3. Results and Analysis

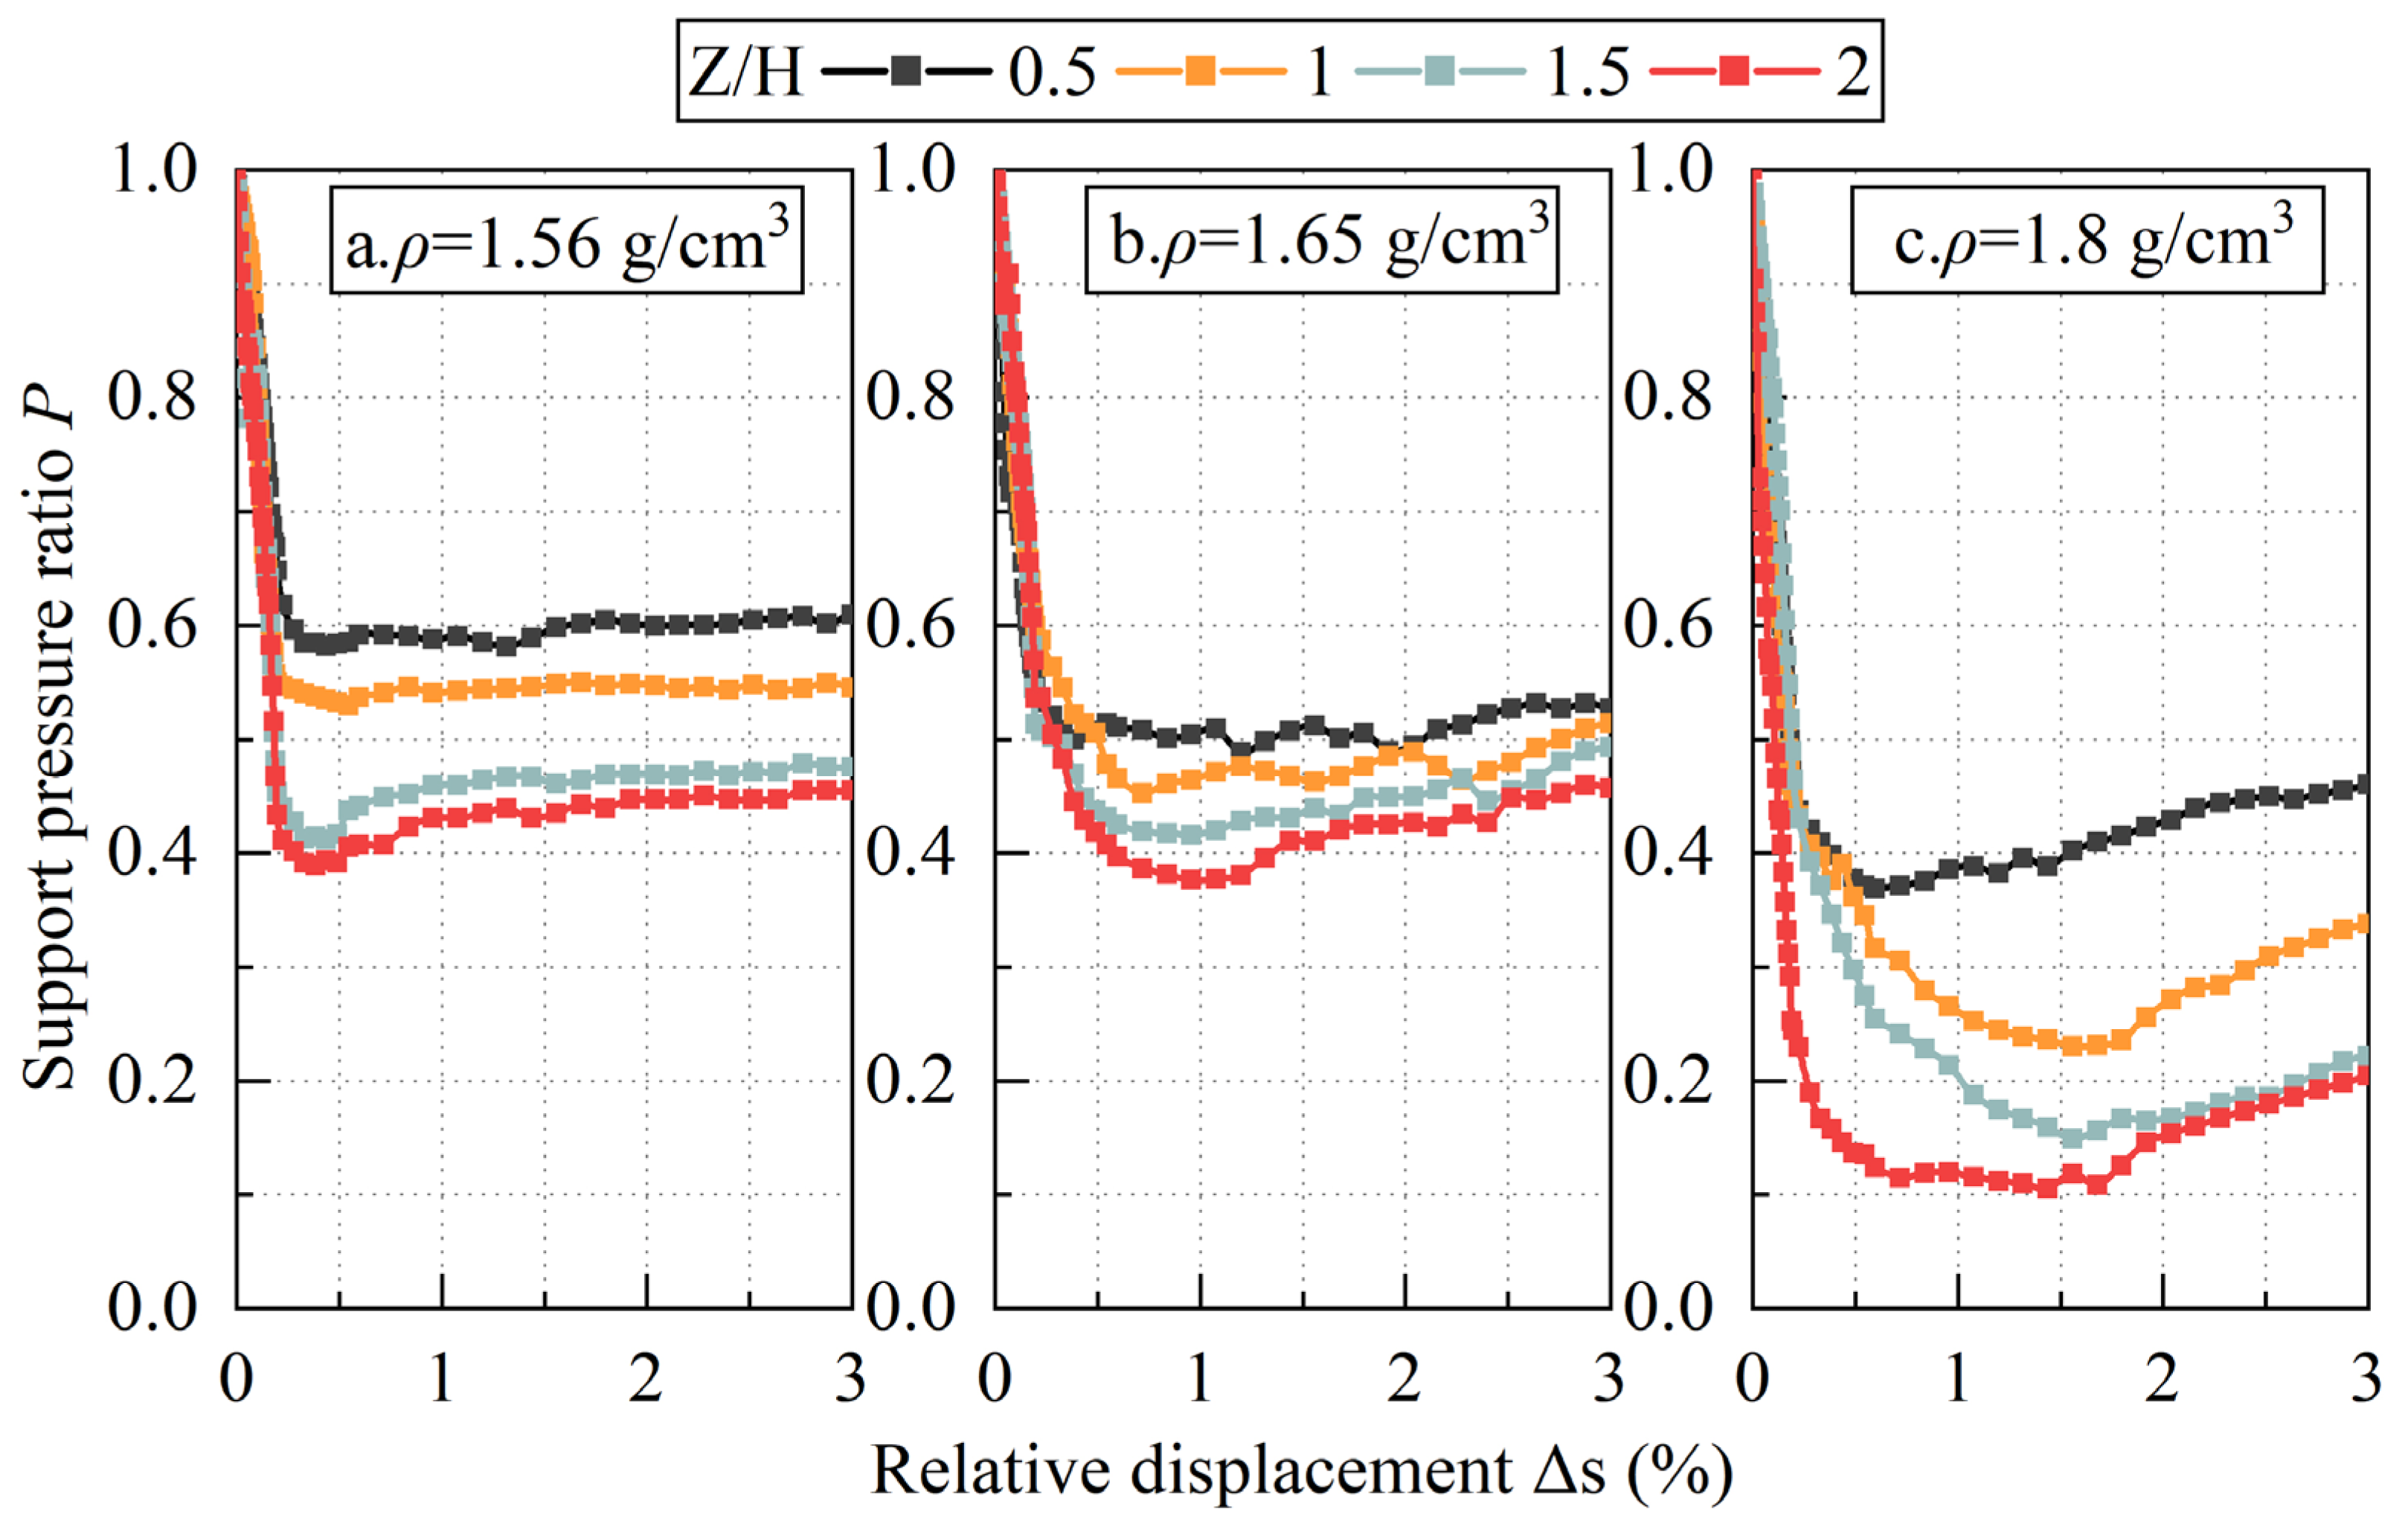
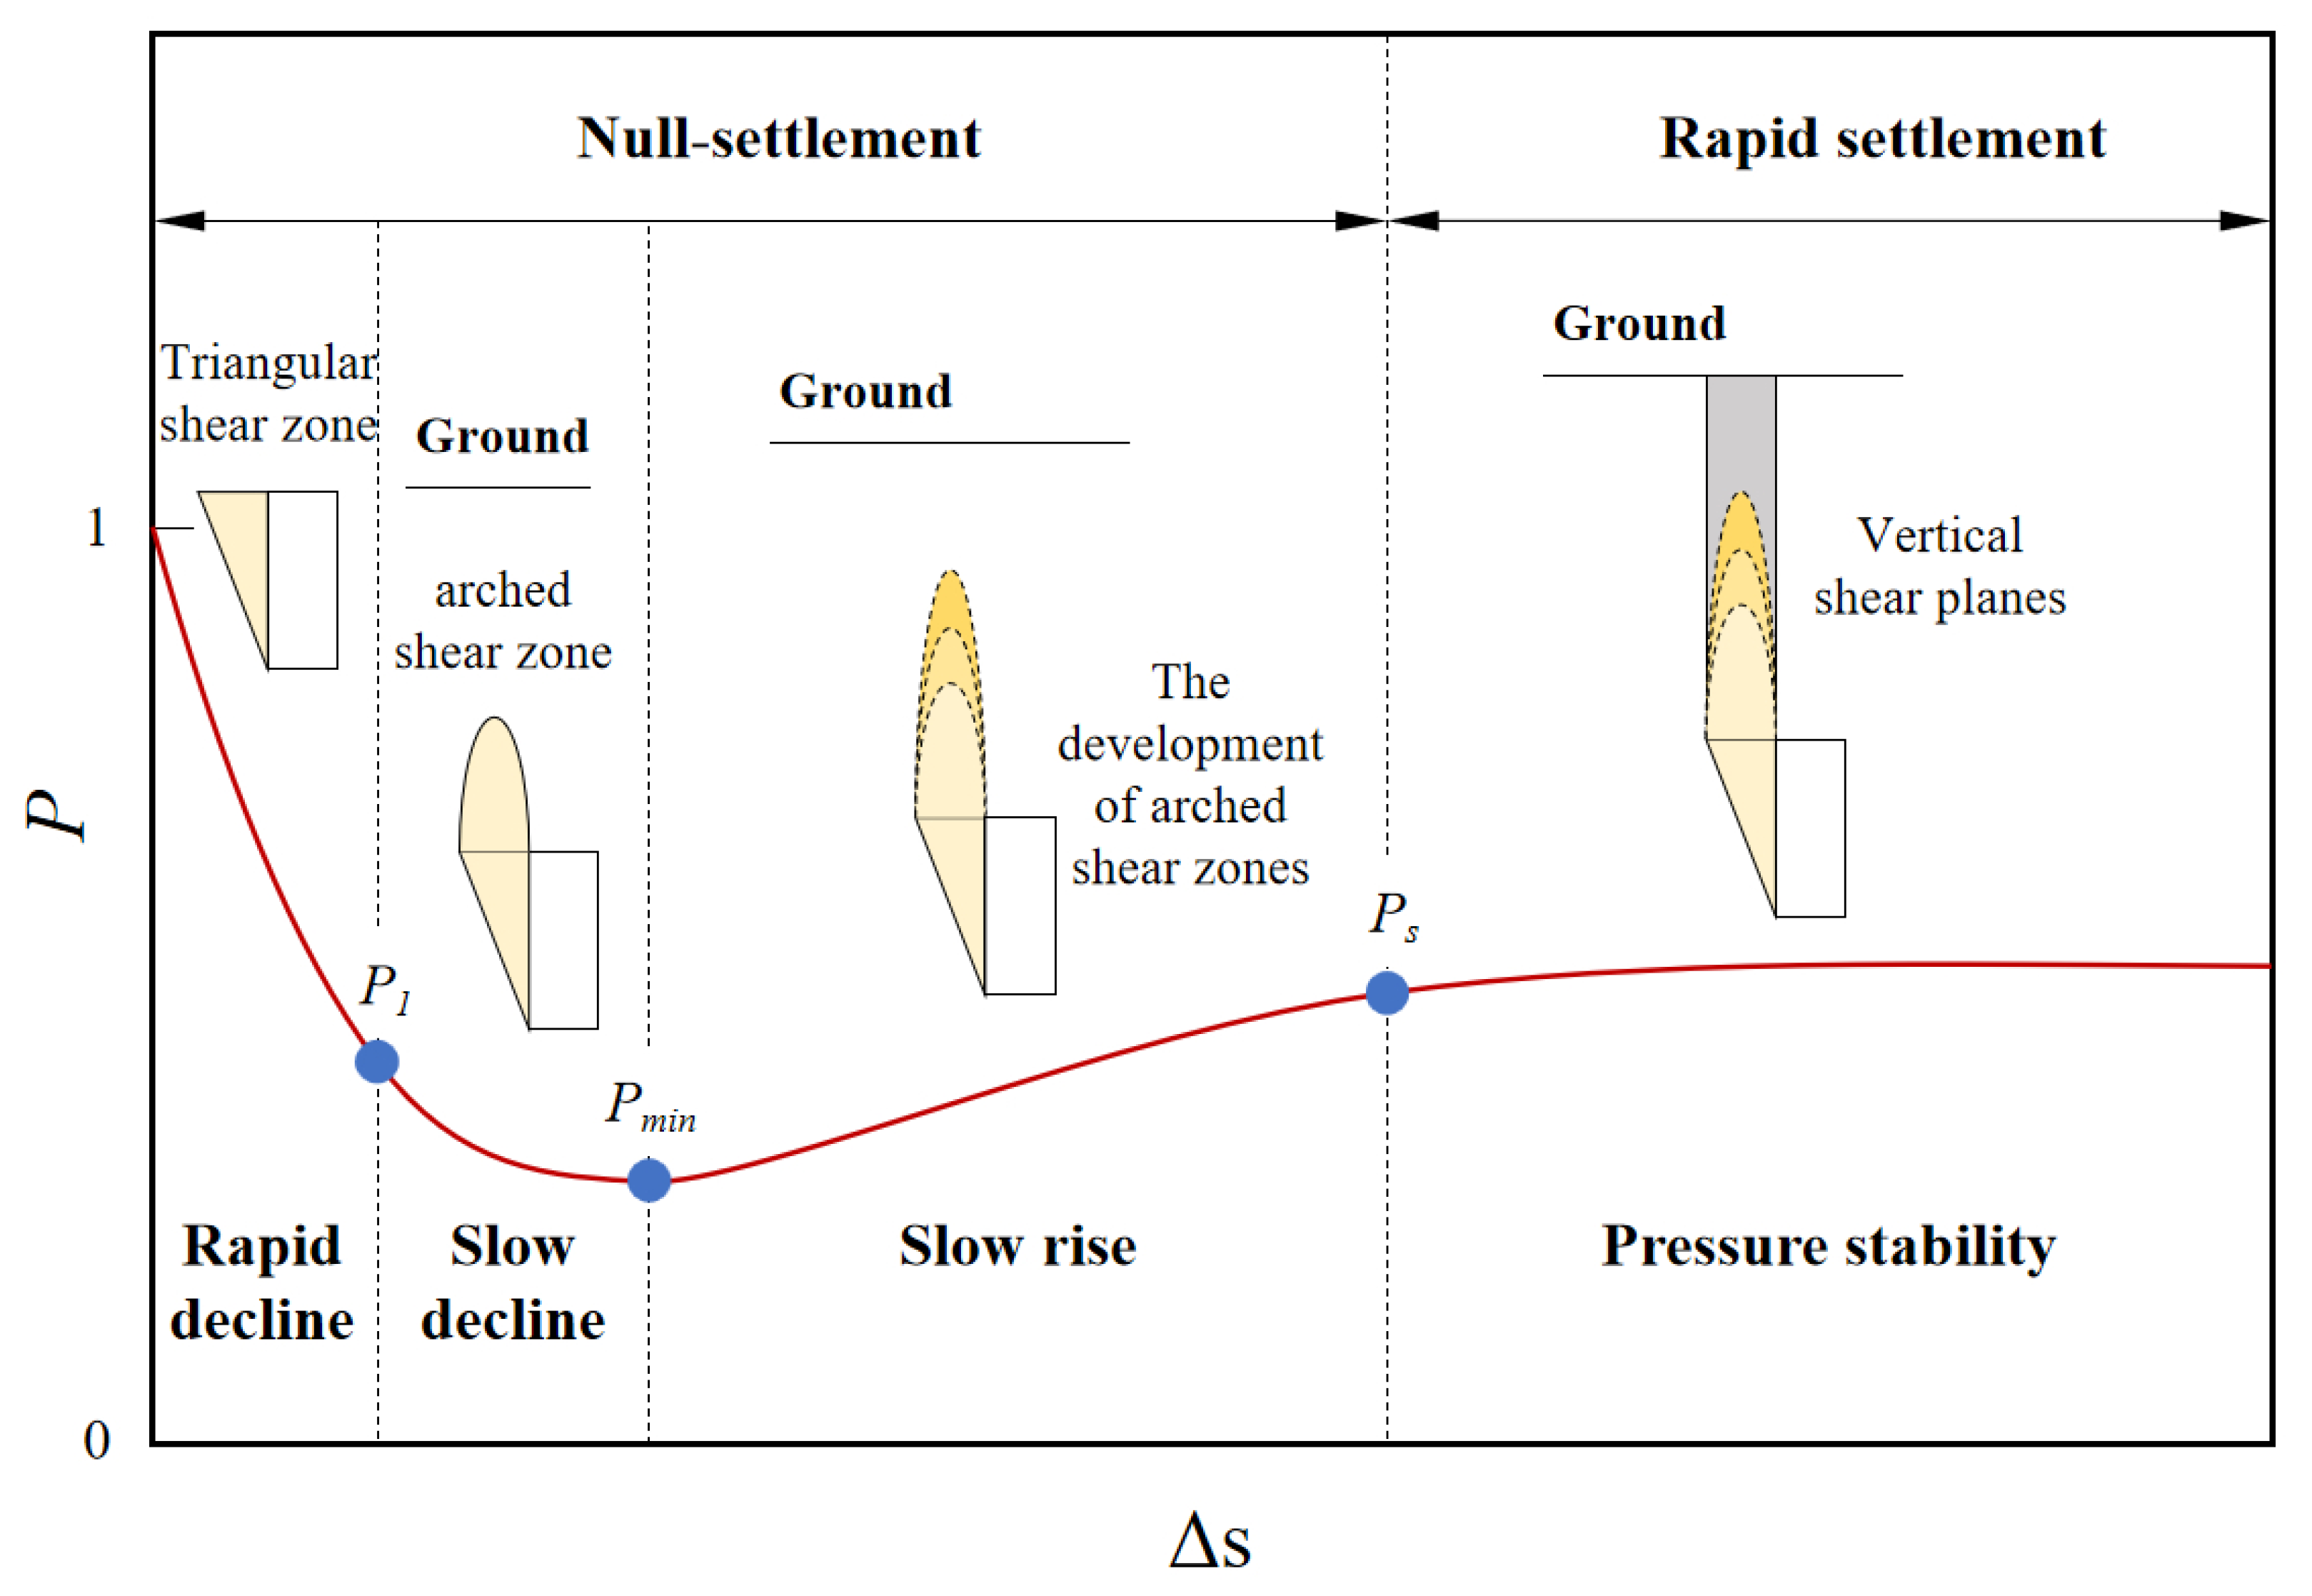
3.1. Support Pressure Variation Law

Figure 3 presents the normalized support pressure evolution curve characterized by two dimensionless parameters: relative displacement Δs (ratio of actual displacement to pipe height H) and support pressure ratio P (ratio of measured pressure to initial pressure). It can be found that as Δs increases, the variation law of P under different overburden ratios and densities is basically consistent, which can be divided into 4 stages:
(1)
Pressure rapid decline stage: Small relative displacement causes significant support pressure drop. This stage mainly involves soil elastic deformation and gradual mobilization of sand shear strength, with the support pressure reaching failure value P1.
(2)
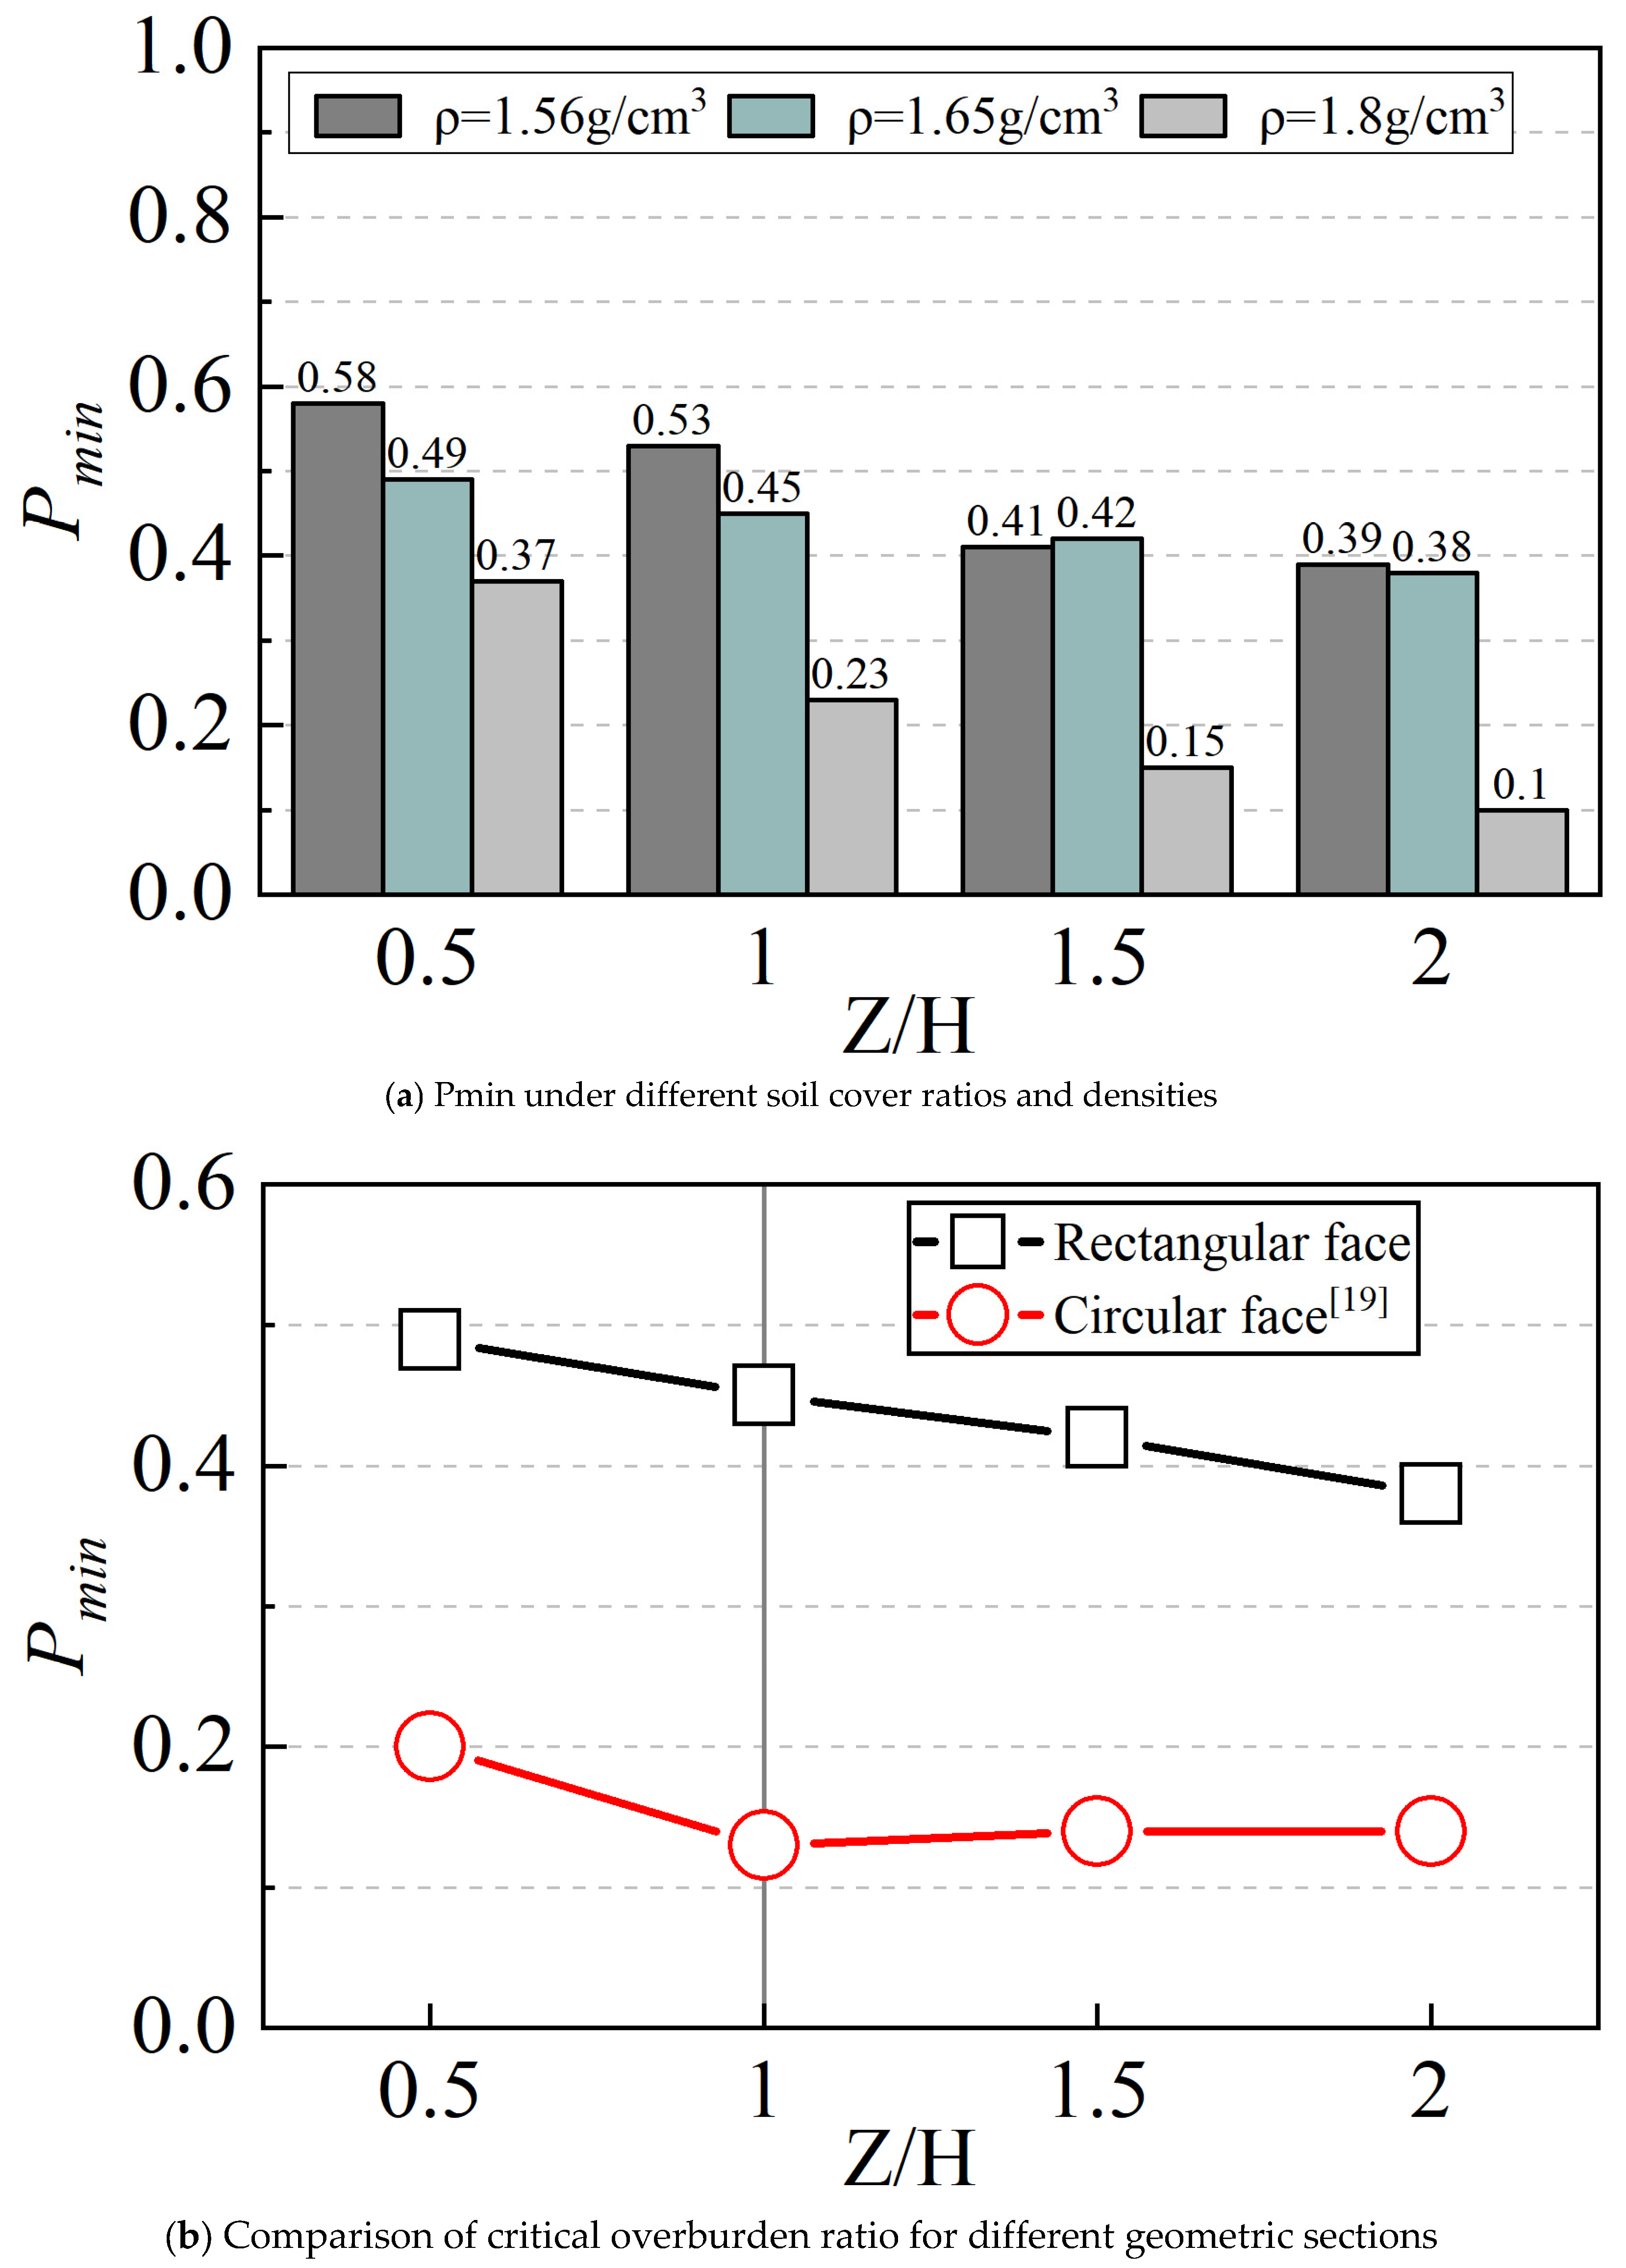
Pressure slow decline stage: Reduced pressure reduction rate. Mainly soil plastic deformation occurs, while soil arching effect develops. Upon reaching limit equilibrium state at certain displacement, the support pressure reaches minimum Pmin.
(3)
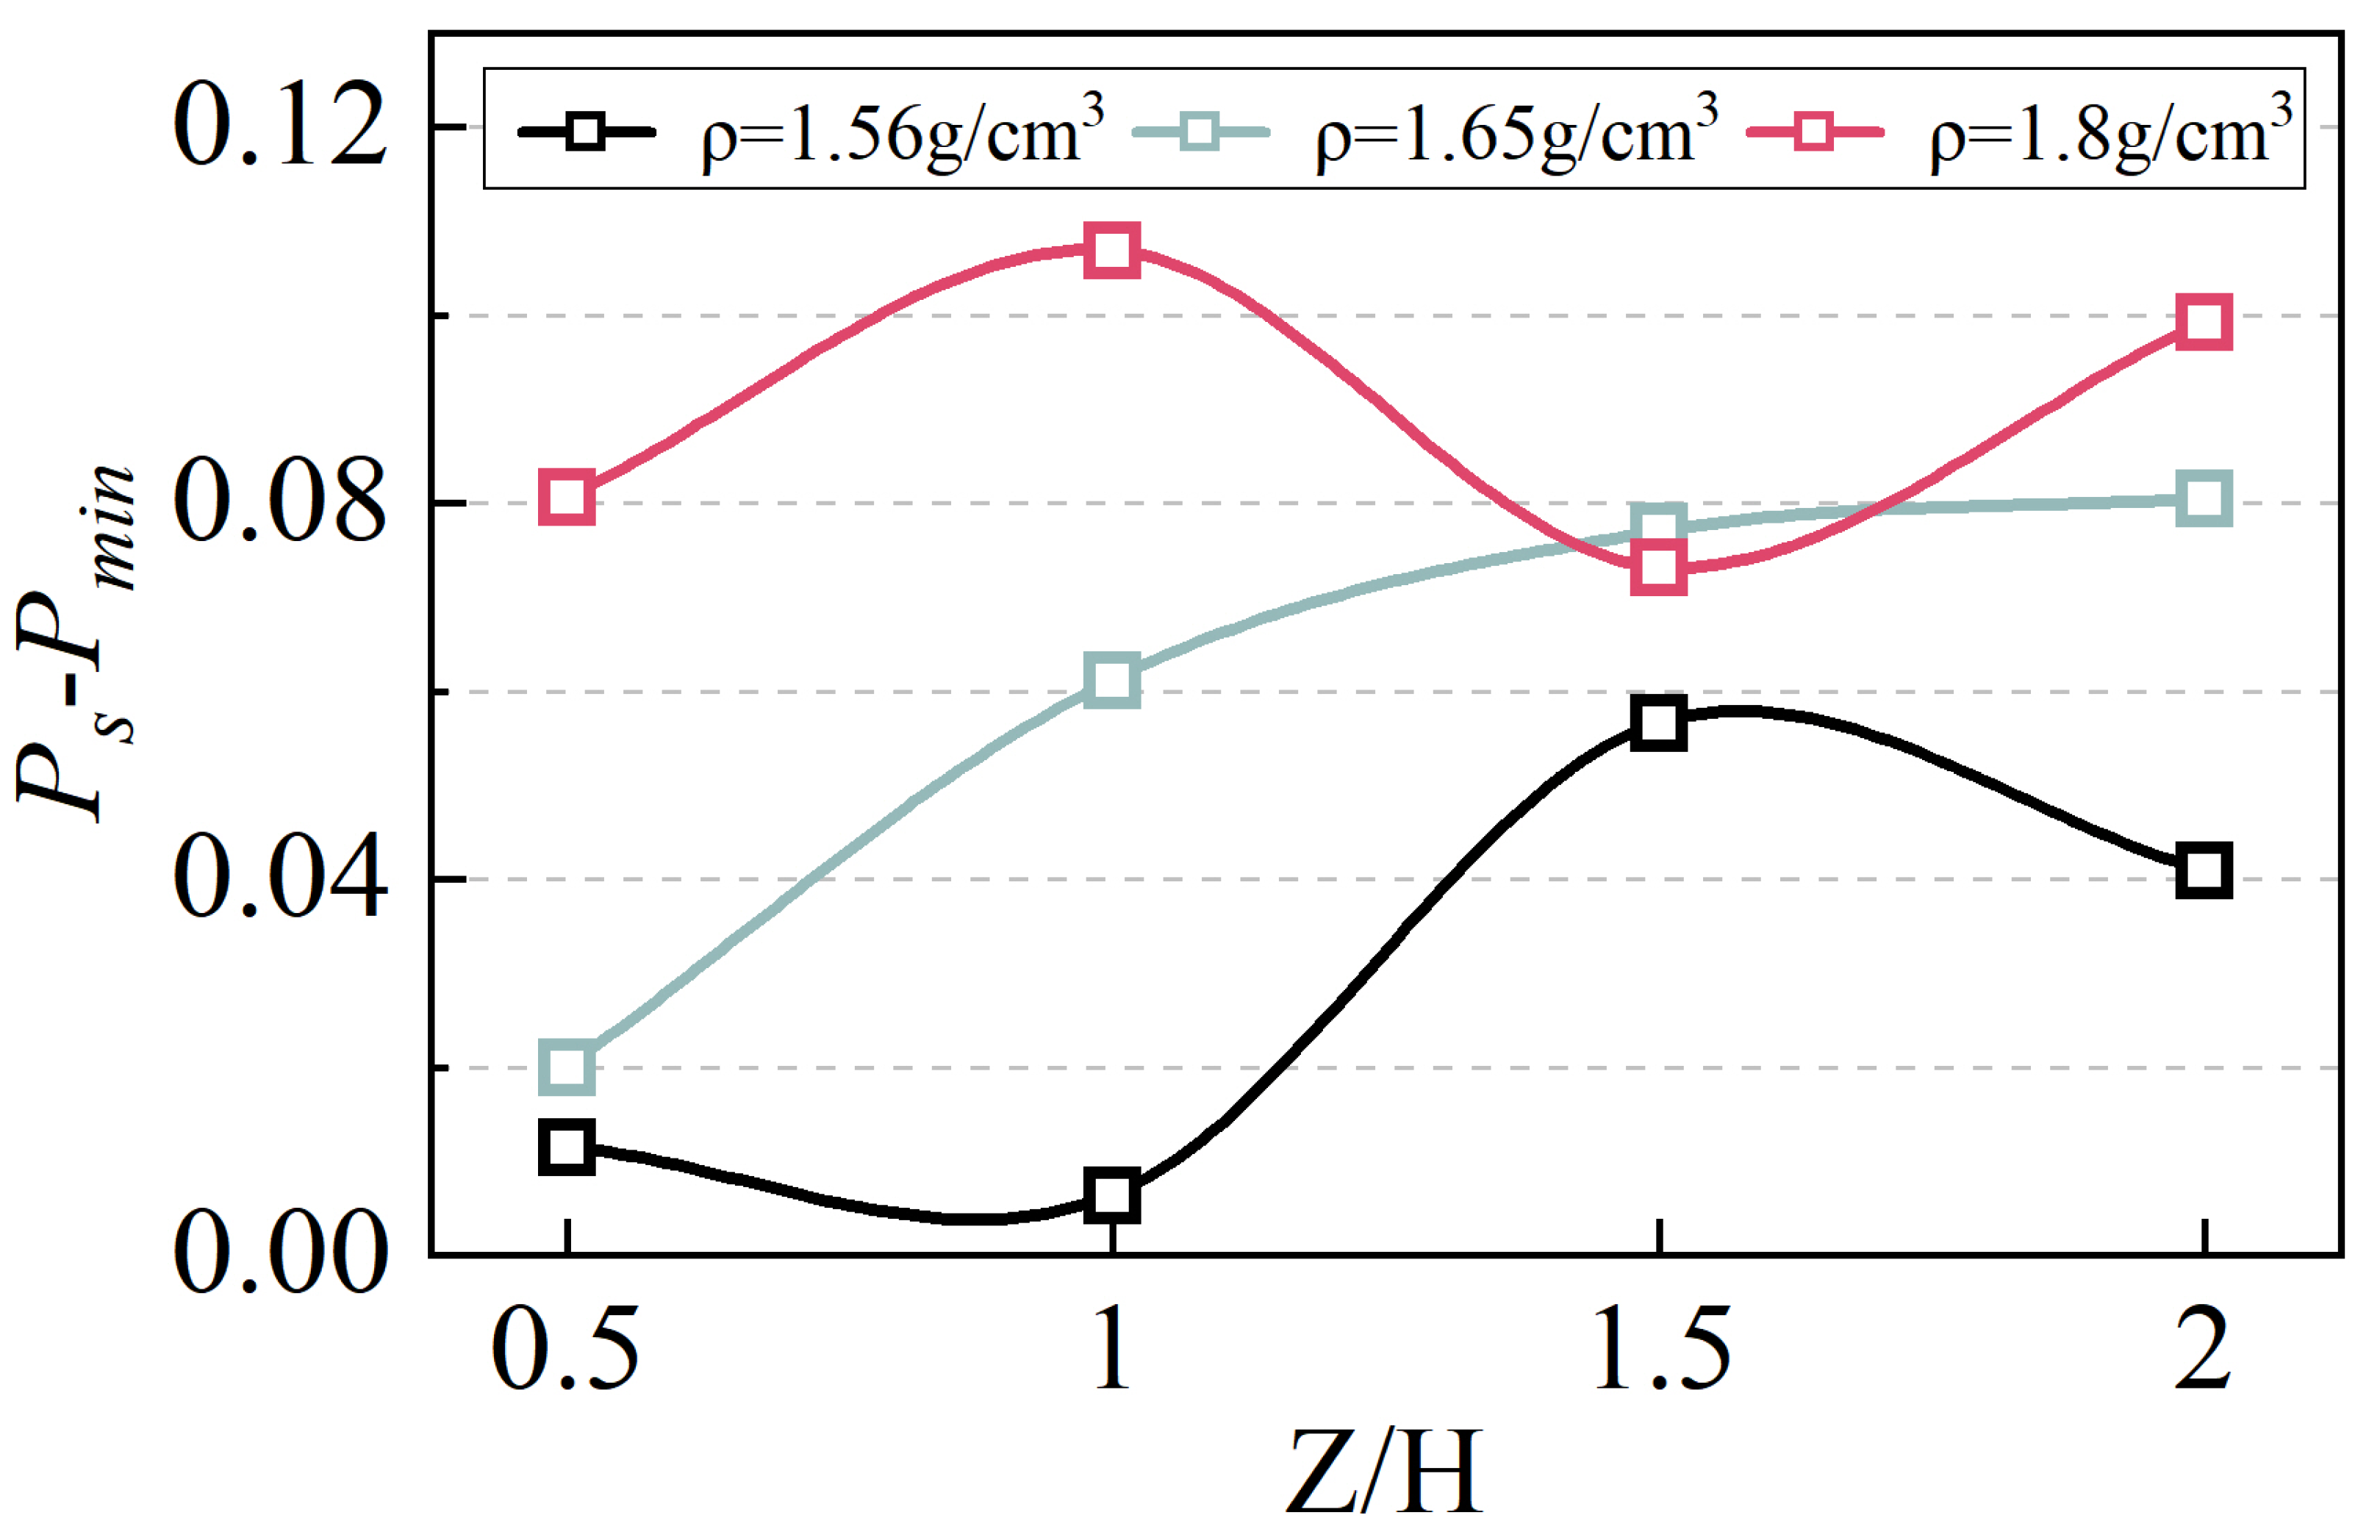
Pressure slow rise stage: Pressure shows gradual increase as displacement continues. Soil ahead reaches ultimate shear strength, arching effect diminishes, and local shear failure occurs.
(4)
Pressure stabilization stage: Support pressure stabilizes, remaining constant with displacement increase, while the support pressure reaches stable value Ps.
Figure 4a shows Pmin under different overburden ratios and densities. It can be found that higher density leads to tighter particle packing, stronger arching effects, and more pressure redistribution, resulting in lower Pmin. Among them, the support force can be reduced to 0.39–0.58 of the initial pressure in a loose state, 0.38–0.49 in a medium-dense state, and 0.1–0.37 in a dense state.
Notably, when overburden ratio < 1.5, Pmin decreases with depth increase. When >1.5, Pmin remains stable. This is because soil arching requires certain burial depth, that is, there is a critical overburden ratio. Circular face tests show critical ratio = 1 [18,19], indicating rectangular geometry’s reduced arching efficiency, requiring greater depth to develop equivalent stress redistribution.
The exertion of the soil arching effect requires a certain soil burial depth, that is, there exists a critical overburden ratio [18,19]. Chen et al. [19] carried out the circular excavation face model test. In this paper, the test results under the same density (1.65 g/cm3) are selected for comparison. As shown in Figure 4b, the critical ratio of the circular face test is 1 [19]. This rule is not obvious in this study, indicating that rectangular geometry′s reduced arching efficiency, requiring greater depth to develop equivalent stress redistribution.
The evolution of soil arching effects can be characterized by the critical support pressure parameters Pmin and Ps. When the support pressure decreases to Pmin, the soil arching mechanism reaches full activation but subsequently deteriorates until complete shear failure occurs at Ps. The pressure differential (Ps—Pmin) quantitatively represents the arching effect intensity. As shown in Figure 5, the difference between the two is positively correlated with the soil density and overburden ratio. As the density and burial depth increase, the soil arch bears more pressure. After the soil arch of the overlying soil fails and is completely sheared, the degree of rebound of the support force in the slow rise stage will be greater.
This mechanical behavior implies two distinct operational scenarios for rectangular pipe jacking projects:
In deep-buried, high-density soil conditions, minimal support pressure (approaching Pmin) suffices to maintain face stability through effective soil arching. The relatively large pressure margin (Ps—Pmin) provides substantial operational flexibility during the progressive failure process, enhancing excavation face control.
For shallow-buried, low-density soil environments, the narrow pressure margin (Ps—Pmin) creates critical stability conditions. In these cases, minor support pressure fluctuations may trigger immediate shear failure due to limited arching effect development.

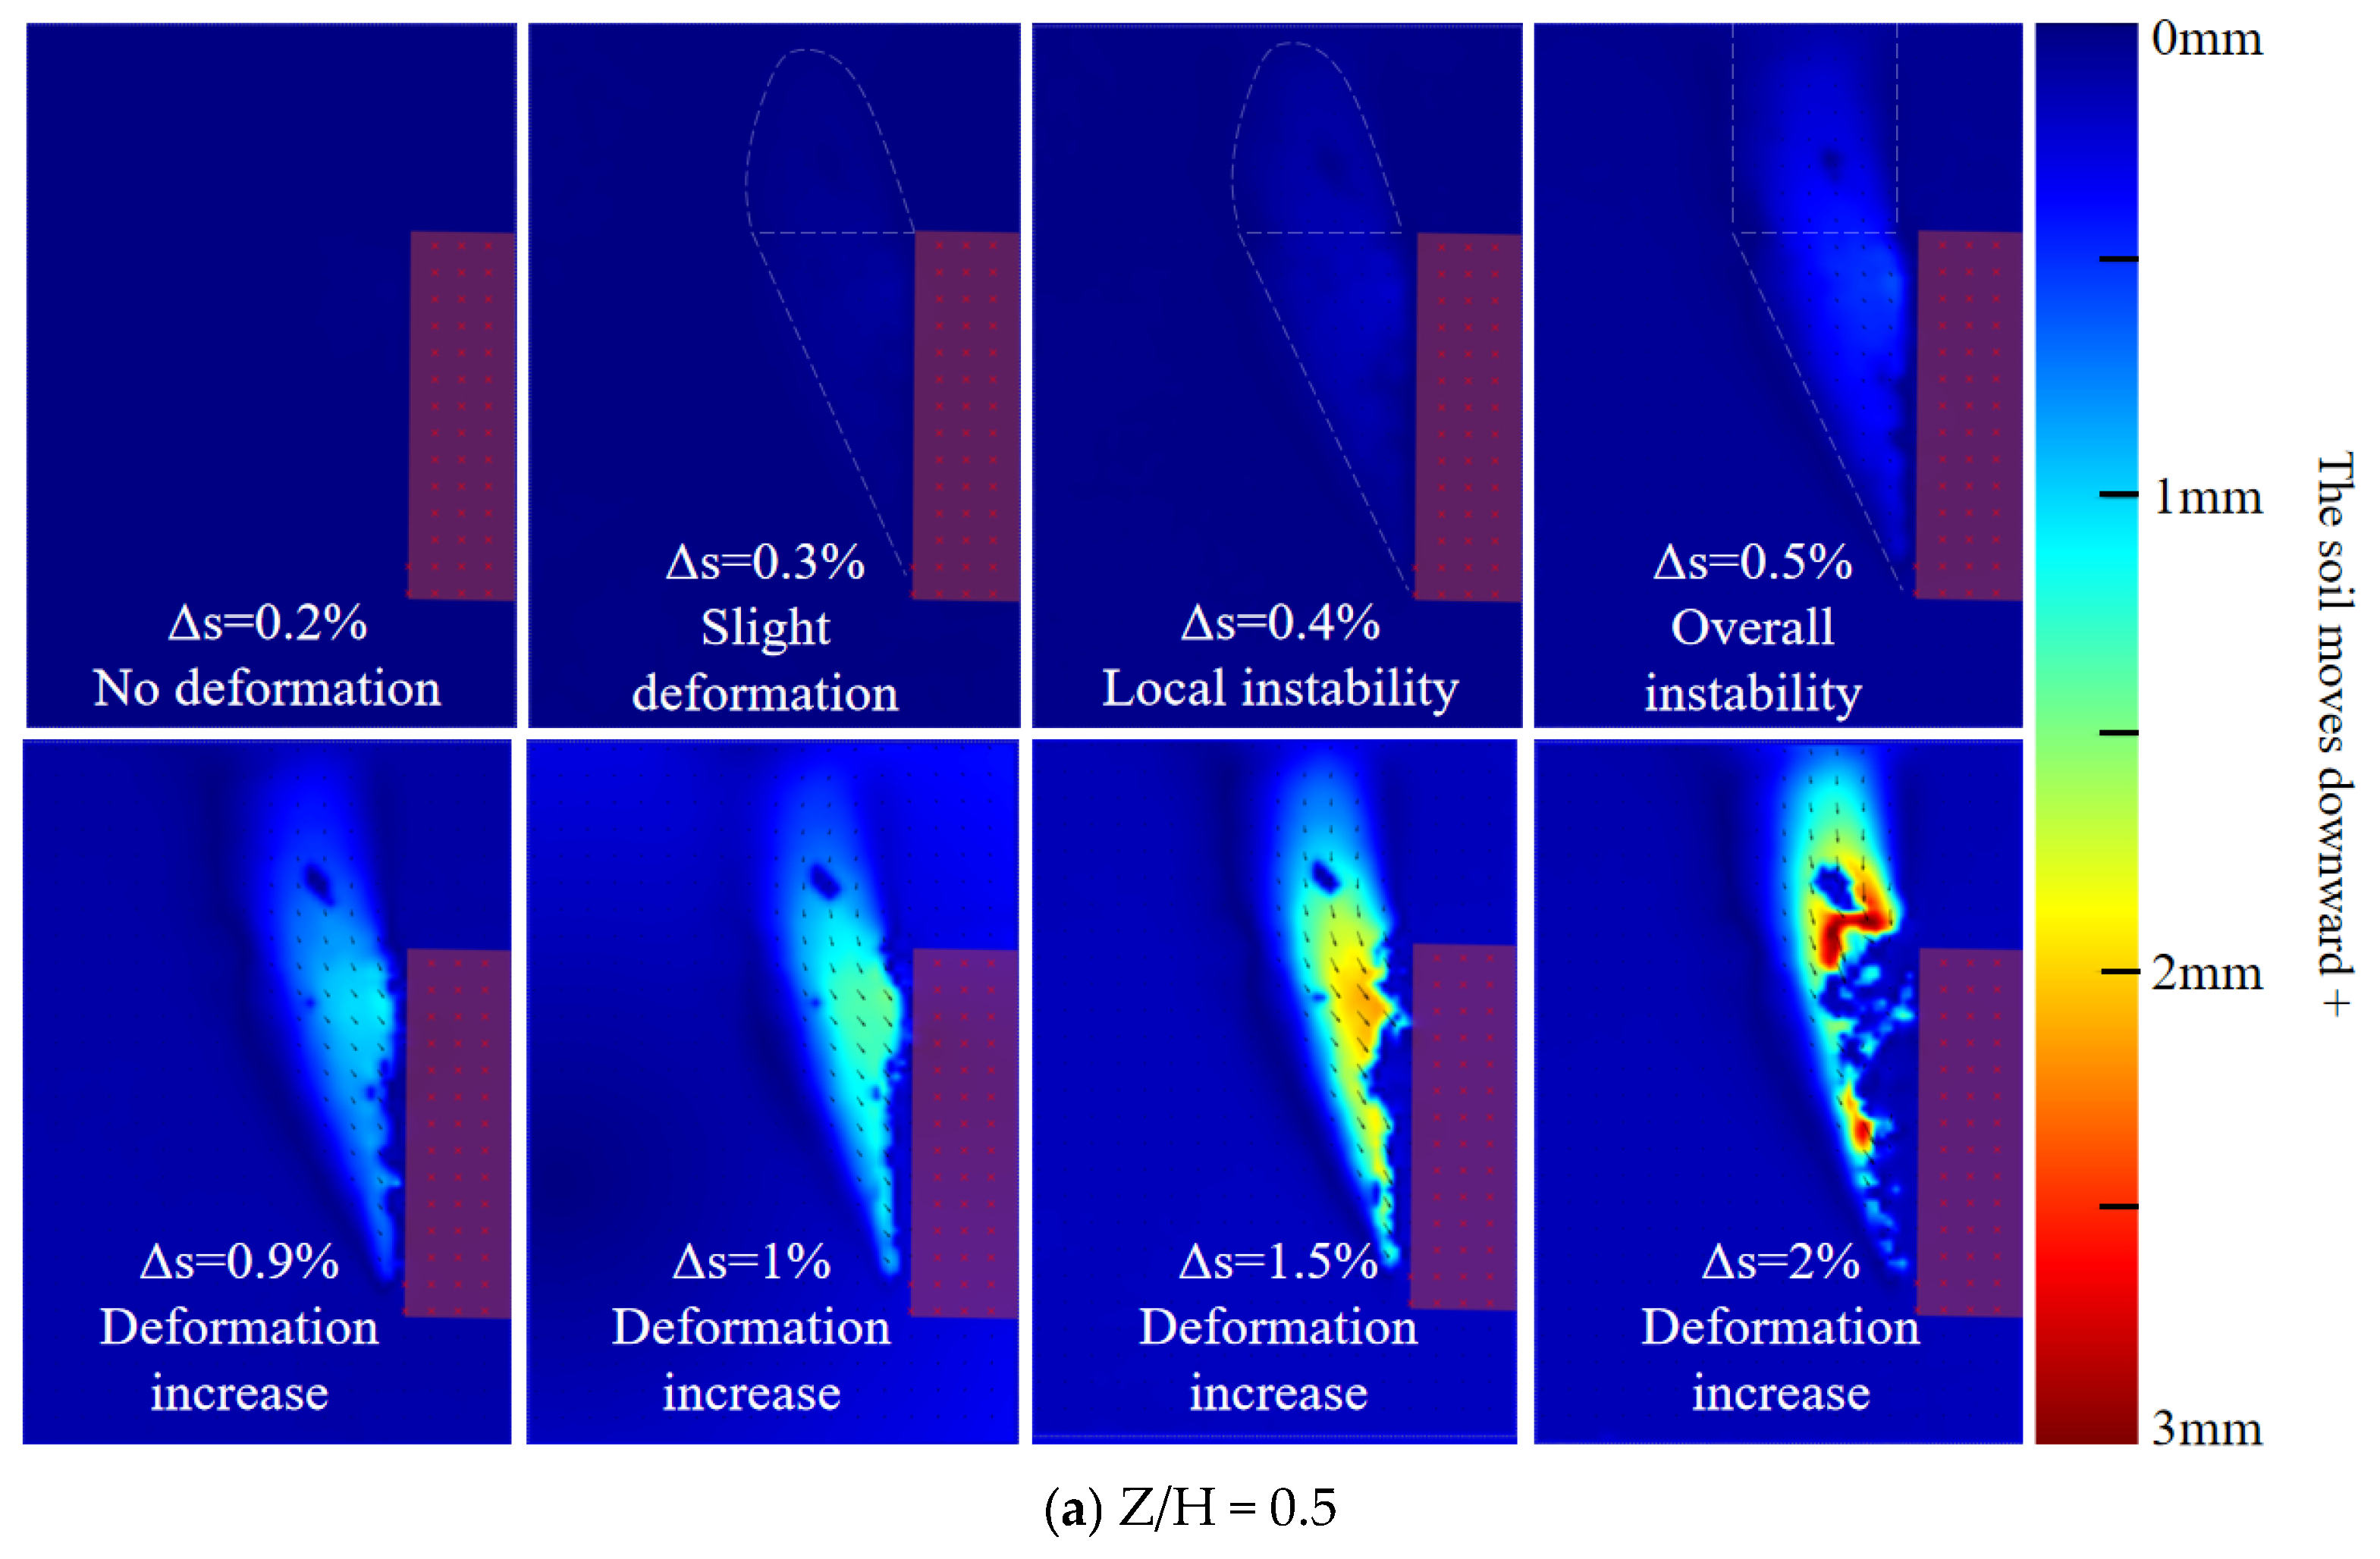
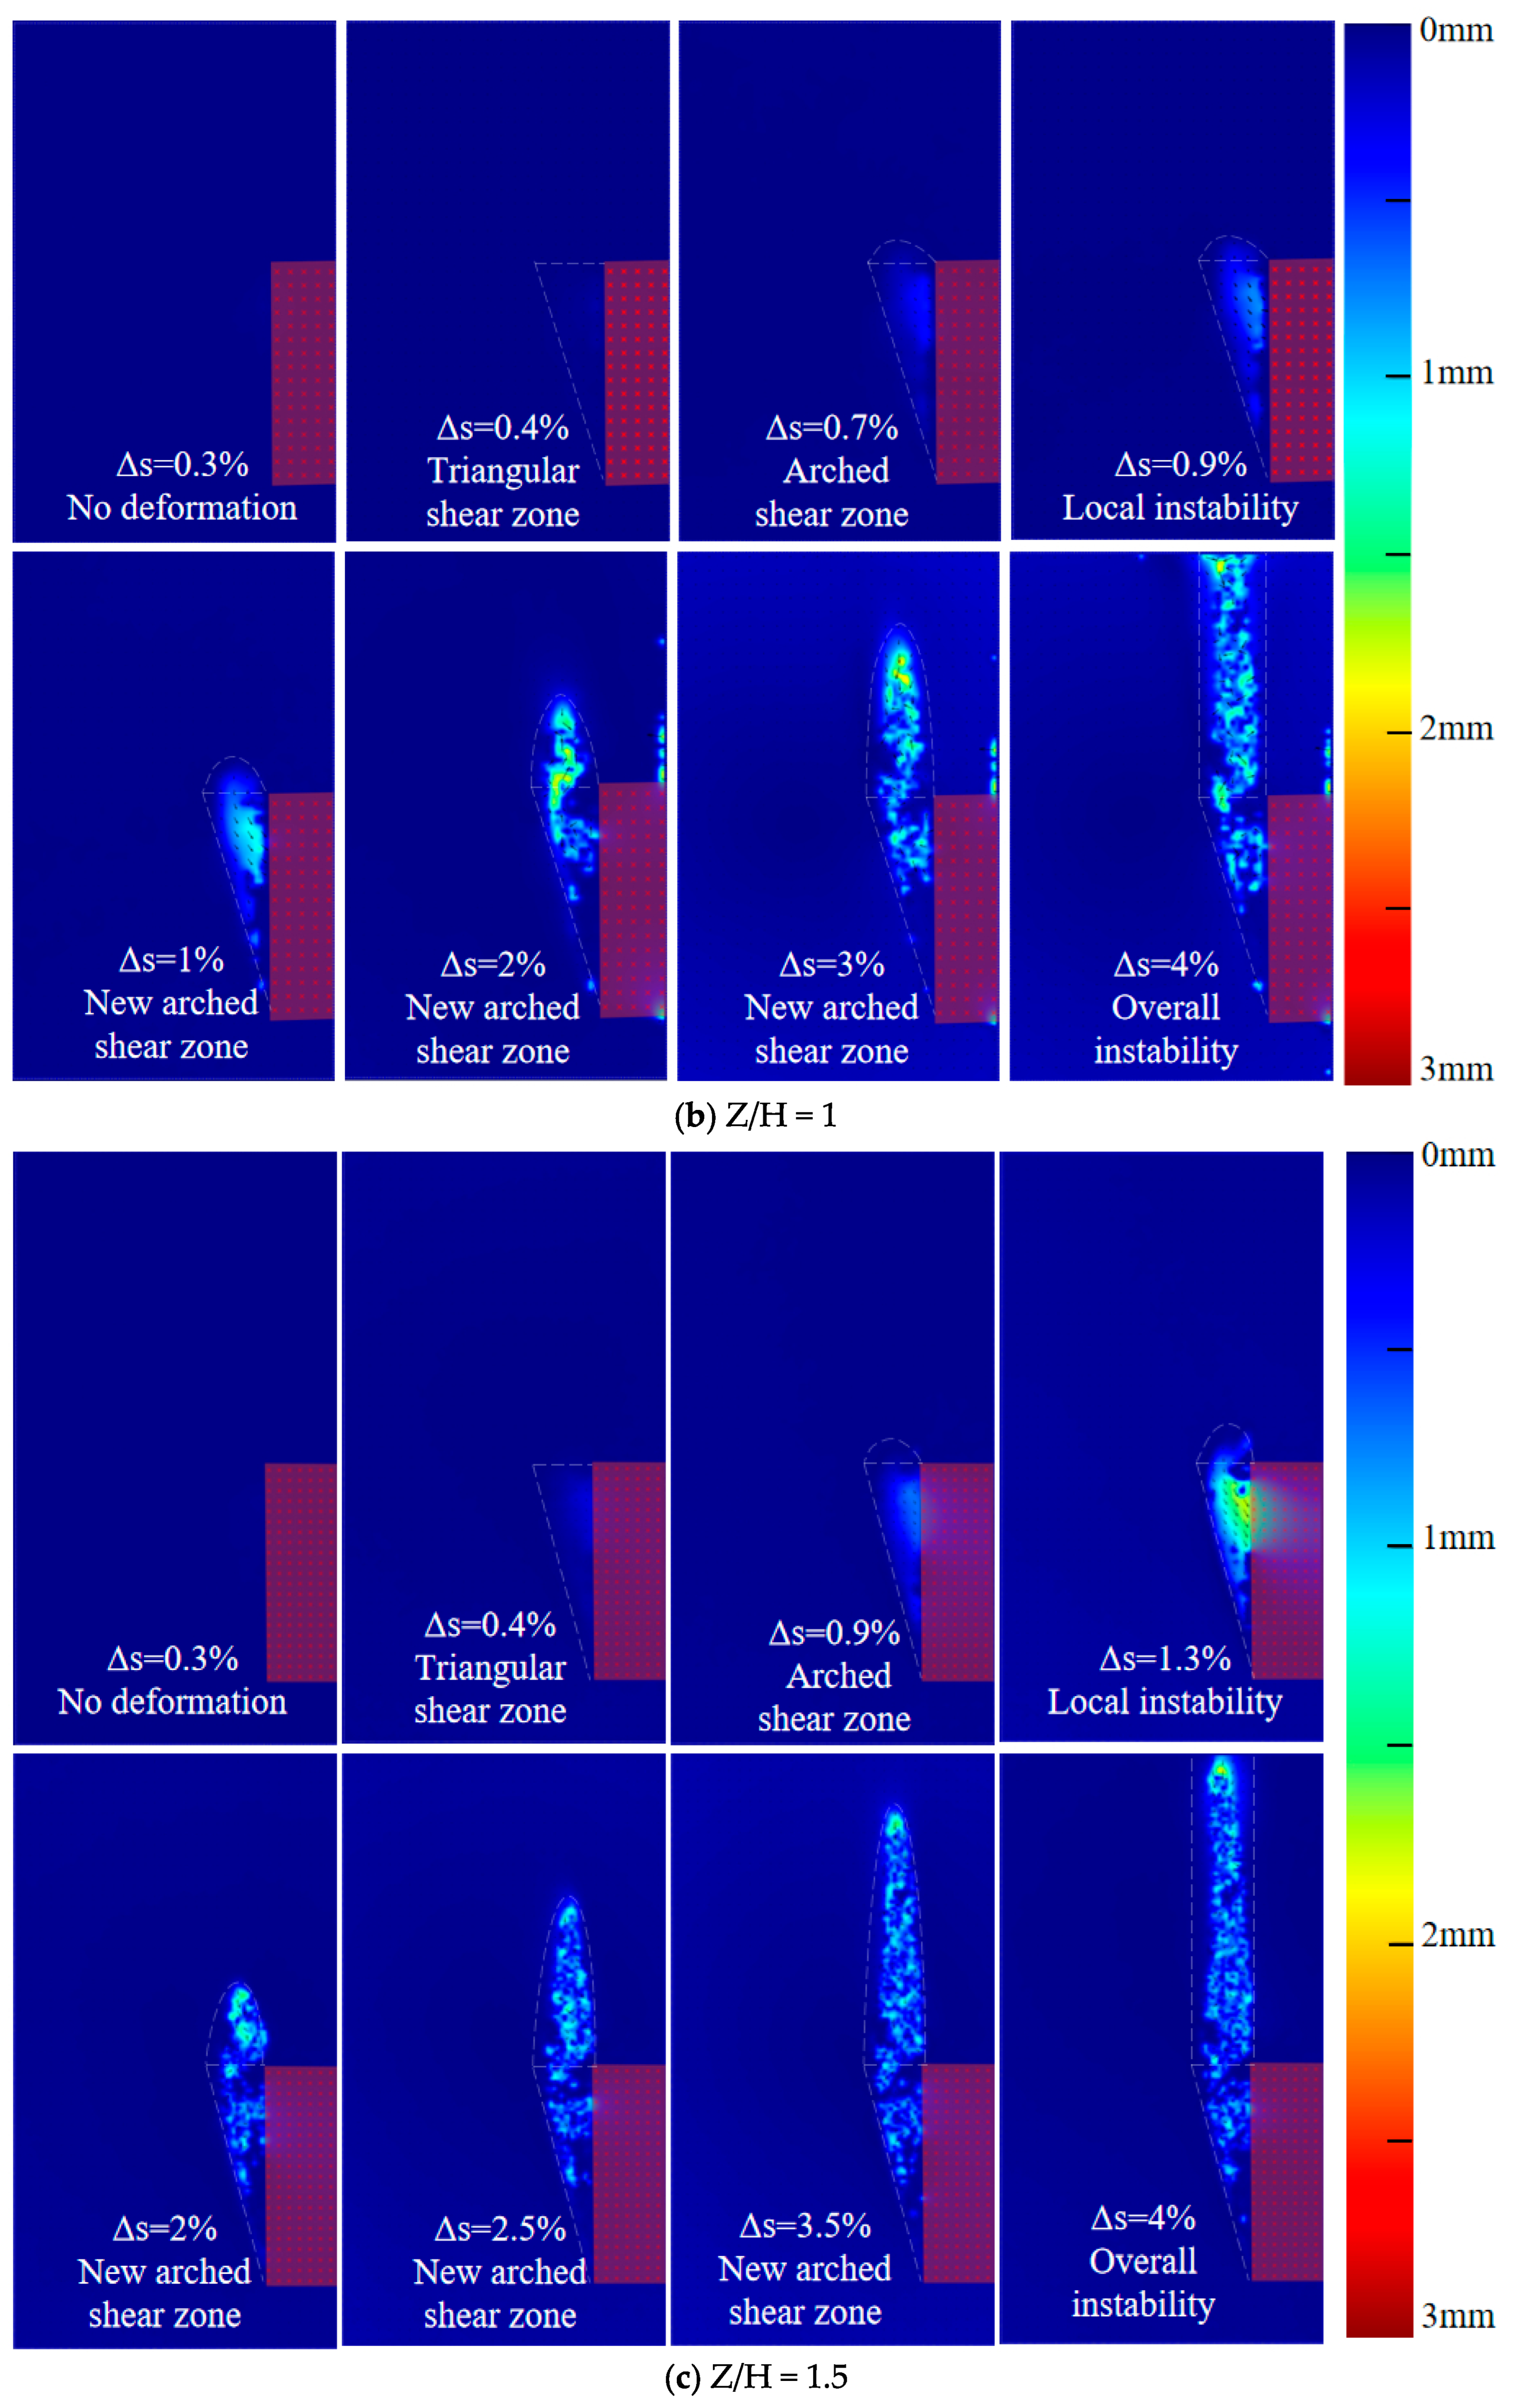
3.2. Deep Soil Deformation Process

Taking medium-dense soil as an example, Figure 6 illustrates the progressive instability mechanisms of soil mass under varying overburden ratios (Z/H) with increasing relative displacement (Δs).
As shown in Figure 6, all tested overburden conditions exhibited consistent evolutionary patterns, successively experiencing no deformation, slight deformation, local instability, and overall instability. The ultimate failure configuration comprised two distinct features: (1) triangular shear zones in front of the excavation face and (2) vertical shear planes extending to the ground.
As shown in Figure 6a, under the condition of Z/H = 0.5, when Δs = 0.2%, there is no deformation. When Δs = 0.3%, minor deformations occur and triangular + arched shear zones appear, which are the same as the shear band morphology in the circular excavation face test and numerical simulation [18,19,20]. When Δs = 0.4%, the soil in the arched shear zone is locally unstable. When Δs = 0.5%, the arched shear zone extends to the ground, forming a vertical shear zone, and the overall overlying soil on the excavation face becomes unstable. As the relative displacement continues to increase (Δs = 0.9%, 1%, 1.5%, 2%), the deformation of the soil in the shear zone also increases, but the range of the vertical shear zone no longer expands. It can be seen that even when the burial depth is relatively small, there is a weak soil arching effect. However, due to the fact that the full development of the soil arching effect requires a certain burial depth, its stability is relatively poor and it soon develops into a vertical shear zone.
As shown in Figure 6b, under the condition of Z/H = 1, there is no deformation when Δs = 0.3%. When Δs = 0.4%, slight deformation occurs, but only triangular shear bands appear. When Δs = 0.7%, the displacement of the triangular shear band further increases and an arched shear band appears. However, when Δs = 0.9%, the arched shear zone does not directly extend to the ground as Z/H = 0.5 but undergoes local instability and generates a loose failure zone. As the relative displacement continues to increase, the original soil arch is damaged when Δs = 1%, 2%, and 3%, forming a new arched shear zone. It does not extend to the ground until Δs = 4%, forming a vertical shear zone. As shown in Figure 6c,d, the instability process under the conditions of Z/H = 1.5, 2, and 3 is similar to that of Z/H = 1, with only the difference in the relative displacement Δs. Meanwhile, during the instability process, the angle between the triangular shear zone and the horizontal line (i.e., the failure angle) remains basically unchanged, indicating that the failure angle under the same overburden ratio and density is independent of the relative displacement.
Figure 6 demonstrates the progressive evolution of shear bands in overlying soils during excavation face instability, transitioning from an arch-shaped pattern to vertical alignment. This development mechanism parallels observations from trapdoor tests [21,22]. Notably, the triangular shear zone ahead of the excavation face governs the width of the “trapdoor” mechanism through its slippage extent. Experimental results in Figure 7 reveal consistent failure angles under varying overburden ratios with equivalent densities, indicating the independence of triangular shear zone slippage from burial depth. Conversely, maintaining constant overburden ratio while increasing soil density results in progressive enlargement of failure angles and corresponding reduction in shear zone slippage.
Figure 8 illustrates that rectangular excavation faces exhibit failure angles approaching 2φ, significantly exceeding the theoretical value of 45° + φ/2. This discrepancy amplifies with increasing soil density. Under static conditions ahead of the excavation face, principal stress orientations align vertically (major) and horizontally (minor). According to Rankine′s earth pressure theory and Mohr–Coulomb failure criterion, the theoretical failure plane forms at 45° + φ/2 relative to the minor principal stress, a convention typically adopted for circular excavations. However, non-uniform deformation within the triangular shear zone (characterized by inner expansion and outer contraction) induces inter-particle relative displacements, causing principal stress rotation [23]. The inferior arching capacity of rectangular boundaries compared to circular profiles exacerbates minor principal stress reorientation, consequently generating larger failure angles. Zhu et al. [24] analytically established minimum failure angles exceeding 72° when neglecting seepage and cohesion effects. Through numerical optimization of support force minimization and failure angle inversion, Hu et al. [25] corroborated the independence of failure angles from overburden ratios, while demonstrating their positive correlation with internal friction angle and consistent magnitudes above 70°.

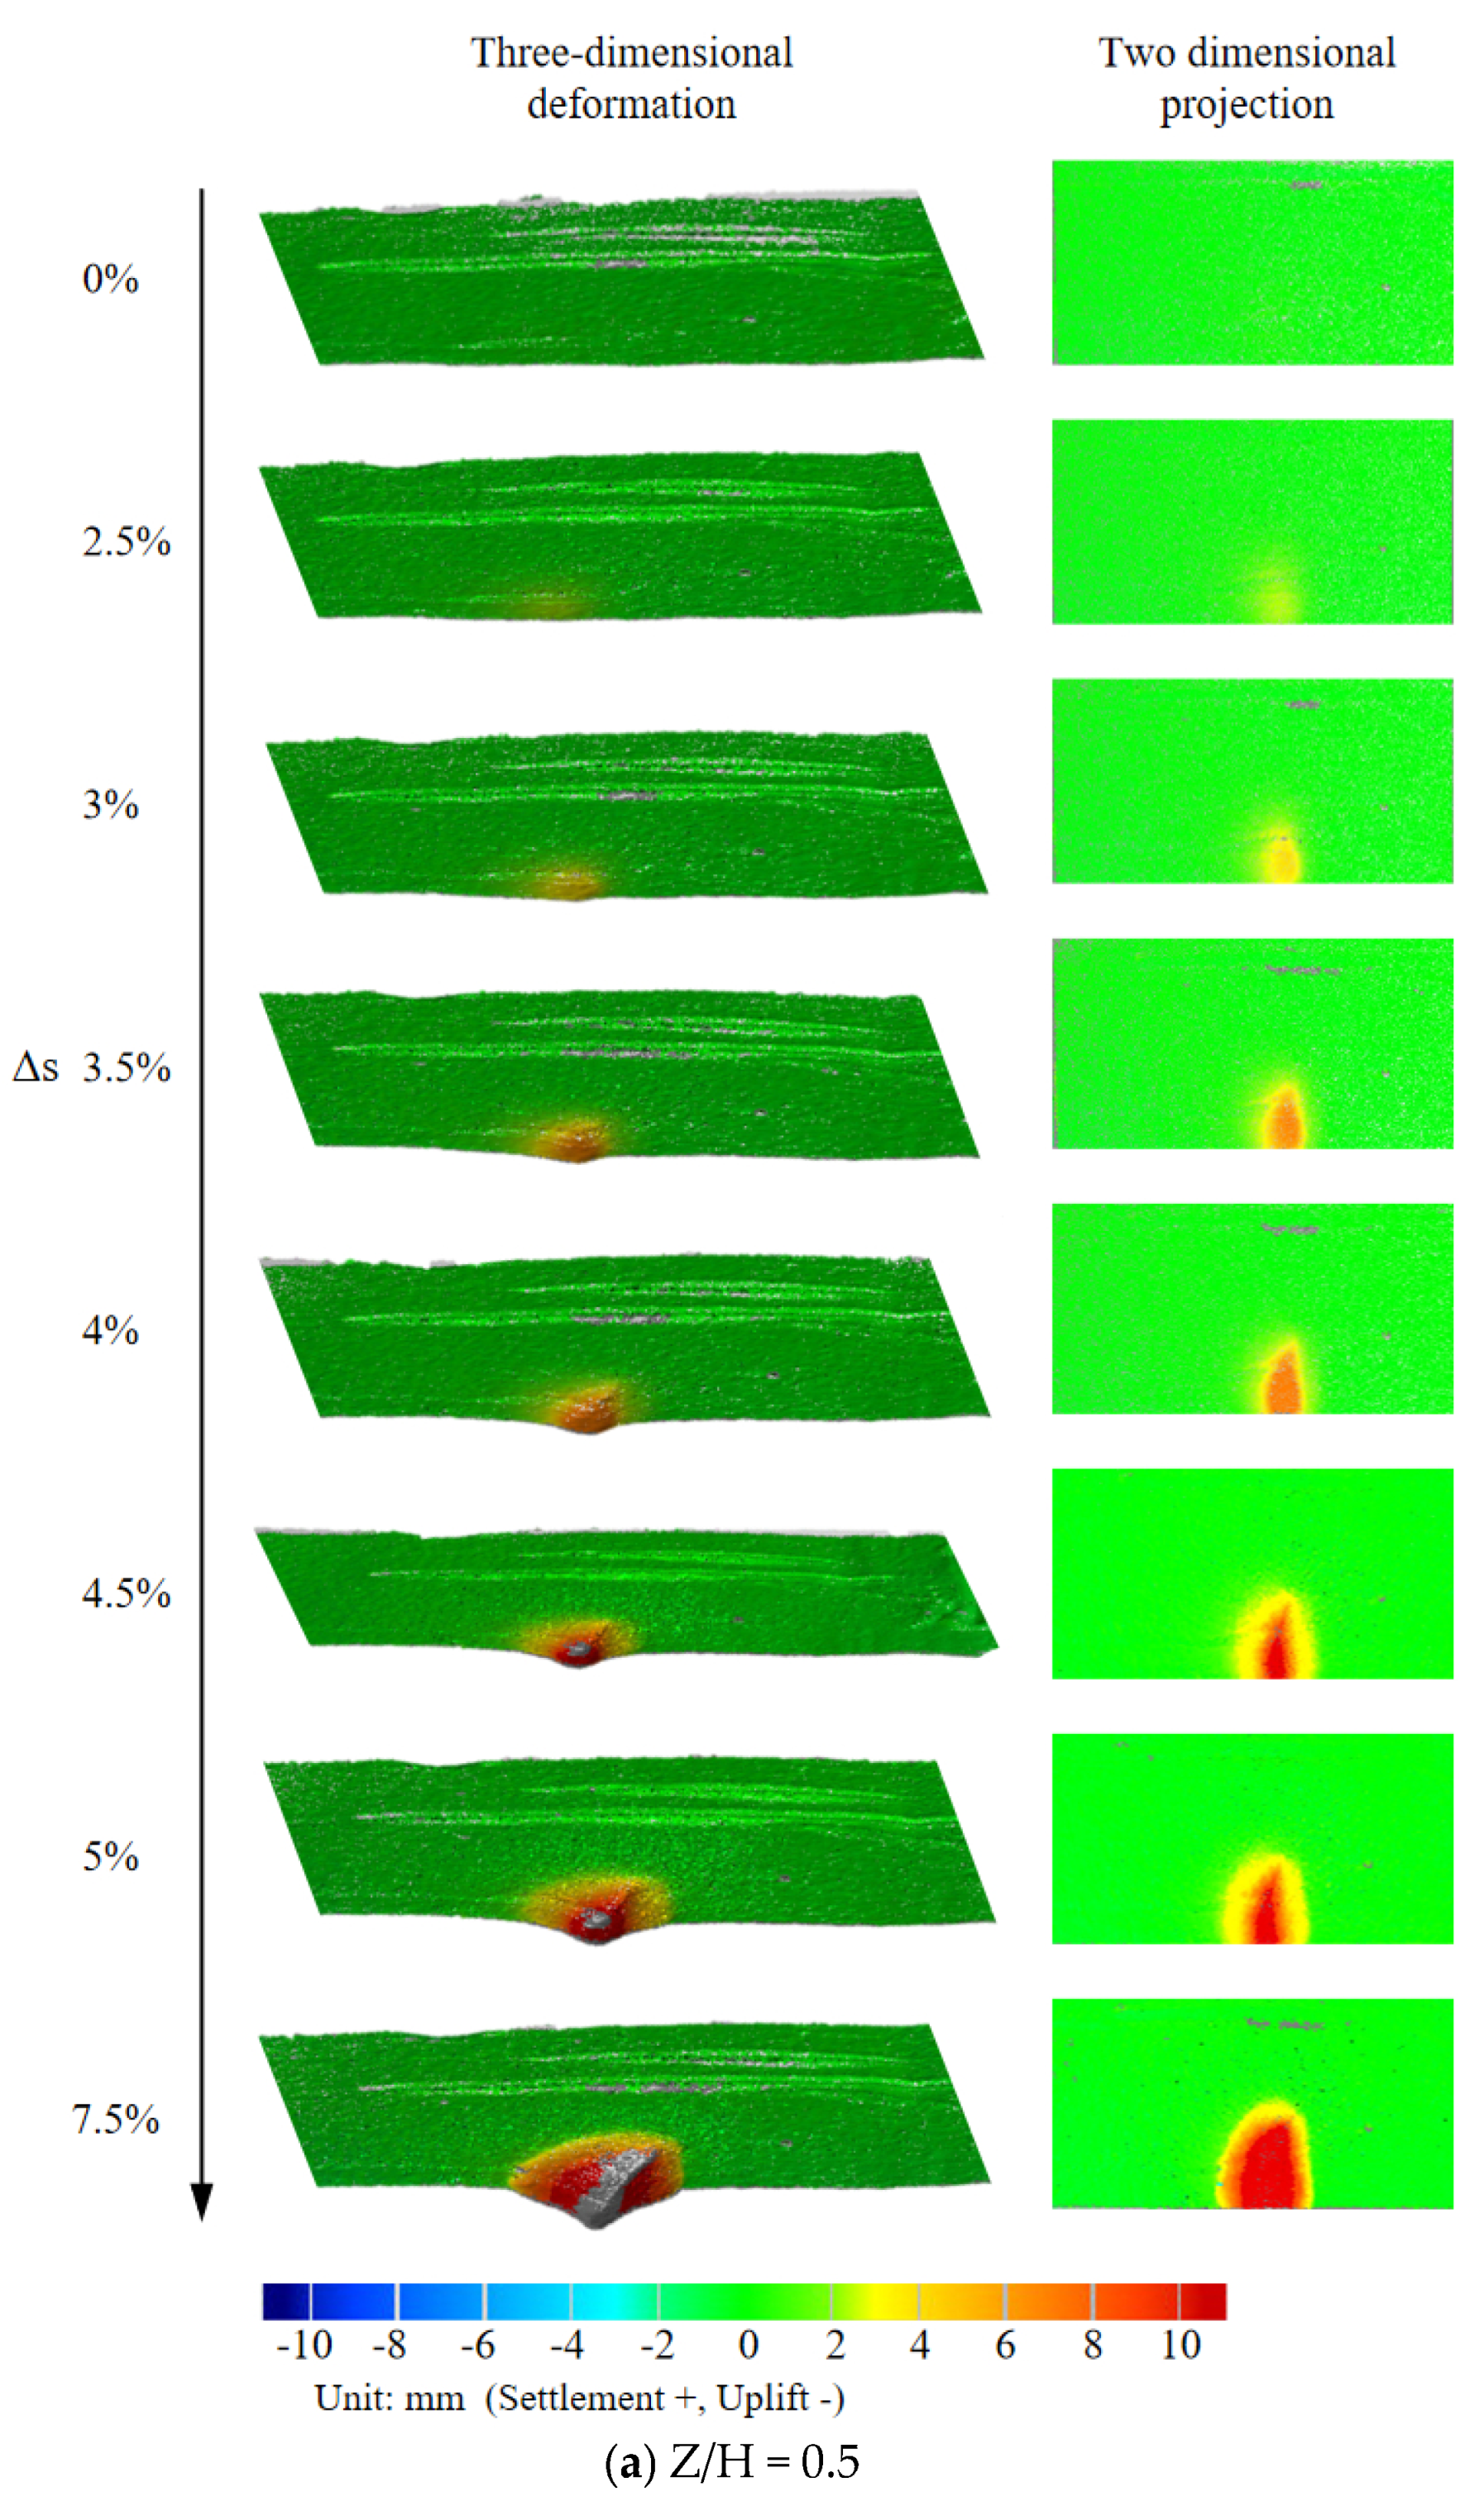
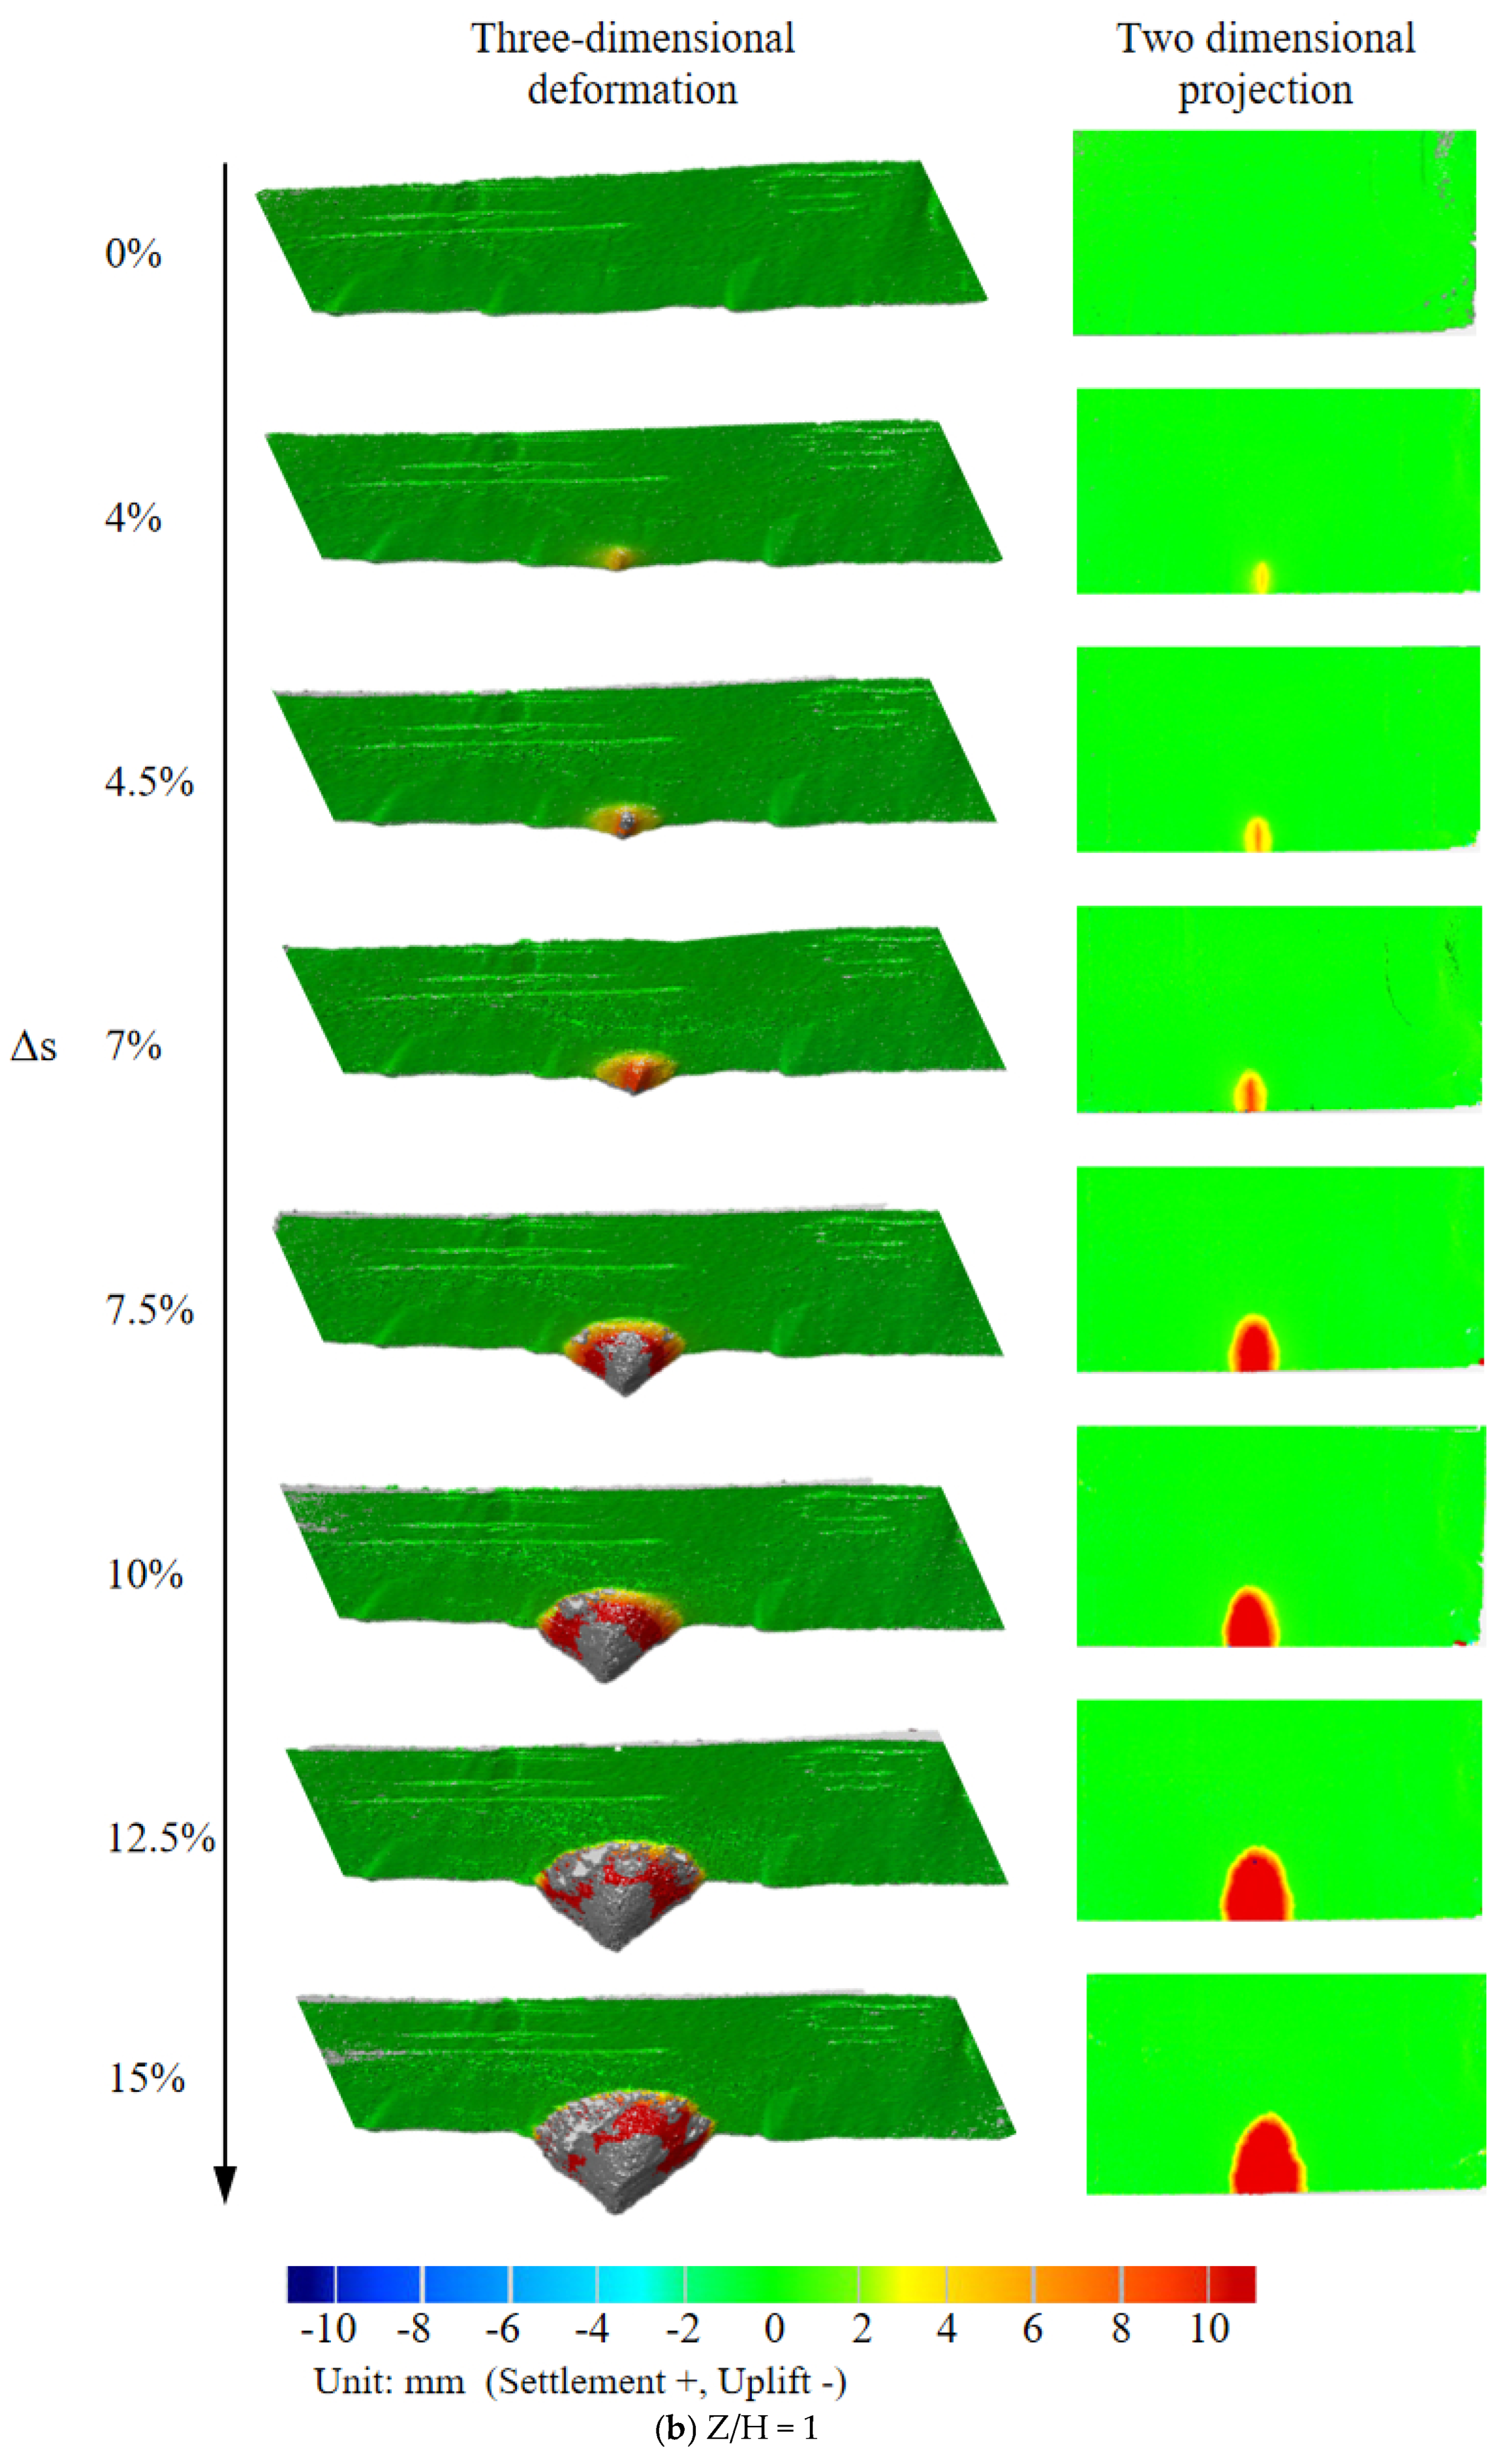
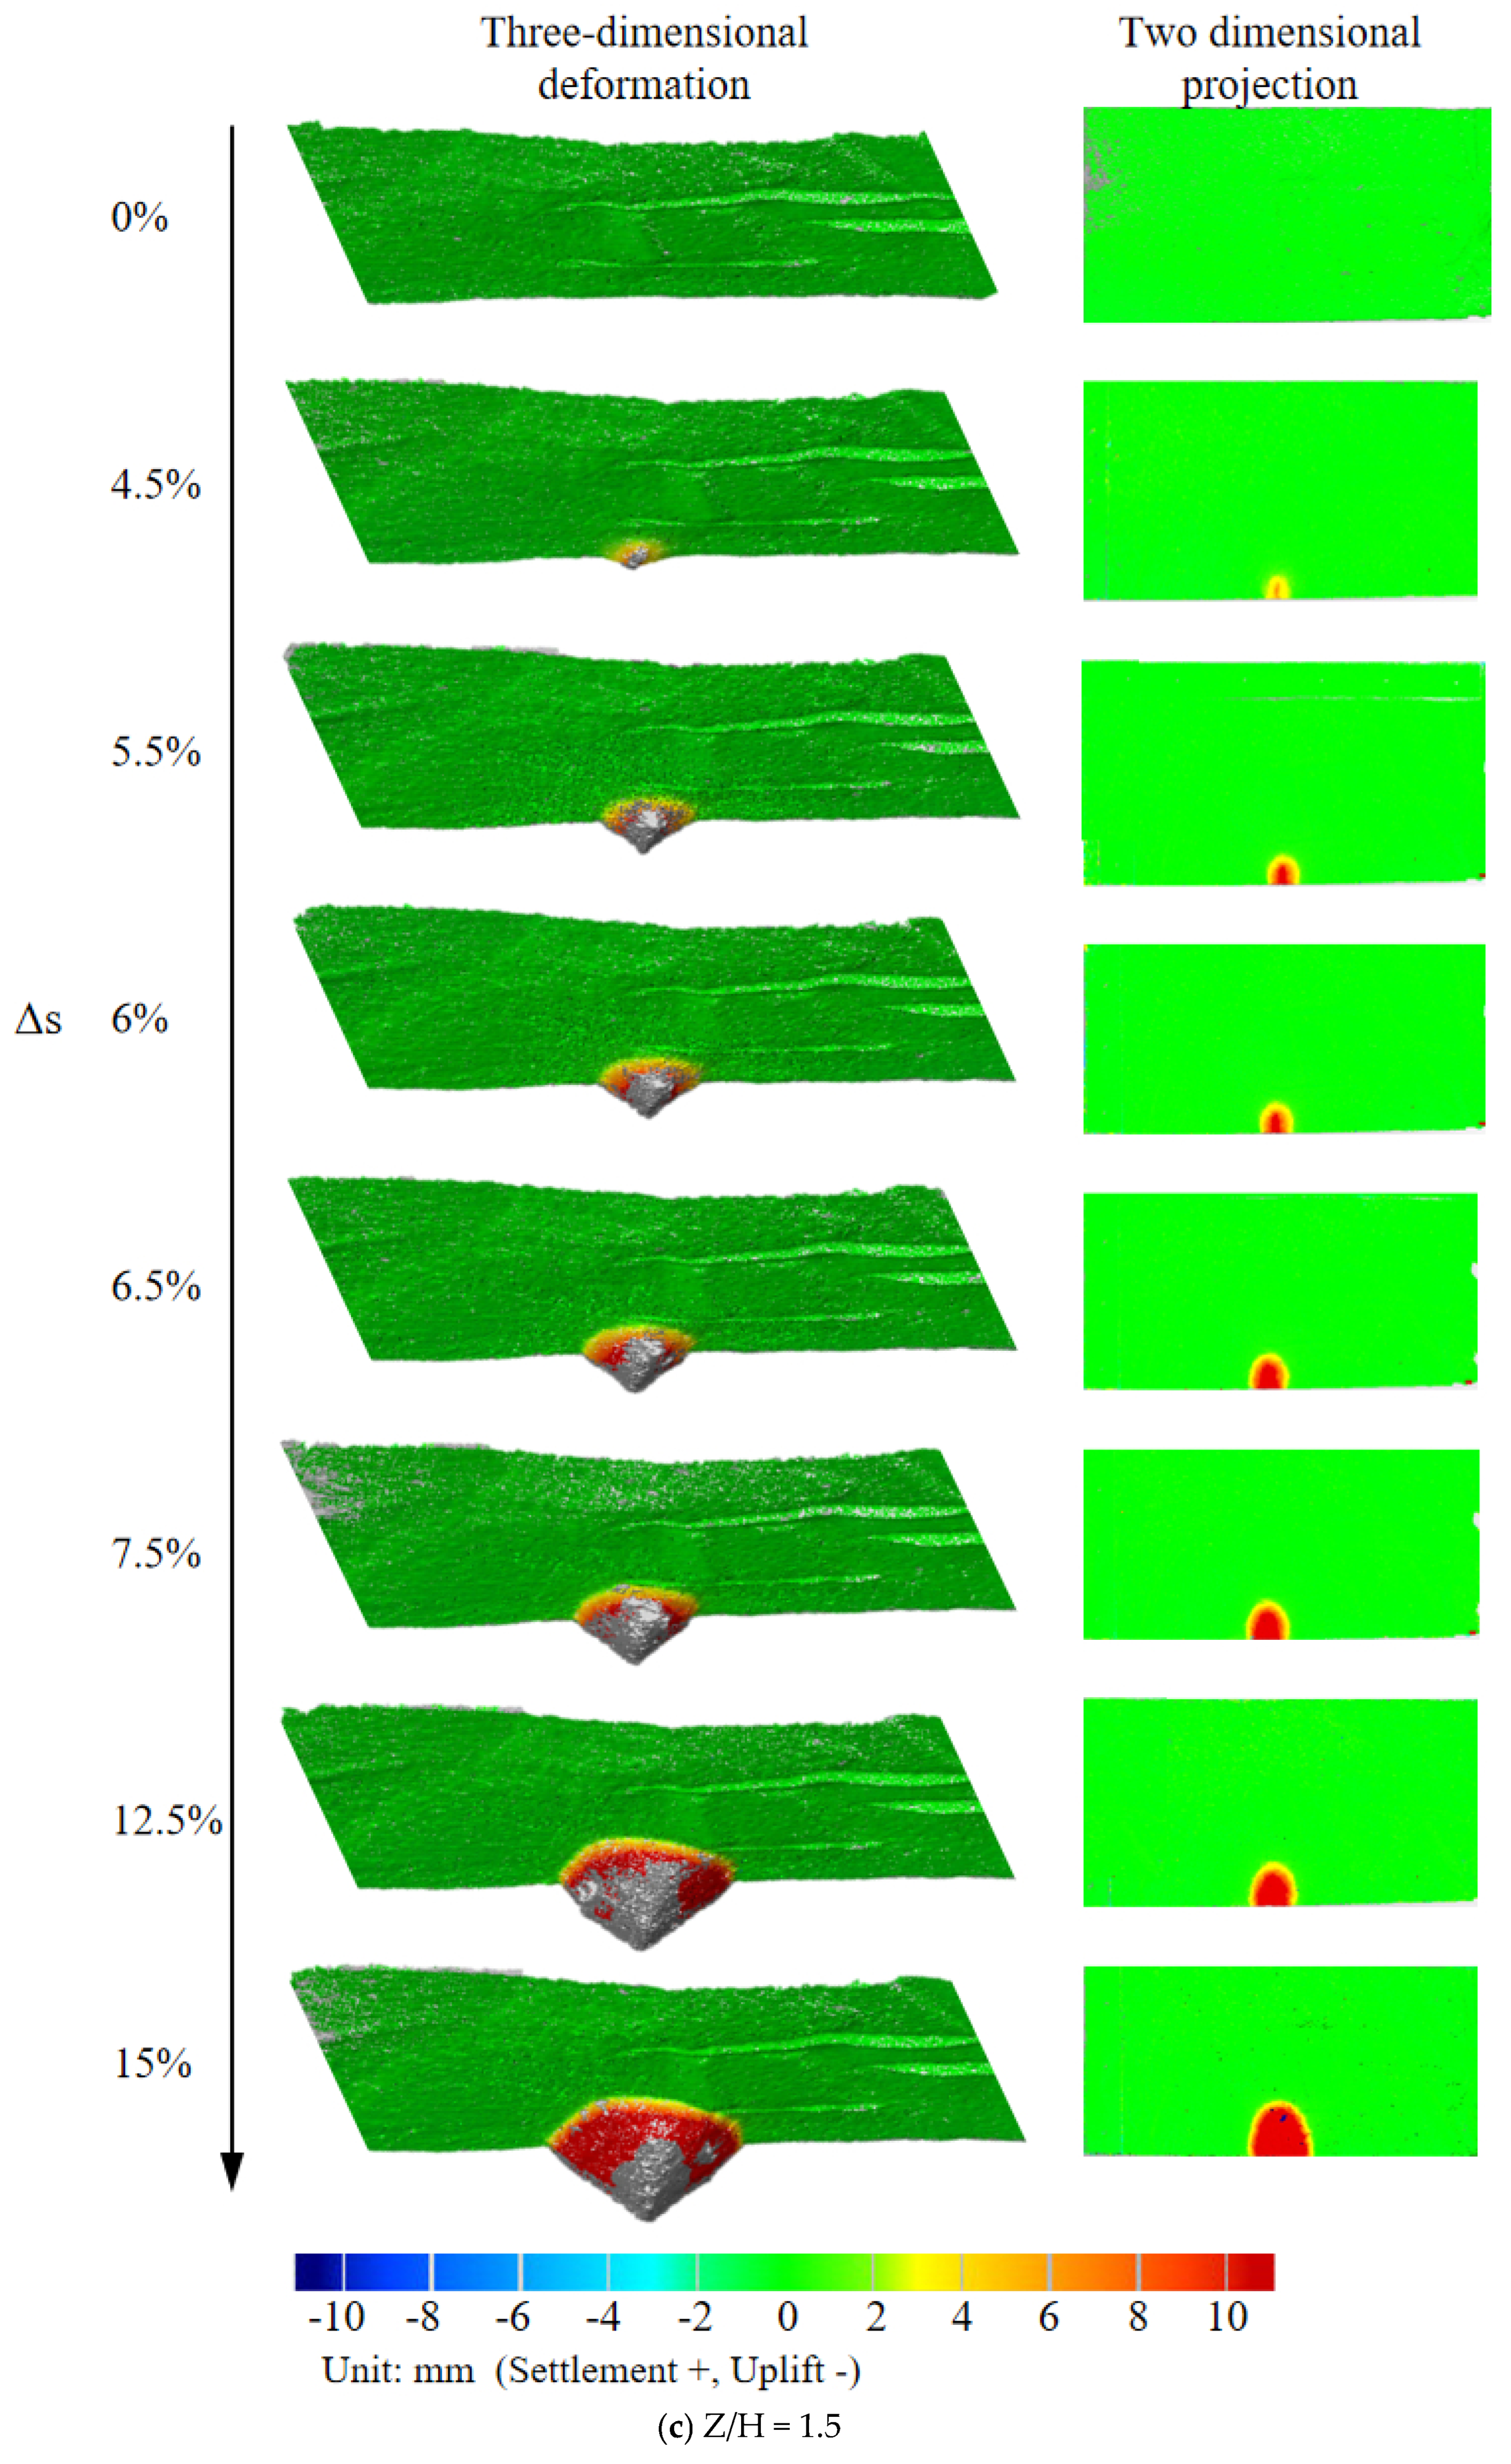
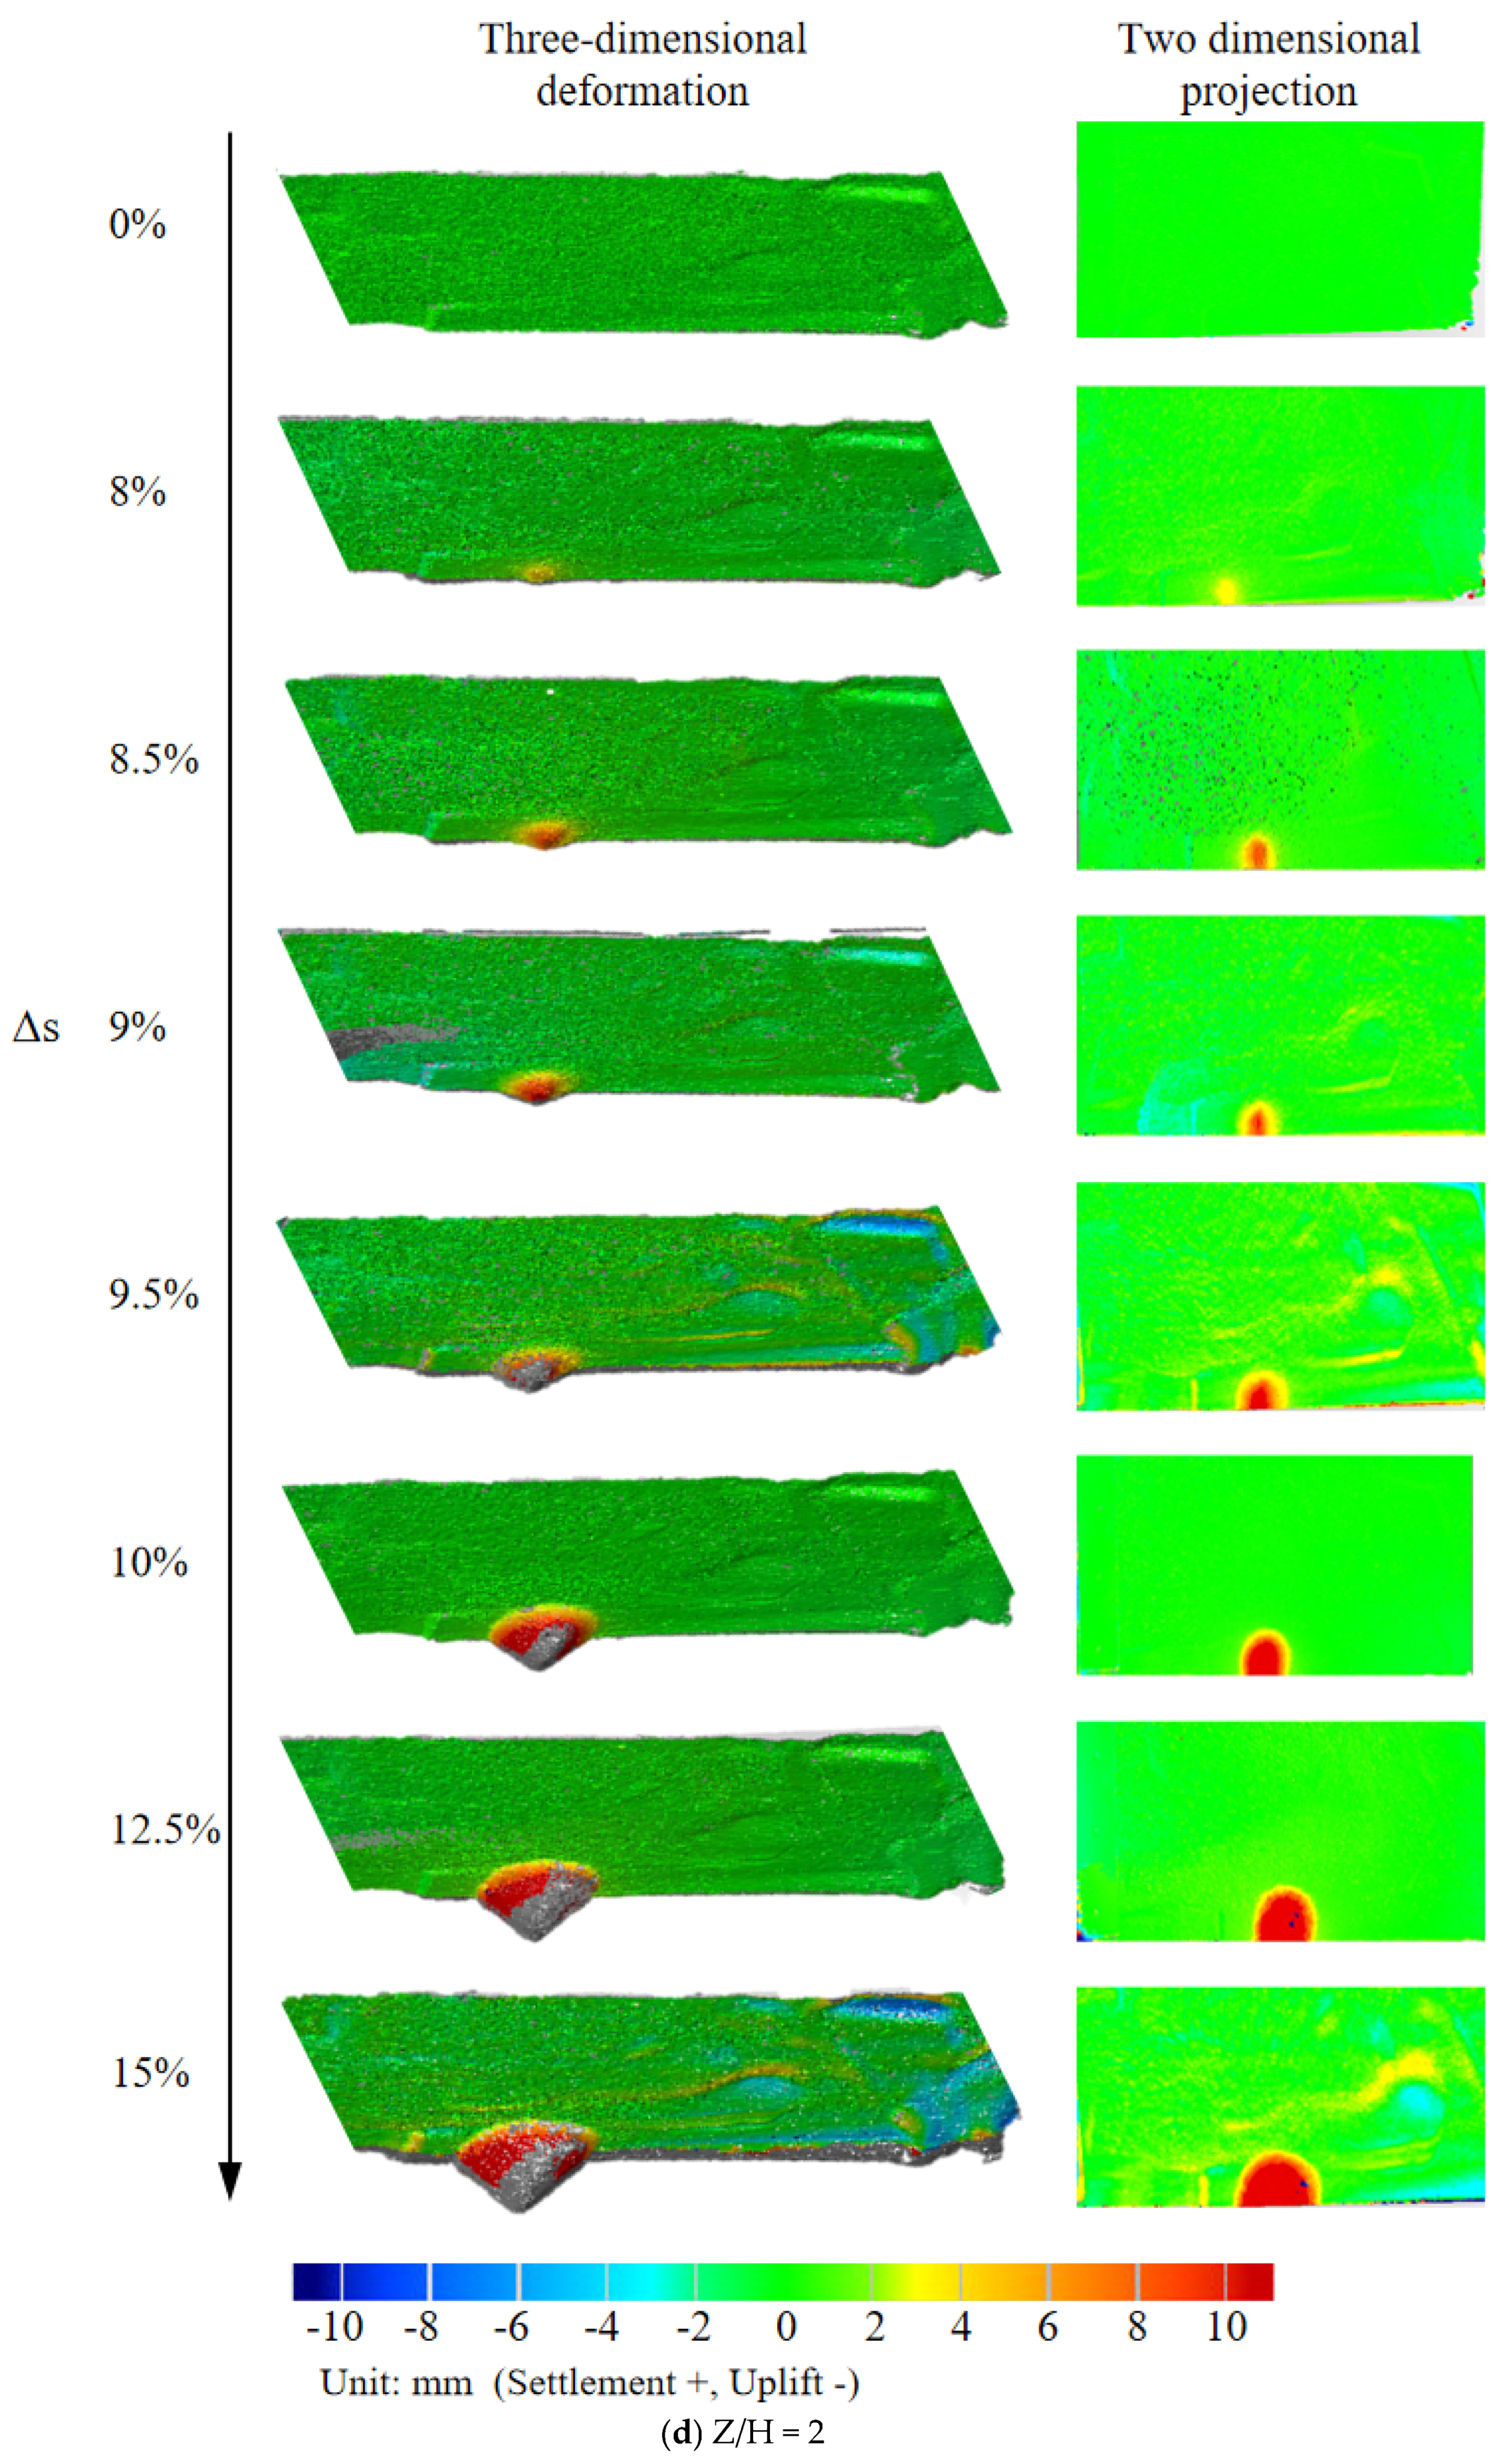
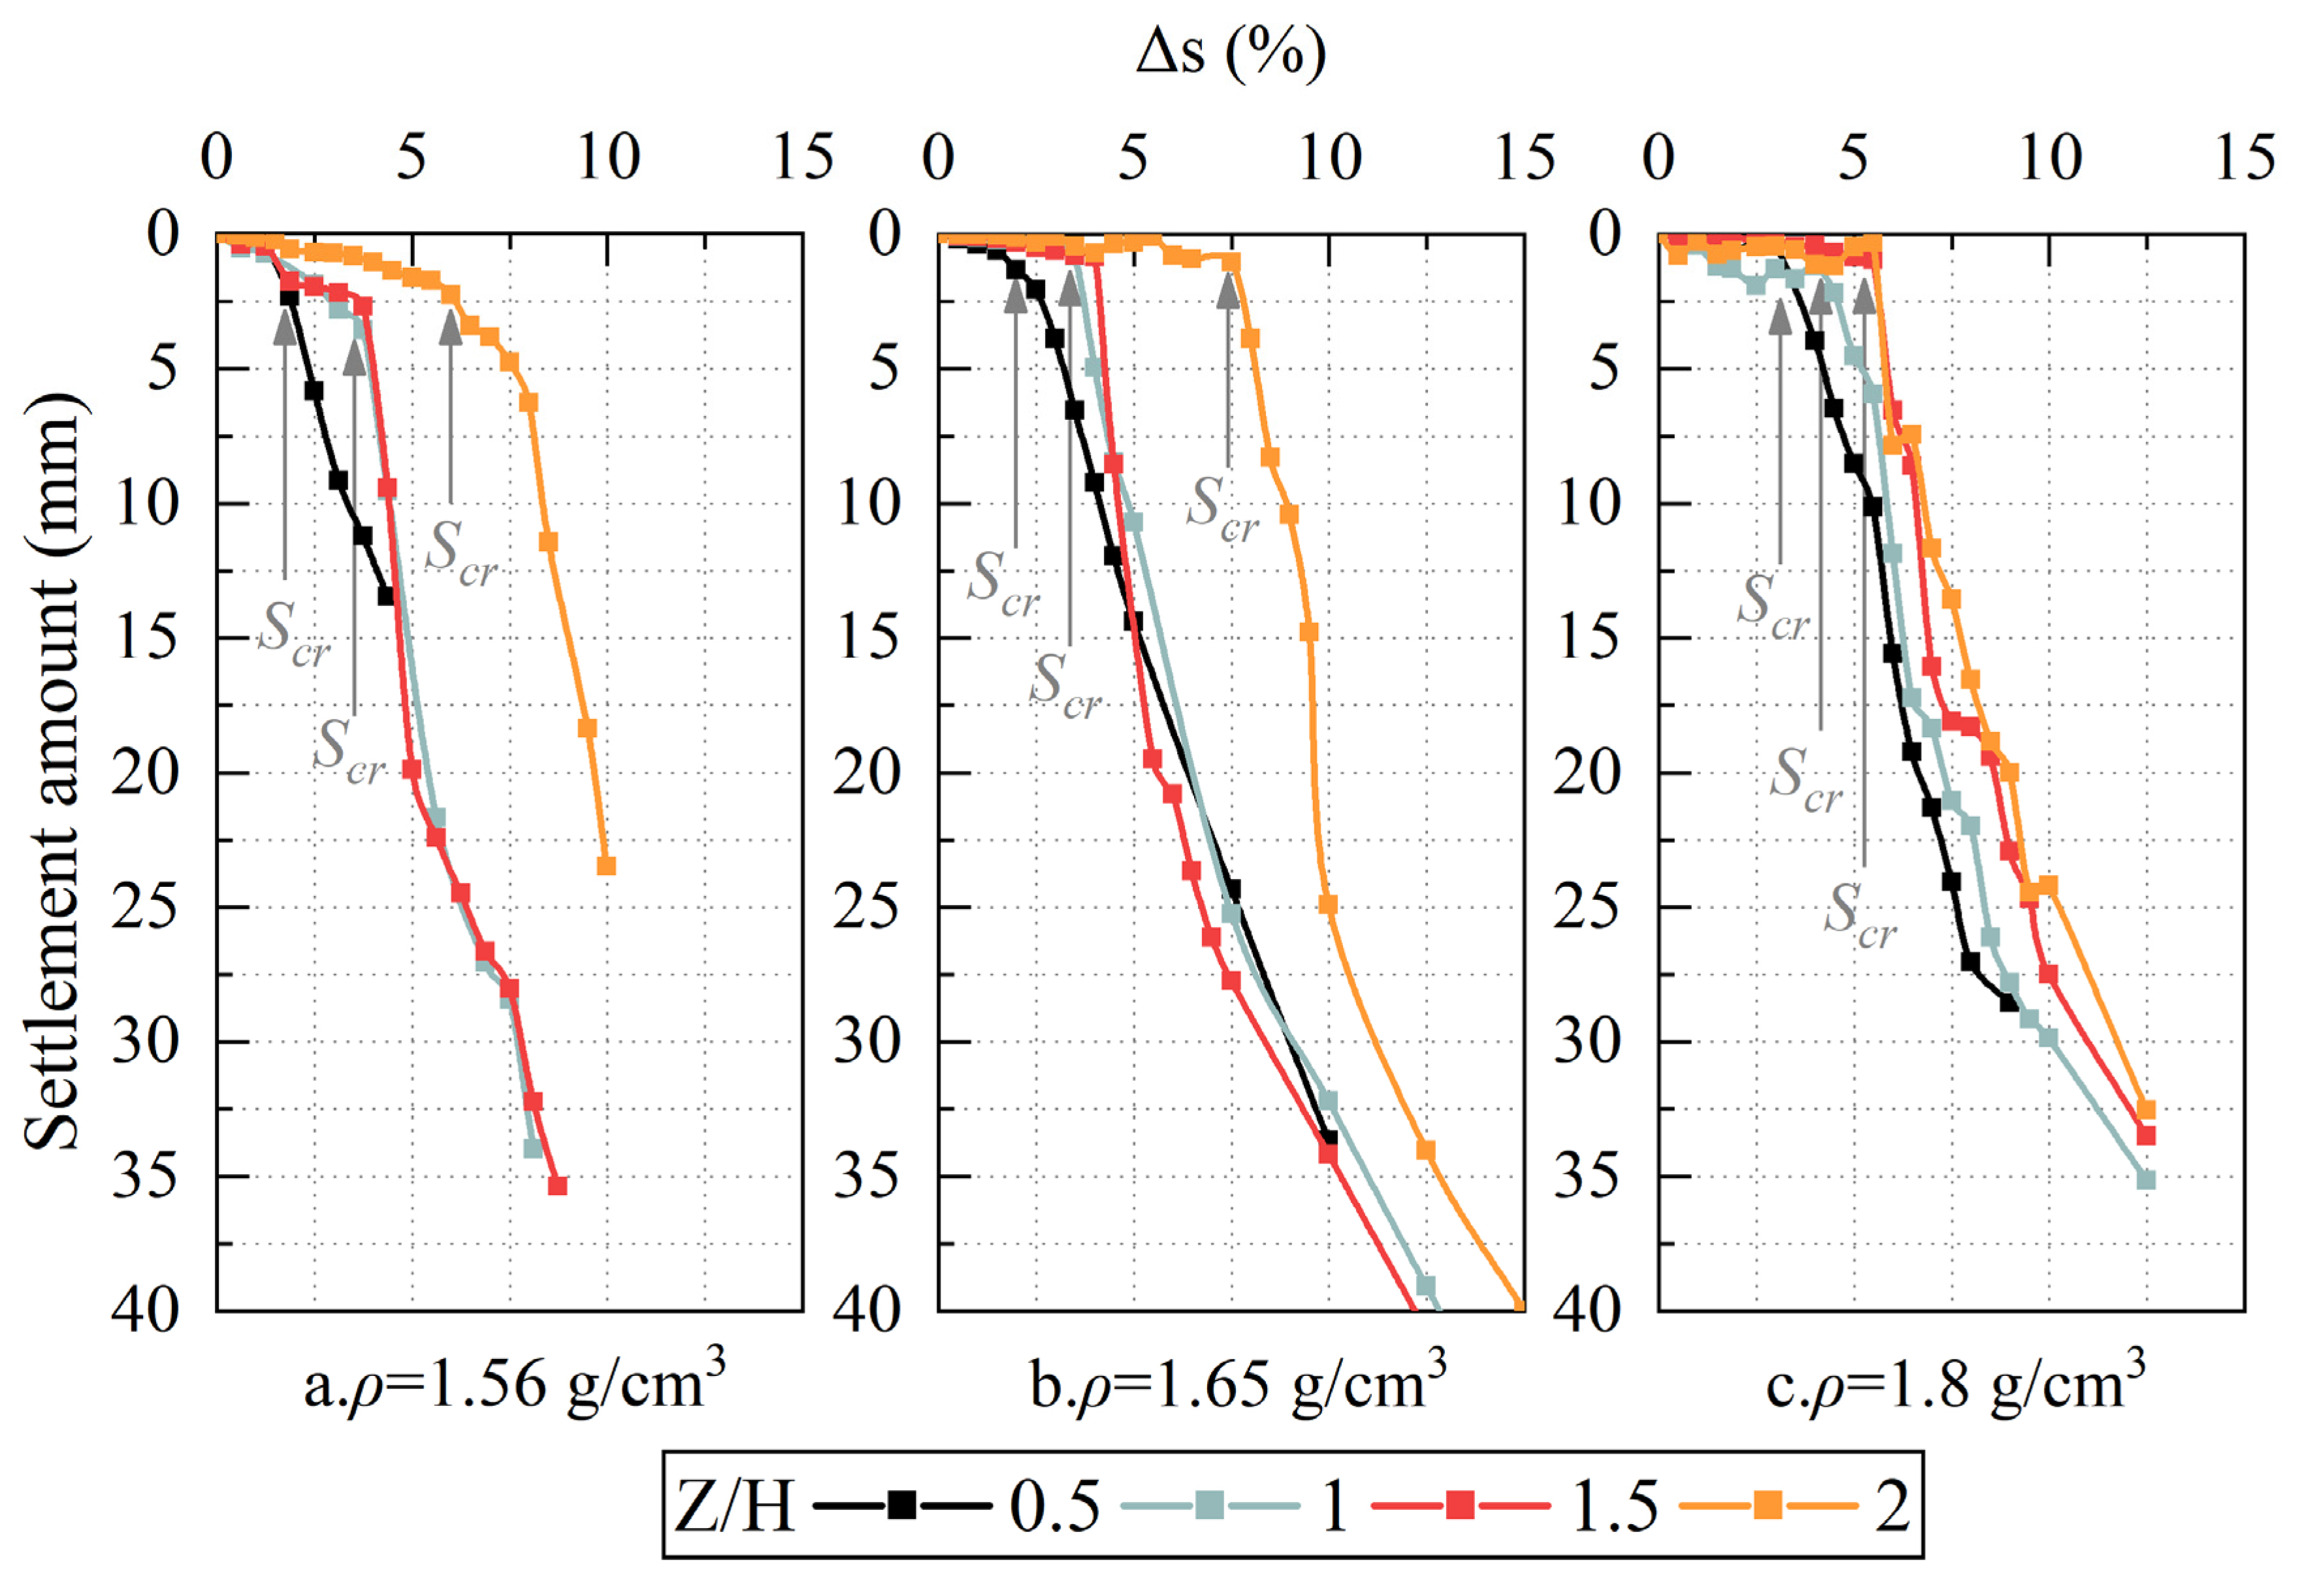
3.3. Ground Settlement Characteristics

Taking medium-dense soil as an example, Figure 9 delineates the evolutionary characteristics of ground settlement under varying overburden ratios, revealing two distinct phases:
Without settlement phase: During initial face displacement, the soil arching effect remains underdeveloped as arch-shaped shear bands have not propagated to the ground, resulting in negligible ground settlement.
Rapid settlement phase: Progressive relative displacement facilitates shear band penetration through the ground, triggering global instability in overburden soils. Initial micro-settlements evolve into rapid linear subsidence with expanding influence zones.
The enhanced soil arching effect in circular excavations produces gradual phase transitions. This phenomenon was experimentally verified in shallow sandy strata, identifying four-stage evolution: without settlement, slow linear growth, accelerated nonlinear development, and rapid linear progression [18,19]. In contrast, rectangular excavations demonstrate abrupt settlement characteristics due to compromised arching capacity. Beyond critical displacement thresholds, both settlement magnitude and rate escalate dramatically, bypassing intermediate transitional phases and indicating catastrophic collapse potential.
The critical settlement amount Scr is defined as the settlement at the inflection point between the no-settlement and rapid settlement phases. Figure 10 demonstrates that Scr remains consistent when soil density is unchanged and exhibits minimal dependence on the overburden ratio. However, larger overburden ratios decelerate the propagation of the arched shear zone toward the ground, consequently increasing the incremental settlement Δs required to attain Scr. Beyond Scr, ground settlement progresses linearly at an approximately constant rate. At this stage, soil arching collapses, shear effects diminish, and gravitational acceleration governs the settlement rate. Consequently, settlement rates converge to similar values across varying overburden ratios and densities.
As illustrated in Figure 11 and Figure 12, trapezoidal settlement surfaces emerge on the ground under varying overburden ratios and soil densities. Adjacent soils experience stress relaxation and slide along the natural angle of repose, forming arcuate boundary lines. With increasing relative displacement, these trapezoidal surfaces collapse downward while the arcuate boundary line boundaries expand. This demonstrates the three-dimensional nature of soil arching, which manifests both vertically and horizontally within deep soil strata. During excavation-induced displacement, the overburden develops two distinct stress zones: (1) a plastic stress zone within the shear band where soils slide downward, and (2) an elastic stress zone outside the shear band exhibiting negligible deformation. Stress transmission occurs through soil particle interactions. When the soil in the plastic stress zone undergoes stress relaxation, the soil arch effect will occur in the direction perpendicular to it. The soil arch contour of the soil is called the equilibrium arch (i.e., the trapezoidal boundary line) [26]. Soils within the equilibrium arch undergo significant settlement synchronized with excavation displacement, whereas those beyond the arch slide solely under self-weight conditions. This transitional region progressively extends outward toward the elastic stress zone.
Figure 12 demonstrates equilibrium arch angles β ranging 41°–48°, independent of the density and overburden ratio. Centrifuge testing proved an inverse proportionality between β and retaining wall aspect ratio W/H [26]: β = 45° at W/H = 1.5 and β = 55° at W/H = 0.5. Interpolation yields β = 47.5° for the current model′s W/H = 1.25, aligning with experimental measurements.

4. Discussion

As exemplified by the 1.65 g/cm3 density case in Figure 13, analysis by comparing the characteristic points of the supporting force, deep soil, and Scr reveals mechanistic linkages between pressure evolution and instability progression.
It can be found that displacements at P1 and Pmin attainment are negligible, indicating high sensitivity of excavation face pressure in rectangular pipe jacking. Operational factors, such as excessive cutter-head advance rate, insufficient jacking velocity, or soil bin unloading, may precipitously reduce support pressure. Conversely, displacements preceding overall instability and rapid settlement exhibit substantial magnitude, demonstrating significant ground deformation hysteresis. This confirms the inadequacy of ground settlement monitoring for real-time stability assessment; minor ground settlement often signifies underlying overall instability with imminent collapse risk.
Therefore, the variation law of the support pressure with relative displacement is generalized. As shown in Figure 14, the four stages of the development of the support force have different instability evolution mechanisms.
(1)
Rapid decline stage: When there is a slight movement in the excavation face, the soil is disturbed and undergoes misalignment and rearrangement. The interaction force shifts, gradually exerting the binding effect between soil particles. A triangular shear zone appears in front of the excavation, and the supporting force rapidly decreases and reaches the P1.
(2)
Slow decline stage: As the relative displacement further increases, an arched shear zone appears in the overlying soil. The uneven displacement of the soil causes the soil arch effect to share part of the soil pressure. When the shear stress is fully activated, the maximum arch effect is exerted, and the support pressure ratio reduces to the Pmin.
(3)
Slow rise stage: The relative displacement continues to increase, causing the soil within the arched shear zone to slide downward. When the volume expansion of the soil within the arched shear zone is insufficient to compensate for the soil loss caused by the movement of the excavation face, the arched shear zone is disrupted, and some of the soil directly collapses, resulting in local instability. When the soil cover is relatively small, it directly develops into a vertical shear zone. However, when the soil cover is relatively large, a new arched shear zone appears and gradually develops towards the ground, resulting in a slow increase in the support force.
(4)
Stabilization stage: The overlying soil on the excavation face formed a vertical shear zone running through the ground. The continuous increase in relative displacement led to the overall movement of the soil within the shear zone, resulting in rapid settlement of the ground, with the Ps remaining basically constant.

5. Conclusions

To investigate the instability evolution mechanism of the shallow-buried rectangular pipe jacking excavation face in the sand layer, model tests were carried out in this study, and the following four conclusions were obtained:
(1)
Support pressure evolves through consistent stages irrespective of overburden ratio or density, and it shows nonlinear changes due to the influence of soil arch. And enhanced density intensifies soil arching, reducing support pressure while amplifying its post-failure rebound.
(2)
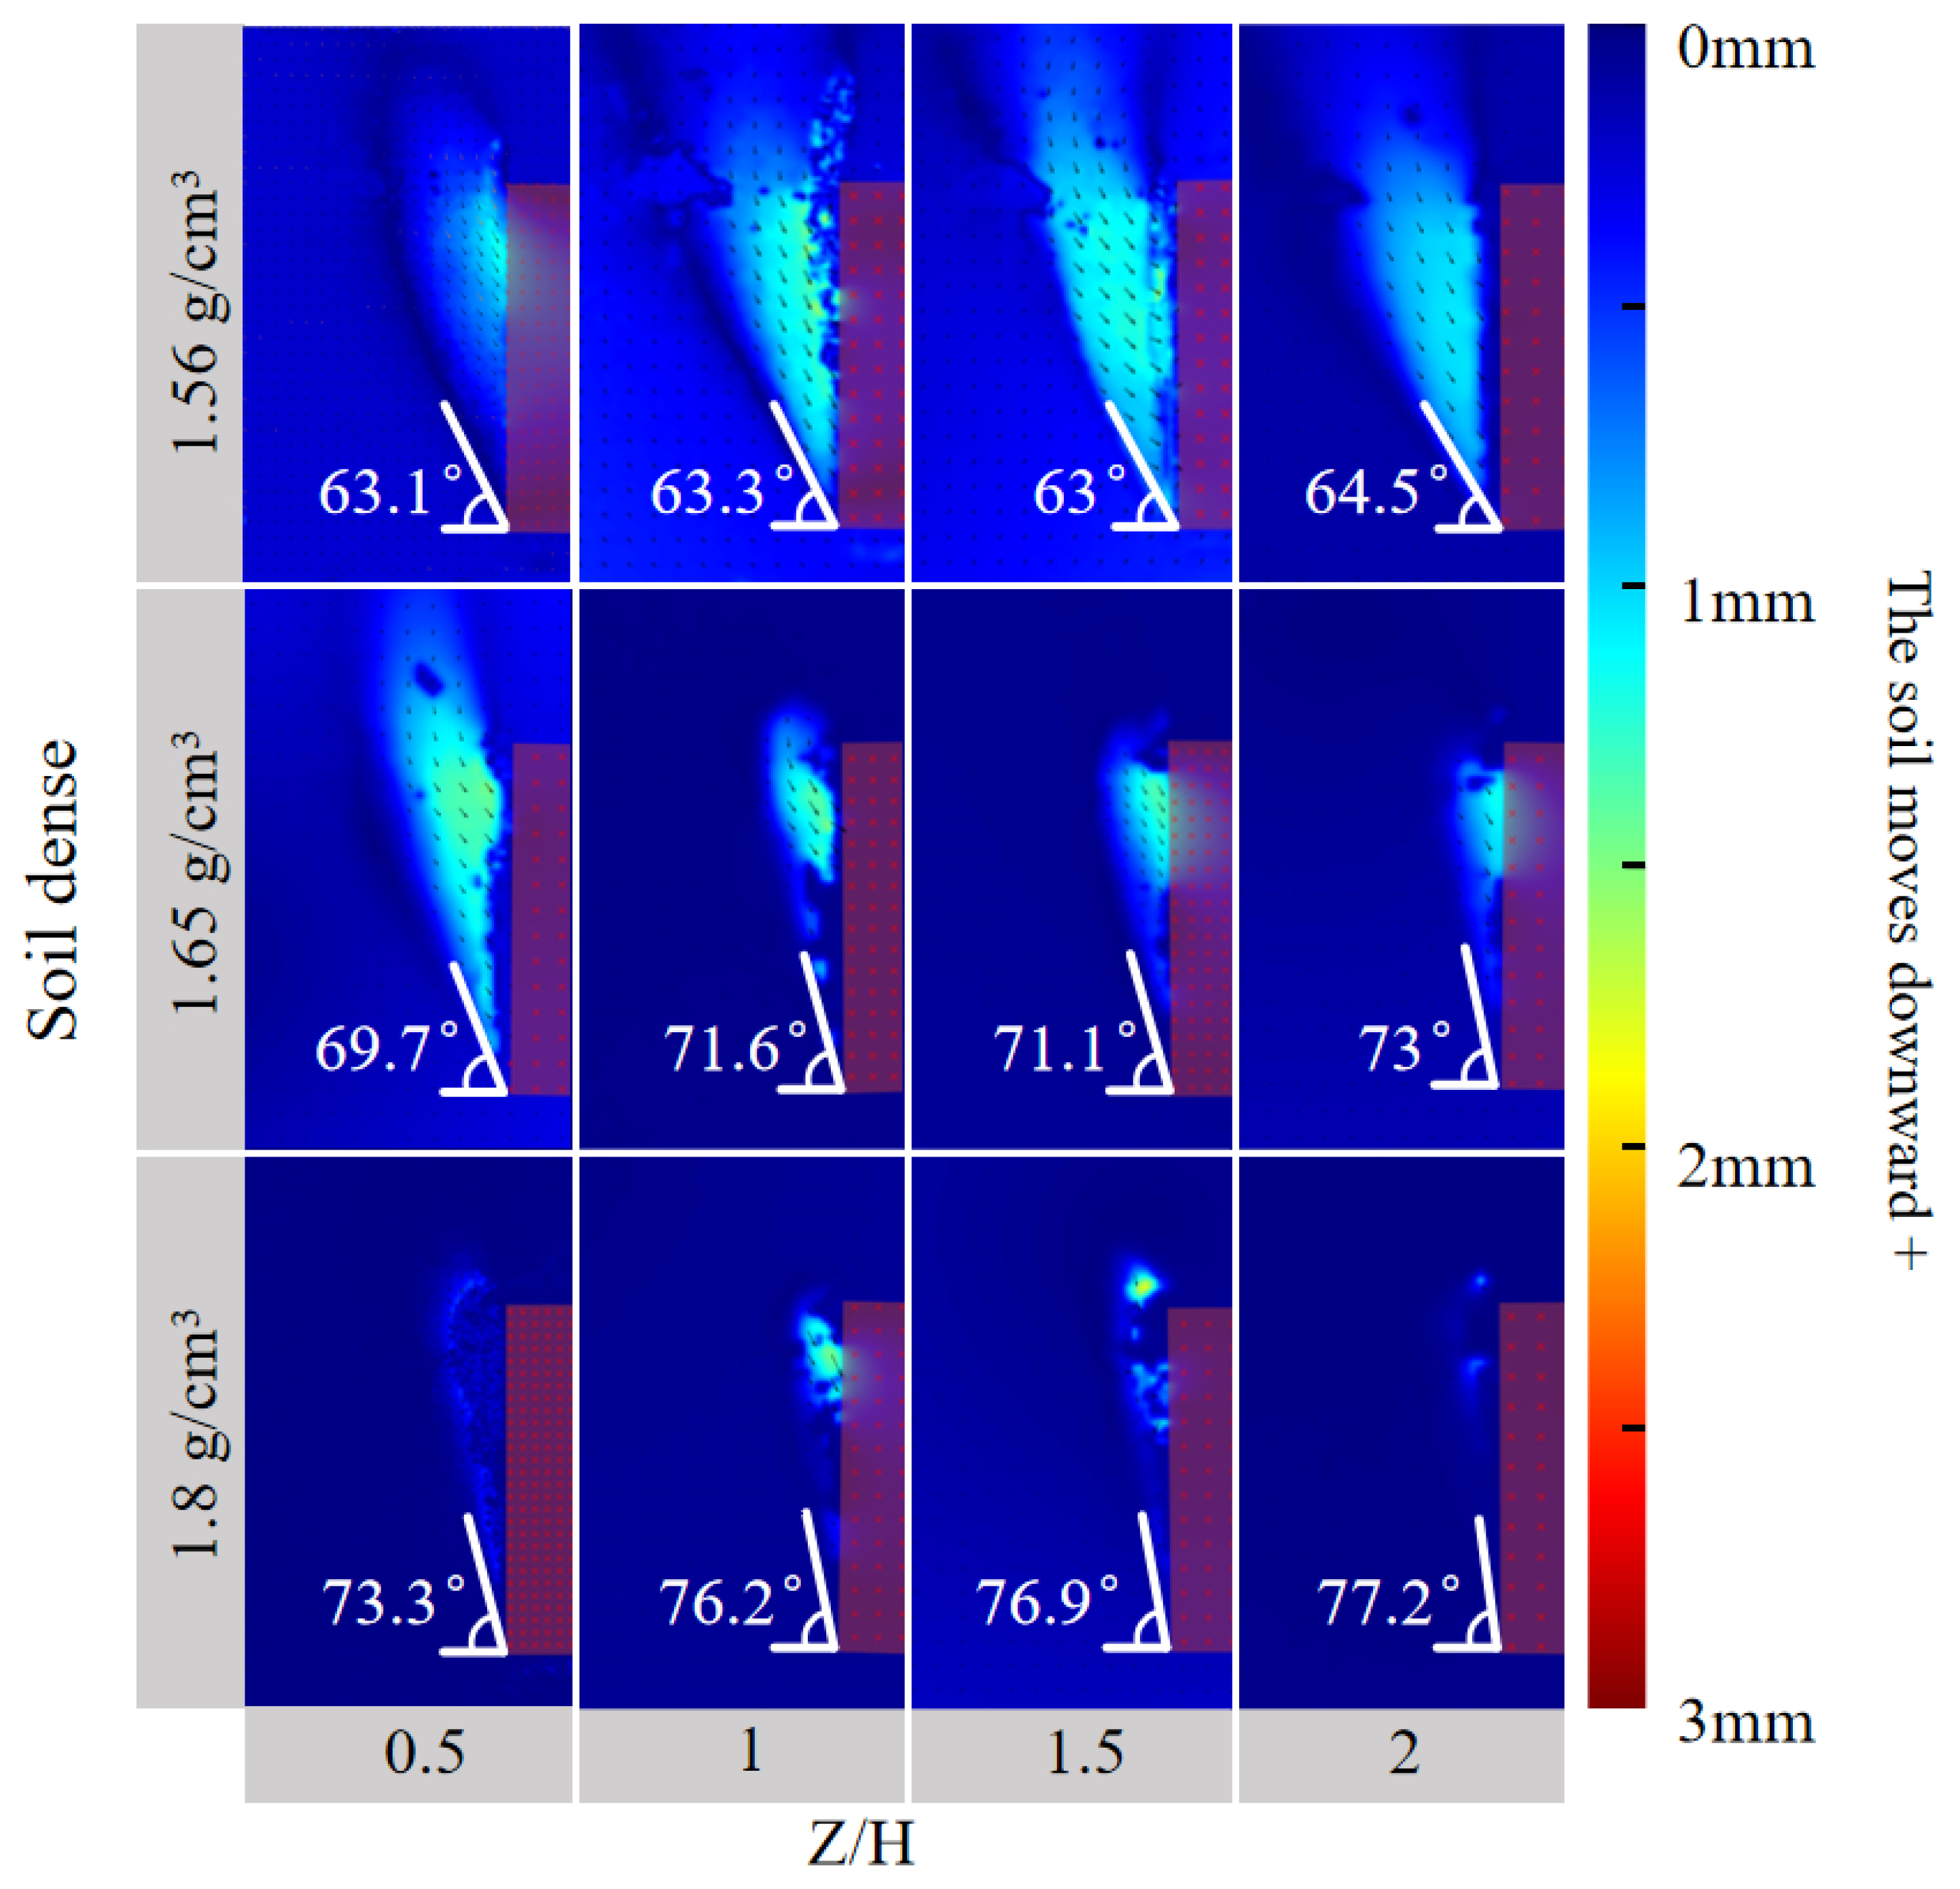
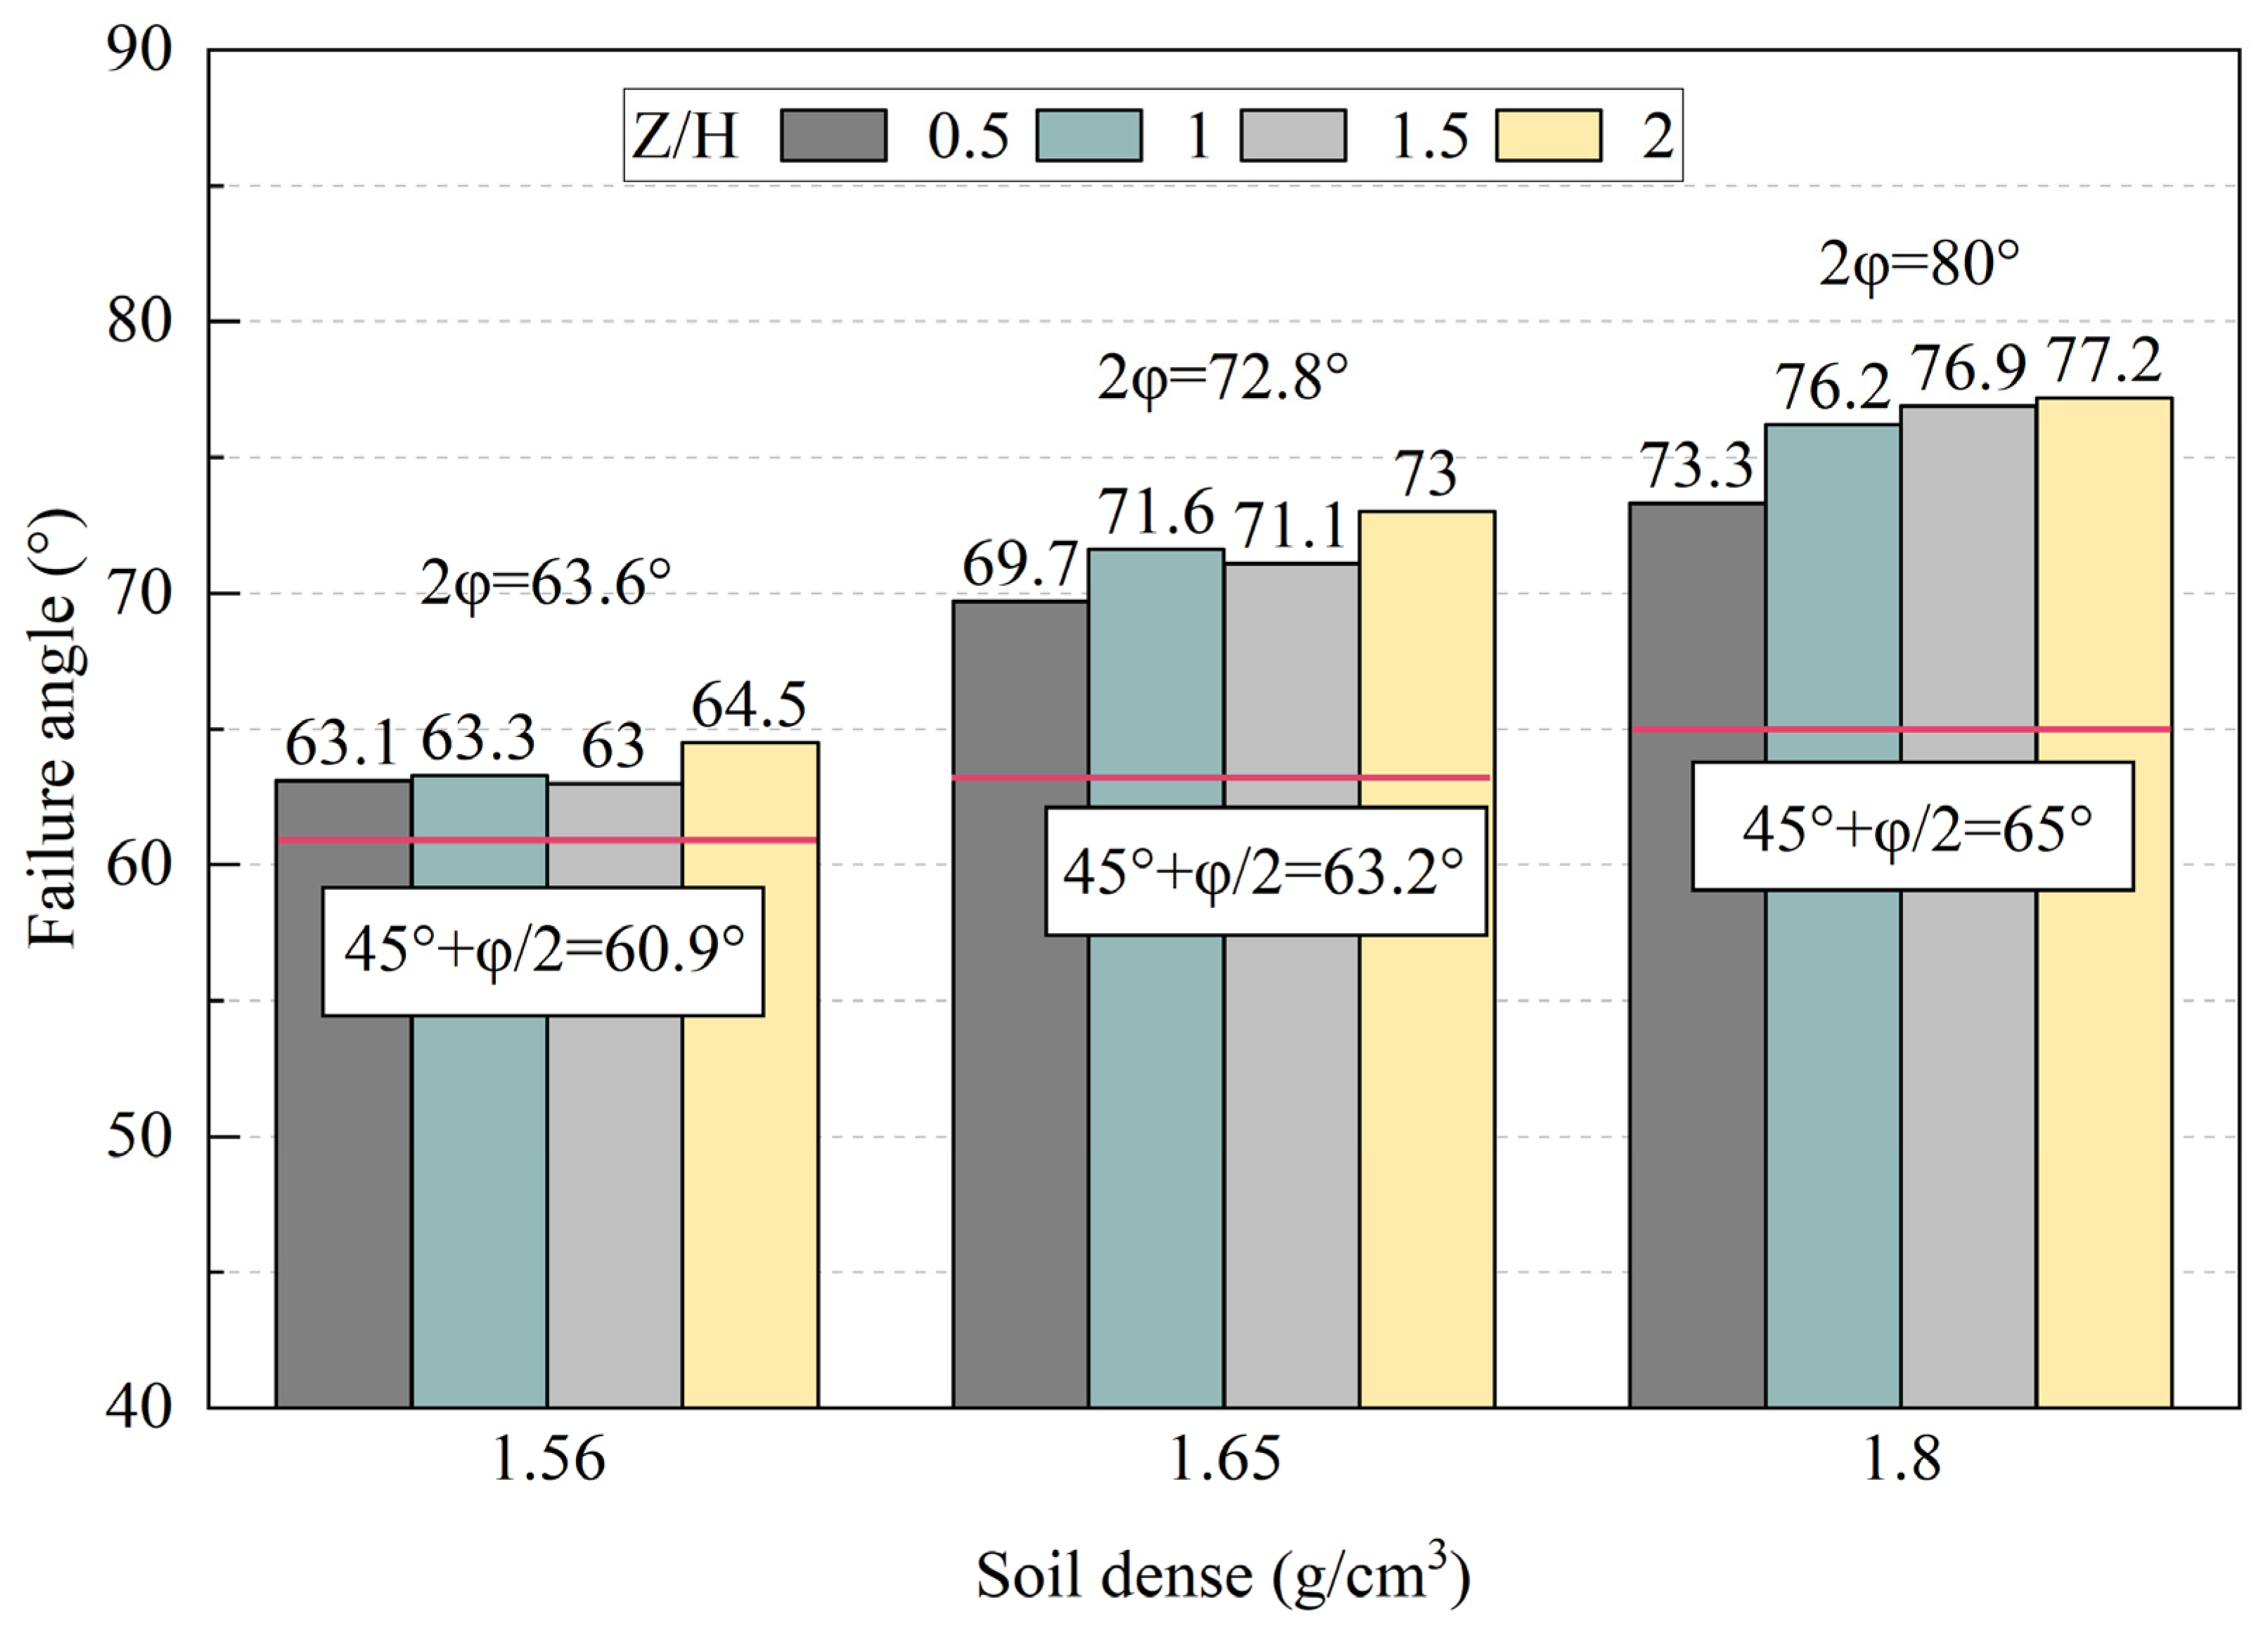
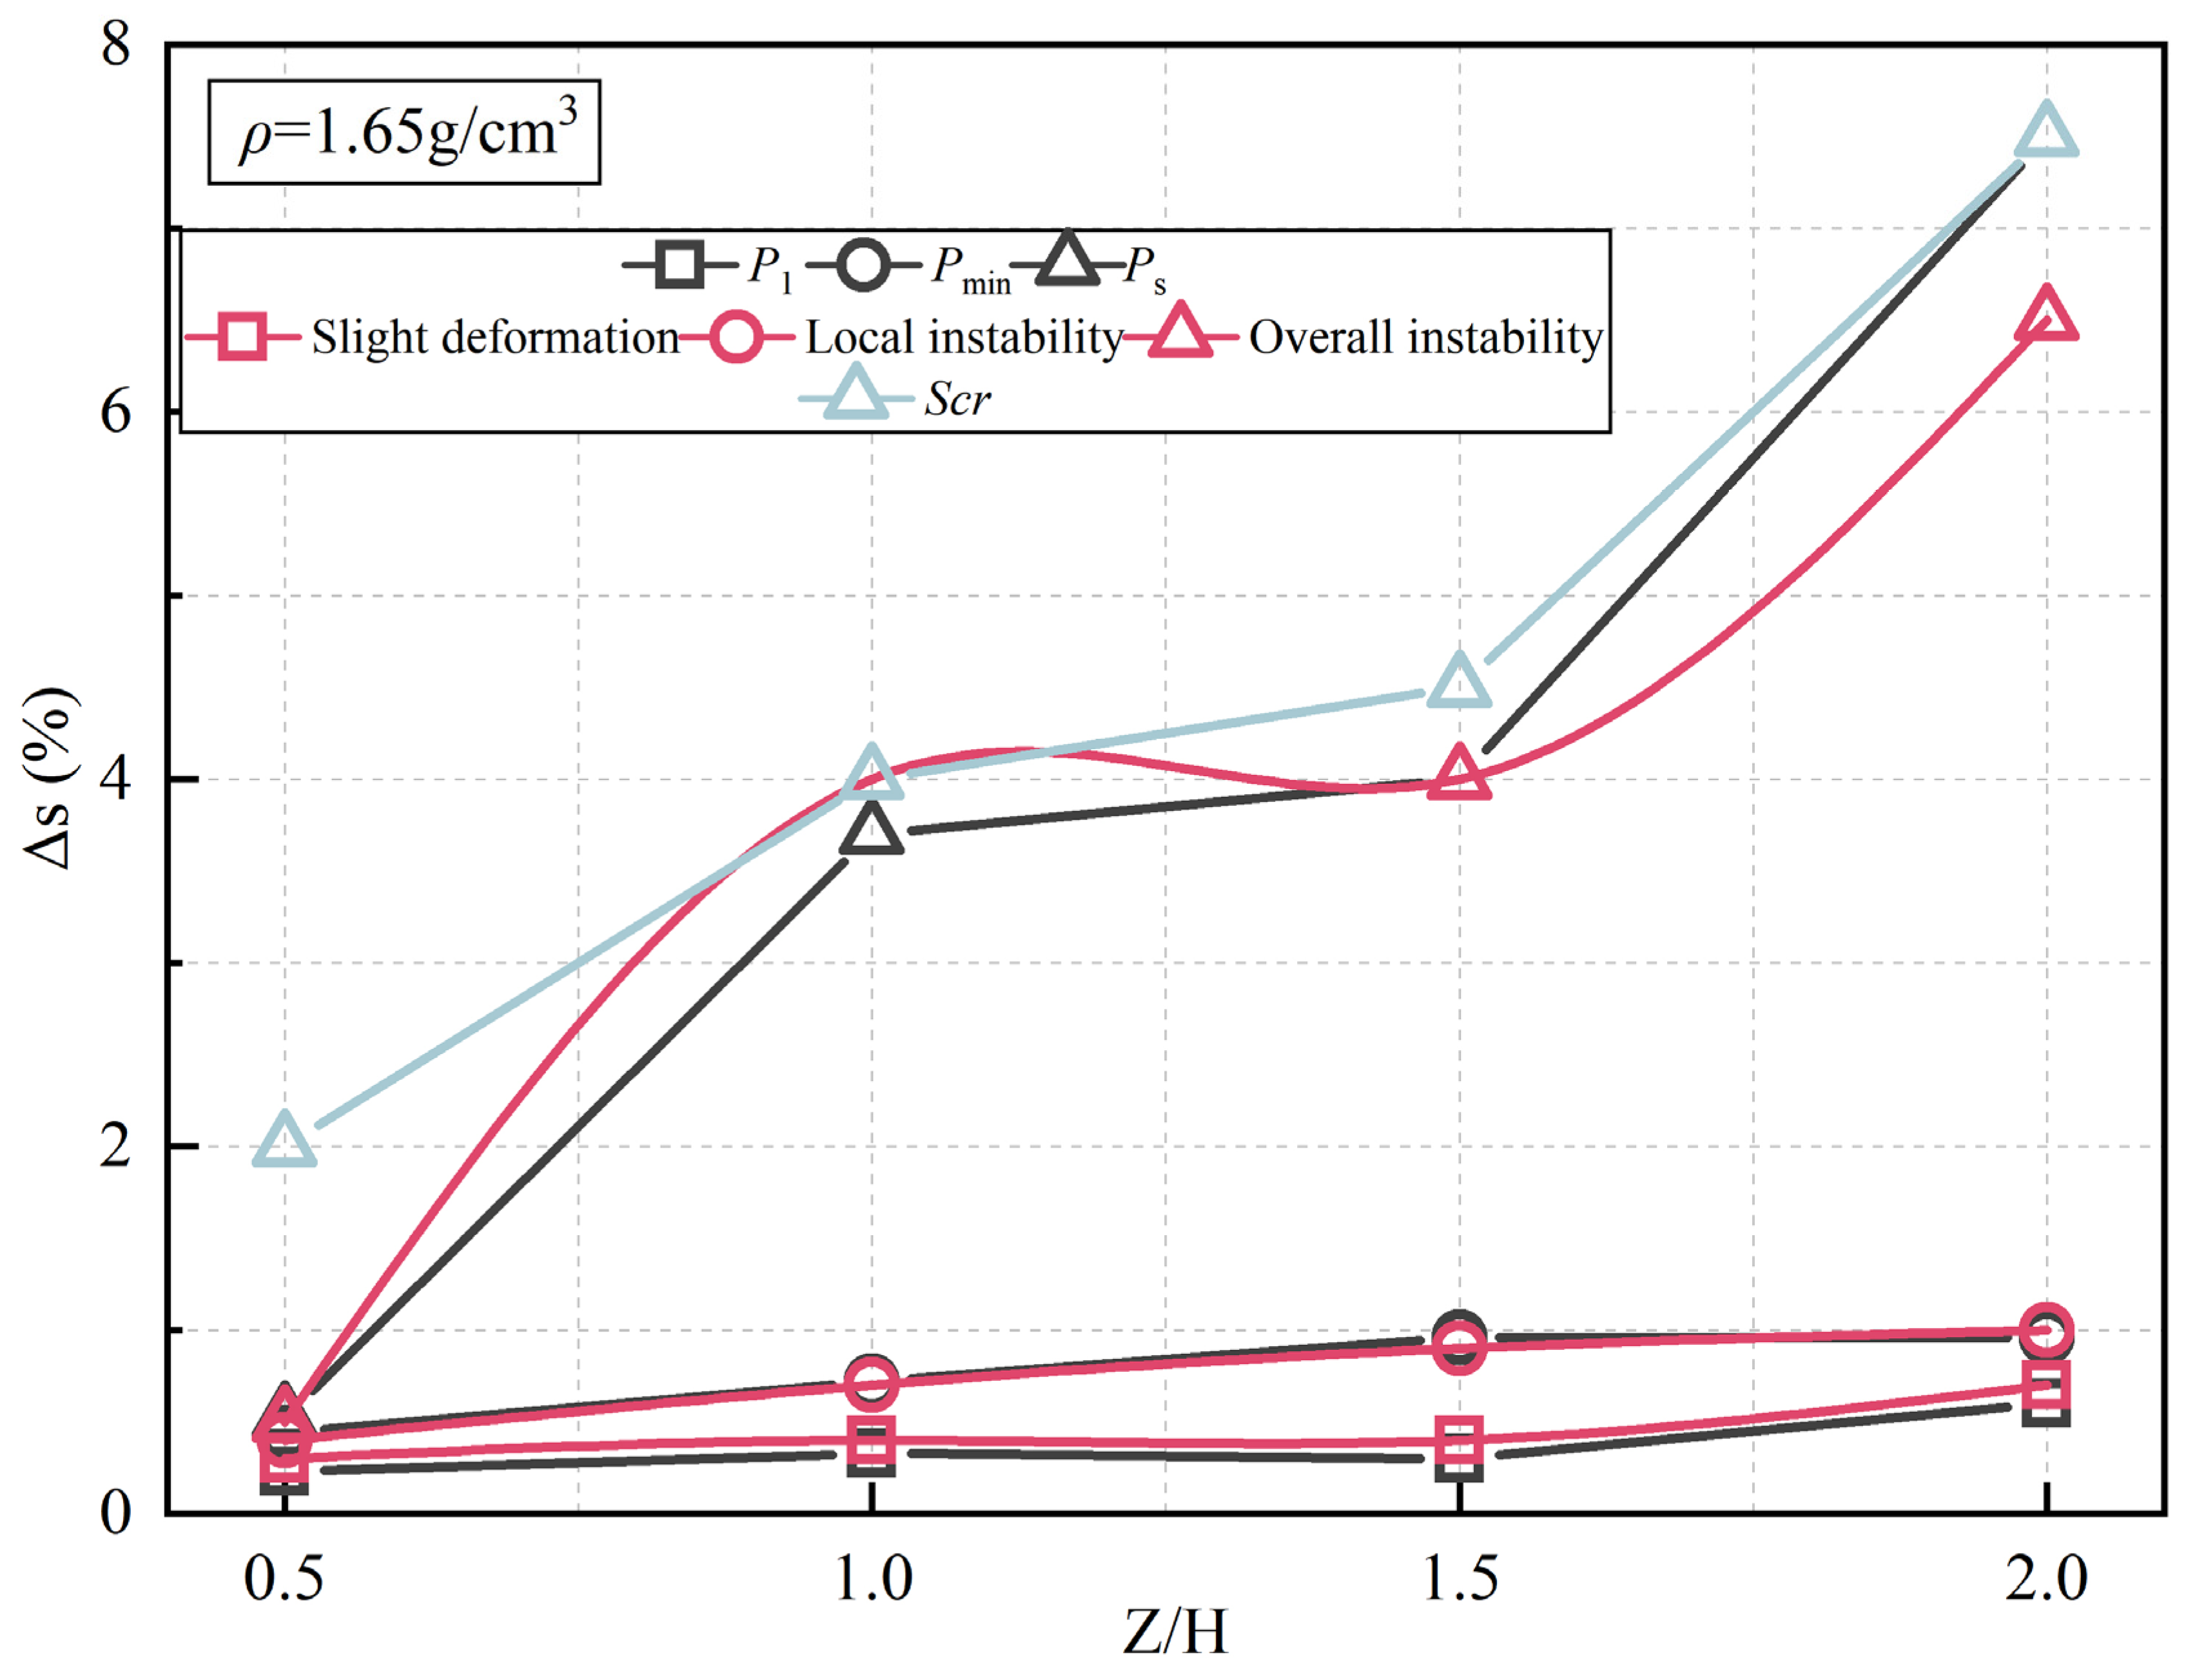
Shear bands propagate progressively from excavation base to the ground during instability. The deep soil successively develops into non-deformation, triangular shear zone (slight deformation), arched shear zone (local instability), and vertical shear zone (overall instability). Meanwhile, the failure angle increases with soil density but is depth-independent, approximating twice the internal friction angle (≈2φ) for rectangular excavation faces.
(3)
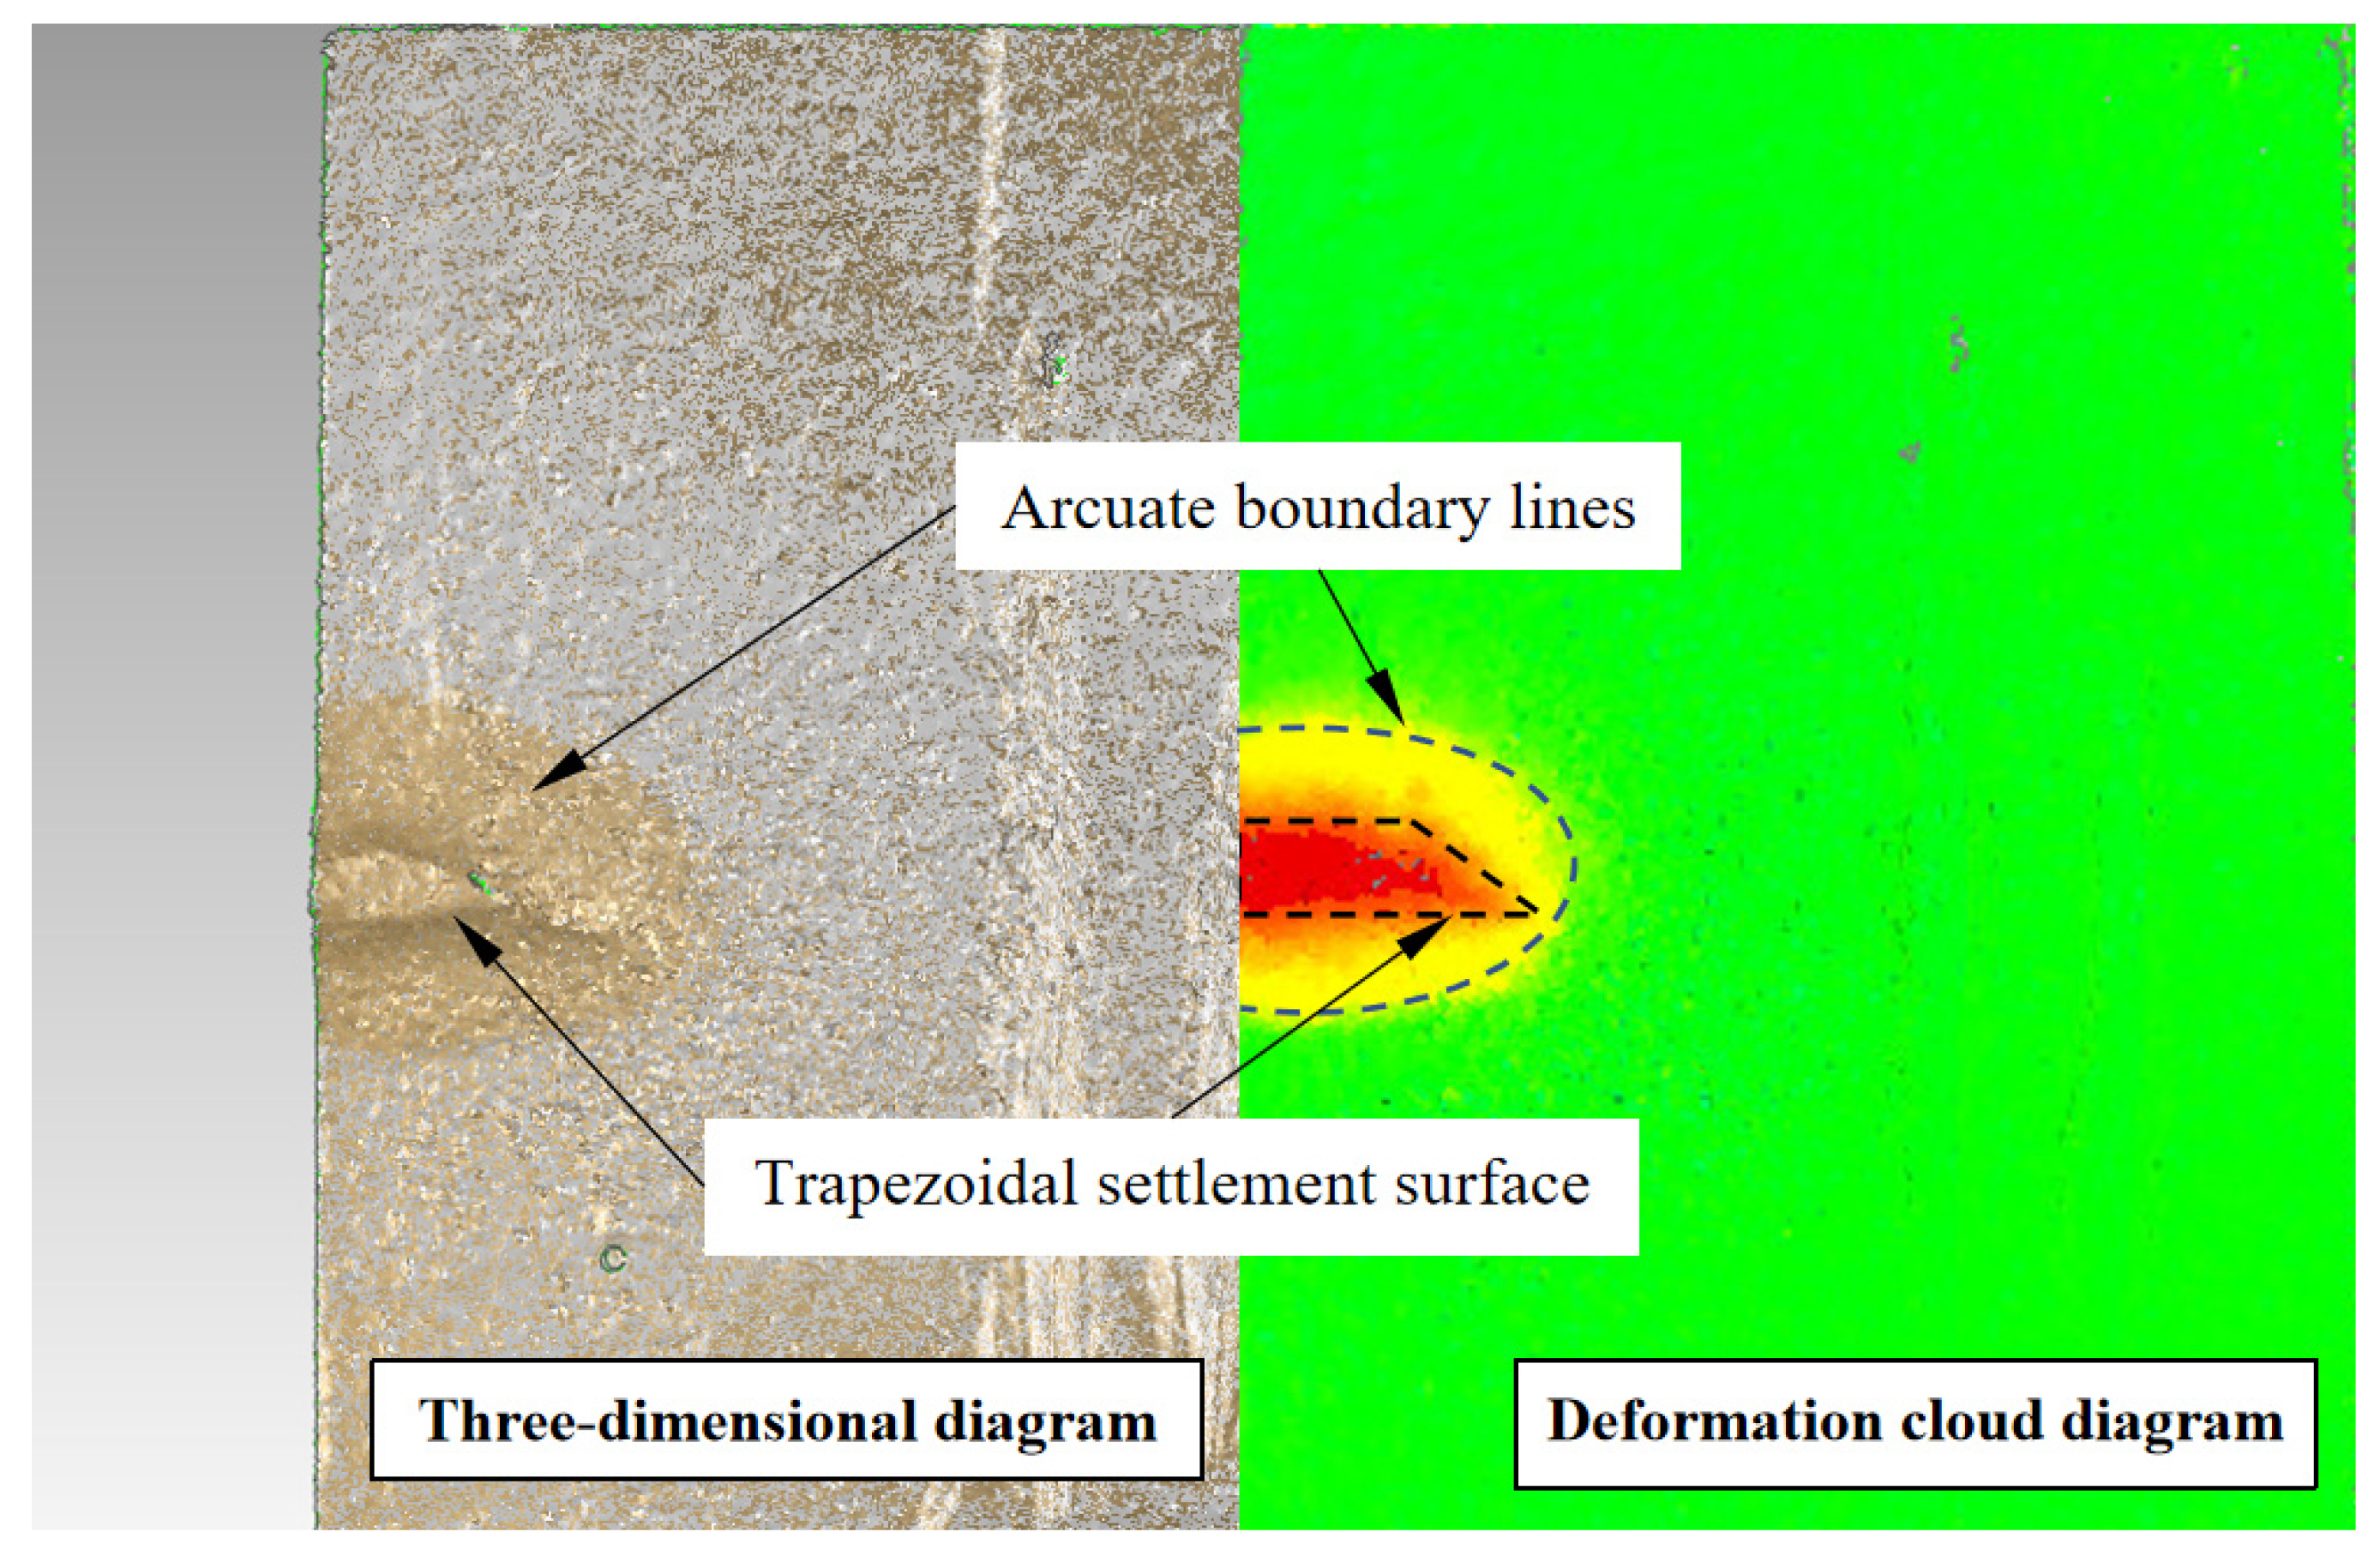
During face instability, abrupt trapezoidal settlement surfaces emerge. Negligible settlement occurs prior to arched shear band penetration, but post-penetration triggers overall instability, forming these trapezoidal surfaces that exhibit progressively increasing settlement magnitude, rate, and extent. The critical settlement Scr depends on soil density but not overburden ratio. While the settlement rate is invariant to both parameters, larger overburden ratio increases displacement to reach Scr. Critically, the trapezoid geometry is governed by horizontal soil arching, where the equilibrium arch angle β, at a range of 41°~48°, correlates with the excavation aspect ratio and is independent of both soil density and overburden thickness.
(4)
Mechanistic linkages exist among support pressure, deep soil displacement, and ground settlement. Triangular shear band initiation causes pressure to drop to P1. Subsequent arched shear band development activates arching, minimizing pressure. Arch disruption induces localized instability, initiating pressure ascent while triggering new peripheral arched bands. These ultimately evolve into vertical surface-penetrating shear bands, coinciding with rapid ground settlement and pressure stabilization.
The instability mechanism revealed in this study provides a foundation for establishing a three-dimensional support pressure calculation model. Combined with more realistic on-site monitoring, it is of great significance to establish a calculation model of the rectangular pipe jacking face.

Author Contributions

Conceptualization, Y.Z. and P.Z.; Data Curation, Y.Z. and Y.X.; Funding Acquisition, P.Z.; Investigation, Y.Z.; Methodology, Y.Z. and P.Z.; Validation, P.Z.; Visualization, P.Z. and J.M.; Writing—Original Draft, Y.Z., Y.X. and P.Z.; Writing—Review and Editing, Y.Z. All authors have read and agreed to the published version of the manuscript.

Funding

This research was funded by PowerChina Guiyang Engineering Corporation Limited Postdoctoral Fund Project (YJBSXM240002), the National Science Foundation of China (52008383), and the Open Project Fund of Engineering Research Center of Rock-Soil Drilling & Excavation and Protection, Ministry of Education (202306).

Institutional Review Board Statement

Not applicable.

Informed Consent Statement

Not applicable.

Data Availability Statement

The raw data supporting the conclusions of this article will be made available by the authors on request.

Conflicts of Interest

Author Yunlong Zhang was employed by the company PowerChina Guiyang Engineering Corporation Limited. The remaining authors declare that the research was conducted in the absence of any commercial or financial relationships that could be construed as a potential conflict of interest.

References

  1. Zhang, Y.; Feng, X.; Zhou, H.; Zhang, P.; Ma, B.; Tan, L.; Wang, J. Pressure characteristics of rectangular box jacking considering box-soil-lubricant interaction. Tunn. Undergr. Space Technol. 2022, 126, 104569. [Google Scholar] [CrossRef]
  2. Zhang, Y.; Zhang, P.; Liu, K.; Xu, T.; Xu, Y.; Mei, J. A Segmented Calculation Method for Friction Force in Long-Distance Box Jacking Considering the Effect of Lubricant. Appl. Sci. 2024, 14, 2111. [Google Scholar] [CrossRef]
  3. Wang, Y.; Xiang, Y. Complex Function Solution of Stratum Displacements and Stresses in Shallow Rectangular Pipe Jacking Excavation Considering the Convergence Boundary. Appl. Sci. 2024, 14, 1154. [Google Scholar] [CrossRef]
  4. Xu, Y.; Liang, W.; Liu, X.; Cui, G.; Bai, X. Research on soil stability of large section rectangular pipe jacking tunnel excavation face. Mod. Tunn. Technol. 2017, 54, 70–77+85. (In Chinese) [Google Scholar] [CrossRef]
  5. Xie, X.; Zhao, M.; Shahrour, I. Experimental Study of the Behavior of Rectangular Excavations Supported by a Pipe Roof. Appl. Sci. 2019, 9, 2082. [Google Scholar] [CrossRef]
  6. Pan, W.; Wang, Z.; Diao, Y.; Zheng, G.; Zhou, H.; Zhang, T. Stability Analysis and Safety Factors of the Excavation Face of a Pipe Screen Tunnel in a Soft Soil Area. Appl. Sci. 2023, 13, 11120. [Google Scholar] [CrossRef]
  7. Wang, Y.; Zhang, D.; Fang, Q.; Liu, X.; Wang, J. Analytical Solution on Ground Deformation Caused by Parallel Construction of Rectangular Pipe Jacking. Appl. Sci. 2022, 12, 3298. [Google Scholar] [CrossRef]
  8. Ding, W.; Wang, Z.; Guo, X.; Chen, R. Calculation method of limit support pressure for large diameter rectangular pipe jacking tunnel face. Sci. Technol. Eng. 2021, 21, 9563–9569. (In Chinese) [Google Scholar] [CrossRef]
  9. Liu, W.; Yu, M.; Wu, Y.; Shi, P.; Wu, B. Formation stability analysis during the opening operation of the box pipe boxing. Harzard Control. Tunn. Undergr. Eng. 2022, 4, 92–98. (In Chinese) [Google Scholar] [CrossRef]
  10. Yu, M.; Liu, W.; Shi, P.; Jia, P. Analysis of stability and support pressure of driving face in shallow buried rectangular pipe jacking with large section. J. Jiansu Univ. (Nat. Sci. Ed.) 2022, 43, 612–620. (In Chinese) [Google Scholar] [CrossRef]
  11. Ding, J.; Peng, L.; Lei, M.; Zhu, L.; Tang, Z. Three-dimensional limit analysis method for excavation surface stability of rectangular pipe jacking tunnel with large section. J. Railw. Sci. Eng. 2022, 19, 2369–2380. (In Chinese) [Google Scholar] [CrossRef]
  12. Qu, K. Face stability analysis of shallow rectangular pipe jacking tunnel considering fluid-solid coupling effect. Sci. Technol. Eng. 2022, 22, 2055–2062. (In Chinese) [Google Scholar] [CrossRef]
  13. Zhang, M.; Dai, Z.; Zhang, X.; Javadi, A.A. Active failure characteristics and earth pressure distribution around deep buried shield tunnel in dry sand stratum. Tunn. Undergr. Space Technol. Inc. Trenchless Technol. Res. 2022, 124, 104479. [Google Scholar] [CrossRef]
  14. He, J.; Yang, Z.; Zhang, X. Effect of Undercrossing Shield Tunnels Excavation on Existing Rectangular Pipe-Jacking Tunnels. Appl. Sci. 2023, 13, 12235. [Google Scholar] [CrossRef]
  15. Yan, Y.; Zhang, M.; Cao, M. Study on the Effect of Large Cross-Section Quasi-Rectangular Pipe Jacking near Side Crossing Viaduct Piles in Soft Soil Areas. Appl. Sci. 2023, 13, 9799. [Google Scholar] [CrossRef]
  16. Xu, Y.; Huang, Z.; Zhang, C.; Pang, Y.; Liu, T. Bearing Capacities and Failure Behaviors of F-Type Socket Joint in Rectangular Pipe Jacking Tunnel. Appl. Sci. 2023, 13, 5442. [Google Scholar] [CrossRef]
  17. Garnier, J.; Gaudin, C.; Springman, S.M.; Culligan, P.J.; Goodings, D.; Konig, D.; Kutter, B.; Phillips, R.; Randolph, M.F.; Thorel, L. Catalogue of scaling laws and similitude questions in geotechnical centrifuge modeling. Int. J. Phys. Model. Geotech. 2007, 7, 1–23. [Google Scholar] [CrossRef]
  18. Chambon, P.; Corte, J.F. Shallow tunnels in cohesionless soil: Stability of tunnel face. J. Geotech. Eng. 1994, 120, 1148–1165. [Google Scholar] [CrossRef]
  19. Chen, R.; Li, J.; Chen, Y.; Kong, L. Large-scale tests on face stability of shield tunnelling in dry cohesionless soil. Chin. J. Geotech. Eng. 2011, 33, 117–122. (In Chinese) [Google Scholar]
  20. Li, J.; Liu, W.; Zou, J.; Zhao, Y.; Gong, X. Large-scale model tests on face instability of shallow shield tunnels in sand. Chin. J. Geotech. Eng. 2018, 40, 562–567. (In Chinese) [Google Scholar] [CrossRef]
  21. Zhao, Y.; Gong, Q.; Wu, Y.; Zhao, Y.; Gong, X. Evolution of active arching in granular materials: Insights from load, displacement, strain, and particle flow. Powder Technol. 2021, 384, 160–175. [Google Scholar] [CrossRef]
  22. Liang, L.; Xu, C.; Chen, Q.; Chen, Q. Experimental and Theoretical Investigations on Evolution of Soil-Arching Effect in 2D Trapdoor Problem. Int. J. Geomech. 2020, 20, 06020007. [Google Scholar] [CrossRef]
  23. Zhang, M.; Dai, Z.; Zhang, X.; Wn, H.; Fu, Z. A calculation method of active limit support pressure for deep shield tunnels considering principal stress axis rotation. Chin. J. Rock Mech. Eng. 2021, 40, 2366–2376. (In Chinese) [Google Scholar] [CrossRef]
  24. Zhu, J.; Lin, Q.; Kang, Y. Research on dip angle of sliding surface of wedge model in shield tunneling. Rock Soil Mech. 2015, 36, 327–332. (In Chinese) [Google Scholar] [CrossRef]
  25. Hu, W.; Lv, X.; Huang, M. Three-Dimensional Limit Equilibrium Solution of the Support Pressure on the Shield Tunnel Face. Chin. J. Undergr. Space Eng. 2011, 7, 853–856+862. (In Chinese) [Google Scholar] [CrossRef]
  26. Wei, G.; He, F. Calculation of minimal support pressure acting on shield face during pipe jacking in sandy soil. Chin. J. Undergr. Space Eng. 2007, 3, 903–908. (In Chinese) [Google Scholar] [CrossRef]
Figure 1. Model test system.
Applsci 15 07847 g001
Figure 2. The grain size distribution curve.
Applsci 15 07847 g002
Figure 3. Normalized supporting pressure–displacement curve.
Applsci 15 07847 g003
Figure 4. Pmin variation law.
Applsci 15 07847 g004
Figure 5. The difference between Pmin and Ps.
Applsci 15 07847 g005
Figure 6. Instability process of deep soil (the sectional view from the front of the model).
Applsci 15 07847 g006aApplsci 15 07847 g006bApplsci 15 07847 g006c
Figure 7. Variations in failure angle (the sectional view from the front of the model).
Applsci 15 07847 g007
Figure 8. Contrast diagram of failure angle.
Applsci 15 07847 g008
Figure 9. Three-dimensional map of ground settlement (the planar view above the model).
Applsci 15 07847 g009aApplsci 15 07847 g009bApplsci 15 07847 g009cApplsci 15 07847 g009d
Figure 10. Settlement amount variation curve.
Applsci 15 07847 g010
Figure 11. Trapezoidal settlement surface diagram (the planar view above the model).
Applsci 15 07847 g011
Figure 12. Variations in equilibrium arch angle (the planar view above the model).
Applsci 15 07847 g012
Figure 13. Relative displacement of soil instability.
Applsci 15 07847 g013
Figure 14. Generalized diagram of instability mechanism for rectangular excavation face.
Applsci 15 07847 g014
Table 1. Parameters of the test soils.
Soil CompactnessLooseMedium-DenseDense
Relative density Dr0.2~0.330.33~0.670.67~1
Dry density ρd (g/cm3)1.53~1.571.57~1.681.68~1.80
Experimental control density (g/cm3)1.561.651.8
Internal friction angle φ (°)31.836.440
Disclaimer/Publisher’s Note: The statements, opinions and data contained in all publications are solely those of the individual author(s) and contributor(s) and not of MDPI and/or the editor(s). MDPI and/or the editor(s) disclaim responsibility for any injury to people or property resulting from any ideas, methods, instructions or products referred to in the content.

