1. Introduction
Heavy-truck driving is a physically and cognitively demanding activity that requires sustained attention, precise motor skills, and rapid response to unexpected situations [
1]. Fatigue in these drivers represents a significant risk factor for both traffic accidents and musculoskeletal disorders (MSDs) [
2,
3,
4,
5]. The leading causes include adverse ergonomic factors such as prolonged static postures, repetitive limb movements, excessive force application without breaks, and prolonged exposure to vibrations [
6,
7,
8,
9].
A strategy to reduce these risks involves implementing specific technical modifications to cabin design, as these can improve driving ergonomics, reduce vibration exposure, and minimize the physical effort required to operate the vehicle [
10]. Countries like Ecuador do not manufacture heavy-duty vehicles locally, so making substantial modifications to driving cabins is not viable due to cost-benefit considerations.
Driver anthropometry is not static but changes over time. An example is the United States, where according to Guan et al. [
11], the average dimensions of heavy-duty drivers have increased compared to 25–30 years ago. Additionally, anthropometric variability among drivers, influenced by the ethnic diversity of this profession, also plays an important role. Hispanic drivers tend to be shorter compared to their non-Hispanic white counterparts. The previous examples highlight the need to adjust the technical features of cabins to the anthropometric dimensions of drivers according to local particularities.
Considering driver anthropometric characteristics is crucial to reducing the incidence of musculoskeletal disorders (MSDs). For example, drivers with higher body mass index (BMI), one of the relevant anthropometric characteristics, experience inadequate lumbar support distribution, intensifying fatigue during long trips. Low back pain (LBP) is the most frequent MSD in driving [
3]. According to Maradei et al. [
6], 72% of drivers develop LBP after one year in the profession. Globally, approximately 37% of LBP cases relate to occupational factors, accounting for 21% of compensable work accidents and 33% of healthcare costs [
12]. On the other hand, shorter drivers may face difficulties with road visibility and access to truck controls, increasing physical and mental load during driving. Additionally, differences in limb and torso length can affect pedal and steering wheel positioning, generating more significant effort and contributing to fatigue [
13,
14,
15].
The technical characteristics of a heavy-truck cabin also influence the ergonomic performance of the drivers. For example, steering wheel tilt and turning resistance directly affect driving ergonomics and the prevalence of musculoskeletal disorders (MSDs). Ergonomic steering system designs, such as adjustable steering wheels, aim to improve driver biomechanical response and reduce muscle effort [
16,
17]. Previous studies have demonstrated that steering wheel tilt affects load distribution in arm and shoulder muscles, potentially generating excessive tension in the cervical and thoracic regions [
18,
19]. Additionally, steering wheel tilt in trucks forces drivers to adopt postures such as forward trunk flexion or lateral twists to improve visibility [
10], compromising driving ergonomics. Recent studies further highlight the importance of steering wheel tilt’s demonstrated impact on both ergonomic cabin seat design [
2] and upper-body muscle activation patterns during steering wheel operation [
20].
Similarly, steering wheel turning resistance influences upper limb muscle load; high torque can increase arm and shoulder fatigue [
21], affect vehicle control, and promote compensatory postures that increase MSD risk in the lumbar and cervical regions. Controlling both steering wheel tilt and turning resistance could help reduce MSDs among Ecuadorian drivers and provide better steering system control, helping to prevent rollovers [
22] and thereby reducing traffic accidents in Ecuador. Furthermore, De Waard et al. [
19] studied drivers’ hand positions in a driving simulator during a demanding motorway-merge task, enabling full steering-wheel visibility. Hand positions were classified into three control levels: high, medium, and low. Various traffic conditions were compared, revealing limited differences and no correlation with perceived risk or self-reported mental effort. However, shifts in hand position were linked to changes in workload demand. It is therefore concluded that hand position can provide insight into mental workload. Moreover, a validated simulation model was developed by Pfeffer et al. [
23] to analyze vehicle–steering system interaction for on-center handling. Key parameters were altered to assess their effect on steering torque, steering feel, and understeer. Results emphasize the importance of an accurate steering system model. Improvements to center feel include a stiffer torsion bar, higher cornering stiffness, or lower steering ratio, although increasing trail worsens response. Steering rack friction mainly degrades response and column friction reduces center feel, while a stiffer torsion bar lessens understeer tendency. Furthermore, prolonged vibration exposure contributes to muscle fatigue and may compromise driver spinal health [
24,
25]. Bronson Boi Du et al. [
9] investigated whether reducing whole-body vibration (WBV) affects driver vigilance and discomfort. A crossover design with five truck drivers compared active and passive suspension seats during 10 h shifts. WBV exposure, discomfort, and reaction times were assessed pre- and post-shift. Active suspension significantly reduced WBV, lower back and forearm discomfort, and reaction time deterioration.
Also, surface electromyography (EMG) was used in the study developed by Perchthaler et al. [
8] to analyze the effects of whole-body vibration (WBV) on trunk and neck muscle activity under varying peak-to-peak displacements and knee angles. Twenty-eight healthy adults performed static squat exercises on a vibration platform. WBV significantly increased muscle activation, particularly in the back. Displacement and vibration conditions were statistically significant factors. These results contribute to optimizing safe and effective WBV protocols for upper-body training. Furthermore, Thamsuwan et al. [
26] assessed whole-body vibration (WBV) exposure in two types of urban buses: a high-floor coach and a low-floor city bus. Both vehicles were driven along a standardized test route including new and deteriorated highways, city streets, and speed bump segments. Vibrations were measured following [
27] ISO 2631-1 and [
28] 2631-5 standards.
The high-floor bus showed greater WBV exposure, particularly on speed bump sections. Additionally, the seats provided minimal vibration attenuation, highlighting the need to improve seat design and suspension systems. In this context, the redesign of heavy-duty truck cabins must consider the current anthropometric differences of drivers in Ecuador, as these directly influence fatigue and driving ergonomics. Therefore, this study investigates how three technical factors—steering wheel tilt, torque, and cabin vibration frequency—affect driver posture in order to propose minor adjustments to enhance ergonomic performance for drivers in this transport sector in Ecuador.
2. Materials and Methods
The research team designed and built a simplified heavy-load transport cabin, replicating the working conditions under which drivers travel on the roads. The researchers used the cabin to evaluate how technical factors influenced the postures adopted by drivers, with a sample size of . The design and construction followed a user-centered approach, using perception surveys and in situ measurements of cabin dimensions. This study focused on evaluating three technical factors in heavy-duty cabins that have the potential to cause MSDs among drivers in Ecuador: (1) steering wheel tilt, (2) steering wheel torque, and (3) cabin vibration. These three technical factors were determined as key considerations for design analysis, based on a survey conducted with 22 heavy-duty vehicle drivers at their worksites. Based on this, the study’s hypothesis states that the three technical factors influence the postures adopted by heavy-vehicle drivers, which, in turn, may affect their musculoskeletal health.
All participants in the experiment provided informed consent prior to participation and The Escuela Politécnica Nacional Ethics Committee approved the experimental protocol. The sample was relatively homogeneous in terms of experience, age, health status, and anthropometric characteristics. Specifically, participants had between 0 and 5 years of driving experience. The average age was 23 years with a standard deviation of 2 years. Regarding health status, no participants reported any pre-existing conditions beyond normal fatigue. Anthropometric measurements showed an average height of 171.13 6.81 cm and an average weight of 69.82 11.29 kg. These factors ensured a consistent participant profile across the study.
This work used video analysis of drivers’ motor gestures during regular transit to collect data on their road behavior. With the video recordings and survey results, the team researched and designed an experimental protocol, considering both heavy-vehicle operation’s kinematic and dynamic characteristics. This study emphasized kinematic analysis and EMG signals from the arms, forearms, thighs, torso, and head for the body parts, and the upper trapezius, middle trapezius, triceps brachii, quadriceps, and gastrocnemius for the muscles. During the protocol execution, the 16 participants replicated the movements of professional heavy-load truck drivers during their work shifts.
2.1. Design of the Experimental Protocol
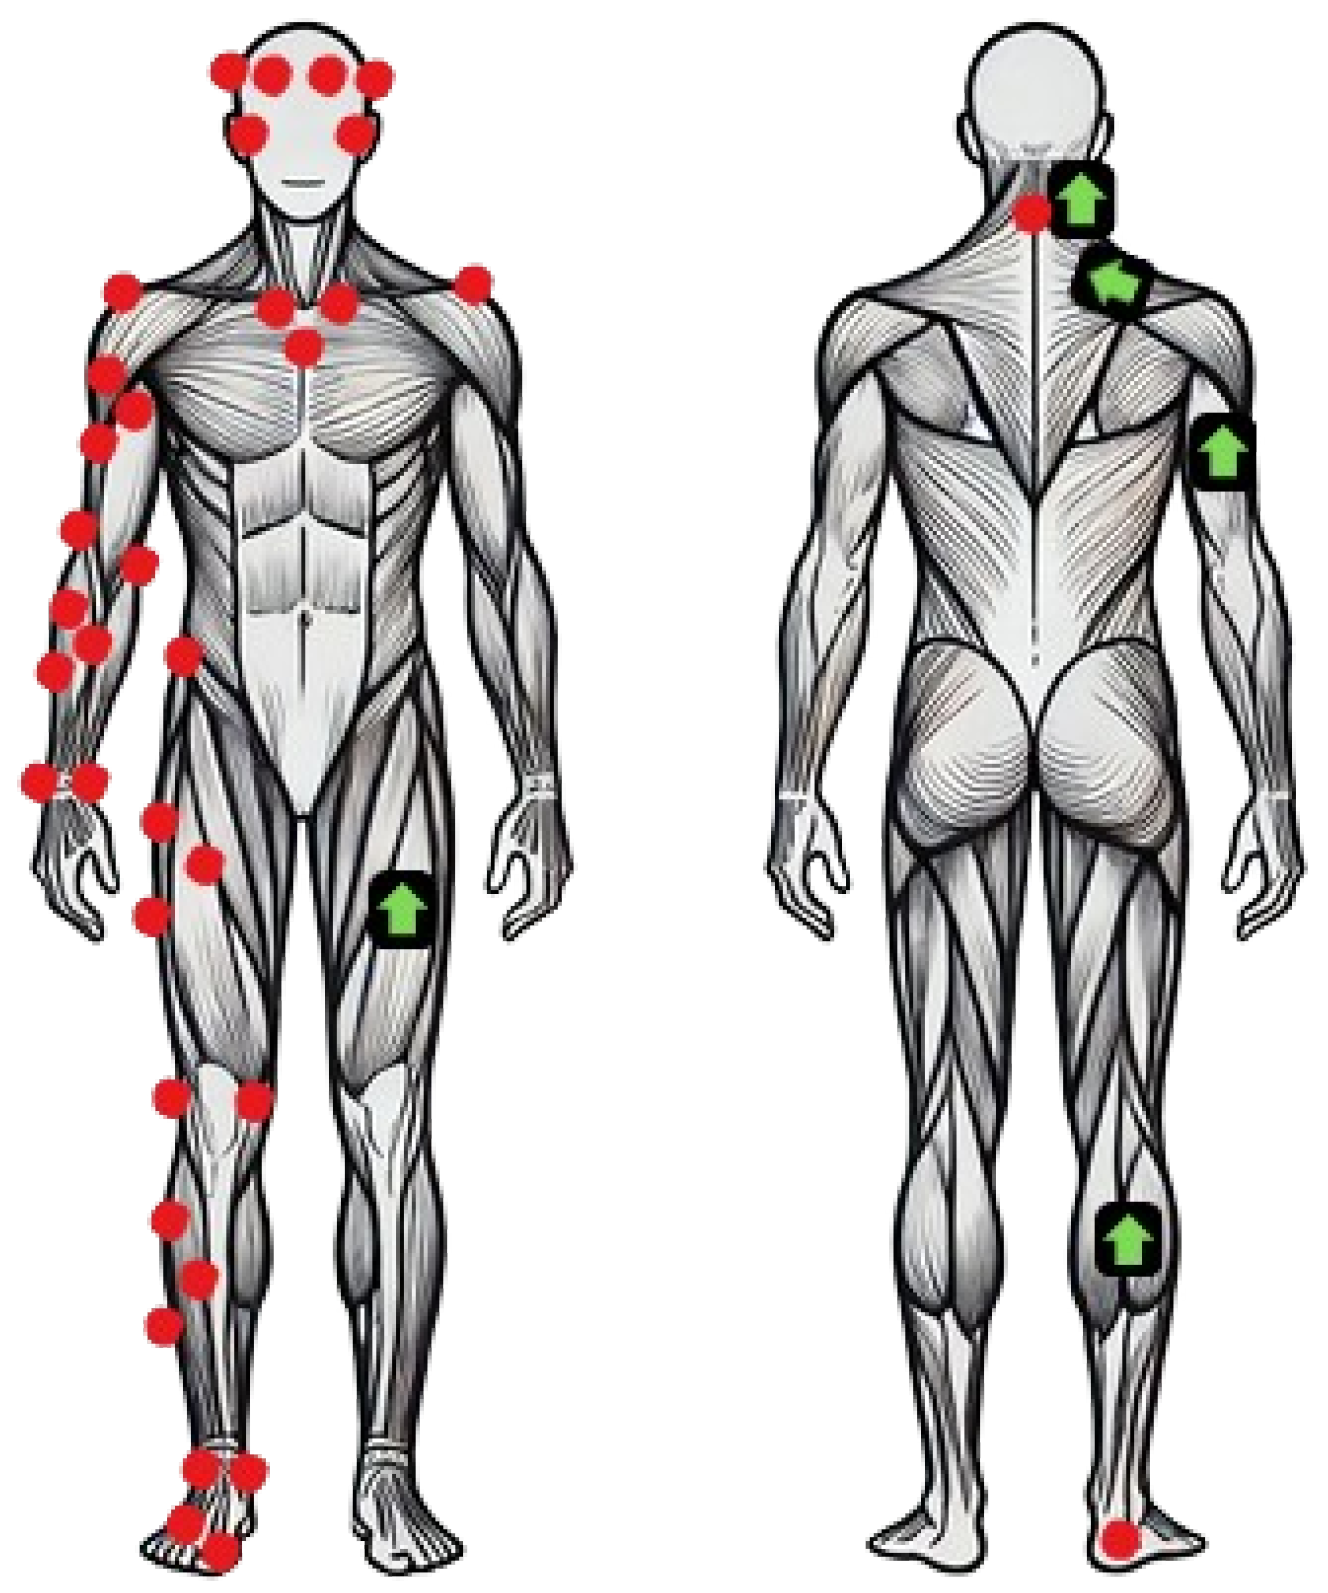
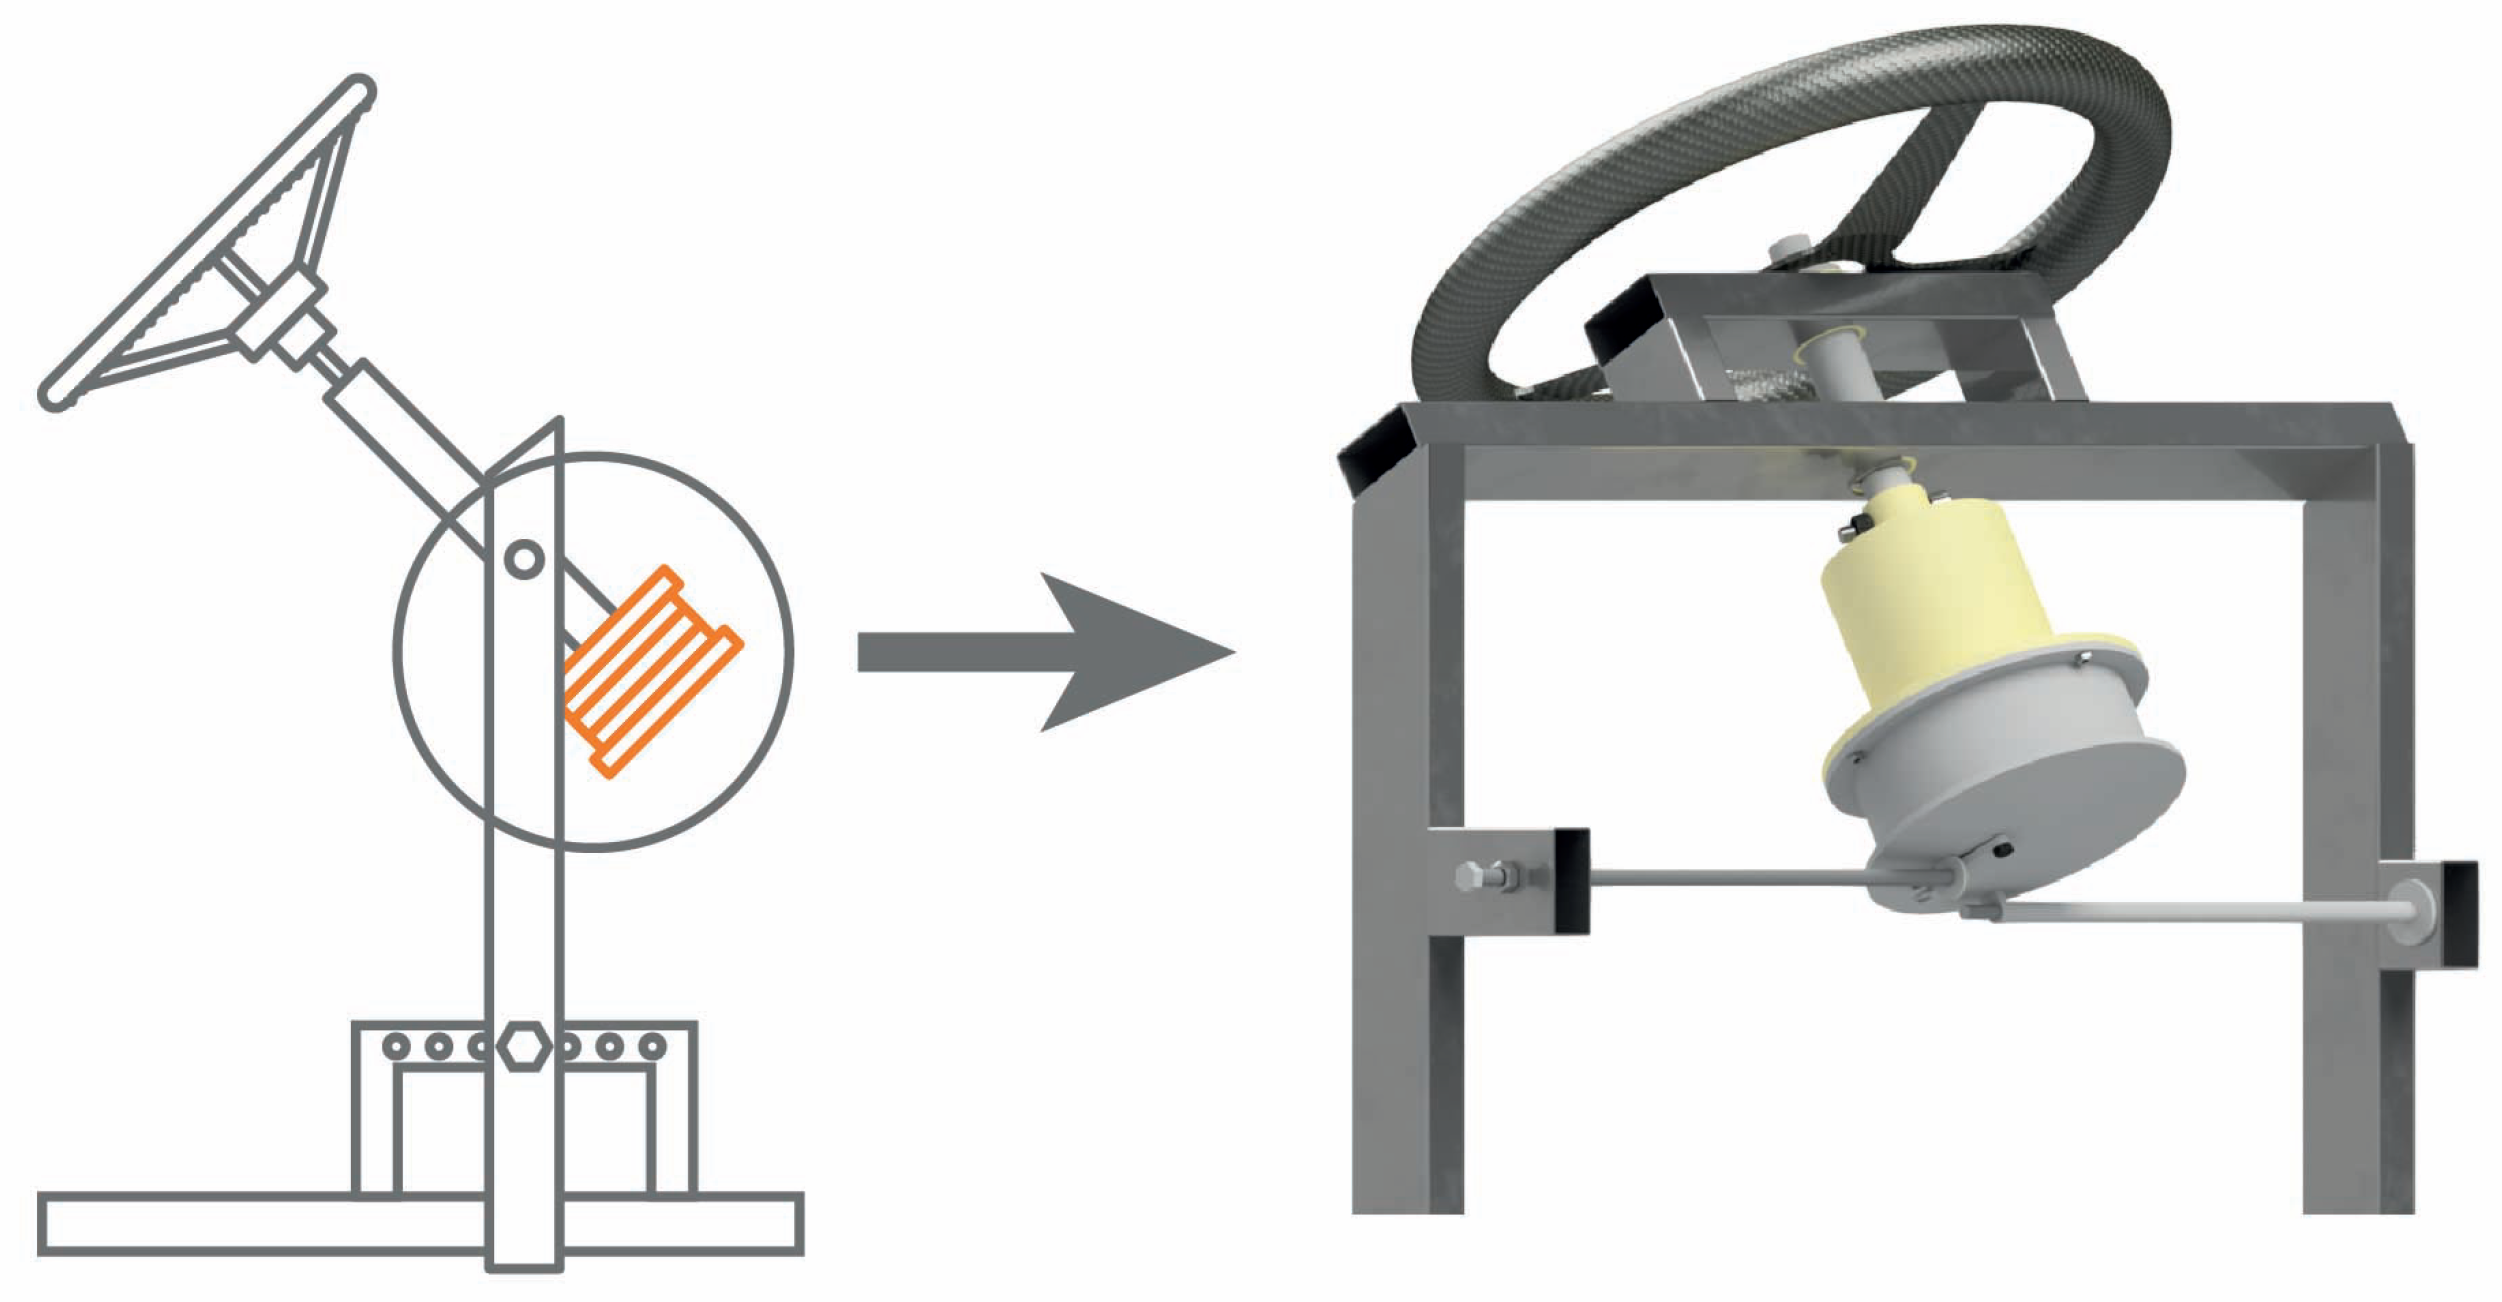
The protocol began with instrumentation of the participant using 36 reflective markers and five inertial measurement unit (IMU) sensors with EMG tracking, as shown in
Figure 1. The instrumentation procedure aligned the Delsys
® Trigno Avanti
® IMUs, Delsys Inc., Natick, MA, USA with the longitudinal muscle fibers of the upper trapezius, middle trapezius, triceps brachii, quadriceps, and gastrocnemius muscles to record electromyographic (EMG) signals during protocol execution. Prior to sensor placement, the skin was prepared by shaving (if necessary), lightly abrading, and cleaning the area with alcohol wipes to reduce impedance. The Trigno Avanti
® sensors feature built-in electrodes with a parallel bar configuration. All sensors were secured according to the manufacturer’s guidelines to ensure stable and high-quality signal acquisition.
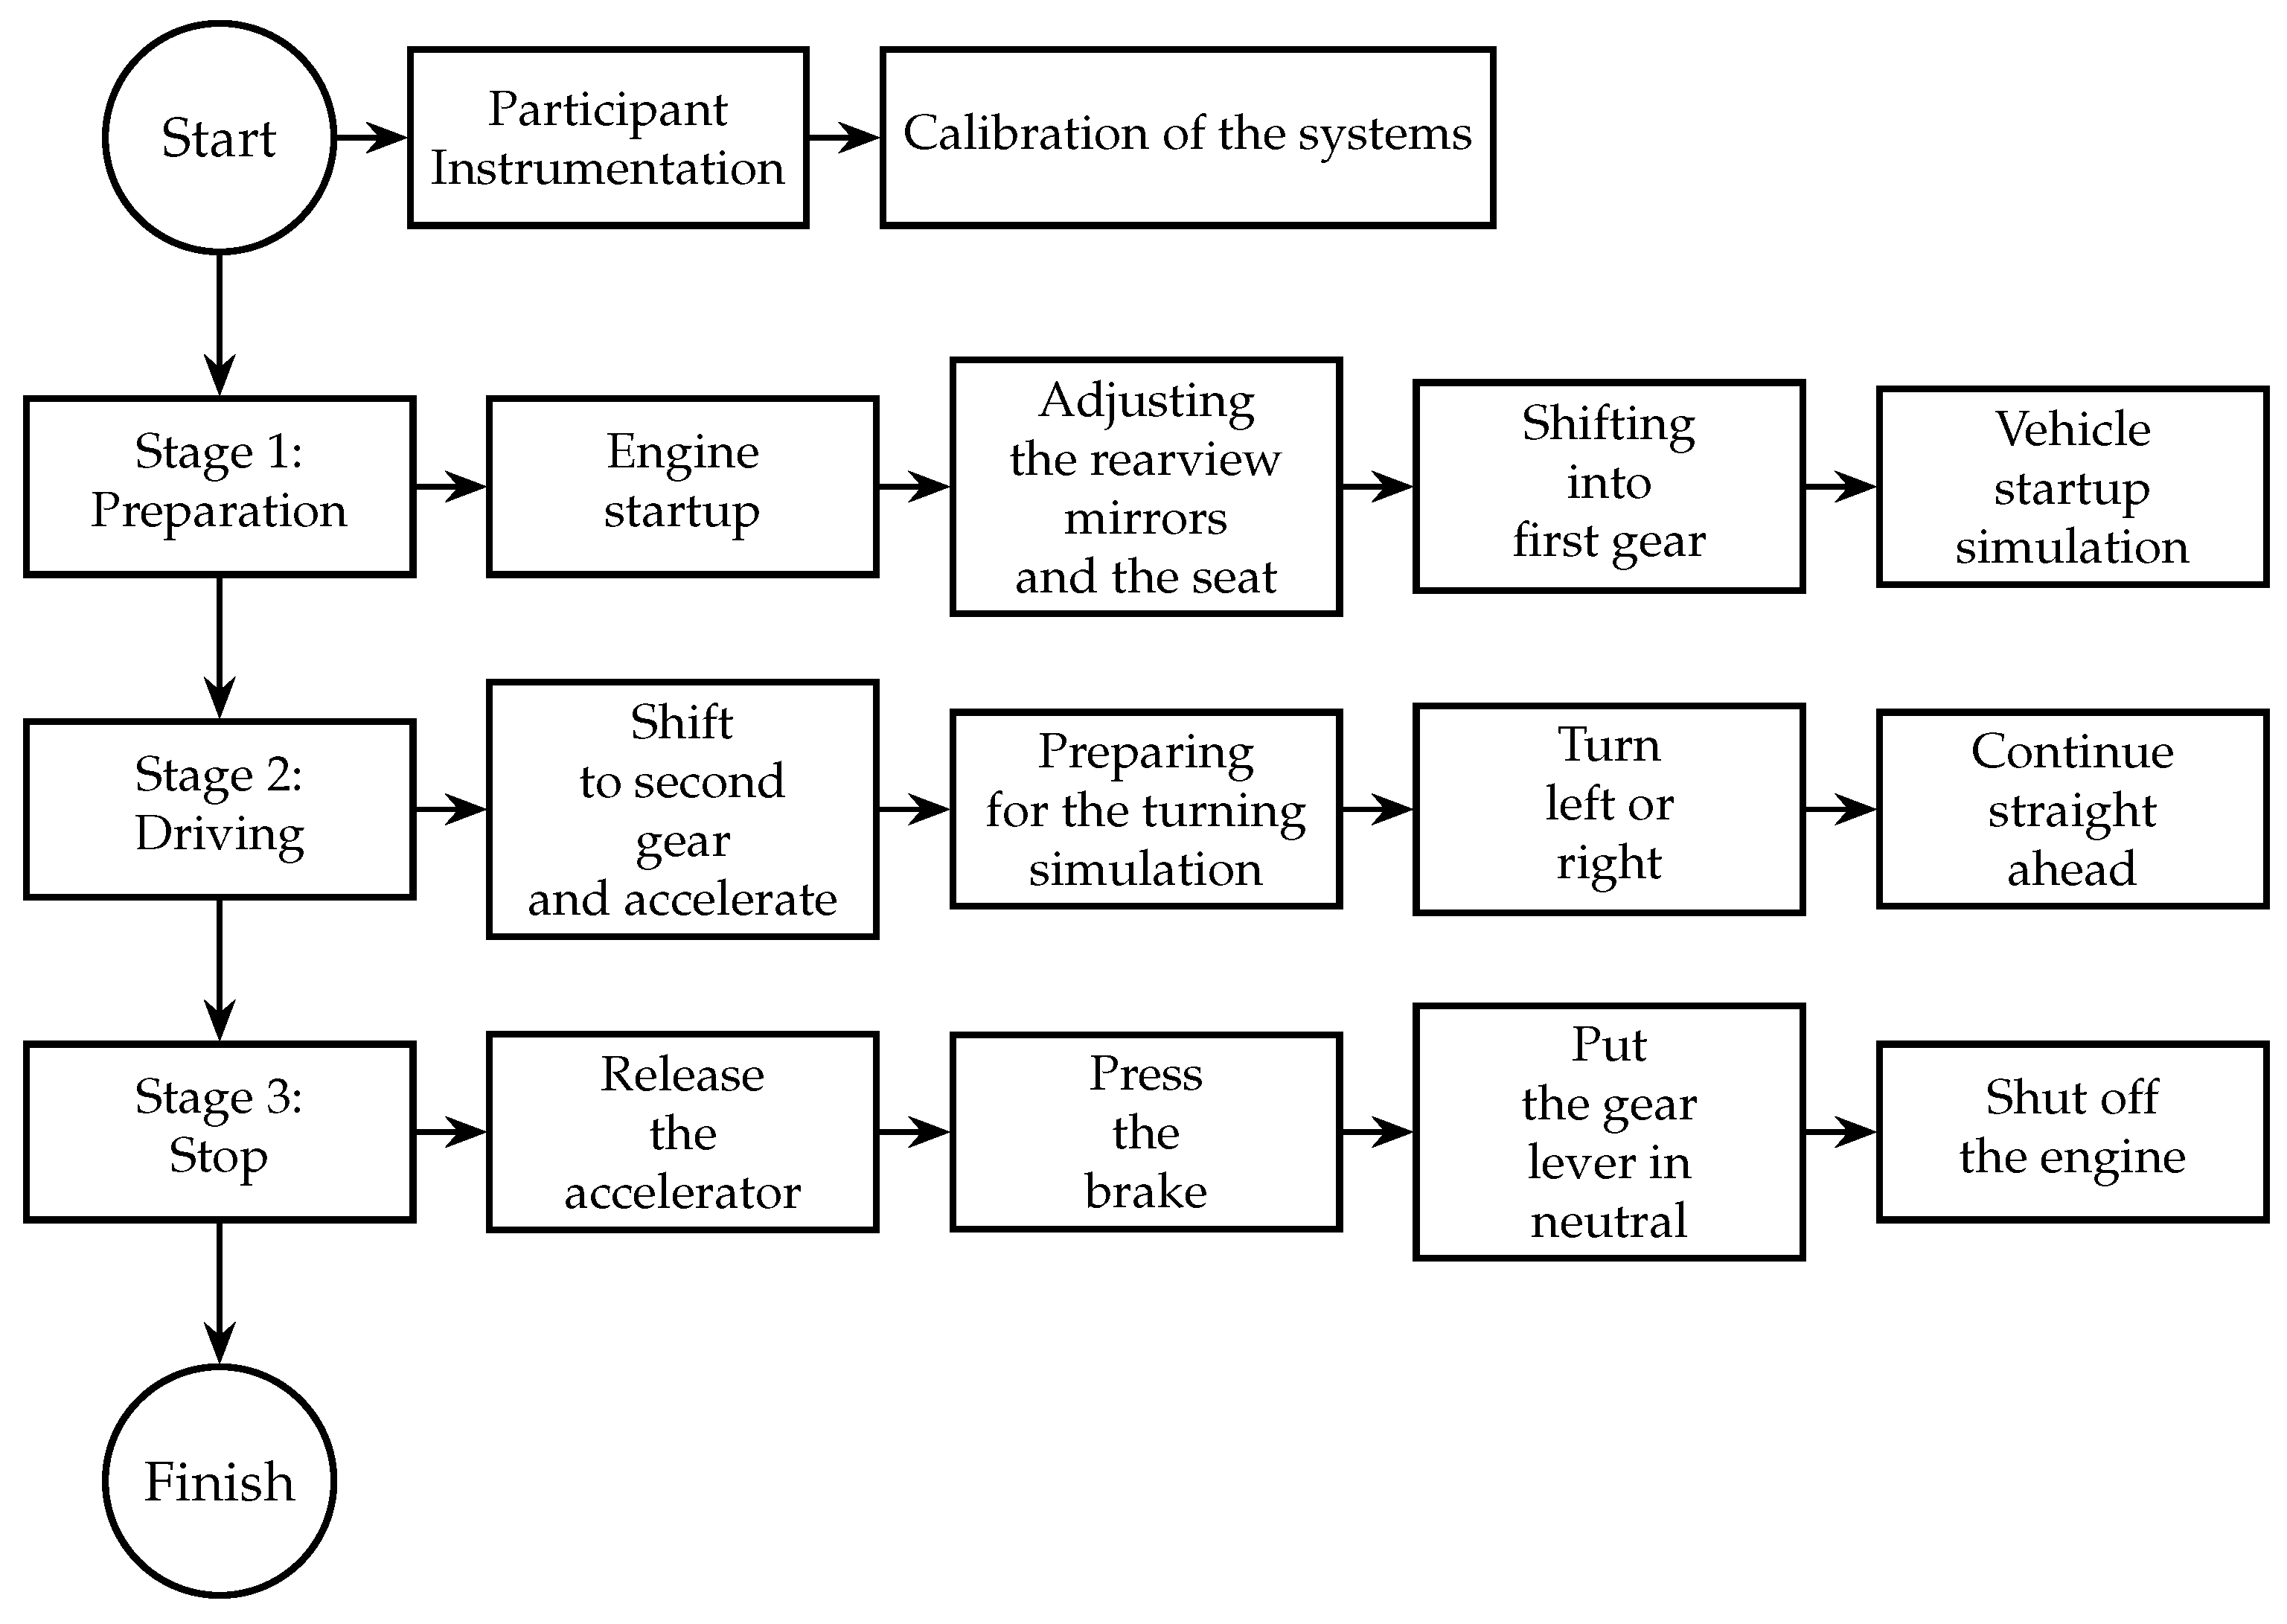
After the on-site observation and audiovisual recording of truck drivers performing their daily professional activities, the following protocol, which is composed of three stages, was defined.
In the first stage, the participant starts the engine and checks the dashboard indicators. Subsequently, they adjust the rearview mirrors and the seat, emulating drivers’ actions to ensure proper visibility and comfort. Next, the participant shifts the gear lever into the first gear and presses the clutch pedal to set the vehicle in motion. This phase simulates the driver’s initial preparation.
In the second stage, the participant shifts to second gear and accelerates. Since Ecuadorian roads are often winding, the protocol includes two turns. The first is a left turn, and the second is a right turn. During these maneuvers, the participant checks the mirrors and returns the steering wheel to its neutral position before continuing straight ahead until the next turn.
The third stage of the protocol replicates the necessary actions to bring the vehicle to a stop upon reaching the destination. In this stage, the participant gradually releases the accelerator, presses the brake pedal, shifts the gear lever to neutral or park, and turns the key, thus completing the stopping process. The protocol takes approximately 120 s.
Figure 2 shows the set of stages in the protocol. The cabin remains static, with only the steering wheel, pedals, gear lever, and mirrors moving.
2.2. Fabrication of the Simplified Test Cabin
The simplified cabin enables control of steering wheel tilt, steering torque, and vibration frequency. Its design is based on data collected through in situ surveys administered to drivers from two Ecuadorian companies specializing in heavy-load transportation. The researchers also performed dimensional measurements of actual cabins and conducted on-site photogrammetric analysis. This article details its general construction and dimensions to facilitate replication.
The structure consists of carbon steel profiles and aluminum panels, enabling accurate replication of real operational conditions.
Figure 3 illustrates the profile configuration.
The suspension system consists of four linear springs positioned at the corners of the cabin. The seat, sourced from a heavy-duty truck, remains unmodified, as surveys indicate that drivers consider it comfortable and adjustable to their ergonomic needs, eliminating the necessity of manufacturing a custom one. Additionally, the cabin incorporates brake and clutch pedals, whose retraction is achieved through helical springs, one per pedal, as shown in
Figure 3.
Figure 4 displays the 3D model of the cabin with the participant, the markers, and the global reference system. For the kinematic analysis of postures, a global Cartesian reference system was established, with its X- (longitudinal), Y- (lateral), and Z- (vertical)-axes serving as the basis for angle evaluation (see
Figure 4a). Furthermore, a participant with reflective markers was included in the actual cabin (see
Figure 4b).
2.2.1. Vibration Design of the Cabin Module
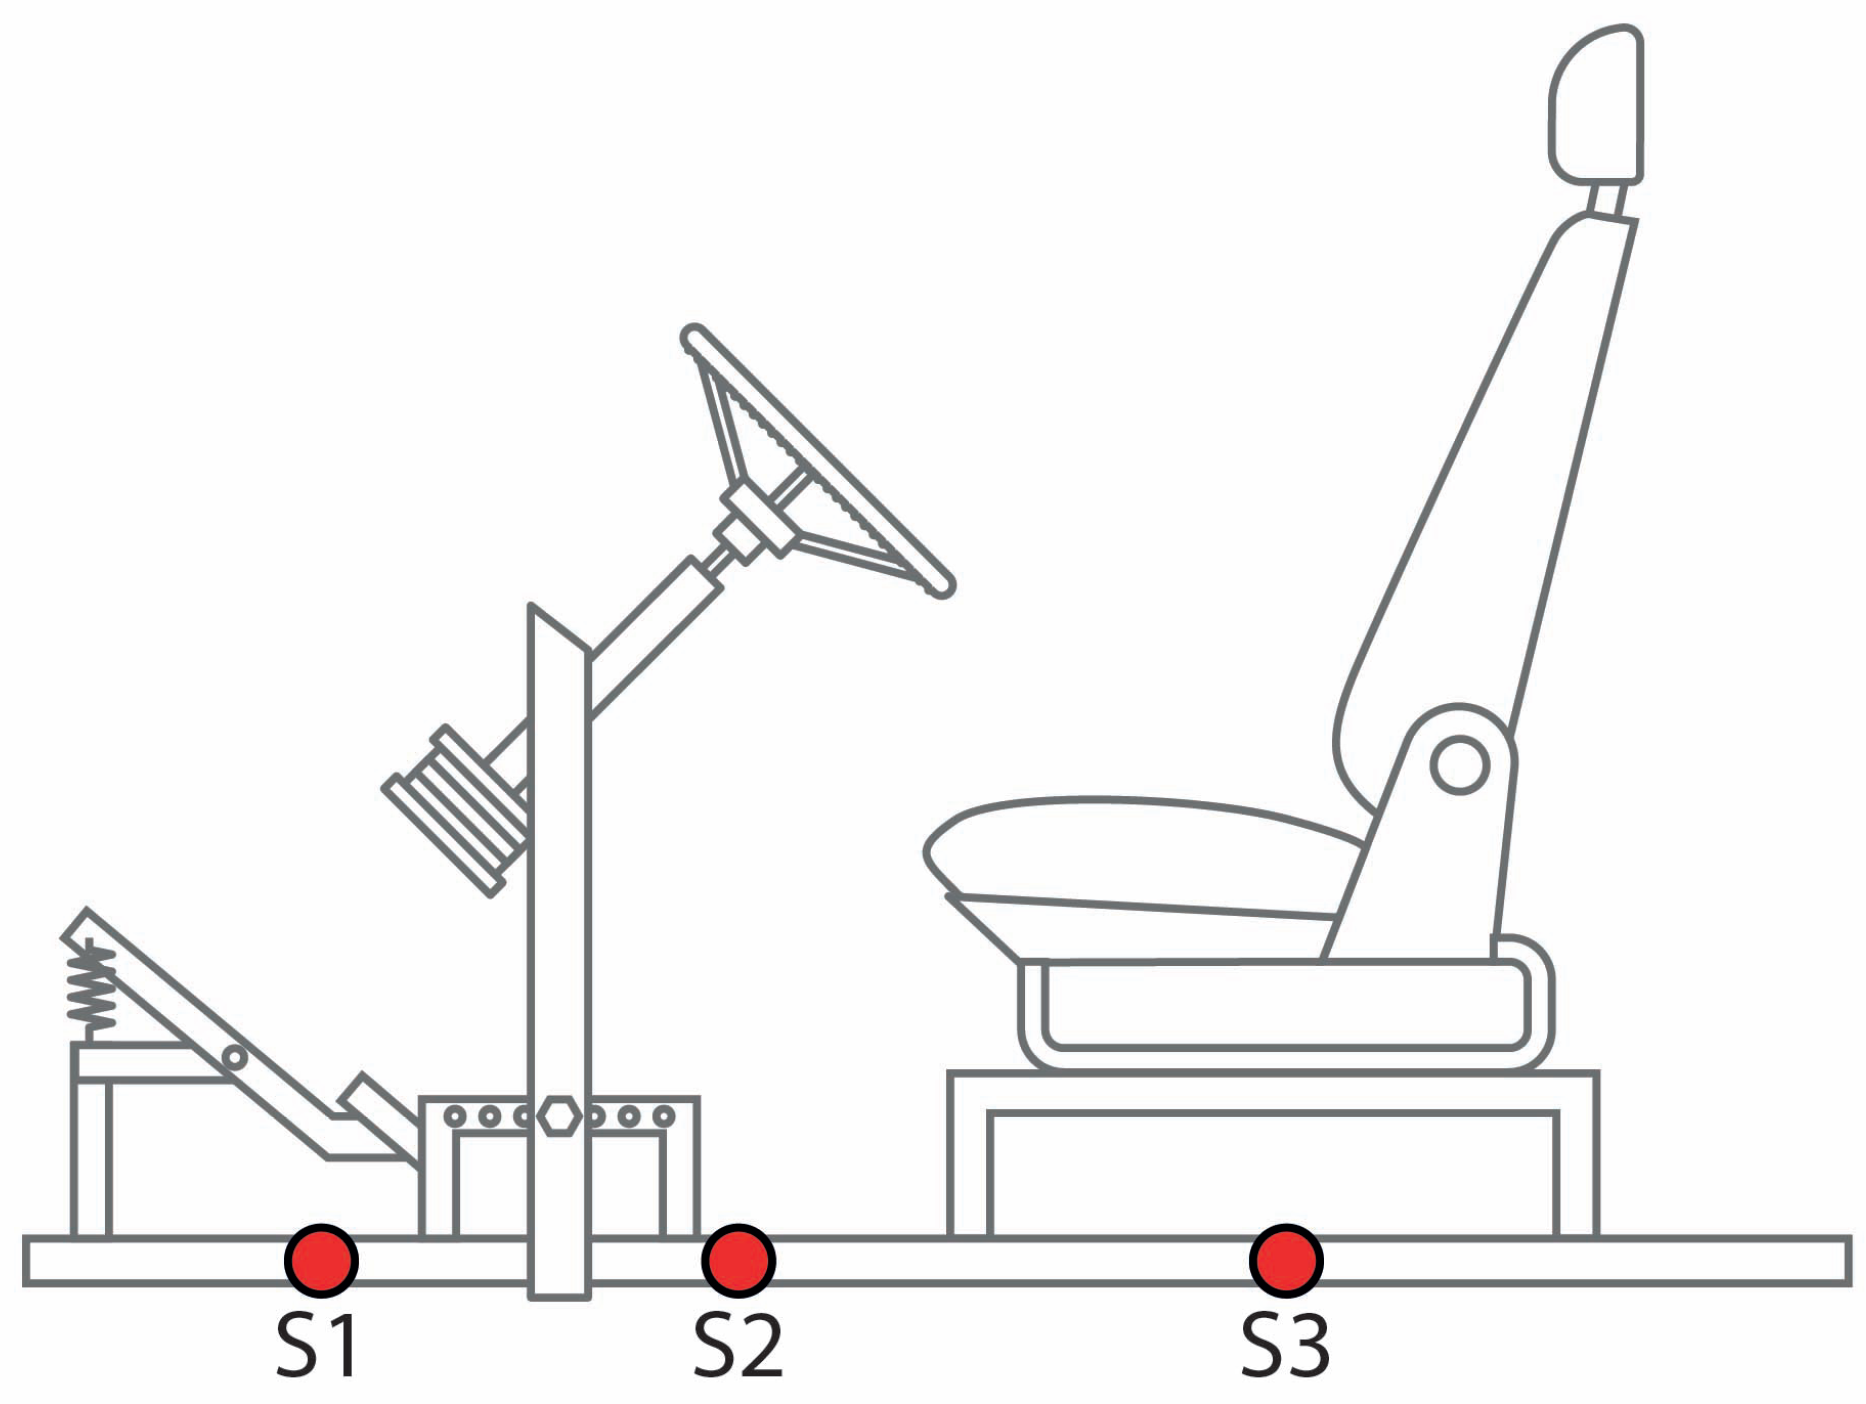
A modal analysis in ANSYS
® software, version 2024 R2 determined the operational vibration range of the cabin, considering fixed boundary conditions at the structure’s base. The analysis identified that the vibration modes fell within a range of 0 to 35 Hz, which prevents structural resonance phenomena within the operational range. Piezoelectric sensors connected to an SVAN 958A vibration analyzer, SVANTEK, Warsaw, Poland performed experimental measurements to validate the modal analysis. The sensors were placed at the cabin’s base and seating area, as illustrated in
Figure 5. An unbalanced mass motor installed at the base induced the vibration, which excited the entire system (see
Figure 4a). By comparing the simulation results with experimental data, two representative values for vibration frequency were shown: 9.5 associated with a low or ergonomic level, and 12 Hz, corresponding to an elevated level.
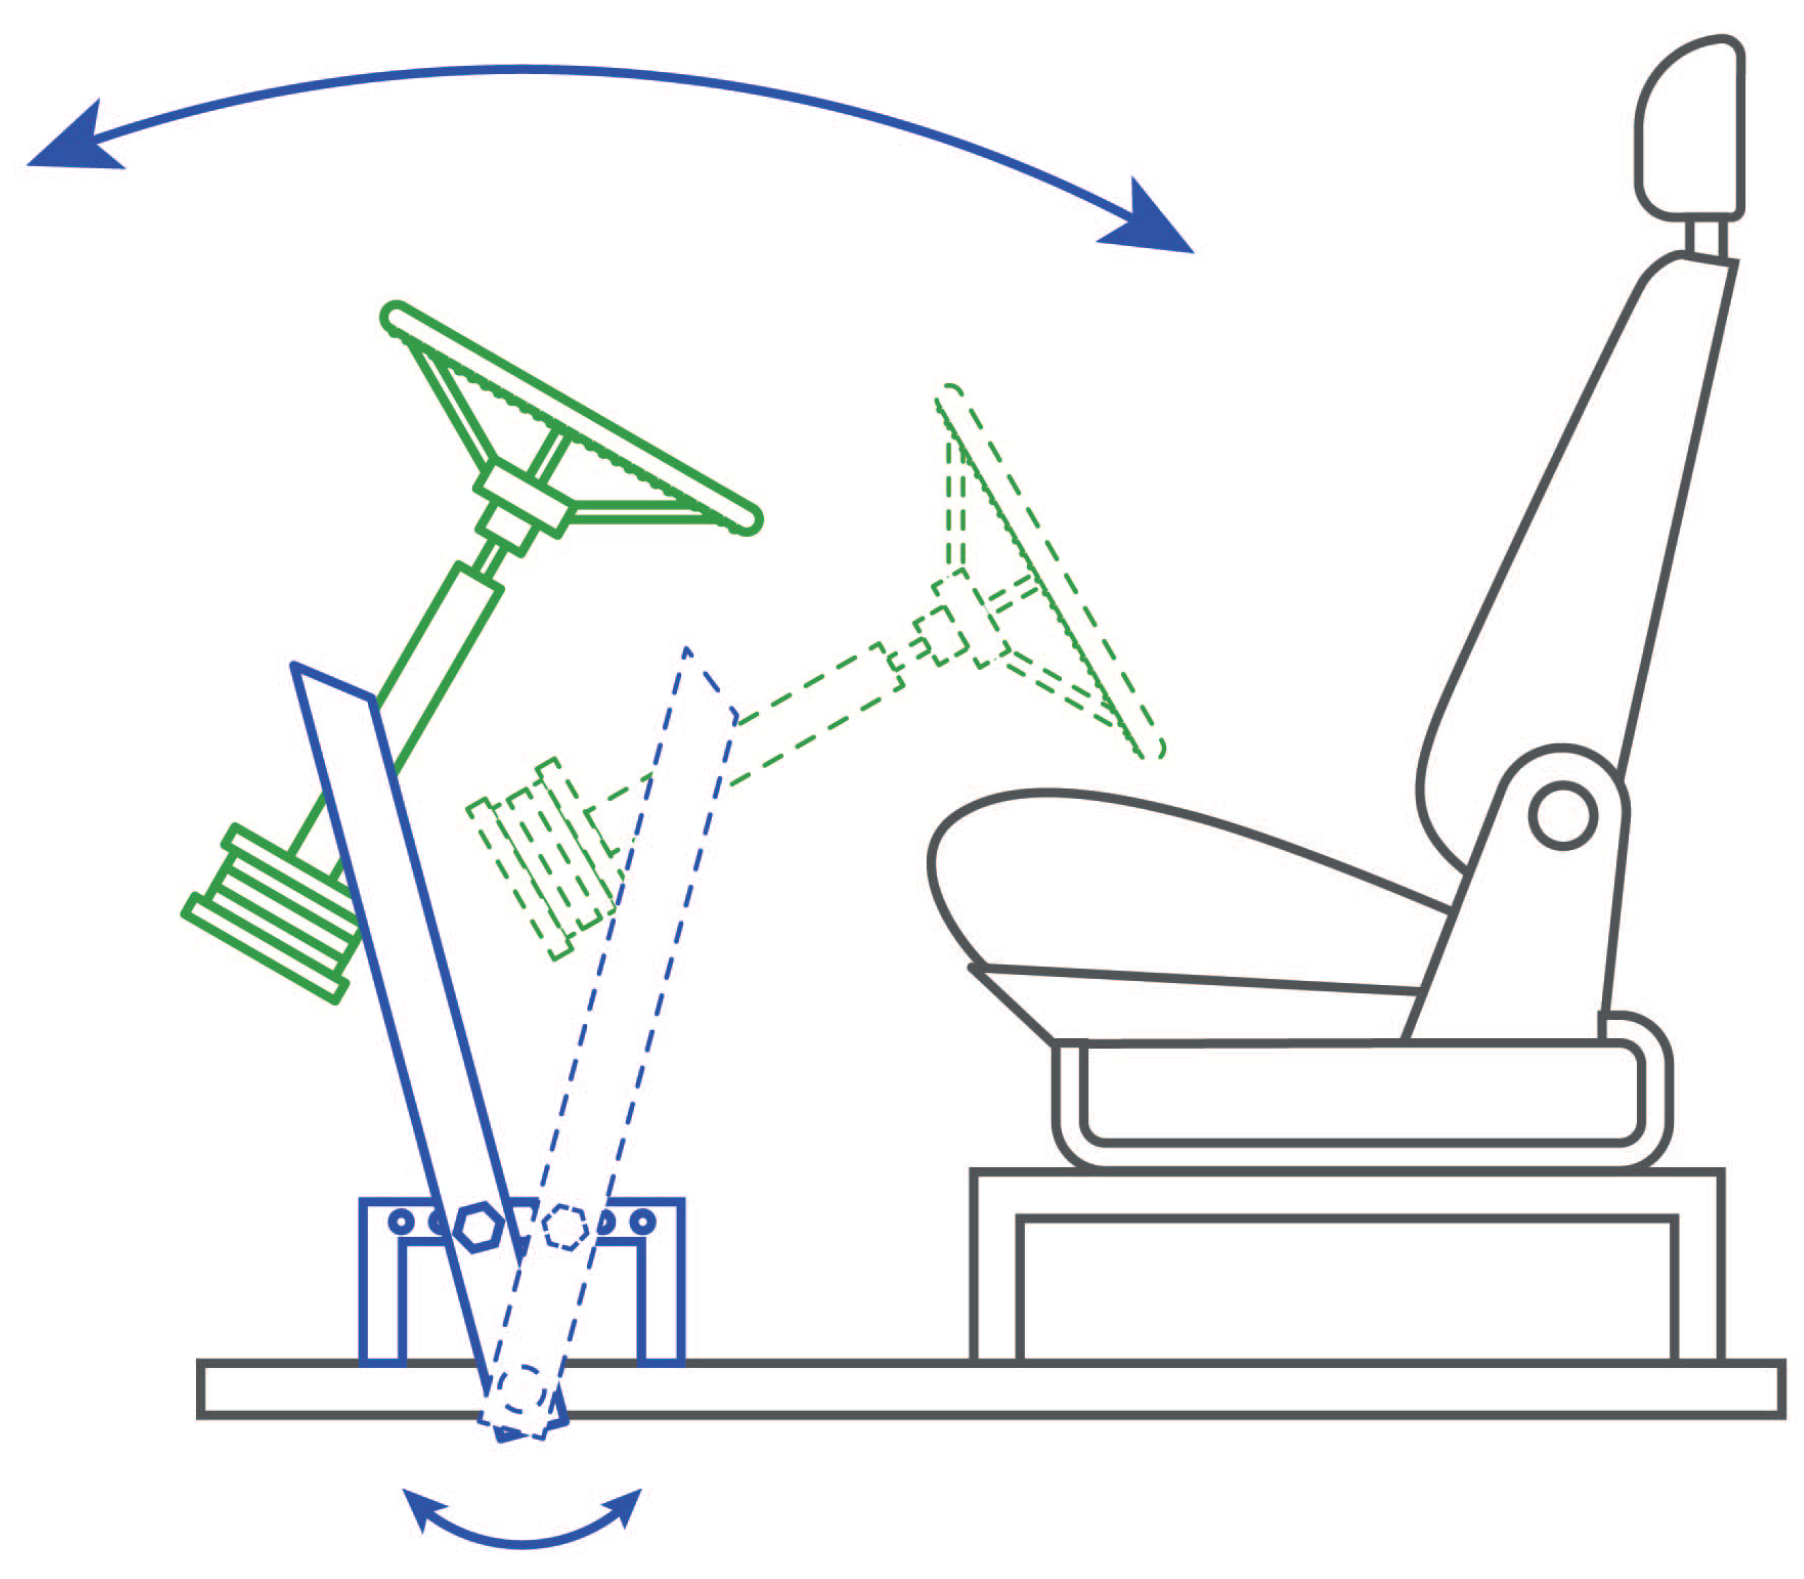
2.2.2. Design of the Steering Wheel Tilt Mechanism
The study designed a steering wheel tilt mechanism to evaluate driver postures. The system consisted of a semicircular guide with locking bolts combined with pivoting support, enabling manual adjustment of the steering wheel inclination, as shown in
Figure 6. The tilt range was between 55 and 65°, consistent with in situ measurements. Measurements indicated that the average steering wheel angle in the heavy-duty vehicles was 63°, with a minimum of 53° and a maximum of 73°. The design incorporated ergonomic recommendations suggesting that the driver’s arms maintain a neutral posture, avoiding hyperextension or excessive flexion, which was validated using a goniometer. Experimental tests verified the functionality and accuracy of the tilt mechanism by manually adjusting the steering wheel inclination and measuring the angles with a digital goniometer. Additionally, the study measured the distance between the seat and the dashboard, establishing an average value of 770 mm to ensure optimal driver accessibility without compromising system ergonomics.
2.2.3. Steering Wheel Torque Mechanism Design
During heavy-duty vehicle operation, road surface irregularities require drivers to apply varying force levels to the steering wheel. Therefore, the experimental cabin implemented a torque modulation system that adjusted the steering wheel rotation resistance within a 3 to 6 Nm range. The system employed a modified drum brake as its primary mechanism (
Figure 7). An adjustment screw displaced a washer against an internal cam to regulate resistance. This cam actuated the brake shoes, increasing friction within the drum. By modifying the frictional force, the system controlled the resistance level the driver perceived during steering maneuvers.
The team conducted experimental tests using a tangential dynamometer coupled to the steering wheel to validate that the system operated within the range of 3 to 6 Nm. The generated torque was calculated based on the measurement of the applied force and the perpendicular distance from the application point to the center of the steering wheel. The results confirmed that the system operated within the established torque range.
2.3. Statistical Analysis
2.3.1. Statistical Analysis of Technical Factors
A
factorial design was used with three factors: steering wheel inclination, steering wheel torque, and motor vibration frequency. Each factor has two levels: one labeled ergonomic and the other labeled high. For steering wheel inclination, 55 corresponds to the ergonomic level and 65° to the high level. For steering wheel torque, 3 represents the ergonomic level, and 6 Nm is the high level. Finally, for motor vibration frequency, 9.5 corresponds to the ergonomic level and 12 Hz to the high level. Since each of the three factors has two levels (
), the factorial design generates
experimental scenarios. The researchers labeled these experimental scenarios from P0 to P7.
Table 1 shows how each factor varied between its two levels in each trial.
For each of the 16 participants, the researchers randomly selected four of the eight available trials without repetition, ensuring that the trial with the ergonomic value P0 was included in all assignments (see
Table 2).
The Analysis of Variance (ANOVA) method was employed, and statistical significance was defined as . The dependent variable, called postures, represents the rotation angle of each body segment along each axis during the implementation of the protocol. The rotation angles are defined as follows: Rotations about the X-axis correspond to abduction–adduction movements, the Y-axis to flexion–extension movements, and the Z-axis to internal and external rotation movements. The analyzed body segments include the head, spine, arm, forearm, and thigh. On the other hand, the independent variables correspond to the technical factors: inclination, steering wheel torque, and cabin vibration frequency.
The posture data were normalized using the Z-score method to compare the results obtained from the different participants. This process involves transforming the original data into a standard scale, where each value is expressed in terms of its distance from the mean, measured in standard deviation units. Thus, comparing postures becomes easier, regardless of differences in measurement units or data distribution, by applying Equation (
1).
where
represents the normalized value (Z-score),
is the original value of the variable,
is the mean of the variable, and
is the standard deviation of the variable.
A code developed in MATLAB 2024a
® was used to process the data. The ANOVA method allowed for a cross-analysis of variables using the ANOVAN function. The code generated a matrix for each factor: one for the motor’s vibration frequency, another for the steering wheel torque, and one more for the steering wheel inclination. Additionally, it included the subject variable. The code used binary categorical variables (0 and 1) for data recording.
Table 2 shows that each participant performed four tests. Furthermore, according to
Table 1, in each test (except P0), at least one factor reached a high value. The code encoded the variables by assigning a value of 0 when the factor stayed within its ergonomic value. It assigned a value of 1 when the factor reached a high level during the test. As a result, the torque, inclination, and frequency matrices have a size of 64 × 1 since there are four tests for each of the 16 participants, and their values are logical (0 and 1). The subjects variable is 64 × 1, where each of the 16 participants repeats 4 times.
The rotation angles of the head, spine, arm, forearm, and thigh were analyzed along the three rotational axes using the set of 36 markers placed on the body. The analysis used Euler angles (pitch, roll, and yaw), which were calculated using the laboratory’s global reference system. These angles were obtained through tracking performed in the Kinescan/IBV® software, v2014 which provided the rotation values for each axis and each human body segment. The posture matrices were 64 99, corresponding to 4 trials for each of the 16 participants, with 99 data points recorded per trial.
2.3.2. Statistical Analysis of the Anthropometric Factor
During the application of the experimental protocols, anthropometric data were recorded, including the height and length of the head, trunk, arm, forearm, and thigh, as well as the weight of each participant. Based on these data, Equation (
2) was used to calculate the mass index.
where
represents the mass of the segment in kilograms (kg), and
corresponds to the length of the body segment in centimeters (cm). Therefore, the mass index (
) has units of
.
Calculating the segment masses used regression equations to estimate the volume of each segment. These equations take height and weight as the input parameters and follow the general pattern given in Equation (
3).
The coefficients
,
, and
depend on the segment analyzed, and their values come from McConville et al. [
29]. Using the density values of each body segment from D.A. Winter [
30], Equation (
4) was applied to determine the masses of each segment in kilograms (kg). Subsequently, an ANOVA was performed between the posture variables and the mass index, considering only the postures under the ergonomic condition (
).
2.3.3. Statistical Analysis of EMG Signals
The analysis focused on the following muscle groups: the upper trapezius, middle trapezius, triceps brachii, quadriceps, and gastrocnemius. The Trigno Avanti sensor was positioned longitudinally along the participant’s muscle fibers. Each participant had four EMG signals recorded during the four tests performed (see
Table 2). The signals were normalized using Equation (
1). Z-score normalization was selected over traditional methods such as Maximum Voluntary Contraction (MVC) normalization because this study sought to compare postural and muscle activation patterns across various technical conditions and among participants with diverse anthropometric characteristics. By using Z-score normalization, individual baseline differences are accounted for, enabling more meaningful comparisons. Given the experimental setup—simulating truck-driving tasks in a laboratory environment—Z-score normalization is more appropriate than MVC testing. This is because the focus is on relative changes in muscle activation related to technical factors, rather than on measuring absolute muscle strength.
Analysis of the curve distribution revealed low data dispersion; therefore, a process was used to calculate the average of the four tests for each participant. The analysis extracted the average curve’s 10th, 50th, and 90th percentiles. The 10th percentile corresponds to the static phase, the 50th percentile represents the mean value, and the 90th percentile reflects the peak signals.
3. Results and Discussion
3.1. ANOVA Between Postures and Anthropometric Factors
In
Table 3, a significant relationship is observed (
) between the head mass index and the lateral movement of abduction–adduction of the head, within a range of
8.12 to
2.18°. The result suggests that the head mass index influences the amplitude of lateral head movement within this interval. Lateral head rotation is associated with improved visual field, crucial for attention during driving tasks. Furthermore, since only the steering wheel rotates and not the entire vehicle in the experimental protocol, this lateral head movement could be interpreted as an habitual response or a compensatory pattern that drivers adopt in response to the centrifugal force generated during steering wheel rotation. Notably, the absolute range of movement is 5.94°, indicating that lateral movements are not extensive. However, the fact that the range of movement is represented as negative values suggests a preferential tendency to rotate the head toward one specific side, which may imply that some drivers develop asymmetric movement patterns that, over time, could affect posture and performance. On the other hand, a statistically significant relationship was observed between the spine mass index and the flexion–extension movement of the trunk, within a range of
0.38 to 6.99°. The result suggests that, within this interval, the spine mass index influences the forward inclination of the trunk, which could be interpreted as a strategy to improve comfort and visibility during driving under the evaluated conditions. This result is in accordance with Maradei et al. [
6], who highlighted that spinal flexion–extension—quantified through seat tilt—affects the perception of both comfort and visibility.
3.2. ANOVA: Postures and Driving Factors
In
Table 4, steering wheel inclination is the most highlighted dependent variable, significantly influencing trunk and arm movements. This aligns with the study by Halder et. al. [
2], which highlighted steering wheel clearance as a critical factor in the assessment of driver comfort within heavy truck cabins. Specifically, for the trunk, flexion–extension presented a range of
13.56 to 16.99° (30.55° absolute), while external–internal rotation had a smaller range of
5.17 to 3.31° (8.48° absolute). For the arm, flexion–extension showed a more restricted range of 33.09 to 37.70° (4.61° absolute), while external–internal rotation exhibited much greater variability, with values between
31.1 and 19.7° (50.80° absolute). These results suggest that changes in steering wheel inclination may be more closely related to postural adjustments of the trunk and arm, possibly in response to the need to maintain vehicle control and compensate for the ergonomic driving demands.
Subject variability significantly influenced head movements, particularly abduction–adduction and external–internal rotation. For abduction–adduction, the observed range was 10.46 to 12.11° (22.57° absolute), while external–internal rotation presented two distinct patterns: one with a range of 25.69 to 3.25° (28.94° absolute) and another more restricted range from 24.40 to 33.81° (9.41° absolute). These differences may be associated with individual biomechanical factors, such as the head mass index, which has been shown to influence the abduction–adduction angle. The results suggests that specific physical characteristics of the subjects could condition their range of movement, possibly in response to the need to adapt posture to improve visibility of the road and vehicle controls.
Steering wheel torque significantly influenced arm movements, suggesting that drivers adjust their posture to compensate for its effect. Specifically, external–internal rotation of the arm presented a range of 30.49 to 6.77° (23.72° absolute), indicating considerable variation in joint posture when interacting with the steering wheel. This finding highlights the significant relationship between steering wheel torque and arm biomechanics, suggesting that drivers modify their joint alignment to maintain control, which could contribute to fatigue in the upper limbs during prolonged driving.
Vibration frequency significantly correlated with the flexion–extension movement of the forearm in the sagittal plane, recording an angular range of 3.76 to 16.51° (absolute amplitude of 12.75°). This phenomenon could be explained by a compensatory muscular mechanism between engine oscillations and the biomechanical response of the forearm, where the vertical transmission of vibrations activates involuntary postural adjustments.
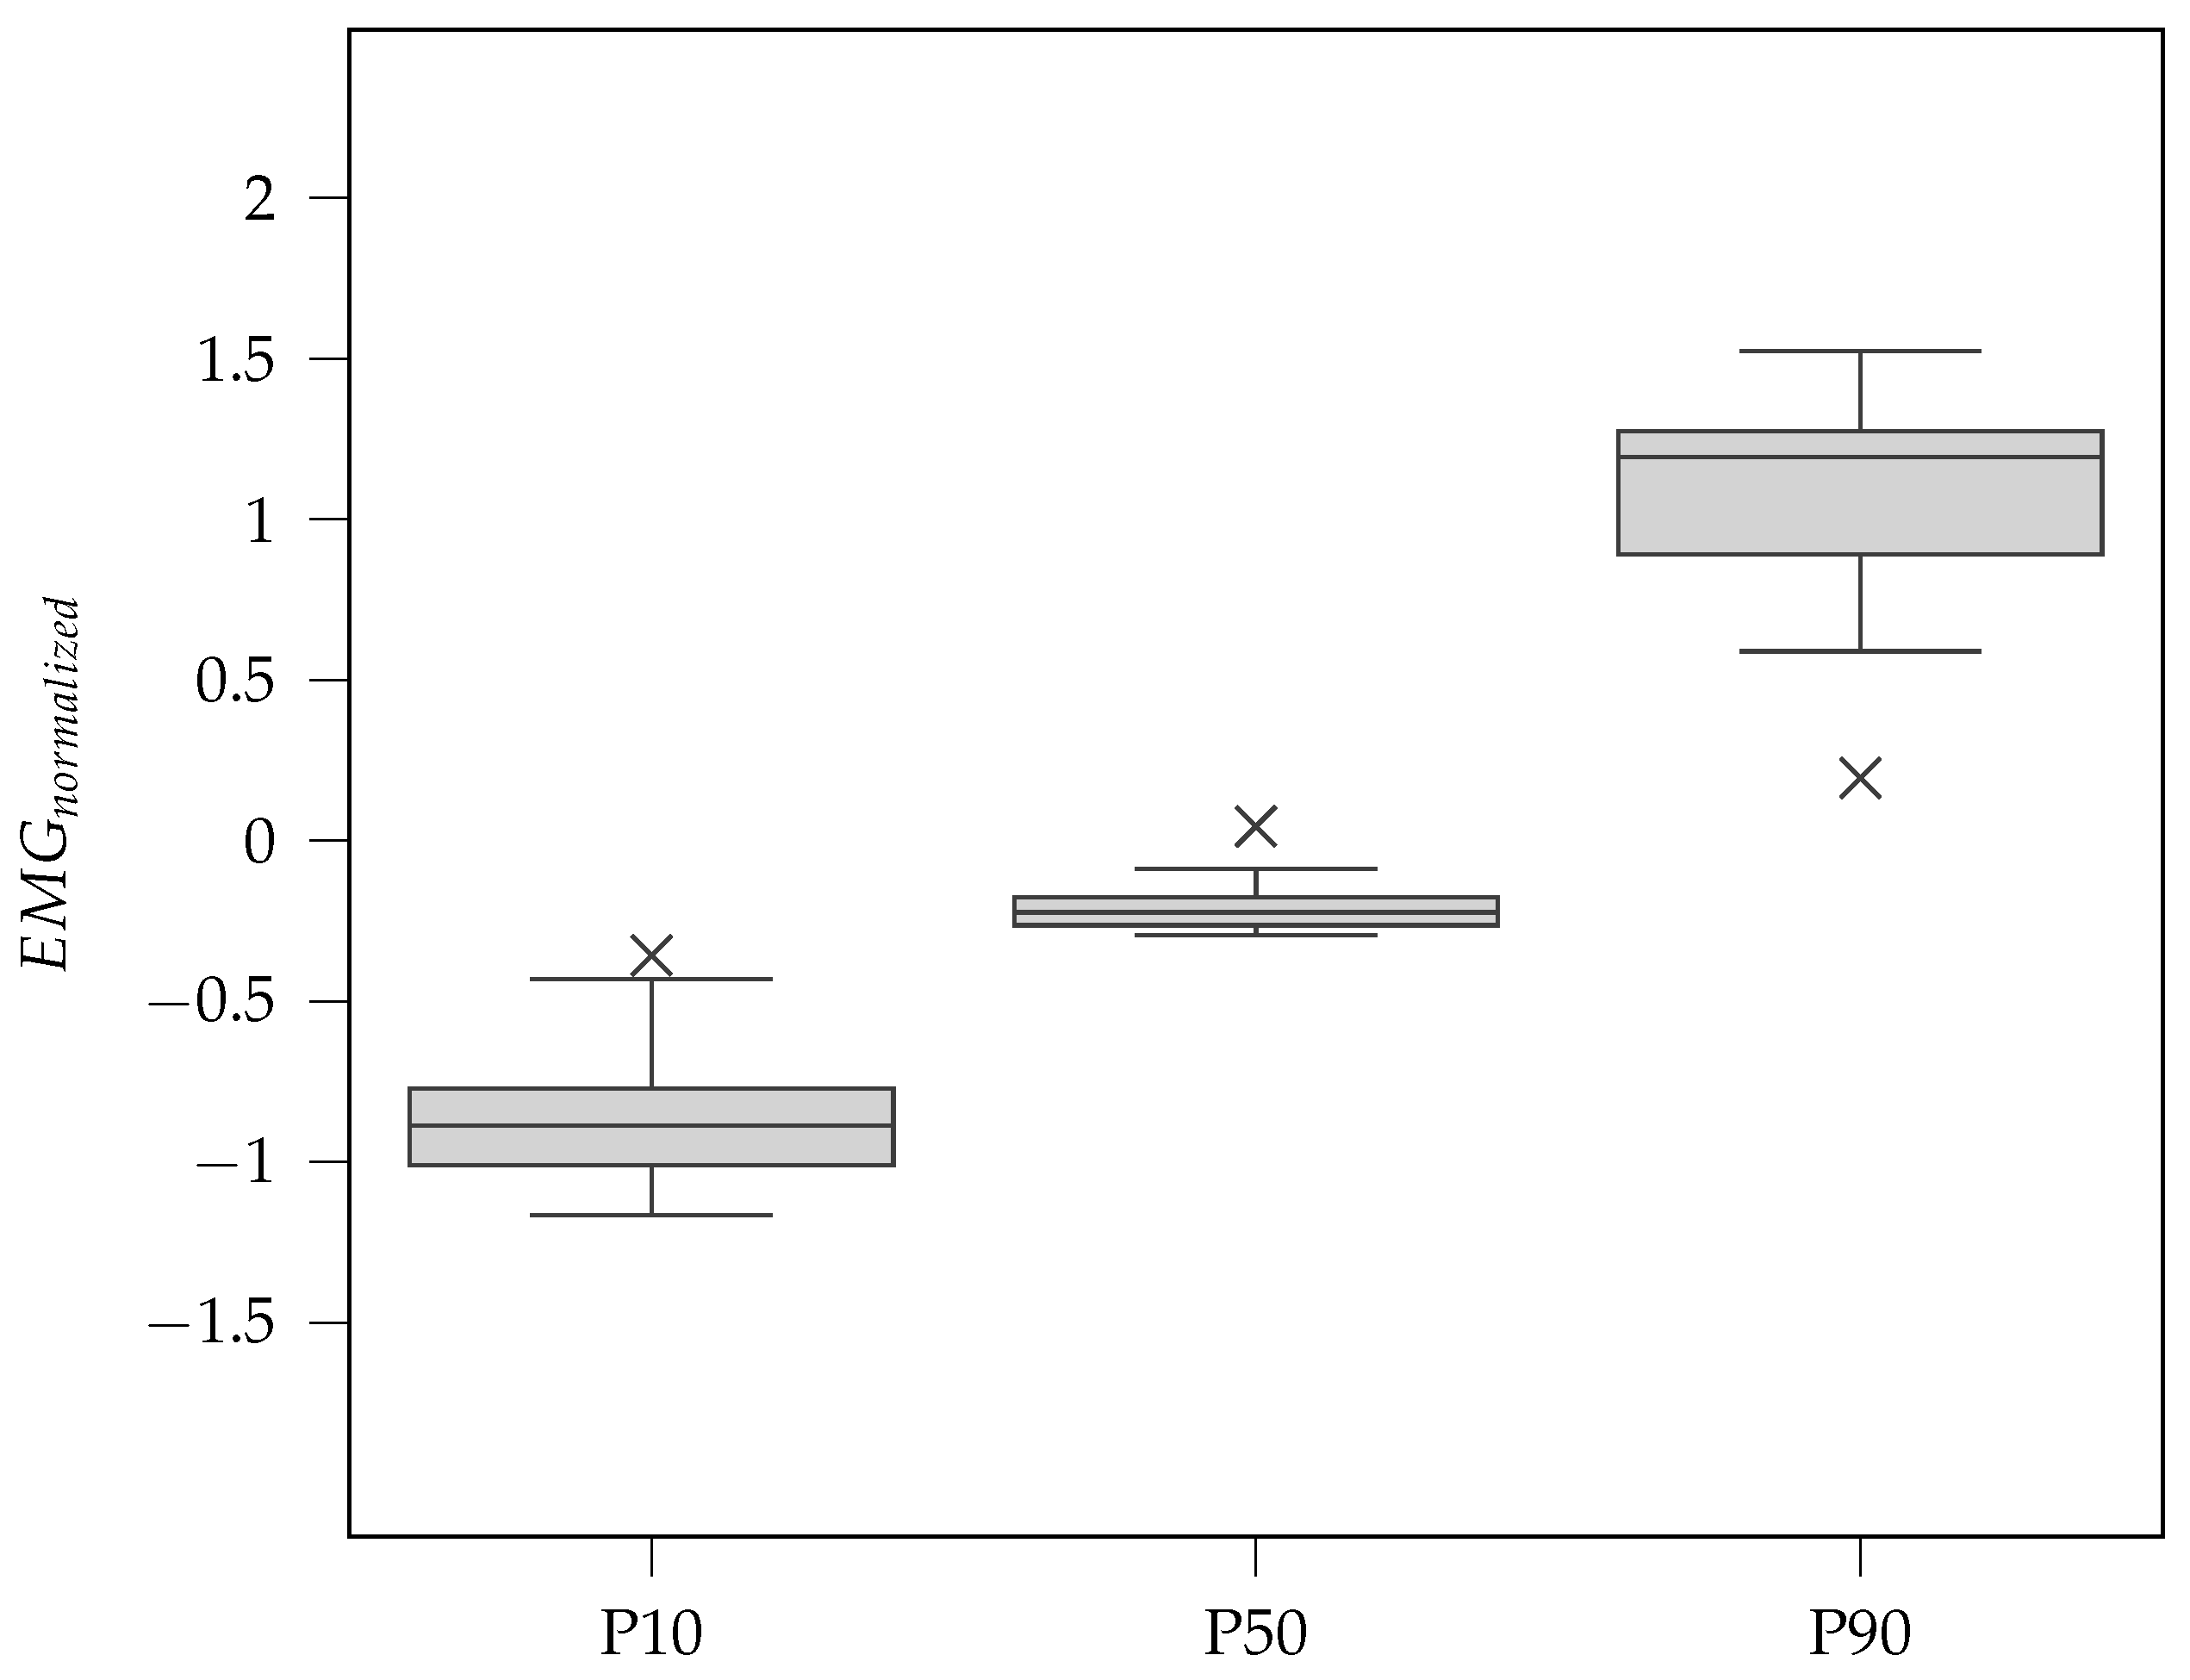
3.3. Descriptive Analysis of EMG Signals
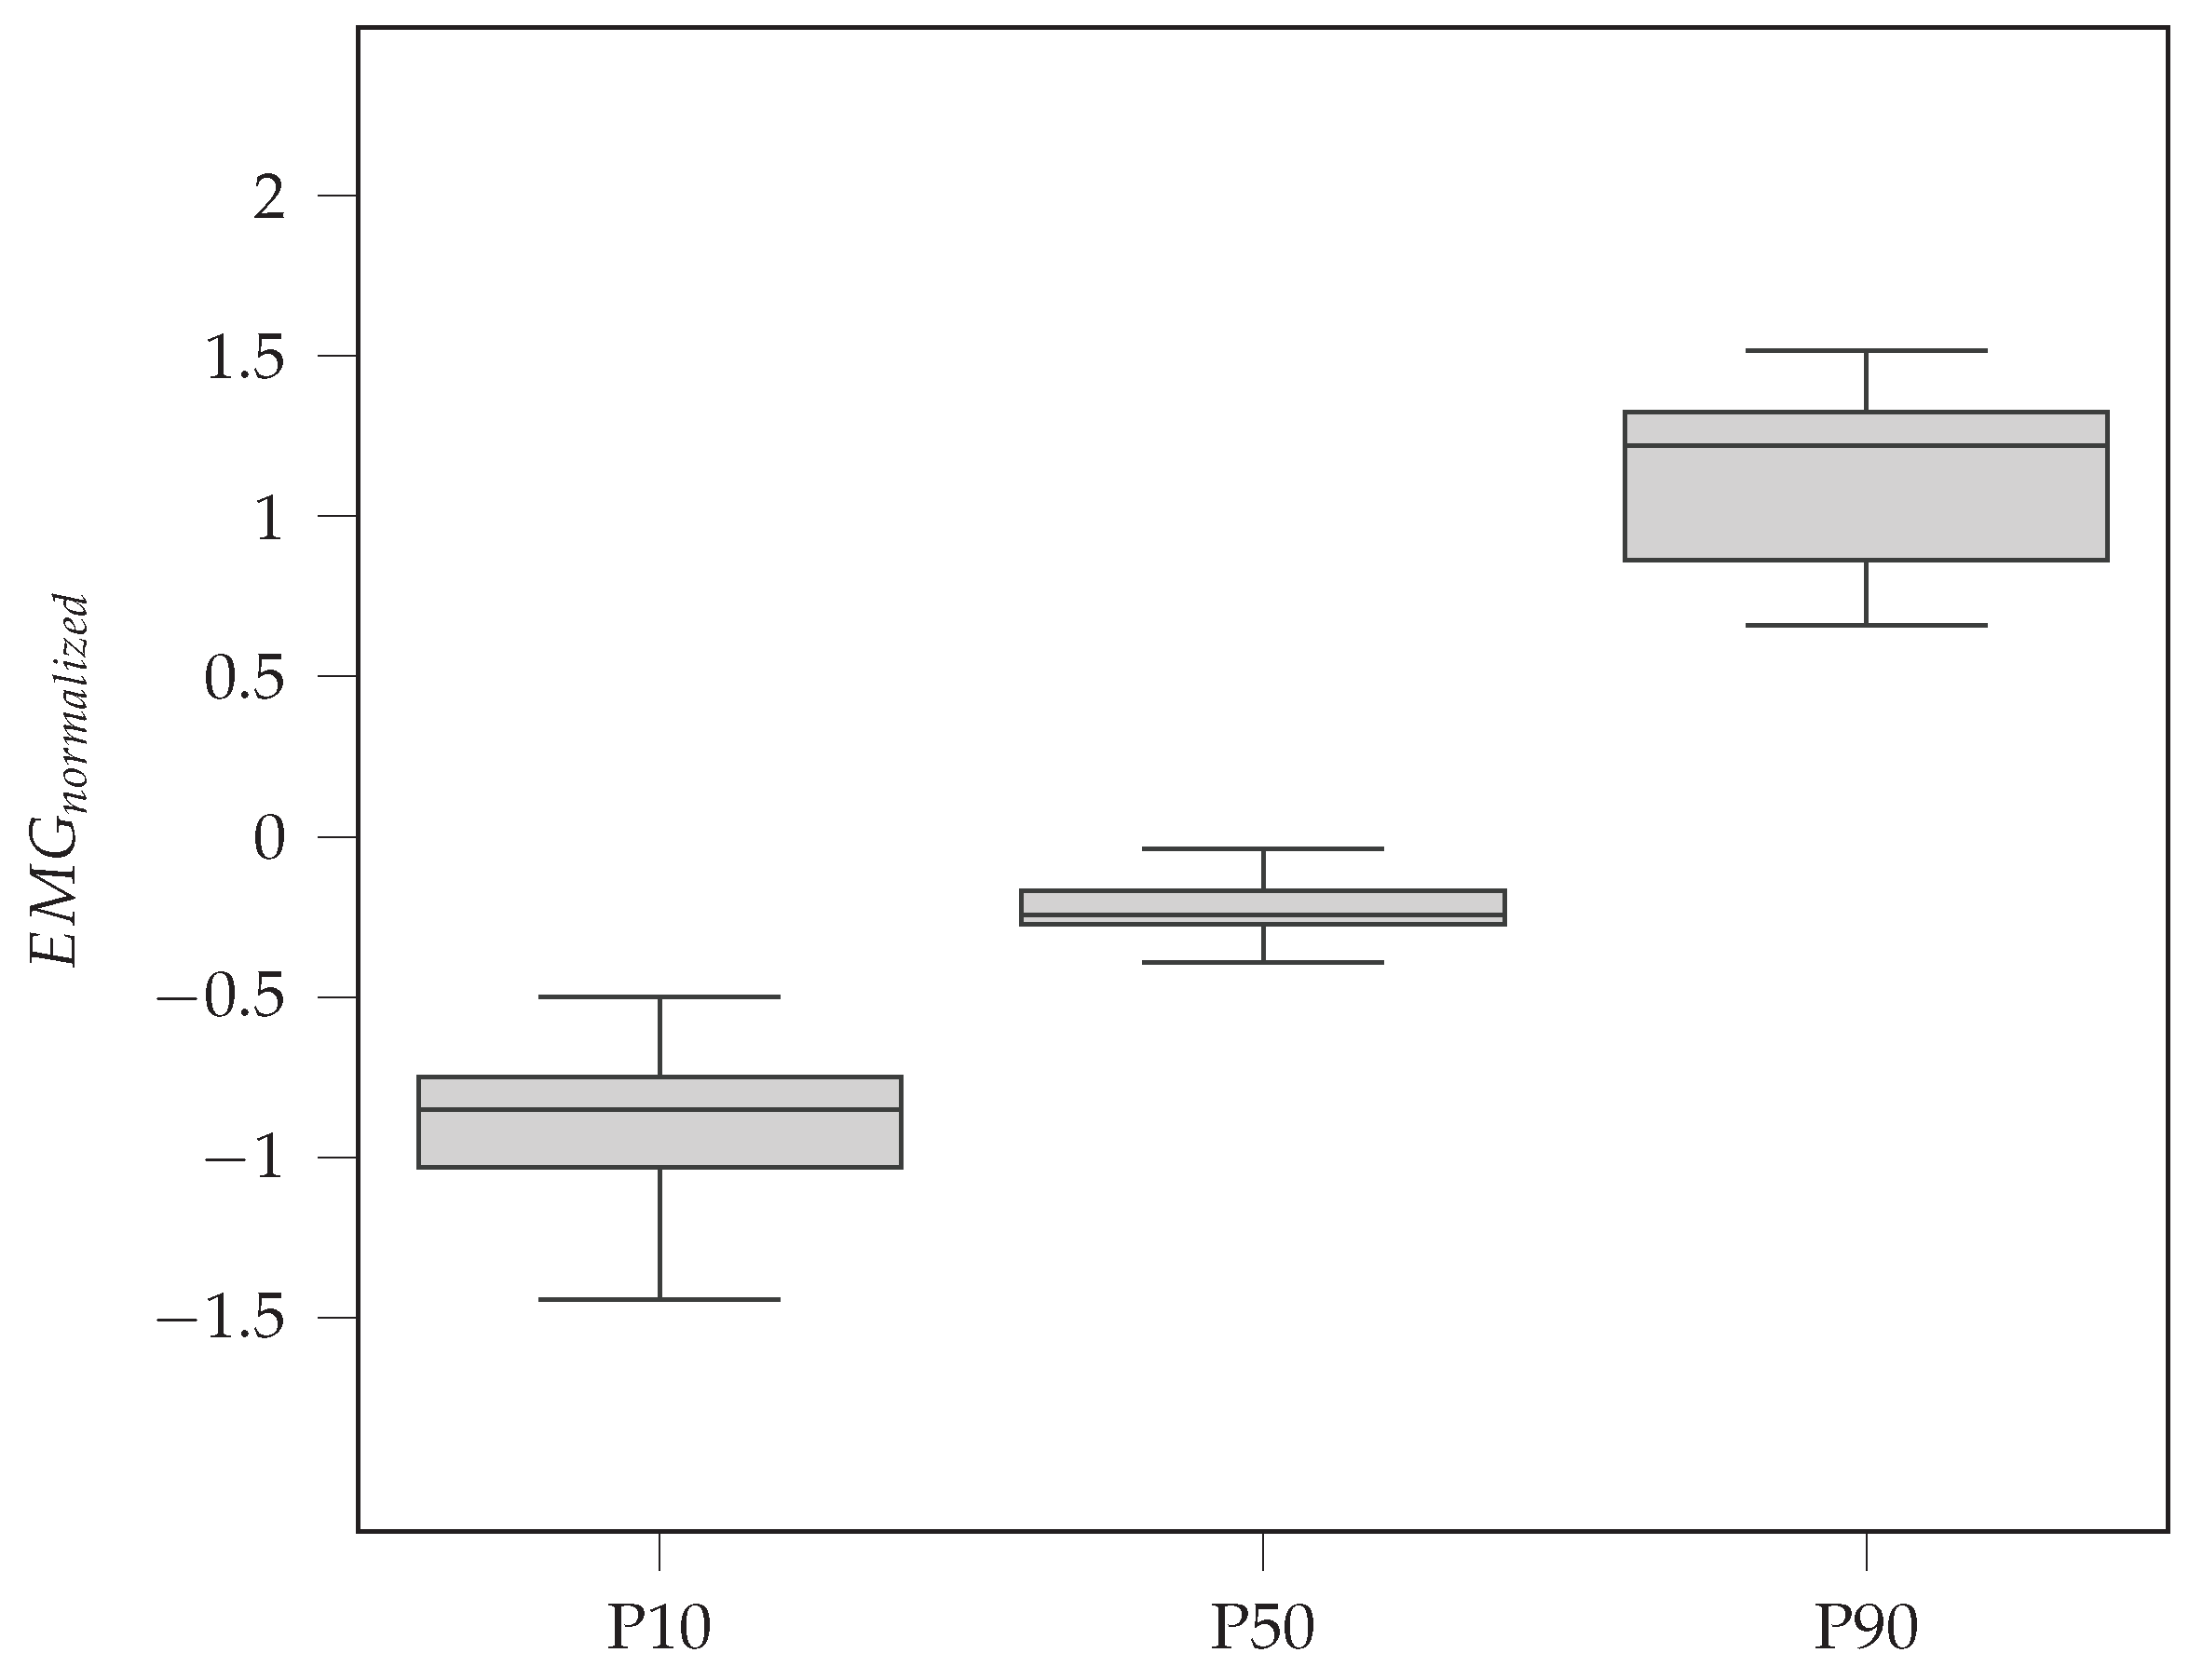
Figure 8 shows the distribution of the average normalized electromyography (
) signal for the 16 participants, calculated from the four trials performed by each participant (see
Table 2) corresponding to the quadriceps muscle. The signals were previously normalized using Equation (
1), which sets a mean of zero and a standard deviation of ±1. For each average signal per participant, the corresponding values for the 10th (P10), 50th (P50), and 90th (P90) percentiles were extracted, which are represented in a box plot. According to
Figure 8, P10 approaches 1, P50 approaches 0, and P90 approaches 1, indicating that, in general, the muscle activation of the participants is similar.
The P10 percentile represents an initial phase of the protocol, possibly associated with a more static condition where participants are still adapting to the movement. During this stage, the normalized muscle activation () shows negative values with moderate dispersion, indicating low overall muscle activity among the participants.
At the P50 percentile, a muscle activation close to zero corresponds to an average level of muscle effort during driving. The dispersion of the data at this phase is minimal, suggesting a more uniform muscular response among the subjects.
Finally, the P90 percentile reflects the highest muscle activation levels reached during the protocol. At this stage, the values of
are positive, and greater dispersion is observed, indicating that some participants experienced significantly higher peaks of muscle effort, possibly during demanding maneuvers or situations that required more active postural control. As shown in
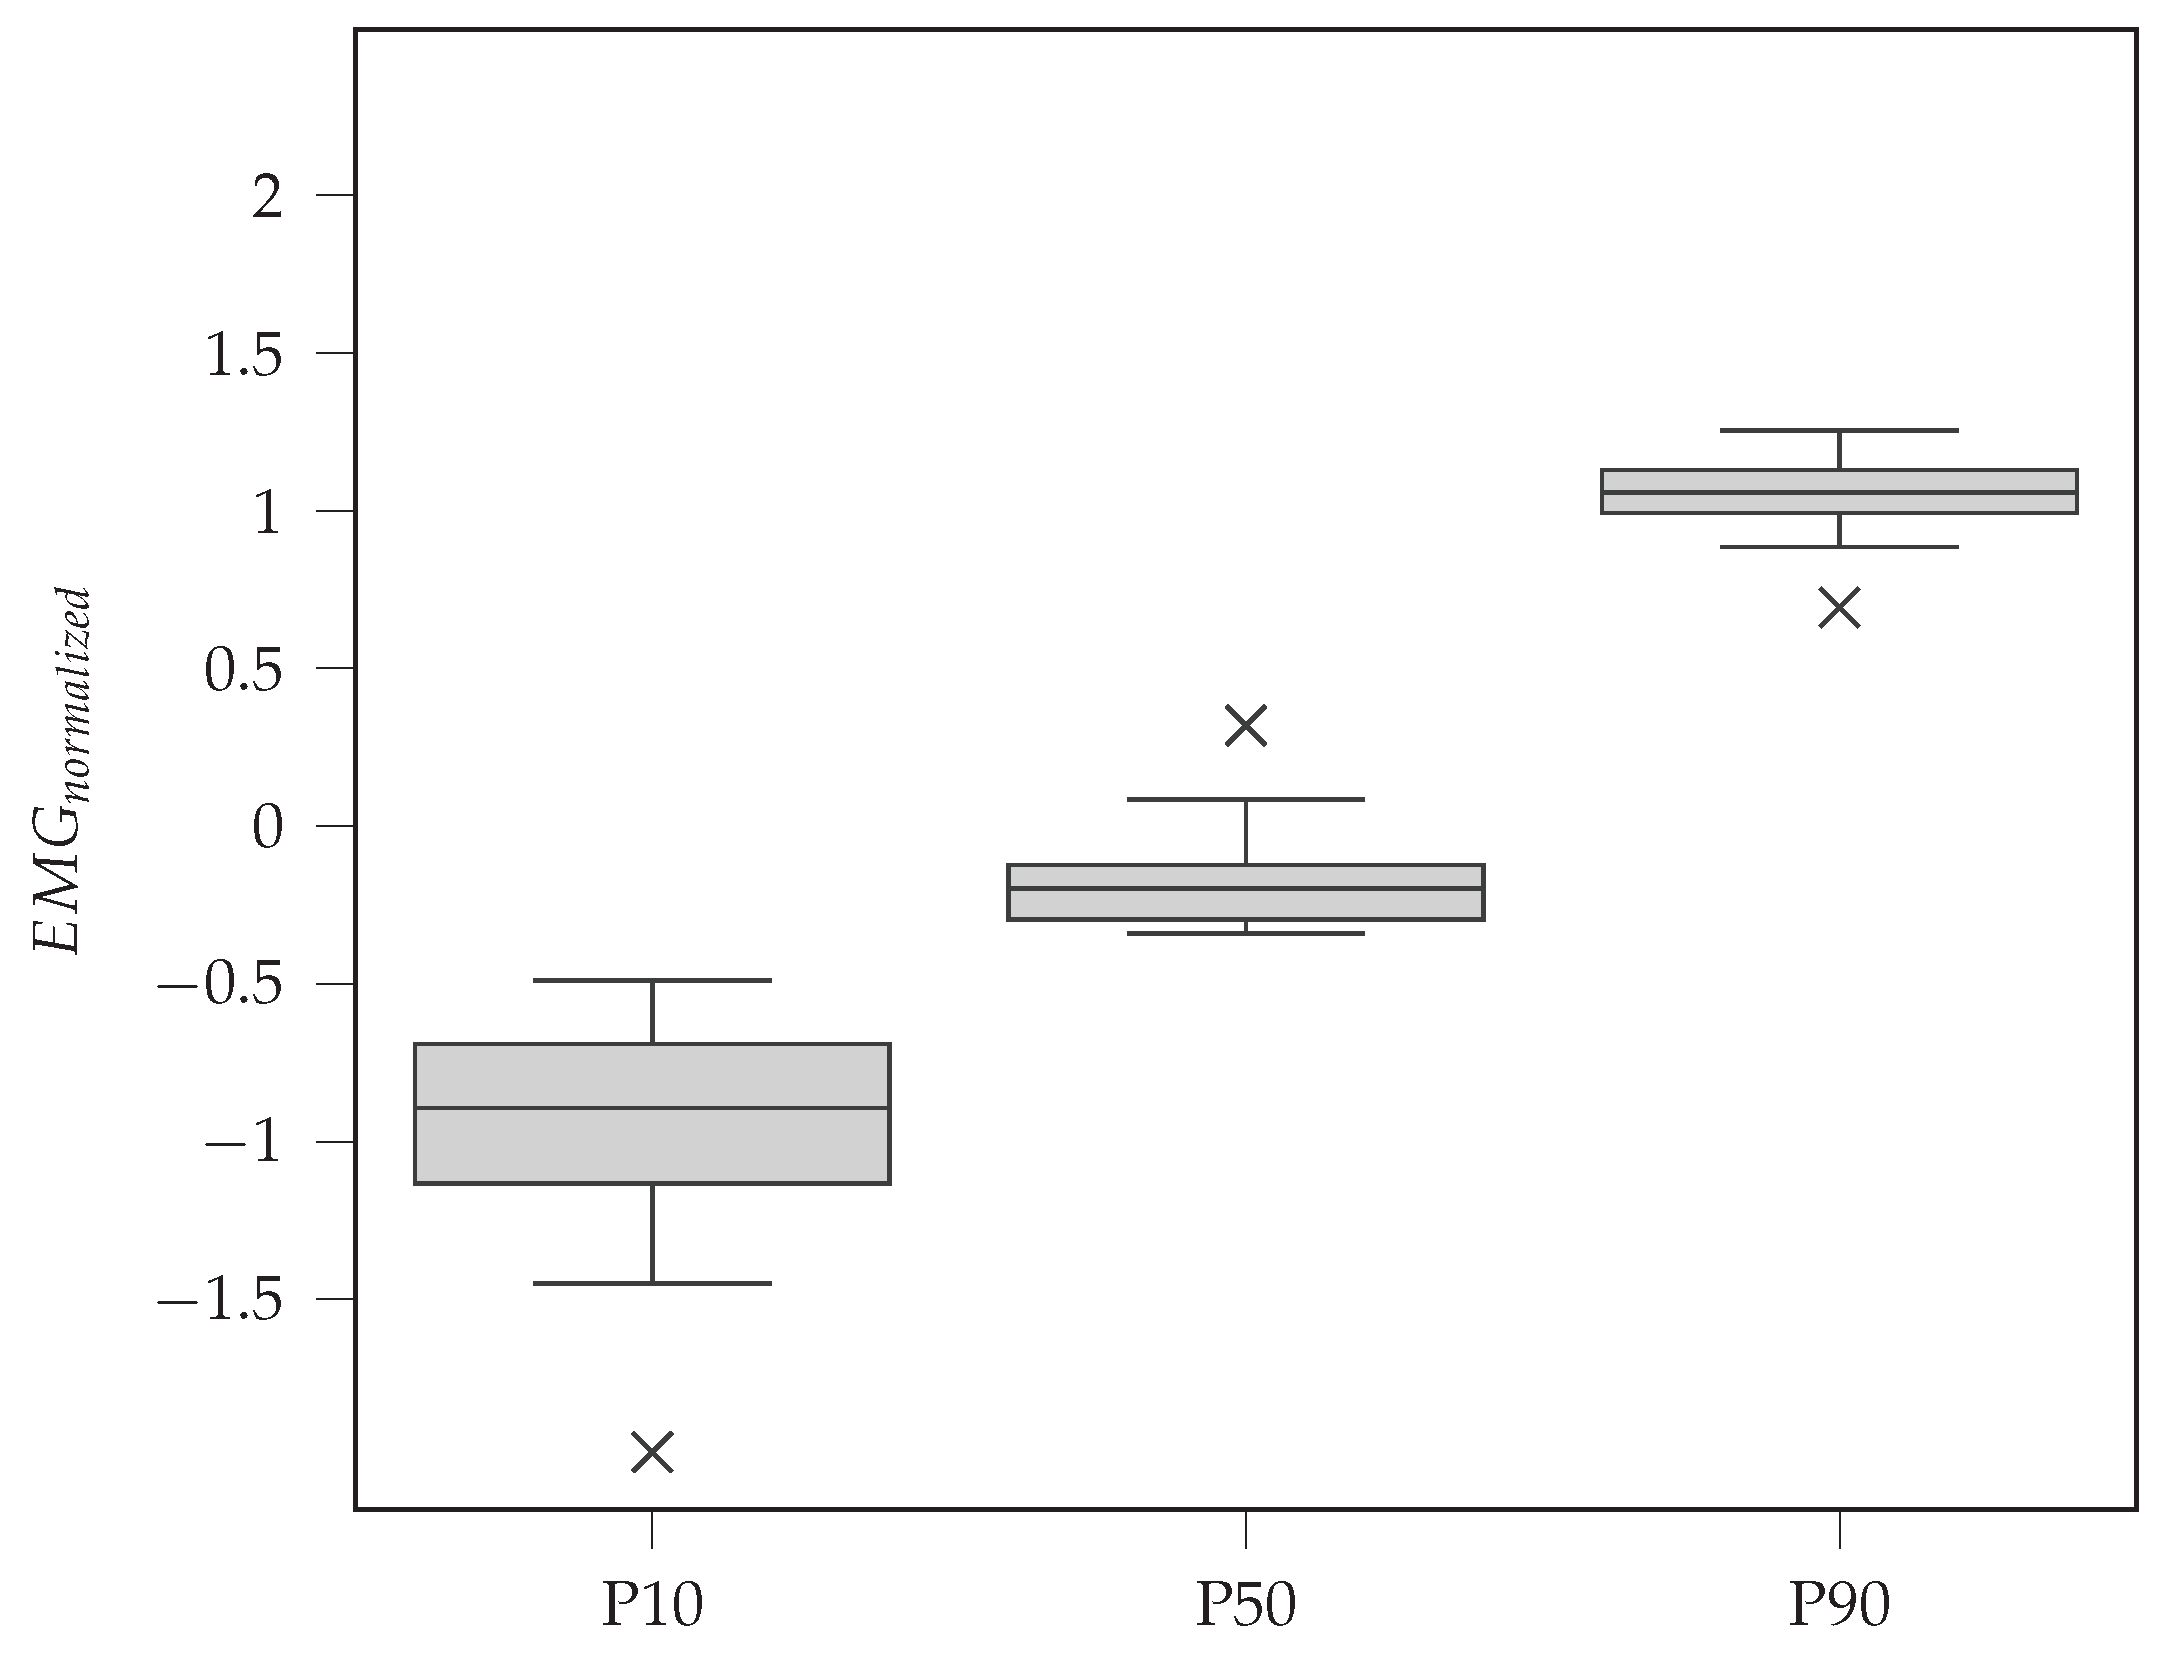
Figure 9, the
signal of the triceps brachii muscles exhibits greater dispersion during the static (initial) phase. In contrast,
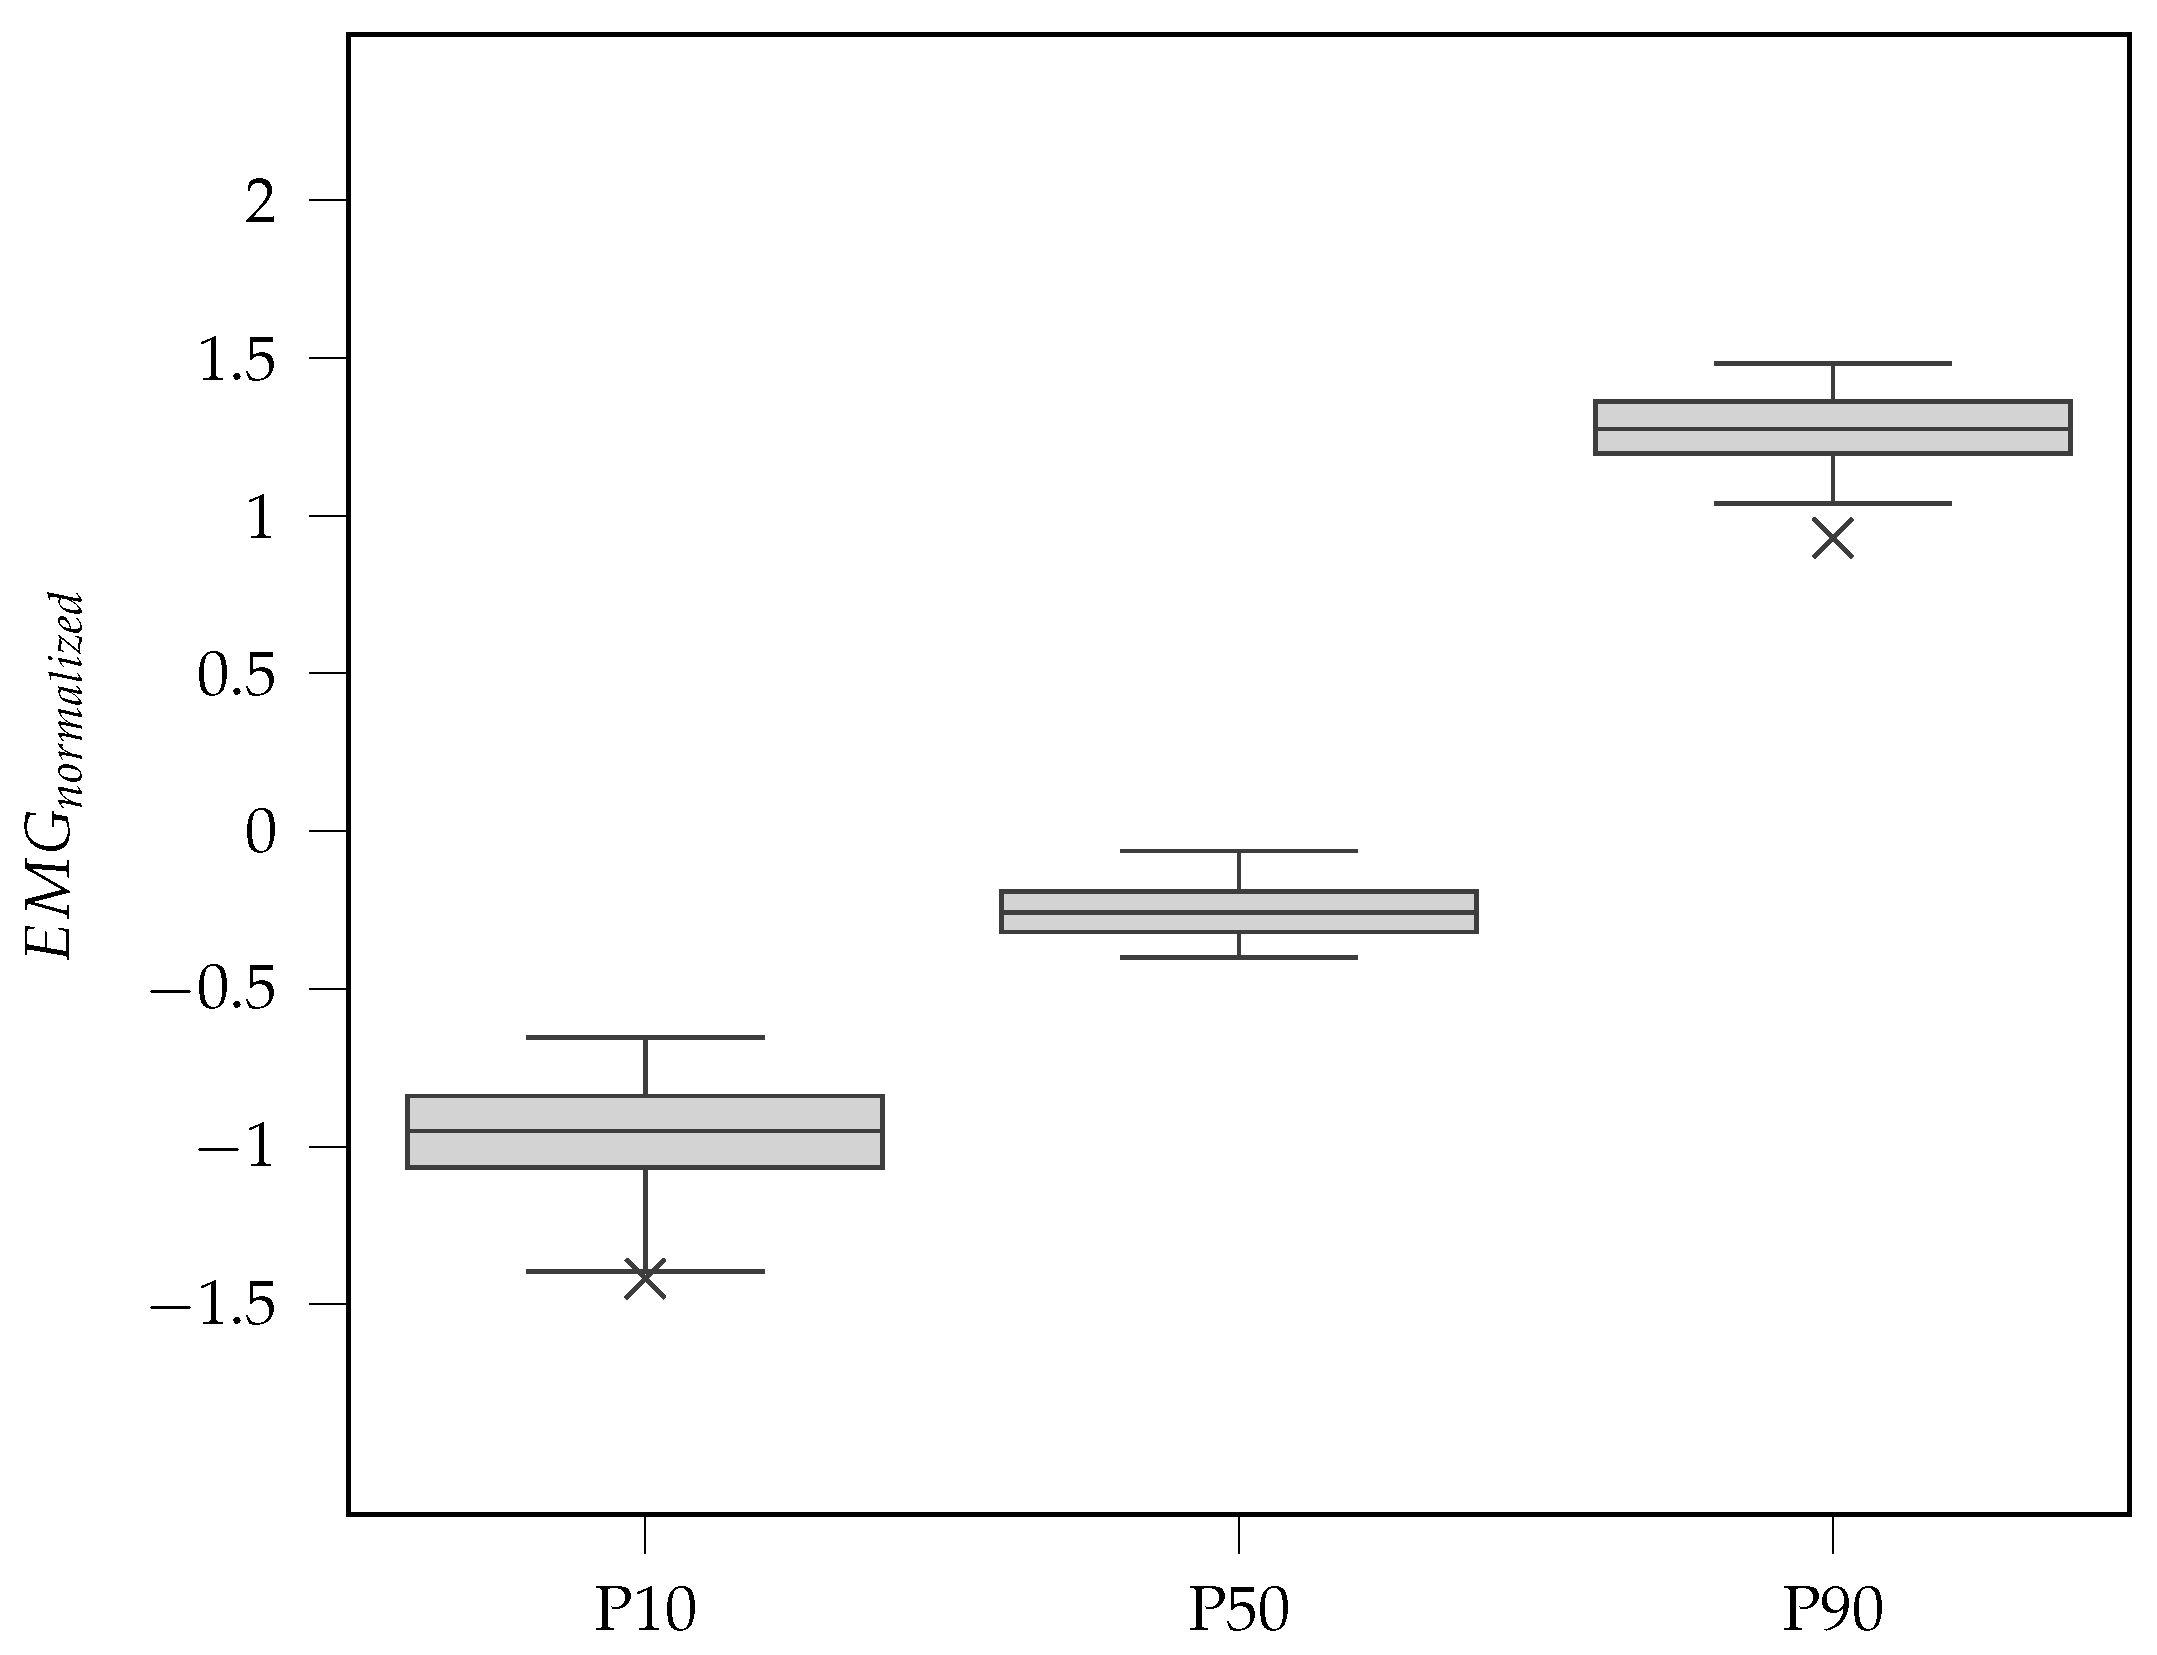
Figure 10 shows that the middle trapezius muscle does not display significant dispersion across any of the percentiles. Meanwhile, the upper trapezius muscles, as illustrated in
Figure 11, present higher dispersion at the 90th percentile (P90).


 ,
, 


