Abstract
The photovoltaic, energy storage, direct current, and flexibility (PEDF) system represents a crucial innovation for transforming buildings into low-carbon energy sources. Although it is still in the early stages of scalable demonstration, current research and practice related to PEDF lack comprehensive studies on optimizing and evaluating system capacity configuration across various scenarios. Capacity configuration and energy scheduling are crucial components that are often treated separately, leading to a missing opportunity to leverage the synergy among key interactive devices. To address this issue, this paper proposes an optimization and evaluation framework for the PEDF system that employs a dual-layer model for planning and operating. This framework precisely configures the PEDF topology, load, photovoltaic, energy storage, and critical interactive devices, while integrating economic, environmental, and reliability objectives. The effectiveness of the proposed model has been validated in optimizing capacity configurations for newly built office buildings and existing commercial settings. The results indicate that for new office buildings, schemes that prioritize low-carbon initiatives are more effective than those that focus on reliability and economy. In existing commercial buildings, reliability-focused schemes outperform those that prioritize economy and low carbon, and all three are significantly better than pre-configuration schemes. The proposed framework enhances the theoretical understanding of PEDF system planning and evaluation, thereby promoting broader adoption of sustainable energy technologies.
1. Introduction
As non-renewable resources like oil and natural gas continue to decline, there is an increasing concern about the efficient use of renewable energy sources, such as wind and solar energy. Photovoltaic, energy storage, direct current and flexibility (PEDF) has become essential for achieving innovations in low-carbon or zero-carbon energy systems and promoting clean energy consumption in buildings [1,2,3]. Specifically, “photovoltaic” refers to distributed solar power generation, while “energy storage” pertains to distributed energy storage solutions. “Direct current” connects to low-voltage DC distribution networks, and “flexibility” relates to the adaptable load characteristics of a building, which can be scheduled flexibly to help alleviate supply–demand conflicts and enhance the utilization rate of renewable energy [4,5]. The PEDF system aims to establish a new type of power distribution system for buildings that align with carbon neutrality goals by focusing on photovoltaics, energy storage, direct current, and flexibility [6,7,8]. According to China’s Action Plan for Carbon Peak, it is essential to “improve the electrification level of building terminals and build PEDF buildings that integrate photovoltaic power generation, DC distribution, energy storage, and flexible electricity consumption” before 2030.
In recent years, there has been a significant increase in research and its applications. However, the existing research, standards, and systems for PEDF in buildings are still incomplete, with many studies remaining in the preliminary exploration stage. Many researchers highlight the importance of developing renewable energy systems for PEDF buildings to achieve carbon neutrality goals and innovate energy systems [9,10]. Several studies have examined the planning, operating, and control aspects of DC microgrids, identifying relevant challenges and opportunities, while summarizing control strategies [11,12]. Some studies focused on the feasibility of distributed photovoltaic and energy storage systems, exploring configurations for various building types and climates [13]. Others have proposed methods to improve the self-sufficiency rate (SSR) and self-consumption rate (SCR) of these systems by addressing issues like transformer losses and load curves [14]. Research has also explored balancing strategies between electricity costs and carbon dioxide emissions [15].
Some studies have proposed dual-layer configuration models for photovoltaic energy storage in DC solar storage microgrids based on interval linear programming to enhance both economic and operational efficiency [16,17]. Optimal operation planning models for scalable DC microgrids have been developed in [18], considering factors like demand response, islanding operation, and battery degradation costs. Moreover, some studies aimed to adopt intelligent optimization algorithms based on a dual-layer configuration model of DC microgrids, with grid compatibility and annual net profit of microgrids as internal and external optimization goals, effectively improving both economic efficiency and operational stability [19,20,21]. At the same time, some studies have noted the critical role of intelligent optimization algorithms in optimizing system capacity configuration, utilizing intelligent optimization algorithms (such as Particle swarm, Whale, and Grey wolf) to determine the optimal configuration of system capacity that meets user needs [13,14,18,19,20,21]. Overall, current research on the PEDF system is transitioning to applied stages, but there is still a need for in-depth studies on optimizing and evaluating system capacity configuration across different scenarios. Capacity configuration and energy scheduling, as core issues in system planning and operating, are often treated separately, leading to a failure to consider the coordinated configuration of key interactive devices within the system. This oversight can result in inefficient capacity optimization or insufficient operational capacity in existing systems.
The policies enacted by China create favorable conditions for developing various building technologies such as PEDF, demand response, energy storage, and photovoltaic systems. There is an urgent need for the rational construction of PEDF systems, along with the development of critical equipment and engineering applications. Several regions in China have explored the engineering application of PEDF systems to enhance renewable energy in buildings. Notable examples include the future building in Shenzhen, Zhuangshang village in Shanxi province, and the energy-saving building at Tsinghua University. According to a survey conducted by the PEDF Professional Committee of the China Building Energy Efficiency Association, the number of PEDF building systems constructed and put into operation in China has exceeded 200. These systems encompass various building types, including residential, office, science, education, cultural, healthcare, commercial, and other sectors [9,13,14]. However, it is crucial to consider the impact of capacity planning and energy operation scheduling on PEDF systems. Some systems may require optimization in their capacity configuration, as excessive energy storage or insufficient application capacity could lead to economic losses and compromise the stability of the power grid.
In response to the diverse needs of different stakeholders for system configuration optimization, this paper presents a framework designed to optimize and evaluate the configuration of the PEDF system, considering the coupling effect of system capacity configuration and energy scheduling, as well as the coordinated configuration of key interactive devices within the system. This adaptable framework can cater to different building types and configuration goals, solve the capacity coordination and daily energy scheduling strategy problems of PEDF systems, and transform building energy systems. By exploring the relationship between system capacity and energy scheduling, this paper develops a dual-layer configuration optimization model to enhance planning and operating. The framework’s effectiveness is demonstrated through two case studies: one focused on a new office building and the other on an existing commercial building, highlighting its applicability and scalability for effective PEDF system design and implementation.
The structure of this research is as follows. Section 2 introduces the optimization and evaluation framework for configuring the PEDF system based on the planning and operating dual-layer model. Section 3 illustrates the proposed framework through two case studies from different building types. Section 4 discusses the proposed framework’s main technical contributions and opportunities. Section 5 concludes the research findings.
2. Optimization and Evaluation Framework for Configuration of the PEDF System Based on Planning and Operating Dual-Layer Model
The framework for optimizing and evaluating the configuration of the PEDF system comprises three key components: system application scenario analysis, system planning and configuration, and optimization and evaluation of the configuration. The application scenario analysis first identifies the characteristics and requirements of various PEDF systems by examining application types and configuration goals, which sets the stage for optimizing the system configuration.
During the system planning and configuration phases, the system topology is designed according to PEDF system configuration principles, allowing for flexible arrangements of interconnected components such as loads, photovoltaic elements, energy storage systems, and critical interactive devices. The system optimization and evaluation phase establishes the system’s objective function and constraints. A dual-layer model is then applied to enhance the configuration optimization of the PEDF system. The process assesses the system’s economic viability, low-carbon performance, and reliability. The operating layer uses commercial solvers (such as Cplex, Gurobi) to handle large-scale linear or nonlinear programming problems with complex constraints, ensuring efficient and accurate optimization of operations, while the planning layer employs intelligent algorithms (such as Particle swarm, Whale, and Grey wolf) to optimize the entire lifecycle cost and find the best configuration. This hierarchical strategy balances efficiency and global optimality, enhancing the framework’s practicality. Furthermore, an illustration of the configuration optimization and evaluation framework of the PEDF system is provided in Figure 1.
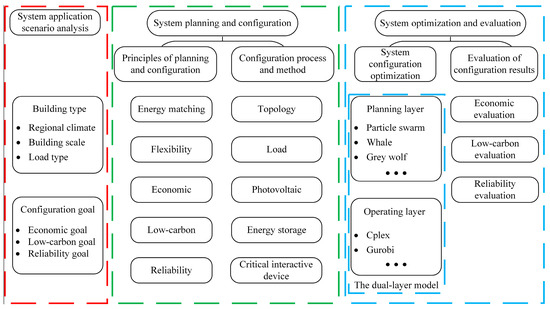
Figure 1.
Optimization and evaluation framework for the PEDF system configuration.
2.1. Analysis of System Application Scenarios
This section explores the various application scenarios for China’s PEDF building demonstration projects. The analysis will focus on how different building types and configuration goals impact the performance of the PEDF system. Furthermore, this paper will provide guidance on customizing the system to meet the specific needs of various building types and configuration goals. This approach will establish a foundation for optimizing and evaluating the configuration of the PEDF system.
2.1.1. Determination of Building Type
The distribution characteristics of PEDF building applications are illustrated in Figure 2 [9,11,12]. PEDF buildings are versatile, making them suitable for both new and existing buildings in most areas of China [8]. Regions with annual total solar radiation of ≥1400 kWh/m2 and annual equivalent sunshine hours of ≥1200 h are classified as having abundant solar resources; regions with annual total solar radiation ranging from 1050 to 1400 kWh/m2 and annual equivalent sunshine hours between 900 and 1200 h are designated as the average areas for solar power generation resources [9,11,12]. However, the significant variations in energy demand and usage among different buildings greatly affect the selection and configuration of PEDF systems and interactive devices.
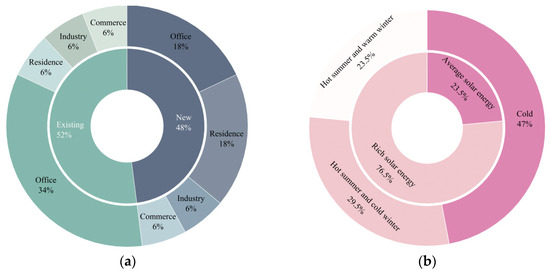
Figure 2.
Distribution characteristics of PEDF building applications: (a) building type; (b) climatic region [9,11,12].
It is also important to consider the different methods of photovoltaic energy consumption across various buildings. A building is classified as a zero-energy consumption building when its annual photovoltaic power generation offsets its annual electricity consumption, as indicated by the diagonal line in Figure 3. If a building generates more electricity than it consumes, it is classified as a photovoltaic “grid-output” building (in the area above the diagonal line in Figure 3), while buildings that generate less are termed “self-consumption” buildings, found in the area below the diagonal line in Figure 3 [8]. The PV self-consumption rate in Figure 3 represents the proportion of photovoltaic electricity consumed locally compared to total generation, whereas the PV self-sufficiency rate measures how much of the building’s overall electricity consumption is covered by locally generated photovoltaic power [9,10,14].
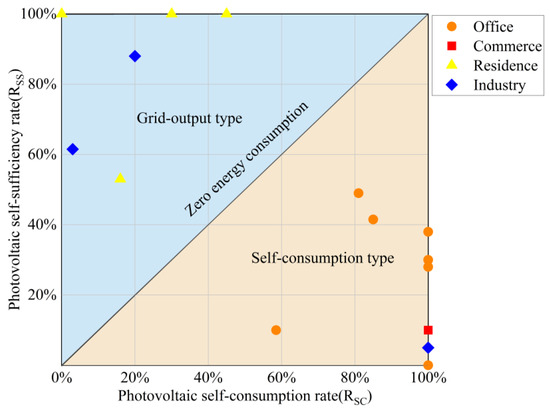
Figure 3.
Distribution of PV consumption method in PEDF building [9,10,14].
Therefore, when configuring the PEDF system, it is essential to conduct a thorough analysis of the specific building type, considering regional climate characteristics, building size, and load type. Following this analysis, it is crucial to evaluate the potential of local solar energy resources and determine the most effective strategy for utilizing photovoltaic power generation. The components of the PEDF system should then be allocated appropriately to meet the needs of the various systems involved.
2.1.2. Determining Configuration Goals
The configuration of the PEDF system requires a flexible arrangement of various interconnected elements, such as photovoltaic modules, energy storage devices, and critical interactive devices. The various configuration options differ in terms of cost-effectiveness, low-carbon emissions, and reliability. Stakeholders, including property owners, asset management parties, operation and maintenance parties, and users, will evaluate the PEDF system based on these economical, low-carbon, and reliability factors [13,14,15]. Therefore, when optimizing and evaluating the PEDF system configuration, it is essential to consider various configuration objectives and constraints to achieve the optimal solution.
2.2. System Planning and Configuration
This section outlines the principles for planning and configuring PEDF systems by analyzing different application scenarios. The key principles include energy matching, flexibility, economic, low-carbon emissions, and reliability. A dual-layer model for planning and operating is proposed to assist in configuring the system’s topology, load, photovoltaic components, energy storage, and critical interactive devices.
2.2.1. Principles of System Planning and Configuration
The configuration optimization of the PEDF system should adhere to the following principles [11,22,23]:
- Energy matching principle: The system must ensure that there is a balance between photovoltaic sources, energy storage, the power grid, and load demand, effectively fulfilling all energy requirements.
- Flexibility principle: The PEDF system should be designed to accommodate flexible adjustments and expansions based on various application scenarios, guaranteeing adaptability, efficiency, and stability.
- Economic principle: An optimally configured PEDF system can reduce both construction and operational costs, significantly enhancing economic benefits and cost-effectiveness.
- Low-carbon principle: When configuring the PEDF system, it is essential to utilize solar energy resources, minimize dependence on the power grid, and strive for lower carbon emissions.
- Reliability principle: A well-considered configuration of the PEDF system and its interactive components should reduce the capacity needed for power electronic conversion devices, thereby improving overall reliability.
2.2.2. System Configuration Process and Method
The configuration optimization and evaluation framework for the PEDF system consists of a dual-layer system configuration optimization model, which includes planning and operating, along with an evaluation model. Initially, the PEDF topology is established to determine the capacity range of photovoltaic and energy storage systems based on the building type and construction objectives. Various capacity configuration combinations are identified, serving as constraints for the planning layer. In the planning layer, these combinations are evaluated to minimize the total annual lifecycle cost, which is then passed down to the operating layer. The operating layer aims for three objectives: recurring electricity purchase cost, minimizing emissions, and ensuring reliability. A scheduling plan is created based on these goals and provides feedback on operating costs to the planning layer. This feedback is processed through a double-layer optimization algorithm to refine the optimal configuration plan. Finally, the evaluation indexes are established to assess the proposed configuration. Figure 4 illustrates the PEDF configuration optimization process.
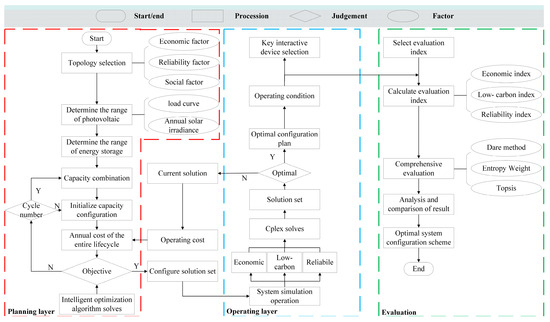
Figure 4.
Optimization process for the PEDF system configuration.
The dual-layer model separates the planning and operating layer, solved iteratively. The planning layer employs an intelligent optimization algorithm (such as Particle Swarm Optimization, Whale Optimization, Grey Wolf Optimization, or the Sinh Cosh optimizer) to solve the model. In contrast, the operating layer utilizes the Cplex solver for its computations. The optimization results inform the energy scheduling and configuration, leading to the optimal system configuration scheme. A multi-dimensional evaluation method for the PEDF system has been developed based on this approach.
- PEDF topology configuration
The process for configuring the topology of the PEDF system network is as follows:
- Analyzing typical topology structures: The process begins with an examination of the typical network topologies used in the PEDF system. This analysis considers various economic, reliability, and social indexes relevant to the system [24,25,26]. The typical topology network structures of standard PEDF systems are illustrated in Figure 5, along with their characteristics and applicable scenarios, as detailed in Table 1.
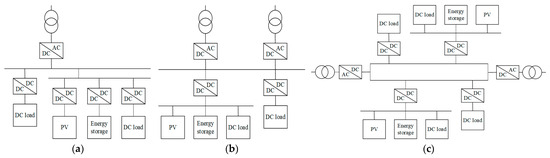 Figure 5. Typical topology network structures of standard PEDF systems: (a) single-ended topology; (b) double-ended topology; (c) ring topology.
 Table 1. Characteristics and applicable scenarios of typical topological network structures.
 - Determining Voltage Levels: The PEDF system typically adopts single or multiple voltage conversion levels [11,12,27]. The recommended voltage levels are DC750V, DC375V, and DC48V, in accordance with TCABEE030-2022, titled “The Design Standard for Direct Current Power Distribution of Civil Building”.
- Designing the PEDF topology structure: Based on the typical topology network structure and the established voltage level, a suitable PEDF topology is designed for various application scenarios.
- Load configuration
The load configuration process of the PEDF system involves several steps:
- Determine the typical type of electricity loads. Analyze load demand for various DC equipment types, including large, medium, and small. Figure 6 illustrates the distribution percentages of various types of DC electrical equipment in PEDF buildings [8].
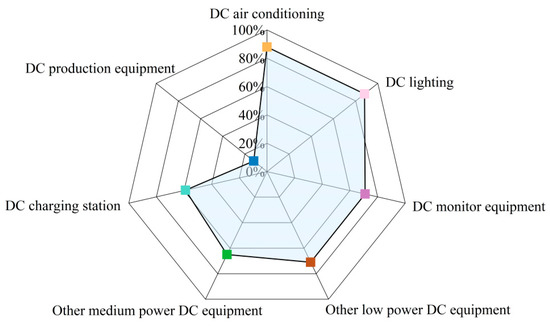 Figure 6. Distribution characteristics of the application type of DC electrical equipment in buildings [8].
 - Identify flexible loads. Recognize and assess flexible loads, such as interruptible, transferable, and curtailable electrical equipment, focusing on their operating times and power needs.
- Select modeling method. Choose a suitable model approach, often using machine learning-like methods for load prediction or clustering to define the power curve [28,29,30]. Figure 7 illustrates load curves for typical office and commercial buildings.
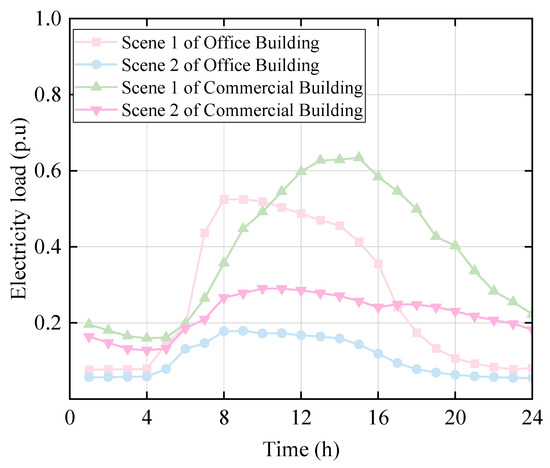 Figure 7. Typical daily electricity load power curves for different types of buildings.
- Photovoltaic configuration
The photovoltaic configuration process of the PEDF system is as follows:
- Potential evaluation of building photovoltaic utilization. The first step is to assess the potential for building photovoltaic use in the building, analyzing the layout and transportation systems to determine the suitability of rooftop or facade installations [31,32,33].
- Determination of Specifics affecting factors. Based on factors such as system load configuration, solar radiation intensity and available installation area, as well as system form and module type for the photovoltaic system are identified [9,31,34]. Table 2 provides relevant data, showing the percentages of different photovoltaic installation locations, system forms, and component types in PEDF buildings.
Table 2. Common PV installation location, system form, component type, characteristic, scenario and ratio.
- Guided Configuration. Figure 8 outlines the photovoltaic configuration process, which adapts to different configuration goals and optimizes system performance based on solar radiation data and module parameters [8].
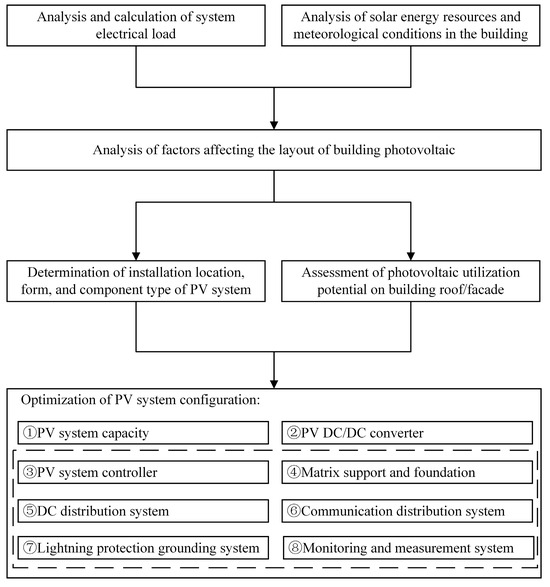 Figure 8. Photovoltaic configuration process of the PEDF system.
- Energy storage configuration
The energy storage configuration process of the PEDF system is as follows:
- Select Battery Types. Choose batteries based on their technical performance and economic efficiency for various application scenarios, as detailed in Table 3 [8,9], which indicates the distribution of energy storage types in PEDF buildings.
Table 3. Common characteristics and application scenarios of electrochemical energy storage types.
- Determine rated power. Establish the rated power of the energy storage while considering specific constraints [34,35].
- Optimize configuration. Optimize the setup for effective integration with photovoltaic systems.
- Critical interactive device configuration
The configuration process of critical interactive devices in the PEDF system includes:
- Load calculation. Assess the load, photovoltaic, and energy storage characteristics to select transformer types and determine their capacity and number, considering reserve capacity and load rates.
- Interaction power calculation. Calculate the interaction power of the building’s grid to choose AC/DC converters. Urban office and commercial buildings typically base this on the daily power purchased from the grid, while rural buildings use typical photovoltaic output [10,11,12].
- DC/DC Converter Configuration. Determine the type and capacity of each DC/DC converter based on DC load power and bus voltage, while factoring in system topology and conversion efficiency.
2.3. System Configuration Optimization
This section outlines the objective function and constraints involved in optimizing the system configuration. It combines an optimization algorithm with a commercial solver to create a dual-layer optimization model that enhances the system configuration.
2.3.1. System Configuration Optimization Model
To optimize the PEDF system configuration, this work employs a dual-layer model based on planned operation. The objective function targets economic viability, low carbon emissions, and reliability. The inner layer utilizes a Cplex solver to solve this linear problem, while the Sinh Cosh Optimizer in the outer layer determines the optimal configuration scheme [36].
Cplex solvers are commercial solvers that efficiently solve linear programming problems. The Sinh Cosh optimizer is a recently proposed metaheuristic algorithm based on the mathematical properties of hyperbolic functions. It features two stages for balancing global exploration and local utilization, a bounded search strategy to ensure convergence, and a mechanism to switch between stages. This results in strong evolutionary capabilities, fast search speeds, and robust optimization ability compared to other algorithms [36].
The solution process and information exchange for the planning and operating dual-layer model, based on Sinh Cosh optimizer and Cplex, are illustrated in Figure 9. The planning layer initializes configuration for photovoltaics and energy storage and sends them to the operating layer. The operating layer then optimizes the comprehensive goals of economic efficiency, low carbon emissions, and reliability using Cplex, providing feedback on operation and maintenance costs. The planning layer utilizes the Sinh Cosh optimizer to determine the optimal solution, thereby forming a closed loop that results in the best lifecycle cost for the system.
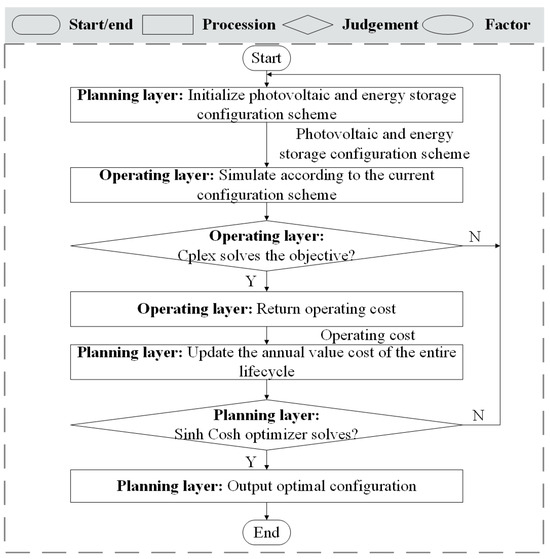
Figure 9.
The solution process and information exchange of the planning and operating dual-layer model.
2.3.2. Configuration Optimization Objective Function
The planning layer aims to minimize the total annual cost of the system’s lifecycle, which includes the initial investment cost , annual operating cost , and annual maintenance cost throughout the entire lifecycle . entails the purchase cost , installation cost , construction cost , and other expenses related to photovoltaic and energy storage equipment . consists of the annual operating cost of photovoltaic power generation and the annual operating cost of system energy storage charging and discharging . After solving the operating layer model, the results return to the planning layer model. The objective function of the planning layer can be expressed as:
where is the equivalent annual cost of the entire lifecycle of the system (CNY); , represents the capacity of photovoltaic and energy storage configuration (kW); , indicates cost per unit capacity (purchase cost, installation cost, construction cost, and other expenses) for photovoltaic and energy storage (CNY/kW); with the device in the system represents photovoltaic or energy storage; represents the annual conversion factor for the total lifecycle cost; denotes the discount rate; indicates work years for the equipment (year); denotes the photovoltaic power generation (kW); indicates the energy storage charging and discharging power (kW); , are, respectively, the load demand before and after demand response (kW); is the operating cost per unit power of photovoltaic (CNY/kW); is the operating cost per unit power of energy storage (CNY/kW); indicates the unit power demand response cost (CNY/kW); is the annual conversion coefficient for the entire lifecycle cost.
The operating layer aims for economic efficiency by minimizing electricity costs, reducing carbon emissions, and optimizing reliability with low interaction power. To address the varying dimensions of multiple objectives, this work normalizes the objective functions and applies a weighted optimization method.
The economic objective function expression is:
where is the power purchased by the system from the power grid at time (kW); represents the system load power at time (kW); represents the electricity price purchased by the system from the grid at time (CNY/kW); denotes the calculation cycle.
The low-carbon objective function is expressed as:
where is the power sold by the system to the power grid at time (kW); indicates the carbon emission distribution coefficient per unit of electricity (kW/tCO2).
The reliability objective function is expressed as:
where is the average interaction power between PEDF and the power grid at time (kW).
The comprehensive objective function can be expressed as:
where , and represent the weights of economic, low-carbon, and reliability objectives, respectively.
2.3.3. Configuration Optimization Constraints
The PEDF system’s configuration optimization must consider the dynamic energy balance involving building photovoltaic power generation, building–grid interaction power, energy storage charging and discharging power, and the building’s electricity load. The constraints for building PEDF systems include:
- Power balance constraint
- Photovoltaic output constraint
- Energy storage charging and discharging constraint
- Interconnection line constraint
- Demand Response Constraint
2.3.4. Configuration Optimization Solution
The proposed optimization approach uses two separate layers of models. The planning layer sends system configuration combinations to the operating layer, and the operating layer transmits the system operating cost back to the planning layer. This exchange ultimately leads to obtaining the system configuration optimization results.
The approach reformulates the optimization problem of PEDF system configuration into a constrained optimization problem, described as follows:
where , denote the constraint condition for solving equations and inequalities in the model.
2.4. Evaluation System
Based on the specific situation and configuration optimization results of the PEDF system, an evaluation index system for system configuration optimization is established, considering different application scenarios and stakeholder perspectives, across three dimensions: economy, low carbon emissions, and reliability. A new building and an existing building are evaluated based on these indexes, with the existing building evaluated using the Dare-Entropy Weight-Method-Topsis Method (Dare-EW-Topsis) to comprehensively evaluate the effects of optimizing the PEDF system’s configuration.
The evaluation process of the PEDF system is illustrated in Figure 10. It begins with establishing an index system for the PEDF system comprising primary, secondary, and tertiary indices. Subjective weights for each index are determined using the Dare method, while the objective weights are calculated using the Entropy Weight method. An original data matrix is created based on these indices. The results are then ranked and sorted using the Topsis method, leading to the optimized configuration of the PEDF system. The evaluation indexes, along with their calculation formulas, are detailed in Appendix A.
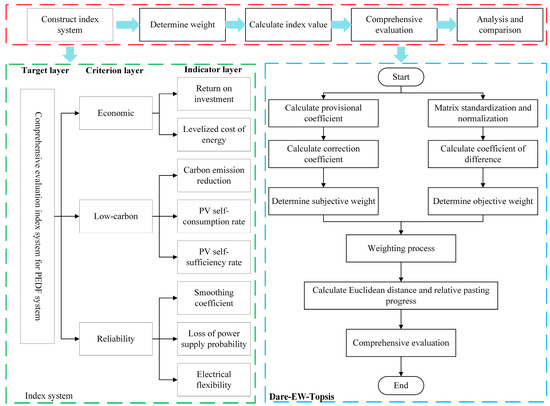
Figure 10.
Comprehensive evaluation process of the PEDF system.
- Dare method to determine subjective weight:
- Entropy Weight method to determine objective weight:
Equations (22) and (23) standardize the positive and negative indexes in the original evaluation matrix for evaluation object and evaluation indexes. indicates the result of standardized processing; and denote the maximum and minimum values of the evaluation index ; present the result of normalized processing; , and denote the information entropy, coefficient of difference, and objective weight of the evaluation indexes for .
- Topsis method comprehensive evaluation
3. Case Studies
This study utilizes accurate data from two different sets of buildings in a specific region of China to present an optimization and evaluation framework for configuring the PEDF system. It emphasizes its practical application in various scenarios. Validating this framework through case studies is essential for verifying its effectiveness in optimizing PEDF systems.
3.1. New Office Building
This study evaluates a newly constructed office building with a land area of 5000 m2 in Guangzhou, Guangdong, China (113°14′ E and 23°22′ N), to validate the proposed framework. The specific building structure is illustrated in Figure 11a. The building’s loads vary due to factors such as scale, climate zone, actual function, and reliance on air conditioning and lighting. It includes air conditioning, an LED screen, microwave, water heater, LED lighting, office equipment, and sockets. An electric vehicle charging station has been incorporated to serve at least 10% of the parking capacity. The maximum expected annual load is estimated at 1245 kW.
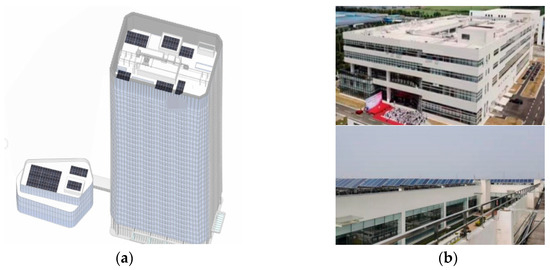
Figure 11.
Specific structure of the building: (a) new office building; (b) existing commercial buildings.
The electrical load for this building is classified as a second- or third-level load, indicating smaller load capacities and low requirements. Thus, a single-ended radial structure has been selected, utilizing a single-pole bus connection with voltage levels of DC750V, DC375V, and DC48V. Other system components are connected to the power grid via bidirectional AC/DC. The topology of the building’s PEDF system is illustrated in Figure 12. The building’s ample rooftop space makes it an ideal site for photovoltaic installation. Due to high solar radiation intensity and high efficiency of Poly-Si PV panels, the rooftop solar system is configured as shown in Figure 8. To manage peak shaving and valley filling, this project selected lithium-iron-phosphate batteries for their high energy density and long discharge times. Details on the configuration results are in Appendix A. Time-of-use electricity prices used in the configuration optimization process are detailed in Table 4, while Table 5 outlines optimization parameters, including photovoltaic lifespan and energy storage lifespan, among others.
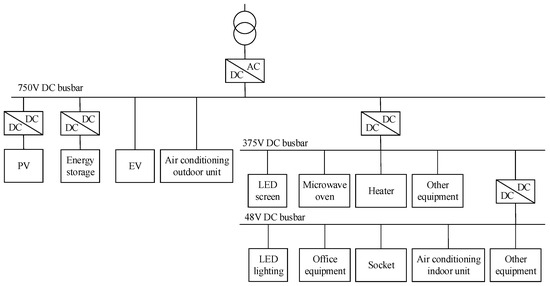
Figure 12.
Topology of office building PEDF system.
Table 4.
The time-of-use electricity price in a specific location in China.
Table 5.
Configure optimization parameters.
The calculation results for evaluation indicators of the three configuration schemes for new office buildings are presented in Table 6, and the comprehensive evaluation process is detailed in Table 7. The evaluation index results show that within a shorter return on investment, the levelized cost of electricity drops below 0.5 CNY/kW and carbon emission exceeds 1.5 million kilograms. The photovoltaic self-consumption rate will rise above 70%, and the self-sufficiency rate will increase to over 45%. Additionally, the system’s smoothing coefficient is expected to surpass 45%, and the probability of power supply loss will fall below 45%, with electricity flexibility increasing to over 25%. The comprehensive evaluation indicates that the optimized configuration achieved the highest score, emphasizing low-carbon strategies, followed by reliability and economy. These findings suggest that the configuration optimization and evaluation framework effectively improve the PEDF system configuration in new office buildings.
Table 6.
Evaluation results of the office building PEDF system.
Table 7.
Comprehensive evaluation results of office building configuration.
3.2. Existing Commercial Building
An existing commercial building situated on 2000 m2 of land in an industrial park in Suzhou, Jiangsu, China (120°26′ E and 31°22′ N) serves as a case study for further validating the proposed framework. The specific building structure is shown in Figure 11b. It features a 200 kW photovoltaic power generation system. The evaluation results of the existing system are shown in Table 8. Commercial buildings exhibit high energy consumption density, significant seasonal and temporal fluctuations, and considerable demand for lighting and air conditioning, along with the potential for renewable energy utilization. It contains various loads, including elevators, network equipment, water heaters, lighting, monitoring equipment, and sockets, as well as electric vehicle charging stations occupying at least 10% of its parking space. The maximum annual load is 462 kW.
Table 8.
Results before and after configuration evaluation are indexed in the specific commercial building.
The building has a limited load capacity and requires moderate power supply reliability. Thus, a single-ended radial structure with a single-pole bus connection is adopted, operating at DC voltages of 750 V, 375 V, and 48 V. The system integrated various components and connected to the power grid via a bidirectional AC/DC converter. The topology structure of the building’s PEDF system is shown in Figure 13. The building has sufficient roof space for photovoltaic installations, with additional facade space available if necessary. Its design meets aesthetic requirements and does not impact nearby structures. Given high solar radiation intensity, BIPV is employed and the photovoltaic configuration process is shown in Figure 8. For energy management, lithium-iron-phosphate batteries have been chosen to assist with peak shaving and valley filling. Critical interactive devices have been configured. The specific configuration results are presented in Appendix A. The time-of-use electricity prices used in the configuration optimization process are detailed in Table 4.
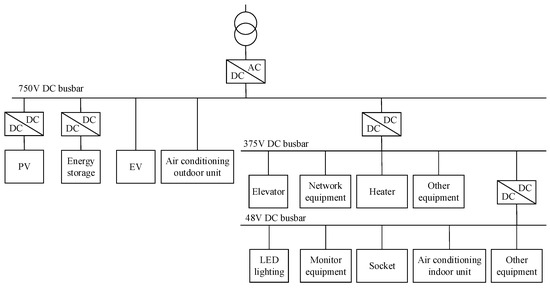
Figure 13.
Topology of the PEDF system in the specific commercial building.
Table 8 presents a detailed list of evaluation indicators before and after the configuration of existing commercial buildings, while Table 9 provides a comprehensive overview of the evaluation process and results before and after the configuration of these buildings. The investment return period evaluation index has been set to 9999 due to the inability to achieve investment recovery before optimizing the configuration of existing commercial buildings. The evaluation index results show that commercial buildings can achieve investment returns while reducing levelized cost of electricity to below 0.4 CNY/kW, carbon emission have dropped by over 1 million kilograms, and photovoltaic self-consumption rate has increased to over 40%, with the self-sufficiency rate at over 45%. The system smoothing coefficient is expected to exceed 45%, the probability of power supply loss will fall below 50%, with electricity flexibility increasing to over 10%. However, the photovoltaic self-sufficiency rate in the economic priority is slightly lower than the pre-optimization benchmark, and the system smoothness coefficient for the low-carbon priority has slightly decreased. The comprehensive evaluation results indicate that the system’s rating has improved after the optimization, with the highest score in reliability optimization, followed by economy and low-carbon considerations. These results validate the effectiveness of the framework proposed in this research for optimizing PEDF systems in existing commercial buildings.
Table 9.
Comprehensive evaluation results before and after the configuration in the specific commercial building.
4. Discussion
4.1. Contributions
This research develops a practical framework for optimizing and evaluating the PEDF system configuration. Two case studies are presented—one for newly constructed office buildings and the other for existing commercial buildings. The framework provides tools to enhance the PEDF configuration for various stakeholders, supporting economic, low-carbon, and safe operations across different scenarios. These case studies illustrate the implementation and effectiveness of the optimization framework.
Framework: This research presents a PEDF system configuration optimization and evaluation framework based on a dual-layer model of planning and operating. It includes three components: system application scenario analysis, system planning and configuration, and system configuration optimization and evaluation. The scenario analysis explores how different building types and configuration objectives affect the PEDF performance, identifying the distinct characteristics and requirements. A set of configuration methods for related elements such as system topology, load, photovoltaics, energy storage, and critical interactive devices has been proposed. For optimization and evaluation, a configuration optimization function is developed with relevant constraints. A commercial solver, combined with an intelligent optimization algorithm, is used to optimize the PEDF system configuration, and the effectiveness is assessed.
Case: The first case examines optimizing the configuration of the PEDF system for a newly built office building, which now functions as a PV self-consumption system. Under the economic priority scheme, it performs better economically than other schemes. The low-carbon priority scheme excels in low-carbon indicators, while the reliability priority scheme leads comprehensively in reliability indicators. Overall, the low-carbon priority scheme offers the best performance. The second case involves an existing commercial building equipped with 200 kW of photovoltaic power. After optimization, these buildings become photovoltaic grid-output systems, with all three schemes showing improved evaluation indicators compared to their pre-optimized state. The economic priority scheme has a slightly lower self-sufficiency rate than the benchmark, while the low-carbon scheme experiences a minor drop in smoothness, though not significantly. In summary, all three schemes outperform the pre-configuration status, with the reliability priority scheme achieving the best overall results. The proposed framework effectively adapts to various scenarios and provides practical guidance for planning, configuring, and optimizing the PEDF system.
In addition, to verify the effectiveness of the dual-layer model, this study compared and analyzed it with traditional energy scheduling strategies such as 100% grid connection, 50% self-use and 50% grid connection, and spontaneous self-use surplus electricity grid connection, taking a newly built office building as a case study (see Table 10). The results show that the dual-layer model outperforms traditional strategies in economic efficiency, low carbon emissions, and power supply reliability by optimizing the energy flow between photovoltaic power generation, energy storage systems, grid interaction, and building loads. This highlights the model’s effectiveness in enhancing overall energy system performance.
Table 10.
Comparison of results of different energy scheduling strategies.
PEDF systems are ideal for buildings with abundant solar energy and space for photovoltaic installations, as well as those aiming to reduce energy consumption and carbon emissions. From the perspective of the interaction between the building and the power grid, PEDF systems are suitable for buildings with high electrical loads, strong fluctuations, and high load flexibility. Additionally, PEDF systems are particularly effective in office and commercial buildings with a high reliance on DC equipment and strict electrical reliability needs, including both new constructions and renovated existing buildings. In summary, the configuration optimization and evaluation framework proposed is applicable across various scenarios for implementing PEDF systems effectively.
4.2. Future Opportunities
The framework created in this research provides a universal guide for designing and evaluating the PEDF system with various stakeholders. However, it may not fully meet all stakeholder needs and requires further development. Specifically, tailored control strategies and an improved optimization framework are necessary to better address daily working conditions. This enhancement will enable the system to quickly respond to faults and changes, preventing loss of control and increasing efficiency.
To better serve the diverse stakeholders and improve configuration optimization for the PEDF system, it is essential to develop a software tool that integrates a PEDF configuration optimization and evaluation framework. This tool will adapt to various application scenarios, allowing for automated analysis, standardized planning and configuration, and optimized evaluation of configurations. By using this software, users can efficiently design systems that are economic, low-carbon, and reliable. Additionally, it will provide a platform for testing the PEDF system’s performance in different scenarios, offering valuable data for decision making in real projects. This research team has already started designing and developing this software, using case studies from this research as examples. In summary, this software tool will significantly enhance the application of the PEDF system in building energy management, promoting green, intelligent, and sustainable development.
5. Conclusions
The PEDF system is currently undergoing the early stages of scalable demonstration, highlighting the need for optimized configuration. This research proposes an optimization and evaluation framework for the PEDF system using a dual-layer model for planning and operating, encompassing essential principles, methods and evaluation indexes. Validated through two case studies, this framework offers the following insights:
- The dual-layer configuration optimization model facilitates flexible design of system topology and the configuration of related elements. It supports the economic, low-carbon, and reliable operation of PEDF systems, accommodating various building applications and configuration objectives.
- The findings from this framework and case studies indicate that PEDF systems can effectively serve diverse building types, including office and commercial spaces. They offer potential benefits such as renewable energy utilization, energy conservation, and emission reduction, improving interaction with the grid and the conversion of building loads to DC. This framework can be applied to various scenarios where PEDF systems are relevant.
- Moreover, this scalability of this framework opens opportunities for future research to investigate expanded control strategies and operational conditions for the PEDF system. Developing related configuration optimization software will further enhance the system’s capabilities, providing a broad landscape for future research and optimization efforts related to the PEDF system.
Author Contributions
Conceptualization, J.K. and T.L.; methodology, T.L. and J.K.; software, T.L., P.Y. and H.W.; validation, T.L., P.Y. and H.W.; formal analysis, P.Y. and X.H.; investigation, H.W. and X.H.; resources, J.K.; data curation, T.L., P.Y. and H.W.; writing—original draft preparation, T.L.; writing—review and editing, T.L., W.L. and J.K.; visualization, T.L., W.L. and J.K.; supervision, W.L. and J.K.; project administration, W.L. and J.K.; funding acquisition, J.K. All authors have read and agreed to the published version of the manuscript.
Funding
This research was funded by the National Key R&D Program of China (2021YFB1600200); the Guizhou Science and Technology Plan Project (Guizhou Science Support [2023] General 409) and the Key R&D Program of Shaanxi Province (2023-YBSF-285).
Institutional Review Board Statement
Not applicable.
Informed Consent Statement
Not applicable.
Data Availability Statement
The data presented in this study are available on request from the corresponding author.
Conflicts of Interest
The authors have no competing interests to declare that are relevant to the content of this article.
Abbreviations
The following abbreviations are used in this manuscript:
| PEDF | Photovoltaic, energy storage, direct current and flexibility |
| PV | Photovoltaic |
| ES | Energy storage |
| ROI | Return on investment |
| LOCE | Levelized cost of energy |
| CCER | Carbon emission reduction |
| RSC | PV self-consumption rate |
| RSS | PV self-sufficiency rate |
| LPSP | Loss of power supply probability |
Appendix A
Table A1.
Evaluation indexes of the PEDF system.
Table A1.
Evaluation indexes of the PEDF system.
| Index | Calculation Formula | Evaluation Content |
|---|---|---|
| Return on investment [37,38] | is the initial investment cost of the system (CNY); is the system operation and maintenance cost (CNY); is the annual revenue of the system (CNY). | Evaluate and measure economic efficiency through the ratio of system costs to benefits. |
| Levelized cost of energy [39] | is the annual cost of the system (CNY). | Measure the electricity cost by the ratio of its annual costs to its annual electricity consumption. |
| Carbon emission reduction | Measure the low-carbon performance by reducing its annual carbon emissions. | |
| PV self-consumption rate [40,41,42] | is the photovoltaic power generation consumed locally by the building (kW). | The closer the value is to 1, the less light is discarded, or the electricity needs to be connected to the grid. |
| PV self-sufficiency rate [40,41,42] | The closer the value is to 1, the electricity needs to be connected to the grid, and the lower the dependence on the grid. | |
| Smoothing coefficient [9,10,14] | The level of stability of the building system is measured by the interaction power between the system and the power grid. The closer the value is to 1, the more stable the electricity consumption is. | |
| Loss of power supply Probability [43,44] | is the difference between the system’s PV power generation and the building’s electricity consumption at that time (kW). | The difference between the photovoltaic power generation and the system’s electricity consumption measures the system’s power supply reliability. A positive value indicates that the system needs power from the grid, while a negative value indicates that the system’s photovoltaic power generation is surplus and connected to the grid. |
| Electrical flexibility [3,45] | is the flexible load power of the system (kW); is the rated power of the operating equipment of the system (kW); is the number of system runs. | By measuring the system’s reliability through its flexible load regulation capability. |
Table A2.
Configuration results of the office building PEDF system.
Table A2.
Configuration results of the office building PEDF system.
| Objective | Equipment Type | Capacity | Equipment Parameters |
|---|---|---|---|
| Economic priority | Photovoltaic (kW) | 1848 | Poly-Si PV panels |
| Energy storage (kW) | 594 | Lithium iron phosphate battery | |
| Transformer (kVA) | 1500 | Two units, one primary and one backup | |
| AC/DC (kW) | 500 | One unit | |
| PV DC/DC (kW) | 1000 | One unit | |
| ES DC/DC (kW) | 300 | One unit | |
| LOAD DC/DC (kW) | 900 | One unit | |
| low-carbon priority | Photovoltaic (kW) | 1628 | Poly-Si PV panels |
| Energy storage (kW) | 300 | Lithium iron phosphate battery | |
| Transformer (kVA) | 1500 | Two units, one primary and one backup | |
| AC/DC (kW) | 500 | One unit | |
| PV DC/DC (kW) | 900 | One unit | |
| ES DC/DC (kW) | 100 | One unit | |
| LOAD DC/DC (kW) | 900 | One unit | |
| Reliability priority | Photovoltaic (kW) | 1638 | Poly-Si PV panels |
| Energy storage (kW) | 345 | Lithium iron phosphate battery | |
| Transformer (kVA) | 1500 | Two units, one primary and one backup | |
| AC/DC (kW) | 450 | One unit | |
| PV DC/DC (kW) | 900 | One unit | |
| ES DC/DC (kW) | 150 | One unit | |
| LOAD DC/DC (kW) | 900 | One unit |
Table A3.
Configuration results of the PEDF system in the specific commercial building.
Table A3.
Configuration results of the PEDF system in the specific commercial building.
| Objective | Equipment Type | Capacity | Equipment Parameters |
|---|---|---|---|
| Economic priority | Photovoltaic (kW) | 1689 | Poly-Si PV panels |
| Energy storage (kW) | 414 | Lithium iron phosphate battery | |
| Transformer (kVA) | 1000 | Two units, one primary and one backup | |
| AC/DC (kW) | 500 | One unit | |
| PV DC/DC (kW) | 900 | One unit | |
| ES DC/DC (kW) | 200 | One unit | |
| LOAD DC/DC (kW) | 300 | One unit | |
| low-carbon priority | Photovoltaic (kW) | 1287 | Poly-Si PV panels |
| Energy storage (kW) | 282 | Lithium iron phosphate battery | |
| Transformer (kVA) | 1000 | Two units, one primary and one backup | |
| AC/DC (kW) | 350 | One unit | |
| low-carbon priority | PV DC/DC (kW) | 700 | One unit |
| ES DC/DC (kW) | 100 | One unit | |
| LOAD DC/DC (kW) | 300 | One unit | |
| Reliability priority | Photovoltaic (kW) | 1155 | Poly-Si PV panels |
| Energy storage (kW) | 51 | Lithium iron phosphate battery | |
| Transformer (kVA) | 1000 | Two units, one primary and one backup | |
| AC/DC (kW) | 350 | One unit | |
| PV DC/DC (kW) | 600 | One unit | |
| ES DC/DC (kW) | 50 | One unit | |
| LOAD DC/DC (kW) | 300 | One unit |
References
- Xie, L.; Singh, C.; Mitter, S.K.; Dahleh, M.A.; Oren, S.S. Toward carbon-neutral electricity and mobility: Is the grid infrastructure ready? Joule 2021, 5, 1908–1913. [Google Scholar] [CrossRef]
- Jiang, M.; Qi, L.; Yu, Z.; Wu, D.; Si, P.; Li, P.; Wei, W.; Yu, X.; Yan, J. National level assessment of using existing airport infrastructures for photovoltaic deployment. Appl. Energy 2021, 298, 117195. [Google Scholar] [CrossRef]
- Bouchekara, H.R.E.H.; Sha’aban, Y.A.; Shahriar, M.S.; Abdullah, S.M.; Ramli, M.A. Sizing of hybrid PV/battery/wind/diesel microgrid system using an improved decomposition multi-objective evolutionary algorithm considering uncertainties and battery degradation. Sustainability 2023, 15, 11073. [Google Scholar] [CrossRef]
- Şirin, C.; Goggins, J.; Hajdukiewicz, M. A review on building-integrated photovoltaic/thermal systems for green buildings. Appl. Therm. Eng. 2023, 229, 120607. [Google Scholar] [CrossRef]
- Farghali, M.; Osman, A.I.; Mohamed, I.M.; Chen, Z.; Chen, L.; Ihara, I.; Yap, P.-S.; Rooney, D.W. Strategies to save energy in the context of the energy crisis: A review. Environ. Chem. Lett. 2023, 21, 2003–2039. [Google Scholar] [CrossRef]
- Heptonstall, P.J.; Gross, R.J. A systematic review of the costs and impacts of integrating variable renewables into power grids. Nat. Energy 2021, 6, 72–83. [Google Scholar] [CrossRef]
- Chen, S.; Li, Z.; Li, W. Integrating high share of renewable energy into power system using customer-sited energy storage. Renew. Sustain. Energy Rev. 2021, 143, 110893. [Google Scholar] [CrossRef]
- Sun, D.; Kang, J.; Hao, B.; Li, Y.; Yu, H.; Sun, L. Analysis on characteristics of PEDF(photovoltaic, energy storagedirect current and flexibility) building cases and discussion onrelated problems of system design. HV&AC 2024, 54, 118–129+134. [Google Scholar]
- Liu, X.; Liu, X.; Jiang, Y.; Zhang, T.; Hao, B. Photovoltaics and energy storage integrated flexible direct current distribution systems of buildings: Definition, technology review, and application. CSEE J. Power Energy Syst. 2022, 9, 829–845. [Google Scholar] [CrossRef]
- Zhang, Y.; Ma, T.; Yang, H. A review on capacity sizing and operation strategy of grid-connected photovoltaic battery systems. Energy Built Environ. 2024, 5, 500–516. [Google Scholar] [CrossRef]
- Jain, D.; Saxena, D. Comprehensive review on control schemes and stability investigation of hybrid AC-DC microgrid. Electr. Power Syst. Res. 2023, 218, 109182. [Google Scholar] [CrossRef]
- Al-Ismail, F.S. DC Microgrid Planning, Operation, and Control: A Comprehensive Review. IEEE Access 2021, 9, 36154–36172. [Google Scholar] [CrossRef]
- Li, H.; Chen, Q.; Zhang, T.; Liu, X.; Liu, X.; Dai, Y.; Guan, B. Can distributed photovoltaic-battery systems power buildings with favorable matching performance and techno-economic feasibility? Energy Convers. Manag. 2024, 306, 118260. [Google Scholar] [CrossRef]
- Li, S.J.; Zhang, T.; Liu, X.C.; Liu, X.H. A Battery Capacity Configuration Method of a Photovoltaic and Battery System Applied in a Building Complex for Increased Self-Sufficiency and Self-Consumption. Energies 2023, 16, 2190. [Google Scholar] [CrossRef]
- Chen, Q.; Kuang, Z.H.; Liu, X.H.; Zhang, T. The tradeoff between electricity cost and CO2 emission in the optimization of photovoltaic-battery systems for buildings. J. Clean. Prod. 2023, 386, 135761. [Google Scholar] [CrossRef]
- Yu, D.; Tang, R.; Pan, L.Z. Optimal allocation of photovoltaic energy storage in DC distribution network based on interval linear programming. J. Energy Storage 2024, 85, 110981. [Google Scholar] [CrossRef]
- Ollas, P.; Thiringer, T.; Persson, M.; Markusson, C. Energy Loss Savings Using Direct Current Distribution in a Residential Building with Solar Photovoltaic and Battery Storage. Energies 2023, 16, 1131. [Google Scholar] [CrossRef]
- Zia, M.F.; Elbouchikhi, E.; Benbouzid, M. Optimal operational planning of scalable DC microgrid with demand response, islanding, and battery degradation cost considerations. Appl. Energy 2019, 237, 695–707. [Google Scholar] [CrossRef]
- Zhong, X.J.; Sun, X.B.; Wu, Y.H. A bi-layer optimization method of the grid-connected microgrid based on the multi-strategy of the beluga whale algorithm. Front. Energy Res. 2024, 12, 1336205. [Google Scholar] [CrossRef]
- Ma, X.F.; Duan, Y.; Meng, X.Y.; Zhu, Q.P.; Wang, Z.; Zhu, S.J. Optimal configuration for photovoltaic storage system capacity in 5G base station microgrids. Glob. Energy Interconnect. 2021, 4, 465–475. [Google Scholar] [CrossRef]
- Shi, Z.D.; Wang, W.S.; Huang, Y.H.; Li, P.; Dong, L. Simultaneous Optimization of Renewable Energy and Energy Storage Capacity with the Hierarchical Control. CSEE J. Power Energy Syst. 2022, 8, 95–104. [Google Scholar] [CrossRef]
- Eskander, M.M.; Silva, C.A. Techno-economic and environmental comparative analysis for DC microgrids in households: Portuguese and French household case study. Appl. Energy 2023, 349, 121495. [Google Scholar] [CrossRef]
- Pan, W.J.; Zhang, Y.; Jin, W.W.; Liang, Z.D.; Wang, M.N.; Li, Q.Q. Photovoltaic-Based Residential Direct-Current Microgrid and Its Comprehensive Performance Evaluation. Appl. Sci. 2023, 13, 12890. [Google Scholar] [CrossRef]
- Modu, B.; Abdullah, M.P.; Sanusi, M.A.; Hamza, M.F. DC-based microgrid: Topologies, control schemes, and implementations. Alex. Eng. J. 2023, 70, 61–92. [Google Scholar] [CrossRef]
- Khon, K.; Chhlonh, C.; Vai, V.; Alvarez-Herault, M.-C.; Raison, B.; Bun, L. Comprehensive low voltage microgrid planning methodology for rural electrification. Sustainability 2023, 15, 2841. [Google Scholar] [CrossRef]
- Cabana-Jiménez, K.; Candelo-Becerra, J.E.; Sousa Santos, V. Comprehensive analysis of microgrids configurations and topologies. Sustainability 2022, 14, 1056. [Google Scholar] [CrossRef]
- Leskarac, D.; Moghimi, M.; Liu, J.; Water, W.; Lu, J.; Stegen, S. Hybrid AC/DC Microgrid testing facility for energy management in commercial buildings. Energy Build. 2018, 174, 563–578. [Google Scholar] [CrossRef]
- Jahani, A.; Zare, K.; Khanli, L.M. Short-term load forecasting for microgrid energy management system using hybrid SPM-LSTM. Sustain. Cities Soc. 2023, 98, 104775. [Google Scholar] [CrossRef]
- Eltamaly, A.M.; Almutairi, Z.A. Nested Optimization Algorithms for Accurately Sizing a Clean Energy Smart Grid System, Considering Uncertainties and Demand Response. Sustainability 2025, 17, 2744. [Google Scholar] [CrossRef]
- Chen, H.; Dang, Z. A Hybrid Deep Learning-Based Load Forecasting Model for Logical Range. Appl. Sci. 2025, 15, 5628. [Google Scholar] [CrossRef]
- Jiang, H.; Yao, L.; Lu, N.; Qin, J.; Zhang, X.T.; Liu, T.; Zhang, X.X.; Zhou, C.H. Exploring the optimization of rooftop photovoltaic scale and spatial layout under curtailment constraints. Energy 2024, 293, 130721. [Google Scholar] [CrossRef]
- Eyimaya, S.E. Efficiency Analysis of Artificial Intelligence and Conventional Maximum Power Point Tracking Methods in Photovoltaic Systems. Appl. Sci. 2025, 15, 5586. [Google Scholar] [CrossRef]
- Matusz-Kalász, D.; Bodnár, I.; Jobbágy, M. An Overview of CNN-Based Image Analysis in Solar Cells, Photovoltaic Modules, and Power Plants. Appl. Sci. 2025, 15, 5511. [Google Scholar] [CrossRef]
- Jimenez-Castillo, G.; Martinez-Calahorro, A.J.; Rus-Casas, C.; Snytko, A.; Munoz-Rodriguez, F.J. Performance analysis indices for Rooftop Solar Photovoltaic system. IEEE Lat. Am. Trans. 2023, 21, 999–1006. [Google Scholar] [CrossRef]
- Zhu, J.; Chen, S.; Ji, C. Day-Ahead Planning and Scheduling of Wind/Storage Systems Based on Multi-Scenario Generation and Conditional Value-at-Risk. Appl. Sci. 2025, 15, 5386. [Google Scholar] [CrossRef]
- Bai, J.; Li, Y.; Zheng, M.; Khatir, S.; Benaissa, B.; Abualigah, L.; Wahab, M.A. A sinh cosh optimizer. Knowl.-Based Syst. 2023, 282, 111081. [Google Scholar] [CrossRef]
- Lyu, C.; Zhang, Y.C.; Bai, Y.L.; Yang, K.; Song, Z.X.; Ma, Y.H.; Meng, J.H. Inner-outer layer co-optimization of sizing and energy management for renewable energy microgrid with storage. Appl. Energy 2024, 363, 123066. [Google Scholar] [CrossRef]
- Arashrad, P.; Sharafi Laleh, S.; Rabet, S.; Yari, M.; Soltani, S.; Rosen, M.A. Real-Time Modeling of a Solar-Driven Power Plant with Green Hydrogen, Electricity, and Fresh Water Production: Techno-Economics and Optimization. Sustainability 2025, 17, 3555. [Google Scholar] [CrossRef]
- Lou, J.W.; Wang, Y.X.; Wang, H.Y.; Wang, J.F.; Chen, L.Q.; Zhang, J.Y.; Islam, M.R.; Chua, K.J. Operation characteristics analysis and optimal dispatch of solar thermal-photovoltaic hybrid microgrid for building. Energy Build. 2024, 315, 114340. [Google Scholar] [CrossRef]
- Zhan, S.C.; Dong, B.; Chong, A.D. Improving energy flexibility and PV self-consumption for a tropical net zero energy office building. Energy Build. 2023, 278, 112606. [Google Scholar] [CrossRef]
- Amry, Y.; Elbouchikhi, E.; Le Gall, F.; Ghogho, M.; El Hani, S. Optimal sizing and energy management strategy for EV workplace charging station considering PV and flywheel energy storage system. J. Energy Storage 2023, 62, 106937. [Google Scholar] [CrossRef]
- Wang, Y.F.; Gao, W.J.; Li, Y.; Qian, F.Y.; Yao, W.X. Techno-economic analysis of the transition toward the energy self-sufficiency community based on virtual power plant. Front. Energy Res. 2023, 11, 1010846. [Google Scholar] [CrossRef]
- Zhang, J.; Xiao, F.; Ma, F.; Sun, L.; Zhang, Y.; Xiao, R.L. Capacity optimization allocation method for off-grid RES-H2 microgrid system considering the load-follow-source mechanism. Electr. Power Syst. Res. 2024, 231, 110378. [Google Scholar] [CrossRef]
- Agajie, T.F.; Fopah-Lele, A.; Amoussou, I.; Ali, A.; Khan, B.; Mahela, O.P.; Nuvvula, R.S.; Ngwashi, D.K.; Soriano Flores, E.; Tanyi, E. Techno-economic analysis and optimization of hybrid renewable energy system with energy storage under two operational modes. Sustainability 2023, 15, 11735. [Google Scholar] [CrossRef]
- Shao, Z.M.; Liu, C.X.; Yao, R.; Wang, C.; Li, L.T.; Liu, Z.; Liu, Y.M.; Zhou, Z.Y. Hybrid bilevel optimization-based interaction between the distribution grid and PV microgrids with differentiated demand response. Front. Energy Res. 2023, 11, 1297650. [Google Scholar] [CrossRef]
Disclaimer/Publisher’s Note: The statements, opinions and data contained in all publications are solely those of the individual author(s) and contributor(s) and not of MDPI and/or the editor(s). MDPI and/or the editor(s) disclaim responsibility for any injury to people or property resulting from any ideas, methods, instructions or products referred to in the content. |
© 2025 by the authors. Licensee MDPI, Basel, Switzerland. This article is an open access article distributed under the terms and conditions of the Creative Commons Attribution (CC BY) license (https://creativecommons.org/licenses/by/4.0/).