

Augmented Reality for Learning Algorithms: Evaluation of Its Impact on Students’ Emotions Using Artificial Intelligence

 ,
,  , and
, and
Abstract
Abstract
1. Introduction
2. Related Work
2.1. Emotions in Learning
2.2. Assessment of Emotions
3. Technological Resources: DARA and Emolive
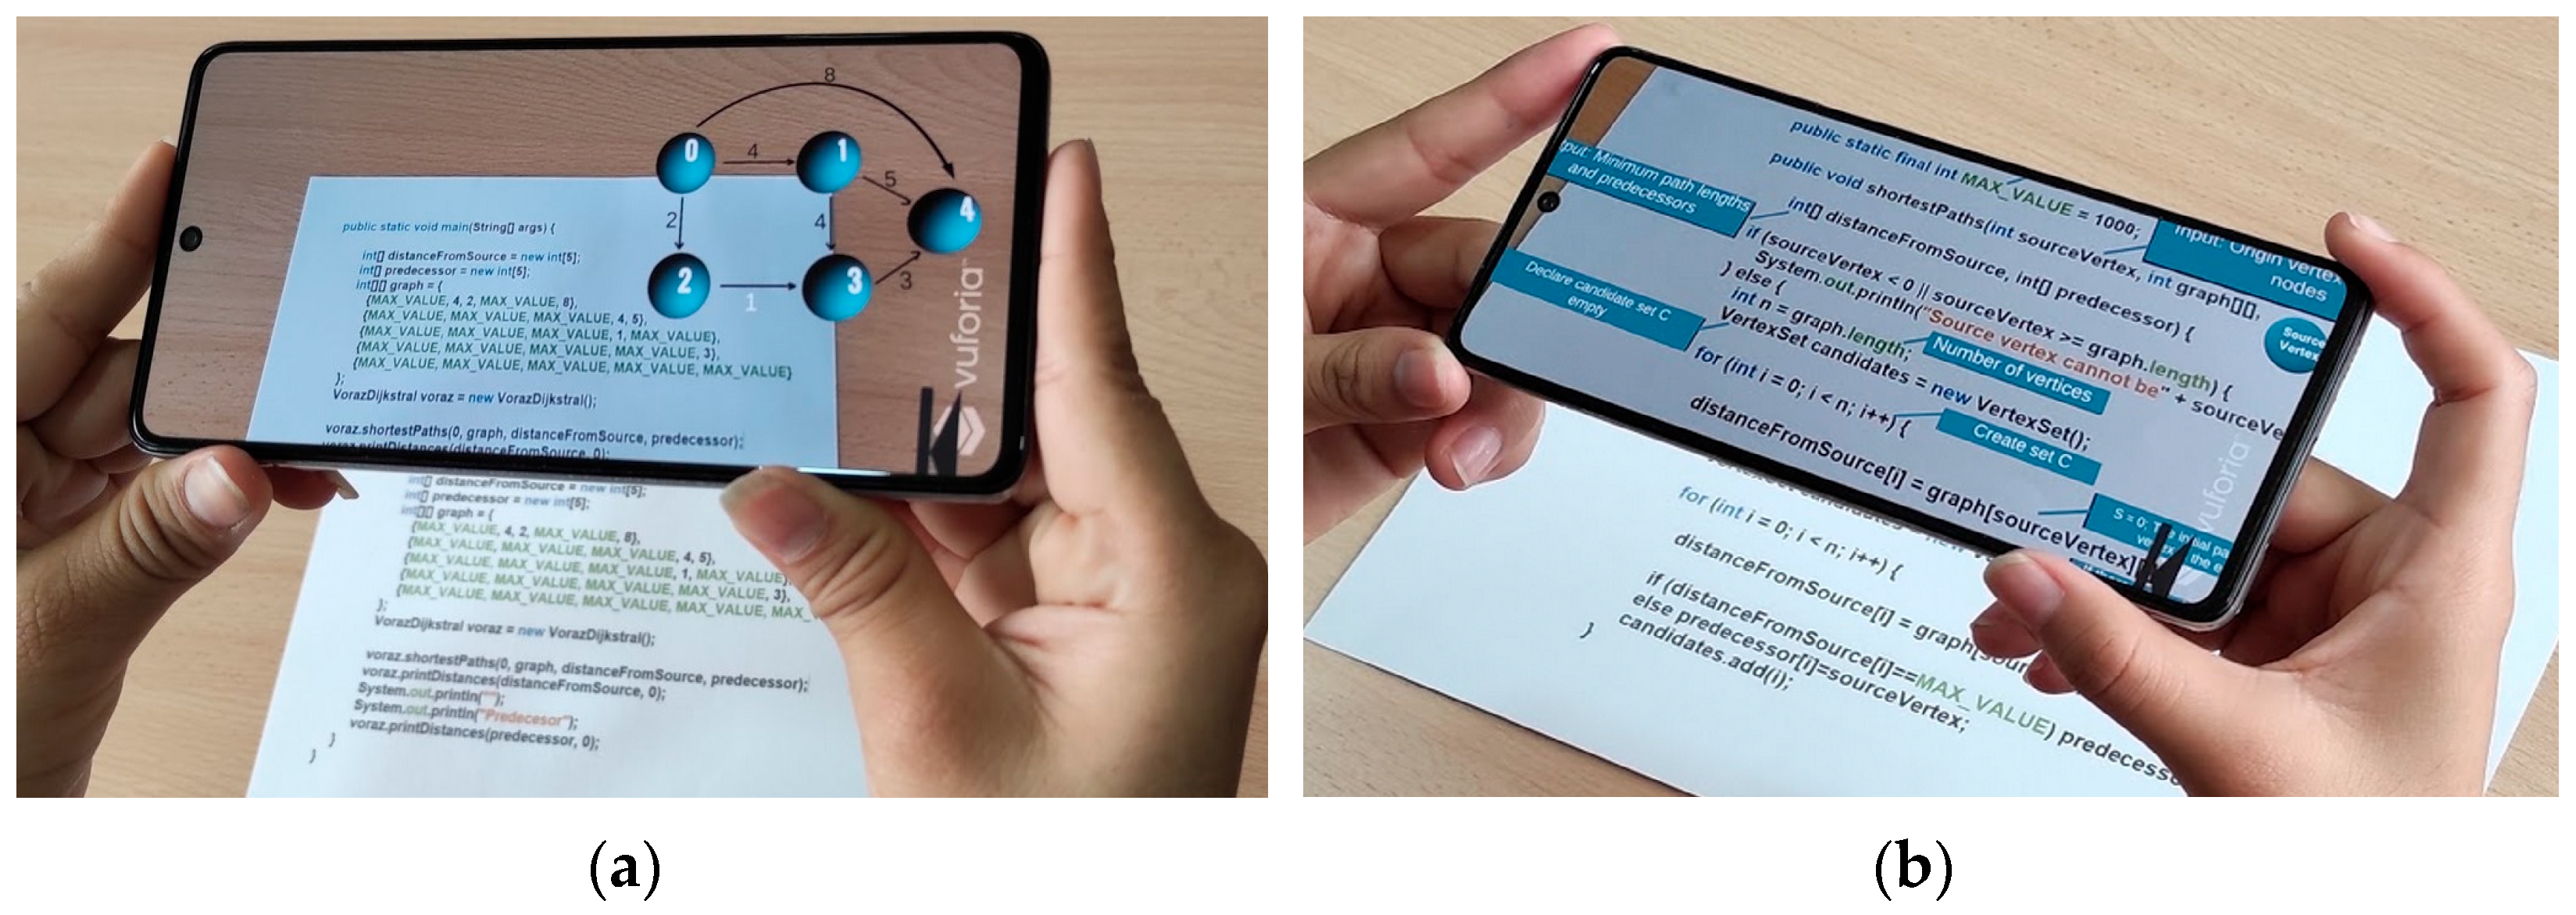
3.1. DARA in Learning Greedy Algorithms with Augmented Reality
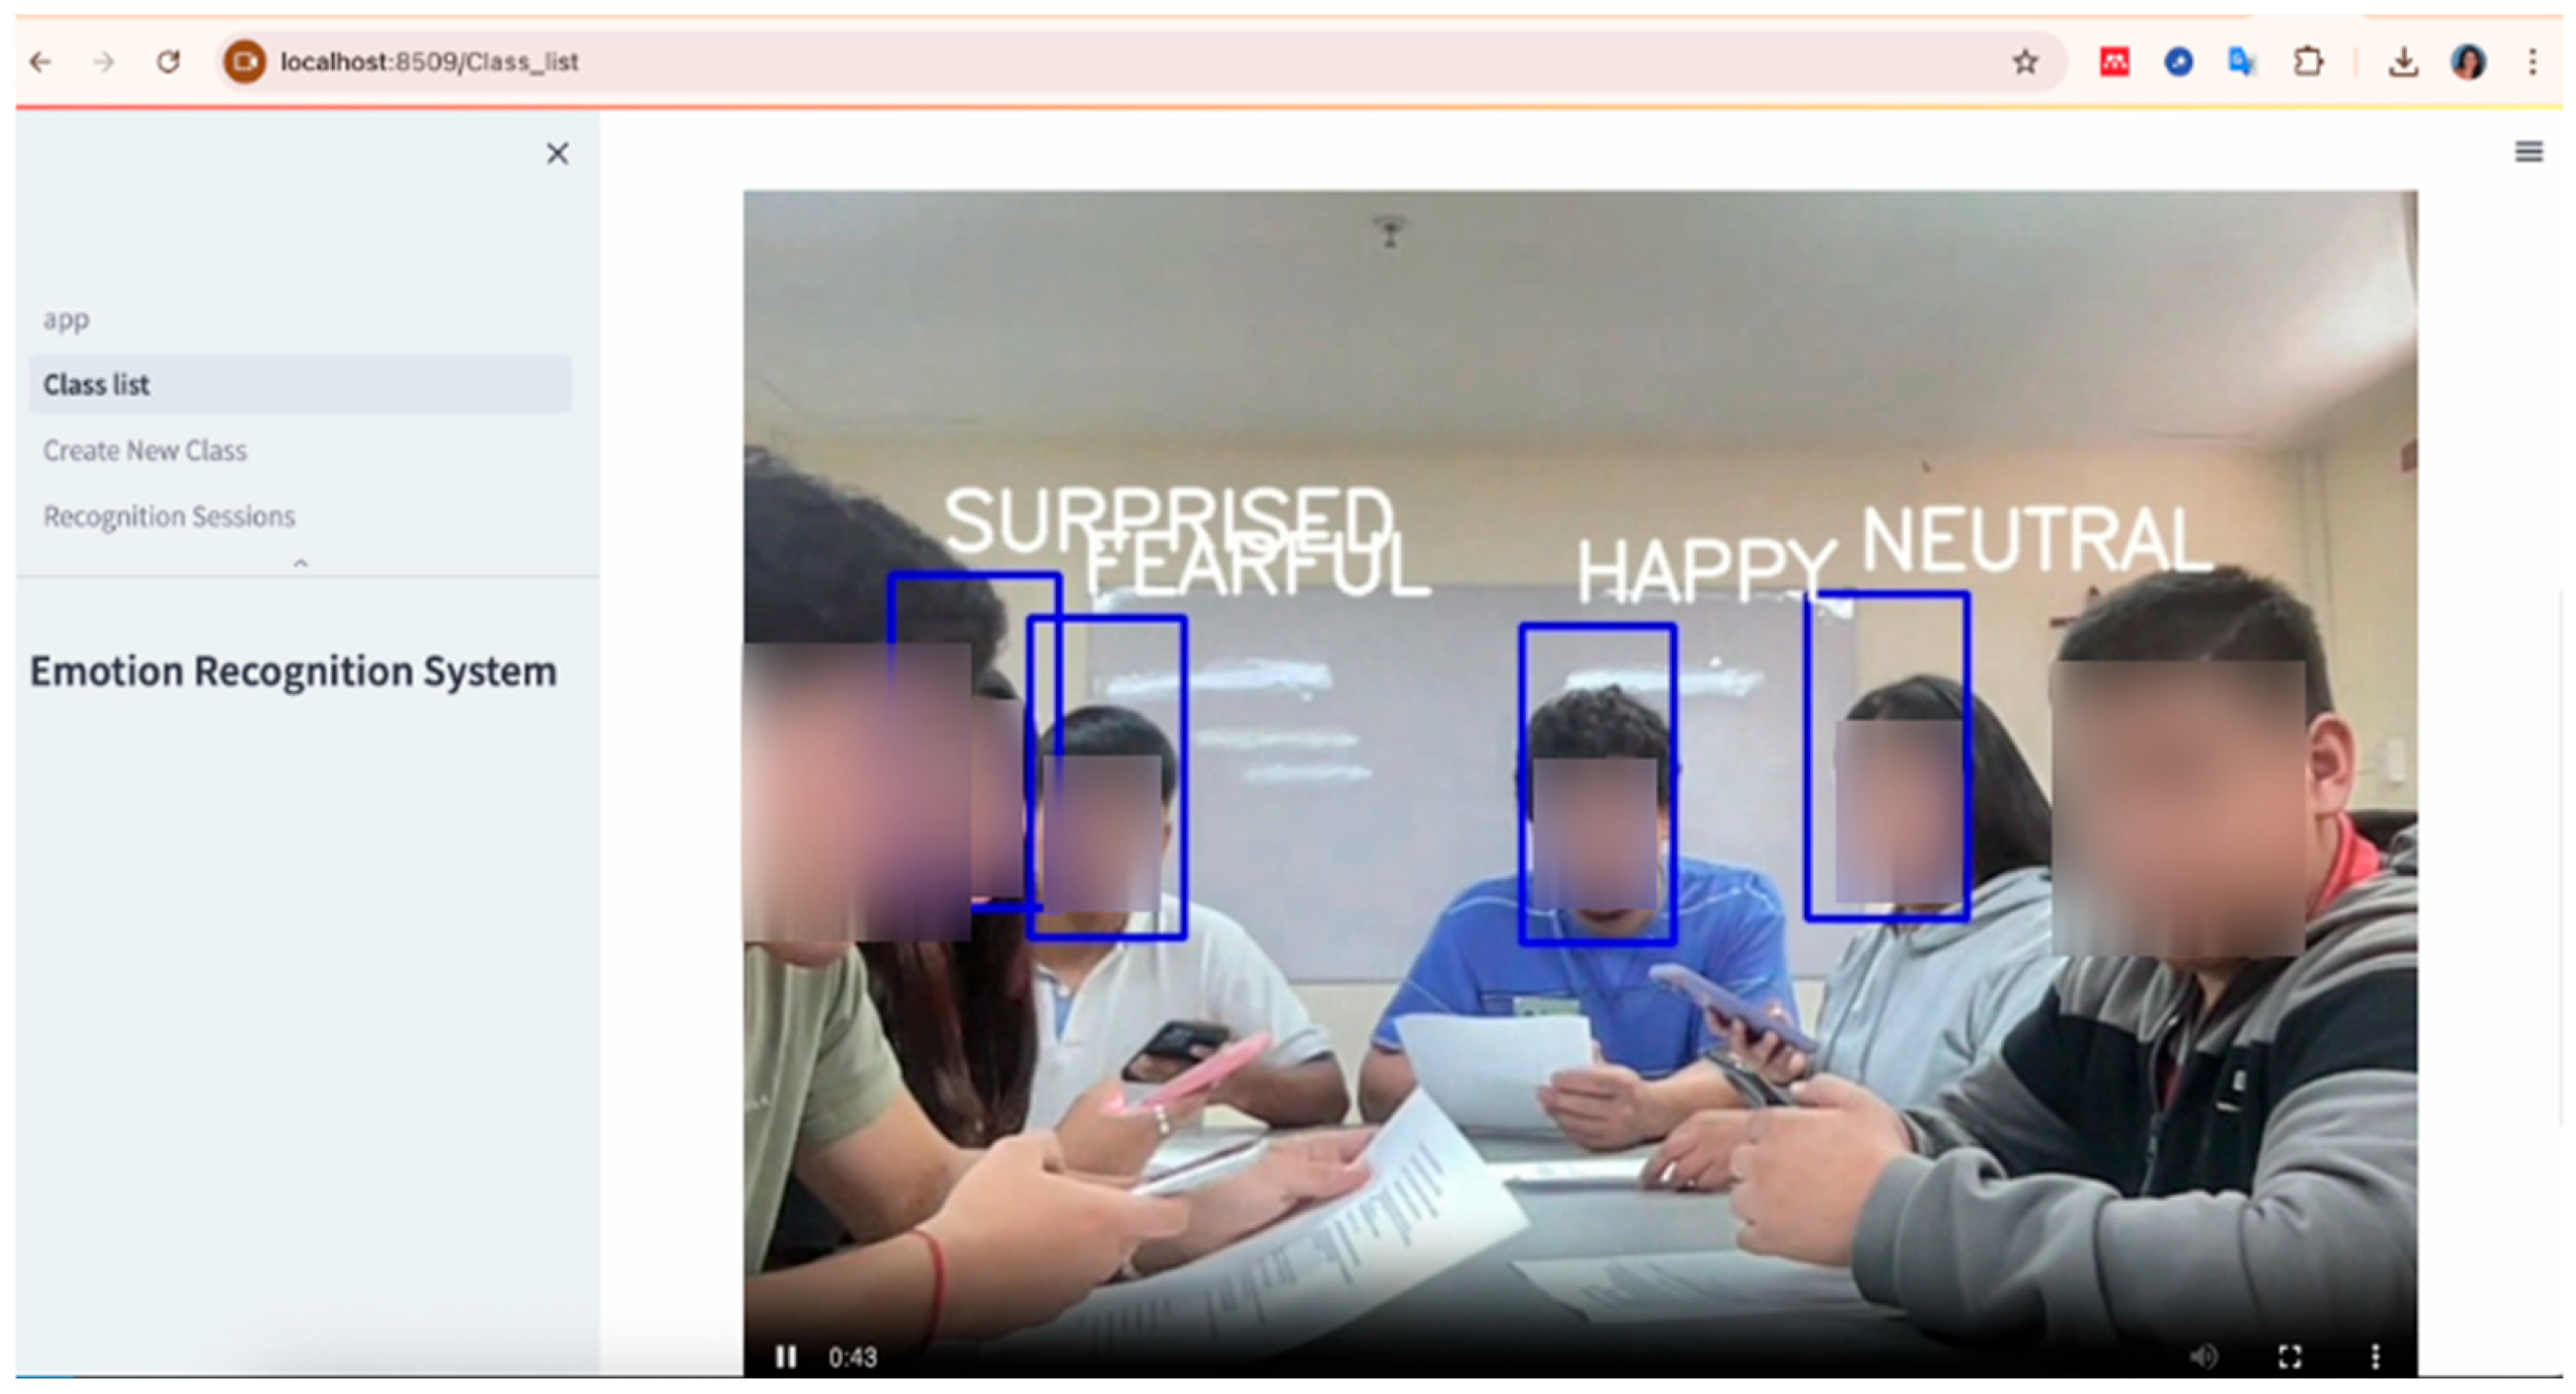
3.2. Emotion Detection with Emolive
4. Methodology
4.1. Hypotheses
4.2. Participants
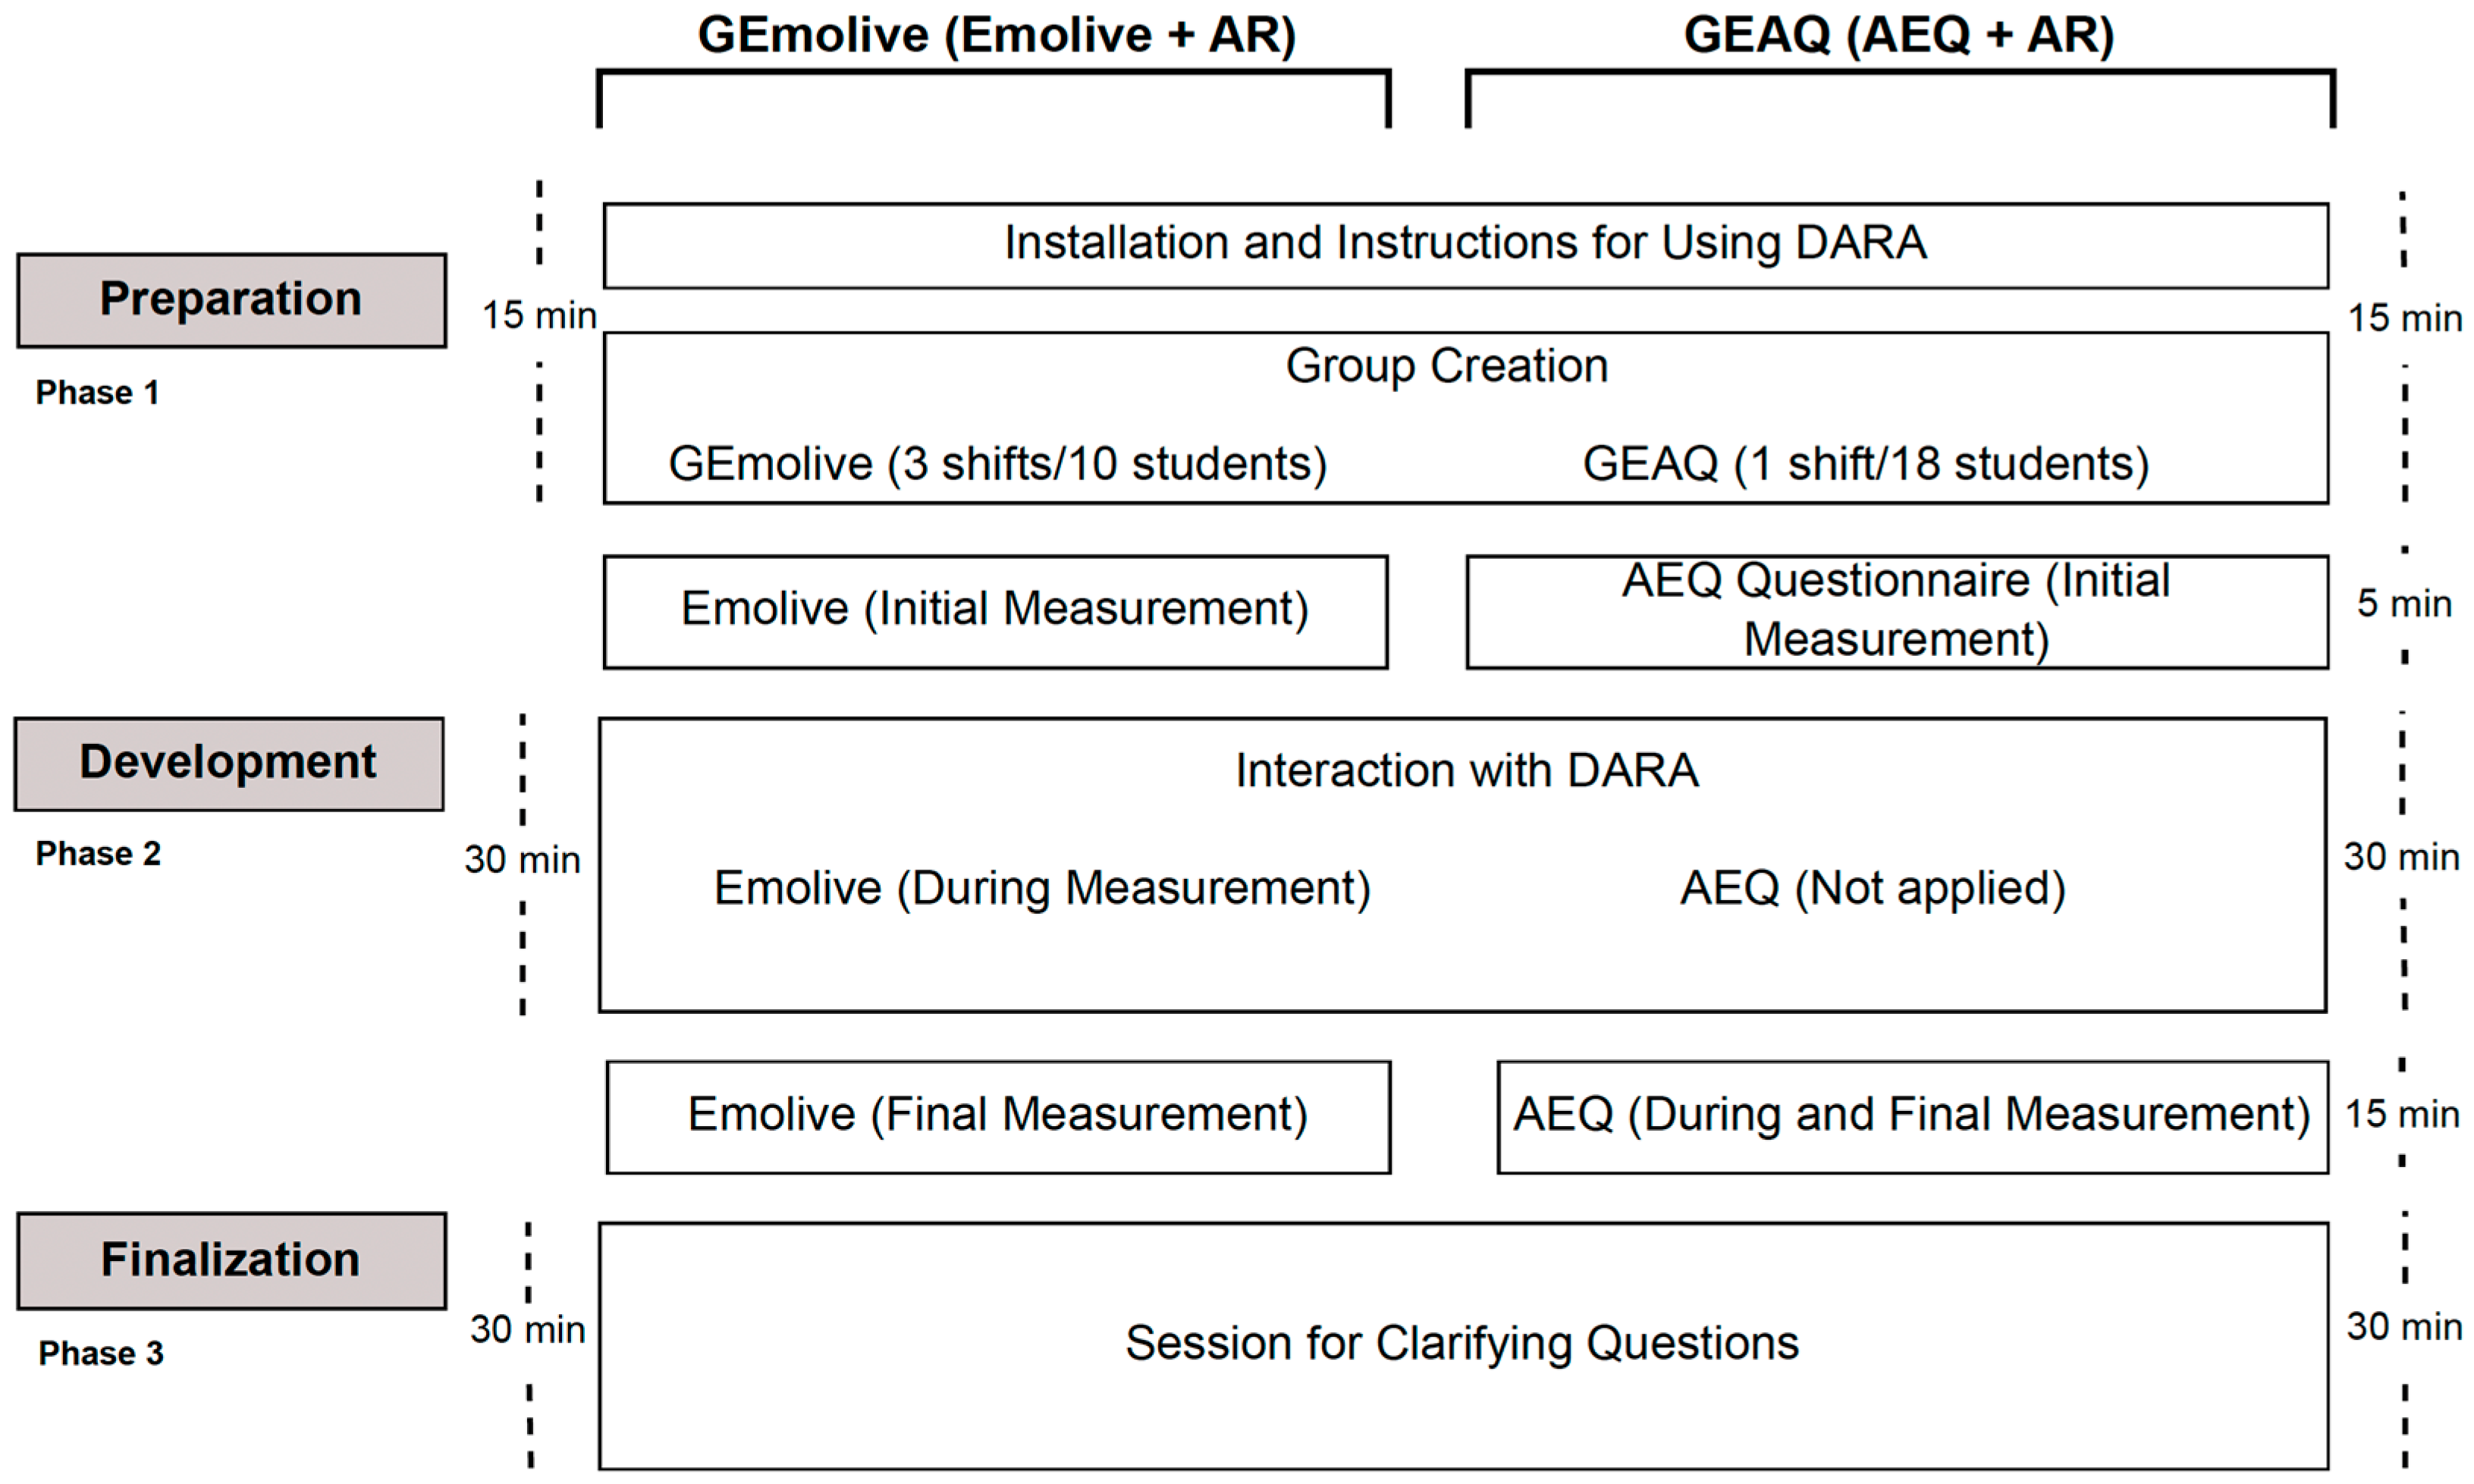
4.3. Procedure
- Getting Started. Fifteen minutes were spent providing students with instructions on how to use the DARA app and installing it on their mobile devices.
- Development. Thirty minutes were allocated to complete the work assignment. Students had the Java source code for Dijkstra’s algorithm on paper and used DARA to read the problem statement and an explanation of the greedy scheme. DARA then activated the smartphone camera, and students focused on the parts of the source code they found the most complex or did not understand, to obtain additional explanations on the smartphone screen. The students then manipulated an animation of the algorithm for a given graph.
- Finalization. This final phase, which lasted 30 min, was used to address students’ questions and concerns.
5. Results
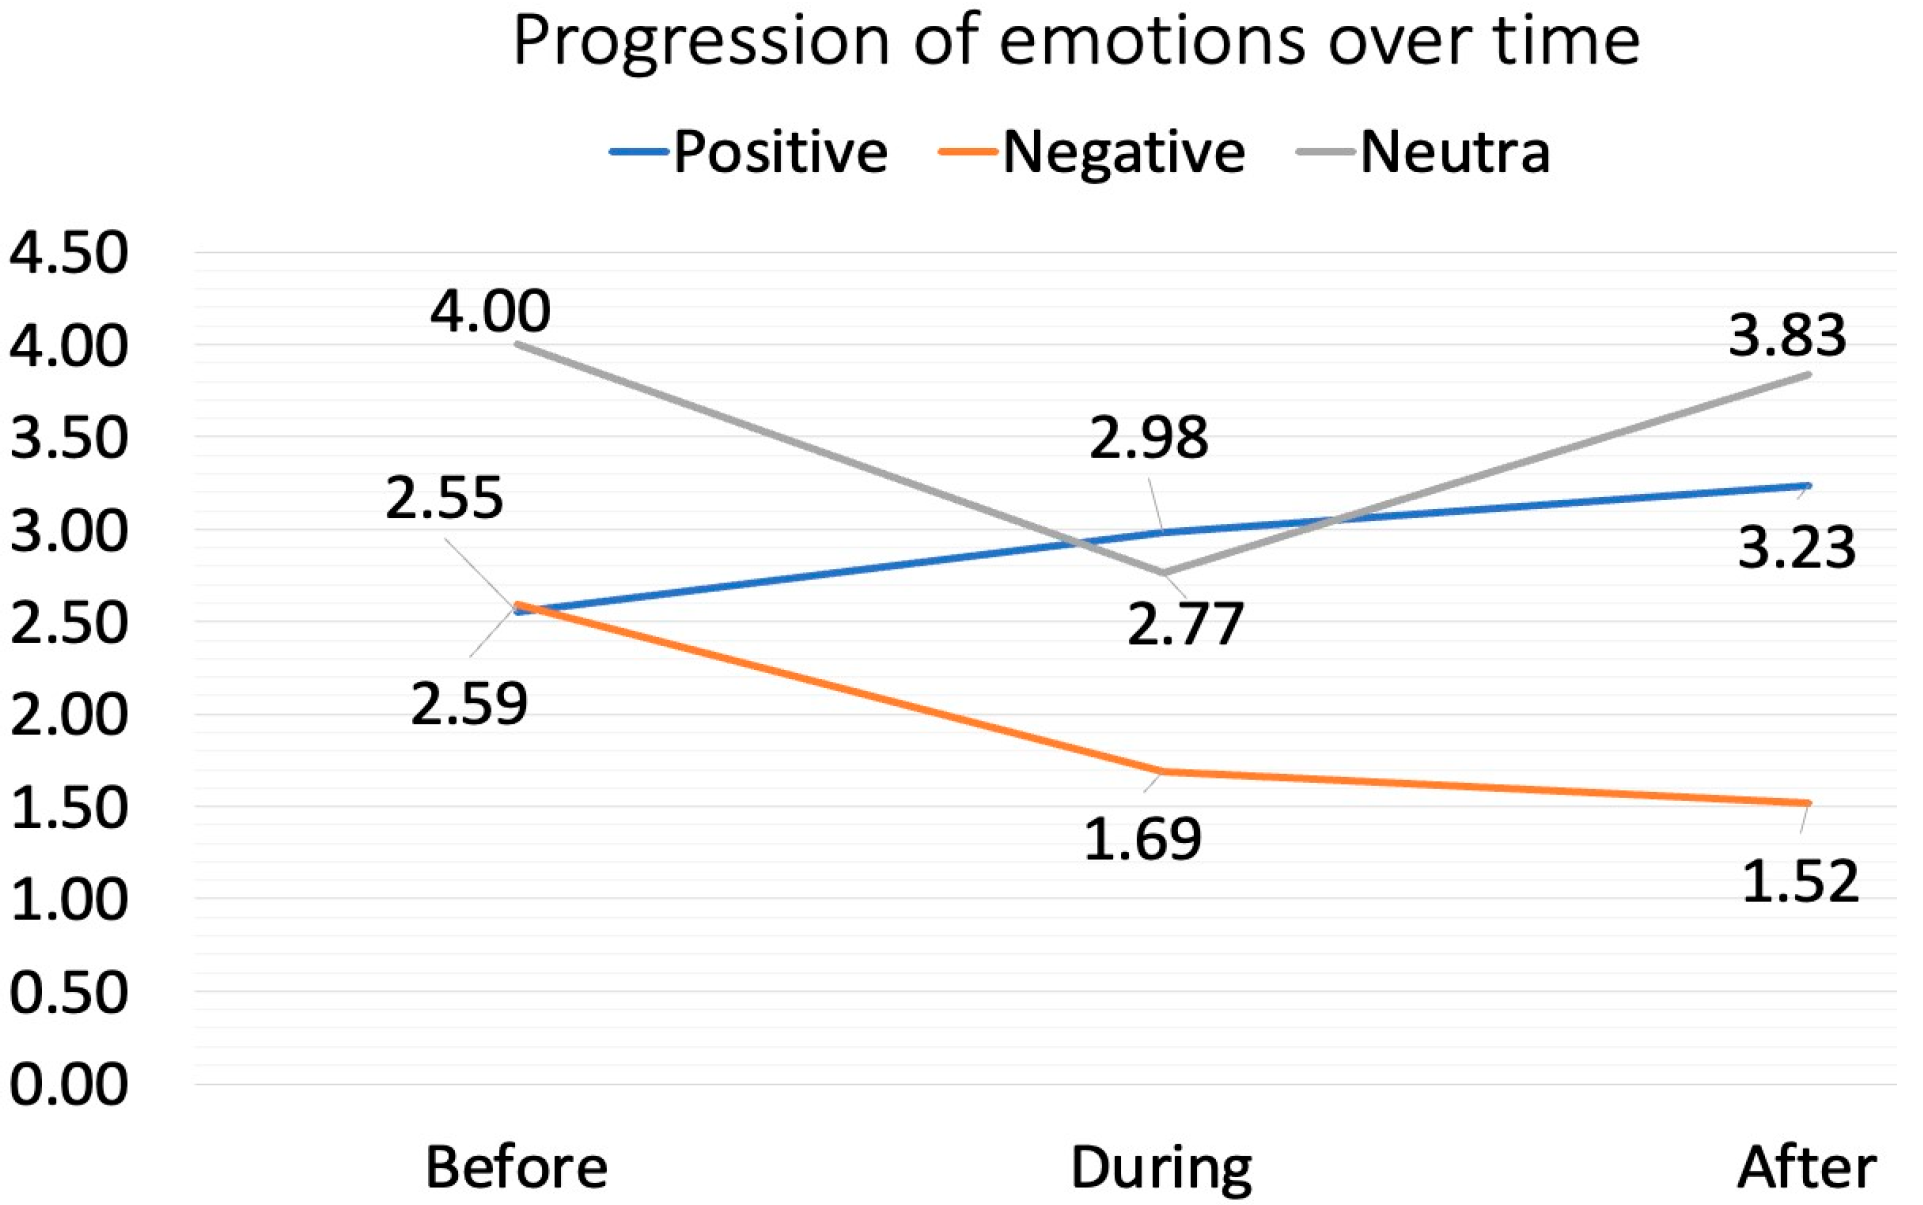
5.1. Analysis of H1: Different Between Positive and Negative Emotions
5.2. Analysis of H2: Emotional Variation Through Psycometric Questioinnaire and Facial Recognition
6. Discussion
6.1. Hypothesis 1
6.2. Hypothesis 2
6.3. Limitations
7. Conclusions
Supplementary Materials
Author Contributions
Funding
Institutional Review Board Statement
Informed Consent Statement
Data Availability Statement
Acknowledgments
Conflicts of Interest
References
- Altinpulluk, H. Determining the Trends of Using Augmented Reality in Education between 2006–2016. Educ. Inf. Technol. 2019, 24, 1089–1114. [Google Scholar] [CrossRef]
- Avila-Garzon, C.; Bacca-Acosta, J.; Duarte, J.; Betancourt, J. Augmented Reality in Education: An Overview of Twenty-Five Years of Research. Contemp. Educ. Technol. 2021, 13, ep312. [Google Scholar] [CrossRef]
- Moreno-Fernández, O.; Solís-Espallargas, C.; Moreno-Crespo, P.; Ferreras-Listán, M. Augmented Reality and Primary Education: Linkage, Potentiality and Applicability from the Perspective of Teachers in Initial Training. Hacet. Univ. J. Educ. 2023, 38, 388–389. [Google Scholar] [CrossRef]
- Huang, T.-C.; Tseng, H.-P. Extended Reality in Applied Sciences Education: A Systematic Review. Appl. Sci. 2025, 15, 4038. [Google Scholar] [CrossRef]
- Cabero-Almenara, J.; Llorente-Cejudo, C.; Martinez-Roig, R. The Use of Mixed, Augmented and Virtual Reality in History of Art Teaching: A Case Study. Appl. Syst. Innov. 2022, 5, 44. [Google Scholar] [CrossRef]
- Ibáñez, M.B.; Uriarte Portillo, A.; Zatarain Cabada, R.; Barrón, M.L. Impact of Augmented Reality Technology on Academic Achievement and Motivation of Students from Public and Private Mexican Schools. A Case Study in a Middle-School Geometry Course. Comput. Educ. 2020, 145, 103734. [Google Scholar] [CrossRef]
- Vistorte, A.O.R.; Deroncele-Acosta, A.; Ayala, J.L.M.; Barrasa, A.; López-Granero, C.; Martí-González, M. Integrating Artificial Intelligence to Assess Emotions in Learning Environments: A Systematic Literature Review. Front. Psychol. 2024, 15, 1387089. [Google Scholar] [CrossRef]
- Kaur, M.; Kumar, M. Facial Emotion Recognition: A Comprehensive Review. Expert Syst. 2024, 41, e13670. [Google Scholar] [CrossRef]
- Kalateh, S.; Estrada-Jimenez, L.A.; Nikghadam-Hojjati, S.; Barata, J. A Systematic Review on Multimodal Emotion Recognition: Building Blocks, Current State, Applications, and Challenges. IEEE Access 2024, 12, 103976–104019. [Google Scholar] [CrossRef]
- Gómez-Rios, M.D.; Paredes-Velasco, M.; Hernández-Beleño, R.D.; Fuentes-Pinargote, J.A. Analysis of Emotions in the Use of Augmented Reality Technologies in Education: A Systematic Review. Comput. Appl. Eng. Educ. 2023, 31, 216–234. [Google Scholar] [CrossRef]
- Ibáñez, M.-B.; Delgado-Kloos, C. Augmented Reality for STEM Learning: A Systematic Review. Comput. Educ. 2018, 123, 109–123. [Google Scholar] [CrossRef]
- Pekrun, R.; Goetz, T.; Frenzel, A.C.; Barchfeld, P.; Perry, R.P. Measuring Emotions in Students’ Learning and Performance: The Achievement Emotions Questionnaire (AEQ). Contemp. Educ. Psychol. 2011, 36, 36–48. [Google Scholar] [CrossRef]
- Watson, D.; Clark, L.A.; Tellegen, A. Development and Validation of Brief Measures of Positive and Negative Affect: The PANAS Scales. J. Pers. Soc. Psychol. 1988, 54, 1063. [Google Scholar] [CrossRef]
- Petrowski, K.; Albani, C.; Zenger, M.; Brähler, E.; Schmalbach, B. Revised Short Screening Version of the Profile of Mood States (POMS) From the German General Population. Front. Psychol. 2021, 12, 631668. [Google Scholar] [CrossRef] [PubMed]
- Connor, K.M.; Davidson, J.R.T. Development of a New Resilience Scale: The Connor-Davidson Resilience Scale (CD-RISC). Depress. Anxiety 2003, 18, 76–82. [Google Scholar] [CrossRef]
- Bosch, N.; D’Mello, S.; Baker, R.; Ocumpaugh, J.; Shute, V.; Ventura, M.; Wang, L.; Zhao, W. Automatic Detection of Learning-Centered Affective States in the Wild. In Proceedings of the 20th International Conference on Intelligent User Interfaces, Atlanta, GA, USA, 29 March–1 April 2015; ACM: New York, NY, USA, 2015; pp. 379–388. [Google Scholar]
- Xie, J.; Luo, Y.; Wang, S.; Liu, G. Electroencephalography-Based Recognition of Six Basic Emotions in Virtual Reality Environments. Biomed. Signal Process. Control 2024, 93, 106189. [Google Scholar] [CrossRef]
- Flores, E.; Solis-Fonseca, J.-P.; Cuba-Aguilar, C.-R.; Rosales-Fernandez, J.-H.; Barahona-Altao, Y.-G. Emotional State of the Classroom through Artificial Intelligence to Improve the Teaching-Learning Process in a University. In Proceedings of the 21th LACCEI International Multi-Conference for Engineering, Education and Technology, Buenos Aires, Argentina, 17–21 July 2023; Latin American and Caribbean Consortium of Engineering Institutions: Boca Raton, FL, USA, 2023. [Google Scholar] [CrossRef]
- Bogicevic Sretenovic, M.; Milenkovic, I.; Jovanovic, B.; Simic, D.; Minovic, M.; Milovanovic, M. Bringing Biometric Sensors to the Classroom: A Fingerprint Acquisition Laboratory for Improving Student Motivation and Commitment. Appl. Sci. 2020, 10, 880. [Google Scholar] [CrossRef]
- Wang, X.; Ren, Y.; Luo, Z.; He, W.; Hong, J.; Huang, Y. Deep Learning-Based EEG Emotion Recognition: Current Trends and Future Perspectives. Front. Psychol. 2023, 14, 1126994. [Google Scholar] [CrossRef]
- Wilhelm, R.A.; Lacey, M.F.; Masters, S.L.; Breeden, C.J.; Mann, E.; MacDonald, H.V.; Gable, P.A.; White, E.J.; Stewart, J.L. Greater Weekly Physical Activity Linked to Left Resting Frontal Alpha Asymmetry in Women: A Study on Gender Differences in Highly Active Young Adults. Psychol. Sport. Exerc. 2024, 74, 102679. [Google Scholar] [CrossRef]
- Wang, Z.; Wang, Y.; Tang, Y.; Pan, Z.; Zhang, J. Knowledge Distillation Based Lightweight Domain Adversarial Neural Network for Electroencephalogram-Based Emotion Recognition. Biomed. Signal Process. Control 2024, 95, 106465. [Google Scholar] [CrossRef]
- Canazas, A.P.; Blaz, J.J.R.; Martínez, P.D.T.; Mamani, X.J. Sistema de Identificación de Emociones a Través de Reconocimiento Facial Utilizando Inteligencia Artificial. Innovación Softw. 2022, 3, 140–150. [Google Scholar] [CrossRef]
- Mukhopadhyay, S.; Sharma, S. Real Time Facial Expression and Emotion Recognition Using Eigen Faces, LBPH and Fisher Algorithms. In Proceedings of the 2020 10th International Conference on Cloud Computing, Data Science & Engineering (Confluence), Noida, India, 29–31 January 2020; IEEE: Piscataway, NJ, USA, 2020; pp. 212–220. [Google Scholar] [CrossRef]
- Aouani, H.; Ben Ayed, Y. Deep Facial Expression Detection Using Viola-Jones Algorithm, CNN-MLP and CNN-SVM. Soc. Netw. Anal. Min. 2024, 14, 65. [Google Scholar] [CrossRef]
- Grassi, D. Supporting Developers’ Emotional Awareness: From Self-Reported Emotions to Biometrics. In Proceedings of the 28th International Conference on Evaluation and Assessment in Software Engineering, Salerno, Italy, 18–21 June 2024; ACM: New York, NY, USA, 2024; pp. 500–504. [Google Scholar]
- Liu, J.; Yan, C.; Liu, W.; Liu, X.; Ding, Y.; Zhou, Y. Research on Learner “Emotion-Behavior-Ability” Characteristics Based on MOOC Online Education User Profiles. Inf. Process Manag. 2025, 62, 104026. [Google Scholar] [CrossRef]
- Huangfu, Q.; Li, H.; Ban, Y.; He, J. An Eye-Tracking Study on the Effects of Displayed Teacher Enthusiasm on Students’ Learning Procedural Knowledge of Chemistry in Video Lectures. J. Chem. Educ. 2024, 101, 259–269. [Google Scholar] [CrossRef]
- Liu, T.; Wang, M.; Yang, B.; Liu, H.; Yi, S. ESERNet: Learning Spectrogram Structure Relationship for Effective Speech Emotion Recognition with Swin Transformer in Classroom Discourse Analysis. Neurocomputing 2025, 612, 128711. [Google Scholar] [CrossRef]
- Velázquez-Iturbide, J.Á. The Design and Coding of Greedy Algorithms Revisited. In Proceedings of the 16th Annual Joint Conference on Innovation and Technology in Computer Science Education, Darmstadt, Germany, 27–29 June 2011; ACM: New York, NY, USA, 2011; pp. 8–12. [Google Scholar]
- Velázquez-Iturbide, J. ángel Reflections on Teaching Algorithm Courses. In Proceedings of the 56th ACM Technical Symposium on Computer Science Education V. 1, Pittsburgh, PA, USA, 26 February–1 March 2025; pp. 1148–1154. [Google Scholar]
- Sahni, S. Data Structures, Algorithms, and Applications in Java; Universities Press: Ibadan, Nigeria, 2000; ISBN 8173715238. [Google Scholar]
- Quiroz-Martinez, M.A.; Díaz-Fernández, S.; Aguirre-Sánchez, K.; Gomez-Rios, M.D. Analysis of Students’ Emotions in Real-Time during Class Sessions through an Emotion Recognition System. In X Congreso Internacional de Ciencia, Tecnología e Innovación para la Sociedad (CITIS 2024); Springer: Cham, Switzerland, 2024. [Google Scholar] [CrossRef]
- Salloum, S.A.; Alomari, K.M.; Alfaisal, A.M.; Aljanada, R.A.; Basiouni, A. Emotion Recognition for Enhanced Learning: Using AI to Detect Students’ Emotions and Adjust Teaching Methods. Smart Learn. Environ. 2025, 12, 21. [Google Scholar] [CrossRef]
- Paredes-Velasco, M.; Velázquez-Iturbide, J.Á.; Gómez-Ríos, M. Augmented Reality with Algorithm Animation and Their Effect on Students’ Emotions. Multimed. Tools Appl. 2023, 82, 11819–11845. [Google Scholar] [CrossRef]
- Fernández Herrero, J.; Gómez Donoso, F.; Roig Vila, R. The First Steps for Adapting an Artificial Intelligence Emotion Expression Recognition Software for Emotional Management in the Educational Context. Br. J. Educ. Technol. 2023, 54, 1939–1963. [Google Scholar] [CrossRef]
- Poitras, E.G.; Harley, J.M.; Liu, Y.S. Achievement Emotions with Location-based Mobile Augmented Reality: An Examination of Discourse Processes in Simulated Guided Walking Tours. Br. J. Educ. Technol. 2019, 50, 3345–3360. [Google Scholar] [CrossRef]
- D’Mello, S.; Graesser, A. Dynamics of Affective States during Complex Learning. Learn. Instr. 2012, 22, 145–157. [Google Scholar] [CrossRef]
- Robinson, M.D.; Clore, G.L. Episodic and Semantic Knowledge in Emotional Self-Report: Evidence for Two Judgment Processes. J. Pers. Soc. Psychol. 2002, 83, 198–215. [Google Scholar] [CrossRef] [PubMed]
- Barrett, L.F.; Adolphs, R.; Marsella, S.; Martinez, A.M.; Pollak, S.D. Emotional Expressions Reconsidered: Challenges to Inferring Emotion From Human Facial Movements. Psychol. Sci. Public Interest 2019, 20, 1–68. [Google Scholar] [CrossRef] [PubMed]
- Calvo, R.A.; D’Mello, S. Affect Detection: An Interdisciplinary Review of Models, Methods, and Their Applications. IEEE Trans. Affect. Comput. 2010, 1, 18–37. [Google Scholar] [CrossRef]

| Emotion (Type) | Before (N = 30) | During (N = 30) | After (N = 30) | |||||||||
|---|---|---|---|---|---|---|---|---|---|---|---|---|
| Min. | Max. | Mean | SD | Min. | Max. | Mean | SD | Min. | Max. | Mean | SD | |
| Anger (negative) | 0.00 | 5.00 | 2.03 | 2.01 | 0.00 | 4.00 | 1.20 | 1.69 | 0.00 | 5.00 | 1.10 | 1.67 |
| Upset (negative) | 0.00 | 0.00 | 0.00 | 0.00 | 0.00 | 0.00 | 0.00 | 0.00 | 0.00 | 0.00 | 0.00 | 0.00 |
| Fearful (negative) | 3.00 | 5.00 | 4.50 | 0.68 | 2.00 | 5.00 | 4.03 | 1.03 | 0.00 | 5.00 | 2.77 | 1.63 |
| Happy (positive) | 0.00 | 5.00 | 2.40 | 1.83 | 0.00 | 5.00 | 3.00 | 1.98 | 1.00 | 5.00 | 3.57 | 1.10 |
| Neutral (neutral) | 0.00 | 5.00 | 4.00 | 1.51 | 0.00 | 5.00 | 2.77 | 1.70 | 2.00 | 5.00 | 3.83 | 1.15 |
| Sad (negative) | 1.00 | 5.00 | 3.83 | 1.29 | 0.00 | 4.00 | 1.53 | 1.20 | 0.00 | 3.00 | 2.20 | 1.10 |
| Surprised (positive) | 0.00 | 4.00 | 2.70 | 1.64 | 0.00 | 5.00 | 2.97 | 1.59 | 0.00 | 5.00 | 2.90 | 1.79 |
| Variable | Sig. |
|---|---|
| Positive-negative emotions (before) | 0.925 |
| Positive-negative emotions (during) | <0.001 |
| Positive-negative emotions (after) | <0.001 |
| Variable (Emotions) | Group (N) | Min. | Max. | Mean | SD |
|---|---|---|---|---|---|
| Positive before | GAEQ (18) | 2.50 | 5.00 | 3.93 | 0.88 |
| GEmolive (30) | 0.00 | 3.50 | 2.55 | 0.98 | |
| Negative before | GAEQ (18) | 1.00 | 4.13 | 2.28 | 0.78 |
| GEmolive (30) | 1.25 | 3.75 | 2.59 | 0.78 | |
| Positive before | GAEQ (18) | 2.59 | 4.95 | 3.85 | 0.65 |
| GEmolive(30) | 0.00 | 4.00 | 2.98 | 1.63 | |
| Negative during | GAEQ (18) | 1.00 | 4.23 | 2.03 | 0.79 |
| GEmolive (30) | 0.50 | 2.75 | 1.69 | 0.69 | |
| Positive after | GAEQ (18) | 2.25 | 5.00 | 3.69 | 0.85 |
| GEmolive (30) | 2.50 | 4.50 | 3.23 | 0.91 | |
| Negative after | GAEQ (18) | 1.44 | 4.19 | 2.44 | 0.85 |
| GEmolive (30) | 0.00 | 3.00 | 1.52 | 0.94 |
| H. | Null Hypothesis | Sig. (U of Mann–Whitney) | Decision |
|---|---|---|---|
| 1 | The distribution of positive emotions before is the same across group categories (AEQ/Emolive) | <0.001 | Reject the null hypothesis |
| 2 | The distribution of negative emotions before is the same across group categories (AEQ/Emolive) | 0.140 | Fail to reject the null hypothesis |
| 3 | The distribution of positive emotions is the same across group categories (AEQ/Emolive) | 0.344 | Fail to reject the null hypothesis |
| 4 | The distribution of negative emotions is the same across group categories (AEQ/Emolive) | 0.151 | Fail to reject the null hypothesis |
| 5 | The distribution of positive emotions after is the same across group categories (AEQ/Emolive) | 0.042 | Reject the null hypothesis |
| 6 | The distribution of negative emotions after is the same across group categories (AEQ/Emolive) | 0.006 | Reject the null hypothesis |
Disclaimer/Publisher’s Note: The statements, opinions and data contained in all publications are solely those of the individual author(s) and contributor(s) and not of MDPI and/or the editor(s). MDPI and/or the editor(s) disclaim responsibility for any injury to people or property resulting from any ideas, methods, instructions or products referred to in the content. |
© 2025 by the authors. Licensee MDPI, Basel, Switzerland. This article is an open access article distributed under the terms and conditions of the Creative Commons Attribution (CC BY) license (https://creativecommons.org/licenses/by/4.0/).
Share and Cite
Gómez-Ríos, M.; Paredes-Velasco, M.; Velázquez-Iturbide, J.Á.; Martínez, M.Á.Q. Augmented Reality for Learning Algorithms: Evaluation of Its Impact on Students’ Emotions Using Artificial Intelligence. Appl. Sci. 2025, 15, 7745. https://doi.org/10.3390/app15147745
Gómez-Ríos M, Paredes-Velasco M, Velázquez-Iturbide JÁ, Martínez MÁQ. Augmented Reality for Learning Algorithms: Evaluation of Its Impact on Students’ Emotions Using Artificial Intelligence. Applied Sciences. 2025; 15(14):7745. https://doi.org/10.3390/app15147745
Chicago/Turabian StyleGómez-Ríos, Mónica, Maximiliano Paredes-Velasco, J. Ángel Velázquez-Iturbide, and Miguel Ángel Quiroz Martínez. 2025. "Augmented Reality for Learning Algorithms: Evaluation of Its Impact on Students’ Emotions Using Artificial Intelligence" Applied Sciences 15, no. 14: 7745. https://doi.org/10.3390/app15147745
APA StyleGómez-Ríos, M., Paredes-Velasco, M., Velázquez-Iturbide, J. Á., & Martínez, M. Á. Q. (2025). Augmented Reality for Learning Algorithms: Evaluation of Its Impact on Students’ Emotions Using Artificial Intelligence. Applied Sciences, 15(14), 7745. https://doi.org/10.3390/app15147745