Article

Research on Deformation Characteristics and Failure Modes of Tunnel Anchoring in Conglomerate Layers Based on Field Scaled Model Tests

1
Changjiang Survey, Planning, Design and Research Co., Ltd., Wuhan 430010, China
2
School of Earth Science and Engineering, Hohai University, Najing 210098, China
*
Author to whom correspondence should be addressed.
Appl. Sci. 2025, 15(14), 7743; https://doi.org/10.3390/app15147743
Submission received: 10 May 2025 / Revised: 3 June 2025 / Accepted: 9 June 2025 / Published: 10 July 2025
(This article belongs to the Special Issue Rock Mechanics and Mining Engineering)

Abstract

Tunnel anchors are critical for suspension bridge stability, yet their theoretical framework remains underdeveloped, limiting engineering applications. This study addresses this gap through a pioneering 1:12 in situ scaled model test, combining geological surveys, rock mechanics testing, and large-scale experimentation on a Yangtze River bridge case. Key findings include (1) quantified rock mechanics parameters for anchorage conglomerates, (2) load–displacement relationships revealing surrounding rock-dominated failure, and (3) deformation thresholds for anchor integrity. The 1:12 in situ model overcomes lab-scale limitations, providing the first high-fidelity validation of tunnel anchor behavior. The results offer essential design benchmarks, advancing both theory and practice for large-span bridges.

1. Introduction

A suspension bridge is a type of large-span bridge that has significant advantages in terms of material performance and the height to span ratio of stiffening beams [1]. At the same time, it has minimal environmental disturbance and can reduce the construction of large-scale foundation projects. It is currently one of the main forms of large-span bridges, with a unique structure and beautiful appearance. The anchoring methods of suspension bridges can be divided into self-anchoring and ground-anchoring. Self-anchored suspension bridges anchor the main cable on both sides of the stiffening beam, resulting in significant axial pressure on the bridge, which is not suitable for large-span bridges [2]. Ground-anchored suspension bridges transmit the main cable force to the ground through anchorages, which are supported by anchorages or surrounding rocks. There is almost no axial force inside the beam, which will not cause instability of the stiffening beam. Therefore, ground-anchored suspension bridges can achieve larger spans and are mostly used for large-span bridges. Ground-anchored anchorages are mainly divided into gravity type and tunnel type according to their mechanism of action. Tunnel anchoring is achieved by setting up inverted wedge-shaped anchorages with wide bottom and narrow top, utilizing the surrounding rock within a certain range of the plug to jointly exert bearing capacity. Compared with gravity type anchorages, tunnel anchorages have smaller engineering quantities, flexible arrangements, and are more economical. Tunnel anchorage demonstrates superior performance over traditional gravity/rock anchorage systems in terms of mechanical efficiency, geological adaptability, and construction economy, particularly for suspension bridge projects in deep overburden and hard rock strata. Future research should focus on its long-term performance under extreme loads (e.g., seismic events and vessel collisions) and the development of intelligent construction technologies to expand its application scope. Based on the many advantages of tunnel anchoring, there have been many successful application cases in bridge engineering, but there are still shortcomings in research on bearing mechanism, failure mode, and anchoring potential excavation, which restricts its further promotion and application in bridge engineering construction [3,4,5].
The tunnel anchor, as the main load-bearing part of the suspension bridge’s main cable, effectively improves the overall stability of the suspension bridge’s main tower and bridge due to its load-bearing characteristics [6]. Therefore, fully considering the bearing capacity and bearing method of tunnel anchors in special geological formations, clarifying the stability, deformation mechanism, and failure mode of tunnel anchor structures and surrounding rocks under load, can effectively clarify the practical application value and promotion significance of tunnel anchors [7].
The concept of tunnel anchor design was first proposed 1932 and the construction example was the Washington Bridge built with basalt rock as the surrounding rock, and the second suspension bridge using tunnel anchor was built in the San Francisco Bay Area four years later [8,9,10]. Subsequently, the United Kingdom, as the second country to apply tunnel anchor technology to suspension bridges, built the Forth Road Bridge with coarse basalt as the anchor rock in 1964 [11]. Japan was the first country in Asia to adopt tunnel anchors and built Shimotsui Seto Bridge in diorite and granite surrounding rock mass [12].
At present, tunnel anchors of suspension bridges can be divided into self-anchored and ground-anchored according to the main cable anchoring forms. Since the anchoring structure of ground anchored suspension bridges and the surrounding rock mass bear the main bridge load, there are more application cases of ground anchored suspension bridges than self-anchored suspension bridges, which improves the crossing ability of suspension bridges on the basis of ensuring the deformation of bridges [13]. Among the bridges built and put into use at different times, the proportion of tunnel anchor suspension bridges is gradually increasing, but the application of tunnel anchors is affected by factors such as topography, formation lithology, and surrounding rock properties, etc. The early design is relatively conservative, and the application is mostly concentrated on short-span bridges. With the development of tunnel anchor technology, tunnel anchors are gradually applied to long-span suspension bridges.
At present, the construction and application of suspension bridges using tunnel anchors are gradually increasing, and the anchoring strata continue to expand to the soft rock mass with poor rock quality and low mechanical properties, shallow surface rock mass, and areas with complex geological conditions. However, the bearing mode of the tunnel anchor structure and the creep deformation of the surrounding rock mass bearing the uplift load affect the stability of the joint bearing system formed by “tunnel anchor and surrounding rock” [14,15]. Therefore, with the increasing application range of tunnel anchors and the trend of complex and diversified anchoring strata, it is of great significance to understand the load-bearing mode of tunnel anchors, the stress and deformation trend of anchoring structure and surrounding rock, and the failure mode and stability of the “tunnel anchor-surrounding rock” co-bearing system [16,17].
Tunnel anchor is a key component for the main cable tension transfers to rock mass, and the stability of rock mass in the anchoring area is also a key factor affecting the use of tunnel anchor. The mechanical properties of rock mass in the anchoring area and the bearing state of the anchoring structure jointly affect the safety performance of the suspension bridge and the overall stability of the bridge structure [18].
Although the parameters of the surrounding rock mass determined by the laboratory model test can reflect the mechanical properties of the anchorage rock mass in the engineering area, the synergistic effect between the “tunnel anchor and surrounding rock” is difficult to be fully revealed due to the length contraction effect.
Therefore, before the actual construction of the tunnel anchor suspension bridge, in order to fully guarantee the optimal design and safe construction of the tunnel anchor, the influence of geological conditions and rock mass characteristics similar to the actual anchoring area on the tunnel anchor system can be determined through in situ model experiments, and the structural and mechanical properties of the rock mass can be further obtained.
Currently, some scholars have investigated tunnel anchor system performance through in situ scaled model tests. However, bridge construction applications based on such test results remain limited in China, particularly regarding tunnel anchors in deep overburden conglomerate strata—an area that still lacks systematic in situ scale research.
Some scholars have analyzed the deformation characteristics and failure modes of tunnel anchor-surrounding rock systems by in situ scaling model tests. Wu et al. revealed the mechanical rock mass characteristics of tunnel anchors under different load conditions through large-scale field model tests and evaluated the potential load-bearing performance of tunnel anchors in the proposed super-large railway suspension bridge based on practical application cases [19]. Based on field model tests, Han et al. analyzed the load-bearing performance of tunnel anchors in soft rock with weak interlayers, and divided the deformation stages of the surrounding rock, and determined that the final failure mode of tunnel anchors under special geological conditions was similar to that of inverted wedges [3,20].
At the same time, relevant scholars analyzed and determined the bearing capacity of tunnel anchors under different rock mass conditions based on the field model test monitoring data, which provided references for the actual construction of suspension bridges. Shen et al. conducted a design load test, an overload test, a failure test, and a rheological test on the field scale model of 1:12, and the results showed that when the test load exceeded the overload stability coefficient, there would be an obvious inflection point; when the test load was less than the overload stability coefficient, the anchorage deformation and rheological characteristics were not obvious [21].
Based on the characteristics of rock mass at the test site and the performance of the test instrument, the relevant scholars improved the in situ scaling model test. Since the field scale model test is easily affected by the field loading conditions, and it is generally difficult to reach the surrounding rock failure conditions, it is difficult to fully grasp the failure form and uplift process of the surrounding rock in the anchoring area and determine the ultimate bearing capacity of the tunnel anchor [22]. Therefore, by simulating the failure conditions of surrounding rock through a similar indoor model test, it can further deepen the failure form of surrounding rock and the working mechanism of the “tunnel anchor-surrounding rock” co-bearing system.
At present, relevant scholars have studied the relevant mechanism and optimal design of tunnel anchors and surrounding rock based on the tunnel anchor indoor model test. Some scholars have conducted relevant studies on the stress and deformation of the tunnel anchor body and surrounding rock, the stress mechanism and bearing capacity of anchor structure, and the deformation mechanism of surrounding rock by changing the variables such as anchor depth and surrounding rock conditions in laboratory model tests [23]. The collaborative analysis of numerical simulation results and tunnel anchor indoor model test data also provide a theoretical basis and reference for the analysis of failure deformation modes and bearing characteristics of tunnel anchors and the surrounding rock. Lim et al. (2021) and Seo et al. (2021) conducted tunnel anchor pullout tests based on indoor model tests [24,25,26,27]. Based on the test data and tunnel anchor failure phenomenon, the bearing capacity and failure mode of tunnel anchors were further analyzed on the basis of clarifying the influencing factors of tunnel anchor failure.
The above field and laboratory model experiments have played a key guiding role in the subsequent analysis of tunnel anchor-bearing capacity and tunnel anchor system stability, but both of them will be affected by in situ test site conditions, similar test materials, and safety assurance. Therefore, the relevant test results are insufficient to fully understand the load-bearing characteristics of tunnel anchors under different engineering geological conditions and the failure modes affected by the mechanics and structural characteristics of surrounding rock mass. Therefore, it is very important to study the load-bearing mechanism of tunnel anchors and the deformation of surrounding rock mass.
The main disadvantage of tunnel anchorage is that the geological conditions of the surrounding rock in the anchoring area are relatively high, which involves the interaction between the anchorage and the surrounding rock and the deformation of rock mass under load, and its bearing mechanism is relatively complex. Wujiagang Yangtze River Bridge is the first tunnel anchorage with conglomerate strata in China. Its geological conditions are complicated, and the overlying rock mass is soft, layered, and poor in uniformity. The research in this paper not only greatly reduces the project investment and environmental cost of Wujiagang Yangtze River Bridge but also provides a theoretical basis and practical reference for the construction of tunnel anchorage in small mountain complex strata in flat or hilly areas.

2. Engineering Background

The main bridge of a suspension bridge under construction is located in the Yichang section of the Yangtze River in Hubei, China. The south bank of the bridge is designed to use the gravity anchoring method, and the north bank is designed to use the tunnel anchoring method. The tunnel anchorage on the north bank fully utilizes a complete “rock hill” at the bridgehead, anchoring the anchorage within the rock mass, thereby avoiding the construction of large foundation pits and support structures on the riverbank terrace, achieving an organic unity of environmental protection and investment savings. The bridge is designed as a steel box girder suspension bridge, with a two-way six-lane urban trunk road design. The main line of the project has a total length of 2.81 km, with a main span of 1160 m and a main cable rise–span ratio of 1:9, and a width of 31.5 m. The north tunnel’s anchor has an axis 45 m in length and an inclination angle of 40°. The anchor is shaped like a wedge and is narrower at the front (9.0 m × 11.4 m) than at the rear (16.0 m × 20.0 m). The minimum net distance between the double anchor centers is about 23.42 m. There are scattered Quaternary residual slope deposits (Q4edl) with a thickness of less than 1.0 m on the surface of the north bank site. The bedrock is a medium-to-thick layered conglomerate of the Luojingtan Formation, mostly cemented with mud and calcium, and the strata are often interbedded with sandstone, as shown in Figure 1.

3. Physical and Mechanical Tests on Rock Masses

3.1. Indoor Physical and Mechanical Tests

In order to study the physical and mechanical properties of the rock mass in the tunnel anchorage area, sampling tests were conducted on typical conglomerates and gravel rocks in each section. A total of 19 sets of rock physical property tests were completed, and the results are shown in Table 1. A total of 16 sets of uniaxial compressive, tensile, and deformation tests were conducted on rocks, and the results are shown in Table 2. By using the MTS815.03 (Mechanical Testing & Simulation, Eden Prairie, MN, USA) fully automatic triaxial testing system, 8 sets of rock triaxial compression tests were conducted, and the results are shown in Table 3. Four sets of rock direct shear tests were conducted using the RMT-150 rock mechanics testing system (Hubei Key Laboratory of Environmental Geotechnology, Wuhan, China), and the results are shown in Table 4.

3.2. On-Site Tests of Mechanical Characteristics of Rock

Due to the consideration of the field scaling test design, it is necessary to conduct on-site rock mechanics property tests. Representative strata will be selected in the inclined tunnel for rock deformation tests (4 groups), rock direct shear tests (4 groups), direct shear tests on the contact surface between concrete and rock mass (3 groups), and tensile strength tests on the cohesion between concrete and rock mass (1 group). The location and experimental layout of the inclined tunnel are detailed in Figure 1 and Figure 2.
  • Rock deformation tests
The field deformation test uses a circular rigid pressure plate with a maximum test load of 4.5 MPa, as shown in Figure 3a,b. The pressure is applied in 5 stages of cyclic loading, and the deformation is continuously measured at certain time intervals after each stage of loading. If the difference between the cumulative deformation increments of the last two stages is within 5%, it is considered stable before proceeding with the lower stage loading. Conduct 3 sets of experiments at each testing point. Calculate the elastic modulus and deformation modulus of the rock mass based on the experimental data of loading and deformation. The deformation test results are shown in Table 5.
2.
Direct shear test
The field rock mass direct shear test adopts the flat push method, with a maximum normal load of 1000 kN. One to two jacks with a maximum load of 1500 kN are installed in the normal and tangential directions, respectively, as shown in Figure 3c. During the loading process, maintain the normal stress constant, load at 0.1 times the estimated maximum shear load, and read the displacement value until failure occurs. The shear strength parameters and shear strength parameters can be determined, as shown in Table 6.
According to the test results, the shear strength parameter of K2l1 conglomerate in the anchorage area is the highest, followed by K2l2 conglomerate and sandstone conglomerate in the upper part, and K2l2 sandstone interlayer is the lowest.
3.
Direct shear test on the contact surface between rock mass and concrete
The experiment adopts the flat push method, with a maximum normal load of 1000 kN. Maintain normal stress unchanged during loading process while loading the estimated maximum shear load at 0.1 times and read the displacement value until failure occurs.
According to the measured results, the relationship between shear stress and horizontal displacement and normal displacement can be obtained for each pilot site, so the shear strength parameters of the contact surface between rock mass and concrete can be determined, as shown in Table 7.
According to the experimental results, the shear strength parameter of the contact surface between K2l1 conglomerate and concrete is the highest, followed by K2l2 conglomerate and K2l1 conglomerate (saturated).
4.
Concrete anti-pull test
To obtain the frictional resistance between concrete and rock mass, conduct concrete anti-pull test. The experiment uses a step-by-step cyclic loading method to apply pressure. According to the experimental results, the frictional resistance between concrete and K2l1 micro fresh conglomerate was calculated using the relationship between normal load and frictional resistance, as shown in Table 8.

4. Field Scale Test

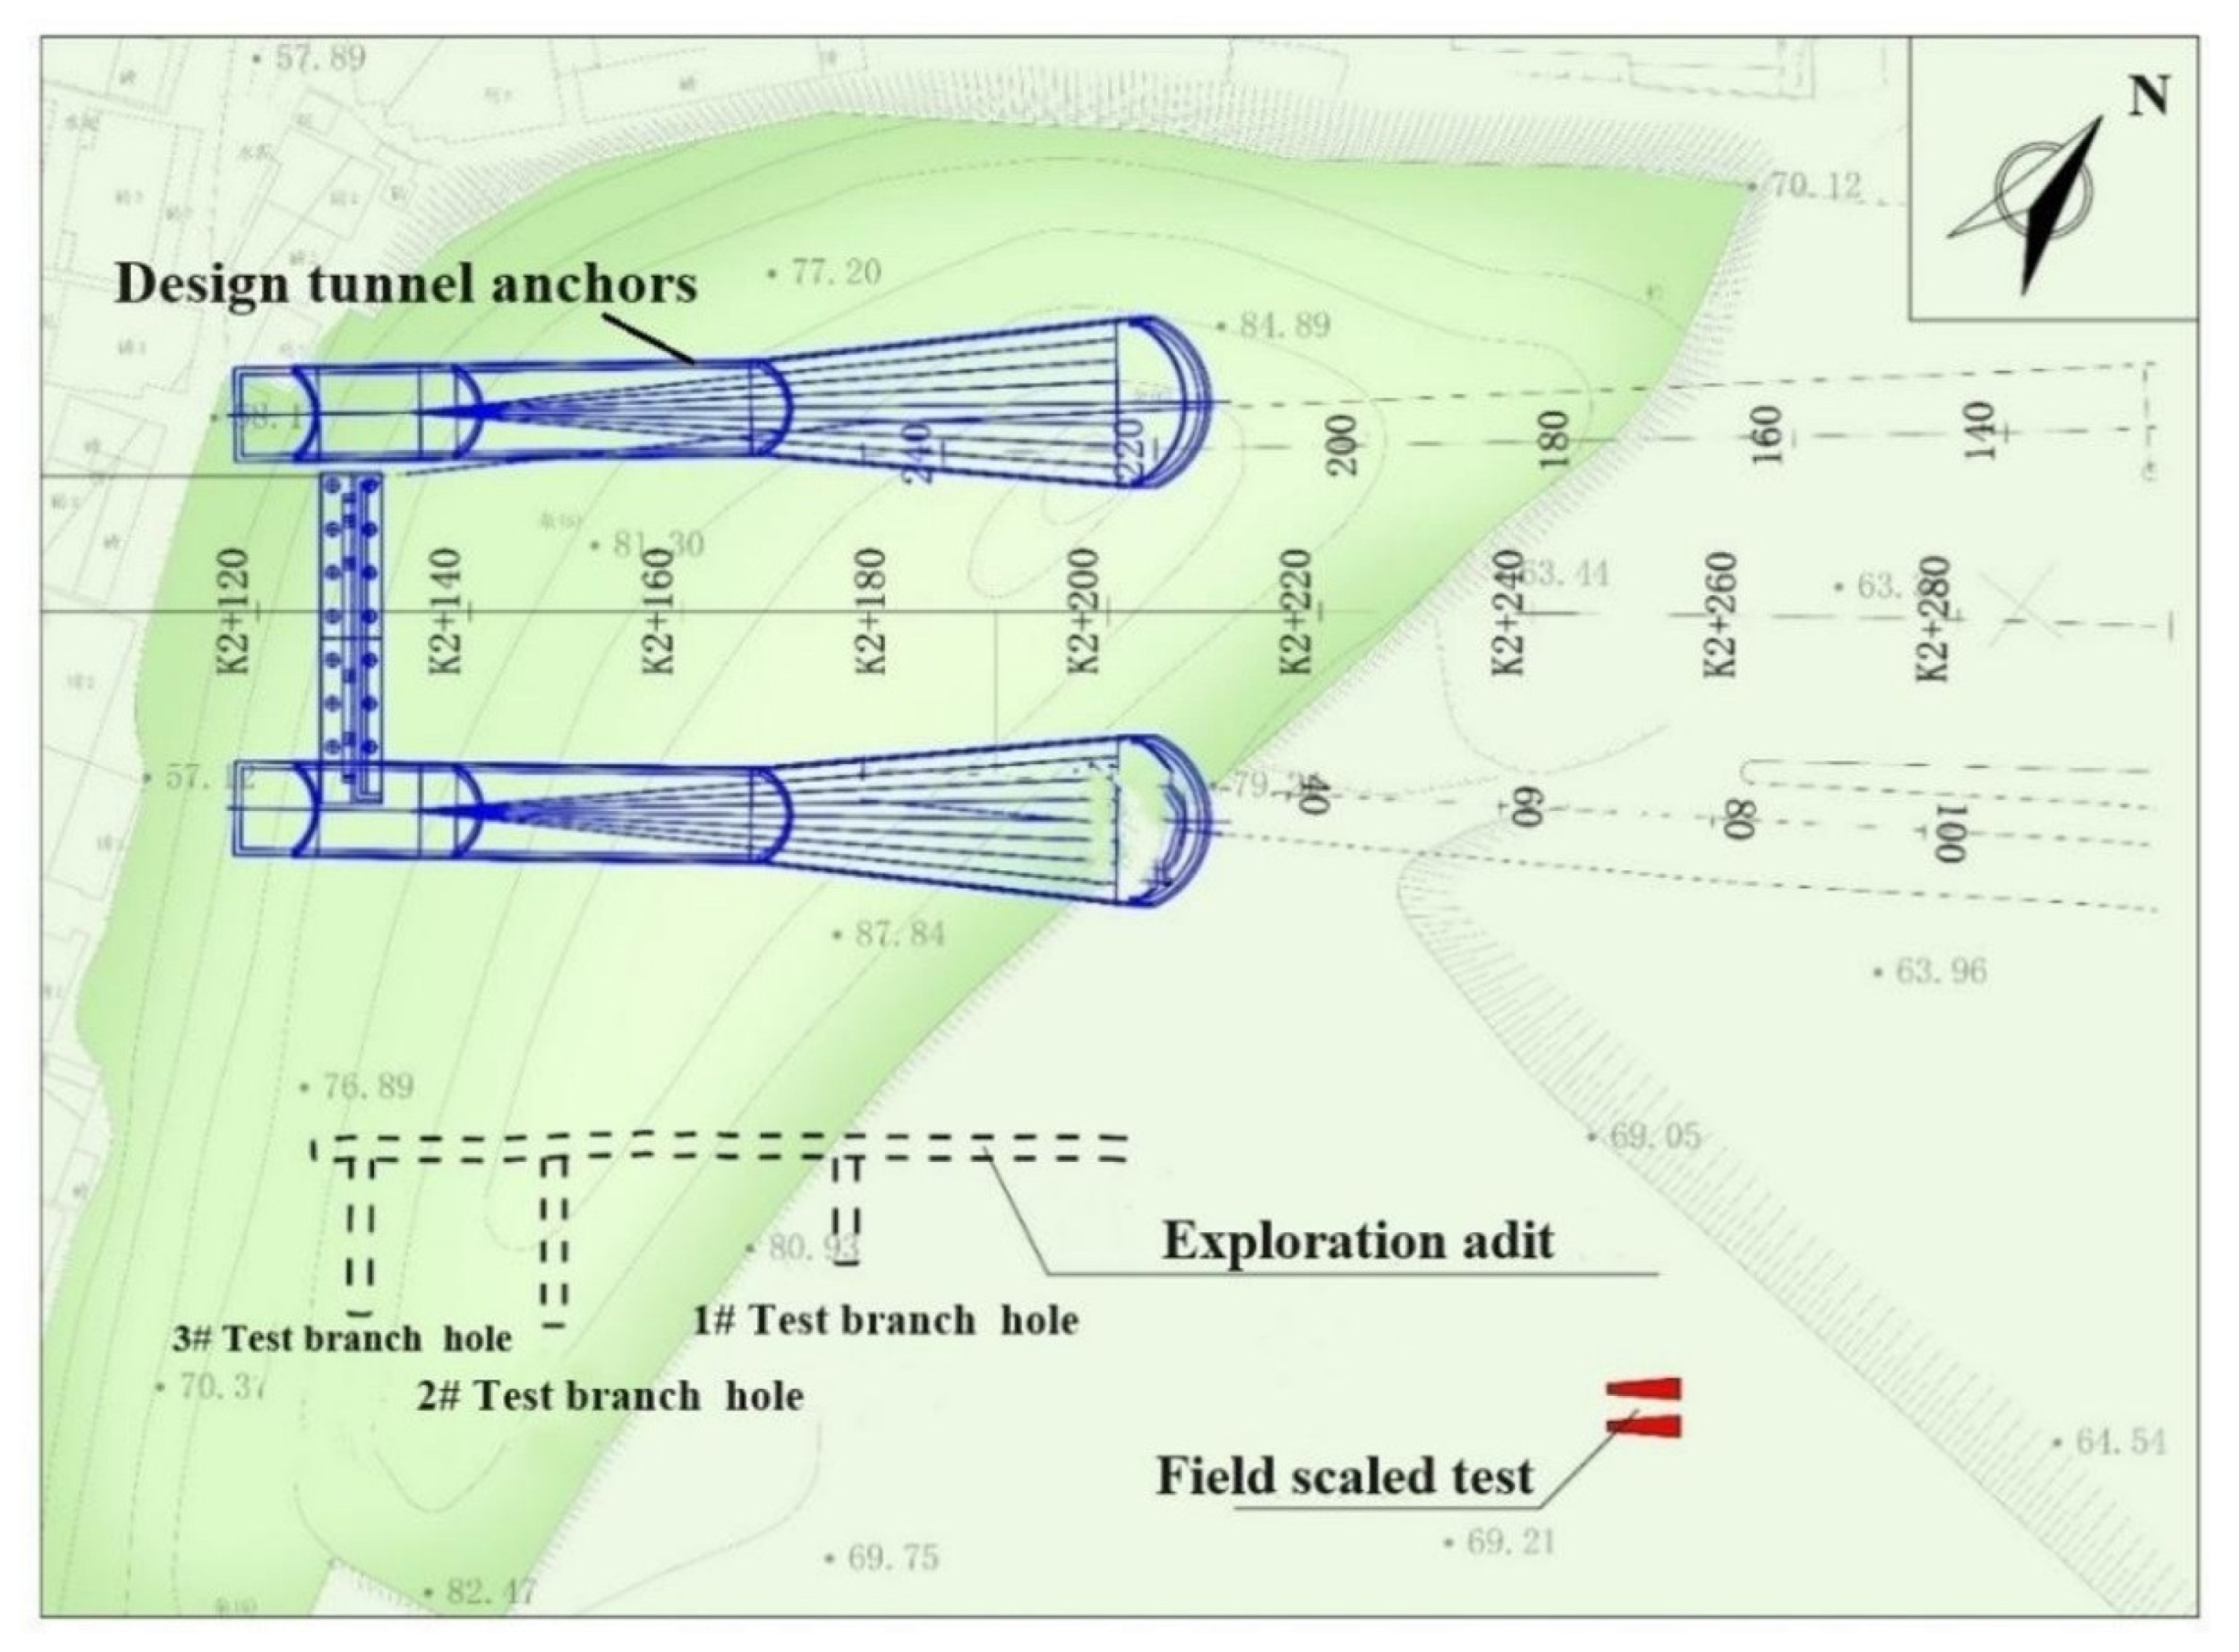
In order to study the feasibility of tunnel anchoring schemes in sandstone formations, field-scaled tunnel anchoring test was designed. Field scale testing allows for large-scale structures of testing equipment and material models, without indoor site limitations, reducing costs, simplifying model production and disassembly, and saving material costs. The efficiency of on-site scaling tests has been improved. Due to the smaller size and lower load requirements of scaled models compared to real components, the testing process can be accelerated, and the testing period can be shortened. The more consistent the rock type selected for the anti-pull test of tunnel anchorages is with the actual rock type, the closer the obtained load strain characteristics, anti-pull capacity, and anti-pull mechanism of tunnel anchorages are to reality. The open site facilitates the entry and exit of large equipment, and larger scale models can be selected to reduce the impact of size effects. And the on-site testing is highly targeted, taking into account the actual site conditions and environment, such as temperature, humidity, lighting, etc., to eliminate external factors. At the same time, the terrain can be fully utilized to make the scaled model more realistic in terms of terrain similarity, and the load size, loading rate, boundary conditions, and other influences can be accurately controlled on site. The scale test made on site can successfully describe the test results that are consistent with the actual situation. This article conducted on-site scaled model experiments, considering the construction conditions, site size limitations, and budget. The scale used for this model experiment was 1:12.

4.1. Model Construction

According to the principle of similarity, under the same material conditions, the model size of the on-site scaled model test is reduced by 1:12. When physical force is not considered, the ratio of strength and elastic modulus between the prototype and the solid is 1:1, and the load ratio is 1:144.
The scaled model test was conducted by comparing the terrain, physical and mechanical properties of the rock mass, and other conditions. It was selected at a relatively open and spacious platform in the northern part of the hill where the tunnel anchor is located. The test plan was arranged according to the actual double anchoring mode of the tunnel anchor. The test location is shown in Figure 4.
In addition to scaling the geometric dimensions proportionally, consideration was also given to terrain similarity in this experiment. The terrain consistent with the solid was obtained through manual excavation, as shown in Figure 5 and Figure 6.
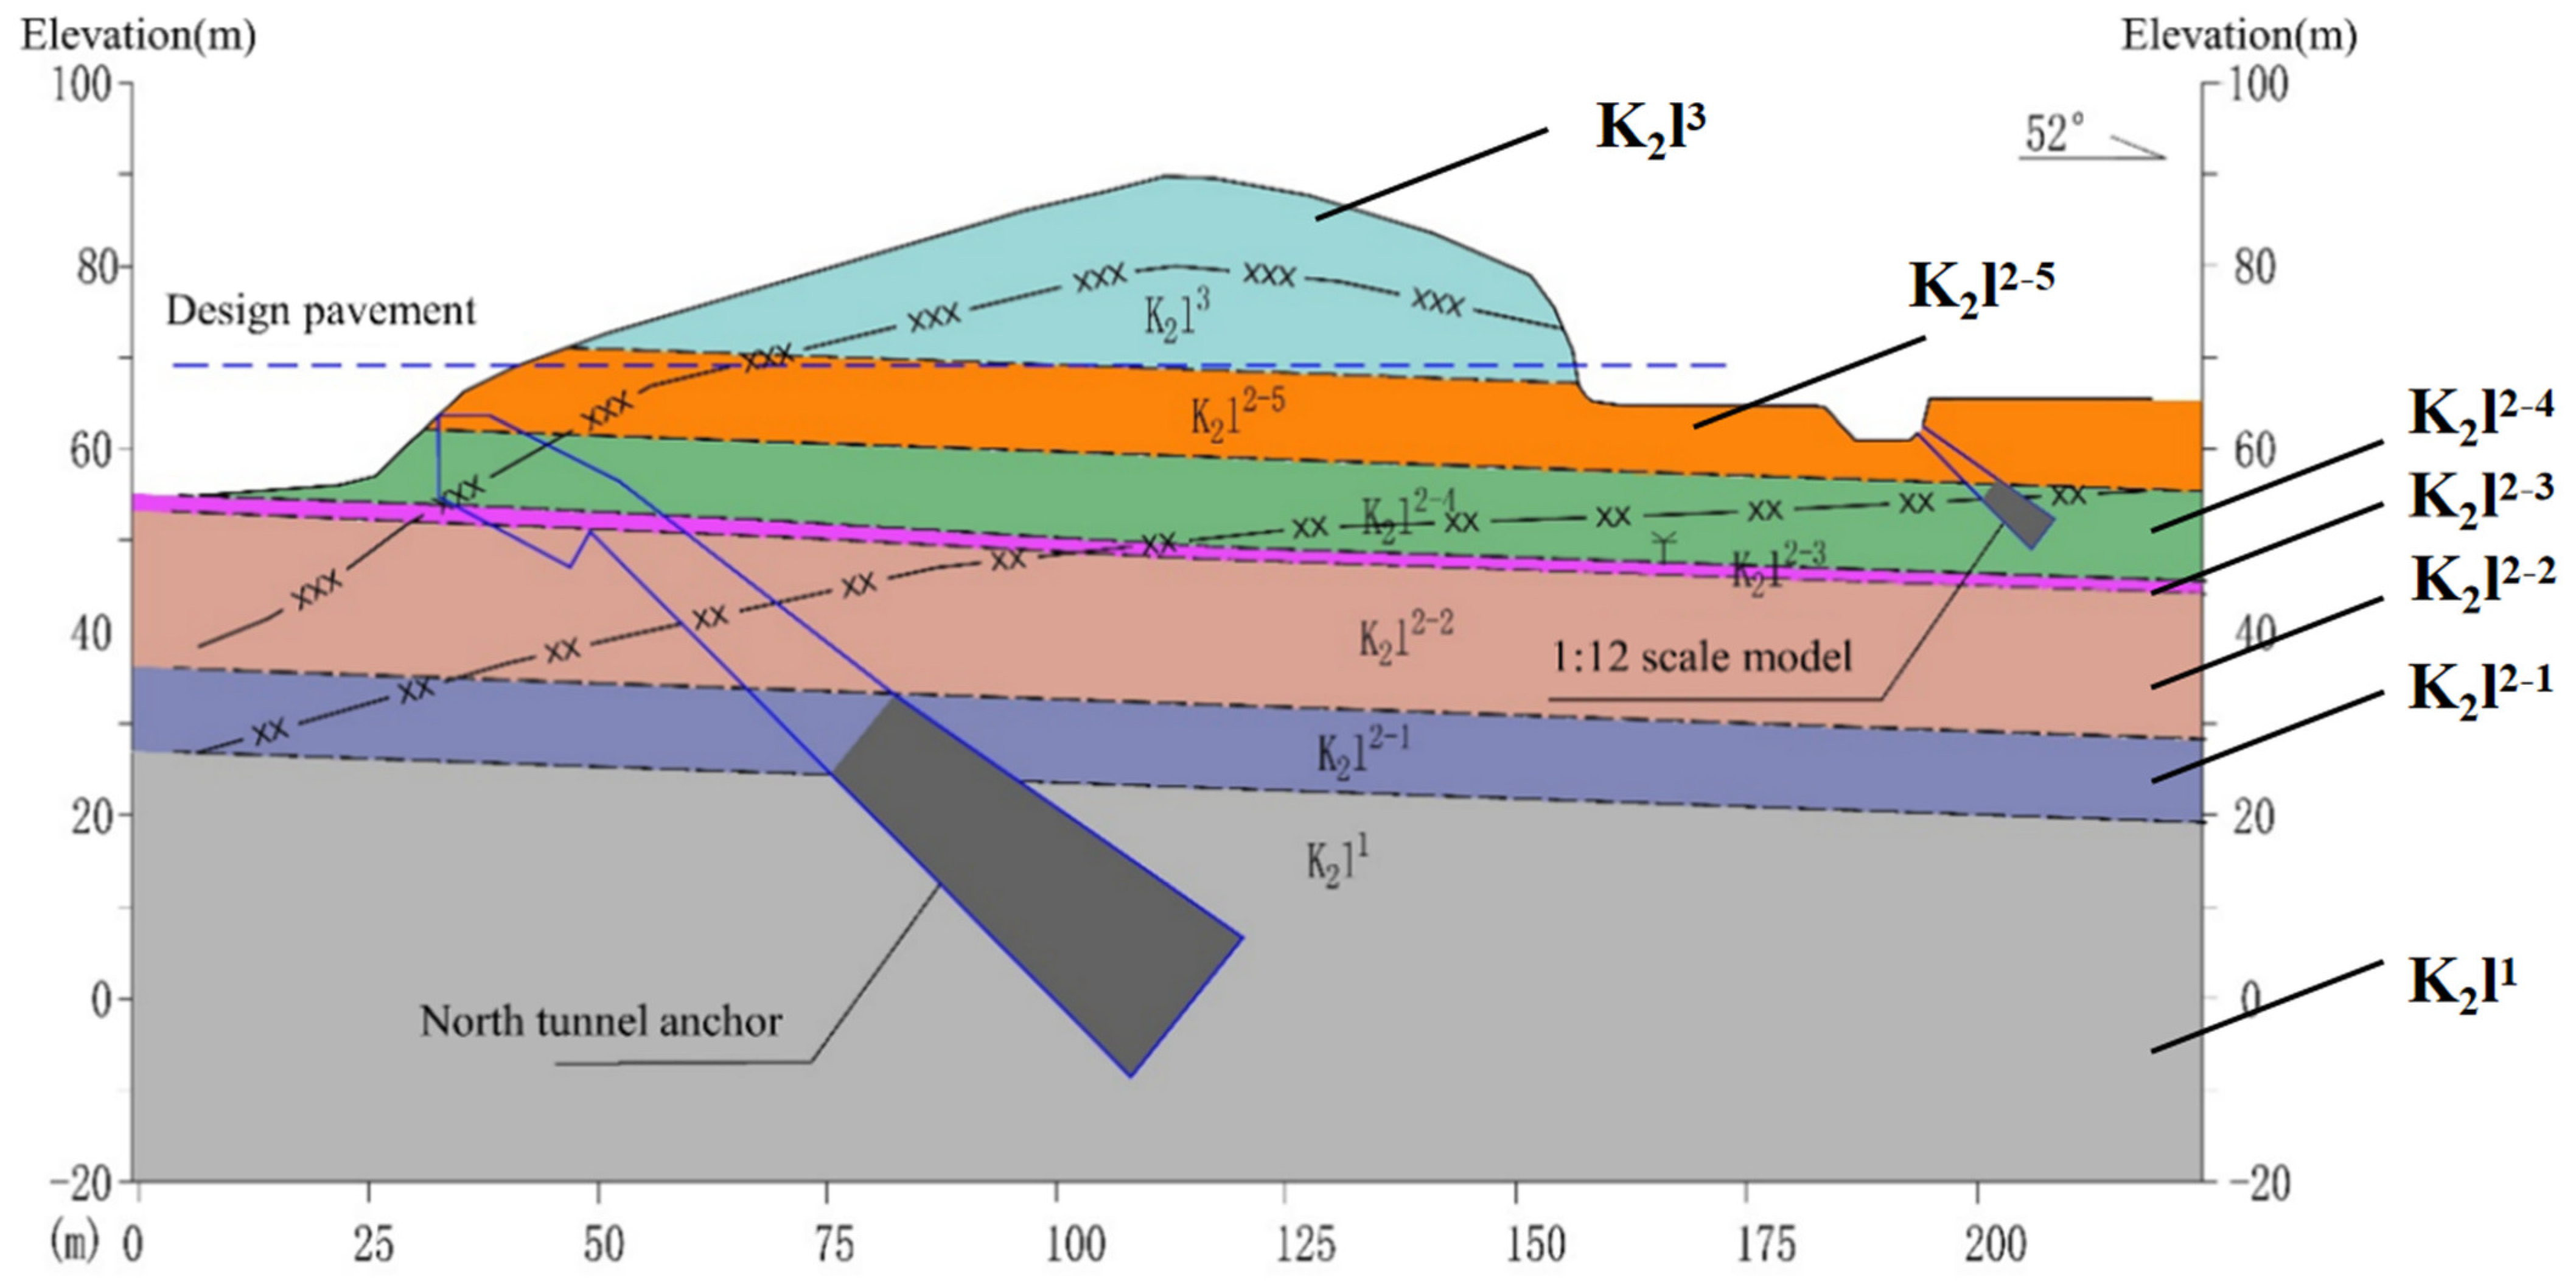
Through on-site investigation, it was found that the first section (K2l1) of the Luojingtan Formation, which was selected for the physical anchor, has a relatively deep burial depth and cannot be obtained on site. Therefore, the upper rock mass of the third section (K2l2) was ultimately chosen as the experimental stratum. The selected rock mass is consistent with the actual lithology of the stratum and also contains typical sandstone bands. The integrity of the model anchor surrounding rock is consistent with that of the actual bridge anchor surrounding the rock.
According to the results of three sets of samples in the conglomerate (K2l2) where the model anchor is located, the average saturated uniaxial compressive strength is 15.6 MPa, which is basically consistent with the strength of the loaded surrounding rock of the actual bridge tunnel anchor. Through comparative analysis, the geological conditions of the surrounding rock selected for the model experiment are similar to those of the surrounding rock of the actual bridge anchorage, and the quality of the surrounding rock of the actual bridge anchorage is slightly better than that of the model anchorage.
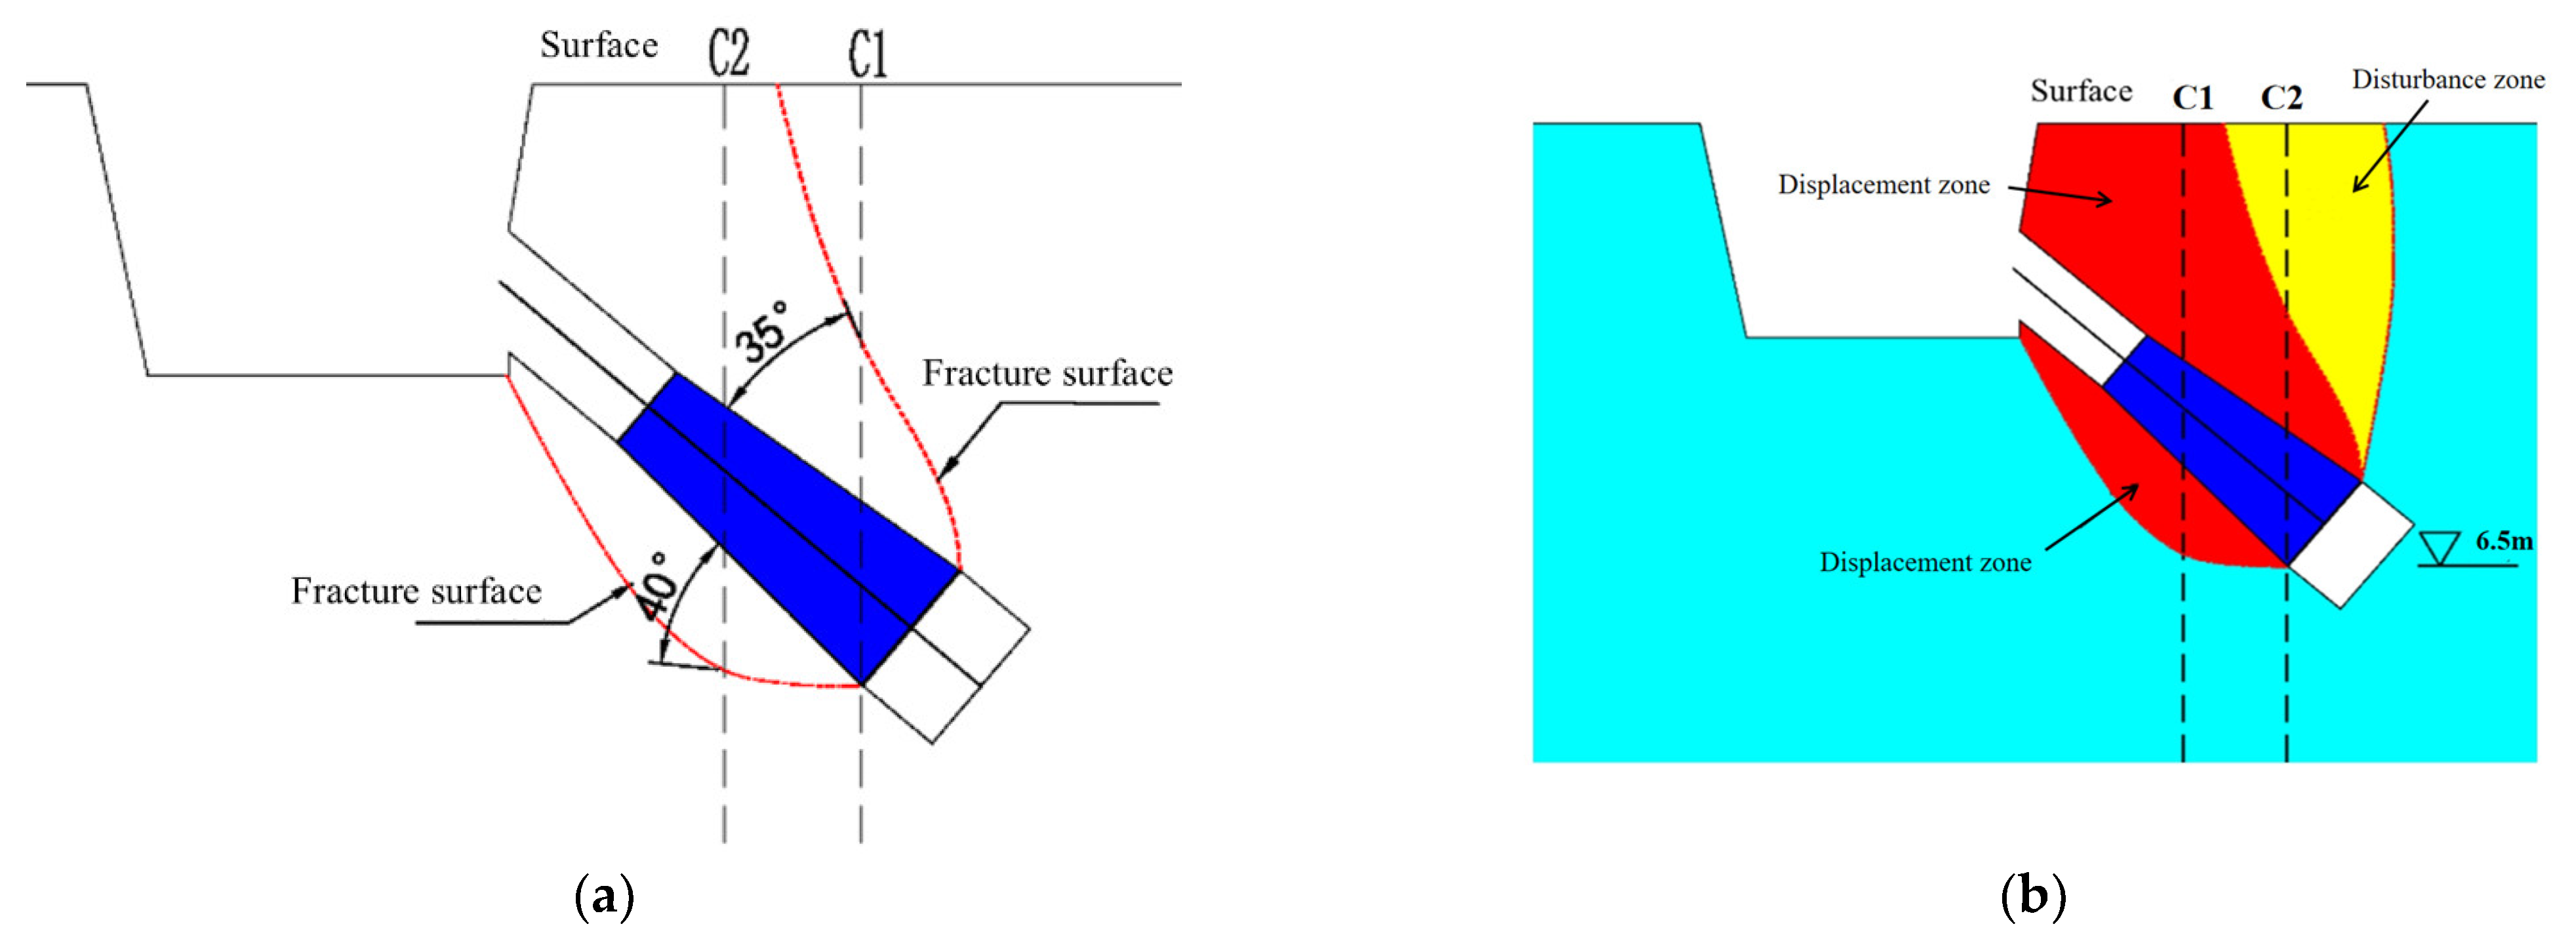
The anchorage should be made at a ratio of 1:12, and the corresponding model anchor hole size should meet similar requirements. Based on the future anchor surface, the anchor depth is 6.7 m, the axis spacing is 2.5 m, and the anchor length is 3.75 m. The angle between the axis of the model anchor and the horizontal is 40°, which is the same as the burial angle of the actual bridge anchor, as shown in Figure 7.
The anchor body is made of reinforced concrete, with five longitudinal steel arches and horizontally arranged stirrups, all of which are made of 10 mm threaded steel and poured with C40 concrete.

4.2. Experimental Monitoring Plan

Nine monitoring holes are set up in the anchorage and surrounding rock during the experiment, and the detailed locations of each monitoring hole are shown in Figure 8 and Figure 9. The inclinometer hole employs a high-precision digital inclinometer (Shaanxi Right M&C Technology Co., Ltd., Xi’an, China) with an accuracy of ±0.02 mm/m, the sliding micrometer utilizes an SMP-100 model sliding micrometer with ±0.003 mm precision, and the multi-point borehole extensometers adopt vibrating wire-type displacement sensors (Durham Geo Slope Indicator, Seattle, WA, USA) with ±0.1% FS accuracy.
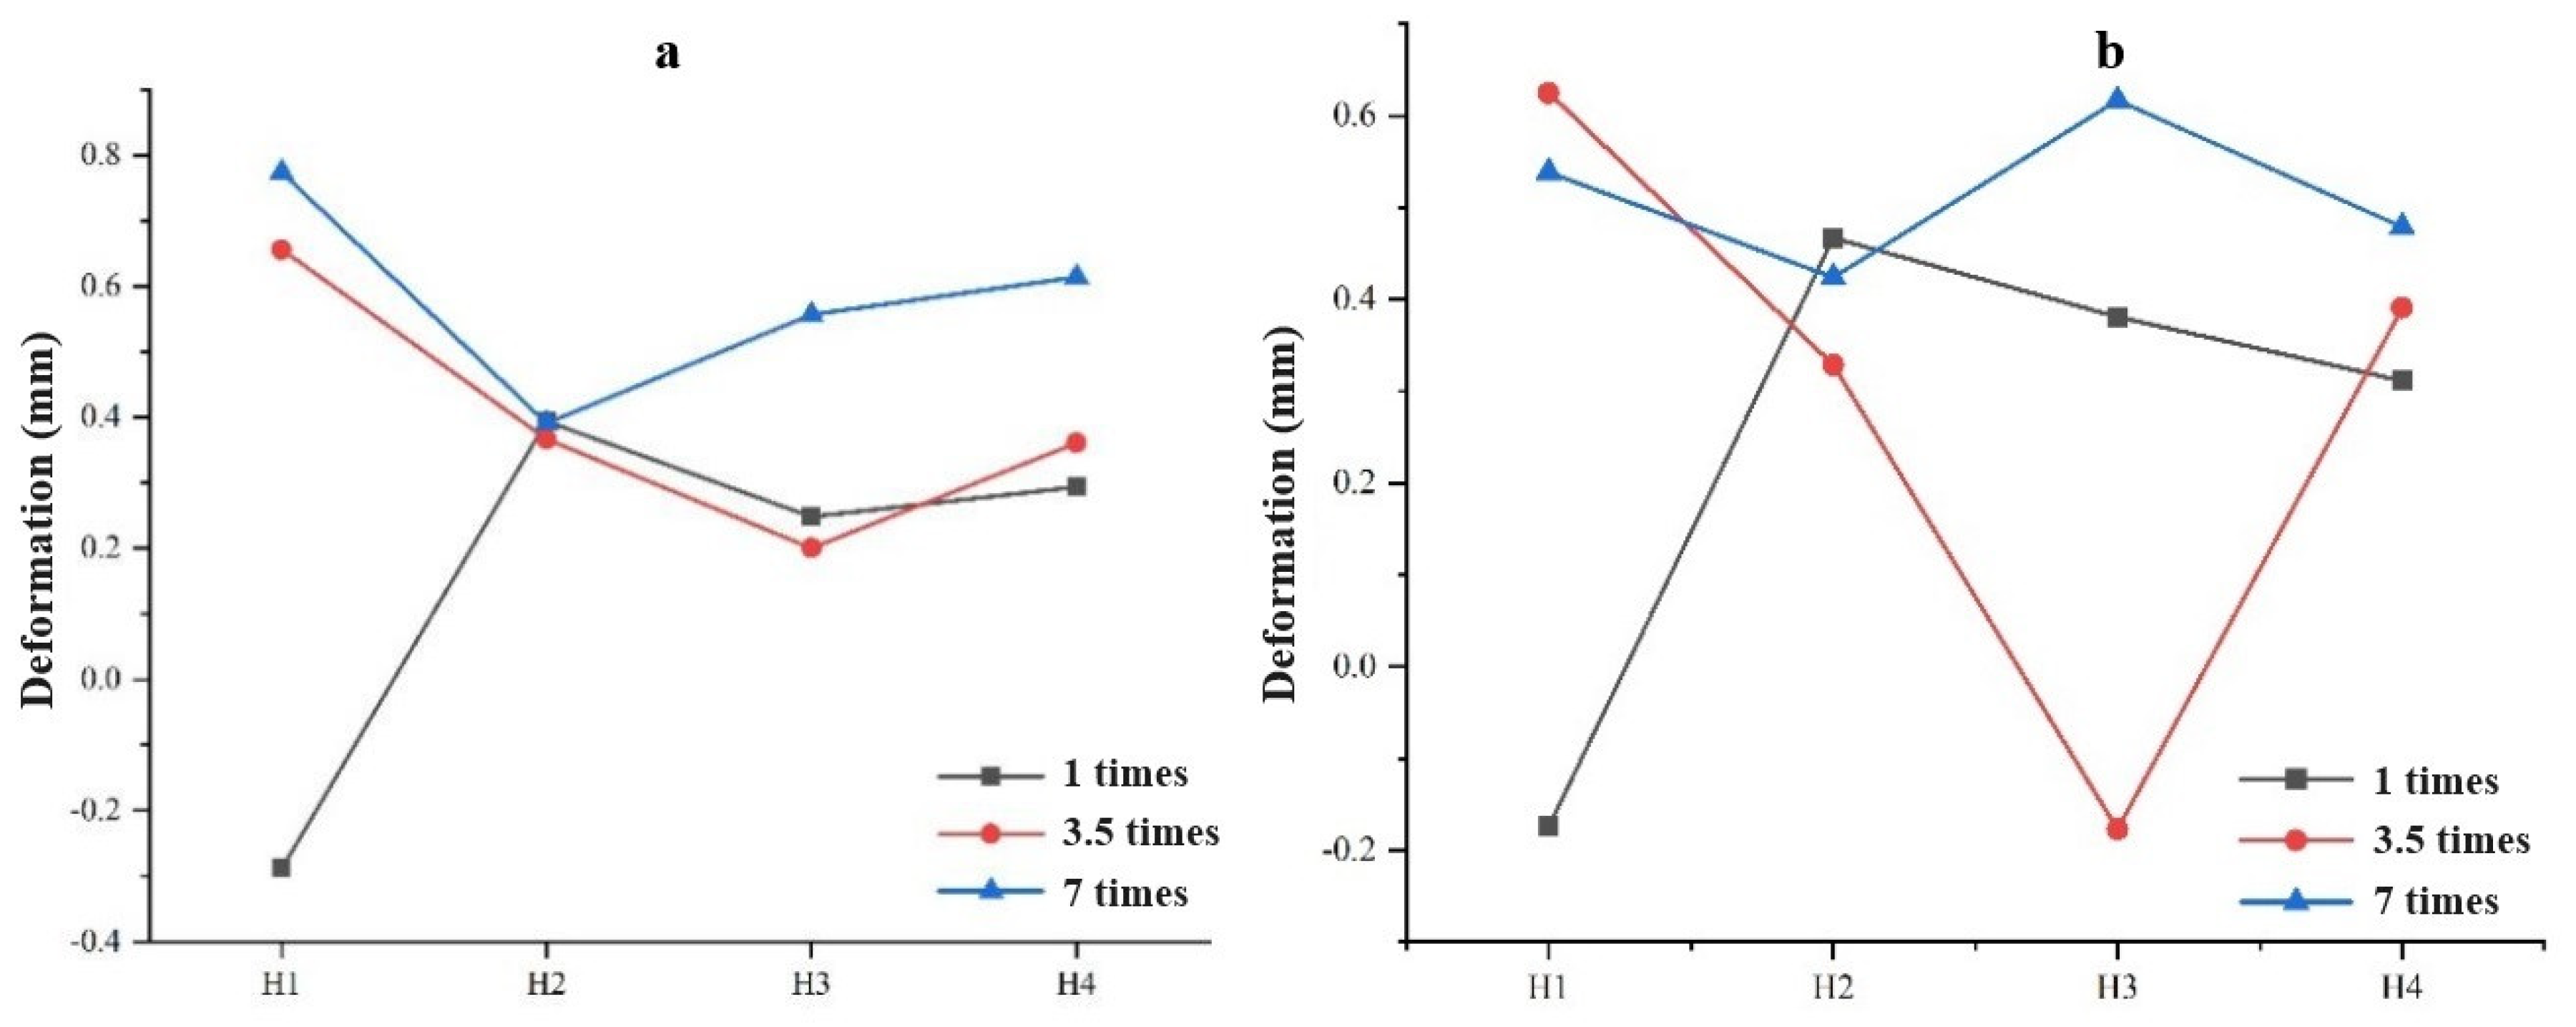
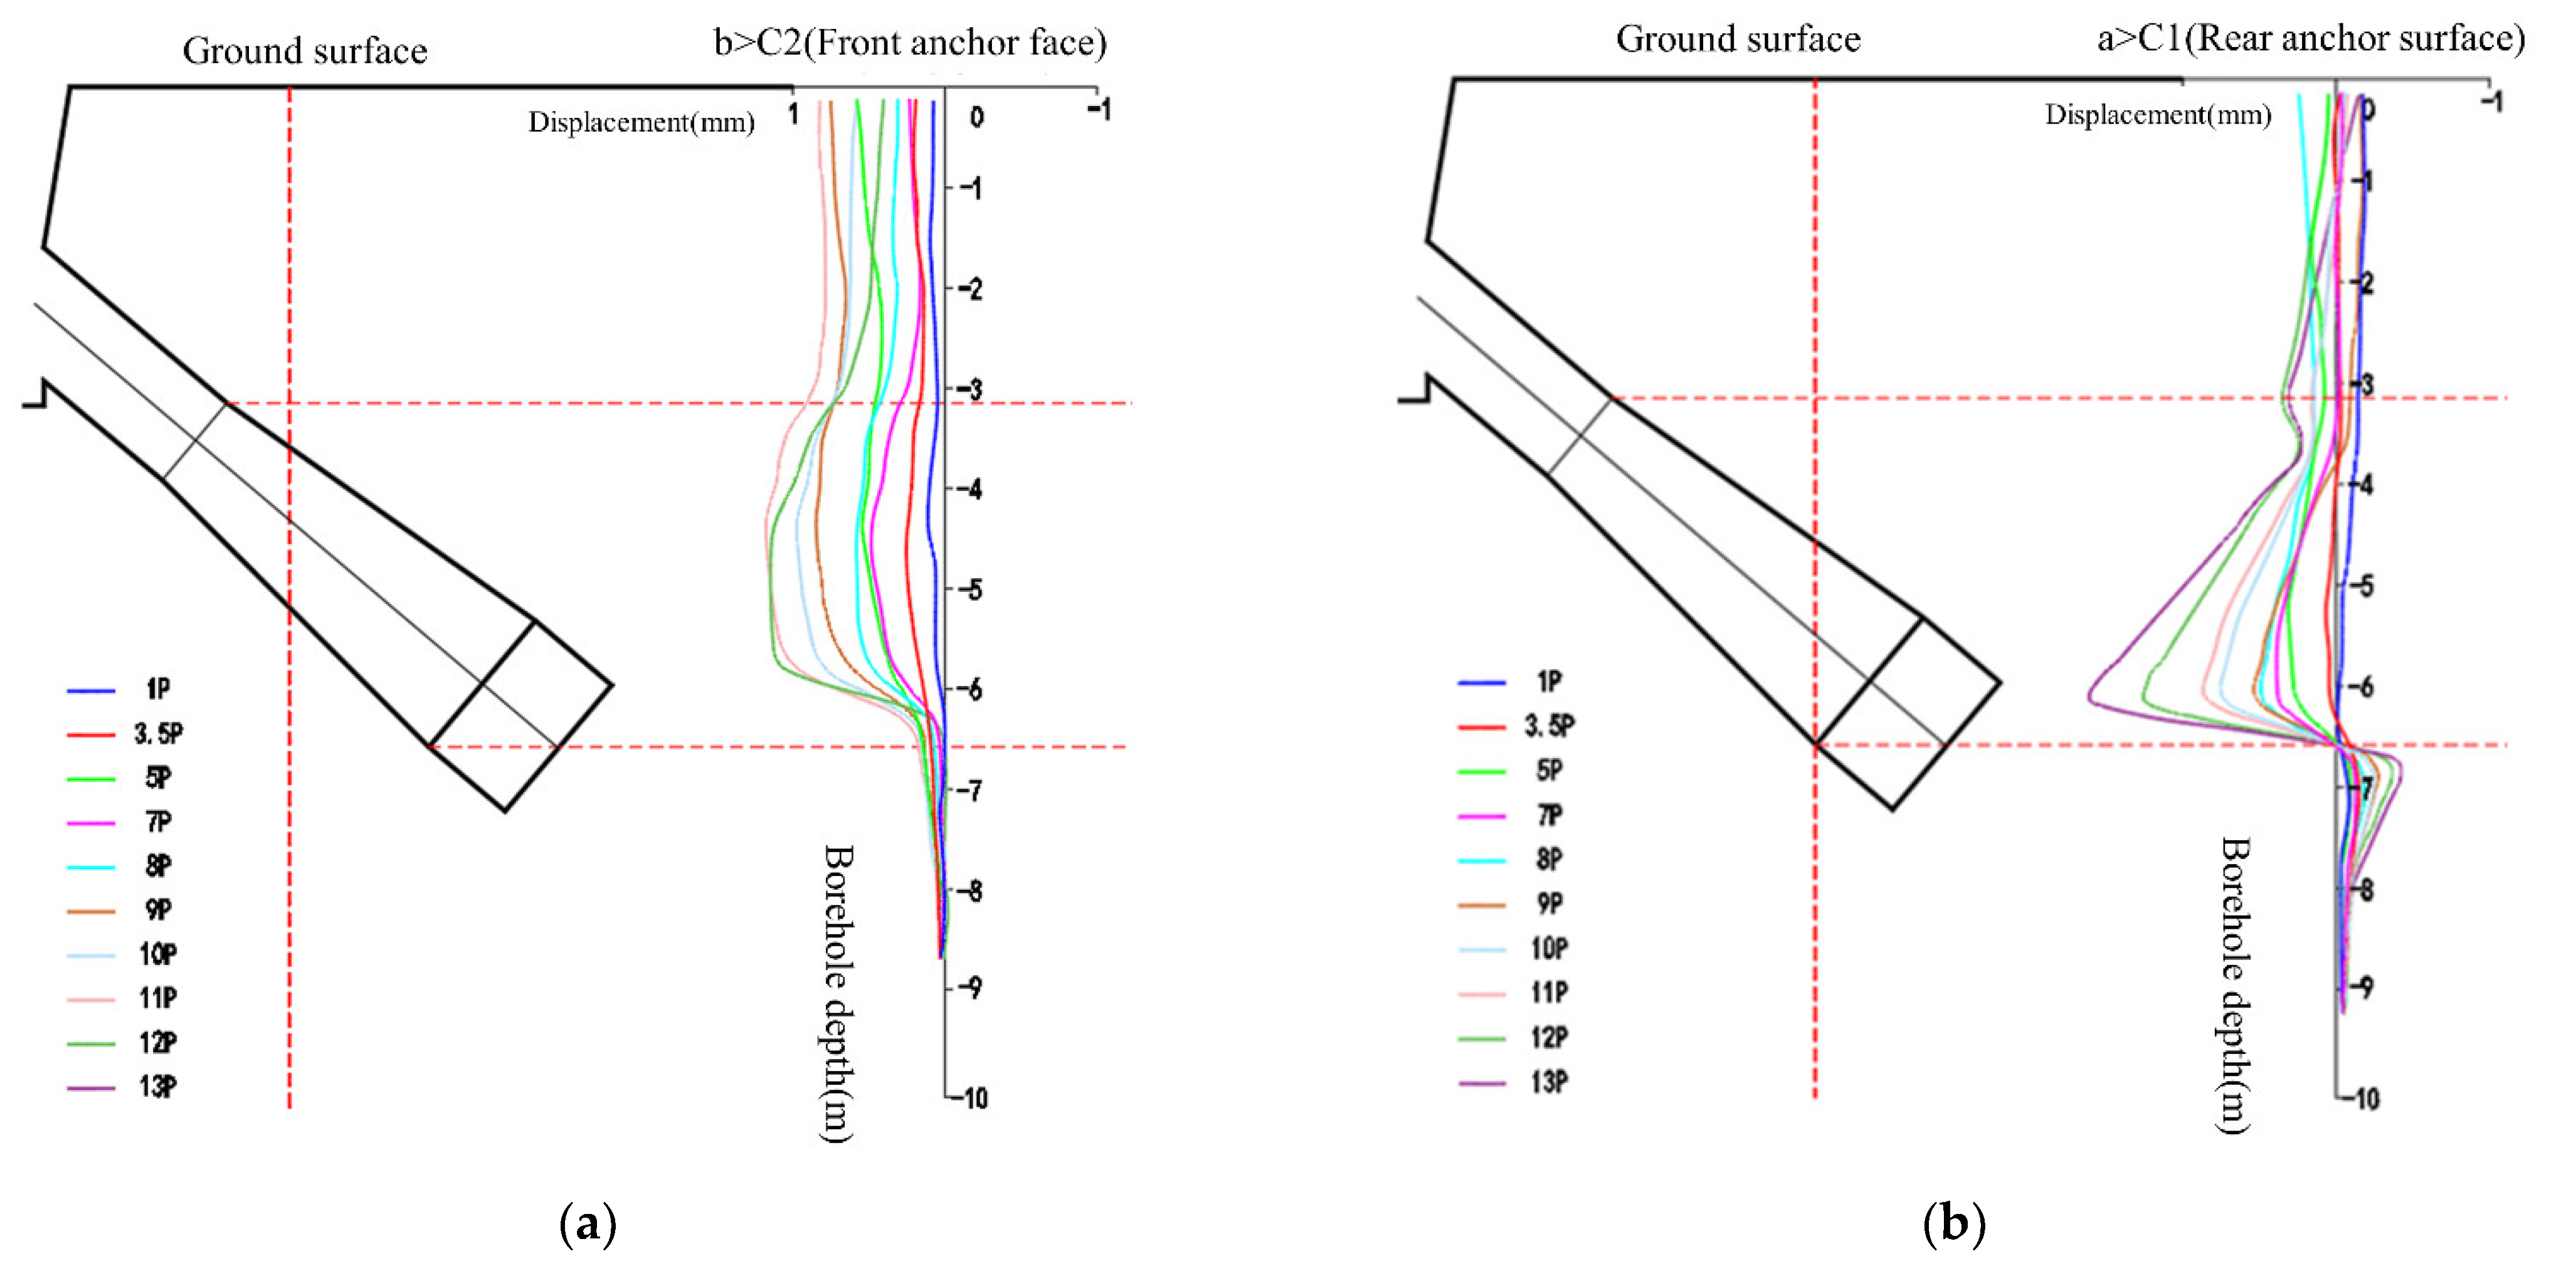
C1 and C2 inclinometer holes are vertically arranged in the surrounding rock between the double anchors, with C1 located on the front anchor surface and C2 located on the rear anchor surface. Multiple displacement monitoring holes, numbered D1, D2, and D3, are arranged parallel to the axis direction of the anchor and double anchor centerlines. On the upper surrounding rock of the double anchor and on both sides of the double anchor, parallel to the anchor axis direction, sliding micrometer monitoring holes are arranged with a spacing of 0.5 m, and the monitoring hole numbers are H1, H2, H3, and H4, respectively.

4.3. Experimental Loading and Process

The scaling test adopts the backward push method, using the rear rock mass to provide reactive force to simulate the pulling force of the anchorage. In this test, eight jacks are installed, and 50 cm and 30 cm reinforced concrete reaction plates are poured at the front and rear ends of the jacks, respectively, to make the anchorage more evenly stressed. Reinforced concrete reaction plates are reinforced with threaded steel bars. Each anchor is equipped with eight jacks, which can load up to a maximum of 2000 tons, equivalent to 13 times the design load. Shown as Figure 10.
The load test adopts a cyclic loading method for graded loading and unloading. Single design load is loaded in 5 levels and then unloaded to zero. When the test begins to load, recording begins immediately, with an interval of 10 min. If the continuous recording difference is less than 0.002 mm, it can be considered that the deformation of this level has stabilized, and the next level of load can be carried out sequentially. The recording method and requirements for unloading are the same as those for loading.
Based on relevant scholarly research and industry standards, this test conducted overload tests at 3.5 times and 7 times the design load, with loads ranging from 5 to 7 levels depending on the situation [3,28].
The load rheological test adopts step-by-step large cycle loading, and the load remains unchanged after being added to the design load. The first half hour is recorded every 5 min, followed by 1 h, 2 h, 4 h, 8 h, 16 h, and 24 h, and then recorded twice a day thereafter. When the difference between records within 24 h is less than 0.002 m, it is considered rheological stability.
The destructive test is conducted after the rheological test is completed, and the designed load is applied in stages until failure or reaching the maximum load level of the jack.

5. Experimental Results

5.1. Analysis of Deformation Characteristics of Tunnel Anchorage Surrounding Rock

According to the multi-point displacement meter test results of D2, the deformation of its free face significantly increases with the increase in load, as shown in Figure 11a. Under the design load, the maximum deformation of the free face is 0.046 mm. Under 3.5 times the design load, the maximum deformation of the free face is 0.158 mm. Under 7 times the design load, the maximum deformation of the free face is 0.509 mm. With the increase in load, the deformation of the free face increased by 3.4 times and 11.1 times, respectively, and the larger the load, the greater the growth rate of deformation.
According to the monitoring data of the inclined holes C1 and C2 between the double anchors, the model anchor shows significant horizontal displacement deformation on the front and rear anchor surfaces during the load application process. Under the design load, the maximum deformation is 0.18 mm. Under 3.5 times the design load, the maximum deformation is 0.24 mm. Under 7 times the design load, the maximum deformation is 0.57 mm. As the load increases, the horizontal deformation of the rock mass between anchors increases by 1.3 times and 3.2 times, as shown in Figure 12.
The surrounding rock between anchors also shows weak horizontal deformation below the anchorage. The front anchor surface exhibits obvious horizontal displacement within the range of 3.0–6.5 m depth, while the rock mass above 3.0 m in depth shows backward tilting deformation, with a horizontal displacement range of about twice the width of the anchor body. The rear anchor surface shows overall the horizontal deformation from the anchor to the ground rock mass.
According to the analysis of the deformation monitoring results of the sliding micrometer at the free face, front anchor face, and rear anchor face from H1 to H4, as the load level increases, the deformation at the free face and front anchor face will gradually increase. The deformation trend of the axis of the rear anchor surface is relatively disorderly. Overall, the deformation of the lateral rock mass is slightly greater than that of the upper rock mass of the anchor plug, as shown in Figure 11b and Figure 13.

5.2. Analysis of Relative Deformation Characteristics Between Anchor Body and Surrounding Rock

The maximum deformation of the dislocation gauge occurs in the middle of the anchor, as shown in Figure 14. As the load increases, the deformation in the middle of the anchor body grows faster, as shown in Figure 15.
F8 represents the misalignment of the middle part of the right anchor, while F1 and F9 represent the misalignment of the front and rear anchor surfaces. The growth rate of F8 with the load is significantly greater than the growth rate of deformation of the front and rear anchor surfaces, as shown in Figure 15.

5.3. Generalization and Analysis of Destructive Modes

Under step-by-step loading, the surrounding rock of the anchorage mainly exhibits deformation along the axis, and the deformation laws of the free face, front anchor face, and rock mass between anchors follow the above trend, and the deformation is also relatively stable, as shown in Figure 16. The deformation of the rear anchor surface is relatively disorderly. The deformation of the rock mass between anchors shows a sudden increase after the load is increased to 8 times the design load, as shown in Figure 16a. The deformation of the rock mass on the free face also shows a sudden increase at 8 times the design load, as shown in Figure 16b. The sudden increase in deformation of the rock mass on the front anchor surface occurs at 9 times the design load, as shown in Figure 16c. The sudden increase in the deformation of the rock mass on the rear anchor surface occurs at 7 times the design load, as shown in Figure 16d. From the analysis of the deformation trend, the critical load for anchor failure is 7 to 9 times the design load.
Under step-by-step loading, the deformation of the rock mass between anchors can be continuously monitored, and analyzing the failure mode of the anchor based on its deformation is more accurate. The boundary point of deformation is located at a depth of 6.2 m on the front anchor face, and the rock mass with a depth of more than 6.2 m shows a relatively uniform horizontal deformation, which is more obvious at 5 times the design load, as shown in Figure 17a. The boundary point of deformation is at a depth of 6.5 m on the rear anchor surface. The rock mass at a depth of 3.5–6.5 m shows obvious horizontal displacement, which is very obvious at 7 times the design load. Above a depth of 3.5, it shows deformation on the rear anchor surface and shows a certain inclination, as shown in Figure 17b.
From the analysis of the inclined hole, it can be seen that the front anchor face with a depth of more than 6.2 m exhibits relatively uniform horizontal deformation, and the greater the load, the more uniform the horizontal deformation. This area should be located before the fractured surface. The upper part of the rock mass on the rear anchor surface is inclined backwards, so the surface fracture surface should be located between holes C1 and C2. The rear anchor surface C1 undergoes significant differential deformation at a depth of 3.5 m, which should be near the rupture surface. In summary, connecting the two feature points with the rear anchor surface point essentially forms the shape of the rupture surface. Similarly, connecting the lower feature points forms the lower rupture surface, with an upper rupture angle of about 35° and a lower rupture angle of about 40°. The rupture surface is trumpet shaped and cut out from the free face in an arc shape, as shown in Figure 18a.
From the perspective of damage zoning, it can be mainly divided into displacement zones and disturbance zones. The upper displacement zone is dominated by tensile shear damage, while the lower displacement zone is dominated by compressive shear damage, as shown in Figure 18b.

6. Conclusions

This study conducted on-site 1:12 scale model tests on complex strata (conglomerate tunnel anchorages), taking into account the similarity of terrain and lithology. The test contents included design load tests, overload tests, and failure tests. The main research conclusions obtained are as follows.
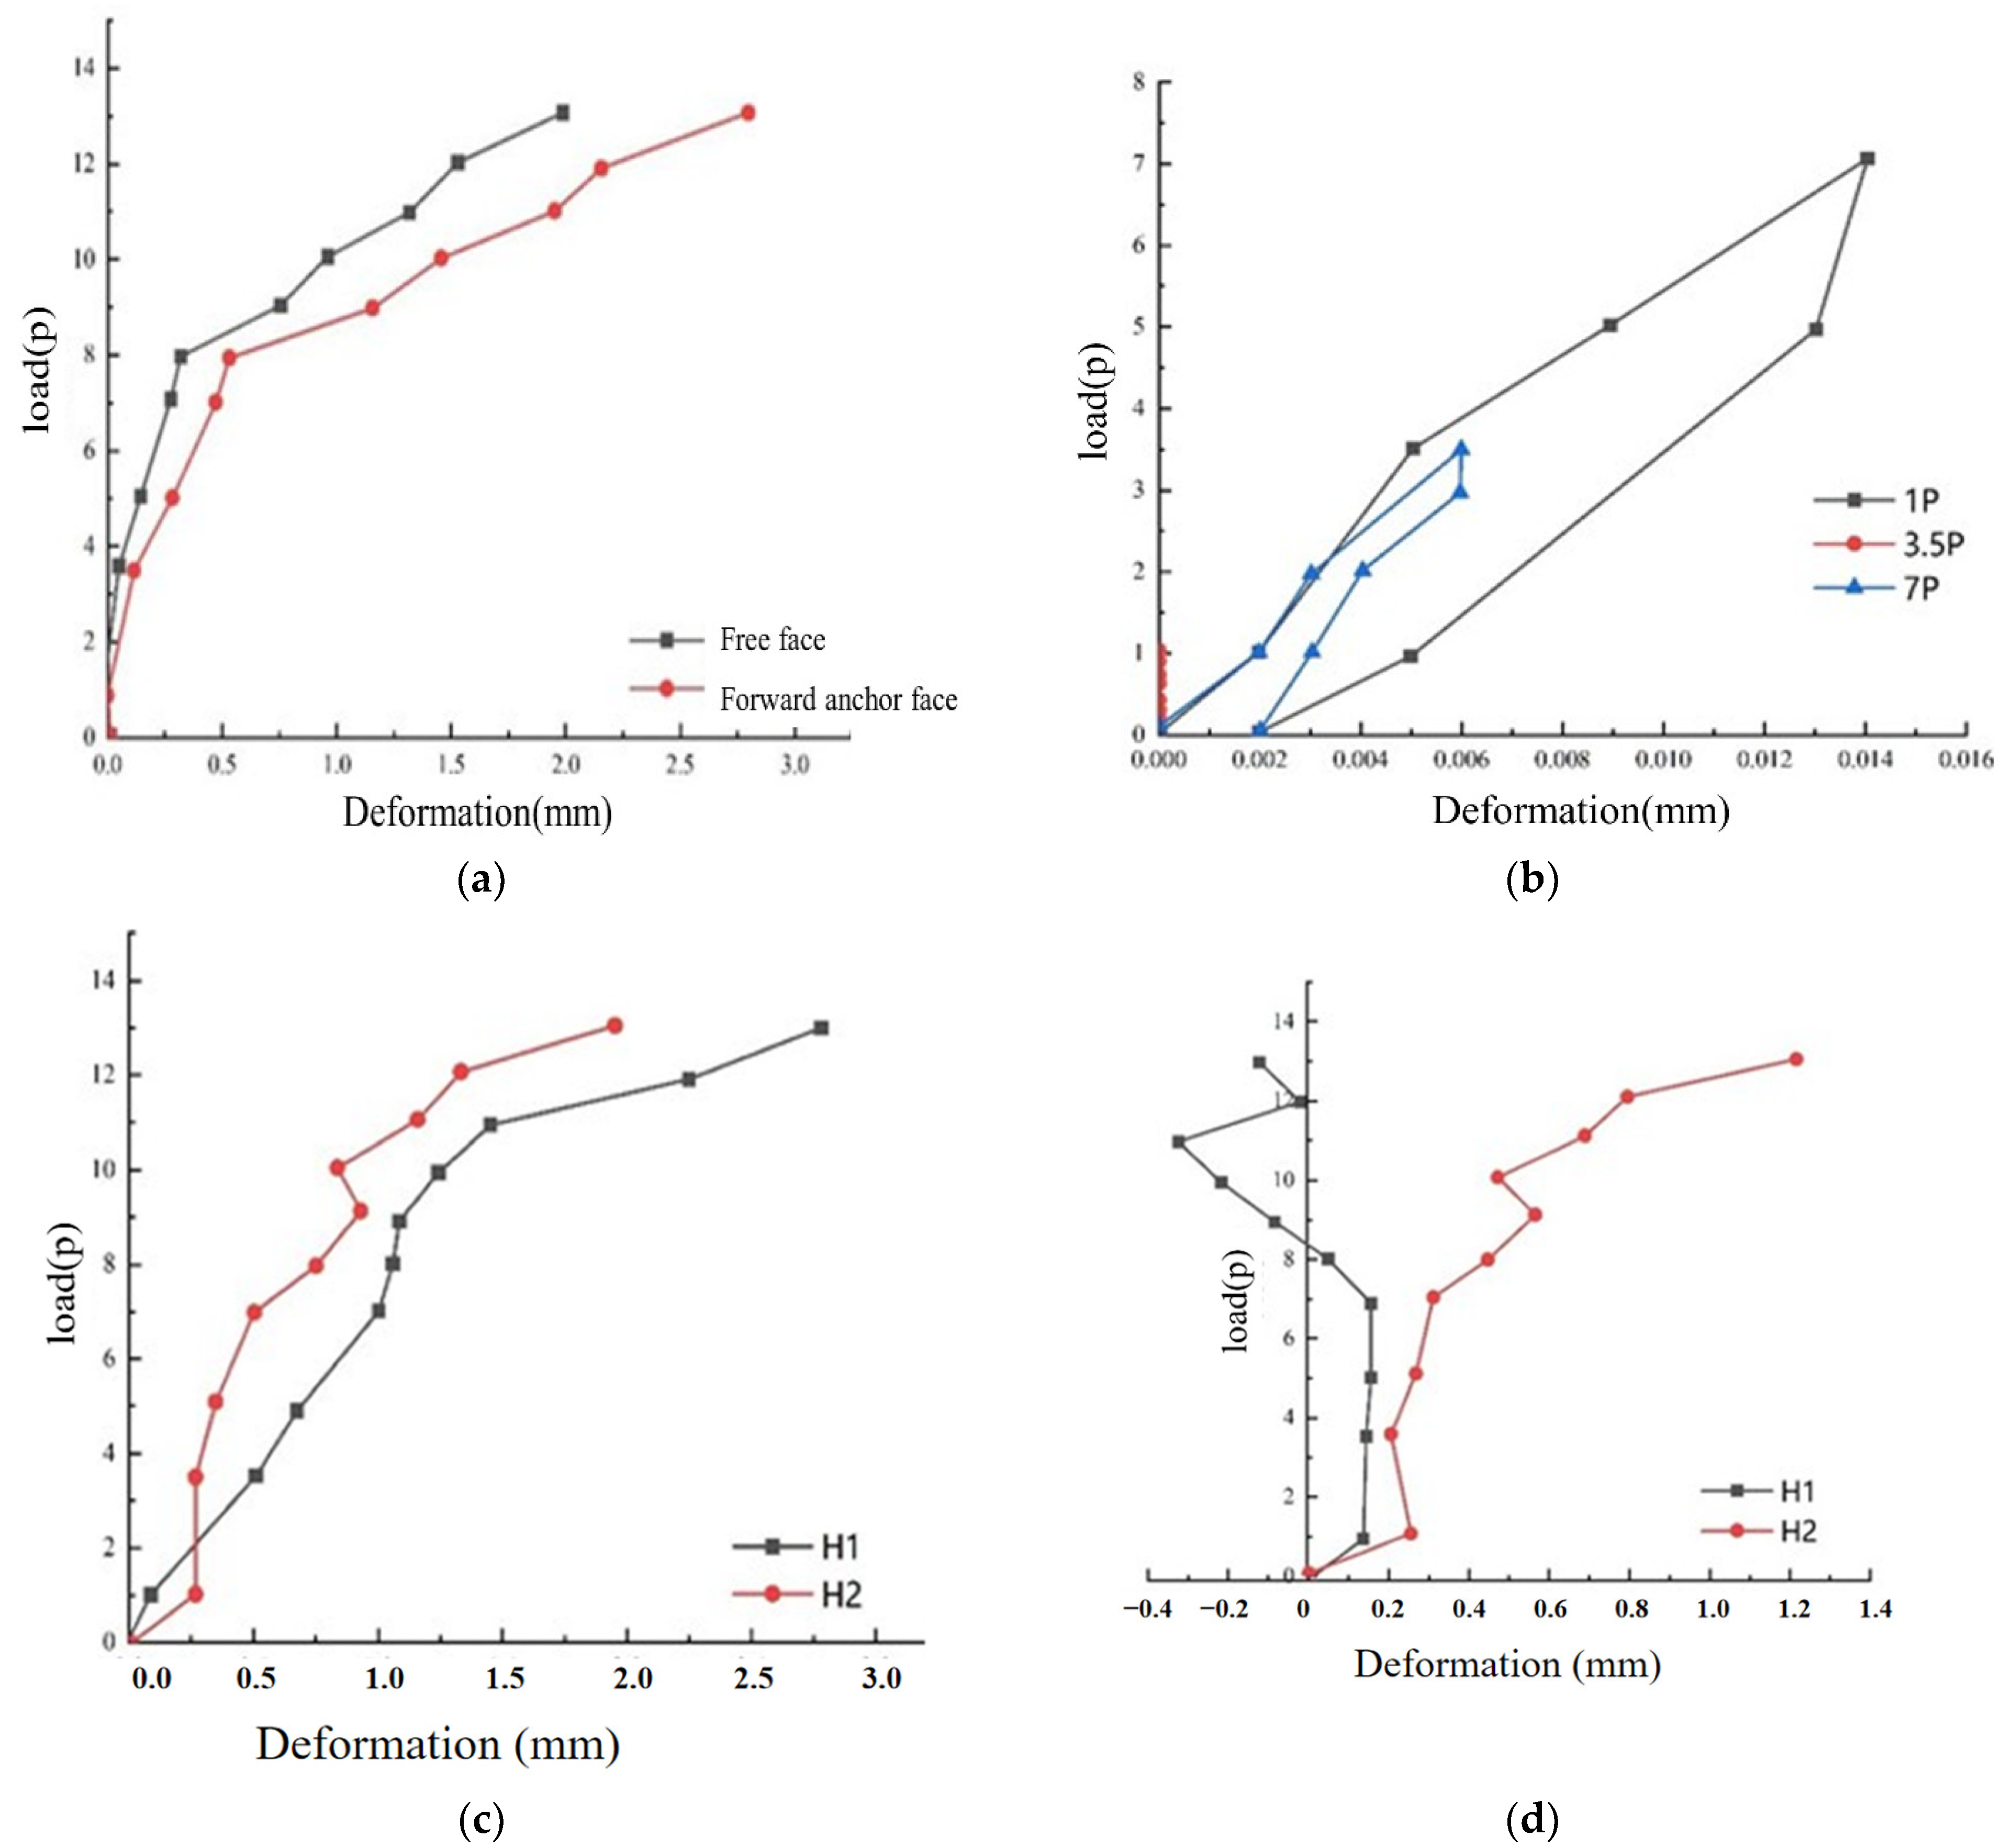
(1) The deformation of the sliding micrometer under the design load was analyzed, and it was found that the deformation at the free face was the largest, followed by the deformation at the front anchor face, and the deformation at the rear anchor face was the smallest.
(2) The deformation of dislocation meter under the design load was analyzed, and it was found that relative deformation between the anchor and the surrounding rock is largest in the middle of the anchor body, followed by the rear anchor surface, and the displacement deformation of the front anchor surface is the smallest.
(3) The deformation of the strain gauge inside the anchorage was analyzed, and it was found that the deformation of the rear anchor surface is the largest, followed by the middle part, and the deformation of the front anchor surface is the smallest, with a significant difference in deformation between the front and rear anchor surfaces, revealing the phenomenon of stress concentration on the anchor surface after anchoring.
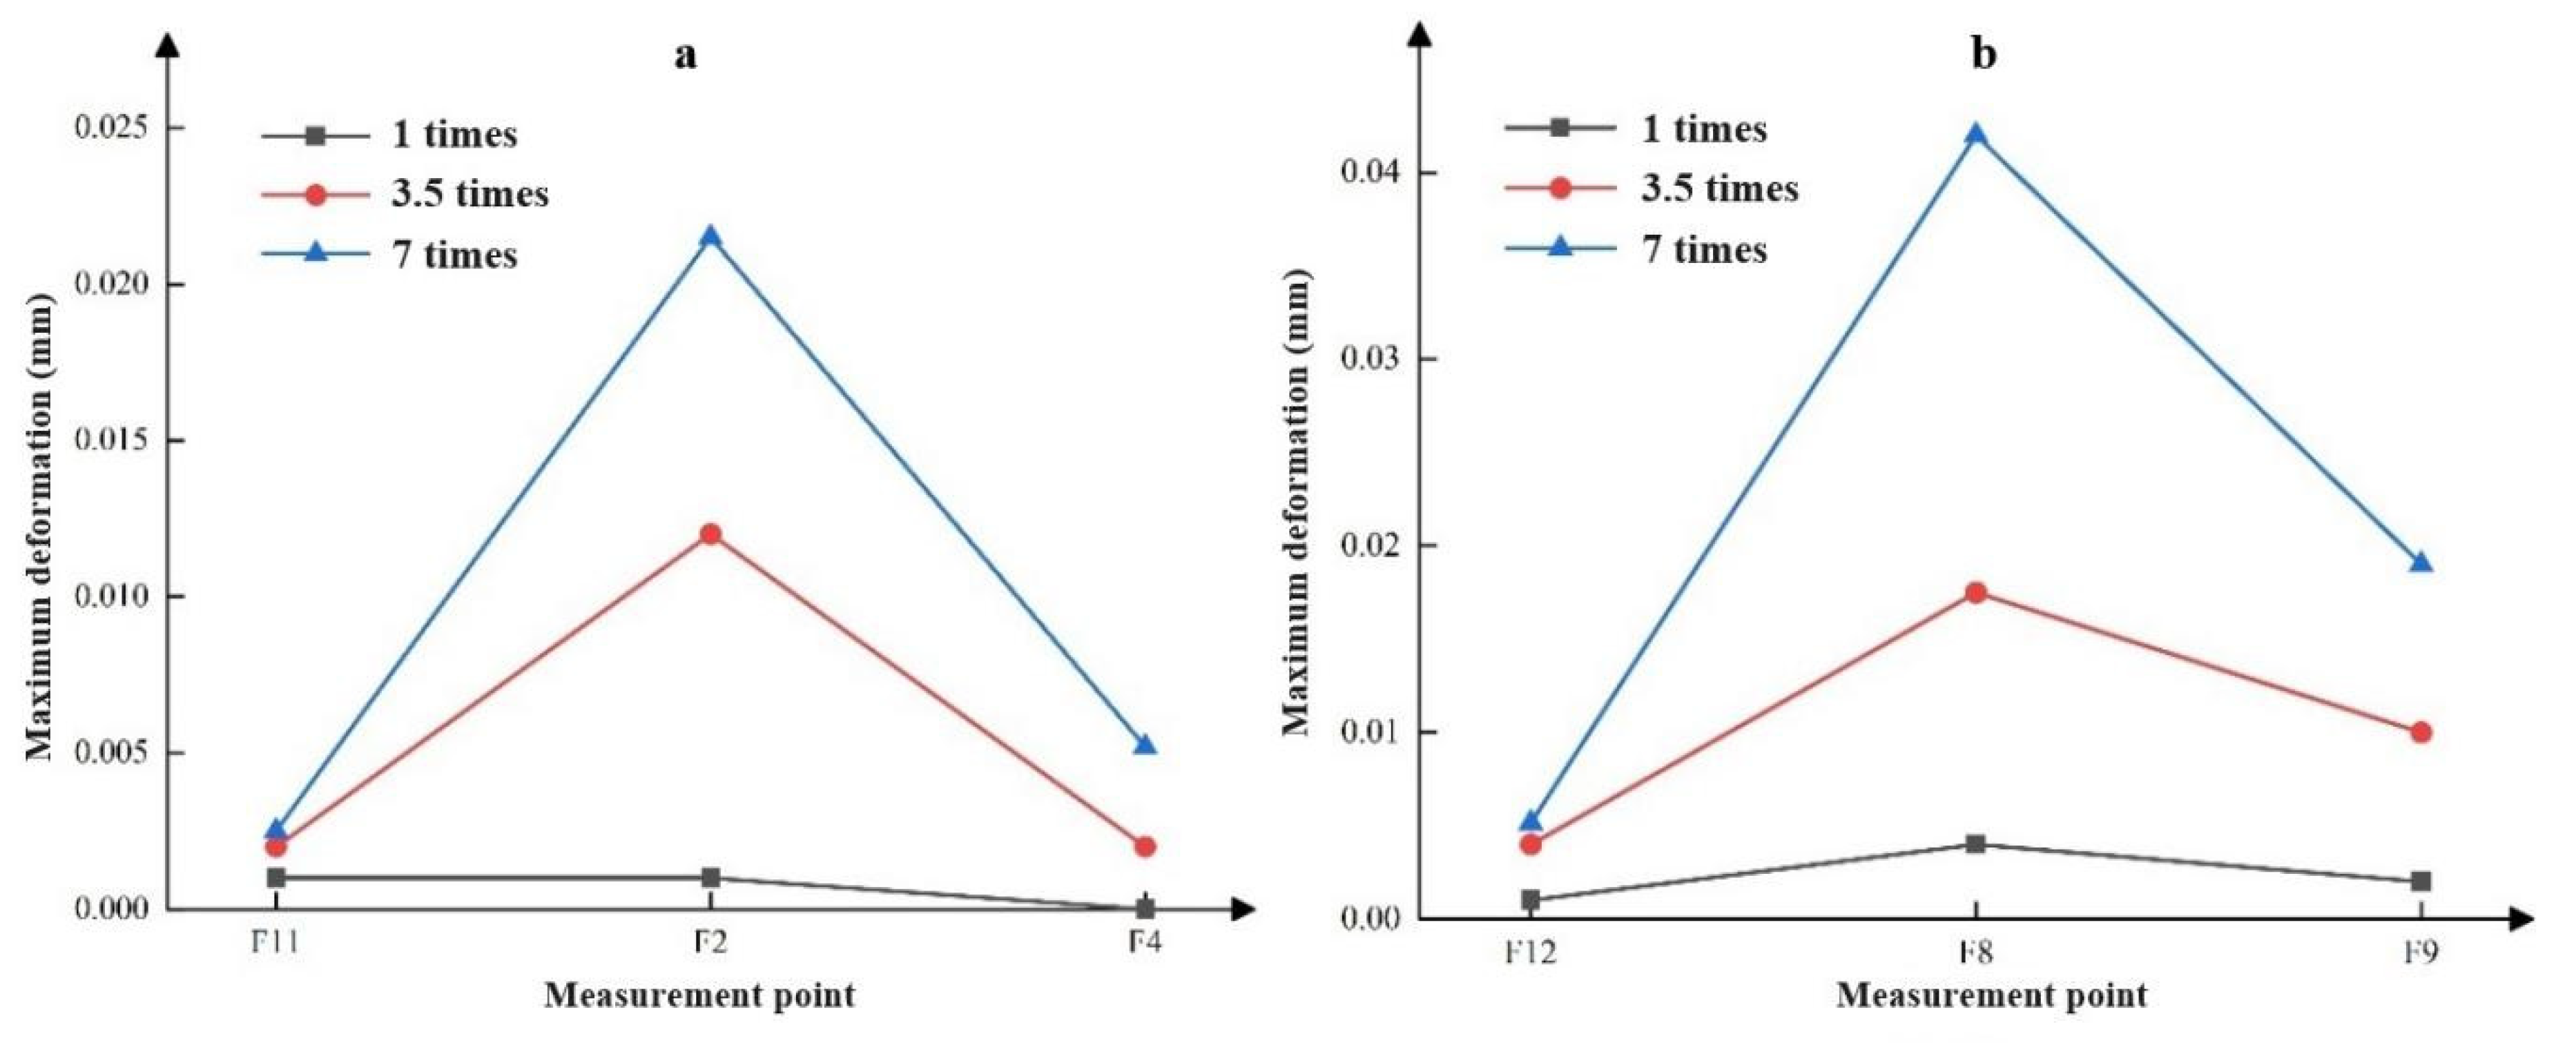
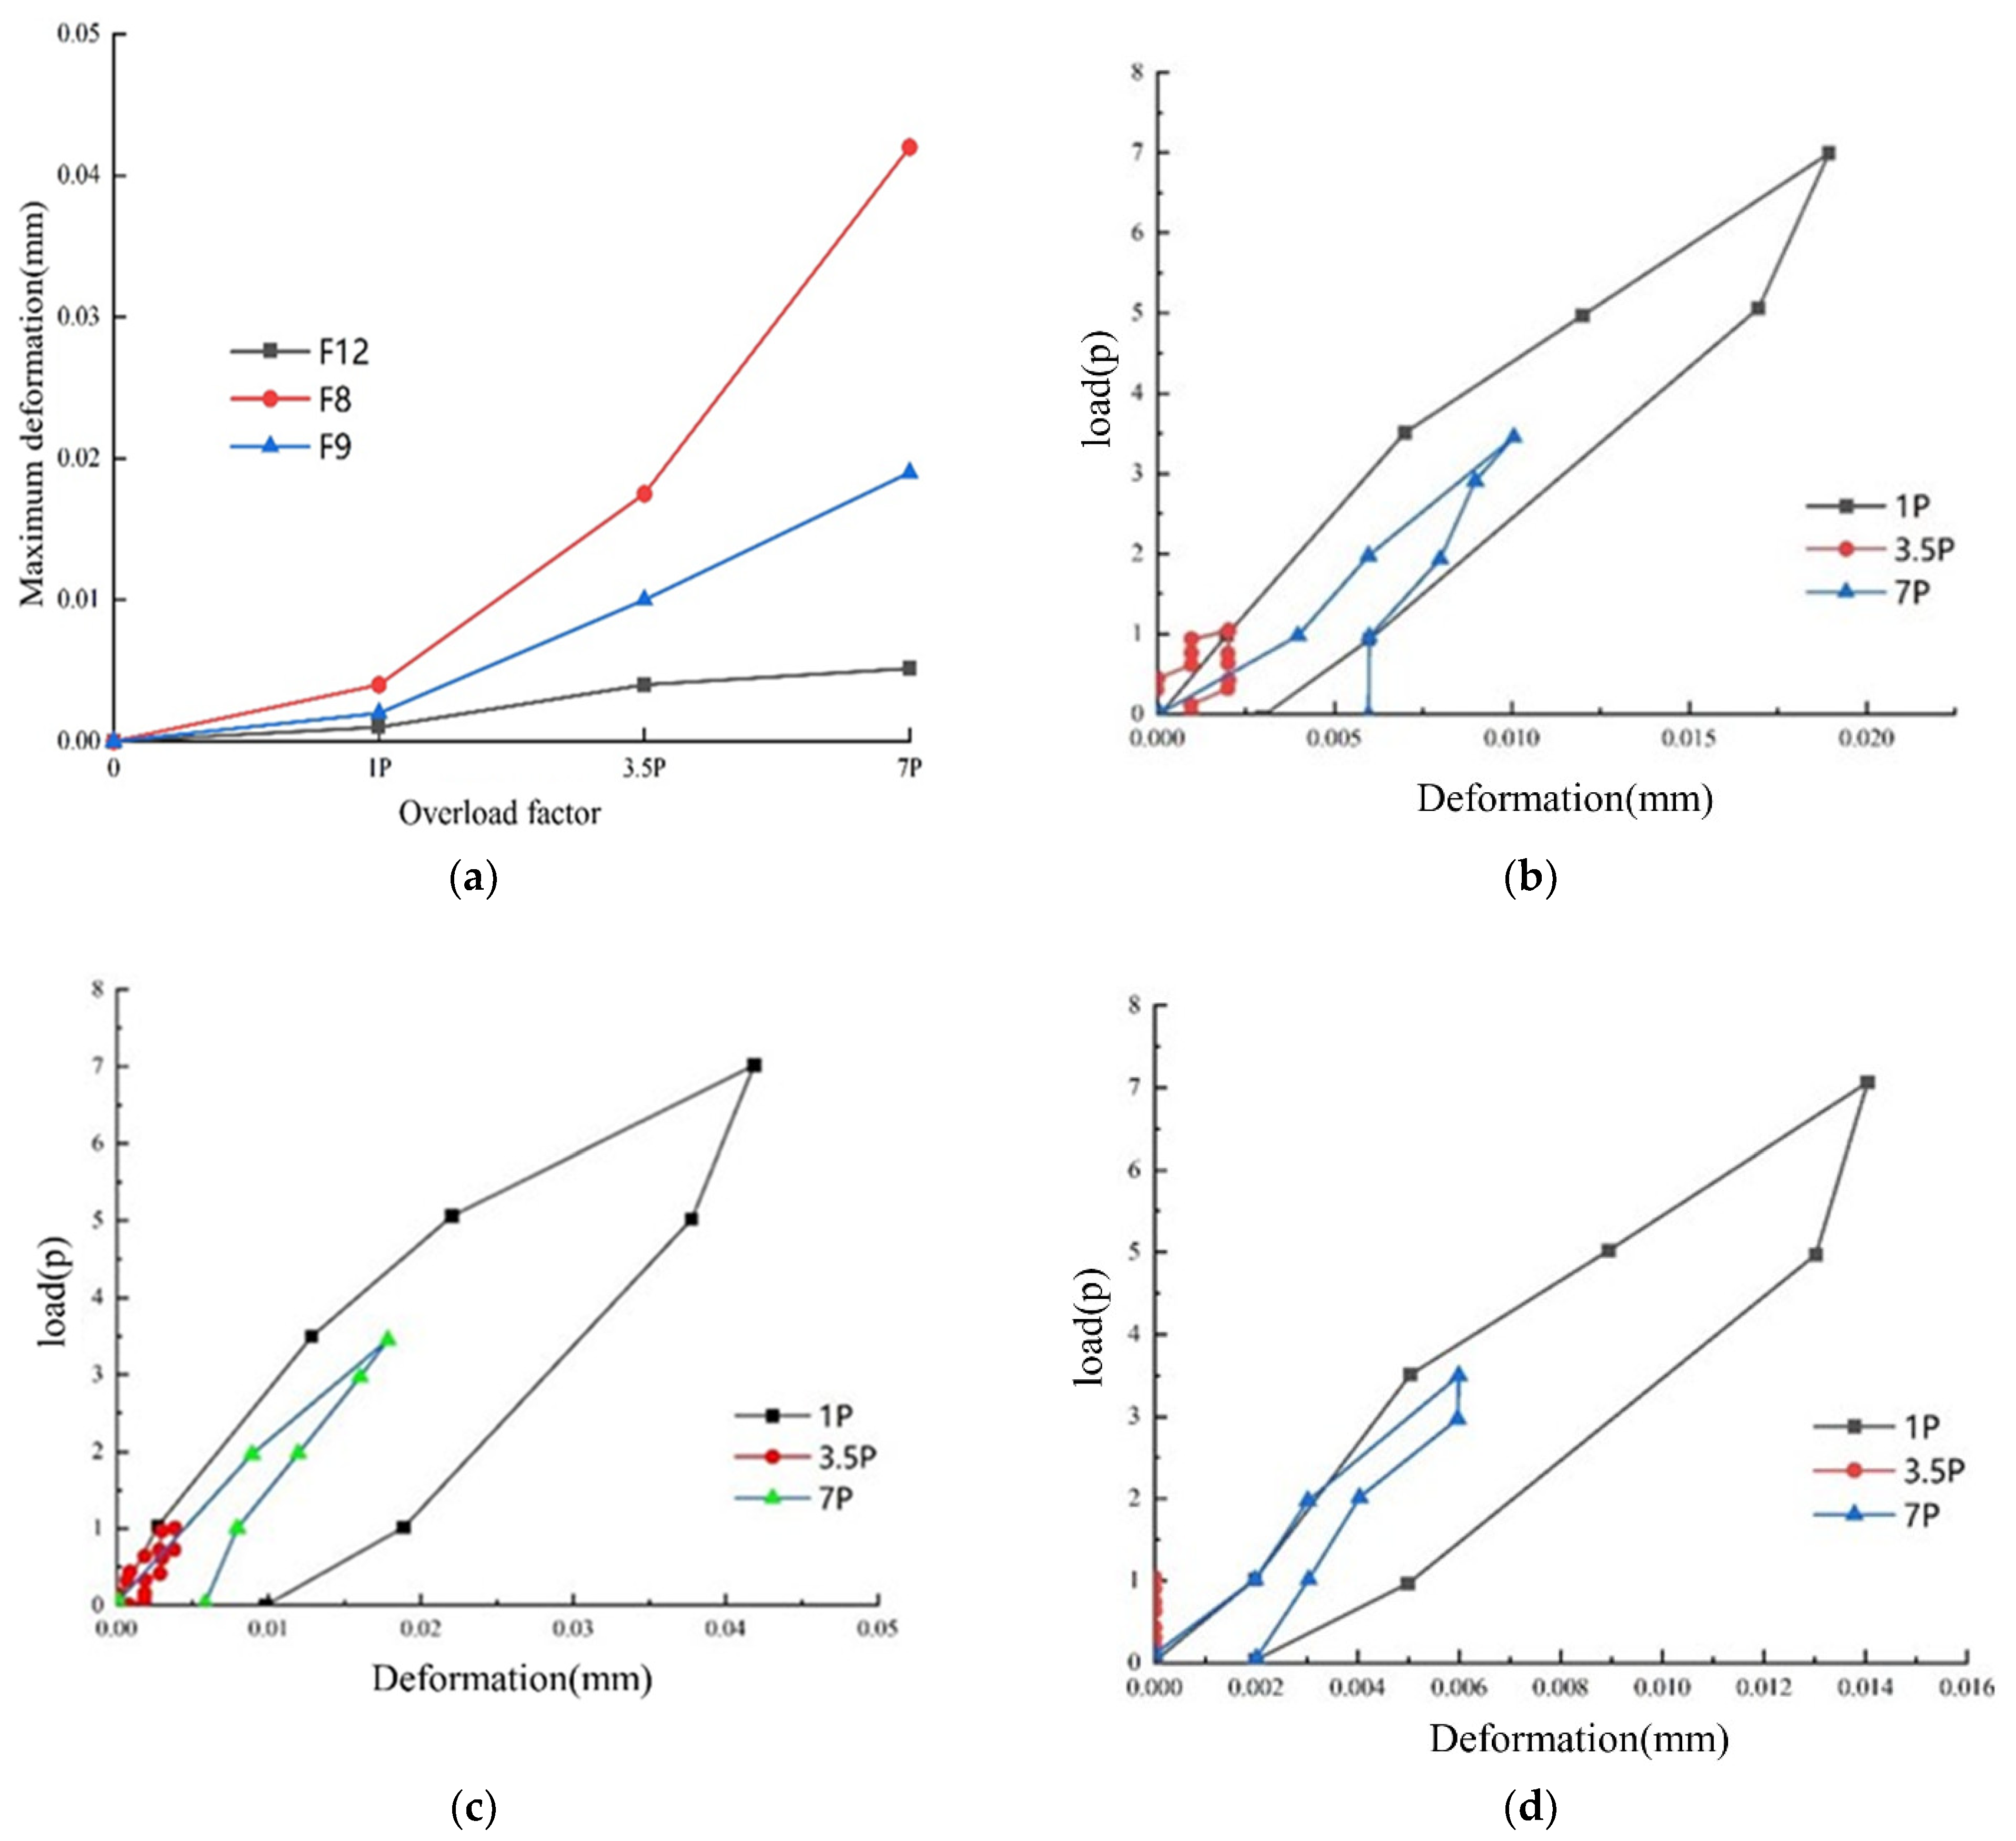
(4) The deformation of each monitoring point under 3.5 P and 7 P overload was analyzed, and the same pattern as under 1 P load was found, that is, the maximum displacement between the anchor plug and the surrounding rock occurred in the middle of the anchor body, and the maximum strain occurred on the anchor surface after anchoring.
(5) The deformation trend of the anchor and surrounding rock under stepwise loading was studied through destructive tests, and it was found that the deformation of the surrounding rock and anchor increased nonlinearly between 8 P and 10 P. The overload coefficient of the anchor was proposed to be 8 P.
These findings establish a comprehensive technical framework for improving tunnel anchorage design practices in conglomerate strata, providing three key advancements: (1) a basis for revising safety factors in current design codes to account for conglomerate-specific behaviors; (2) scientifically grounded protocols for stage-construction monitoring, with quantified thresholds for displacement and strain control; and (3) optimization methodologies for anchorage systems in heterogeneous rock masses, including targeted reinforcement strategies and advanced grouting techniques. The framework addresses critical gaps between conventional design approaches and the actual mechanical responses observed in conglomerate environments, offering practical solutions for safer and more efficient anchorage system implementation. Based on the results of these studies, later research has focused on numerical simulation analysis, comparing the numerical analysis results with the results of physical model experiments to obtain a more accurate deformation and failure mechanism of the surrounding rock for tunnel anchoring.

Author Contributions

Conceptualization, Z.S.; methodology, M.D.; software, M.D.; validation, Z.S. and M.D.; investigation, L.Z. and A.T.; resources, Z.S.; data curation, L.Z.; writing—original draft preparation, M.D.; writing—review and editing, X.L.; visualization, X.L.; supervision, Z.S.; project administration, Z.S.; funding acquisition, Z.S. All authors have read and agreed to the published version of the manuscript.

Funding

This research received no external funding.

Institutional Review Board Statement

Not applicable.

Informed Consent Statement

Not applicable.

Data Availability Statement

The raw data supporting the conclusions of this article will be made available by the authors on request.

Conflicts of Interest

Authors Zhijin Shen, Li Zhang and Aipeng Tang were employed by the company Changjiang Survey, Planning, Design and Research Co., Ltd. The remaining authors declare that the research was conducted in the absence of any commercial or financial relationships that could be construed as a potential conflict of interest.

References

  1. Tsakiri, M.; Lekidis, V.; Karakostas, C.; Klimis, N.; Sous, I.; Makra, K. Evaluation of dynamic response and local soil effects of the Evripos cable-stayed bridge using multi-sensor monitoring systems. Eng. Geol. Amst. 2004, 79, 43–59. [Google Scholar] [CrossRef]
  2. Gwon, S.; Choi, D. Static and dynamic analyses of a suspension bridge with three-dimensionally curved main cables using a continuum model. Eng. Struct. 2018, 161, 250–264. [Google Scholar] [CrossRef]
  3. Deng, Z.; Wu, X.; Liu, D.; Li, D.; Wei, N.; Liu, X.; Han, Y. A Comprehensive review of the mechanical behavior of suspension bridge tunnel-type anchorage. Adv. Mater. Sci. Eng. 2019, 2019, 3829281. [Google Scholar] [CrossRef]
  4. Paolo, C. Effects of Differential Displacements Between the Ground Anchors in Suspension Bridges. Infrastructures 2024, 9, 211. [Google Scholar] [CrossRef]
  5. Gosteev, Y.; Konovalov, I.; Obukhovskiy, A.; Salenko, S.; Yashnov, A.; Lebedev, A. Numerical and Experimental Studies of the Use of Fiber-Reinforced Polymers in Long-Span Suspension Bridges. Energies 2022, 15, 1864. [Google Scholar] [CrossRef]
  6. Li, A.; Feng, D.; Deng, Y.; Chen, S. Serviceability assessment for long-span suspension bridge based on deflection measurements. Struct. Control Health Monit. 2018, 25, e2254. [Google Scholar] [CrossRef]
  7. Lim, H.; Seo, S.; Lee, S.; Chung, M. Analysis of the passive earth pressure on a gravity-type anchorage for a suspension bridge. Int. J. Geo-Eng. 2020, 11, 13. [Google Scholar] [CrossRef]
  8. Sun, J.; Manzanarez, R.; Nader, M. Design of looping cable anchorage system for New San Francisco-Oakland Bay Bridge main suspension span. J. Bridge Eng. 2002, 7, 315–324. [Google Scholar] [CrossRef]
  9. Doig, J. The Best as Enemy of the Good the Port Authority’s 4th Jetport, Lindenthal’s massive span over the Hudson, and the George Washington Bridge. Soc. Sci. Electron. Publ. 2014, 8, 900–906. [Google Scholar] [CrossRef]
  10. Christoffersen, S.; Hall, T.; Gorman, J.; Gross, D.; Matty, S.; Cavendish-Tribe, A.; Shulock, R. San Francisco-Oakland Bay Bridge Anchor Rod Cracking Issues. Mater. Perform. 2015, 54, 52–57. [Google Scholar]
  11. Larsen, K.R. Dehumidification slows corrosion of Forth Road Bridge cables. Mater. Perform. Appl. Inf. Prot. Mater. 2013, 52, 22–24. [Google Scholar] [CrossRef]
  12. Kadooka, M.; Okada, M.; Hashida, Y. Cable erection of Shimotsui-Seto Bridge. KOBELCO Technol. Rev. 1988, 4, 11–14. [Google Scholar]
  13. Deng, Z.; Yu, C.; Wu, X.; Liu, X.; Li, D.; Tu, Y.; Han, Y. Anti-pull mechanisms and weak interlayer parameter sensitivity analysis of tunnel-type anchorages in soft rock with underlying weak interlayers. Eng. Geol. 2019, 253, 123–136. [Google Scholar] [CrossRef]
  14. Meyerhof, G. Uplift resistance of inclined anchors and piles. In Proceedings of the 8th International Conference on Soil Mechanics and Foundation Engineering, Moscow, Russia, 6–11 August 1973. [Google Scholar] [CrossRef]
  15. Das, B. A procedure for estimation of uplift capacity of rough piles. Soils Found. 1983, 23, 122–126. [Google Scholar] [CrossRef] [PubMed]
  16. Aydan, Ö.; Ebisu, S.; Komura, S. Pull-out tests of rock anchors and their failure modes. In Assessment and Prevention of Failure Phenomena in Rock Engineering; CRC Press: Istanbul, Turkey, 1993; pp. 285–293. [Google Scholar] [CrossRef]
  17. Shanker, K.; Basudhar, P.; Patra, N. Uplift capacity of single piles: Predictions and performance. Geotech. Geol. Eng. 2007, 25, 151–161. [Google Scholar] [CrossRef]
  18. Yang, T.; Rui, Y.; Zhang, C.; Shen, L.; Xu, T.; Wang, S.; Liu, H. Rheological characteristics of weak rock mass and effects on the long-term stability of slopes. Rock Mech. Rock Eng. 2014, 47, 2253–2263. [Google Scholar] [CrossRef]
  19. Xu, D.; Zhang, Y.; Wu, X.; Wu, Y.; Zhou, H.; Luo, R.; Li, Y.; Fan, L.; Wu, A. A field model test method of tunnel-type anchorages in rock mass and its application in railway suspension bridge engineering. Rock Mech. Rock Eng. 2023, 56, 8891–8906. [Google Scholar] [CrossRef]
  20. Deng, Z.; Wu, X.; Tu, Y.; Liu, D.; Li, D.; Liu, X.; Han, Y. Model test on the bearing behaviors of the tunnel-type anchorage in soft rock with underlying weak interlayers. Bull. Eng. Geol. Environ. 2020, 79, 1023–1040. [Google Scholar] [CrossRef]
  21. Zhu, B.; Shen, Z.; Jia, J.; Jiang, N.; Sun, W. Field-scale experiment on deformation characteristics and bearing capacity of tunnel-type anchorage of suspension bridge. Energies 2022, 15, 4772. [Google Scholar]
  22. Massimino, M.; Maugeri, M. Physical modelling of shaking table tests on dynamic soil-foundation interaction and numerical and analytical simulation. Soil Dyn. Earthq. Eng. 2013, 49, 1–18. [Google Scholar] [CrossRef]
  23. Jiang, N.; Wang, D.; Feng, J.; Zhang, S.; Huang, L. Bearing mechanism of a tunnel-type anchorage in a railway suspension bridge. J. Mt. Sci. 2021, 18, 2143–2158. [Google Scholar] [CrossRef]
  24. Lim, H.; Chung, M.; Ko, Y.-H.; Lee, S.; Seo, S. Analysis of failure mode on tunnel-type anchorage by model tests and numerical analyses. In Proceedings of the International Foundations Congress and Equipment Expo 2021, Dallas, TA, USA, 10–14 May 2021; Volume 325, pp. 217–226. [Google Scholar]
  25. Seo, S.; Lim, H.; Chung, M. Evaluation of failure mode of tunnel-type anchorage for a suspension bridge via scaled model tests and image processing. Geomech. Eng. 2021, 24, 457–470. [Google Scholar] [CrossRef]
  26. Sang, S.; Shi, X.; Xiong, J.; Gan, C. Effect of Stratified Flow on the Vibration of Anchor Cables in a Submerged Floating Tunnel. J. Mar. Sci. Eng. 2024, 12, 600. [Google Scholar] [CrossRef]
  27. Ma, J.; Li, Y.; He, S.; He, J.; Liu, X.; Zhang, B. Mechanical Behavior of Anchor Bolts for Shallow Super-Large-Span Tunnels in Weak Rock Mass. Materials 2023, 16, 5862. [Google Scholar] [CrossRef]
  28. AASHTO LRFD. Bridge Design Specifications; American Association of State Highway and Transportation Officials: Washington, DC, USA, 2020. [Google Scholar]
Figure 1. Geological profile of tunnel anchor.
Applsci 15 07743 g001
Figure 2. Layout of on-site rock mechanics test.
Applsci 15 07743 g002
Figure 3. On-site rock mechanics test. (a) Vertical loading of rock deformation test; (b) horizontal loading of rock deformation test; (c) rock mass direct shear test.
Applsci 15 07743 g003
Figure 4. Schematic diagram of scaled model test location and exploration audit location.
Applsci 15 07743 g004
Figure 5. Comparison diagram of terrain similarity analysis for scaled model test.
Applsci 15 07743 g005
Figure 6. 1:12 Field scaled model of tunnel anchorage. (a) Model hole; (b) site operation.
Applsci 15 07743 g006
Figure 7. Scaled model. (a) Plane view; (b) sectional view (unit: cm).
Applsci 15 07743 g007
Figure 8. Deformation monitoring points.
Applsci 15 07743 g008
Figure 9. Front view of deformation monitoring points.
Applsci 15 07743 g009
Figure 10. Loading jack system.
Applsci 15 07743 g010
Figure 11. Deformation characteristics of tunnel anchorage surrounding rock. (a) Deformation of the free face of the D2 surrounding rock between anchors; (b) deformation of the sliding micrometer on the rear anchor surface.
Applsci 15 07743 g011
Figure 12. Cumulative deformation curves inside the hole. (a) C1Rear anchor surface; (b) C2 Front anchor surface.
Applsci 15 07743 g012
Figure 13. Deformation of sliding micrometer. (a) Free face of the borehole; (b) front anchor surface of borehole.
Applsci 15 07743 g013
Figure 14. Deformation of dislocation gauge. (a) Left anchor; (b) right anchor.
Applsci 15 07743 g014
Figure 15. Dislocation meter deformation curve. (a) Deformation curve under different loads; (b) dislocation meter F9 deformation curve; (c) dislocation meter F8 deformation curve; (d) dislocation meter F1 deformation curve.
Applsci 15 07743 g015
Figure 16. Deformation curve. (a) Deformation curve of surrounding rock between anchors under step load; (b) deformation curve of free surface under step load; (c) deformation curve of front anchor surface under step load; (d) deformation curve of rear anchor surface under step load.
Applsci 15 07743 g016
Figure 17. Deformation trend chart of measuring holes. (a) Front anchor surface; (b) rear anchor surface.
Applsci 15 07743 g017
Figure 18. Schematic diagrams. (a) Fracture surface; (b) surrounding rock failure zoning.
Applsci 15 07743 g018
Table 1. Physical properties of rocks.
Rock FormationField
Naming
Weathering DegreeBlock Density (g/cm3)Particle Density (g/cm3)Moisture Content (%)Saturation Ratio
(%)
Porosity (%)
DryNaturalSaturated
K2l2ConglomerMedium2.252.292.412.721.697.1412.3
Slightly2.602.602.602.700.801.905.04
K2l1ConglomerateSlightly2.602.602.602.700.601.904.94
K2l2Sandstone
Interlayer
Medium2.402.502.502.700.804.409.90
Table 2. Rock uniaxial test.
Rock FormationField
Naming
Weathering DegreeUniaxial Compressive Strength (MPa)Softening CoefficientUniaxial Deformation (GPa)Poisson’s RatioTensile Strength (MPa)
Deformation Modulus Elastic Modulus
NaturalSaturatedNaturalSaturatedNaturalSaturatedNaturalSaturated
K2l2ConglomerateMedium12.75.490.431.490.662.300.920.270.290.42
Slightly25.412.40.495.841.597.302.750.260.280.50
K2l1ConglomerateSlightly29.717.40.597.602.6211.85.680.250.271.01
K2l2Sandstone
Interlayer
Medium11.05.130.470.850.521.430.690.270.280.40
Table 3. Rock triaxial compressive strength test.
StrataField NamingWeathering DegreeFCohesion (MPa)
K2l2ConglomerateMedium0.955.15
K2l1ConglomerateSlightly1.165.52
Table 4. Rock direct shear test.
StrataField NamingWeathering DegreeFCohesion (MPa)
K2l2ConglomerateMedium0.83 1.25
Slightly1.05 0.52
Sandstone InterlayerMedium0.64 1.52
K2l1Sandstone InterlayerSlightly0.71 2.89
Table 5. Rock deformation test.
Rock CharacterWeathering DegreeLoad DirectionPilot Experiments NumberDeformation Modulus (GPa)Elastic
Modulus (GPa)
K2l2 Partial Conglomerate MediumVerticalE1-11.682.41
K2l2 Partial sandstoneE1-21.262.21
K2l2 SandstoneE1-31.122.13
K2l2 SandstoneSlightlyVerticalE21.472.39
K2l2 ConglomerateSlightlyHorizontalE31.953.13
K2l1 ConglomerateSlightlyVerticalE47.6312.00
Table 6. Rock mass direct shear test.
Rock CharacterWeathering DegreeThe Peak Shear Strength
F′C′ (MPa)
K2l2 ConglomerateMedium1.110.88
K2l2 SandstoneSlightly0.630.38
K2l2 ConglomerateSlightly1.420.99
K2l1 ConglomerateSlightly1.651.25
Table 7. Direct shear test on the contact surface between rock mass and concrete.
Rock CharacterWeathering DegreeThe Peak Shear Strength
F′C′/MPa
K2l2 ConglomerateSlightly1.420.95
K2l1 ConglomerateSlightly1.691.15
K2l1 Conglomerate
(saturated)
Slightly1.580.91
Table 8. Concrete pull-out test.
Rock CharacterWeathering DegreeAverage Ultimate Load (kN)Average Value of Ultimate Frictional Resistance (MPa)
K2l1 ConglomerateSlightly621.01.2
Disclaimer/Publisher’s Note: The statements, opinions and data contained in all publications are solely those of the individual author(s) and contributor(s) and not of MDPI and/or the editor(s). MDPI and/or the editor(s) disclaim responsibility for any injury to people or property resulting from any ideas, methods, instructions or products referred to in the content.

