Abstract
Ground subsidence is a significant geotechnical hazard in urban areas, leading to property damage, casualties, and broader societal issues. This study investigates the mechanisms of cavity formation and ground subsidence through laboratory model tests using Korean standard sand and marine clay under controlled conditions. A transparent soil box apparatus was fabricated to simulate sewer pipe damage, with model grounds prepared at various relative densities, groundwater levels, and fines contents. The progression of cavity formation and surface collapse was observed and quantitatively analyzed by measuring the time to cavity formation and ground subsidence, as well as the mass of discharged soil. Results indicate that lower relative density accelerates ground subsidence, whereas higher density increases cavity volume due to greater frictional resistance. Notably, as the fines content increased, a tendency was observed for ground subsidence to be increasingly suppressed, suggesting that cohesive clay particles can limit soil loss under seepage conditions. These findings provide valuable insights for selecting backfill materials and managing subsurface conditions to mitigate ground subsidence risks in urban infrastructure.
1. Introduction
Ground subsidence is a geological hazard characterized by the downward movement or sinking of the earth’s surface. Such incidents, particularly in densely populated urban areas, can cause human casualties and extensive property damage, and various social problems such as the paralysis of transportation infrastructure and anxiety among residents [1]. Ground subsidence is a phenomenon where the ground surface collapses, triggered by both natural processes and human activities. It has a similar accident pattern to sinkholes. Unlike sinkholes, which are caused by the dissolution of soluble bedrock (such as limestone strata), ground subsidence occurs due to the loss of soil particles under the ground [2]. Hence, ground subsidence can be prevented in advance through the management of underground soil particles and cavities. An effective prevention of ground subsidence would require a thorough understanding of its causes and mechanisms.
Several countries experiencing rapid urbanization are currently implementing management strategies to counter the threat of ground subsidence. In Florida, U.S.A, information on how to use the ONE-CALL SYSTEM and the locations of underground facilities is provided to the managers of underground facilities and excavation or demolition workers to prevent damage to underground facilities caused by excavation or demolition in underground spaces [3,4]. In Japan, periodic cavity inspections are performed on roads, and research has been conducted to prioritize maintenance activities through risk assessment [5,6]. In Singapore, roads are regularly inspected, along with the operation of 24 h reporting hotlines and the construction of a repair system within 24 h [7]. In South Korea, the “Special Act on the Safety Management of Underground Facilities” has been in effect since 2018 to manage disasters in underground spaces. As part of the underground safety information system construction related to the act, an integrated underground space map and an underground space safety management system have been constructed [8].
For ground subsidence management, ground penetrating radar has been used to detect underground cavities in advance [9,10]. According to a survey conducted by the Seoul metropolitan government in Korea, the main cause of ground subsidence is damage to underground pipelines [11]. Damage to underground pipes causes a mechanism whereby a cavity occurs due to the loss of underground soil particles in the damaged area, and the ground surface collapses with its gradual expansion [12]. The construction of underground facilities is facilitated by backfilling with sand. In Japan, several experimental studies have been conducted to simulate underground cavities using standard sand. Through the results of laboratory model tests, the relevant relationships between ground conditions or cavity geometry and the bearing capacity of the ground have been established [13]. Laboratory model tests were conducted to simulate ground subsidence using silica sand, along with research on cavity formation, expanded geometry, and subsidence mechanisms [5,14,15,16,17]. The drainage time and ground behavior characteristics with respect to the permeability were identified using samples with different particle sizes. To identify the mechanism of cavity formation caused by water leakage from sewer pipes, which is known as the main cause of ground subsidence, cavity formation characteristics were identified by repeatedly injecting water under a constant pressure into the bottom of a soil box. In addition, the relationship between the ground stress and displacement in the presence or absence of cavities was established by simulating underground cavities in advance [18]. Laboratory model tests were conducted under various conditions to identify the ground subsidence mechanism. However, these tests were conducted on a small scale (a width of 10 cm or less). This makes it difficult to exclude the interference of the soil box while identifying the ground subsidence mechanism [19].
Therefore, in this study, to clarify the mechanism of ground subsidence, a soil box was fabricated to simulate the damage of underground facilities, and a laboratory model test was performed using Korean standard sand and fines. A soil box simulating damage to the upper part of an underground pipe was fabricated. The ground composed of standard sand was simulated in the produced soil box, and a laboratory model test was conducted to simulate ground subsidence under varying groundwater levels, relative densities, and fines content. After the experiment was performed, the time until cavity formation and ground surface collapse, as well as the amount of soil discharged until cavity formation, was measured to identify the ground subsidence mechanism under the varying conditions.
2. Research Materials and Methods
2.1. Korean Standard Sand
Sand is used as a backfilling material on top of underground facilities to facilitate construction as well as to protect the facilities [20,21]. Therefore, in this study, Korean standard sand was used to minimize the impact of property differences caused by ground characteristics and to maintain constant conditions. A laboratory model test was conducted to examine the effects of the relative density, groundwater level, and fines content during the fabrication of the soil box on cavity formation. Figure 1 shows the particle size distribution of the standard sand; Table 1 lists its basic properties. The particle size distribution and physical properties of the samples used in this study were determined in accordance with ASTM D6913, D7928, D854, D4254, D4253, D698, D2487, and D4318.
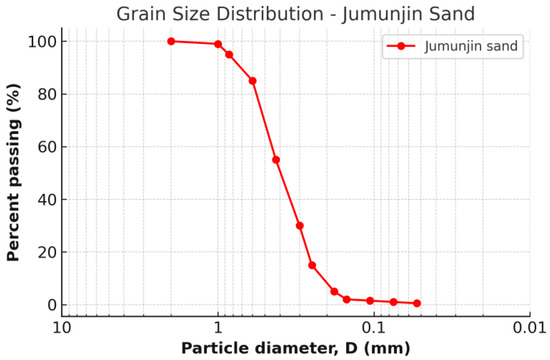
Figure 1.
Particle size distribution of Jumunjin standard sand.

Table 1.
Properties of the standard sand used in the laboratory model test.
2.2. Fines Characteristics
The standard sand was mixed with fines, and a laboratory model test was conducted to identify the ground subsidence mechanism under various fines mixing conditions (contents). The fines used in the experiment were marine clay collected from the southern coast of Korea. Table 2 presents their properties.
Table 2.
Physical properties of the marine clay.
2.3. Experimental Setup
An experimental setup was fabricated to simulate the ground of a damaged sewer pipe. Figure 2 shows the configuration. The experimental setup was fabricated using transparent acrylic panels to observe underground cavities, and it was reinforced with a metal frame to prevent the deformation of the soil box. The soil box used to simulate the ground measured 50 cm in width, 25 cm in depth, and 50 cm in height, and a permeable water tank 10 cm in width, 25 cm in depth, and 50 cm in height was attached to both sides of the soil box to simulate the groundwater level. As shown in Figure 3, circular holes 5 mm in diameter were created between the water tanks and the soil box so that water could flow from the water tanks to the soil box. Filters were installed on the sides of the soil box to prevent soil discharge between the soil box and the water tanks when the groundwater level rose. As shown in Figure 4, a crack was created on the bottom surface of the soil box to simulate a crack in a sewer pipe. The shape and size are significant factors affecting the experimental results, but this study assumed the circle crack with a diameter of 1.5 cm. It was used to induce soil discharge by forming a seepage flow under fluctuations in the groundwater level. In addition, a drainage valve was installed on the crack to prevent the loss of soil particles until the model ground was fully saturated. However, in this study, geometric, kinematic, and dynamic similarity laws between the prototype (actual structure) and the laboratory model were not strictly applied, and no specific similarity ratio (e.g., 1:20, 1:50) was adopted. The size of the soil box was determined primarily based on laboratory installation feasibility and minimization of boundary effects, rather than on analytical similarity laws. Therefore, the significance of the experimental results in this study lies in the qualitative analysis of the mechanism and behavior of ground subsidence, rather than in quantitative prediction.
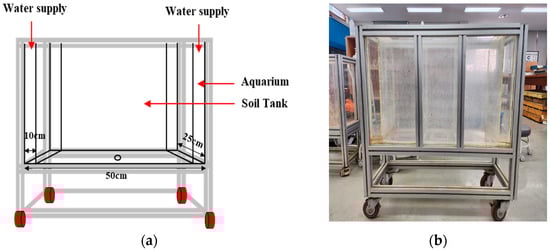
Figure 2.
(a) Schematic diagram of the model soil box and (b) image of the experimental setup including the soil box.
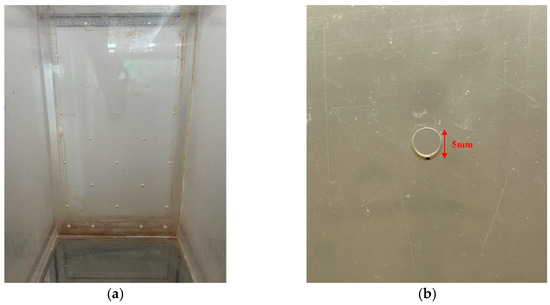
Figure 3.
Details of the water flow system between the water tank and the soil box: (a) general view of the interface showing multiple 5 mm diameter holes, (b) close-up view of a circular hole (5 mm in diameter) for water inflow.
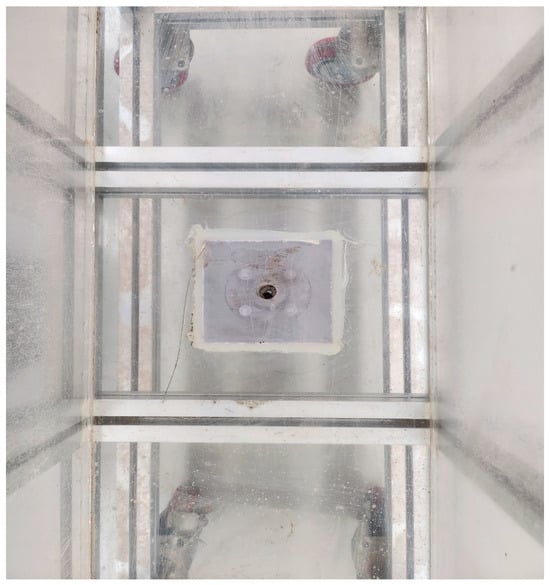
Figure 4.
Outlet at the bottom of the soil box.
2.4. Research Method
2.4.1. Experimental Method
The experiment was performed using the relative density, groundwater level, and fines content as factors. The sequence of the laboratory model test with a soil box was as follows. First, the standard sand was compacted to relative densities of 60% and 75%. After calculating the sample amount required with respect to the soil box volume, samples were prepared with a water content of 5%. The water content of the sample was adjusted by first measuring the mass of the completely dried soil and then mixing the amount of water corresponding to a target water content of 5% with the soil. The valve in the soil box was used to prevent the loss of soil through the crack at the bottom of the box, and filters made of wire mesh were installed on both sides of the soil box to prevent soil discharge into the water tanks. The prepared samples were compacted by hand using a tamping rod. A uniform degree of compaction is required for simulating the model ground. Thus, the compaction was performed by dividing the ground into nine layers. One layer was set to 5 cm, and the sample amount for the corresponding volume was calculated and added into the soil box. For every 5 cm, colored sand was placed on the walls of the soil box to distinguish the layers and examine the ground behavior. The model ground with a total height of 45 cm was simulated. Upon the completion of compaction, the target groundwater level was formed using a tape measure attached to the water tanks. After the compacted ground was fully saturated, the cavity formation test was started. The groundwater level was maintained by supplying water at a constant flow rate through a hose, and a measuring tape attached to the water tank was used to ensure that the groundwater level remained unchanged. The groundwater level was sustained from the preparation of the model ground until the completion of the experiment by continuously supplying water. The saturation of the ground was confirmed by observing whether the water reached the target groundwater level through the soil box walls. The experiment was performed after confirming that there was no change in the saturated ground for 5 min following saturation.
In the experiment, points at which cavities and ground subsidence occurred were determined to identify the ground subsidence mechanism. Since it was difficult to clearly observe cavity formation inside the soil box, the ground behavior on the walls of the soil box was observed. The ground subsidence process was divided into cavity formation and ground subsidence. Figure 5a shows the point at which cavity formation occurred in the model ground due to soil loss. It was defined as the moment when the movement of the colored sand occurred on the soil box observation surface (front). Figure 5b shows an image of the scene defined as ground subsidence. Ground subsidence was defined as the moment when the ground surface completely collapsed. In addition, the time until cavity formation and ground subsidence after the start of the experiment was measured using a stopwatch and video to analyze ground subsidence tendencies under experimental conditions. The dry weight of the soil discharged through the bottom of the soil box until cavity formation was measured to estimate the cavity volume under these conditions. Figure 6 shows a flowchart of the experimental process.
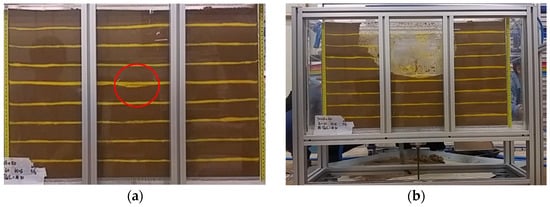
Figure 5.
Illustrations of (a) initial cavity formation and (b) ground subsidence.
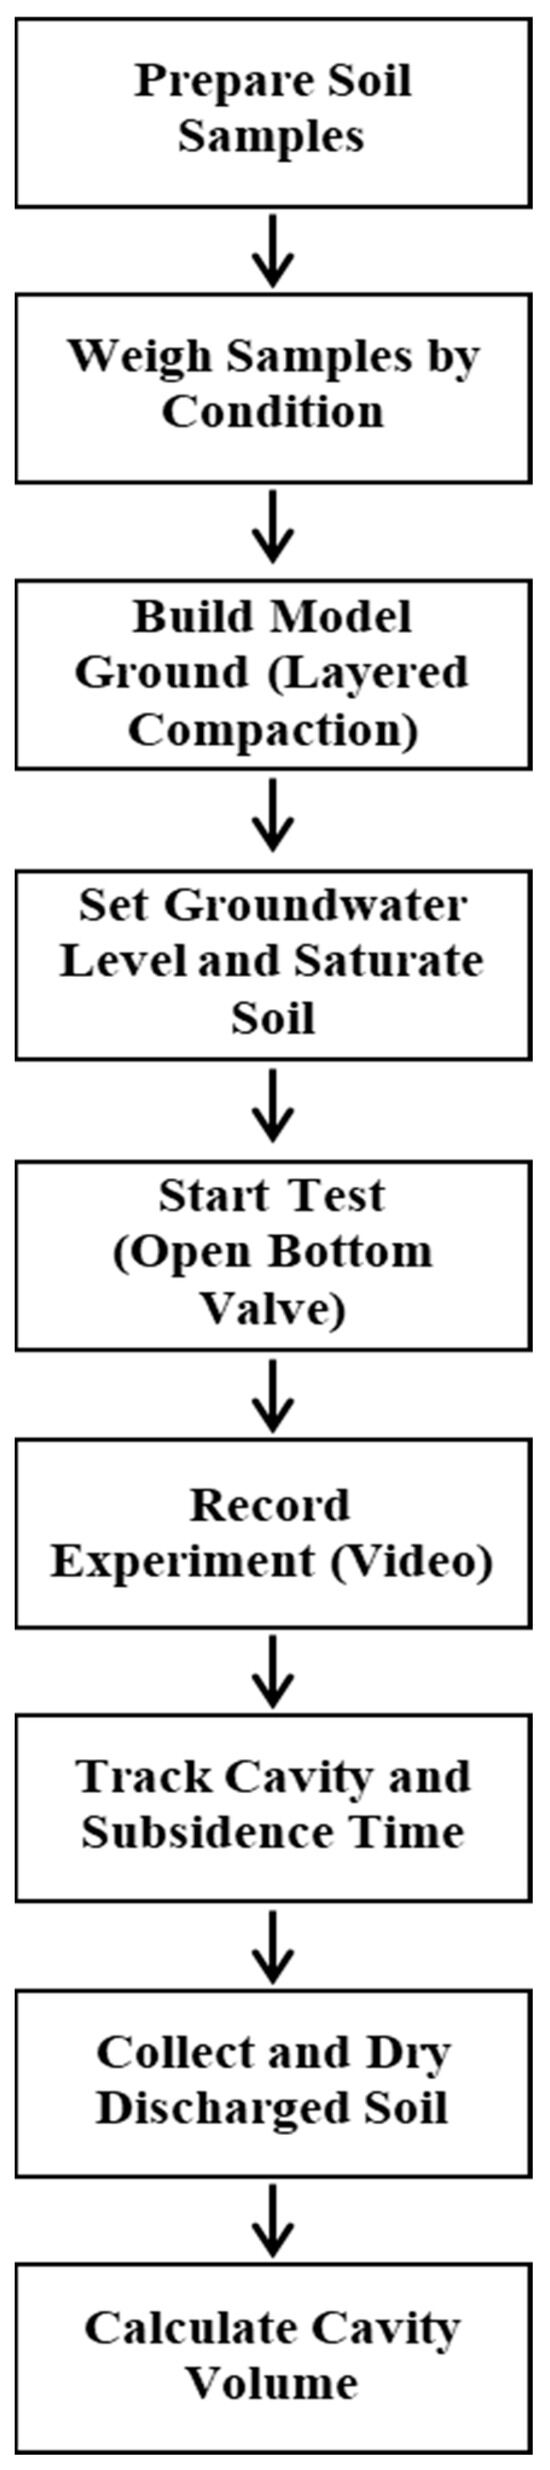
Figure 6.
Research flowchart.
2.4.2. Experimental Conditions
The model ground was simulated under various conditions to analyze the ground subsidence mechanism with respect to the groundwater level, relative density, and fines content. To analyze this mechanism with respect to the degree of ground compaction, the model ground was simulated by adjusting the relative density (Dr) of the standard soil to 60% and 75%. These relative densities simulate a loose state reflecting typical field conditions and a dense state (approximately 75%) representing relatively well-compacted backfill, respectively. Experiments were also performed at groundwater levels of 10, 20, and 30 cm. The relative density, which is an indicator of the density of the ground, is used to quantify the relative compactness of the ground [22]. It is calculated using Equation (1), which utilizes the void ratio in the natural state (), minimum void ratio (), and maximum void ratio () [23].
The change in the groundwater level refers to the height toward the ground surface from the upper part of the sewer pipe (bottom of the soil box), and the ground subsidence tendency with respect to the degree of saturation of the ground was examined. The water content during compaction has no significant impact on ground subsidence [24,25]. Thus, the water content was set to 5%, which is sufficient for model ground simulations [26,27].
The fines content was adjusted by adding completely dried marine clay to the standard sand. Based on this, the ground subsidence pattern with respect to the particle size characteristics of the ground was assessed. The standard sand and clay were mixed by calculating their weight for a relative density of 60%, and the ground subsidence pattern with respect to the groundwater level was analyzed by setting the fines content to 5%, 7.5%, 10%, 12.5%, 15%, and 20%. The experiment was performed under 24 cases of experimental conditions, as listed in Table 3.
Table 3.
Experimental conditions.
3. Experimental Results
3.1. Experimental Results with Respect to Relative Density and Groundwater Level
The model ground was simulated with relative densities of 60% and 75% using the standard sand. The time until cavity formation and ground subsidence, as well as the amount of soil discharged until cavity formation, was measured with respect to the groundwater level. The time until cavity formation and ground subsidence was measured by visual observations of the soil box. This approach, however, cannot determine the accurate time at which cavity and ground subsidence occurred. Since the experiment was performed under the same conditions (sample, equipment, experimenter, and measurement method), it was deemed possible to identify the occurrence tendency under the experimental conditions. As for the amount of soil discharged, the soil discharged until cavity formation was dried, and its weight was measured. The amount of soil discharged was converted into volume () through Equation (2) [28].
Here, , , ms, and e are the water density, specific gravity, dry mass, and void ratio, respectively.
Table 4 presents the results of the time until cavity formation with respect to the relative density under varying groundwater level conditions. Here, the “Cavity formation (min)” and “Ground subsidence (min)” represent the time elapsed from the start of the experiment to the formation of the cavity and to the occurrence of ground subsidence, respectively. Clearly, the time was relatively delayed under all groundwater level conditions at a relative density of 75%. Similarly, the time until ground subsidence was also relatively delayed for the ground with a relative density of 75%.
Table 4.
Experimental results with respect to the relative density and groundwater level.
The comparison of the time until cavity formation and ground subsidence with respect to the groundwater level revealed that the time was inversely proportional to the groundwater level. In addition, no collapse of the ground surface was observed at a groundwater level of 10 cm. After soil discharge for a certain duration, only the water that saturated the ground leaked downward.
Table 5 presents the cavity volume calculated using the amount of soil discharged. The cavity volume tended to increase with increasing relative density; however, this tendency was not clear at a groundwater level of 30 cm. This could be attributed to the early occurrence of cavity due to the high groundwater level, and measurements were distorted in the process due to human errors during the model ground simulation and experiment.
Table 5.
Amount of soil discharged and cavity volume with respect to the relative density and groundwater level.
3.2. Experimental Results with Respect to Fines Content
After preparing samples under experimental conditions by mixing the standard sand and marine clay, the ground was simulated in the soil box. Fines were obtained by sifting dried clay using a #200 sieve, and they were mixed with the standard sand by calculating the weight based on the conditions. Table 6 presents the results of the time until cavity formation and ground subsidence with respect to the fines content. The sample with a fines content of 5% under a groundwater level of 10 cm exhibited cavity formation on the walls of the soil box in 8 min after the start of the experiment. No ground subsidence, however, occurred, and the experiment was stopped in 14 min and 30 s given the lack of soil loss. When the groundwater level was increased to 20 cm, the time until cavity formation sharply decreased to 1 min and 23 s, and ground subsidence occurred in 3 min and 43 s. Under a groundwater level of 30 cm, the cavity occurred in 42 s, and the shortest time until ground subsidence (2 min and 15 s) was observed.
Table 6.
Experimental results with respect to the fines content.
The model ground with a fines content of 7.5% under a groundwater level of 10 cm required 5 min and 40 s for cavity formation and 11 min and 6 s for ground subsidence. When the groundwater level was increased to 20 cm, the cavity occurred in 10 min and 42 s and ground subsidence in 22 min. Under a groundwater level of 30 cm, the time until cavity formation sharply decreased to 18 s, and ground subsidence also rapidly occurred in 50 s.
For the sample with a fines content of 10% under a groundwater level of 10 cm, cavity formation could not be observed through the walls of the soil box. Soil was continuously discharged during the experiment; however, the experiment was stopped in 30 min because no soil loss occurred. When the groundwater level was increased to 20 cm, the cavity occurred in 2 min and 15 s and ground subsidence in 22 min. When it was increased to 30 cm, the cavity occurred in 13 s after the start of the experiment and ground subsidence in 1 min and 9 min.
For the model ground with a fines content of 12.5% under a groundwater level of 10 cm, the cavity occurred in 13 min and 48 s, and the experiment was stopped in 14 min and 43 s after the start of the experiment due to the lack of soil discharge. Under a groundwater level of 20 cm, there was no ground subsidence, and the cavity occurred in 2 min and 45 s. When the groundwater level was increased to 30 cm, the cavity was observed in 7 min and 50 s and ground subsidence in 11 min and 30 s. The model ground with a fines content of 15% showed no ground subsidence under any of the groundwater level conditions.
Table 7 presents the measurement results of the amount of soil discharged until cavity formation. Clearly, the cavity formation tended to be inhibited when the fines content was 10% or higher. However, when the fines content was less than 10%, relatively large cavities occurred at a groundwater level of 10 cm. This indicates that the cavity expanded over a relatively long duration under a groundwater level of 10 cm but did not lead to ground subsidence in the absence of a load over it. When the fines content was 10% or higher, ground subsidence did not occur in most cases, making it difficult to identify significant cavity volumes.
Table 7.
Amount of soil discharged and cavity volume with respect to the fines content.
4. Correlation Analysis Based on Ground Conditions
Based on the model test results, a Pearson’s correlation analysis was conducted to examine the correlations between ground conditions (relative density, groundwater level, and fines content), the time until cavity formation and ground subsidence, and the cavity volume. A Pearson’s correlation analysis helps identify the magnitude of the correlations by examining linear relationships between variables. A correlation analysis is conducted using Equation (3). A higher absolute value of the correlation coefficient indicates a higher correlation between the two variables. The test statistic (p-value) should be examined for the correlation analysis results with statistical reliability. It is an indicator of statistical significance. If the value is 0.05 or less, the two variables are said to be statistically significant [29,30].
where are the standard deviations of the variables.
Table 8 presents the correlation analysis results. The correlation coefficient between the fines content and cavity volume and that between the relative density and cavity volume were −0.837 and 0.612, respectively, indicating strong correlations. In addition, the p-values between the variables were less than 5%, confirming statistical significance [31]. Therefore, attention must be paid to cavity formation in the ground by managing the relative density and fines content of the ground. Our correlation analysis was conducted using a limited amount of data. This appears to have resulted in no statistical significance for most factors. If the correlation analysis is conducted by considering sufficient parameters through experiments under various conditions in the future, the importance of factors influencing ground subsidence can be revealed.
Table 8.
Correlation analysis results.
5. Analysis of Ground Subsidence Mechanism
The ground subsidence mechanism was analyzed based on the results of the laboratory model test where the model ground was experimented under various conditions. As sufficient parameters were not considered, it is difficult to perform a quantitative mechanism analysis through a correlation analysis. Therefore, the ground subsidence mechanism with respect to ground conditions was studied by analyzing the overall tendency.
The main cause of ground subsidence is damage to sewer pipes [10]. Therefore, in this study, an experiment was performed by simulating damage to the upper part of a sewer pipe. During the installation of a sewer pipe, backfilling is performed on top of the pipe using sand. It is difficult to produce an appropriate level of compaction due to concerns regarding pipe damage [32]. The relative density indicates the degree of compaction. The experimental results for ground subsidence with respect to the relative density revealed that the occurrence of ground subsidence tended to accelerate with decreasing relative density; however, the cavity volume increased with increasing relative density. This appears to be due to the difference in the rate of soil loss caused by the friction resistance between soil particles resulting from the relative density [33]. In the ground with a low relative density, a reduction in the friction resistance between particles causes rapid soil loss, thereby accelerating the occurrence of ground subsidence. In grounds with a high relative density, the soil loss is gradual due to the relatively strong bonding between particles, causing delays in cavity formation and ground subsidence [34]. In addition, structural stability prevents the collapse of the ground surface and inhibits cavity expansion; however, the use of the same material is expected to cause consistent soil loss and result in larger cavities and ground subsidence.
The ground subsidence mechanism was analyzed with respect to the groundwater level. Figure 7 shows the time until cavity formation and ground subsidence (stabilization) with respect to the groundwater level. Figure 7a shows the results for relative densities of 60% and 75% (Figure 7b), respectively. Clearly, the time until cavity formation and ground subsidence decreased with increasing groundwater level, and no ground subsidence occurred under a groundwater level of 10 cm.
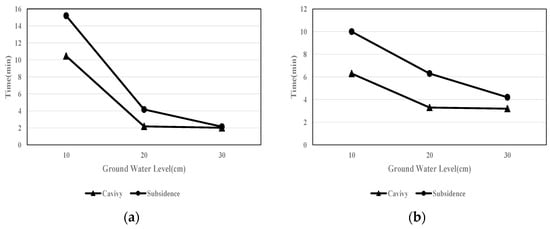
Figure 7.
Time until cavity formation and ground subsidence with respect to the groundwater level under relative densities of (a) 60% and (b) 75%.
Soil discharge measurements revealed that the cavity volume decreased with increasing groundwater level. This appears to be because cavities occurred above the groundwater level. Figure 8 shows the images for the time until cavity formation with respect to the groundwater level. As shown in Figure 8a, for a groundwater level of 10 cm, the cavity occurred above the groundwater level and expanded upward. In Figure 8b, for a groundwater level of 20 cm, expansion of the cavity that occurred near 15 cm slightly below the groundwater level can be seen. As shown in Figure 8c, for a groundwater level of 30 cm, a cavity is formed at a height of approximately 25 cm. These results indicate that cavities tend to form in the vicinity of the groundwater level. Figure 9 shows a conceptual diagram that helps visualize the location of cavity formation with respect to the groundwater level based on the laboratory test results. Clearly, the location of cavity formation varies with increasing groundwater level. Cavity formation is observed near the groundwater level. Therefore, it is judged that ground subsidence occurs more rapidly with increasing groundwater level due to cavity formation at locations closer to the ground surface. For this reason, it appears that a groundwater level of 10 cm resulted in a large amount of soil discharge due to the gradual expansion of the cavity volume.
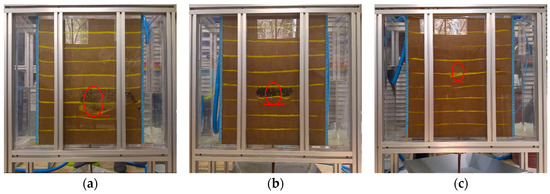
Figure 8.
Cavity formation location with respect to various groundwater levels: (a) 10 cm, (b) 20 cm, and (c) 30 cm.
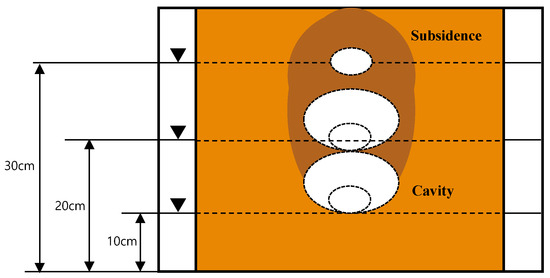
Figure 9.
Conceptual diagram of cavity formation location with respect to the groundwater level (10, 20,30 cm).
Hence, experiments in which the model ground is subjected to load conditions similar to actual ground conditions are required in future research. This is expected to help identify the actual ground subsidence mechanism by preventing behavior that delays cavity formation and ground subsidence due to adhesion in the ground.
The experimental results with respect to the fines content revealed that ground subsidence did not occur under most conditions with a fines content of 10% or higher.
It is considered that the mixing of clay increased both the internal friction angle and cohesion of the soil, thereby enhancing its resistance to particle loss and subsidence during the experiments [35]. Therefore, the presence of clay is believed to have played a key role in preventing ground subsidence by improving the overall strength characteristics of the soil.
6. Discussion
The ground subsidence mechanism identified in this study showed a tendency similar to that observed in previous laboratory model tests, presenting experimental implications that can help expand the applicability of such tests. The ground subsidence tendency with respect to the relative density was similar to the results of previous tests conducted to identify the ground subsidence mechanism [5]. However, a new observation in our study is the possibility that a high relative density could affect the cavity volume. This appears to result from the structural stability caused by an increase in the relative density. It is judged that the groundwater level affects ground subsidence, and with increasing groundwater level, the location of cavity formation moves closer to the ground surface, and ground subsidence tends to occur within a short duration. This is similar to previous experimental results [15]. Therefore, efficient groundwater management is important for preventing ground subsidence. In addition, ground subsidence was inhibited in samples with a fines content of 10% or higher. This is likely because soil loss was inactive due to the cohesion of clay [35]. However, attention must be paid to the use of clay given that employing clay as a backfill material at actual sites may affect the corrosion of the pipes.
7. Conclusions
In this study, a laboratory model test was conducted to simulate the occurrence of ground subsidence using Korean standard sand and marine clay. The main objective was to identify the ground subsidence mechanism in urban areas. Ground subsidence tendencies were examined with respect to the relative density and groundwater level using standard sand. In addition, marine clay was mixed with the standard sand to quantitatively analyze the ground subsidence tendency with respect to the fines content.
The analysis of the ground subsidence mechanism with respect to the relative density revealed that cavity formation and ground subsidence accelerated with decreasing relative density. In the model ground, however, cavities and ground subsidence occurred regardless of the relative density, and the cavity volume increased with increasing relative density. This appears to have been due to the differences in the rate of soil loss caused by friction resistance between soil particles resulting from the relative density.
Cavity formation and ground subsidence accelerated with increasing groundwater level. This appears to have been due to the occurrence of cavities near the groundwater level, and these were closer to the ground surface at higher groundwater levels, resulting in ground subsidence within a short duration.
The fines content in marine clay was found to affect ground subsidence. As the fines content increased, a tendency was observed for cavity formation and ground subsidence to be increasingly suppressed. This was likely because the fines in the ground prevented the loss of soil particles as they moved to the damaged area at the bottom of the soil box under restrained conditions. In underground conditions with a fines content of less than 10%, the cavity volume increased with decreasing groundwater level. This also appears to be related to the cavity formation location with respect to the groundwater level. Structural stability can be ensured if the cavity formed is farther from the ground surface. In such a scenario, a large-scale cavity and considerable time are required for the collapse of the ground surface.
Thus, the ground subsidence mechanism with respect to the relative density, groundwater level, and fines content was analyzed. A laboratory model test on ground subsidence was conducted by simulating the ground under various conditions in a soil box. However, loads (e.g., road and structural loads) on the ground surface similar to actual conditions were not considered. This may be a limitation in practically reflecting the ground subsidence mechanism. Moreover, considerable cost and time are required to simulate the model ground. This caused difficulty in repeating the tests, making it somewhat difficult to ensure reliability.
This study confirms that effective groundwater level management is necessary for the prevention of ground subsidence accidents and that regular inspection of underground utilities is required to suppress the formation of cavities within the ground. In addition, the mechanisms of ground subsidence under various ground conditions presented in this study are expected to serve as fundamental reference data for the selection of backfill materials and construction methods during the installation of underground utilities.
Author Contributions
Conceptualization, S.L., J.K. (Jaemo Kang) and J.K. (Jinyoung Kim); investigation, S.L.; writing—original draft preparation, S.L. and M.K.; writing—review and editing, S.L. and W.B. All authors have read and agreed to the published version of the manuscript.
Funding
Research for this paper was carried out under the Korea Institute of Civil Engineering and Building Technology (KICT) Research Program (project no. 20250285-001 Development of infrastructure disaster prevention technology based on satellites SAR) funded by the Ministry of Science and ICT.
Institutional Review Board Statement
Not applicable.
Informed Consent Statement
Not applicable.
Data Availability Statement
The raw data supporting the conclusions of this article will be made available by the authors on request.
Conflicts of Interest
The authors declare no conflicts of interest.
References
- Kim, J.Y.; Kang, J.M.; Choi, C.H.; Park, D.H. Correlation analysis of sewer integrity and ground subsidence. J. Korean Geo-Environ. Soc. 2017, 18, 31–37. [Google Scholar]
- Mukunoki, T.; Otani, J.; Nonaka, S.; Horii, T.; Kuwano, R. Evaluation of cavity generation in soils subjected to sewerage defects using X-ray CT. In Proceedings of the 2nd International Workshop on X-Ray CT for Geomaterials, GeoX 2006, Aussois, France, 4–7 October 2006; pp. 365–371. [Google Scholar]
- Zisman, E.D. A standard method for sinkhole detection in the Tampa, Florida, area. Environ. Eng. Geosci. 2001, 7, 31–50. [Google Scholar] [CrossRef]
- Quiroga, C.; Anspach, J.; Scott, P.; Kraus, E. Feasibility of Mapping and Marking Underground Utilities by State Transportation Departments (Report No. FHWA-HIF-18-048); U.S. Department of Transportation Federal Highway Administration: Washington, DC, USA, 2018. [Google Scholar]
- Sato, M.; Uno, Y.; Ito, R. Conditions of the Cavity Formation and Sinkholes in the Practical Ground. In Proceedings of the 7th Asia and the Pacific Conference on Unsaturated Soils, Nagoya, Japan, 23–25 August 2019; Volume 7, pp. 493–500. [Google Scholar]
- Sato, M.; Uno, Y.; Ito, R. Evaluation method for determining potential risks of detected underground cavities by using soil properties. J. Jpn. Soc. Civ. Eng. E1 2022, 78, 70–85. [Google Scholar] [CrossRef]
- World Bank. A Brief Overview on the Road Safety Approach in Singapore; World Bank: Washington, DC, USA, 2019. [Google Scholar]
- Lee, S.M.; Yoon, H.M. A study for improvement of policy on ground subsidence prevention in urban areas. Seoul Stud. 2017, 18, 27–42. [Google Scholar]
- Giannini, L.M.; Younsi, S.; Burchini, B.; Deiana, R.; Giorgoi, C.; Paolo, C. Integrating geophysical methods. InSAR, and field observations to address geological hazards and buried archaeological features in urban landscapes. J. Appl. Geophys. 2025, 235, 105726. [Google Scholar] [CrossRef]
- Park, J.J.; Yoo, S.K.; Hong, K.K. Evaluation on Cavity Expansion under Pavement based on Groundwater Injection test. J. Korean Geosynthetics Soc. 2019, 18, 79–88. [Google Scholar]
- Lee, S.; Kang, J.; Kim, J. Prediction of Ground Subsidence Risk in Urban Centers Using Underground Characteristics Information. Appl. Sci. 2024, 14, 11044. [Google Scholar] [CrossRef]
- Kim, J.Y.; Lee, S.Y.; Choi, C.H.; Kang, J.M.; Kang, K.S.; Jeong, H.J.; Hong, J.C.; Lee, J.S.; Baek, W.J. Ground subsidence mechanism by ground water level and fine contents. J. Korean Soc. Agric. Eng. 2017, 59, 83–91. [Google Scholar]
- Kuwano, R.; Sato, M.; Sera, R. Study on the detection of underground cavity and ground loosening for the prevention of ground cave-in accident. Jpn. Geotech. J. 2010, 5, 219–229. [Google Scholar] [CrossRef][Green Version]
- Sato, M.; Kuwano, R. Influence of location of subsurface structures on development of underground cavities induced by internal erosion. Soils Found. 2015, 55, 829–840. [Google Scholar] [CrossRef]
- Kudai, K.; Sassa, S.; Yang, S.; Goto, S. Process of Cavity Formation and Collapse under Various Hydraulic Forces with Countermeasure to Internal Erosion. J. Jpn. Soc. Civ. Eng. 2019, 75, I937–I942. [Google Scholar] [CrossRef]
- Yang, S.; Sassa, S.; Kudai, K.; Murata, K.; Kobayashi, C. Prototype-scale experiment on the identification of time-varying development and collapse processes of a cavity under pavement at waterfront. Jpn. J. JSCE 2023, 79, 23-17132. [Google Scholar] [CrossRef]
- Watanabe, Y.; Unno, T.; Kamura, A. Variation of hydraulic conductivity in sandy soil due to undrained cyclic shear loading. JJSCE C 2021, 77, 386–391. [Google Scholar] [CrossRef]
- Karasaki, Y.; Kuwano, R. A study on the process of generation and expansion of subsurface cavities around the location of water leakage in sewer pipe joints. Jpn. Geotech. J. 2022, 17, 587–597. [Google Scholar] [CrossRef]
- Suzuki, H.; Tsuchida, T. Experimental study on generation mechanism of cavity and depression in the embankment by Masado soil. Proc. Jpn. Soc. Civ. Eng. Geotech. Div. Chugoku Branch 2019, 37, 161–168. [Google Scholar]
- Oh, G.; Kim, D.; Lee, D.; Kim, K.; Hong, S. Behavior of flexible pipes with the accelerated flowable backfill materials using surplus soil for underground power utilities. J. Korean Geo-Environ. Soc. 2009, 10, 33–41. [Google Scholar]
- Kim, J.C.; Yoo, B.S.; Kang, H.J.; Kim, S.H. A study on the development of special materials for liquidity improvement refill applicable to poor ground conditions in low temperature environment. J. Korean Soc. Disaster Sec. 2024, 17, 1–11. [Google Scholar]
- Mujtaba, H.; Farooq, K.; Sivakugan, N.; Das, B.M. Evaluation of relative density and friction angle based on SPT-N values. KSCE J. Civ. Eng. 2018, 22, 572–581. [Google Scholar] [CrossRef]
- Jeong, S.; Ko, J.; Song, S.; Kim, J. The behaviors of a Korean weathered soil under monotonic loadings. Geomech. Eng. 2024, 38, 157–164. [Google Scholar]
- Kim, J.; Choi, C.; Kang, J.; Baek, W.; Chung, M. Model test for the observation of cavity formation in sandy ground—With reference to ground water level and relative density. Jpn. Geotech. Soc. Spec. Publ. 2016, 4, 64–67. [Google Scholar] [CrossRef][Green Version]
- Kuwano, R.; Santa Spitia, L.F.; Bedja, M.; Otsubo, M. Change in mechanical behaviour of gap-graded soil subjected to internal erosion observed in triaxial compression and torsional shear. Geomech. Energy Environ. 2021, 27, 100197. [Google Scholar] [CrossRef]
- Hwang, B.Y.; Han, J.T.; Kim, J.K.; Kwak, T.Y. Liquefaction Characteristic of Pohang Sand Based on Cyclic Triaxial Test. J. Korean Geotech. Soc. 2020, 36, 21–32. [Google Scholar] [CrossRef]
- Lee, S.H.; Han, J.T.; Park, K.H.; Kim, J.K. Comparative Study on the Evaluation of Liquefaction Resistance Ratio According to the Application of the Korean Standard for Cyclic Triaxial Strength Test. J. Korean Geotech. Soc. 2022, 38, 35–44. [Google Scholar] [CrossRef]
- Elkholy, M.; Sharif, Y.A.; Chaudhry, M.H.; Imran, J. Effect of soil composition on piping erosion of earthen levees. J. Hydraul. Res. 2015, 53, 478–487. [Google Scholar] [CrossRef]
- Asuero, A.G.; Sayago, A.; González, A.G. The correlation coefficient: An overview. Crit. Rev. Anal. Chem. 2006, 36, 41–59. [Google Scholar] [CrossRef]
- Xu, H.; Deng, Y. Dependent evidence combination based on shearman coefficient and Pearson coefficient. IEEE Access 2018, 6, 11634–11640. [Google Scholar] [CrossRef]
- Wählby, U.; Jonsson, E.N.; Karlsson, M.O. Comparison of stepwise covariate model building strategies in population pharmacokinetic-pharmacodynamic analysis. AAPS PharmSciTech 2002, 2002, 68–79. [Google Scholar] [CrossRef]
- Kwak, T.Y.; Woo, S.I.; Kim, J.; Chung, C.-K. Model test assessment of the generation of underground cavities and ground cave-ins by damaged sewer pipes. Soils Found. 2019, 59, 586–600. [Google Scholar] [CrossRef]
- Ghazian-Arabi, M.G.; Khosravi, M.; Farhadzadeh, A. Effects of fines content and relative density on erosion and recession of predominantly sandy beach-bluff system. J. Waterw. Port Coast. Ocean Eng. 2021, 147, 04020050. [Google Scholar] [CrossRef]
- Li, S.; Russell, A.R.; Muir Wood, D.M. Internal erosion of a gap-graded soil and influences on the critical state. Acta Geotech. 2024, 19, 5363–5381. [Google Scholar] [CrossRef]
- Deng, Z.; Huang, D.; He, Q.; Chassagne, C. Review of the action of organic matter on mineral sediment flocculation. Front. Earth Sci. 2022, 10, 965919. [Google Scholar] [CrossRef]
Disclaimer/Publisher’s Note: The statements, opinions and data contained in all publications are solely those of the individual author(s) and contributor(s) and not of MDPI and/or the editor(s). MDPI and/or the editor(s) disclaim responsibility for any injury to people or property resulting from any ideas, methods, instructions or products referred to in the content. |
© 2025 by the authors. Licensee MDPI, Basel, Switzerland. This article is an open access article distributed under the terms and conditions of the Creative Commons Attribution (CC BY) license (https://creativecommons.org/licenses/by/4.0/).