Article

Evolution Process of Toppling Deformations in Interbedded Anti-Inclined Rock Slopes

1
School of Geological Engineering and Geomatics, Chang’an University, Xi’an 710054, China
2
Academy of Yellow River Sciences of Shaanxi Province, Chang’an University, Xi’an 710054, China
3
Key Laboratory of Ecological Geology and Disaster Prevention, Ministry of Natural Resources, Xi’an 710054, China
4
School of Water and Environment, Chang’an University, Xi’an 710054, China
5
School of Geosciences, Yangtze University, Wuhan 430100, China
6
School of Engineering, RMIT University, Melbourne 3001, Australia
*
Author to whom correspondence should be addressed.
Appl. Sci. 2025, 15(14), 7727; https://doi.org/10.3390/app15147727
Submission received: 21 May 2025 / Revised: 6 July 2025 / Accepted: 8 July 2025 / Published: 10 July 2025

Abstract

Rock slopes exhibiting anti-inclined interbedded strata have widespread distribution and complex deformation mechanisms. In this study, we used a physical model test with basal friction to replicate the evolution process of the slope deformation. Digital Image Correlation (DIC) and Particle Image Velocimetry (PIV) methods were used to capture the variation in slope velocity and displacement fields. The results show that the slope deformation is conducted by bending of soft rock layers and accumulated overturning of hard blocks along numerous cross joints. As the faces of the rock columns come back into contact, the motion of the slope can progressively stabilize. Destruction of the toe blocks triggers the formation of the landslides within the toppling zone. The toppling fracture zones form by tracing tensile fractures within soft rocks and cross joints within hard rocks, ultimately transforming into a failure surface which is located above the hinge surface of the toppling motion. The evolution of the slope deformation mainly undergoes four stages: the initial shearing, the free rotation, the creep, and the progressive failure stages.

1. Introduction

Toppling is most commonly observed in anti-inclined rock slopes, as recognized by the tilting or rotating of layers or rock columns (blocks) under gravity within the slope [1]. Anti-inclined rock slopes are typically considered stable. However, with the development of human engineering activities, toppling deformations have become prevalent in these slopes during the construction of hydropower, railways, highways, mines, and other projects, such as the excavation slope in Brilliant, USA [2]; the Glowlish Cliff slopes in the UK [3]; and the bank slopes at the dam site of hydropower stations in southwest China [4,5,6]. Once the slope toppling has occurred, it may transform into a large-scale landslide without any effective treatment measures, such as the La Clapiére landslide and the Billan landslide in France [7,8], the Moosfluh landslide in Switzerland [9], the Gendakan landslide, Zhenggang landslide, and the K73 landslide in the upper reaches of the Lancang River, southwest China [10,11,12]. Therefore, it is of significant importance to investigate the mechanisms by which toppling deformation within the anti-inclined rock slopes can occur.
Physical model tests have been used to investigate the mechanics of slope deformation. The kinetic process and detailed failure features can be directly observed during the tests. The slope failure mechanism can be comprehensively investigated through the analysis of multi-field monitoring data [13,14]. Therefore, this method has become an effective tool in the slope research [15]. Based on different experimental principles, common model test methods include the tilt table, fix frame, centrifuge, and base friction. Both the tilt table and fix frame model tests are conducted under the effect of gravity. The tilt table model test simulates the failure process of slopes by increasing the tilt angle of the base plate of the model frame. For example, some scholars investigated the toppling in multiple individual rock columns with cross joints or rounded edges through tilt table model tests [16,17,18,19]. On the other hand, the fixed frame model test is employed to simulate the instability process of large-scale slope models. Zhu et al. [20] conducted fix frame model tests to research the mechanisms controlling an anti-inclined rock slope in an open-pit mine during excavation. They found that the slope failure process contains four stages. The stages include the initial compression, crack generation, followed by crack propagation, and formation of the sliding surface stage. Zheng et al. [21] and Ding et al. [22] analyzed the mechanisms of flexural toppling in layered rock slopes and proposed a related slope stability assessment method grounded in the theory of limit equilibrium. The tilt table and fix frame model tests aim to replicate the failure process of a scaled-down slope model under gravity by means of the similarity theory. However, due to the high requirements for the strength of similar materials and the inherent uncontrollability of the failure process, this method has not been widely adopted.
Centrifuge model tests simulate the self-weight stress experienced by slope rock masses through centrifugal force. By adjusting the rotational speed of the centrifuge, it is possible to simulate various multiples of the gravitational field. Therefore, this test allows for the accurate recreation of the actual stress field experienced by slopes at a reduced scale [14]. Adhikary et al. [23,24,25] used centrifuge model tests to investigate the failure patterns of anti-inclined slope models made of different materials. They pointed out that the slope is likely to cause instantaneous failure with a higher joint friction angle, while a lower friction angle may cause a progressive failure. Pant et al. [26] studied the failure process of anti-inclined rock slopes with non-uniform joint spacing through centrifuge model tests. However, due to the high cost associated with centrifuge model tests, this method is challenging to be widely adopted.
The base friction principle permits the replacement of gravity in the plane of a two-dimensional slope model by drag forces acting along its base. These forces are generally applied by drawing a belt under the stationary model [27]. Therefore, the failure process of the slope model can be directly observed from above the model. Due to its cost-effectiveness, intuitive process and convenient operation, base friction model tests have been employed in the research of a range of rock slopes. For example, Aydan et al. [28] and Wong and Chiu [29] utilized base friction model tests to explore the failure process of rock slopes with two dominant sets of joints, defining the conditions under which blocks undergo toppling or sliding. Aydan and Kawamoto [30] investigated the mechanisms of flexural toppling failures in the slope and underground opening through base friction model tests. Adachi et al. [31] conducted base friction model tests to explore the instability mode of the highway slope in Japan. These experiments indicated that the slope failure is defined by toppling, which was triggered by rainfall and subsequent degradation of rock mass strength. Tu et al. [32] studied the evolution process of an anti-inclined rock slope with progressive river incision through use of physical models with base friction and use of numerical simulations. With the wide application of non-contact measurement technologies during the experiment process, the limitations of the base friction model tests in lacking quantitative monitoring data have been overcome, significantly enhancing the depth of exploration of experimental results [33,34,35].
In general, research on the mechanism of slope toppling deformations through physical model tests has yielded a rich harvest. However, current research efforts primarily focus on single lithology slopes. Indeed, the interbedded structure of soft and hard rock is commonly found in anti-inclined rock slopes [3,36]. In Western China, approximately 63.3% of slope toppling deformations exhibit a structure characterized by alternating soft and hard rock layers [37]. Since rock slopes with interbedded strata can combine the features of both hard and soft rocks, the deformation and failure mechanisms of such slopes are more complex than those of single lithology slopes. Therefore, the evolution process of anti-inclined rock slopes with alternate soft and hard rock layers remains a topic in the field of engineering geology that urgently requires further in-depth research.
Due to the rapid advancement of hydropower projects on rivers in Southwest China, a large number of toppling deformations have been identified along valleys, featuring alternating soft and hard rock layers. Some of these toppling deformations have evolved into landslides, such as the Mari landslide [38], Jiaxi landslide [39], Zhenggang landslide [11,40], Gendakan landslide [10], and Mala landslide [41,42]. Due to their unique interbedded anti-inclined slope structure, these landslides have complex failure mechanisms, large development scales and extremely long formation periods, which pose hazards to the construction of hydropower projects. The toppling evolution mechanism of interbedded anti-inclined rock slopes has become crucial for accurately assessing the stability of the slopes. Therefore, we utilized a typical anti-inclined rock slope with an interbedded structure as a prototype and conducted a base friction model test to study the slope evolutionary process. The DIC and PIV techniques were employed to capture the variations of slope deformation and velocity fields at different evolution stages. The aim of this study was to reveal the evolution process and instability mechanism of such slopes. The findings hold significant application and reference value for the evaluation of stability and treatment design of similar slope problems.

2. Materials and Methods

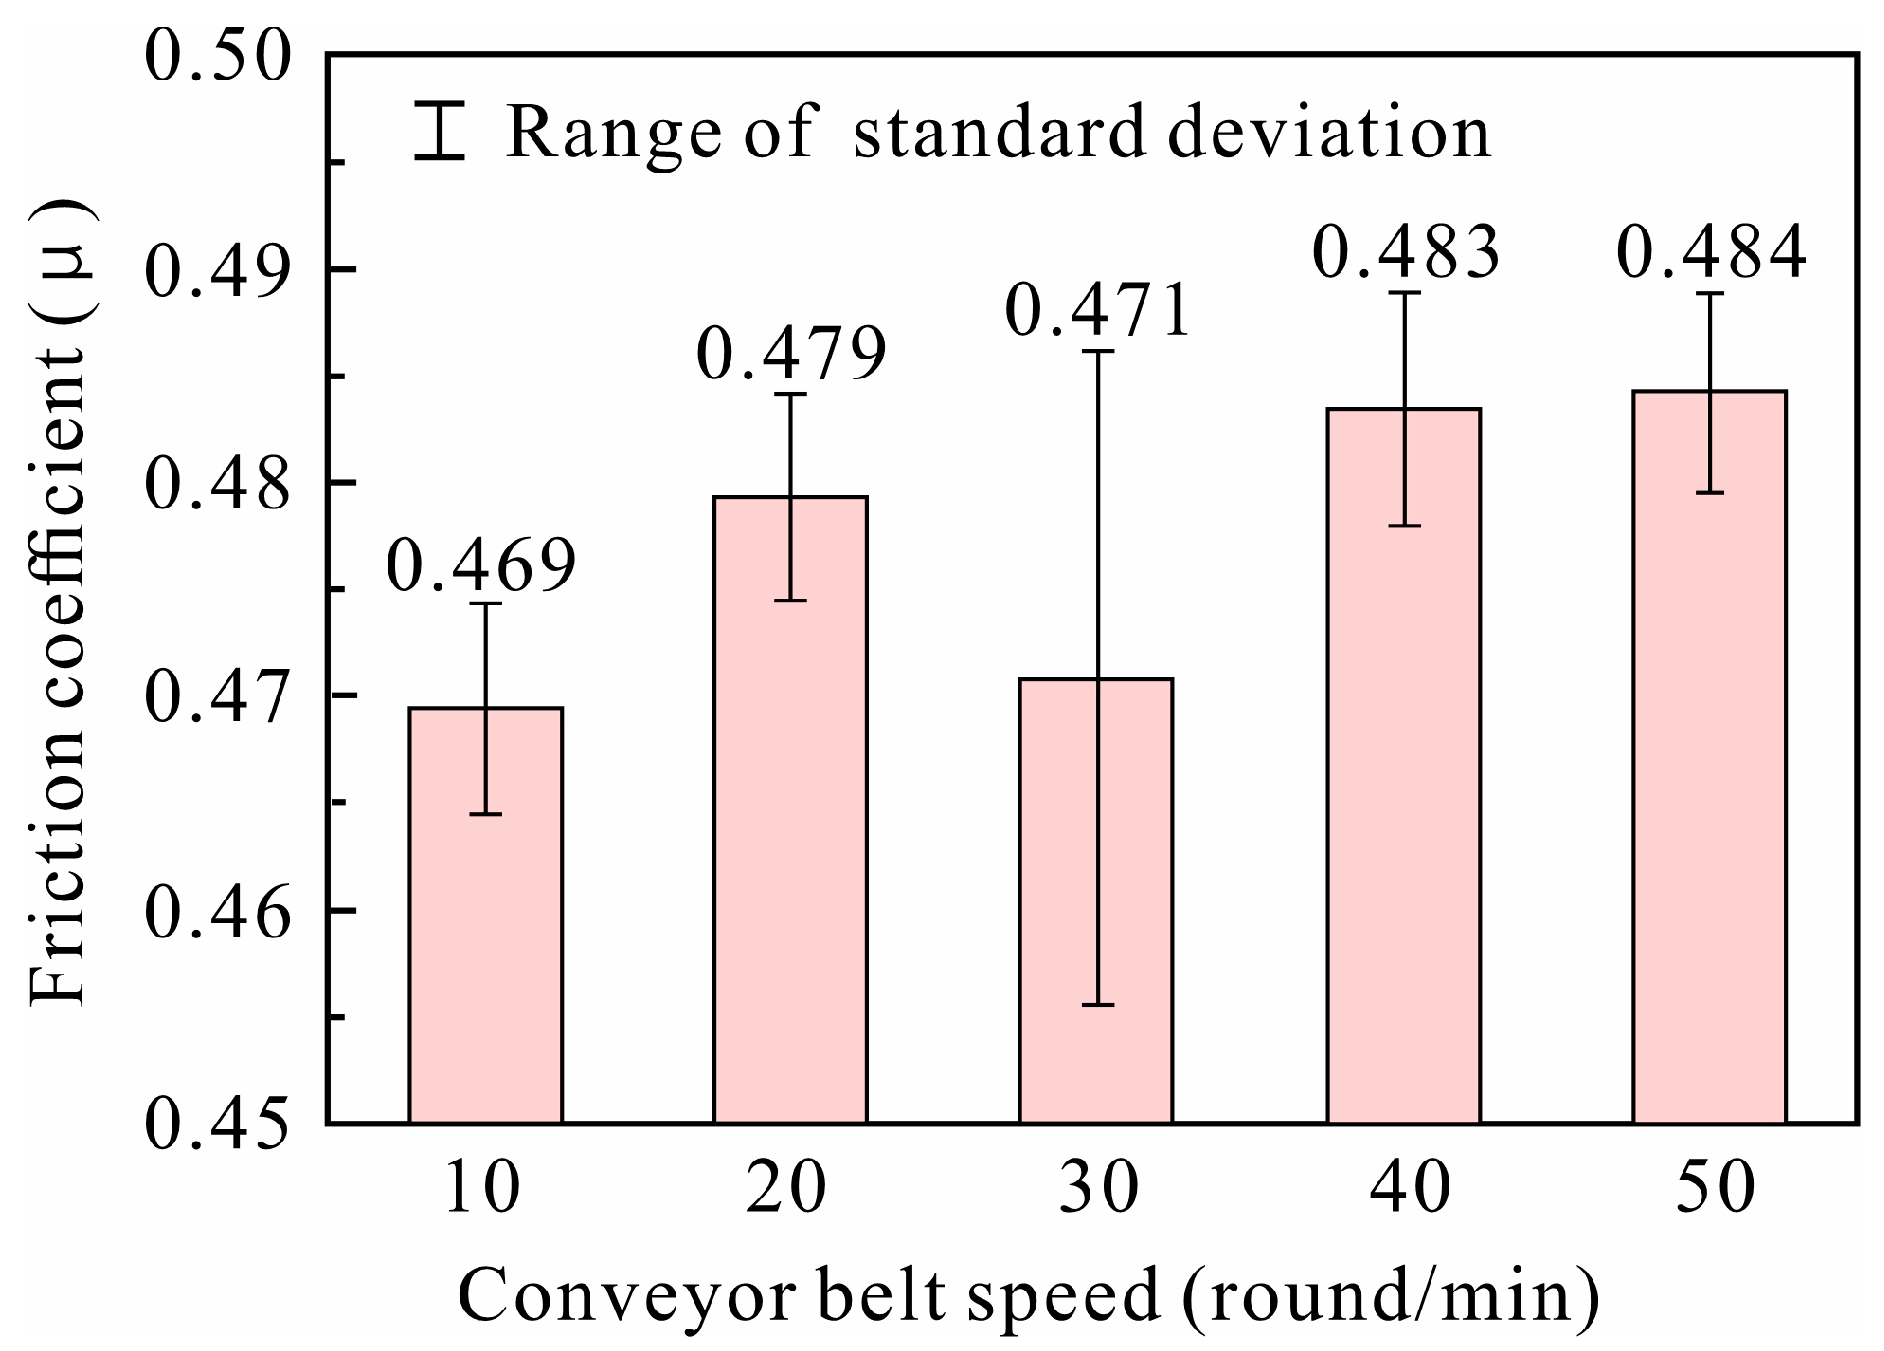
2.1. Model Test Theory

The principle of basal friction is extensively employed for replicating the gravitational effects in two-dimensional physical models. The effect of gravity is replaced by the drag of a belt moving underneath the model [27]. In base friction model tests, the model is placed on a horizontal conveyor belt and fixed by a frame above the belt, aligning the orientation of gravity with the operation direction of the conveyor belt. After the belt is activated, the base of the model experiences a uniform frictional force F generated by the drag of the conveyor belt, which can be calculated by:
F = μ γ m t ,      
where μ is the coefficient of dynamic friction between the model and the belt, γ m is the unit weight of the material used in the model, and t is the thickness of the model.
According to the Saint-Venant principle, when the model is sufficiently thin, the frictional force acting on the bottom of the model can be considered uniformly distributed over the entire thickness, which can simulate the state of an actual slope under the influence of self-weight [32,33,34,35]. Furthermore, the model slope and the prototype must satisfy relevant similarity requirements in geometry, unit weight, stress and internal friction angle [43,44,45]:
C L = L p L m ,   C γ = γ p γ m ,   C σ = σ p σ m ,   C φ = φ p φ m ,
where C is the similarity coefficient, L , γ , σ , and φ are the geometric size, unit weight, stress, and friction angle, respectively. The subscripts p and m stand for prototype and model, respectively. The similarity coefficient can be further determined by:
C σ = 1 μ C γ C L ,   C φ = 1

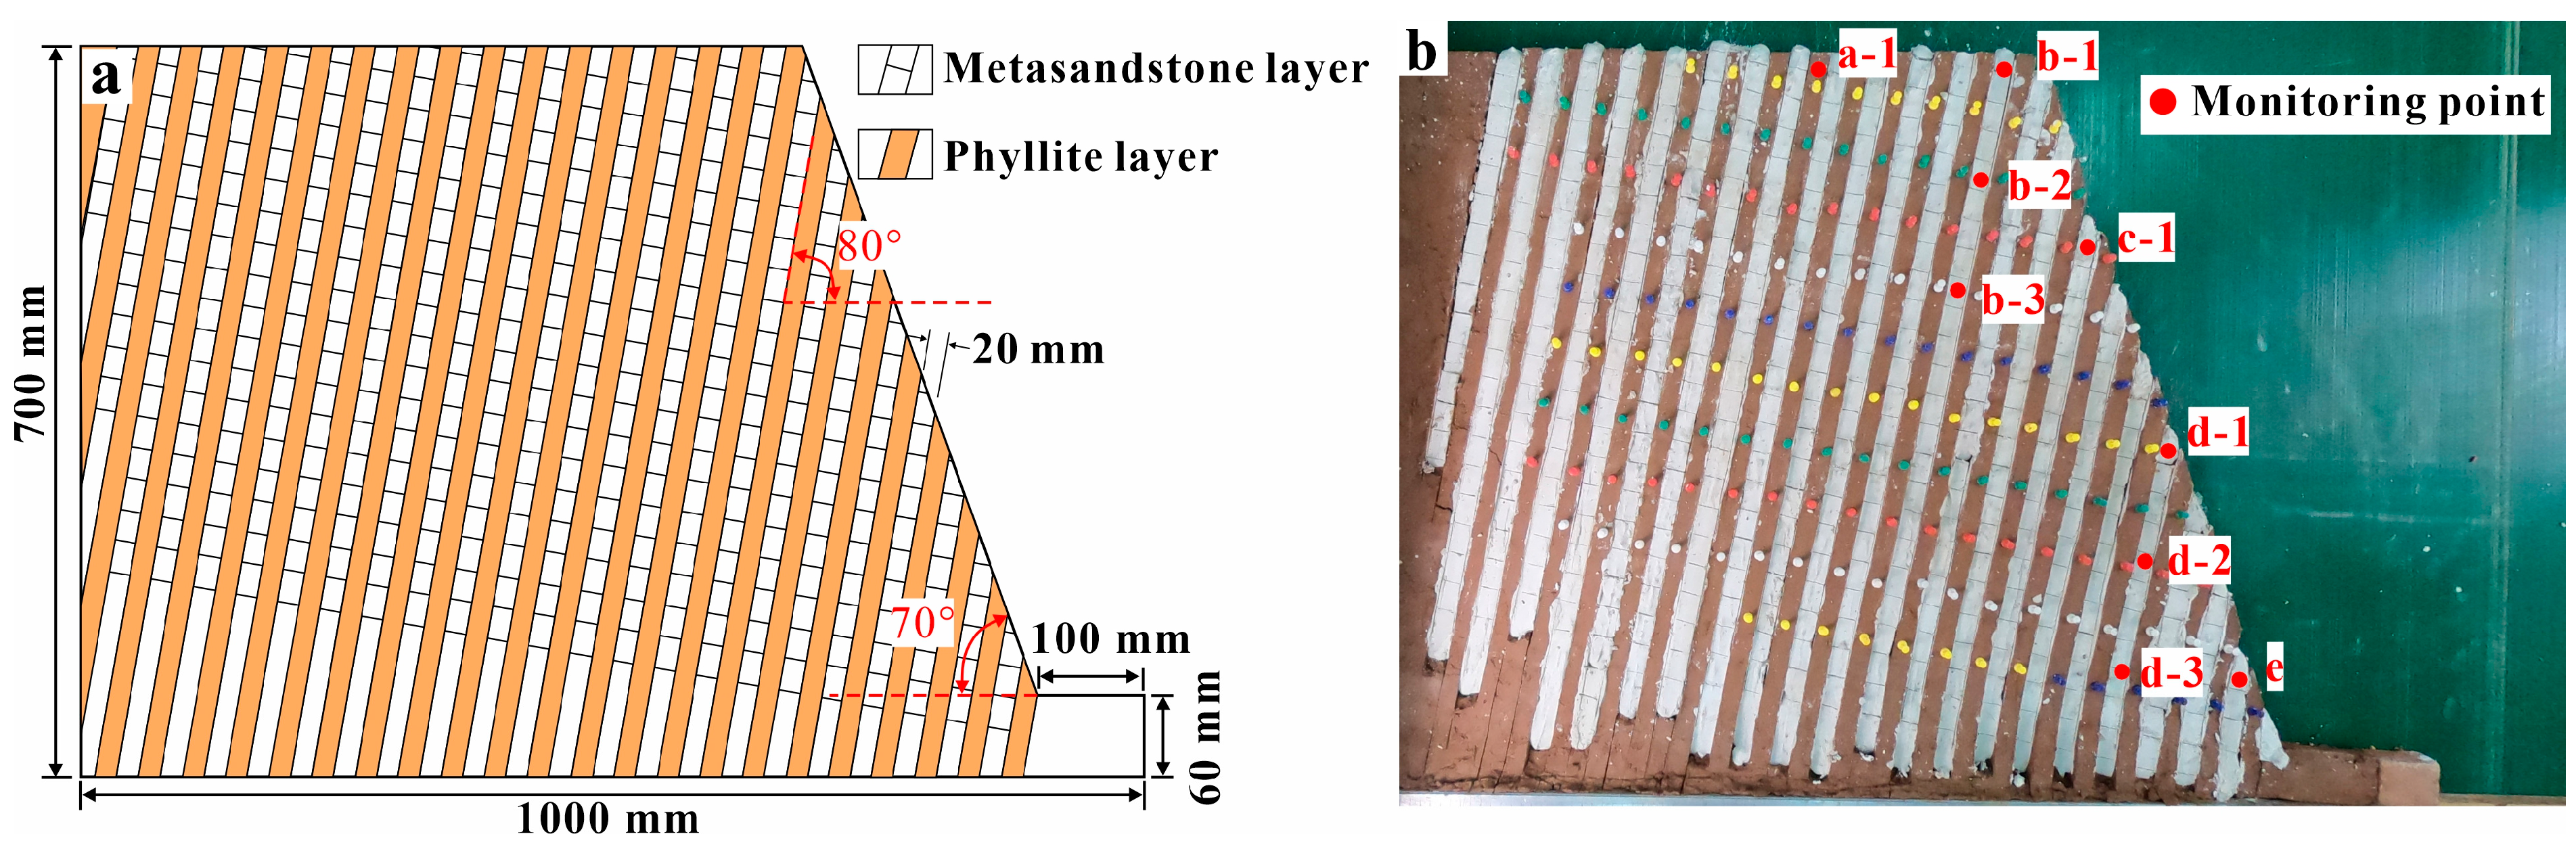
2.2. Model Configuration

This physical model test was conducted using a self-developed automated base friction test apparatus (Figure 1). Place the two-dimensional slope model horizontally on the conveyor belt. Constrained by a fixed model frame, the slope model does not move horizontally with the conveyor belt. As shown in Figure 1a,b, when the conveyor belt moves from right to left, the sliding friction between the conveyor belt and the model can effectively replace the gravity force acting on the two-dimensional slope model. As shown in Figure 1b, the slope surface is free within the horizontal plane to simulate the movement of the slope when under the effect of gravity. The base of the slope model is set as fixed boundaries to prevent overall movement and ensure a stable application of frictional forces on the model base surface when the conveyor belt is operating. The lateral sides of the model are each designed as free in the movement direction of the conveyor belt. The test process can be recorded through a Gopro camera located above the slope model.
The speed of the conveyor belt can be adjusted from 0 to 50 r/min. Before the formal test, we used a dynamometer to measure the value of μ at different speeds. It can be seen that at 50 r/min, the dynamic friction coefficient reached its maximum value ( μ = 0.484), with the lowest data dispersion (Figure 2). To ensure the stability of the test process, the speed of the conveyor belt was set to 50 r/min for this test.
According to the dimensions of the model frame of the test apparatus and the actual dimensions of the typical interbedded rock slopes located in the upper Yalong River of southwest China [38], the value of C L is determined to be 1000. The value of C φ and C γ are both determined to be 1. According to Equation (3), it can be derived that C σ = 2066 . The field study shows that the interbedded rock slopes located in the study area are primarily composed of phyllite and metasandstone [38]. The parameters of intact rocks and discontinuities were determined via uniaxial compression tests, Brazilian tests and direct shear tests conducted in the laboratory. The mean values of the test results are presented in Table 1 and Table 2. The similar materials of metasandstone and phyllite were made by mixing iron powder, quartz sand, barite powder, clay, and gypsum [43]. The configuration scheme of two similar materials was obtained by trial and error to meet the requirements of the similarity conditions as closely as possible. A summary of the physical and mechanical properties for the optimal similar materials is presented in Table 1 and Table 2.
It can be seen that there exists a certain difference between the parameters of the similar materials and the target values (Table 1 and Table 2). On the one hand, for scaled-down models, it is almost impossible to obtain rock similarity materials where all parameters perfectly meet the target value in previous studies [20,32,33,34,35]. On the other hand, this study aims to replicate the deformation and failure process of interbedded anti-inclined rock slopes under long-term gravitational effects. There is no specific prototype slope, and the configuration of similar materials focuses on reflecting the differences in deformation and strength characteristics between hard rock and soft rock. The results of laboratory tests are only used as a reference for the configuration of similar materials. Therefore, a certain deviation between similar materials and target values is acceptable in this study.
The model test aims to replicate the evolutionary process of an interbedded anti-inclined rock slope. Therefore, we consider a generalized model (Figure 3). The slope measures 70 cm in height, 100 cm in width, and 1 cm in thickness. The slope angle is 70°, and the dip angle of rock layers is 80°. Assuming that the soft and hard rock layers are of equal thickness, the designed thickness for each rock layer is 2 cm. Apart from rock layers, we also considered a set of joints that are roughly parallel to the layer strike but dip out of the slope. Since these joints are approximately perpendicular to the rock layer on the cross section of the slope, they were often referred to as cross joints in previous studies [1,5,12,38,39]. In addition, the trace lengths of the cross joint are often limited by the thickness of hard rock columns. Field investigation results indicate that the average spacing of the cross joints exceeds the thickness of the metasandstone layer somewhat. Therefore, the spacing between the cross joints is set at 3 cm in the model.

2.3. Model Establishment and Test Process
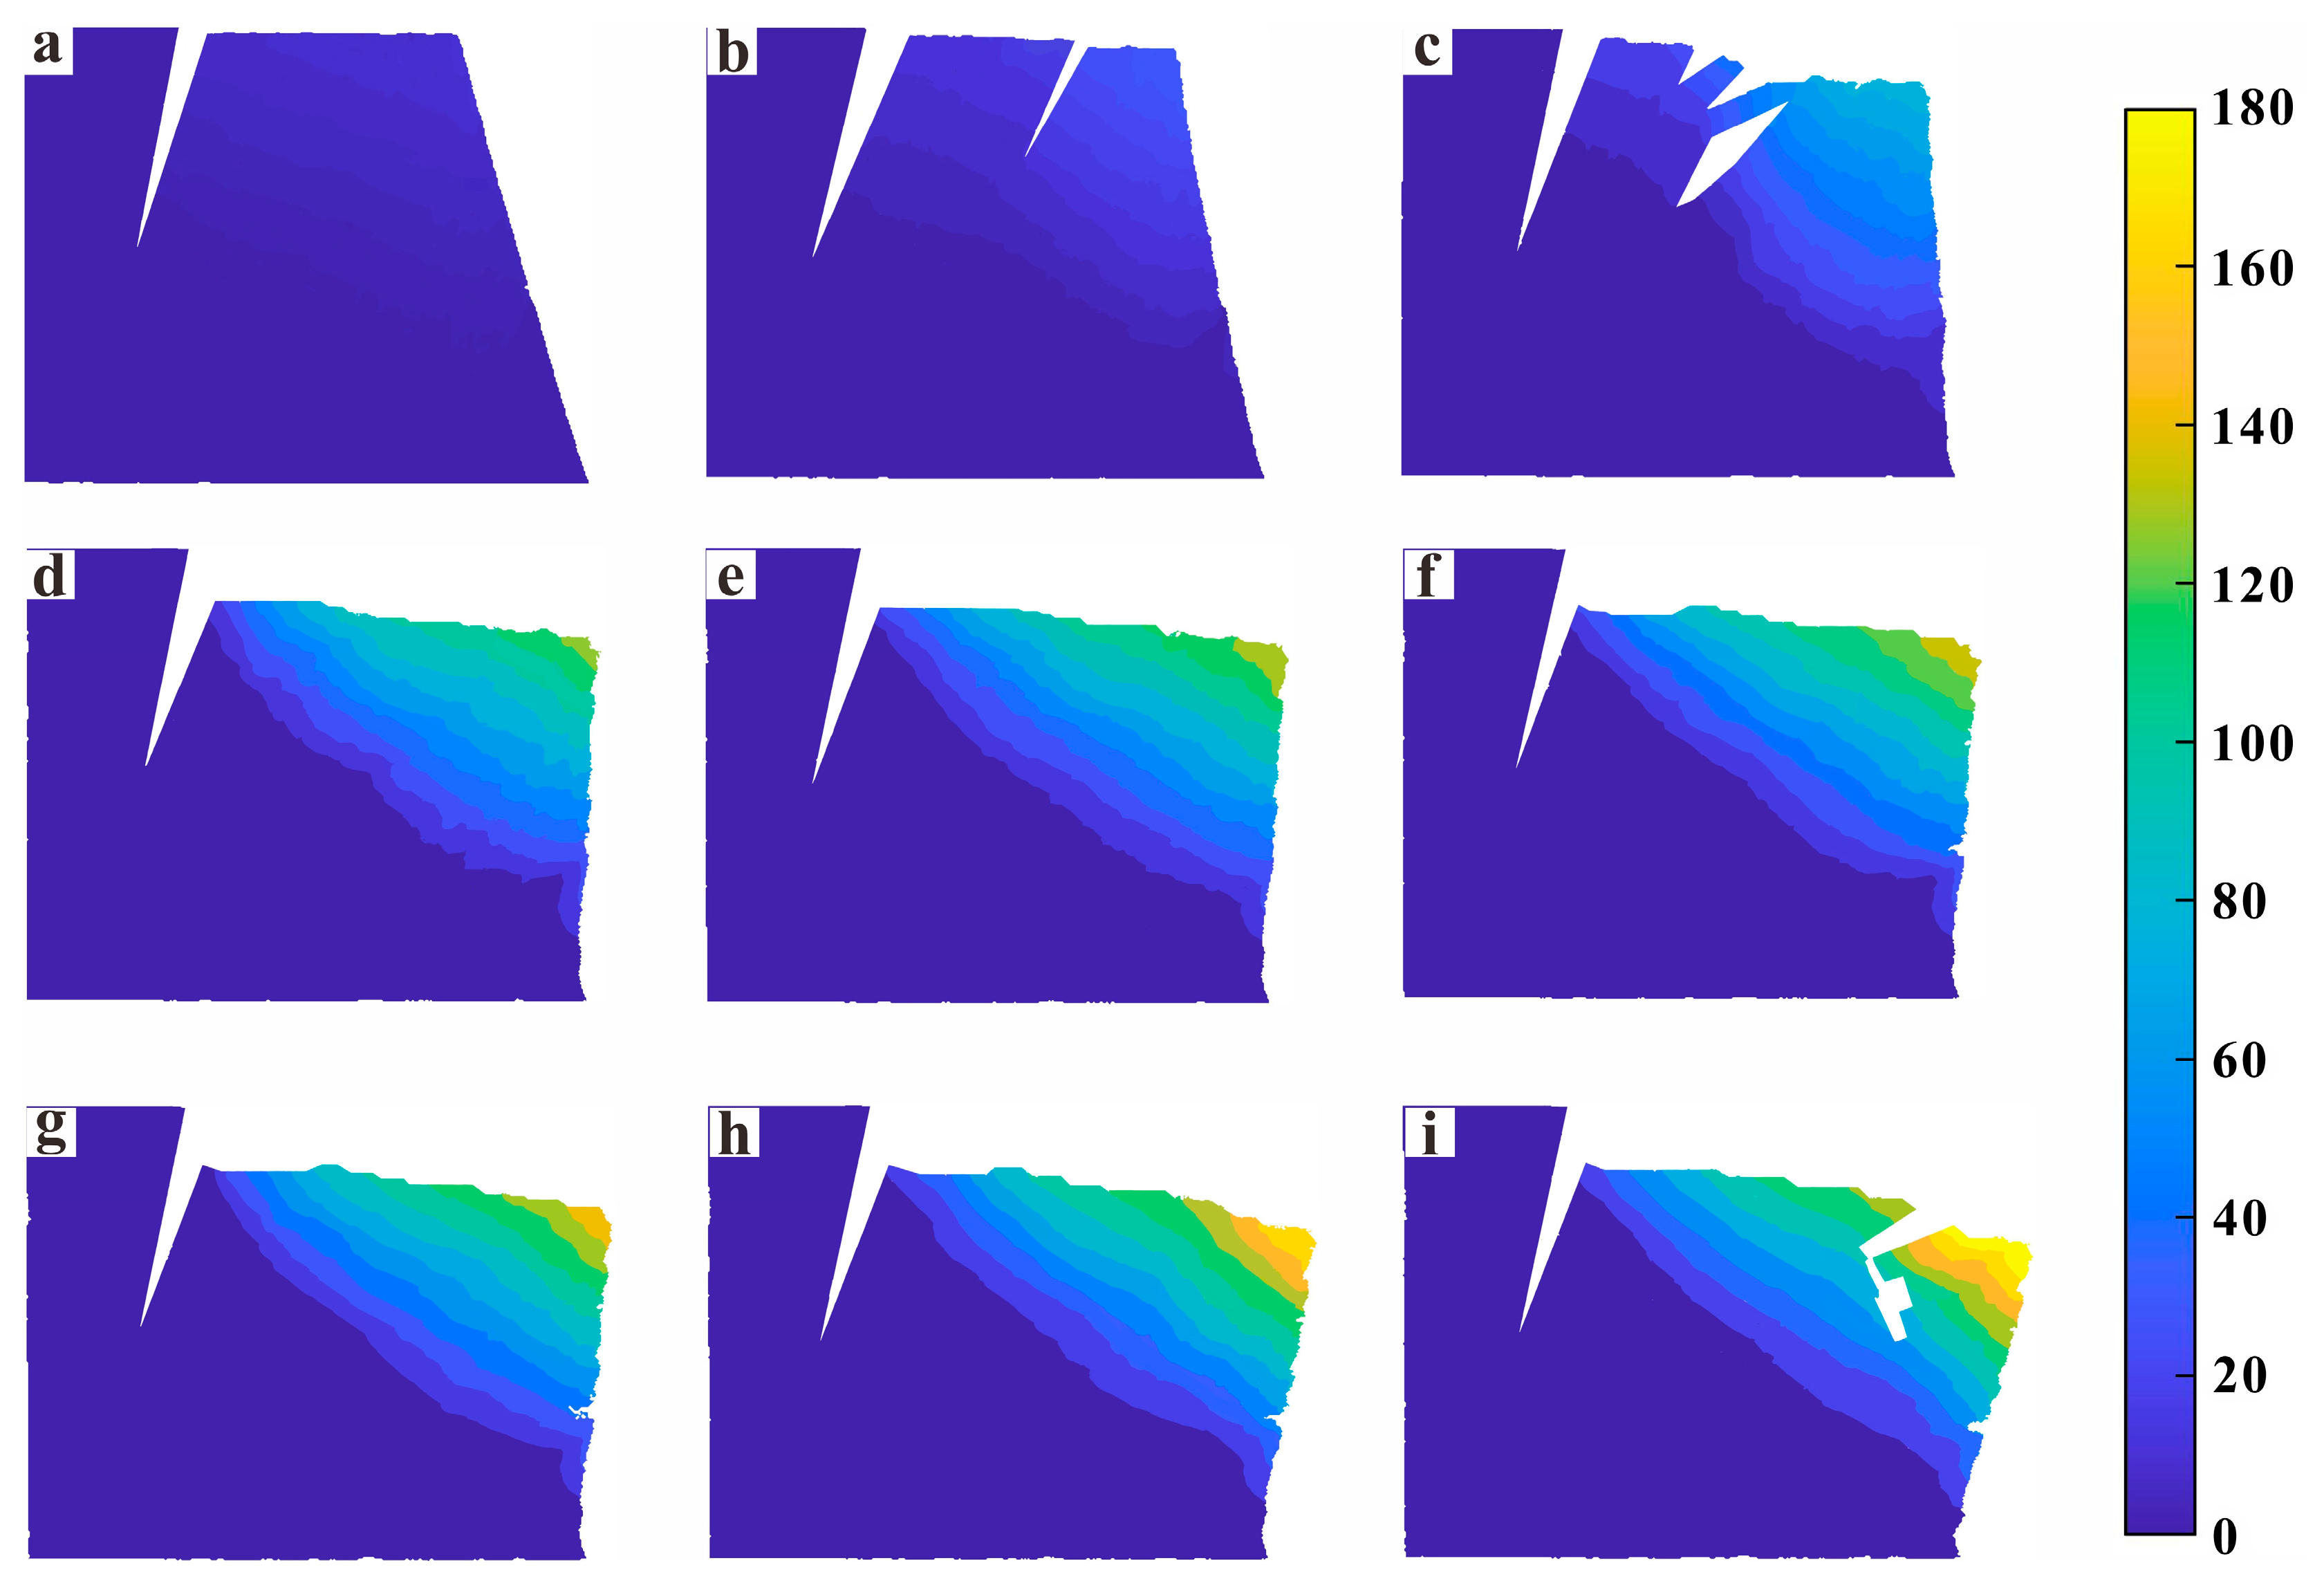
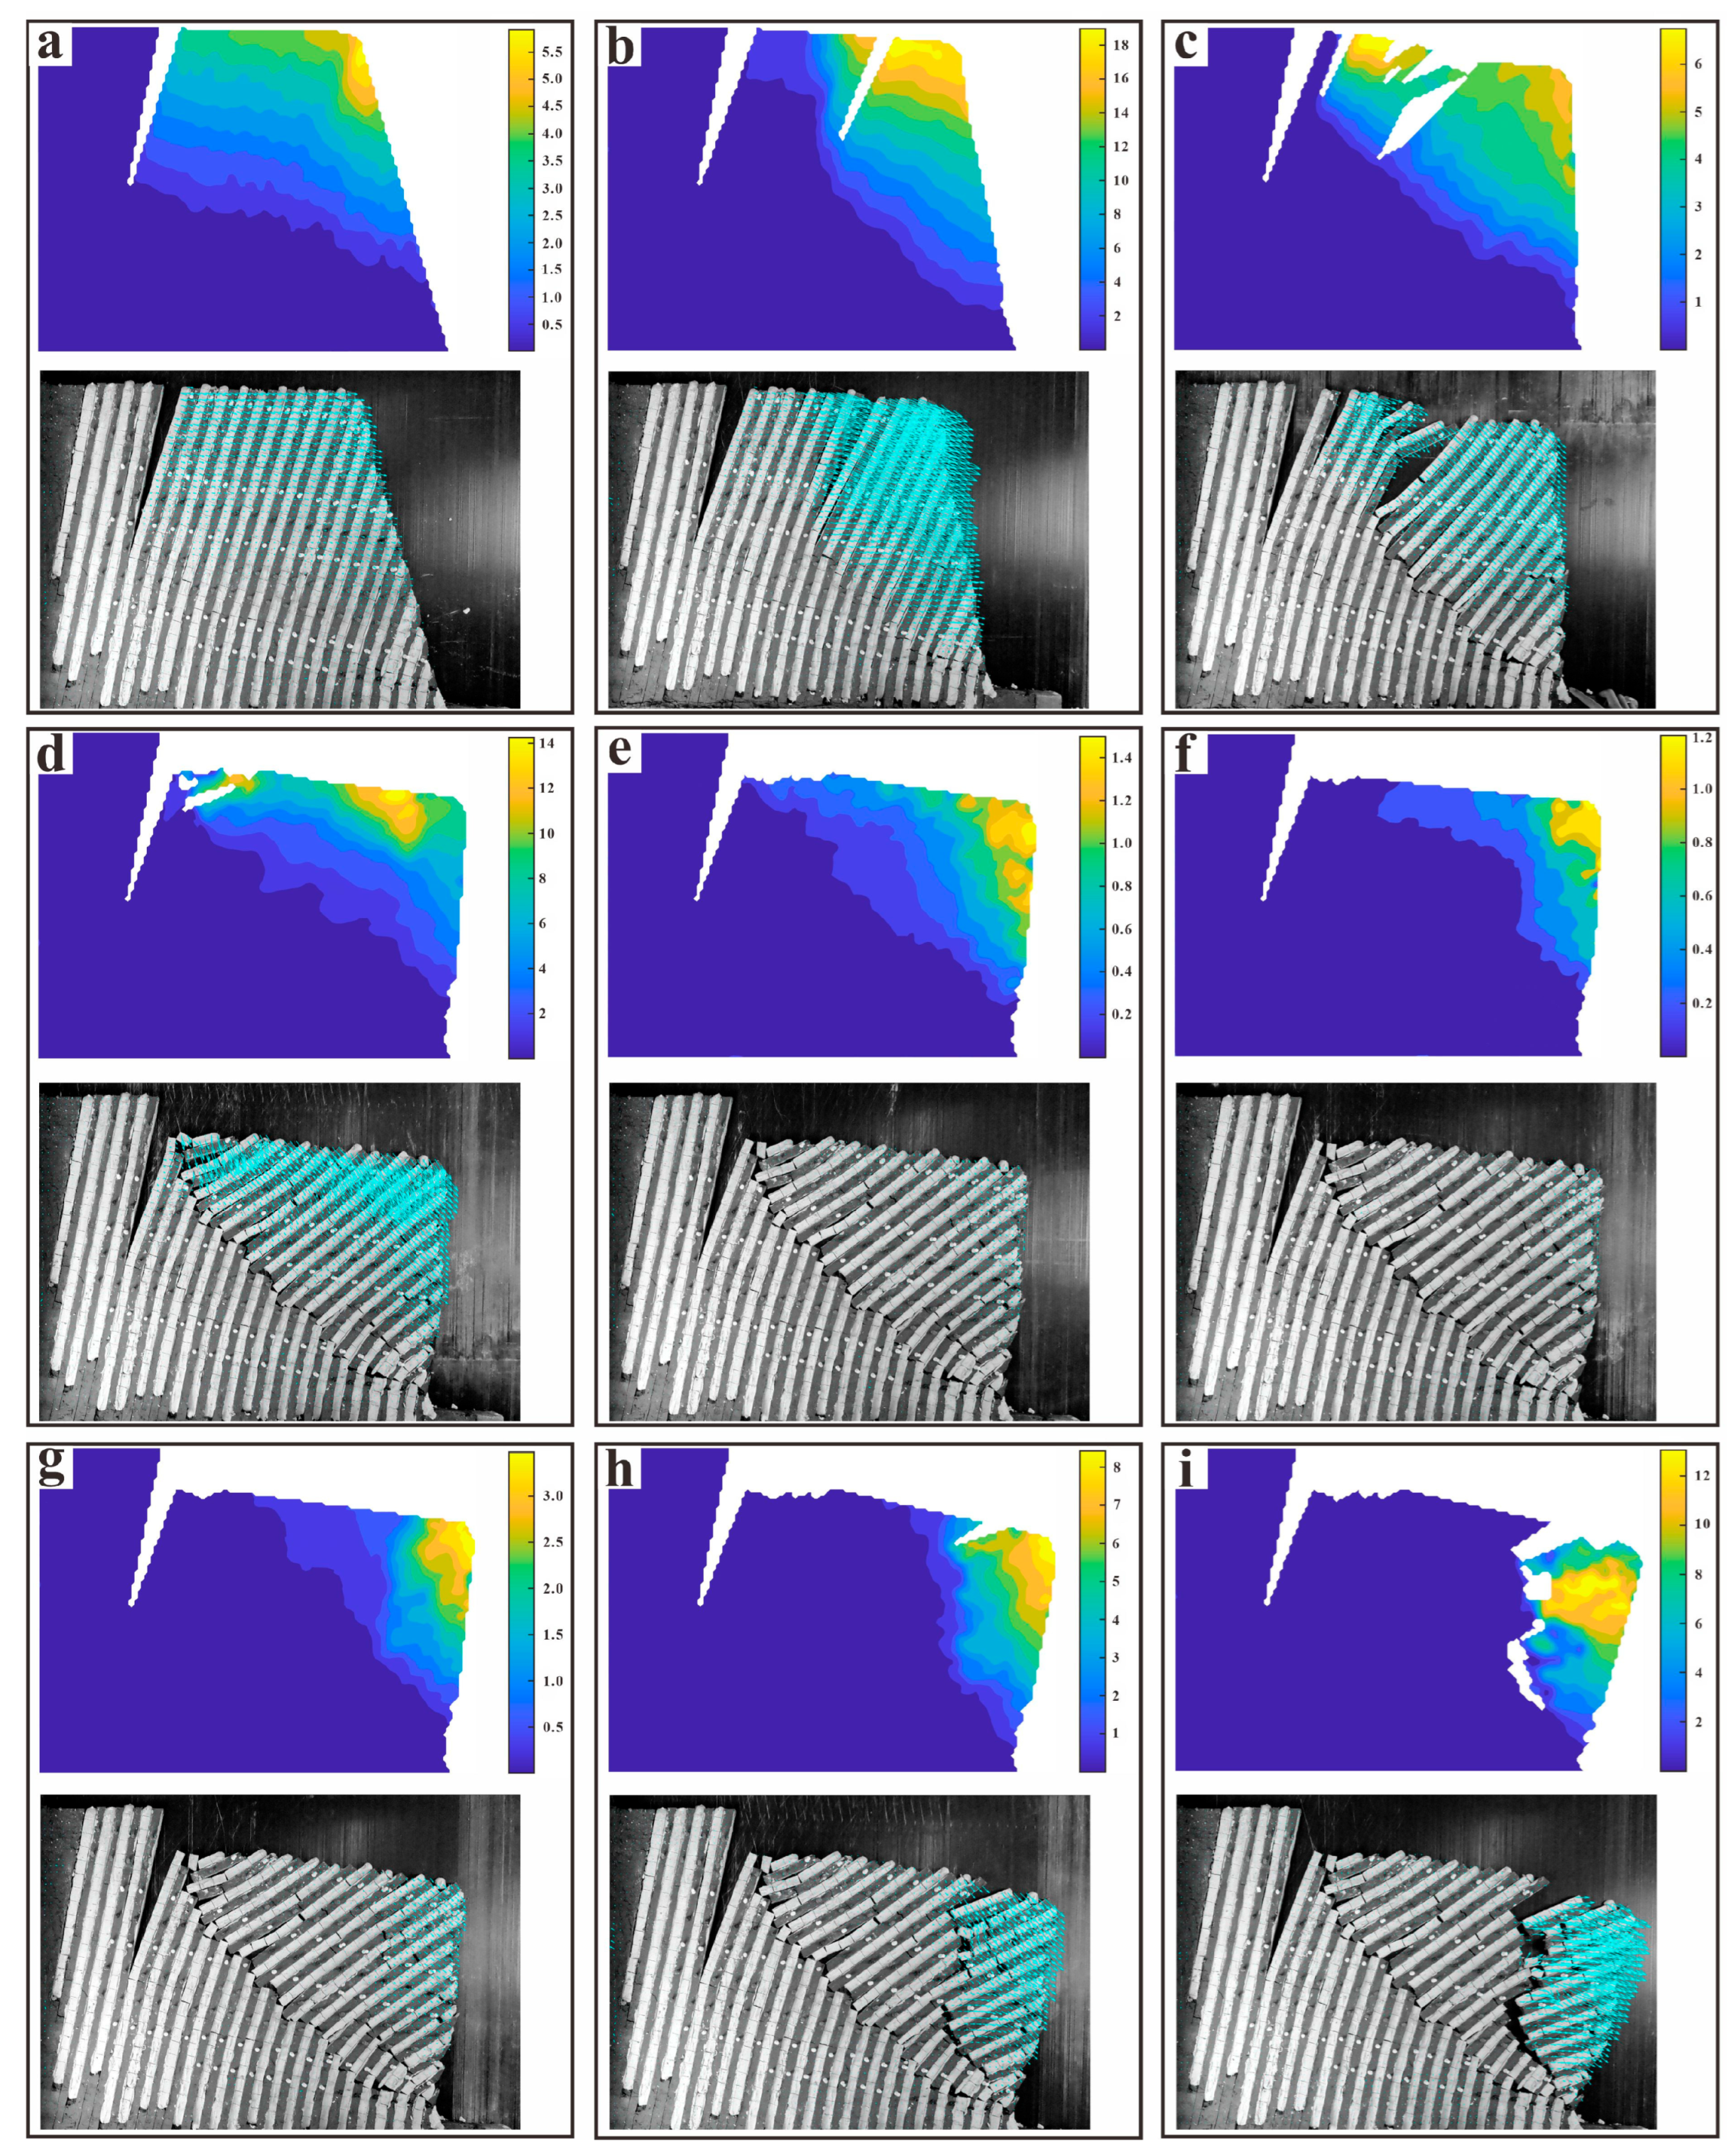
Spread the similar material of metasandstone evenly within the model frame of the base friction test apparatus, and compact it using a rubber mallet. Prior to the complete solidification of the material, use a knife to cut out the overall contour of the slope, rock layers, and the cross joints within the individual metasandstone column. After the material of metasandstone has solidified, remove the metasandstone columns at intervals and fill the material of phyllite into the evacuated spaces. Upon solidification of the phyllite material, the preparation of the interbedded slope model is complete.
Considering that PIV and DIC analysis results are extremely sensitive to lighting, model texture, and image resolution. Therefore, we used constant-power fill light to illuminate the model, ensuring consistent brightness throughout the test process (Figure 1c). On the other hand, the test process was recorded using videos with a resolution of 1920 × 1080 px to ensure the reliability of the analysis results. In addition, numerous circular labels with colors were affixed to the model’s surface to distinctively mark the point cloud pixels, thereby validating the measurement system by visualizing areas exhibiting varied grey scale distributions (Figure 3b).
Upon completion of the model preparation, circular labels of different colors are placed along the rock column at intervals of 6 cm. These labels serve as positioning displacement tracking points to highlight the color difference. Mount the GoPro camera on a tripod above the model and connect it to the mobile app via Bluetooth. Turn on the fill light, adjust and secure the camera position according to the image on the phone screen, and then turn on the camera’s video recording function. The following step of the tests is as follows.
Initiate the conveyor belt and set its speed to 1 r/min to eliminate the adhesion between the conveyor belt and the basal face of the model and pre-compress the model. Subsequently, gradually increase the speed of the conveyor belt and maintain it at 50 r/min. Sliding friction is generated between the model and the belt. The deformation of the slope begins to occur, and the fractures gradually form and develop within the model. The test is terminated when the model is completely destroyed. Import the recorded video of the test process into the Adobe Premiere Pro CC 2019 software, select the images frame by frame, and sequentially export the images depicting the critical phases of slope evolution over time. Import these images into external tools such as Ncorr and PIVlab in MATLAB 2021a to capture the displacement and velocity fields of the slope model at various time intervals. Note that the time-scaling factor (prototype model time ratio) exhibits significant differences in base friction modeling [35]. The deformation of the prototype slope in the study area began during the late Pleistocene, so determining the time-scaling factor for the base friction model test is meaningless [5,34,37]. In this model test, the time represents the sequence of rock mass movement during the tests. Therefore, establishing a direct correspondence between the deformation rates of the slope model and the prototype is challenging. However, the variation characteristics of the slope deformation rate over time can help understand the slope failure mechanisms and identify the evolutionary stage of the slope toppling [12].

3. Results

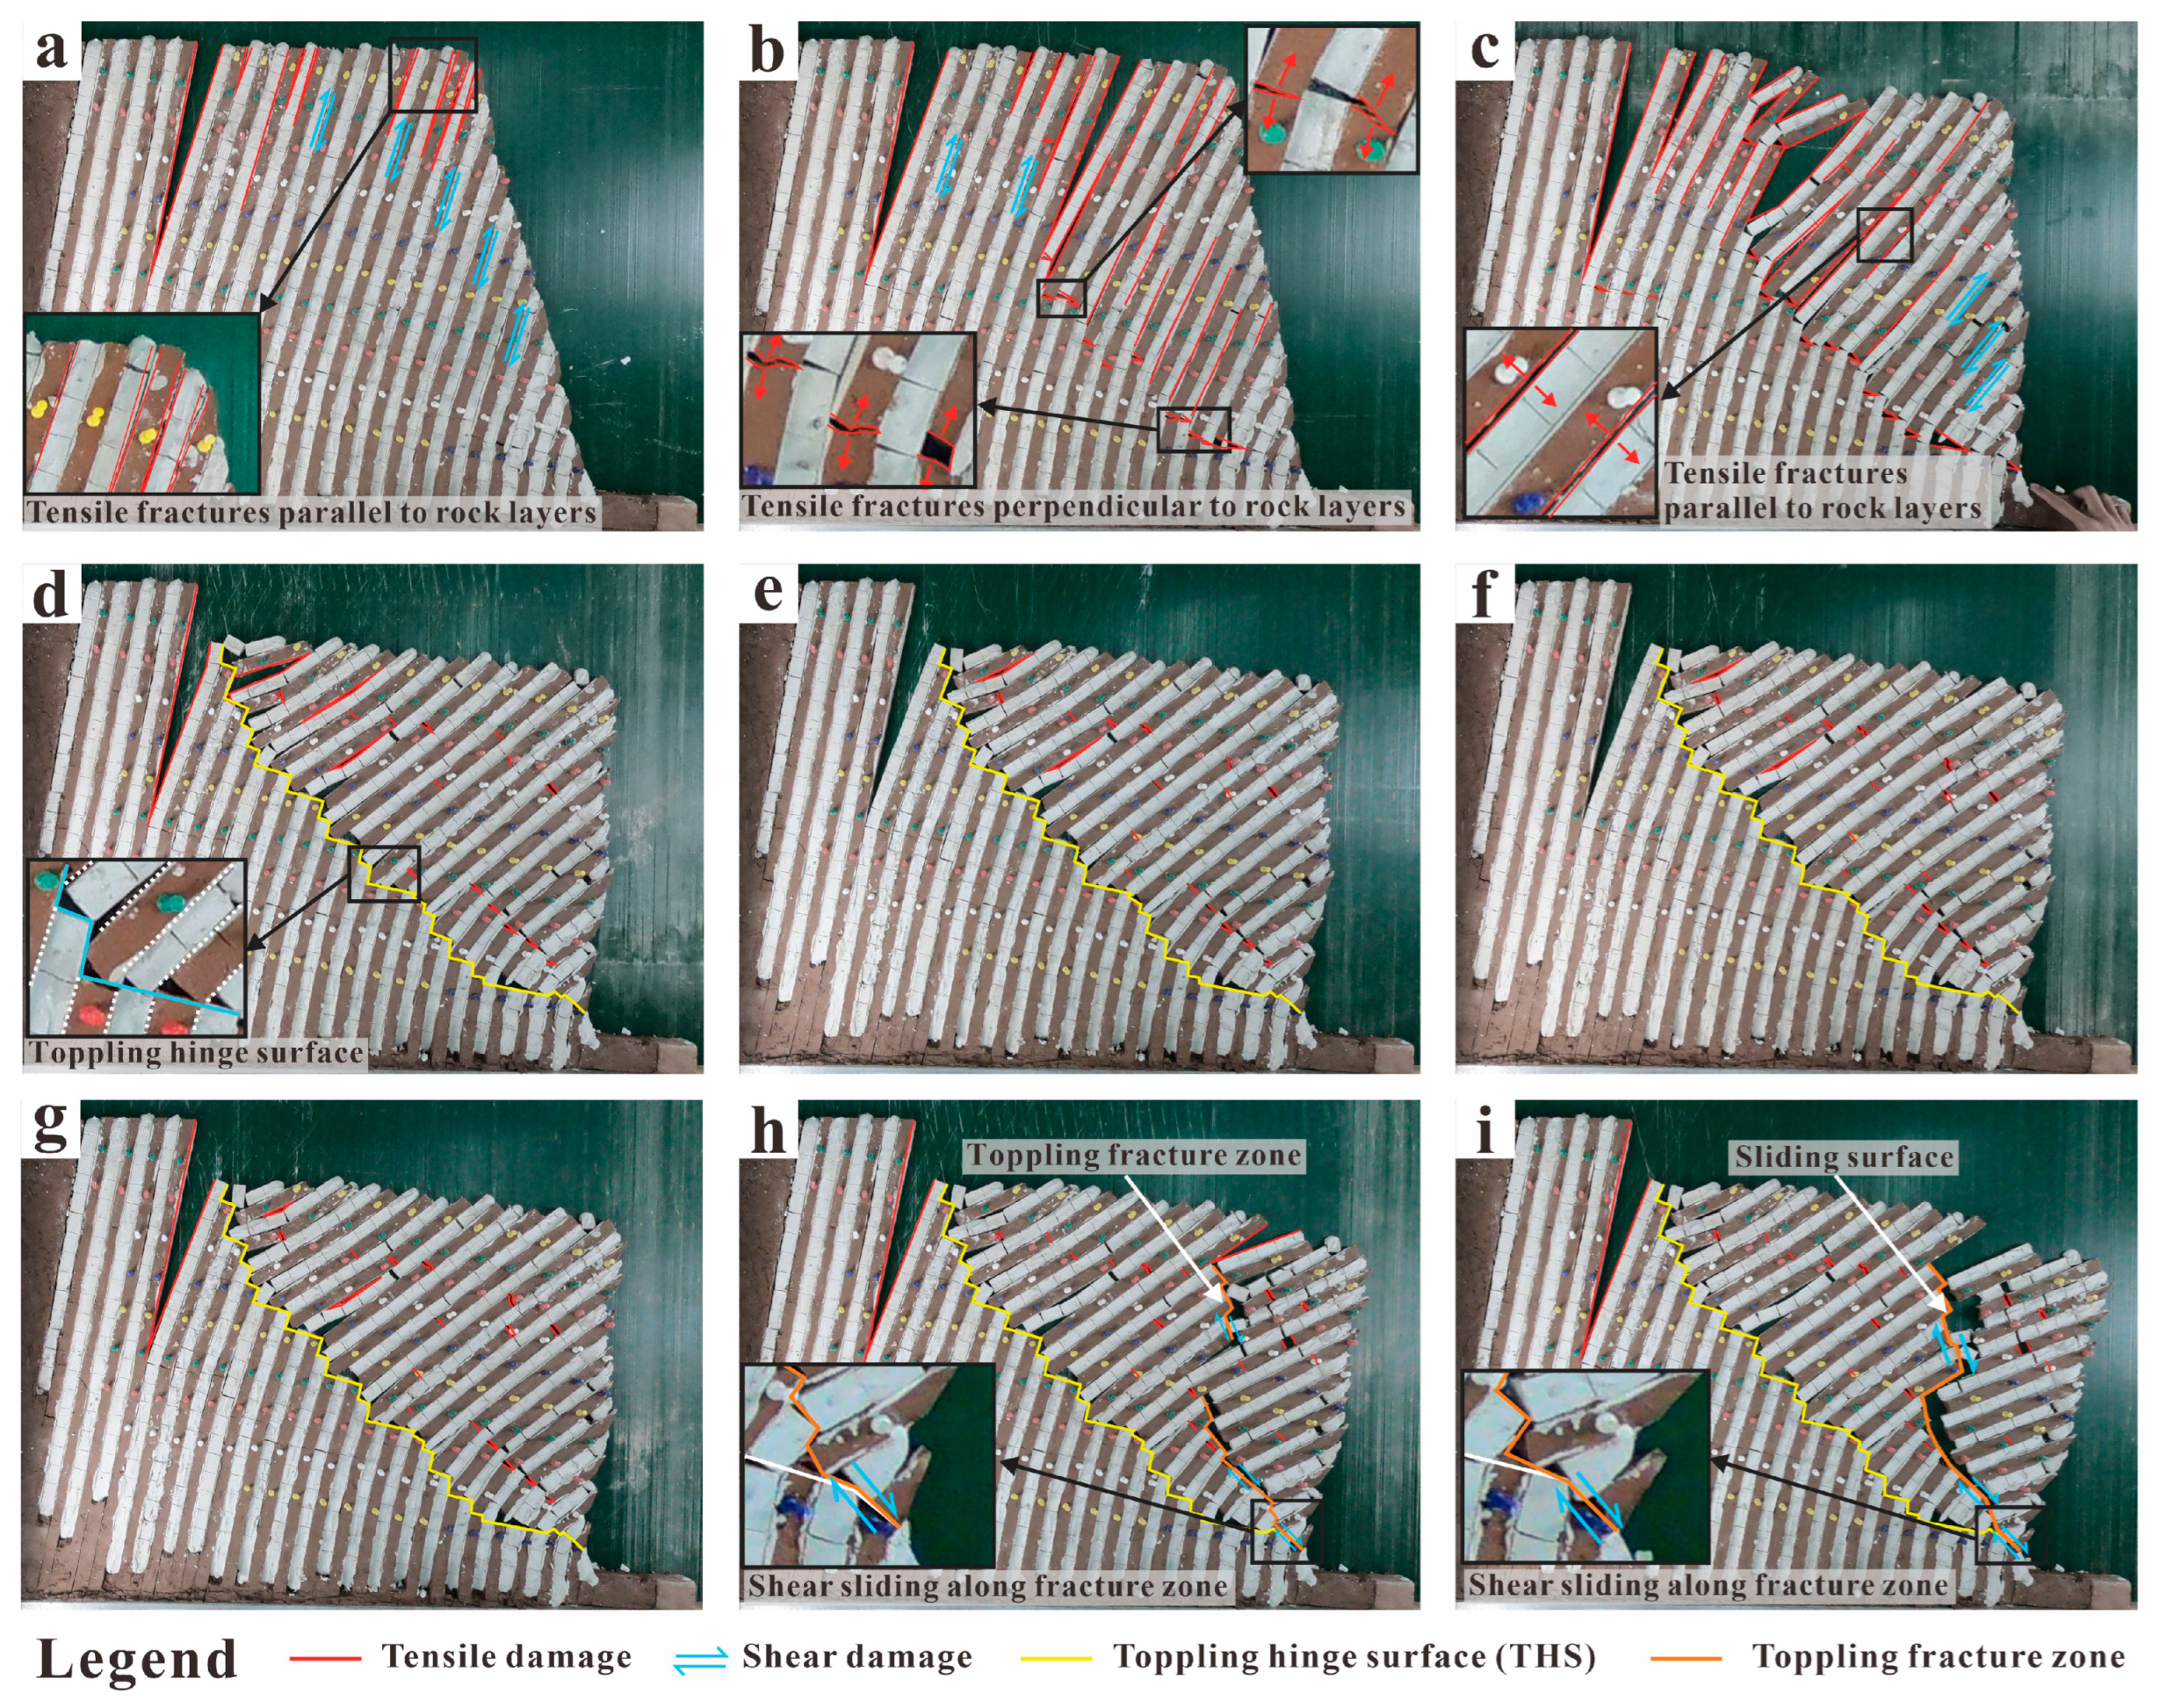
3.1. Deformation and Failure Process

Figure 4 illustrates the deformation features of the model slope at various time intervals during the operation of the conveyor belt. After 80 s of conveyor belt operation, the rock columns produced interlayer shear dislocation under gravity, inducing initial bending deformation of rock columns. Due to the differing deformability of soft and hard rock materials, a series of tensile fractures developed along the rock layers at the crest of the slope. A distinct V-shaped tensile fracture formed between the deformed and undeformed zones, culminating in the formation of a back-slope scarp at the slope surface (Figure 4a). After 130 s of conveyor belt operation, the tensile stress within the rock column progressively increased as the layer bent. When the stress exceeded the tensile strength of the soft rock, a series of tensile fractures perpendicular to the rock layer emerged within the soft rock columns (Figure 4b). After 180 s of conveyor belt operation, the tensile damage along rock layers continued to propagate downslope and into the deeper regions, creating a series of V-shaped tensile fractures in the middle and rear sections of the slope (Figure 4c). After 230 s of conveyor belt operation, the tensile fractures parallel to the rock layer gradually disappeared as the faces of adjacent rock blocks reestablished contact. The tensile fractures within the soft rock columns rapidly concentrated in the locus of maximal curvature of the layers. These fractures interlock with the cross joints of adjacent hard columns, forming a unified toppling hinge surface (THS) within the slope. Furthermore, the strong bending of rock columns led to the widespread development of tensile fractures in the soft intact rocks above the hinge surface (Figure 4d). The deformation features of the slope did not significantly change after 380 s of conveyor belt operation (Figure 4e–g).
After 475 s of conveyor belt operation, a toppling fracture zone was formed by tracking cross joints in hard rocks and tensile fractures perpendicular to the rock layer near the slope toe. The pressure from the overlying rocks caused the toe blocks to slide along the fracture zone, which facilitated further sliding and overturning of the rear rock columns (Figure 4h). The further motion of columns formed another visible toppling fracture zone in the upper region of the slope and a V-shaped tensile fracture perpendicular to the rock layer in the middle region of the slope surface (Figure 4h). After 490 s of conveyor belt operation, the front and rear fracture zones connected and formed a through-going sliding surface that dipped steeply outside the slope. Subsequently, a comprehensive sliding and overturning of the rock masses took place along the failure surface. At this point, the slope was completely destroyed, and the evolutionary process came to a halt (Figure 4i).

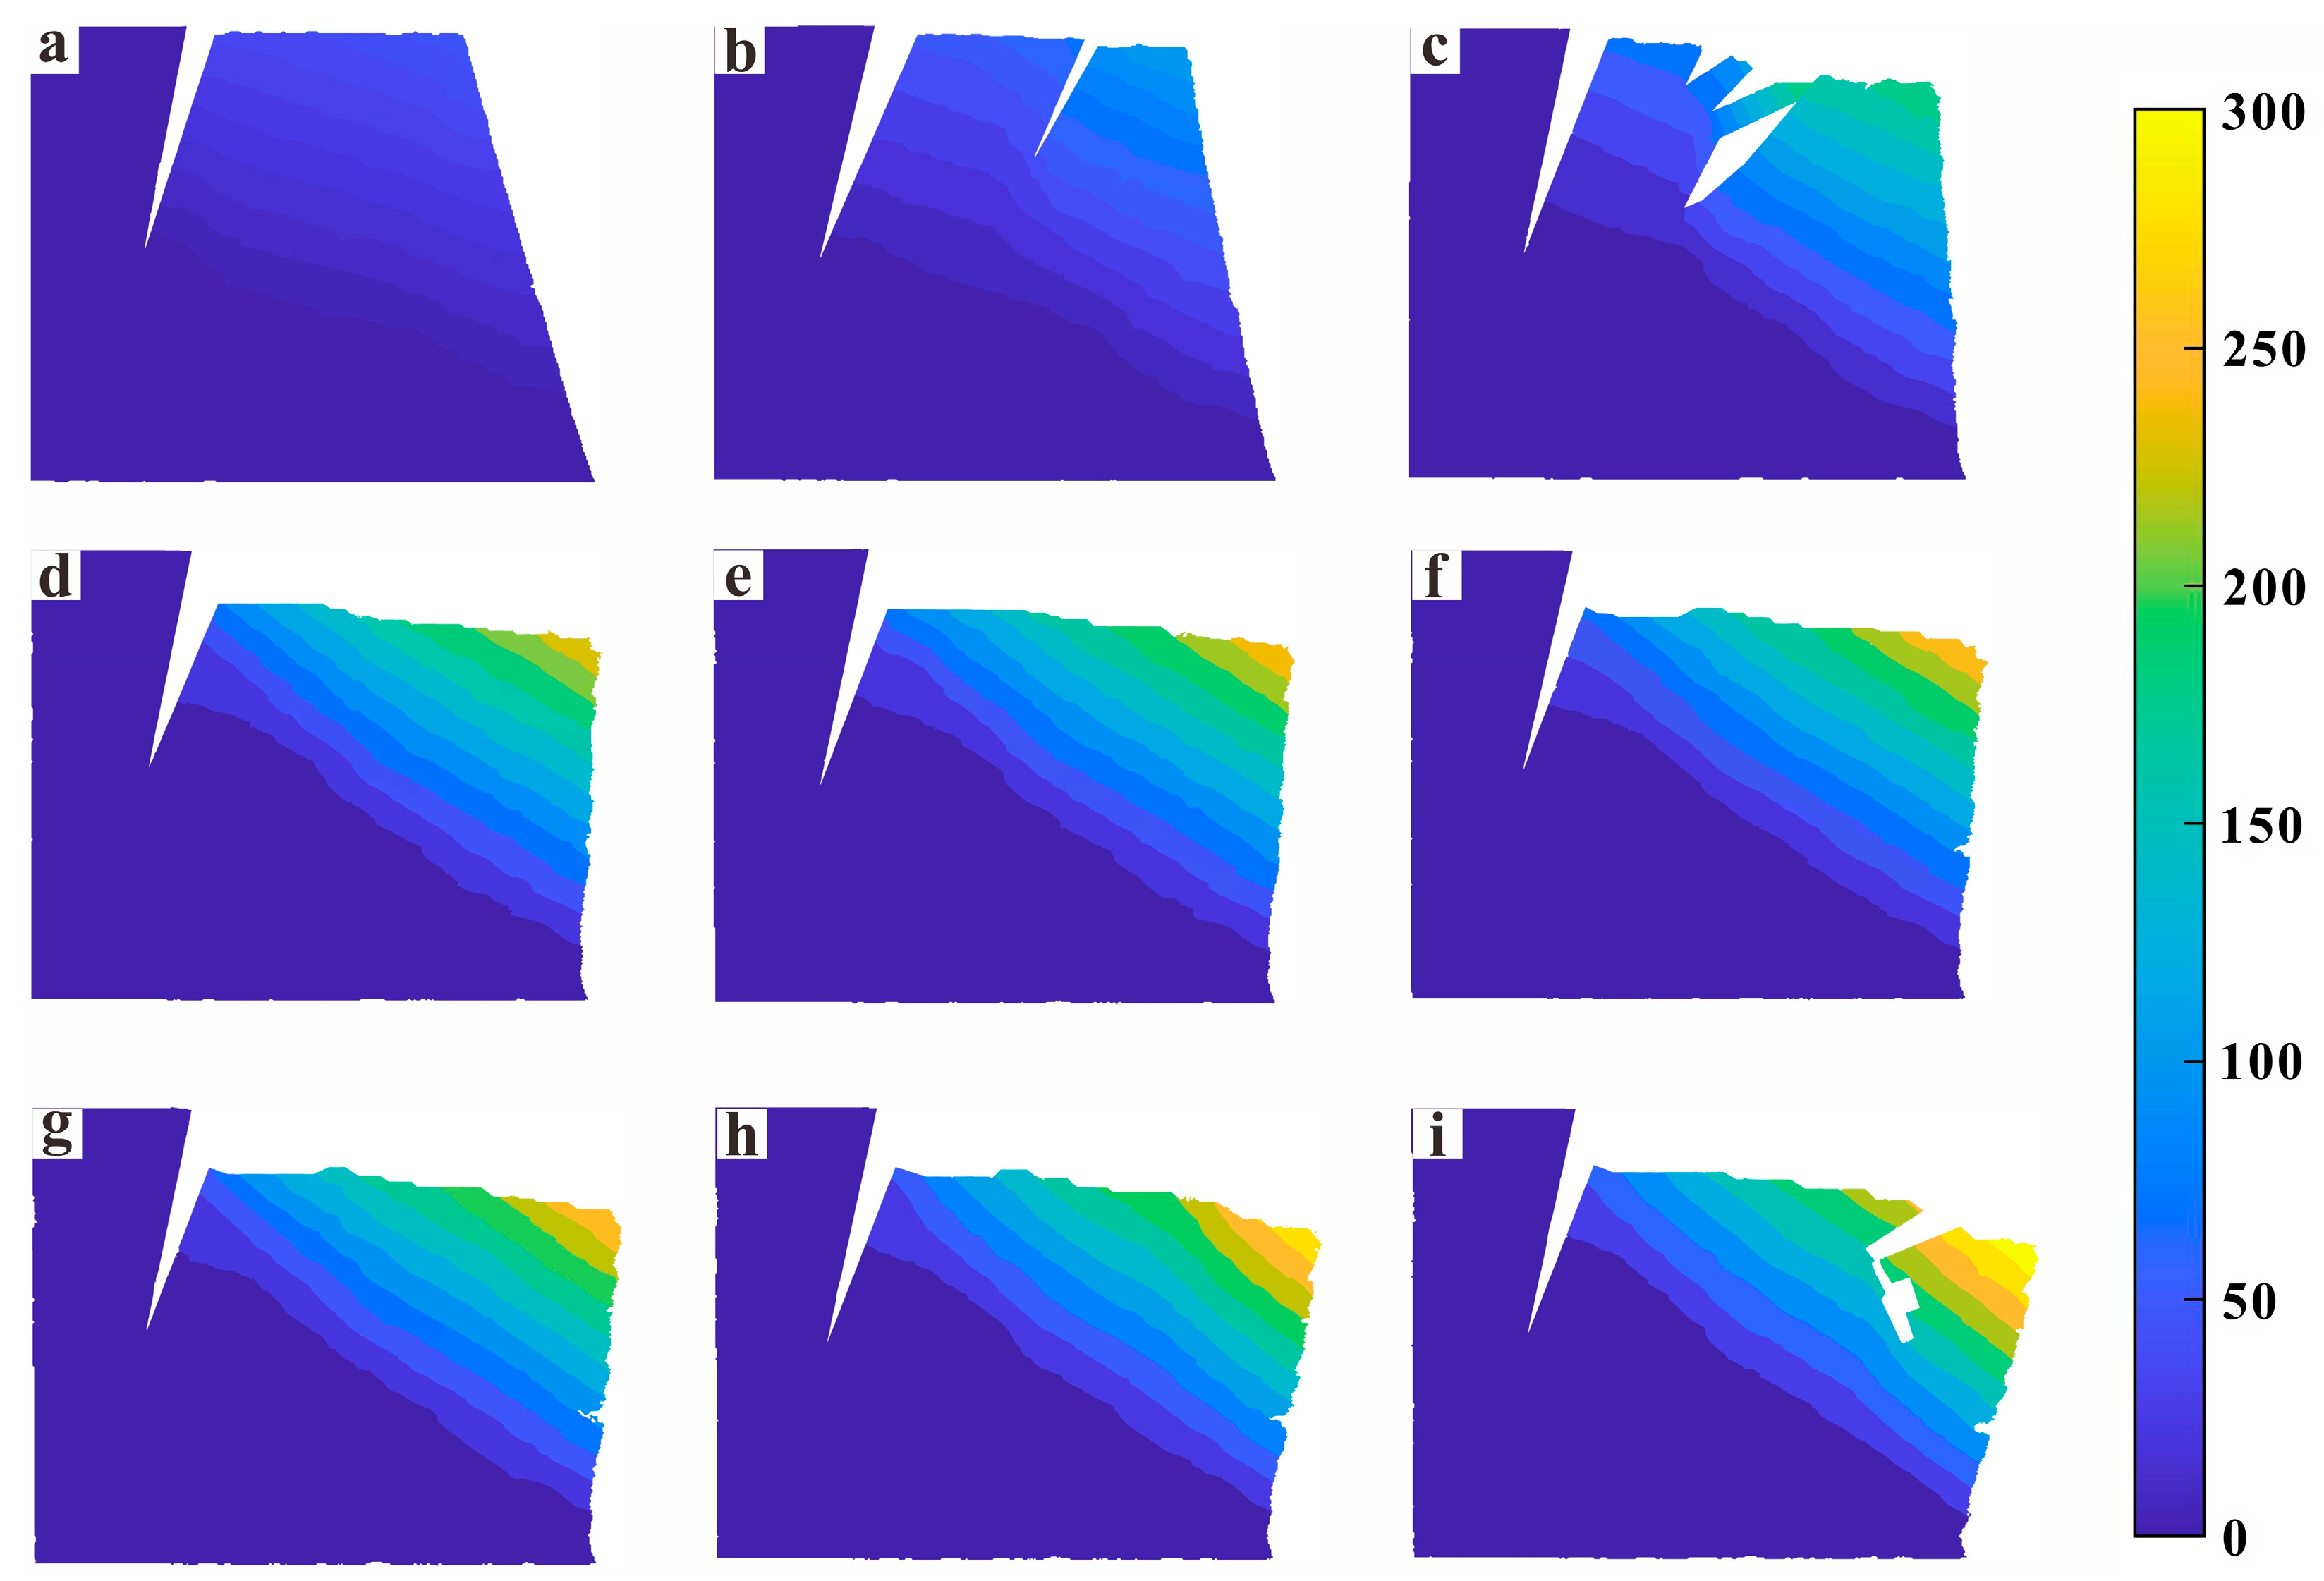
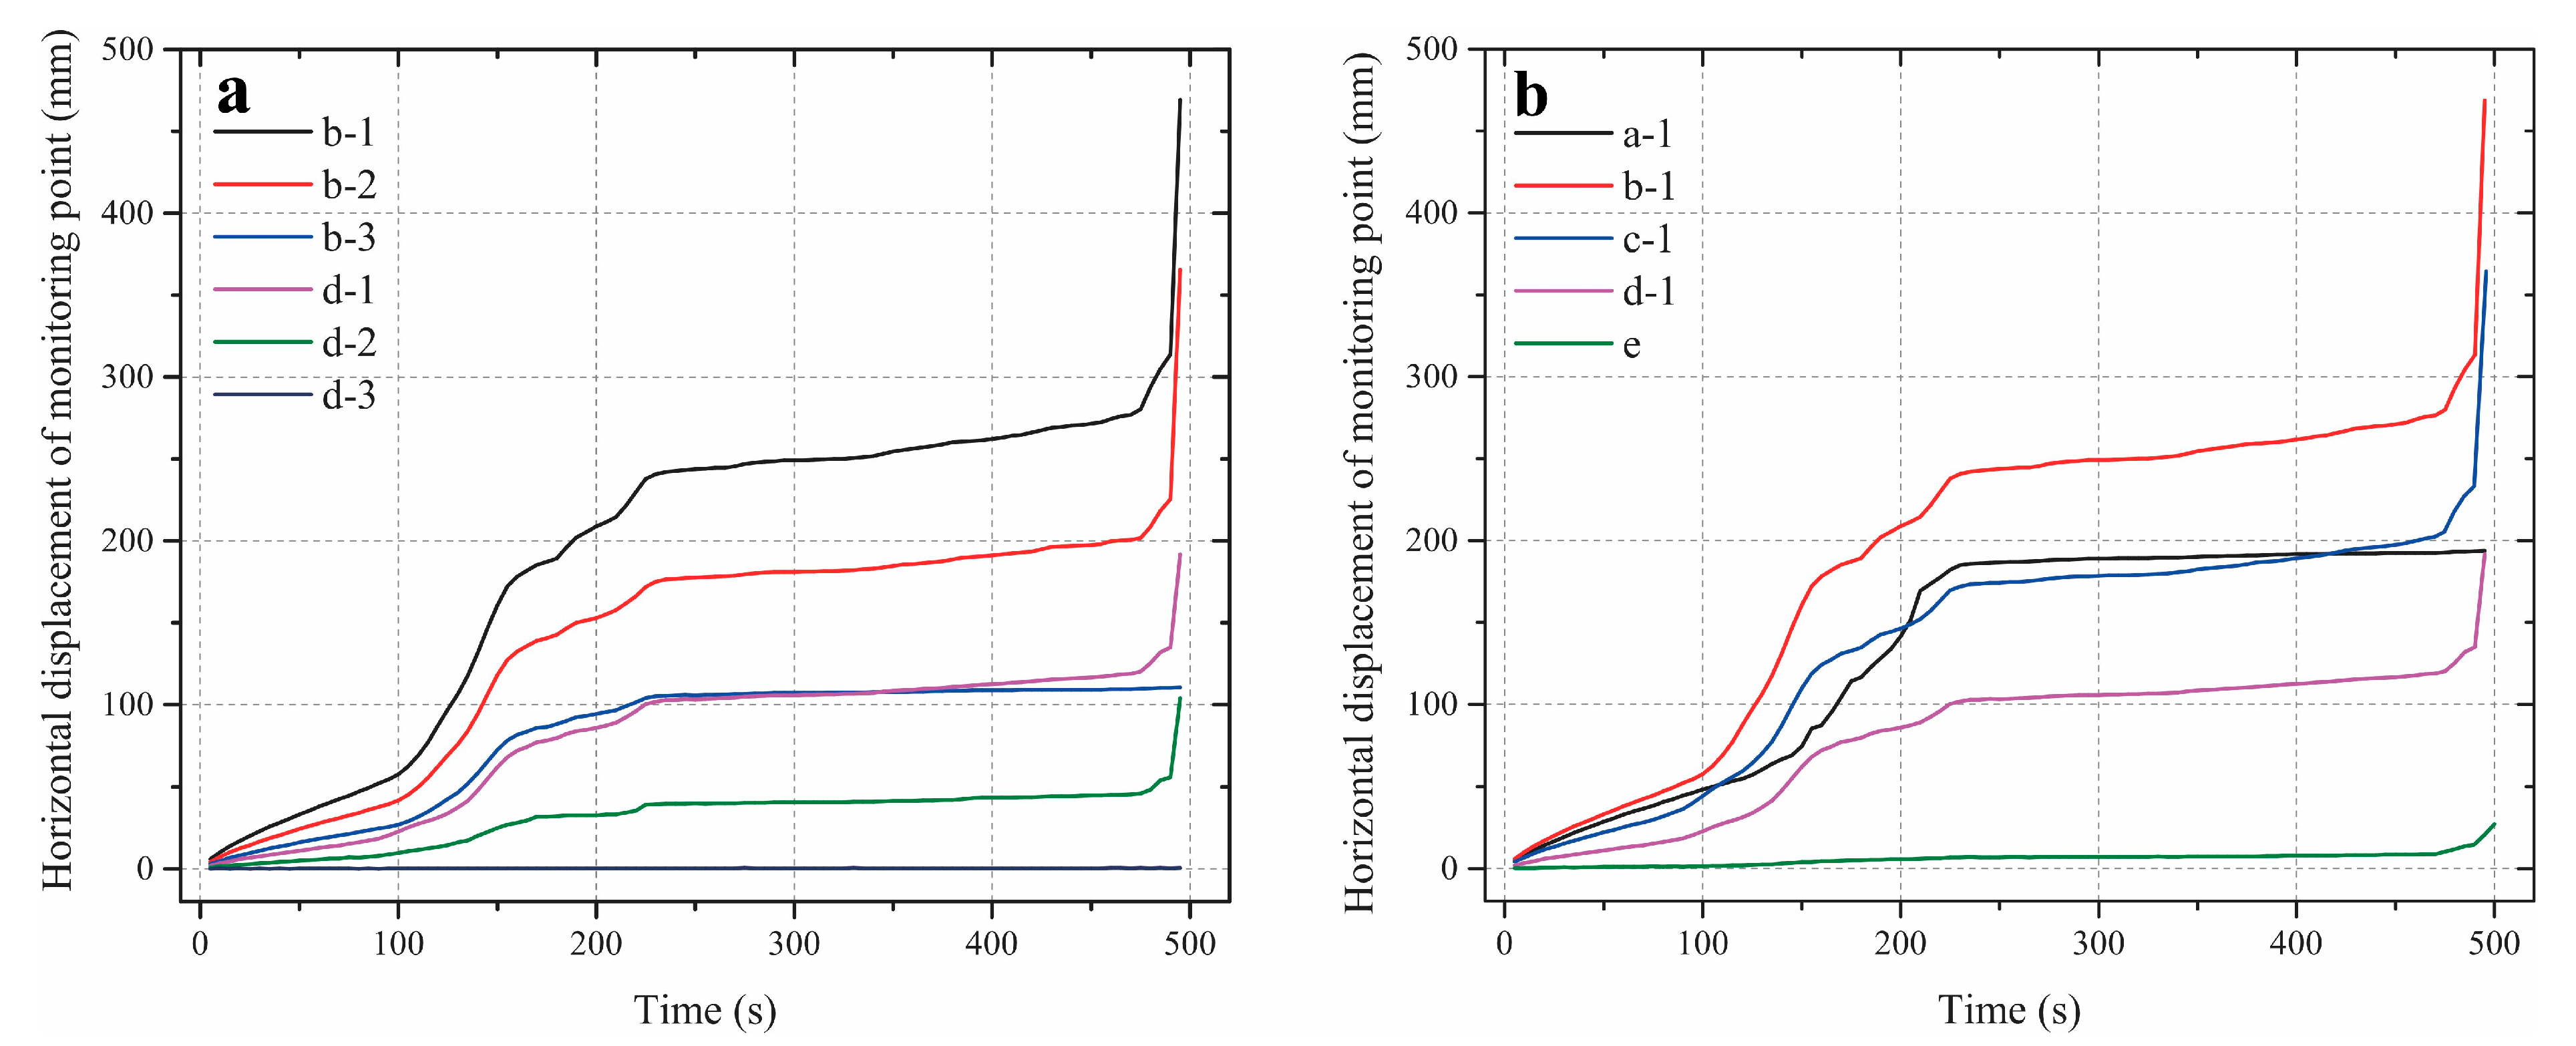
3.2. Evolution of the Slope Displacement

The contours of displacement of the slope at specific times were recorded using the DIC method. After 80 s of conveyor belt operation, the slope underwent overall deformation. The contour lines of horizontal displacement extended nearly perpendicular to the rock layers. The displacement decreased with increasing burial depth, indicating the continuous bending deformation of the rock column. The maximum horizontal displacement at the shoulder of the slope was 50.3 mm (Figure 5a). As the conveyor belt operated, the horizontal displacement showed distinct differentiation on both sides of the tensile fractures parallel to the rock layer at the slope crest. The maximum observed deformation still occurred at the slope shoulder, which reached 196.0 mm after 180 s of conveyor belt operation (Figure 5b,c). Subsequently, the tensile fractures parallel to the rock layer gradually closed, and the heterogeneity of slope deformation disappeared. The contour lines reverted to parallel distribution characteristics, and the maximum horizontal deformation still concentrated at the slope shoulder. Note that from 230 s to 380 s, the horizontal displacement at the slope shoulder increased from 254.2 mm to 270.0 mm. In other words, the rate of deformation decreased significantly during this period, indicating a creep deformation stage (Figure 5d–g). After 490 s of conveyor belt operation, the horizontal displacement at the slope shoulder surged to 341.7 mm, while the maximum horizontal displacement at the rear part of the slope crest remained approximately at 240.0 mm from 475 s to 490 s (Figure 5h,i). This indicated that the unstable rock masses separated from the deformation body and the ultimate instability of the slope occurred.
The contour maps of slope vertical displacement exhibit similar features to those of slope horizontal displacement (Figure 6). The maximum vertical displacement was also located at the slope shoulder. However, the magnitude of deformation was notably less than the horizontal displacement at the corresponding instant. From 230 s to 380 s, the peak value of the slope vertical displacement increased from 140.8 mm to 156.4 mm. After 490 s of conveyor belt operation, the vertical displacement at the slope shoulder surged to 202.3 mm.
Although the entire model was included in the DIC analysis, no significant displacements were observed at the lower and left sides of the slope model, which was consistent with the macro deformation characteristics of the model (Figure 4). This indicated that there is no boundary effect in the test. The displacement contours of the slope model obtained from DIC analysis were accurate and reliable.
Nine characteristic points were selected to record the variations of displacements at different locations (Figure 3b). Overall, the displacement at each monitoring point experienced three evolutionary stages: the initial increase, subsequent stabilization, and final surge, which corresponded to the initial rotation, intermediate creep, and final instability of the slope, respectively. As shown in Figure 7a, the horizontal deformation gradually decreases along the rock layer from the surface to the interior. When considering the same burial depth along the layer direction, the deformation of rock masses in the upper slope is greater than those in the lower slope. Rock masses located above the toppling fracture zone eventually produce a surge in deformation (points b-1, b-2, d-1 and d-2), while rock masses below the THS exhibit minimal deformation (point d-3). Rock masses situated between the THS and the fracture zone experience an initial increase in displacement, followed by stabilization (point b-3). As presented in Figure 7b, the surface displacement decreases from the crest to the toe of the slope. This indicates that the initial rotation of rock columns propagates from top to bottom, displaying a typical push-type motion pattern. After the formation of the throughgoing fracture zone, the displacement at point e first increases, followed by a surge in the displacement at the other monitoring points. This indicates that the final slope instability is induced by the sliding at the slope toe. The slope failure manifests a typical retrogressive motion pattern.

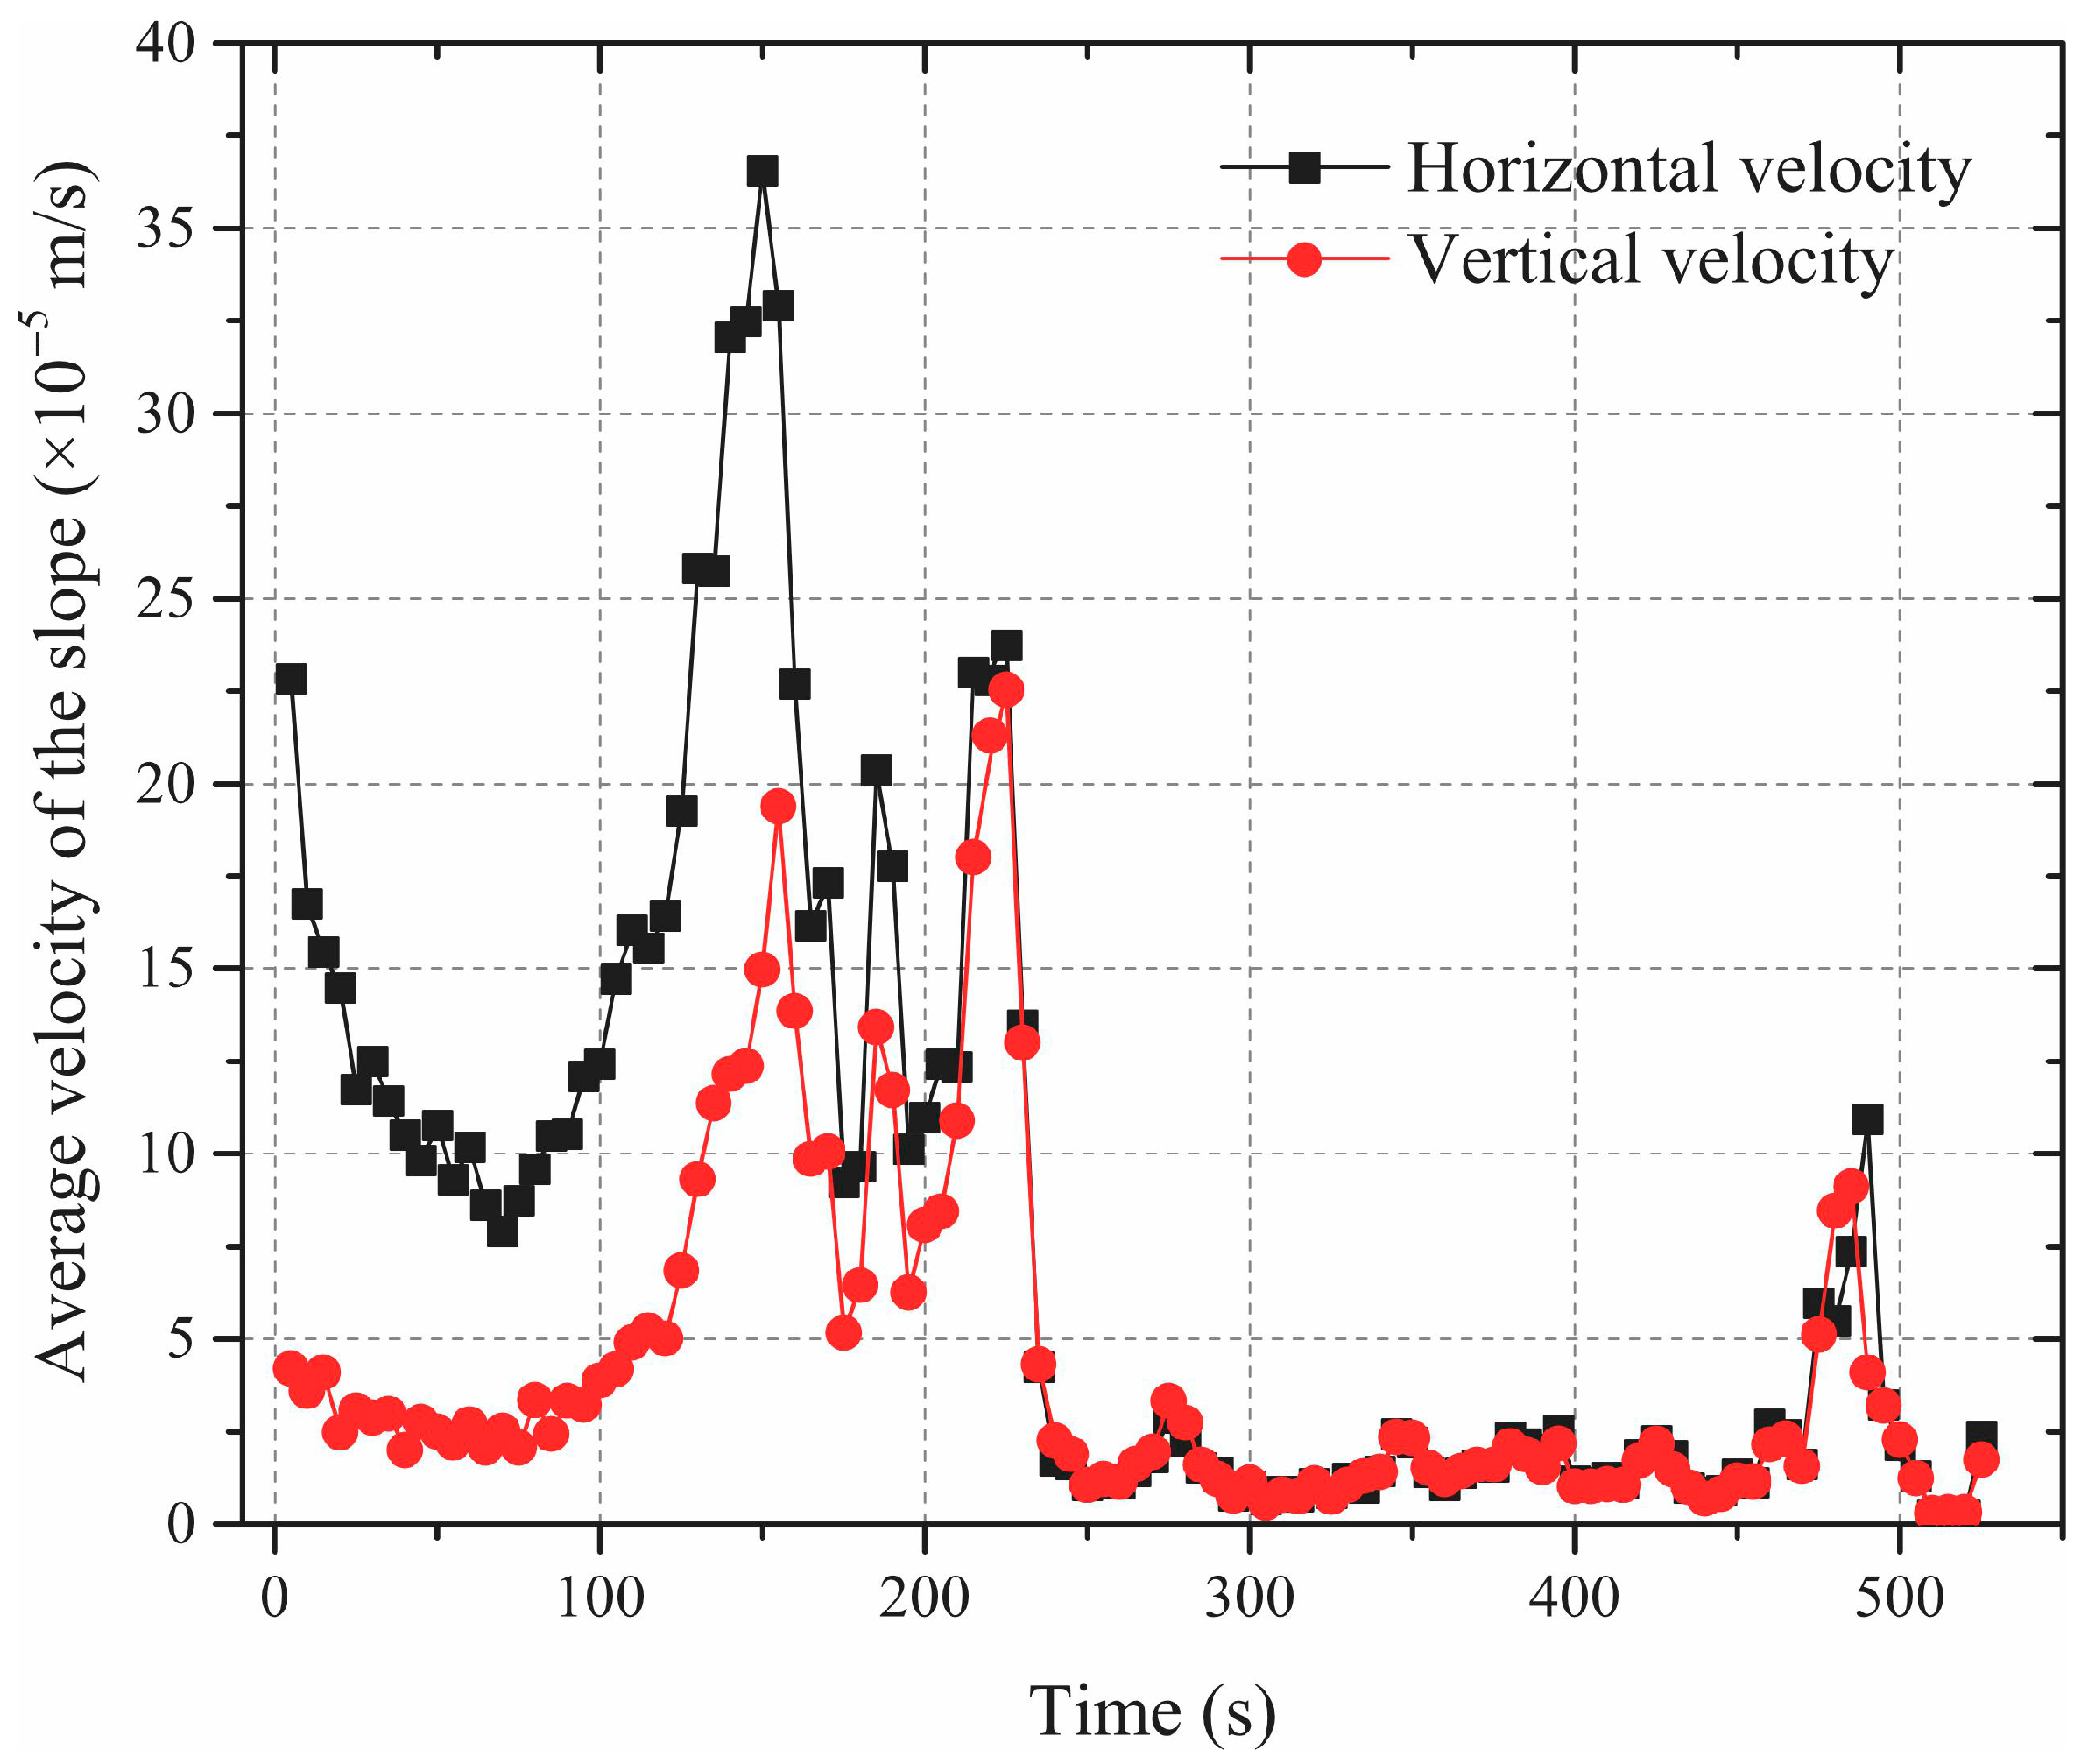
3.3. Evolution of the Slope Velocity

The velocity vector fields of the slope at specific times were recorded using the PIV method. After 80 s of conveyor belt operation, the deformation rate at the slope shoulder was the highest, with the value of 5.9 × 10⁻⁴ m/s. The deformation rate progressively diminished along the direction of the rock layers from the slope surface toward its interior. The surface deformation rate decreased significantly from the shoulder to the toe of the slope (Figure 8a). After 130 s of conveyor belt operation, the peak deformation rate at the slope shoulder reached 19.5 × 10⁻⁴ m/s, while the peak deformation rate at the slope crest was 16.7 × 10⁻⁴ m/s. Due to the differences in deformation rates between the slope shoulder and crest, significant tensile fractures formed along the rock layer in the middle part of the slope crest (Figure 8b). After 180 s of conveyor belt operation, the deformation rate at the slope shoulder significantly decreased, with a peak rate of 5.8 × 10⁻⁴ m/s. The tensile fractures parallel to the rock layer formed at the slope crest provided ample movement space for the rear rock column, resulting in a larger deformation rate at the rear part of the slope, with a peak rate of 7.2 × 10⁻⁴ m/s (Figure 8c). Therefore, the accelerated rotation of the free rock columns gradually closed the tensile fractures parallel to the rock layer, causing the lateral surfaces of neighboring rock columns to reestablish contact. Subsequently, the deformation rate of the slope significantly decreased. The peak deformation rate observed in the slope decreased from 14.2 × 10⁻⁴ m/s at 230 s to 3.2 × 10⁻⁴ m/s at 380 s, and the deformation gradually stabilized (Figure 8d–g). As the toppling fracture zone gradually developed within the slope, the deformation rate of the rock columns above the zone of fracture significantly increased, with a peak value of 12.8 × 10⁻⁴ m/s, leading to the ultimate instability of the slope (Figure 8h,i).
Figure 9 illustrates the temporal variations of the average velocity for the slope. It can be seen that the average velocity of the slope experienced a significant decrease before 80 s. This is because the initial rotation of rock columns was constrained by the surrounding rock columns. After 80 s, with the gradual formation of the tensile fractures parallel to the rock layer, the interlayer frictional resistance decreases significantly. The slope deformation produced a significant increase and reached its peak deformation rate. Notably, the slope deformation rate exhibited a wide range of oscillatory variations, which may be associated with the incompatible rotation between soft and hard rock columns. After 230 s, as the interlayer tensile fractures completely closed, the interlayer frictional forces were reinstated. Consequently, the slope deformation rate significantly decreased, transitioning into a phase of creep. After 460 s, a notable increase in deformation rate reemerged, indicating that the ultimate failure of the slope occurred. Due to the limited extent of the ultimate failed rock masses, the average deformation rate during the final failure phase was lower than that observed during the initial rotation phase (before 230 s). Note that the horizontal deformation dominated the initial rotation of the rock columns, while in the failure phase, vertical and horizontal movements were both evident. This is because the final destabilization of the slope exhibited a composite movement pattern that contained downslope overlapping, overturning, and shear sliding (Figure 4i).
When the slope ultimately failed (at 490 s of conveyor belt operation), the DIC and PIV monitoring results and errors at each monitoring point are shown in Table 3. The true values of displacement and velocity are determined based on the changes in the coordinate values of each monitoring point in the horizontal plane. The coordinate values were measured using the scale on the model frame. It can be observed that the relative error of the DIC monitoring results is within 4.2%, the analysis results are reasonably reliable. The relative error of the PIV monitoring results is within 8.0%. Since the times only represent the sequence of deformation evolution during the tests, we are primarily focusing on the trend of the velocity changes over time. Therefore, the accuracy requirement for the velocity analysis results is relatively low, with an error margin of 8% considered acceptable.

4. Discussion

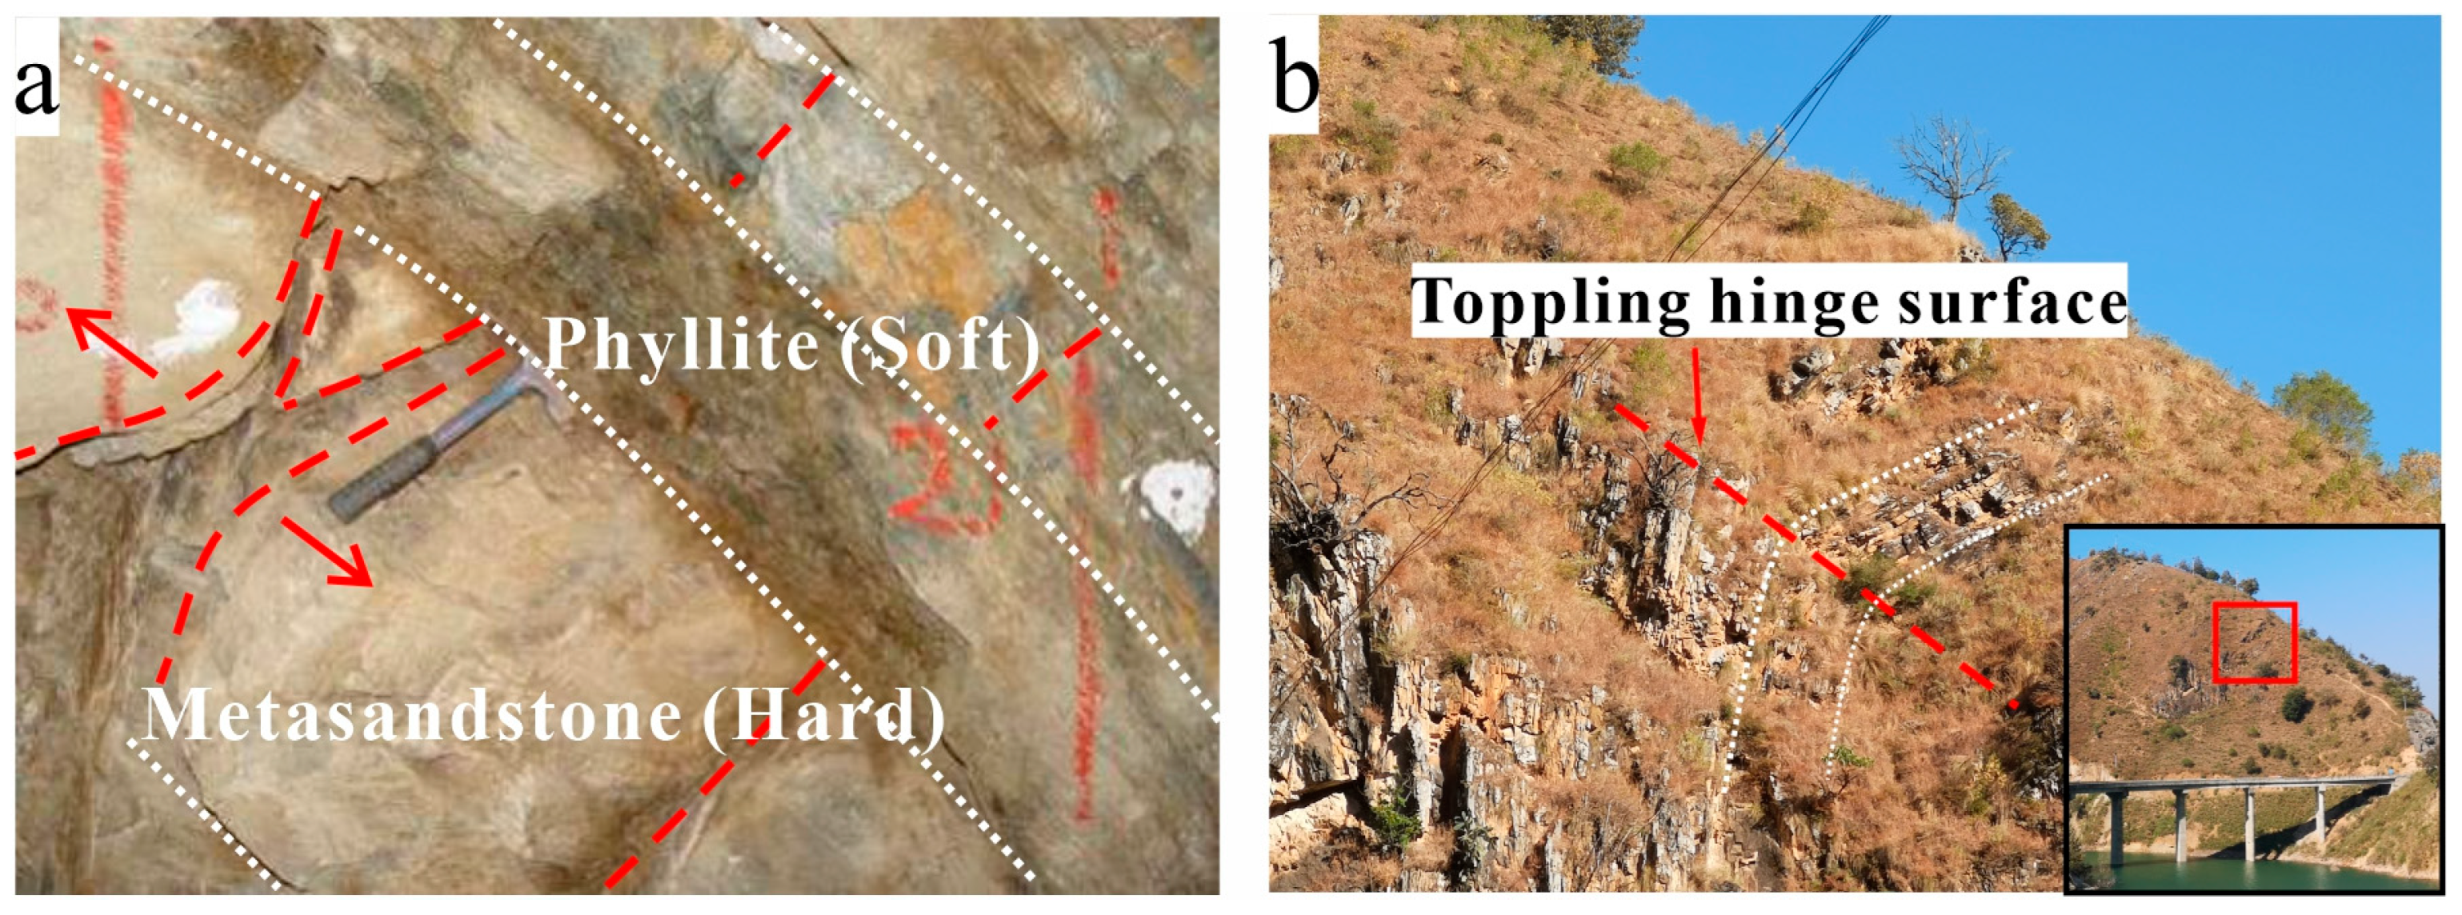
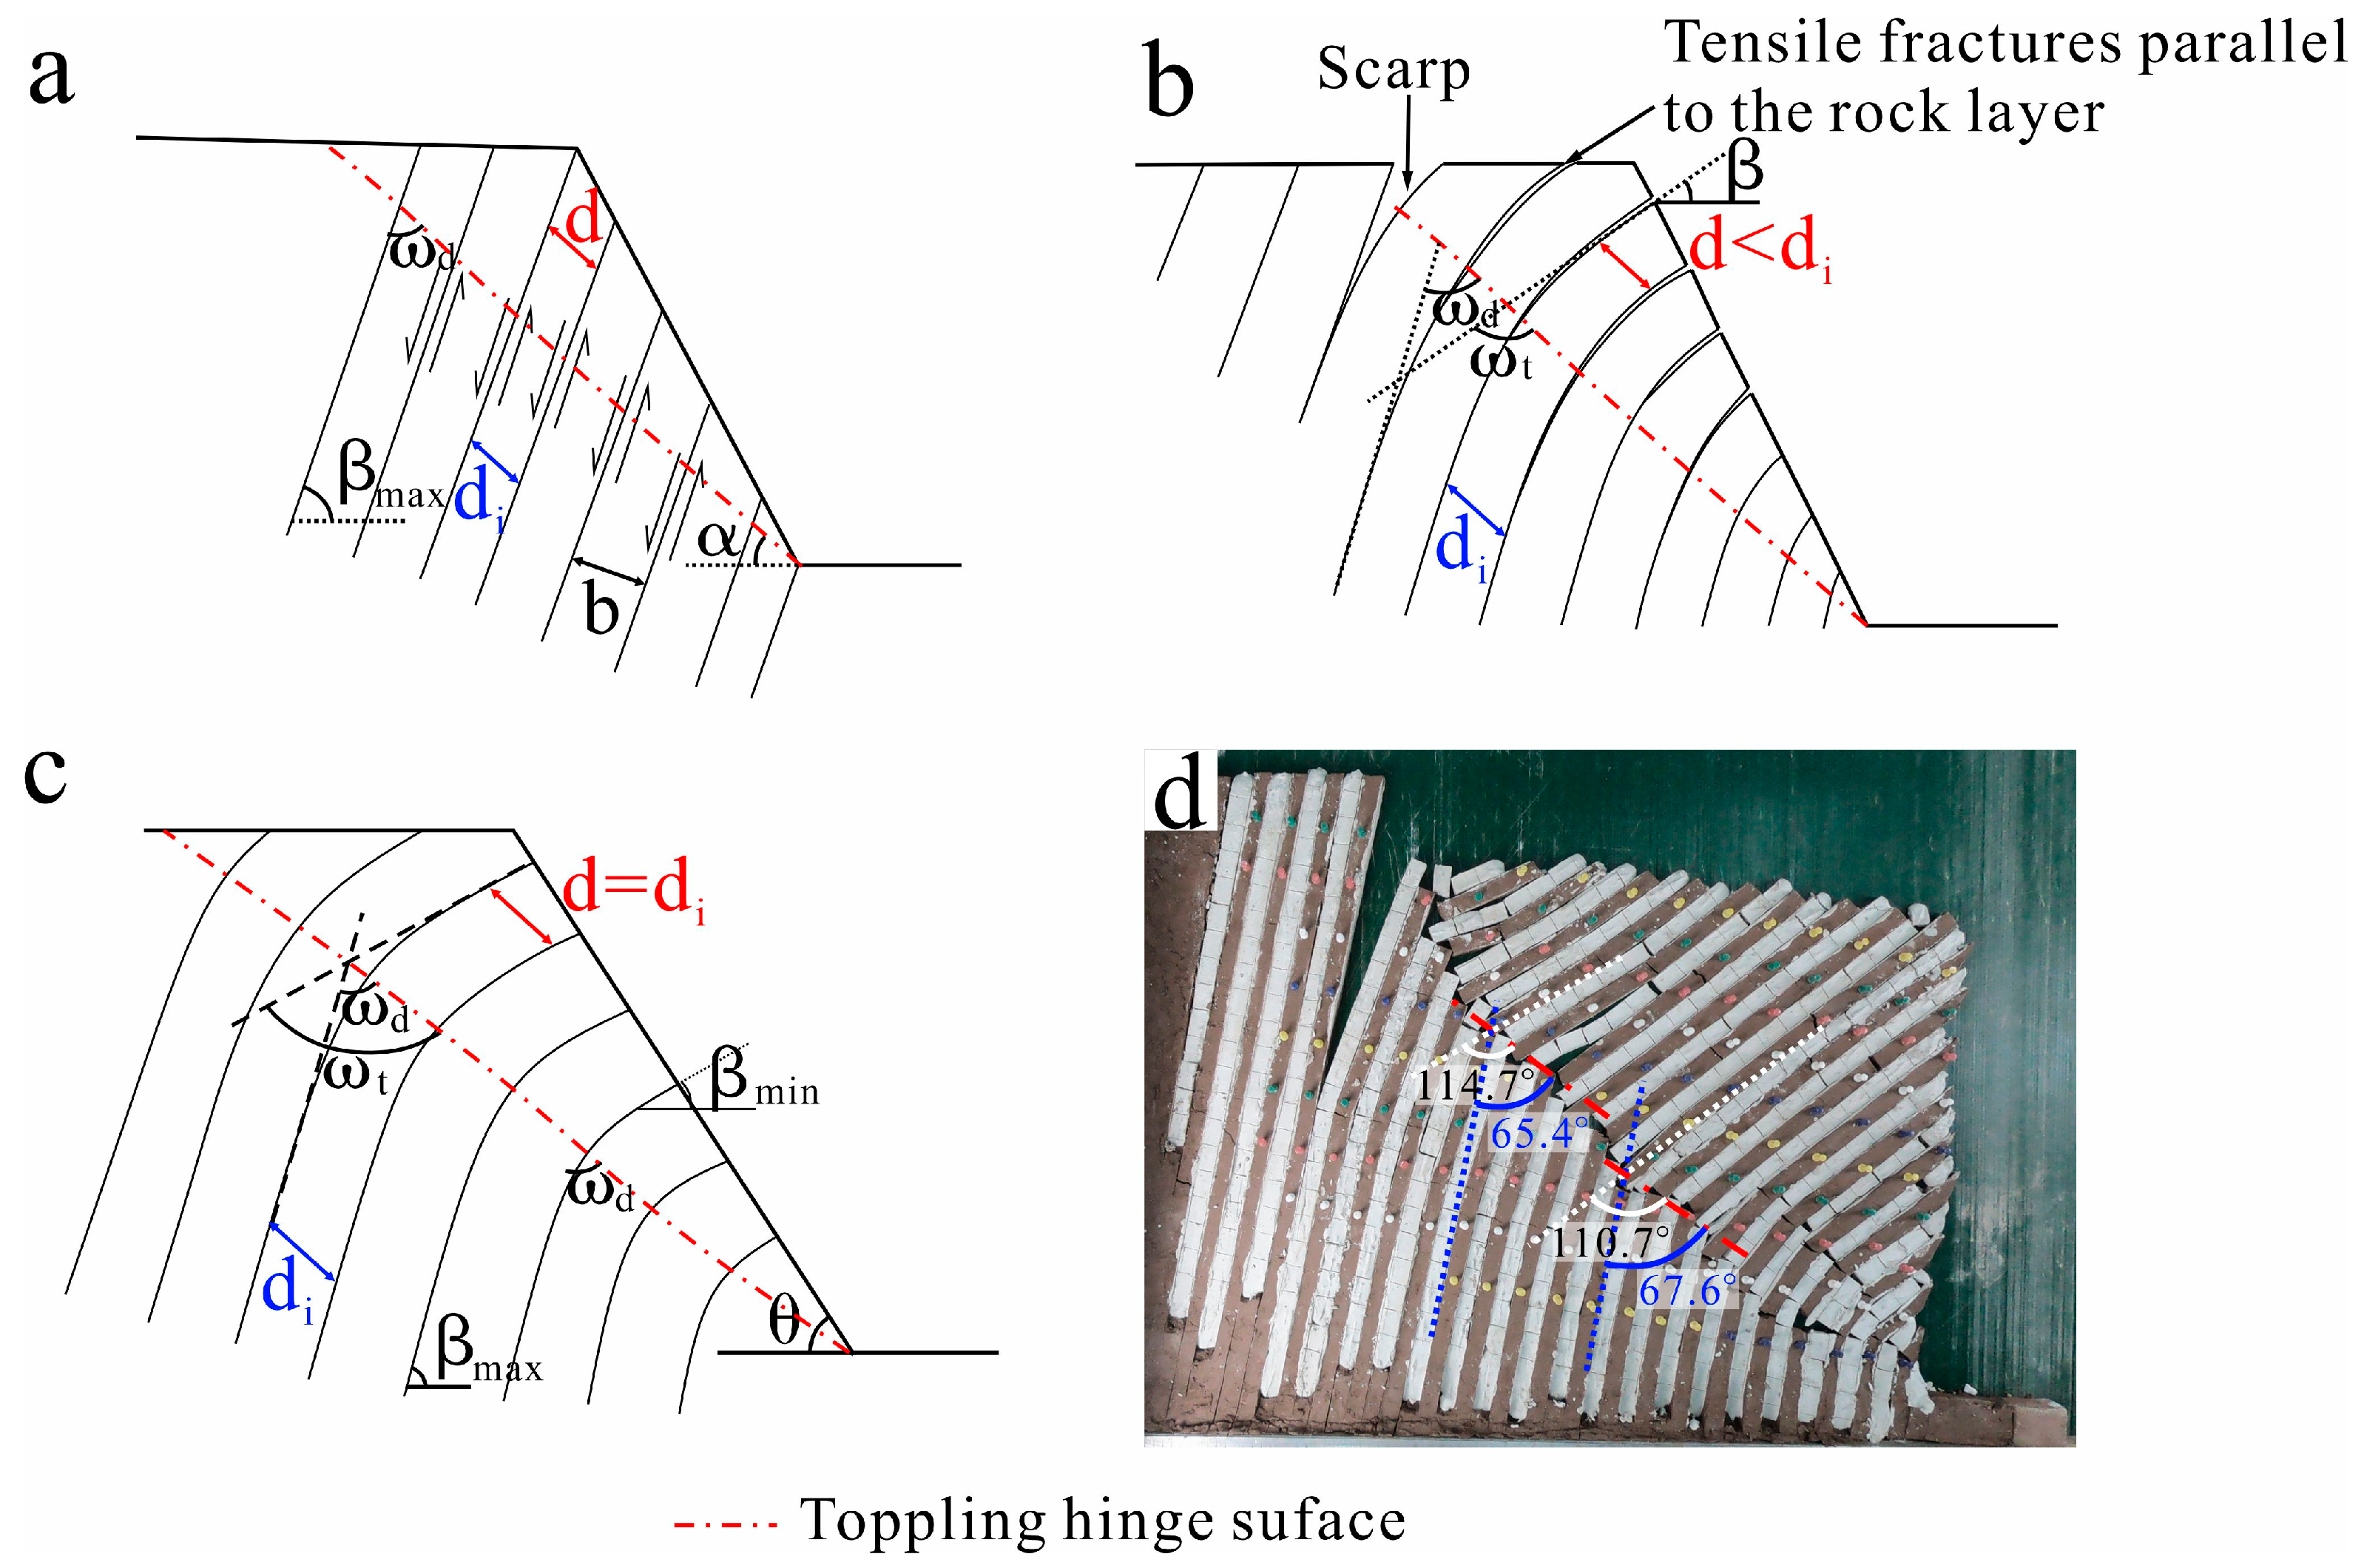
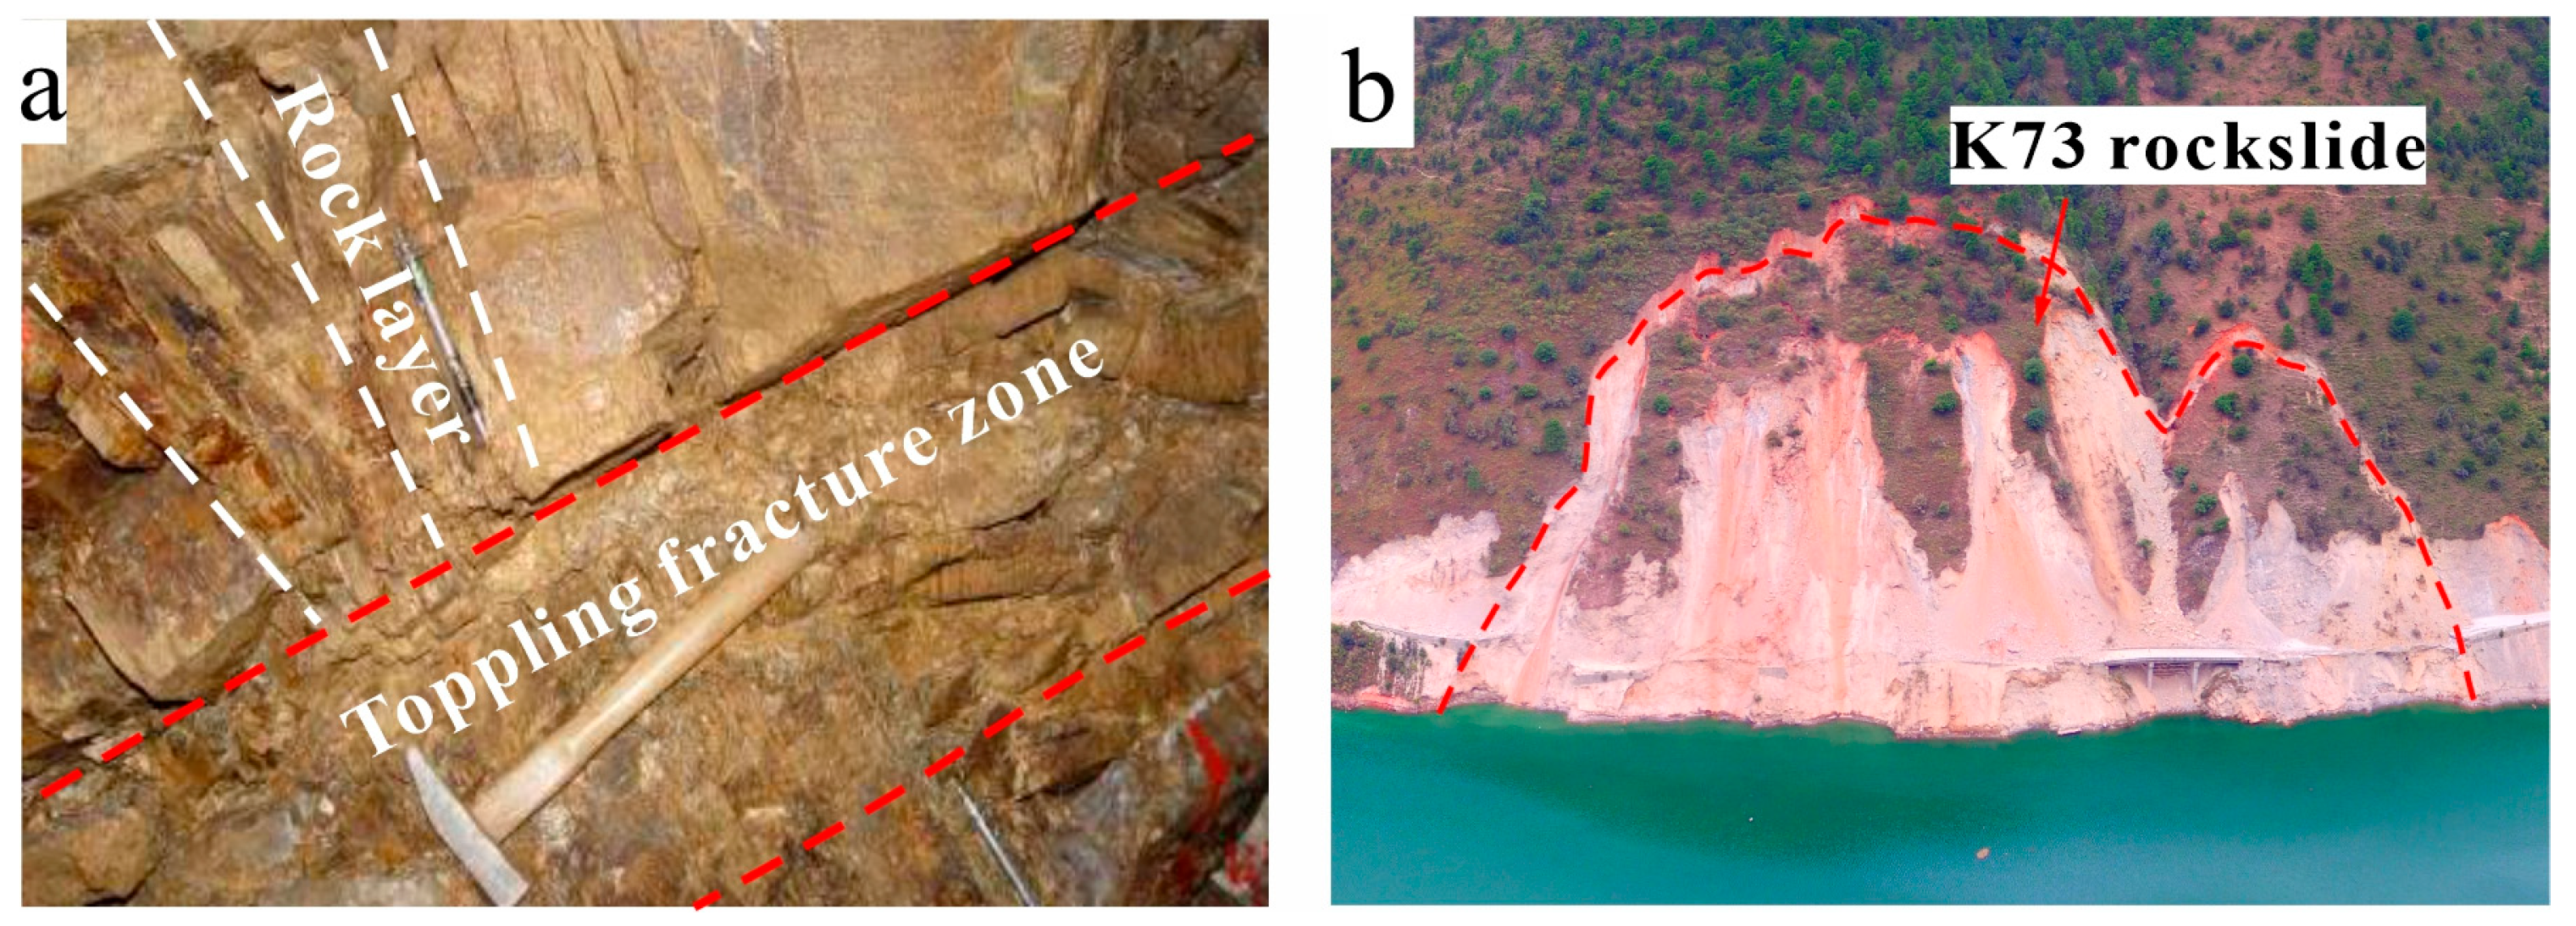
4.1. Uniqueness of the Interbedded Toppling

The lithology significantly influences the toppling behavior of the anti-inclined rock slope. Soft rocks often undergo ductile, flexural toppling, and the mechanism tends toward self-stabilization due to the face-to-face contacts among rock columns. Hard rocks tend to form brittle, catastrophic block toppling due to the loosened structure created by numerous edge-to-face contacts within the slope [1,7,18,46]. However, actual slopes often contain various kinds of lithology and exhibit a more complex interbedded structure. For example, the lithologies exposed in western China primarily comprise phyllite, schist, slate, metasandstone, and limestone [37]. Intense tectonic activities in geological history commonly led to the development of a set of cross joints within hard rocks. During the slope deformation process, soft rocks can withstand significant bending deformation without fracturing due to their ductility. Although hard rock blocks cannot accommodate substantial bending deformations, they can adapt to the bending deformations of surrounding soft rocks by accumulating sliding and overturning along numerous cross joints (Figure 10a). Therefore, the toppling deformation on interbedded anti-inclined rock slopes is a combined result of the flexure of soft rock layers and the accumulated motions of hard rock blocks along cross joints. Compared to block toppling, interbedded rock masses have fewer edge-to-face contacts and a higher degree of constraint from surrounding material. Therefore, the interbedded anti-inclined rock slopes often possess large deformation depths, and the deformation process often tends toward stabilization through its evolution (Figure 10b).
The kinematic analysis can help us intuitively understand the variations in boundary conditions of rock columns during the rotation process. The tensile fracture between two adjacent rock columns can be described by the length parallel to the THS in a rotational column ( d ). As shown in Figure 11a, the initial value of this length ( d i ) can be calculated by:
d i = b sin ω d ,      
where b is the thickness of a rock column. ω d is the angle between the undeflected rock layer and the THS.
After the slope deforms, the value of d in the deflected rock columns can be calculated by:
d = b sin ω t ,      
where ω t is the angle between the deflected rock layer and the THS.
Since rock layers of the prototype slopes are nearly vertical [37], the value of ω d is less than 90°. The rotation of the rock columns will cause an increase in sin ω t , thereby resulting in a decrease in the value of d . Therefore, the formation of the tensile fracture between two adjacent rock columns can be explained by the contractional effect of rotated rock columns parallel to the THS (Figure 11b). The width of the tensile fracture ( d ) can be obtained by:
d = b sin ω d b sin ω t ,      
It should be noted that when ω t > 90 ° , the value of d begins to decrease. When ω t and ω d are complementary, d = 0 . At this point, the side faces of rotated columns regain contact, and the rock layers exhibit a symmetrical structure about the THS (denoted as a mirror image condition). Rotation beyond the mirror image condition is impeded by the shear forces along rock layers, and the slope deformation tends towards self-stabilization (Figure 11c). The results of the base friction model test also indicate that the slope essentially satisfies ω d + ω t = 180 ° in a self-stable state (Figure 11d). Therefore, the mirror image condition of rock layers can serve as an indicator of the slope achieving self-stabilization.
Despite the self-stabilization features of interbedded toppling bodies, there remains a risk of further catastrophic motion for toppled rock masses. This risk is associated with the extent of development of failure surfaces within the toppling bodies. Unlike the distinctive stepped failure surfaces formed by existing cross joints in block toppling (commonly considered as THS), the failure surface in interbedded slopes is related to the cross joints in hard rock columns and tensile fractures in soft rock columns. When cross joints connected tensile fractures among several rock layers, a localized toppling fracture zone can be formed (Figure 12a). Once several fracture zones intersect, a throughgoing failure surface can form, leading to the ultimate destabilization of the toppling bodies (Figure 12b). Note that the position of the failure surface in interbedded toppling bodies often lies above the THS [10,11,12]. This is because the intense weathering and unloading effects have shaped a more fragmented rock structure in the shallow zones of the slope. In addition, the accumulated overturning and bending steepen the tensile fractures near the slope surface, making the rock mass highly susceptible to sliding or overturning along these discontinuities and forming a longer tensile-shear fracture among several rock layers.

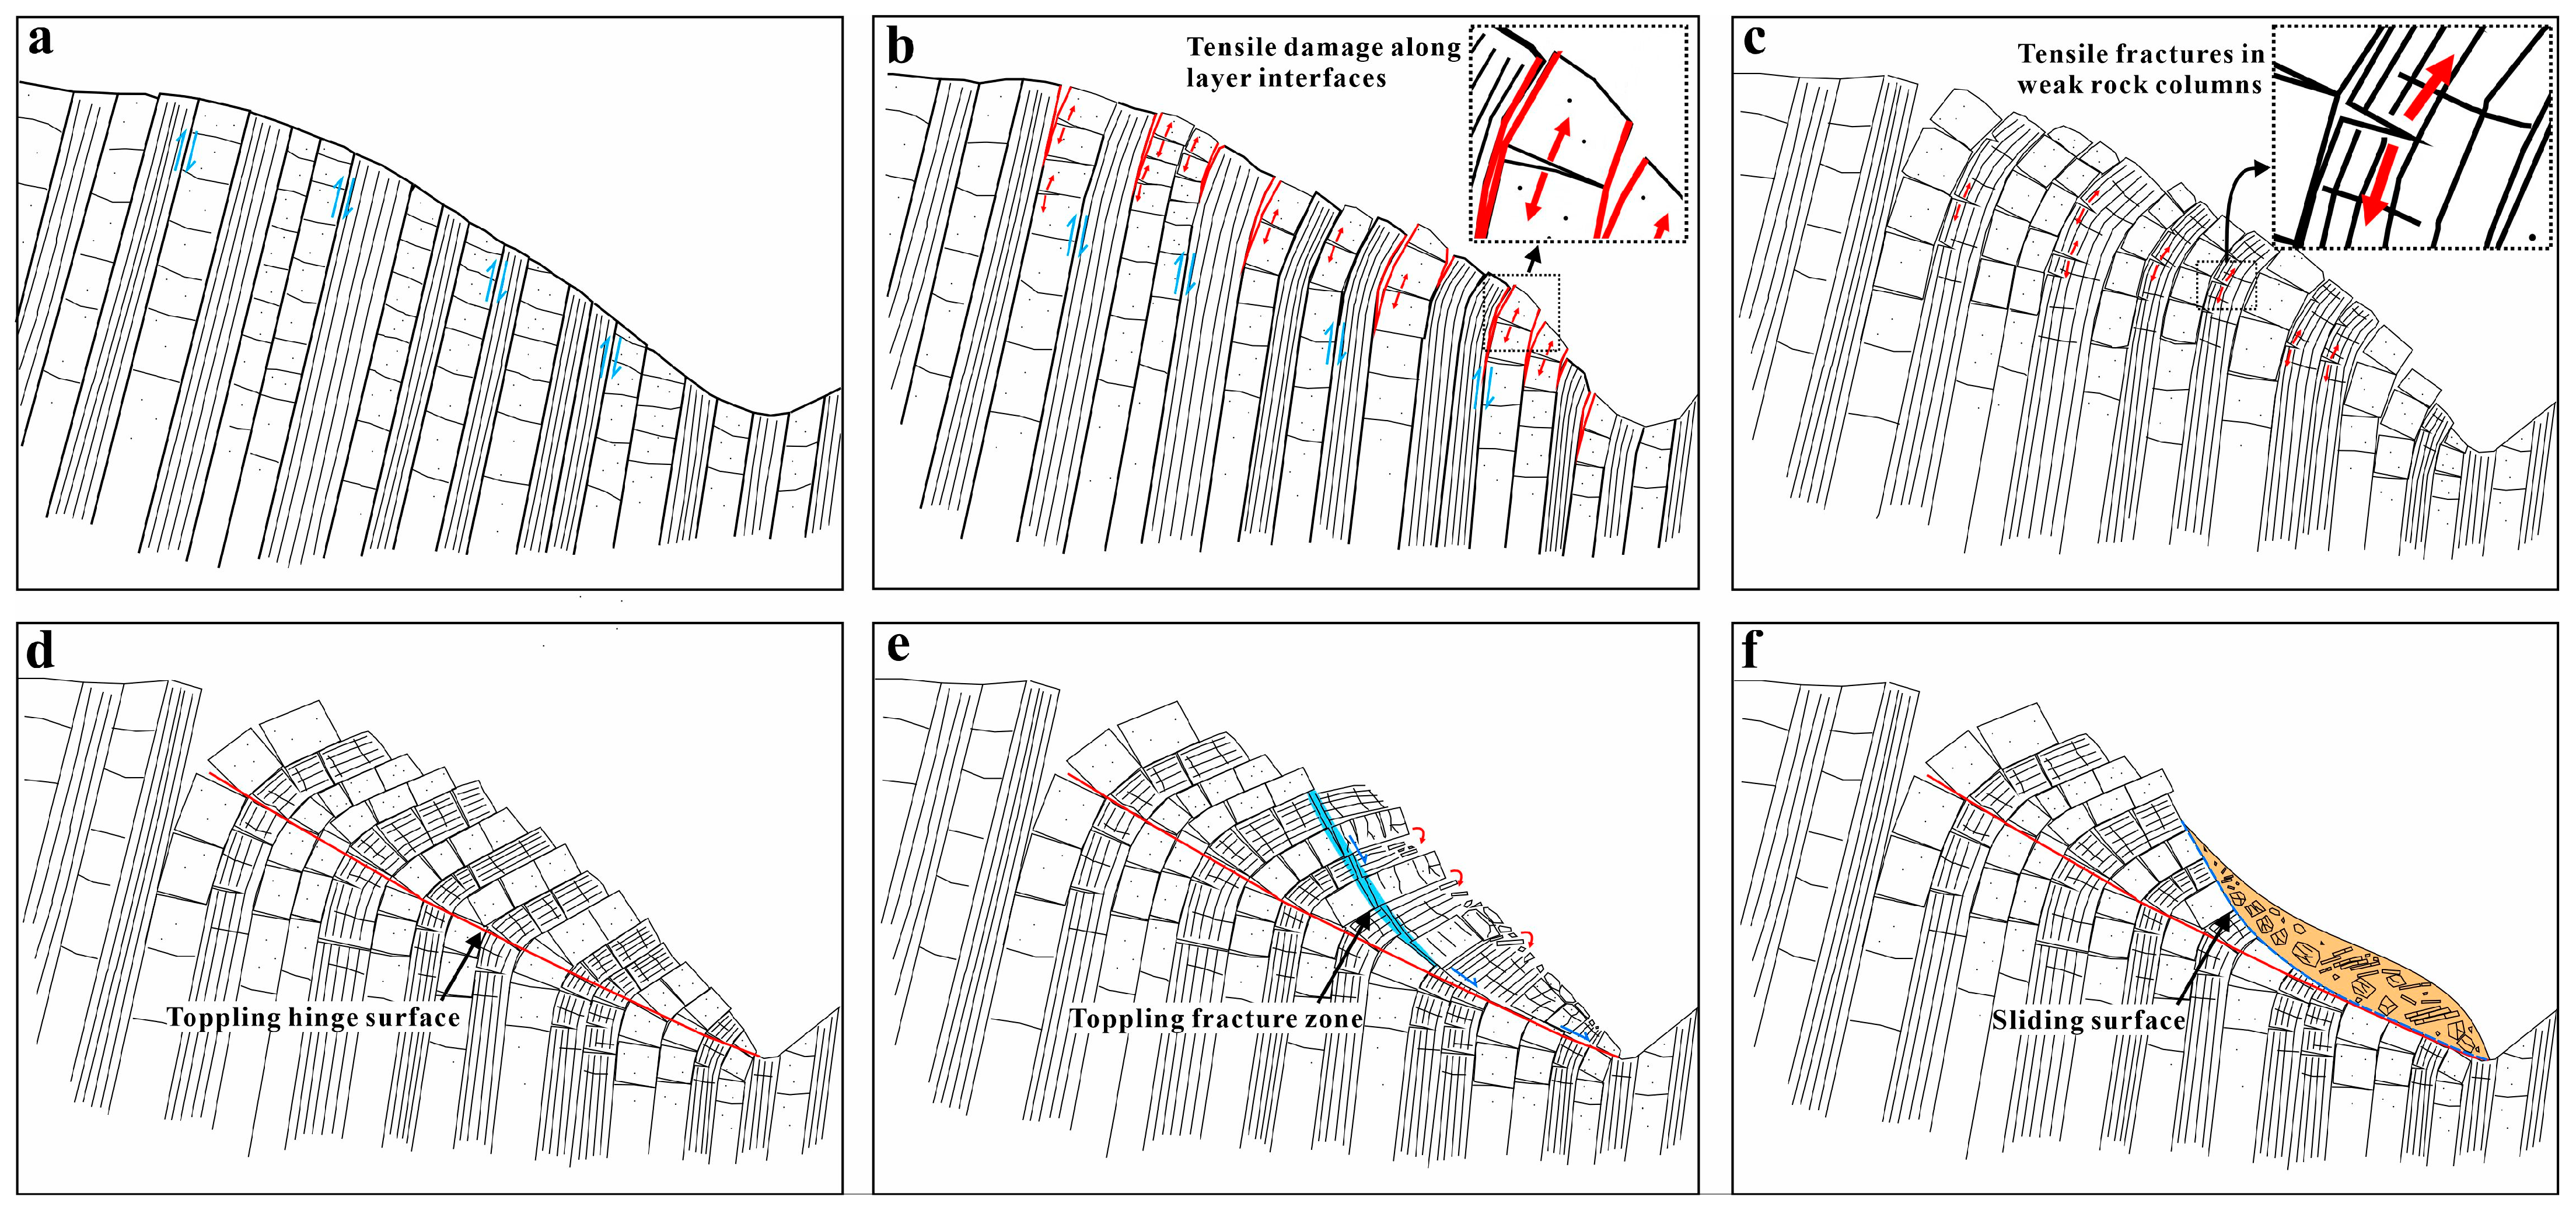
4.2. Evolution Process of the Interbedded Toppling

According to the physical model experiments, the instability of the anti-inclined rock slopes mainly entails early large-scale toppling deformation and later rapid sliding failure. The development of toppling deformation depends on the level of the constraint offered by the materials surrounding the rock column, while the progression to ultimate failure relies on the formation of potential failure surfaces within the deforming body. Overall, the evolution of an interbedded anti-inclined rock slope undergoes the following five stages:
(1)
Initial shearing stage (Figure 13a)
The steeply dipping rock columns overcome the frictional resistance on the side faces from adjacent columns and facilitate shear slip between the parallel rock layers. Due to the tight contact between adjacent rock columns, the deformation rate of the slope is slow.
(2)
Free rotation stage (Figure 13b,c)
As the degree of toppling deformation increases, tensile damage along rock layers rapidly develops and progresses to the lower and deeper parts of the slope. As frictional resistance on the column faces significantly decreases, rock columns undergo accelerated rotation under the effect of gravity. In this stage, rock columns exhibit significant toppling deformation toward the free surface. Soft rock columns undergo ductile bending deformation. Hard rock blocks overturn forward and create numerous tensile fractures based on the cross joints that are present near the slope surface. The formation of the tensile fracture between the adjacent rock layers depends on the differential deformation of soft and hard rocks. On the other hand, the interlayer tensile fractures are likely to be formed by the effective contractional strain which develops parallel to the THS during column rotation [47,48]. In the later period of this stage, tensile fractures perpendicular to the rock layer occur due to sufficient bending deformation.
(3)
Creep stage (Figure 13d)
As rock columns rotate further, the tensile fracture between the adjacent columns gradually disappear, and the side faces of columns are returned into contact. At this point, the further motion of the rock columns is resisted by the increasing interlayer shear forces, and the slope motion tends to be self-stabilized. According to the results of physical model experiments, the deformation rate decreases to approximately 0, and the displacement of the slope essentially ceases to progress. The numerical simulation results from Ning et al. [12] also indicate that the toppling deformation in anti-inclined slate slopes experiences a significant creep stage after initial rotation. Furthermore, such phenomena have been widely observed in the field as well [7,46,47,48]. Based on the strain compatibility theory, the creep stage of toppling can be identified by a mirror image condition of rock layers across the THS [47].
(4)
Progressive failure stage (Figure 13e,f)
Further motion beyond the self-stabilization state is generally induced by the shear slide of the blocks at the slope toe. Due to the release of the restraint at the slope toe, further motion of the above rock columns occurs and progresses towards the rear part of the slope. The hard rock blocks slide along the existing tensile fractures and extrude the adjacent soft rock layers. Then several fracture zones gradually form by tracing the cross joints and tensile fractures in the multiple layers. Once the localized fracture zones gradually connect to form a connected failure surface, the overall movement of fragmented rock masses above this surface subsequently occurs, resulting in the ultimate failure of the slope. Since the fractured rock mass still has a certain layered structure, the movement is characterized by sliding, overturning, and downslope overlapping.
The monitoring results of the average velocity of the slope can provide quantitative references for determining the evolutionary stages (Figure 9). Initially, the slope average velocity consistently decreases. The moment when the rate reaches its minimum value can be considered as the end of the initial shearing stage (70 s). Subsequently, as the velocity significantly increased, the slope is deemed to have entered the free rotation stage. At 240 s, the horizontal velocity of the slope decreases from 22.54 × 10⁻⁵ to 1.71 × 10⁻⁵ m/s, indicating that the slope evolution has entered the creep stage. At 475 s, the slope horizontal velocity surges from 1.61 × 10⁻⁵ to 5.97 × 10⁻⁵ m/s, indicating that the slope has entered the progressive failure stage.
In addition, the magnitude of rotation in the rock columns can serve as an indicator to determine whether the slope has entered the creep stage. The dip angle of rock layers ( β ) in the creep stage exhibits a symmetrical structure across the THS (Figure 11c):
β m i n = π 2 α β m a x ,      
where β m i n is the dip angle of deflected rock layers that satisfy the symmetrical structure. β m a x is the dip angle of undeflected rock layers. α is the dip angle of the THS. When β < β m i n , the slope is likely to enter the progressive failure stage.
The K73 rockslide is a typical example of the instability of anti-inclined rock slopes in the study area. Ning et al. [12] conducted a study on the evolution process of this landslide through numerical simulation. The monitoring results of the joint damage factor indicate that the rock layer is initially subject to shear damage. Then the joint shear damage transforms into tensile damage as the rock columns rotate. Finally, the tensile damage of rock layers dissipates, and the slope achieves self-stabilization. The formation of the rockslide is triggered by the shear movement of the toe rock masses. The sliding surface develops along the cross joints and is located above the THS. It can be seen that the numerical simulation results of the K73 rockslide are closely aligned with the results of the base friction model test. In addition, the rockslide deposits are predominantly composed of nearly horizontal rock columns. Downslope overlapping of rock blocks can be observed at the slope toe. The failure characteristics of the physical model slope are generally consistent with the field investigation results of the K73 rockslide (Figure 14).
Since the failure of anti-inclined rock slopes exhibits distinct stages, different mitigation measures should be applied based on the evolution stage of the slope. The initial rotation of rock columns is often accompanied by the gradual incision of rivers [10,11,12,37]. Due to the extremely slow deformation rates of slopes compared to landslides and the eventual stabilization of deformations, monitoring should primarily guide the treatment of such slope deformations. Protective measures for the rock mass at the toe of the slope should be undertaken when necessary to prevent toppling deformations from developing into landslides [12]. In cases where localized fracture zones form within the slope, a combination of slope reduction and anchoring measures can be employed for treatment.

4.3. Limitations of the Model Test

Physical model tests have successfully revealed the evolution process of the anti-inclined rock slope under long-term gravitational effects. Nevertheless, due to the complexities of real slopes, the results of this study still exhibit limitations. Although the simplified two-dimensional model can effectively capture the primary characteristics of slope deformation evolution, the discontinuities parallel to the direction of the slope section have to be neglected. An advanced three-dimensional model of slopes that considers the topographic features and the structure of rock masses can provide more detailed and specific insights into the deformation and failure mechanisms of slopes.
As a case analysis, we only conducted a single set of tests in this study. Since the test results are consistent with the field investigation results (Figure 10, Figure 12 and Figure 14), we believe that the test results are valid. However, due to the convenient operation, high efficiency, and cost-effectiveness of the base friction model tests, numerous sets of tests can be conducted to further explore the factors influencing slope deformation and failure, such as spacing of cross joints in hard rocks, thickness and dip angle of rock columns, and the strength of rock materials. In addition, the impact of external disturbances on the evolution mechanisms of slopes requires further investigation, such as seismic loads, water saturation, and complex cyclic weathering conditions. Moreover, while we classified the evolutionary stages of toppling deformations in anti-inclined rock slopes based on monitored deformation rates, we did not compare the differences in deformation rates among different toppling patterns. The relationship between slope deformation rates and deformation patterns in base friction model tests remains to be further studied.
The application of PIV and DIC technologies has elevated the qualitative analysis of basal friction tests to a quantitative level, significantly enhancing the accuracy and scientific rigor of the results. However, PIV and DIC techniques can be sensitive to lighting, model texture, and resolution. Therefore, conducting a sensitivity analysis on the influencing factors of PIV and DIC can help identify their primary controlling factors, elucidate their impact mechanisms, and subsequently enable targeted modifications to enhance their accuracy. In addition, advanced intelligent algorithms for fracture propagation can also provide quantitative data and detailed insights into slope instability mechanisms [33].

5. Conclusions

This study investigates the evolutionary process and failure mechanisms of anti-inclined interbedded rock slopes under long-term gravity through base friction physical model tests. The primary conclusions of this study are as follows:
(1) The toppling of interbedded anti-inclined rock slopes is a composite mode formed by the overturning of hard rock blocks and the bending of soft rock columns. Specifically, hard rock blocks slide and overturn along the existing cross joints, resulting in block-flexure toppling. Soft rock columns undergo continuous bending deformation, resulting in flexural toppling. Throughout the deformation process, both toppling modes occur simultaneously, mutually promoting and constraining each other for coordinated development.
(2) The degree of constraint provided by adjacent rock columns highly influences the potential of toppling motion. The initiation of toppling requires overcoming the interlayer shear forces. Contractional strain parallel to the THS causes open space between the layers, thus facilitating forward rotation. As interlayer contact is restored, further rotation is resisted by increasing interlayer shear forces, and the slope deformation becomes self-stabilized.
(3) The destruction of the toe blocks often triggers further motion of rock masses beyond their self-stabilized configuration. Toppling fracture zones are gradually formed by tracing tensile fractures and existing cross joints through multiple layers. When multiple fracture zones connect and form a throughgoing failure surface, an integral movement of fractured rock masses occurs along the failure surface, resulting in slope instability.
(4) The evolution of an anti-inclined rock slope can be recognized as occurring in four stages. These stages are initial shearing, free rotation, creep rotation, and finally the progressive failure stage. Unlike conventional toppling failures, the ultimate failure surface typically lies above the THS, and the landslide deposits are composed mainly of highly toppled rock masses.

Author Contributions

Conceptualization, Y.N. and Y.S.; methodology, Y.N.; investigation, Y.N., T.D., P.X., F.D. and B.Z. (Bei Zhang); resources, B.Z. (Bocheng Zhang); data curation, Y.N., T.D., P.X., F.D. and B.Z. (Bei Zhang); writing—original draft preparation, Y.N.; writing—review and editing, Y.S. and J.V.S.; supervision, Y.N. and Y.S.; project administration, Y.N.; funding acquisition, Y.N. All authors have read and agreed to the published version of the manuscript.

Funding

This research was funded by the National Natural Science Foundation of China (Grant No. 42307220), the Xi’an Association for Science and Technology Youth Talent Support Program (Grant No. 959202413094), the Fundamental Research Funds for the Central Universities, CHD (Grant No. 300102264103), and the Postdoctoral Research Project Funding of Shaanxi Province (Grant No. 2023BSHEDZZ210).

Institutional Review Board Statement

Not applicable.

Informed Consent Statement

Not applicable.

Data Availability Statement

The data presented in this study are available on request from the corresponding author.

Acknowledgments

The authors would express their sincere appreciation to anonymous reviewers and editors for their valuable comments and suggestions.

Conflicts of Interest

The authors declare no conflicts of interest.

Abbreviations

The following abbreviations are used in this manuscript:
THSToppling hinge surface
DICDigital Image Correlation
PIVParticle Image Velocimetry

References

  1. Goodman, R.E.; Bray, J.W. Toppling of rock slopes. In Proceedings of the Special Conference on Rock Engineering for Foundations and Slopes, ASCE, Boulder, CO, USA, 15–18 August 1976; Volume 1, pp. 201–234. [Google Scholar]
  2. Dong, M.; Zhang, F.; Lv, J.; Hu, M.; Li, Z. Study on deformation and failure law of soft-hard rock interbedding toppling slope base on similar test. Bull. Eng. Geol. Environ. 2020, 79, 4625–4637. [Google Scholar] [CrossRef]
  3. De Freitas, M.H.; Watters, R.J. Some field examples of toppling failure. Geotechnique 1973, 23, 495–513. [Google Scholar] [CrossRef]
  4. Liu, X.; Shen, Y.; Zhang, P.; Tang, T.; Liu, Y.; An, Y. Deformation characteristics of anti-dip rock slope controlled by discontinuities: A case study. Bull. Eng. Geol. Environ. 2021, 80, 905–915. [Google Scholar] [CrossRef]
  5. Huang, D.; Ma, H.; Huang, R.; Peng, J.; Luo, S. Deep-seated toppling deformations at the dam site of the Miaowei Hydropower Station, Southwest China. Eng. Geol. 2022, 303, 106654. [Google Scholar] [CrossRef]
  6. Cui, Z.; Chen, P.Z.; Chu, W.J.; Zhou, Y.; Liu, N.; Sheng, Q. Deformation mechanism and reinforcement design for the flexural toppled slope of Miaowei HPP. Bull. Eng. Geol. Environ. 2023, 82, 39. [Google Scholar] [CrossRef]
  7. Hungr, O.; Leroueil, S.; Picarelli, L. The Varnes classification of landslide types, an update. Landslides 2014, 11, 167–194. [Google Scholar] [CrossRef]
  8. Giraud, A.; Rochet, L.; Antoine, P. Processes of slope failure in crystallophyllian formations. Eng. Geol. 1990, 29, 241–253. [Google Scholar] [CrossRef]
  9. Glueer, F.; Loew, S.; Manconi, A.; Aaron, J. From toppling to sliding: Progressive evolution of the Moosfluh Landslide, Switzerland. J. Geophys. Res. Earth Surf. 2019, 124, 2899–2919. [Google Scholar] [CrossRef]
  10. Tu, G.; Deng, H. Formation and evolution of a successive landslide dam by the erosion of river: A case study of the Gendakan landslide dam on the Lancang River, China. Bull. Eng. Geol. Environ. 2020, 79, 2747–2761. [Google Scholar] [CrossRef]
  11. Tu, G.; Deng, H.; Shang, Q.; Zhang, Y.; Luo, X. Deep-seated large-scale toppling failure: A case study of the Lancang slope in Southwest China. Rock Mech. Rock Eng. 2020, 53, 3417–3432. [Google Scholar] [CrossRef]
  12. Ning, Y.; Tang, H.; Zhang, G.; Smith, J.V.; Zhang, B.; Shen, P.; Chen, H. A complex rockslide developed from a deep-seated toppling failure in the upper Lancang River, Southwest China. Eng. Geol. 2021, 293, 106329. [Google Scholar] [CrossRef]
  13. Fang, K.; Miao, M.; Tang, H.; Jia, S.; Dong, A.; An, P.; Zhang, B. Insights into the deformation and failure characteristic of a slope due to excavation through multi-field monitoring: A model test. Acta Geotech. 2023, 18, 1001–1024. [Google Scholar] [CrossRef]
  14. Fang, K.; Tang, H.; Li, C.; Su, X.; An, P.; Sun, S. Centrifuge modelling of landslides and landslide hazard mitigation: A review. Geosci. Front. 2023, 14, 101493. [Google Scholar] [CrossRef]
  15. Fang, K.; An, P.; Tang, H.; Tu, J.; Jia, S.; Miao, M.; Dong, A. Application of a multi-smartphone measurement system in slope model tests. Eng. Geol. 2021, 295, 106424. [Google Scholar] [CrossRef]
  16. Amini, M.; Golamzadeh, M.; Khosravi, M. Physical and theoretical modeling of rock slopes against block-flexure toppling failure. Int. J. Min. & Geo-Eng. 2015, 49, 155–171. [Google Scholar]
  17. Amini, M.; Ardestani, A.; Khosravi, M.H. Stability analysis of slide-toe-toppling failure. Eng. Geol. 2017, 228, 82–96. [Google Scholar] [CrossRef]
  18. Alejano, L.R.; Carranza-Torres, C.; Giani, G.P.; Arzúa, J. Study of the stability against toppling of rock blocks with rounded edges based on analytical and experimental approaches. Eng. Geol. 2015, 195, 172–184. [Google Scholar] [CrossRef]
  19. Alejano, L.R.; Sánchez–Alonso, C.; Pérez–Rey, I.; Arzúa, J.; Alonso, E.; González, J.; Beltramone, L.; Ferrero, A.M. Block toppling stability in the case of rock blocks with rounded edges. Eng. Geol. 2018, 234, 192–203. [Google Scholar] [CrossRef]
  20. Zhu, C.; He, M.; Karakus, M.; Cui, X.; Tao, Z. Investigating toppling failure mechanism of anti-dip layered slope due to excavation by physical modelling. Rock Mech. Rock Eng. 2020, 53, 5029–5050. [Google Scholar] [CrossRef]
  21. Zheng, Y.; Chen, C.; Liu, T.; Xia, K.; Liu, X. Stability analysis of rock slopes against sliding or flexural-toppling failure. Bull. Eng. Geol. Environ. 2018, 77, 1383–1403. [Google Scholar] [CrossRef]
  22. Ding, B.; Han, Z.; Zhang, G.; Beng, X.; Yang, Y. Flexural toppling mechanism and stability analysis of an anti-dip rock slope. Rock Mech. Rock Eng. 2021, 54, 3721–3735. [Google Scholar] [CrossRef]
  23. Adhikary, D.P.; Dyskin, A.V.; Jewell, R.J. Modelling of flexural toppling failures of rock slopes. In Proceedings of the International Society for Rock Mechanics Congress, ISRM, Tokyo, Japan, 25–30 September 1995; pp. 25–29. [Google Scholar]
  24. Adhikary, D.P.; Dyskin, A.V.; Jewell, R.J.; Stewart, D.P. A study of the mechanism of flexural toppling failure of rock slopes. Rock Mech. Rock Eng. 1997, 30, 75–93. [Google Scholar] [CrossRef]
  25. Adhikary, D.P.; Dyskin, A.V. Modelling of progressive and instantaneous failures of foliated rock slopes. Rock Mech. Rock Eng. 2007, 40, 349–362. [Google Scholar] [CrossRef]
  26. Pant, S.R.; Adhikary, D.P.; Dyskin, A.V. Slope failure in a foliated rock mass with non-uniform joint spacing: A comparison between numerical and centrifuge model results. Rock Mech. Rock Eng. 2015, 48, 403–407. [Google Scholar] [CrossRef]
  27. Bray, J.W.; Goodman, R.E. The theory of base friction models. Int. J. Rock Mech. Min. Sci. Geomech. Abstr. 1981, 18, 453–468. [Google Scholar] [CrossRef]
  28. Aydan, Ö.; Shimizu, Y.; Ichikawa, Y. The effective failure modes and stability of slopes in rock mass with two discontinuity sets. Rock Mech. Rock Eng. 1989, 22, 163–188. [Google Scholar] [CrossRef]
  29. Wong, R.H.C.; Chiu, M.A. Study on failure mechanism of toppling by physical model testing. In Proceedings of the 38th U.S. Rock Mechanics Symposium, Washington, DC, USA, 7–10 July 2001; pp. 989–995. [Google Scholar]
  30. Aydan, Ö.; Kawamoto, T. The stability of slopes and underground openings against flexural toppling and their stabilisation. Rock Mech. Rock Eng. 1992, 25, 143–165. [Google Scholar] [CrossRef]
  31. Adachi, T.; Ohnishi, Z.; Arai, K. Investigation of toppling slope failure at Route 305 in Japan. In Proceedings of the 7th ISRM Congress, Aachen, Germany, 16–20 September 1991. [Google Scholar]
  32. Tu, G.; Deng, H.; Li, M. Development and evolution of deep-seated toppling landslide by rapid river downcutting. Bull. Eng. Geol. Environ. 2023, 82, 185. [Google Scholar] [CrossRef]
  33. Li, Q.; Shi, W.; Yu, L.; Yang, C.; Zhu, C. Test evaluation of slope deformation and fissure network with different surface shapes under the action of underground mining. Bull. Eng. Geol. Environ. 2024, 83, 477. [Google Scholar] [CrossRef]
  34. Ning, Y.; Tang, H.; Zhang, B.; Ding, B.; Shen, P.; Xia, D.; Chen, H. Evolution process and failure mechanism of a deep-seated toppling slope in the Lancang River Basin. Chin. J. Rock Mech. Eng. 2021, 40, 2199–2213. [Google Scholar]
  35. Zhang, L.; Chen, Z.; Nian, G.; Bao, M.; Zhou, Z. Base friction testing methodology for the deformation of rock masses caused by mining in an open-pit slope. Measurement 2023, 206, 112235. [Google Scholar] [CrossRef]
  36. Wang, R.; Zheng, Y.; Chen, C.; Zhang, W. Theoretical and numerical analysis of flexural toppling failure in soft-hard interbedded anti-dip rock slopes. Eng. Geol. 2023, 312, 106923. [Google Scholar] [CrossRef]
  37. Huang, D.; Ma, H.; Huang, R. Deep-seated toppling deformations of rock slopes in western China. Landslides 2022, 19, 809–827. [Google Scholar] [CrossRef]
  38. Ning, Y.; Tang, H.; Wang, F.; Zhang, G. Sensitivity analysis of toppling deformation for interbedded anti-inclined rock slopes based on the Grey relation method. Bull. Eng. Geol. Environ. 2019, 78, 6017–6032. [Google Scholar] [CrossRef]
  39. Ning, Y.; Zhang, G.; Tang, H.; Shen, W.; Shen, P. Process analysis of toppling failure on anti-dip rock slopes under seismic load in southwest China. Rock Mech. Rock Eng. 2019, 52, 4439–4455. [Google Scholar] [CrossRef]
  40. Wang, S.N.; Xu, W.Y.; Shi, C.; Chen, H.J. Run-out prediction and failure mechanism analysis of the Zhenggang deposit in southwestern China. Landslides 2017, 14, 719–726. [Google Scholar] [CrossRef]
  41. Lv, J.; Shan, Z.; Yin, F.; Chen, L.; Dong, M.; Zhang, F. Deformation Characteristics and Stability Prediction of Mala Landslide at Miaowei Hydropower Station under Hydrodynamic Action. Water 2023, 15, 3942. [Google Scholar] [CrossRef]
  42. Mai, Z.; Hu, X.; Li, L.; Hou, J. Deformation characteristics and mechanism of Mala paleo-landslide during the Miaowei reservoir initial impoundment period. Sci. Rep. 2024, 14, 5059. [Google Scholar] [CrossRef]
  43. Ning, Y.; Tang, H.; Zhang, B.; Shen, P.; Zhang, G.; Xia, D. Investigation of the rock similar material proportion based on orthogonal design and its application in base friction physical model tests. Rock and Soil Mech. 2020, 41, 2009–2020. [Google Scholar]
  44. Fumagalli, E. Geomechanical models of dam foundation. In Proceedings of the International Colloquium on Physical and Geomechanical Models, Bergamo, Italy, 29–30 March 1979. [Google Scholar]
  45. Zhu, W.; Li, Y.; Li, S.; Wang, S.; Zhang, Q. Quasi-three-dimensional physical model tests on a cavern complex under high in-situ stresses. Int. J. Rock Mech. Min. Sci. 2011, 48, 199–209. [Google Scholar]
  46. Ning, Y.; Tang, H.; Peng, J.; Shen, Y.; Smith, J.V.; Ding, T. Study of the initiating and resisting mechanisms of toppling deformations in anti-inclined rock slopes. Bull. Eng. Geol. Environ. 2025, 84, 167. [Google Scholar] [CrossRef]
  47. Smith, J.V. Self-stabilization of toppling and hillside creep in layered rocks. Eng. Geol. 2015, 196, 139–149. [Google Scholar] [CrossRef]
  48. Ning, Y.; Tang, H.; Peng, J.; Shen, Y.; Smith, J.V.; Zhang, B. A stability evaluation method for deep-seated toppling in the upper Lancang River, Southwestern China. J. Rock Mech. Geotech. Eng. 2024, 16, 2388–2410. [Google Scholar] [CrossRef]
Figure 1. Base friction test apparatus: (a) Side view of the apparatus; (b) Panoramic photograph of the apparatus; (c) Schematic diagram of the apparatus.
Applsci 15 07727 g001
Figure 2. Results of dynamic friction coefficient tests.
Applsci 15 07727 g002
Figure 3. Physical model of the slope: (a) Geometry and structural features of the slope model; (b) Location of the monitoring point within the slope model (a-1, b-1, b-2, b-3, c-1, d-1, d-2, d-3 and e are the names of the monitoring points. b-2 and d-2, b-3 and d-3 are located at the same depth along the rock layer direction).
Applsci 15 07727 g003
Figure 4. Deformation and failure process of the slope model (ai) are the 80 s, 130 s, 180 s, 230 s, 285 s, 335 s, 380 s, 475 s and 490 s after the operation of the conveyor belt).
Applsci 15 07727 g004
Figure 5. Horizontal displacement contour map of the slope model (ai) are the 80 s, 130 s, 180 s, 230 s, 285 s, 335 s, 380 s, 475 s and 490 s after the operation of the conveyor belt, unit: mm).
Applsci 15 07727 g005
Figure 6. Vertical displacement contour map of the slope model (ai) are the 80 s, 130 s, 180 s, 230 s, 285 s, 335 s, 380 s, 475 s and 490 s after the operation of the conveyor belt, unit: mm).
Applsci 15 07727 g006
Figure 7. Horizontal displacement of the monitoring points in the slope model: (a) Displacement of b and d series monitoring points; (b) Slope surface displacement at different elevations. The location of each monitoring point is presented in Figure 3b.
Applsci 15 07727 g007
Figure 8. Velocity vector and velocity contour map of the slope model (ai) are the 80 s, 130 s, 180 s, 230 s, 285 s, 335 s, 380 s, 475 s and 490 s after the operation of the conveyor belt, unit: ×10−4 m/s).
Applsci 15 07727 g008
Figure 9. Average velocity of the slope model versus the operation time of the base friction apparatus.
Applsci 15 07727 g009
Figure 10. Deformation features of interbedded toppling events: (a) Typical deformation features of interbedded rock layers within a slope. Hard rock exhibits brittle fracture, while soft rock shows ductile bending deformation. The white dotted lines denote rock layers. The red dotted lines denote tensile fractures. The red arrows denote the direction of the tensile stress; (b) A typical toppling tends toward self-stabilization. The red dotted lines denote the toppling hinge surface. The white dotted lines denote rock layers.
Applsci 15 07727 g010
Figure 11. Illustration of toppling at different periods: (a) Rock layers without deflection; (b) Rock layers with deflection; (c) Rock layers achieve self-stabilization; (d) Layer symmetry configuration in the physical model test.
Applsci 15 07727 g011
Figure 12. Failure features of interbedded toppling events: (a) A typical toppling-induced fracture zone within a slope. The white dotted lines denote rock layers. The red dotted lines denote the boundary of the toppling fracture zone; (b) The K73 rockslide, a typical landslide developed from a deep-seated toppling deformation, and the failure surface was formed based on fracture zones above the THS. The red dotted line denotes the boundary of the K73 rockslide.
Applsci 15 07727 g012
Figure 13. Evolution process of toppling in interbedded anti-inclined rock slopes: (a) Initial shearing stage; (b,c) Free rotation stage; (d) Creep stage; (e,f) Progressive failure stage. The blue arrows denote the direction of the interlayer shear dislocation. The straight red arrows denote the direction of the tensile stress within the rock column. The curved red arrows denote the movement trend of the rock column. The yellow zone denotes the landslide deposit.
Applsci 15 07727 g013
Figure 14. Failure characteristics of the slope model and the K73 rockslide. The red dotted lines denote rock layers.
Applsci 15 07727 g014
Table 1. Parameters of the intact rock and similar materials.
Material TypeDensity (kg/m3)Elastic Modulus (GPa)Cohesion (Mpa)Internal Friction Angle (°)Tensile Strength (MPa)
Phyllite27006.03.040.05.0
Target value 127002.9 × 10−31.45 × 10−340.02.4 × 10−3
Similar material 126364.8 × 10−32.82 × 10−343.34.5 × 10−3
Metasandstone260011.07.045.09.0
Target value 226005.3 ×10−33.4 × 10−345.04.3 × 10−3
Similar material 224806.7 × 10−34.8 × 10−348.76.1 × 10−3
Table 2. Parameters of the discontinuities and similar materials.
Material TypeCohesion (Pa)Internal Friction Angle (°)
Rock layer1.0 × 10520
Target value 348.420
Similar material 368.718.8
Cross joint3.0 × 10530
Target value 3145.230
Similar material 4178.624.3
Table 3. Error analysis of monitoring results.
Monitoring PointDisplacement (mm)Velocity (m/s)
Monitoring ValueTrue ValueRelative Error (%)Monitoring ValueTrue ValueRelative Error (%)
a-1221.3225.6−1.95.8 × 10−55.5 × 10−56.1
b-1375.2391.7−4.26.9 × 10−47.5 × 10⁻⁴−7.7
c-1275.8286.5−3.710.3 × 10−410.8 × 10⁻⁴−4.6
d-1158.6164.8−3.88.5 × 10−49.0 × 10⁻⁴−5.0
e10.711.1−4.01.5 × 10−41.4 × 10−48.0
Disclaimer/Publisher’s Note: The statements, opinions and data contained in all publications are solely those of the individual author(s) and contributor(s) and not of MDPI and/or the editor(s). MDPI and/or the editor(s) disclaim responsibility for any injury to people or property resulting from any ideas, methods, instructions or products referred to in the content.

