1. Introduction
We analyze whether a link-centric approach can improve upon a node-centric methodology for industrial structure analysis. Industrial structure analysis traditionally defines key industries by utilizing node centrality indices within a network-based approach. The detailed indices used to assess node centrality include degree centrality, betweenness centrality, and closeness centrality. However, traditional network centrality indices are limited in their ability to fully capture the influence and position of each node within the whole integrated network [
1]. To address these limitations, proposals have been made for the use of weighted centrality, measured by applying weighted values to the overall network [
2,
3,
4,
5,
6,
7]. This study presumes that these studies are fundamentally limited by their node-centric analysis and attempts a link-centric approach to industrial structure analysis.
To understand changes in individual industries driven by interdependence, this study proposes a methodology that approaches the network from an inter-industry perspective, focusing on the path of nodes in the transportation and logistics industry through a link-centric approach. The present research defines an ecosystem centered on the transportation and logistics industry, reflecting the interdependence among all industries based on the proposed methodology. Based on this, this study provides a clue for understanding the industrial ecosystem from a dynamic perspective by analyzing how changes in a specific industry are spread to others.
The methodology so developed was validated by applying it to Korean cases using the I/O table. To this end, an input–output network was constructed using the I/O table provided by the Bank of Korea. This I/O table organizes the production input structure and production distribution structure among industries into a matrix, making it possible to understand inter-industry transactions of goods and services. This basic structure is converted into a network based on the total transaction volume between the “transportation and logistics industry (inland, maritime and air transport services)” and all industries, and defines an ecosystem for the transportation and logistics industry after deriving nodes affecting it through link analysis. It is expected that this process will contribute to understanding how the transportation and logistics industry is linked to other industries in the overall industrial network and to the development of the industrial ecosystem from a flow perspective.
This study is composed as follows: First, it reviews existing studies related to industrial ecosystems using network analysis. Second, it presents a link-based network analysis methodology. Third, it presents the results of a comparative analysis of the derived important nodes in the transportation and logistics industry and the existing node-centric methodology, using Korean cases. Lastly, it defines the transportation and logistics industry ecosystem based on the derived results and discusses a new perspective on ecosystem analysis.
2. Literature Review
An industrial ecosystem is defined as the various subjects within a specific industry (businesses, organizations, consumers, governments, etc.) and the interaction network formed by them. It is described as a complex system that promotes innovation and sustainability through cooperation and competition between the subjects [
8]. To establish a successful ecosystem, it is important to understand the interdependence among cooperators and effectively monitor business cooperation based on this understanding [
9]. Input–Output (I/O) analysis is useful for identifying such interdependencies by showing how outputs from one industry serve as inputs for another. It helps reveal the structure of cooperation within an ecosystem and assess the economic ripple effects of each sector.
Christ (1955) provided one of the earliest and most comprehensive reviews of input–output analysis, laying the theoretical foundation for understanding inter-industry relationships through quantitative models [
10]. Duchin (1992) extended the application of I/O analysis to industrial ecology, demonstrating how economic activities across industries are linked to environmental impacts, particularly in terms of resource use and emissions [
11]. Kwak et al. (2005) applied I/O analysis to Korea’s maritime industry to evaluate its forward and backward linkages, illustrating how a single industry interacts with others and contributes to the national economy [
12]. Xing et al. (2011) analyzed China’s ICT industry using I/O data to measure the degree of industrial integration and convergence, highlighting how structural changes in one sector influence the broader ecosystem [
13].
The SCOR (Supply Chain Operations Reference model) research group argued 25 years ago that more attention should be paid to processes rather than objects [
14].
In practice, research using network analysis is predominant in the field of industrial ecosystem studies [
15,
16,
17,
18,
19]. In particular, network analysis is a key tool in understanding relationships and structural patterns in social sciences [
20,
21,
22]. The node centrality indexes, such as degree centrality, betweenness centrality, and closeness centrality, have frequently been used to understand network patterns. Christakis and Fowler (2007) discovered, using degree centrality and betweenness centrality in network analysis, that psychological and behavioral characteristics, such as obesity, smoking, and happiness, tend to be contagious [
23]. There is also research that assesses network connectivity and information paths in the IT industry using network density, clustering coefficients, and information centrality, arguing that the role of hub businesses in the platform ecosystem contributes to the success of the entire ecosystem [
24]. Furthermore, there is a case explaining that a node (a hospital) with a high frequency of cooperation in a hospital network, identified through betweenness centrality, could improve the quality of patient treatment; and that a patient network could provide a path through which diseases are spread and establish strategies for blocking it [
25]. The closeness centrality index, which disseminates information in emergencies, is used in the safety management field [
26]. The role and importance of major nodes (businesses) were assessed by modeling trade relationships between major businesses in the semiconductor equipment industry supply chain into a network, using degree centrality and betweenness centrality [
27]. It was argued, through social network analysis, that promoting business relationships between various enterprises is crucial, as the inter-enterprise network structure plays an important role in the sustainability and resilience of the local industrial ecosystem [
28]. However, research focused on node centrality fails to sufficiently reflect the overall network structure or the characteristics of interdependence when assessing the importance of nodes from a localized perspective [
29].
To address the limitations of node centrality research in a specific network, Fiedler proposed a methodology for assessing the network connectivity by mathematically analyzing synchronization and connectivity based on the algebraic connectivity concept of graphs and spectral theory [
30]. Furthermore, studies have been conducted to construct an inter-node adjacency matrix centered on links and analyze interdependent networks. Numerous studies have quantitatively analyzed the influence over each node by updating the PageRank, hub, and authority methodologies [
31,
32,
33,
34,
35,
36,
37]. However, unlike traditional social or technology networks, an industrial structure network is characterized by inter-industry transactions and interdependence. Therefore, this study intends to systematically define an industrial ecosystem by analyzing in depth the flow and paths of interaction between industries, considering the characteristics of the industrial structure network. This presumes that the essence of cooperation and interaction between industries can be more clearly understood by redefining the transportation and logistics industry ecosystem, based on the results of link-centered analysis.
3. Methods
The methodology that we used is illustrated in
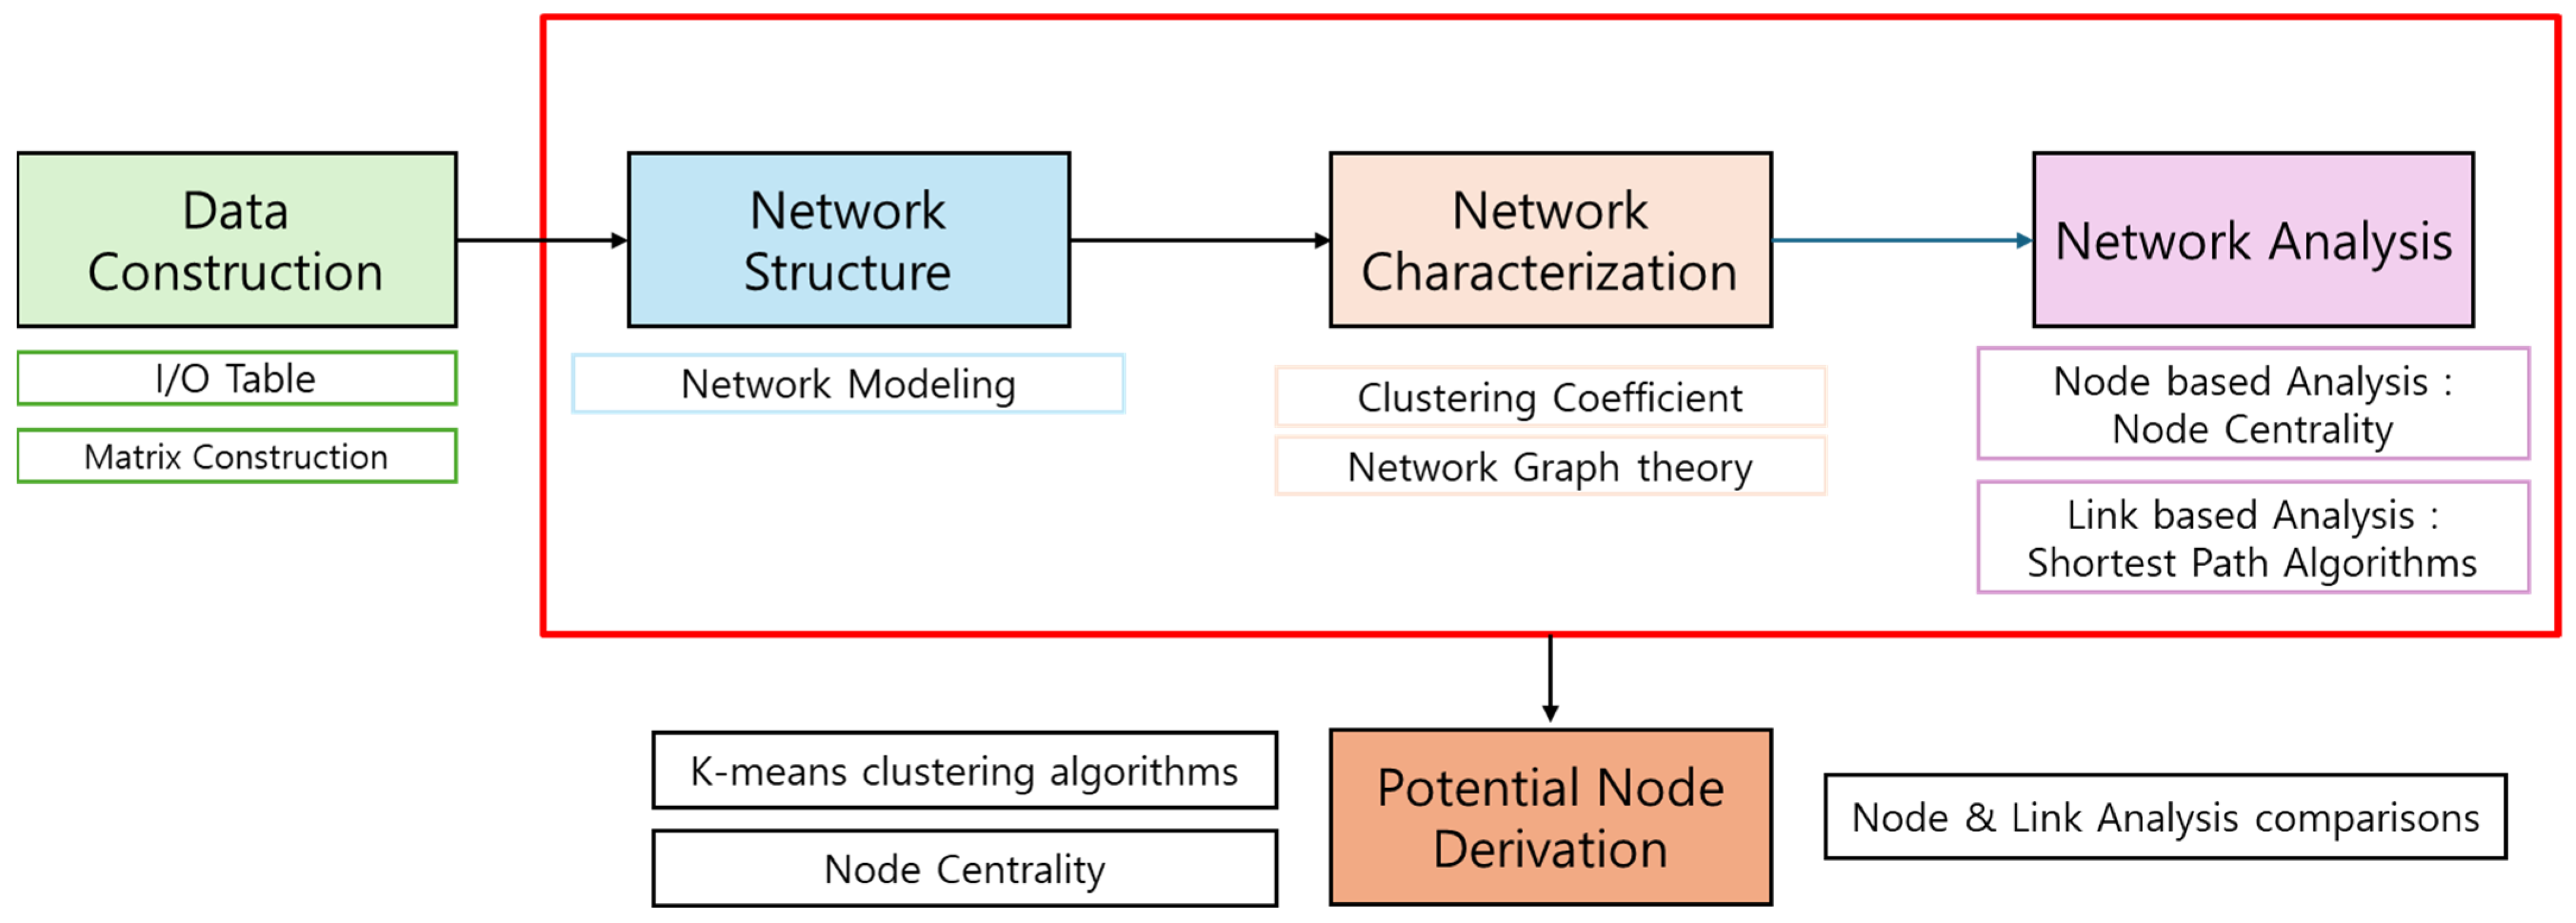
Figure 1. In the data construction phase, a basic network structure was established, represented by inter-industry transaction volume matrices among industries using the I/O table. The network analysis phase consisted of the following stages: network modeling, network definition, and analysis through indices. In the network modeling phase, a set of nodes and edges was selected based on a volume matrix based on I/O tables. In the network defining phase, network analysis was conducted based on the clustering coefficient. In the final phase, we derived and compared latent nodes based on the concept of shortest distance through the traditional centrality index and the link analysis that we proposed.
Additionally, the industrial ecosystem was defined by inducing the internode relationships, based on K-cluster analysis, derived centrality indices, and a comparative analysis of nodes and links. The implementation of the methodology was based on Korean case studies, which were the subject of this study.
3.1. Data Construction and Network Structure
The basic data used in the network analysis were the I/O table, which represents the transaction volume among industries. In Korea, the Bank of Korea provides the I/O table on a regular basis. The I/O table is the statistical data prepared to systematically analyze the trade paths between industries, and it numerically represents the input–output relationships between industries. The main items include production and input by product, added value, and inter-industry transaction volumes. Rows represent the volume of products or services produced by a specific industry and input to other industries, and columns represent the inputs that a specific industry consumes from other industries for production. This study organized a matrix for the total transaction volume (based on the basic price) between industries into a data frame, and constructed a network by setting industries as nodes, the relationships between input and demand as links, and the total trade volume as weights. In constructing the network, inter-industry relationships with a total transaction volume of zero were excluded, as they were considered to represent no actual economic exchange. This was done to enhance analytical accuracy and the validity of network interpretation.
3.2. Network Description
A graph type for Korea’s industrial network is defined by deriving the clustering coefficient. Watts and Strogatz (1998) introduced the concept of the clustering coefficient to quantify the extent to which triangular structures are formed within a network [
38]. The clustering coefficient is derived as specified in Formulas 1 and 2. The purpose of deriving the clustering coefficient is to understand the structural characteristics of the industrial network. It quantitatively assesses the degree of network clustering and indicates how closely the neighbors of a given node are interconnected.
is calculated by averaging the clustering coefficients of all nodes in a network.
evaluates the extent to which the neighbors of a specific node
are interconnected. It is calculated by dividing the actual number of connected edges by the connected degree, where
is the out degree of
and
means the number of triangles containing
. A higher
value indicates that the neighbors around that node are more closely connected.
= Out degree of node
Number of directed triangles formed among the out-neighbors of node
E = Set of directed edges in the network
= Total number of nodes in the network
= A directed edge from node to node
By deriving clustering coefficients, this study aimed to explore whether the structural properties of industrial networks align with those of well known network models, including small-world and scale-free networks.
3.3. Network Analysis
After understanding the structural characteristics of the overall network, the influence of specific nodes on the overall network was assessed using node centrality. We quantitatively analyzed the position and influence of nodes within the network using node centrality indicators and explained the path and interaction structure of the relevant industry by applying link-based analysis. We evaluated the influence of the transportation and logistics industry within Korea’s industrial network.
3.3.1. Node Analysis
Degree centrality, introduced by Freeman (1979), is based on the concept that the degree of a focal node represents the number of adjacent nodes in the network [
39]. We applied a method that assigns varying weights to the number of connections originating from a node. In other words, a weighted degree centrality is measured by applying weights to the network based on the average number of transitions in the desired data. It reflects the number of direct ties a node maintains with others, thereby indicating its immediate prominence and potential influence within the network structure.
The closeness centrality calculates the closeness centrality score for a given node by summing the distances to all other nodes, based on the shortest paths between all node pairs, and then reversing the result. A higher closeness centrality score indicates superior accessibility to other nodes within the network. It indicates how easily and quickly a node can reach all other nodes in the network.
Betweenness centrality, introduced by JM Anthonisse (1971) [
40] and LC Freeman (1977) [
41], is calculated based on the shortest path distances. It represents, as a ratio, how often a node appears on the shortest paths between all pairs of nodes. In other words, this index measures the extent to which a node influences the flow within the entire graph.
3.3.2. Link Analysis
In this phase, a link-based network analysis methodology was proposed to analyze interactions between a specific node and other nodes. The relationships between the forward and backward transportation and logistics industries (excluding those with zero transaction volumes) were quantified using Dijkstra’s algorithm, the shortest-path algorithm based on links. This approach allows for analyzing not just node connections but also the significance of specific paths within the network, using these numerical values.
We defined the distance as the inverse of the total inter-industry transaction volume in the network structure and used it as the weight. To make these weights compatible with Dijkstra’s algorithm, which determines the shortest path by minimizing the sum of edge weights, we transformed the transaction volumes into distance-like values by taking their inverse
This transformation allows edges with higher transaction volumes to be interpreted as shorter distances, thereby increasing their priority in shortest-path computation. The shortest path between two industries was calculated using networkx.dijkstra_path, which applies Dijkstra’s algorithm based on edge weights. In other words, distances were defined as the inverse of transaction volumes
and a priority queue was used to iteratively update the shortest known paths. This enabled efficient identification of economically significant routes within the network.
A priority queue that includes all vertices is created by setting a specific node as the starting vertex and initializing a distance array. Then, the priority of the queue is determined based on the initialized distances, and the shortest-distance vertex (u) is selected from the start vertex in the priority queue. The conditions for all vertices (v) neighboring the shortest-distance vertex (u) can be verified through Formula (7).
A vertex with an updated distance value is reinserted into the priority queue, ensuring the distance value is kept up to date. Finally, if all vertices have been visited or the priority queue is empty, the process is terminated, and the path, distance, etc., are derived. As mentioned, link-based analysis not only evaluates the connectivity between nodes but also provides the advantage of quantitatively analyzing the relative importance of a specific path within the network.
3.4. Potential Node Derivation and Definition of Industrial Ecosystem
After deriving the shortest path from a specific node, the industrial ecosystem is defined using the K-means clustering algorithm (
Table 1). The analysis results based on the shortest path reflect the structural characteristics of the related industries, and the grouped results allow for a clear understanding of the role each node plays within the entire ecosystem. The K-means clustering algorithm is an unsupervised learning algorithm that is effective in grouping a given dataset into K number of clusters [
42].
In this study, K was set to 3, and related industries were grouped into primary, secondary, and tertiary categories. The silhouette analysis showed that the silhouette score was high at 0.704 when the number of clusters was set to 3. This suggests that each cluster was well-formed and clearly separated, indicating that k = 3 effectively captured the structure of the data.
This is because each data point can be assigned to the closest cluster by repeatedly adjusting the cluster centers, based on the shortest-distance value. As a result, the derived potential nodes can be assigned to primary, secondary, and tertiary groups, composed of industries with high correlation. Each group is defined as an industrial group performing a specific role within the industrial ecosystem.
4. Results
The industrial network set in this study was based on the I/O table provided by the Bank of Korea. The Bank of Korea, as the central bank of Korea, releases the I/O table approximately every five years to allow for the quantitative analysis of inter-industry relationships. We constructed the data based on the 2020 I/O table, which included industry classifications in 77 medium categories and 170 small categories (see
Appendix A). In this study, we used the small aggregated product categories (170 sectors) from the input–output tables provided by the Bank of Korea to ensure a detailed and fine-grained analysis of inter-industry relationships. The final raw data were developed based on the total inter-industry transaction volumes, as shown in
Table 2.
They were set as a weighted graph as they was based on inter-industry transactions. The clustering coefficient was 0.90, which is high and indicates a strong level of connectivity between a specific industry and its neighboring industries. In other words, Korea’s industrial structure network can be considered a small-world network, characterized by a high level of interdependence among industries [
38]. Examples of small-world networks include academic and informational, economic, biological, technological, and social networks.
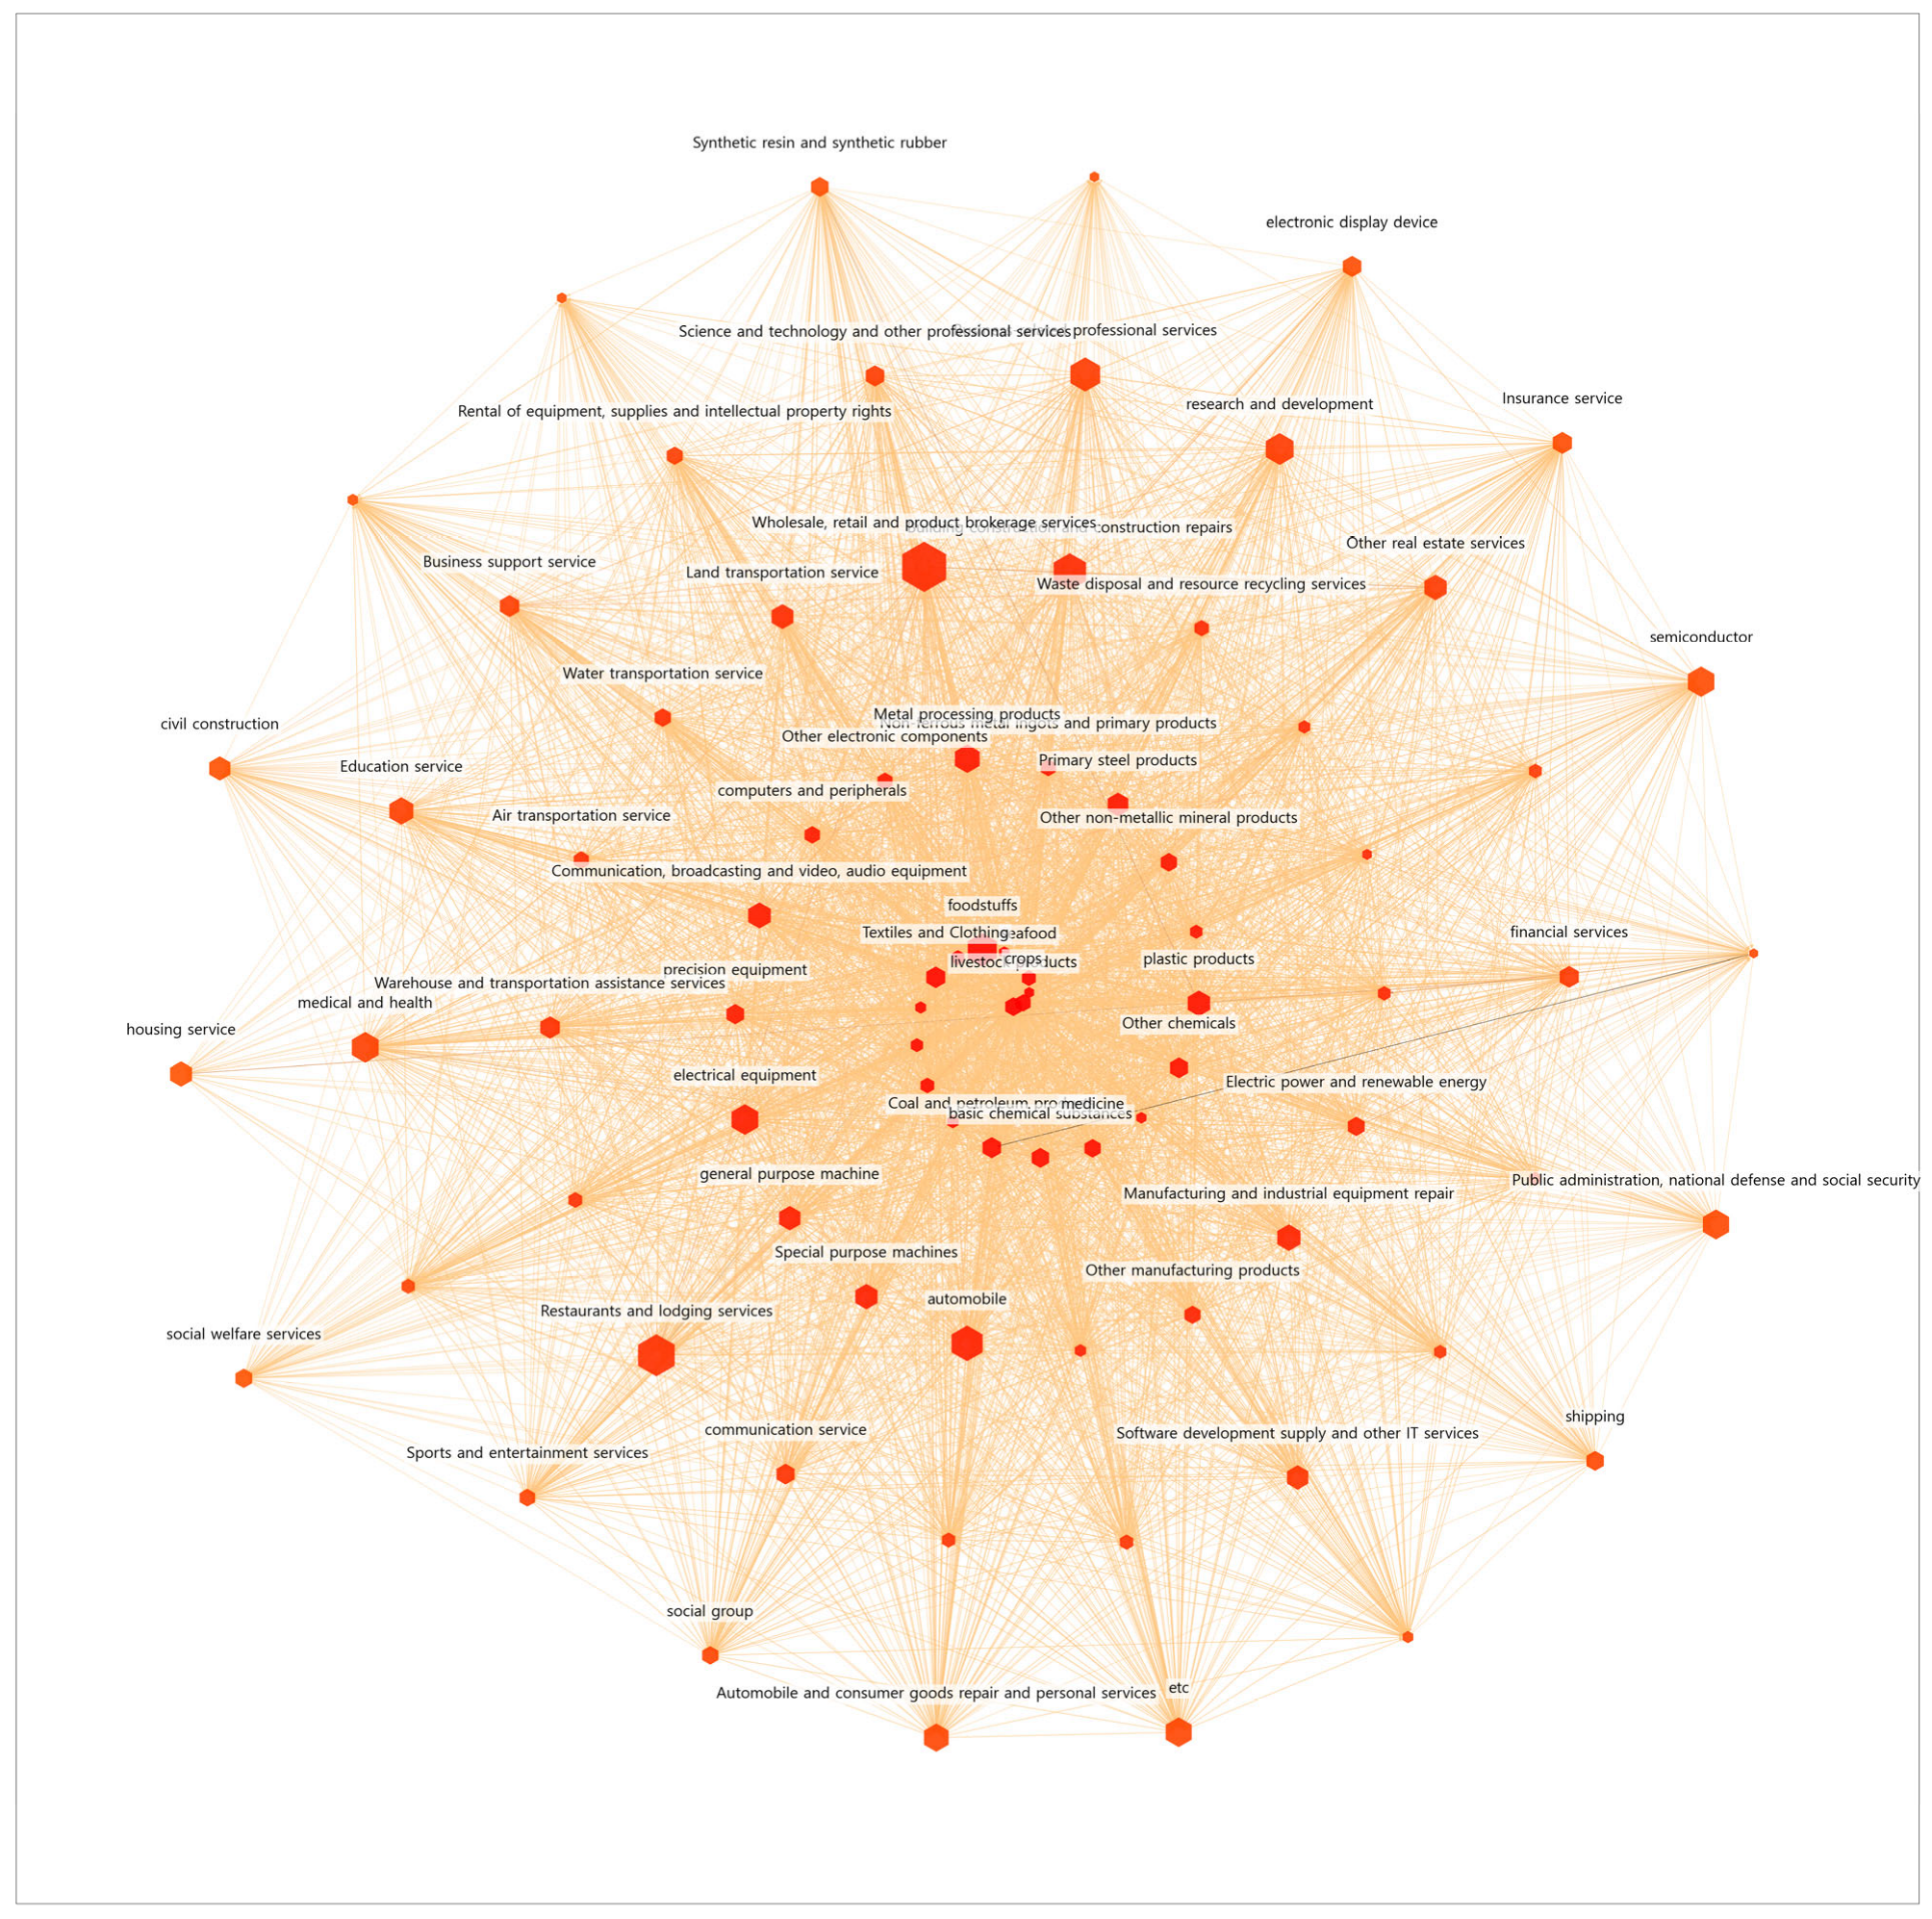
Figure 2 shows the result of network visualization with a subgraph generated by setting the following as specific nodes, which can be considered part of the transportation and logistics industry: land transport services, water transport services, air transport services, warehousing and transport support services, and postal and courier services. It can be considered that the small-world network maintains high clustering both within the overall network and its subcomponents, following a complex hierarchical structure.
Table 3 shows the weighted degree centralities of each industry for the relevant network in descending order. Industries focused on distribution, manufacturing, construction, and resources, such as wholesale and retail services, metal processing, building construction, and coal and petroleum products, showed high values of weighted degree centrality. This suggests that these industries form significant trading relationships within the overall network. On the other hand, these industries showed low values of betweenness centrality, indicating that they are concentrated in specific areas of the network. Their role as intermediaries in information transmission or resource paths may be relatively limited.
Table 4 summarizes the top 10 paths and shortest distances of the transportation and logistics industry, based on link-path analysis, in ascending order of path length. This clearly shows the structure of the forward and backward paths of the transportation and logistics industry. In fact, coal and petroleum products are connected through the shortest path in the transportation industry, suggesting that energy resources for transportation services are key related industries. Next, the indirectly related industries, such as wholesale and retail business, commodity brokerage, financial services, and telecommunication services, are connected through relatively longer paths than the resource-centered industries. However, these industries interact with nodes through intermediate steps. In particular, high-tech industries, such as semiconductors, are connected through the longest path in the transportation and logistics industry network. This indicates that advanced technology and transportation and logistics services are becoming increasingly digitalized and dependent on technology.
Table 5 shows the grouping results based on total distance, with K set to 3. The primary industries identified include coal and petroleum products, as well as coal, crude, and natural gas. Electrical equipment, categorized under the primary industries, has a relatively low weighted degree centrality of 1 × 10
8. However, it exhibits relatively high values at 4 × 10
4 and 6 × 10
−4. This indicates that electronic equipment serves as an intermediary that facilitates the efficient flow of information and resources across the overall network, despite its relatively small volume of direct transactions. Thus, electrical equipment can be regarded as a resource industry of primary importance within the transportation and logistics industry. The secondary industries identified include telecommunication services, electricity, and new renewable energy. Lastly, the tertiary industries, such as scientific technology and other power source services, information services, and semiconductors, were defined as derivative industries. The tertiary industries, characterized by relatively high betweenness centrality, play an important intermediary role within the overall network and contribute indirectly to the industrial ecosystem. However, they can be defined as key industries with significant ripple effects in the transportation and logistics industry ecosystem.
Figure 3 presents a visualization of the transportation and logistics industry grouped with its related industries into primary, secondary, and tertiary industries. The primary industries supply the transportation and logistics services with essential basic resources and show a direct and strong connection with the transportation and logistics industry. The secondary industries are composed of providers of intermediate goods and services that play a pivotal role in reinforcing the sustainability and efficiency of the transportation and logistics industry. The tertiary industries, while exhibiting slightly weaker connectivity compared with the primary industries, contribute indirectly and can be described as a node group driving the expansion and innovation of the transportation and logistics network.
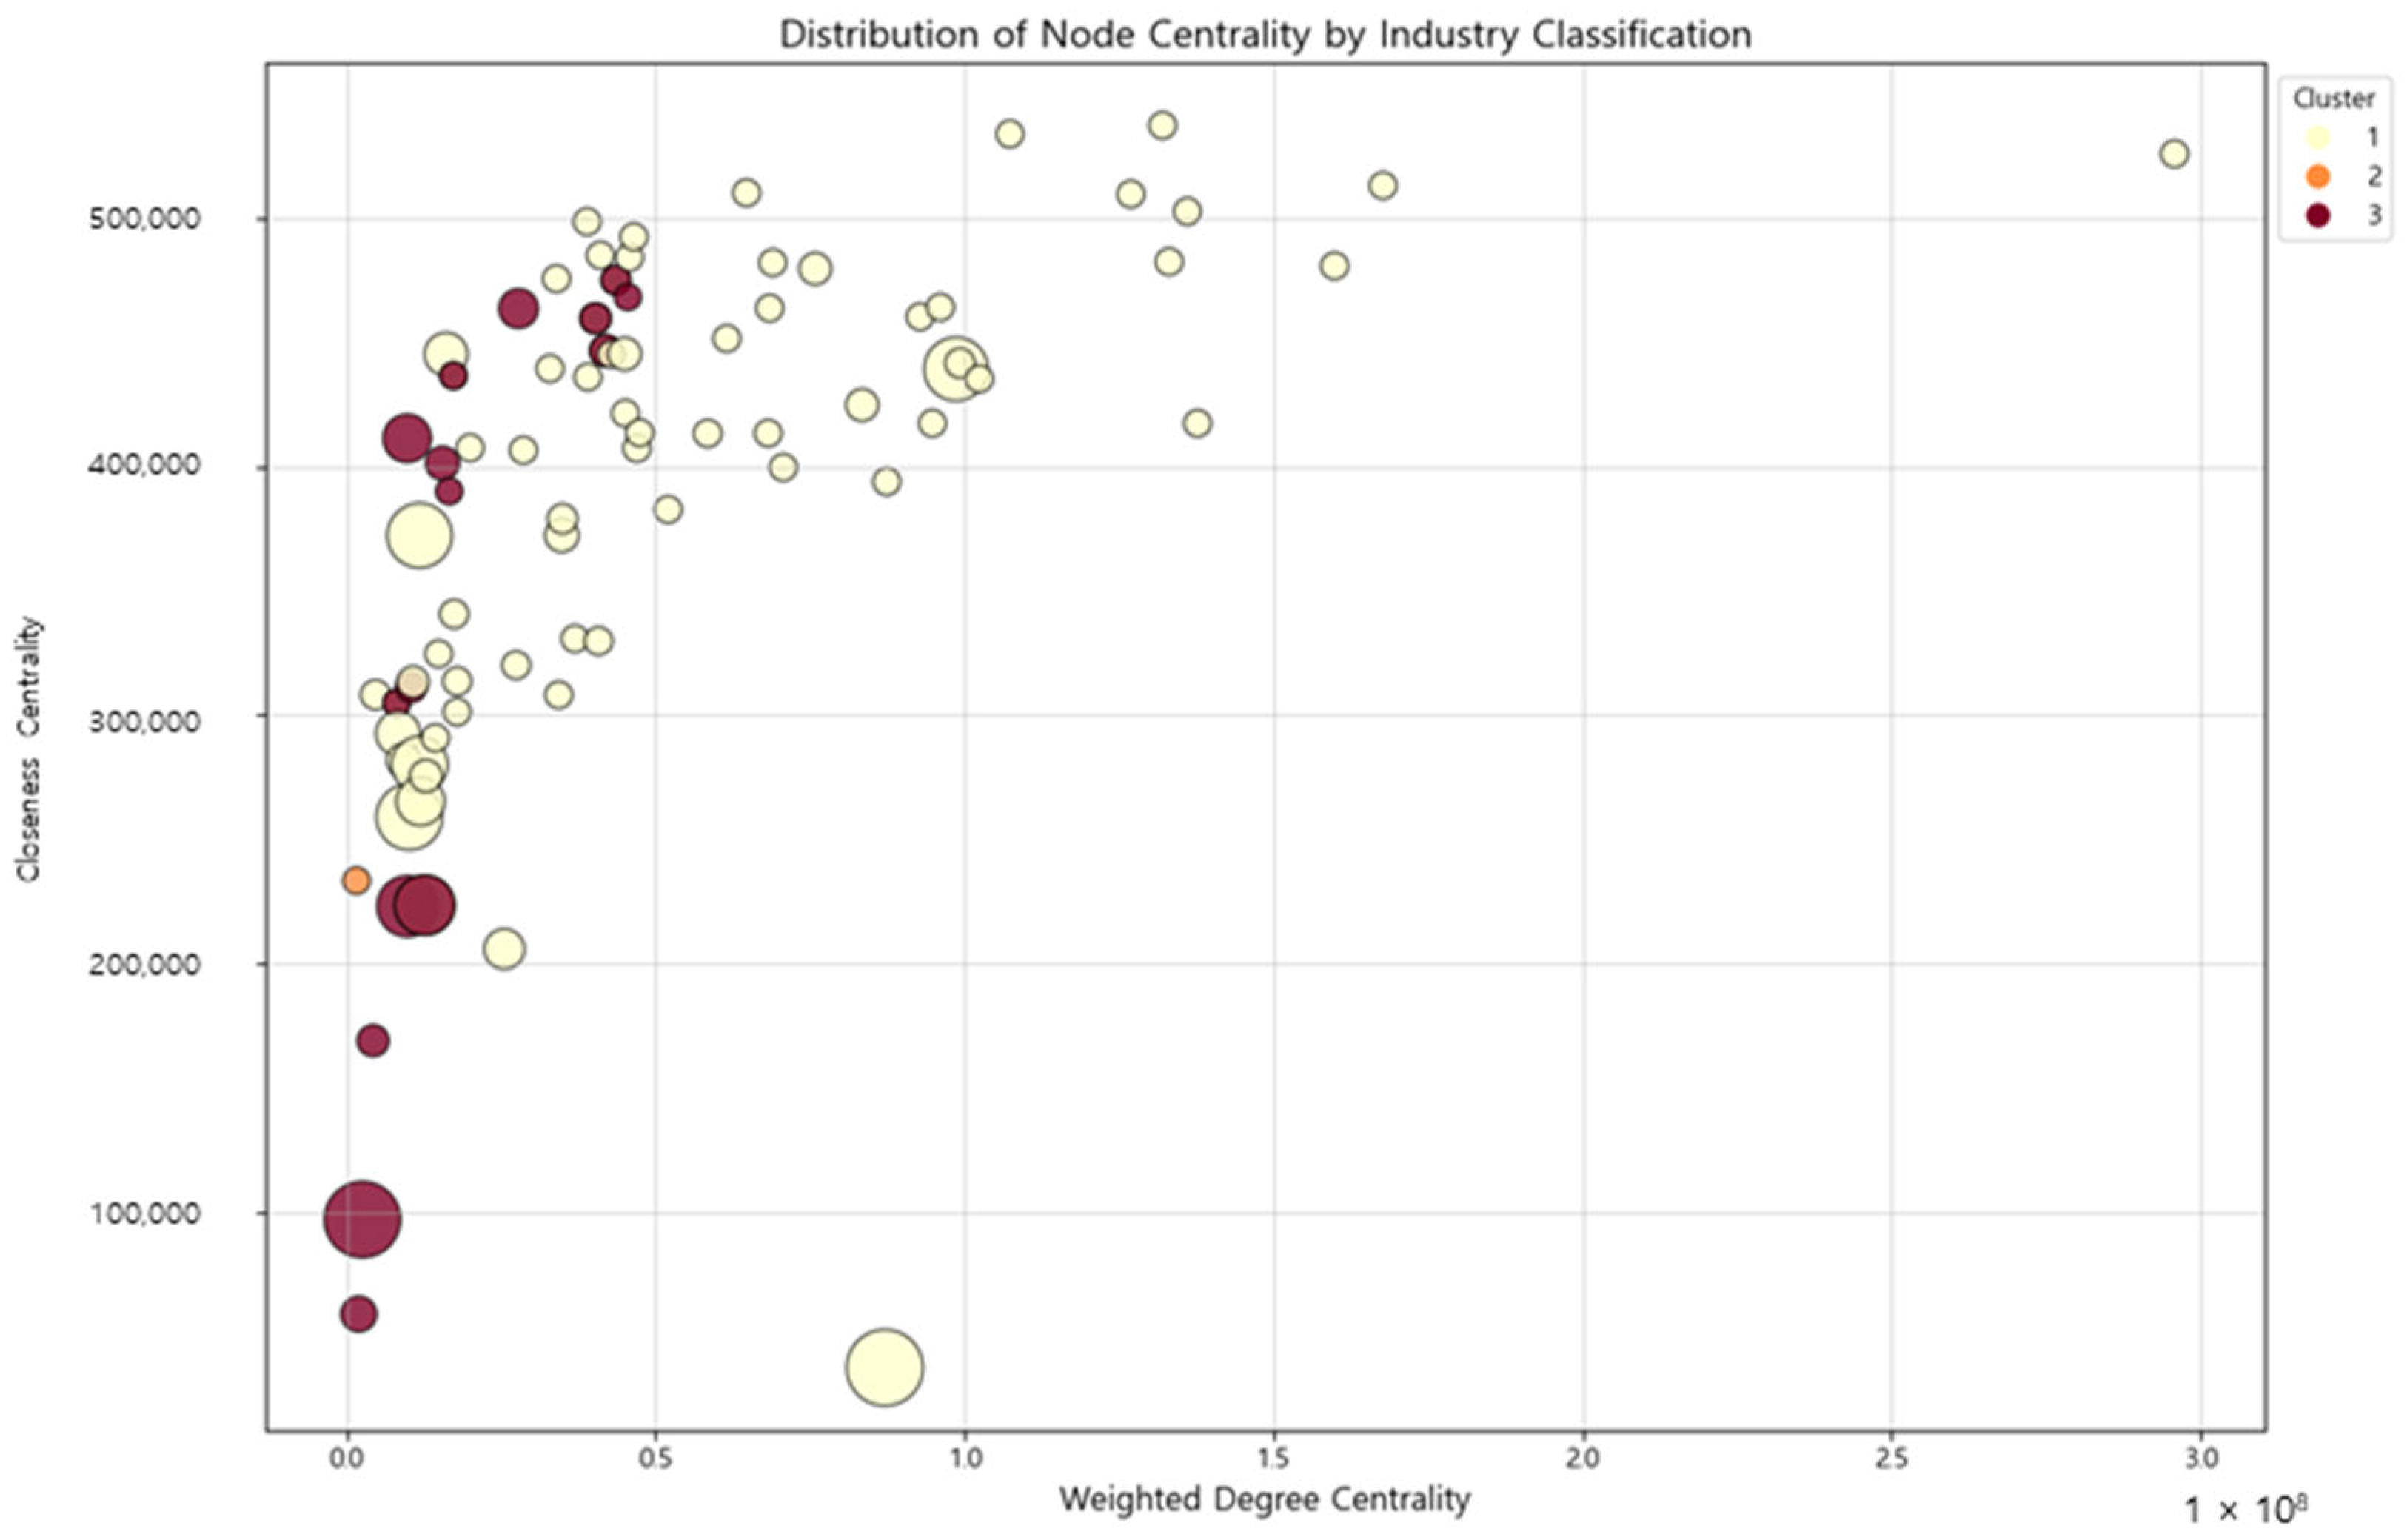
Figure 4 shows the distribution of node centrality metrics by industry classification. The X-axis represents weighted degree centrality, indicating the strength of connections for each node. The Y-axis represents closeness centrality, showing the accessibility of each node within the network. The size of the points reflects betweenness centrality and the colors represent industries (1st: yellow, 2nd: orange, 3rd: red). Each cluster in the visualization corresponds to a distinct industrial group. For example, Primary industries include logistics and transportation, Secondary industries involve manufacturing and steel, and Tertiary industries cover areas such as IT services and finance.
The first industry exhibits a high weighted degree, indicating its role as a core resource-based node with strong network connections.
In contrast, the second industry displays low values across all centrality metrics, indicating its peripheral role or weak involvement in the network.
The third industry shows a higher betweenness value, positioning it as a key intermediary despite having a lower weighted degree compared with the first industry. In particular, some nodes in this industry exhibit high connectivity, highlighting their structural importance.
5. Discussion
We propose a link-based approach to input–output analysis that reveals structurally important industries overlooked by traditional centrality metrics. Our findings demonstrate that even industries with low centrality can play critical roles in resource and information flows, offering new insights into industrial structure and strategic policy planning.
We examined Korea’s industrial network from two perspectives: centrality analysis and link-based analysis. Through this, we identified that the transportation and logistics industry plays a central role in the industrial ecosystem through its essential linkage with resource-based industries. This approach highlights the diversity of network analysis and offers a crucial foundation for enhancing its policy applicability.
The node centrality index represents the influence of each industry (node) in the overall network. Among them, livestock products recorded the highest weighted degree centrality at 295,858,834. This means that the livestock products industry plays a key role as a connection link in the network. However, using only the node centrality index makes it difficult to fully capture the complexity and structural characteristics of the transportation and logistics industry within the industrial network.
The link-based network analysis of the transportation and logistics industry revealed that the shortest distance was between the coal and petroleum products industry and the coal, crude oil, and natural gas industries. This suggests that resource-based industries are primary industries playing an essential role in the transportation and logistics industry. Also, we derived shortest-path distances to define the transportation and logistics industry ecosystem through potential nodes. Accordingly, the related industries were classified into primary, secondary, and tertiary industries, and a new transportation and logistics industry ecosystem was defined through this process. In particular, we rediscovered an industry that had been overlooked by traditional centrality indicators and provided new insights into network research by demonstrating the importance of link-based analytics. For example, even though the electrical equipment industry shows low centrality across the overall network, it has been classified as a major industry according to link-based analysis. As a result, the electrical equipment industry has been identified as a link between key resource flows in the transportation and logistics industry ecosystem. This can facilitate the efficient flow of information and resources across the entire network, despite the low direct-connection strength.
These results could contribute to a re-evaluation of the strategic importance of the transportation and logistics industry network and the role of its related industries. The top 10 shortest paths presented in
Table 4 help explain that the transportation and logistics industry acts as an important connection link in production and supply networks. As stated above, link-based analysis uncovers the potential industries that may be overlooked in traditional centrality indices, and these industries serve as crucial pathways that other industries must pass through within the network.
6. Conclusions
This study performed a link-based analysis to identify potentially important industry nodes, going beyond the existing centrality analysis, within the transportation and logistics industry network. In particular, tertiary industries such as information services and IT services were identified as potential nodes and defined as essential industries with an indirect ripple effect on the transportation and logistics industry ecosystem. It is evident that the transportation and logistics industry is closely connected not only to resource-based industries but also to technology- and information-based industries.
This study emphasizes the indirect importance of tertiary industries, such as information services and IT services, in enhancing the network efficiency of the transportation and logistics industry by leveraging the strengths of link-based analysis. Such industries generate a ripple effect throughout the overall network, rather than playing a direct central role, and represent a collaborative relationship that promotes the development of the transportation and logistics industry. In particular, the information services and IT solutions provided by these industries will act as key elements in promoting the digitalization and innovation of the transportation and logistics industry ecosystem, further enhancing the efficiency of logistics networks.
The findings of this study confirmed the importance of potential industries that were overlooked in the existing centrality analysis of the transportation and logistics industry network, offering insights into new cooperation models and the establishment of strategic directions. Specifically, the link-based analysis suggests that the transportation and logistics industry can achieve higher efficiency and innovation through cooperation not only with existing resource-based industries but also with information- and technology-based industries. Such implications are expected to provide an important foundation for the development of the transportation and logistics industry at both political and practical levels.


