1. Introduction
The catering industry, a key sector impacting public health and quality of life, plays a vital role in driving consumption, stabilizing employment, and advancing urban economic development [
1]. According to the 2024 China Catering Industry Annual Report, the industry’s total revenue exceeded CNY 5 trillion in 2023, reaching CNY 528.9 billion—a year-on-year increase of 20.4%. Notably, digital services have significantly contributed to this growth. Data from the E-Commerce Department of the Ministry of Commerce show that online catering sales rose by 29.1% in 2023 compared to the previous year, with digital orders accounting for 22.2% of overall consumption [
2]. These trends underscore the increasing influence of digitalization in the catering sector.
Against the background of accelerated digital transformation, as an important contact point in human–computer interactions, the design of food ordering interfaces encounters the challenges of the “ambiguity of user needs” and “the core contradiction between certainty”. In order to address this challenge, this study proposes a theoretical framework of a “dual-path collaboration mechanism”, which, through the demand mapping path and design elements, aims to provide a systematic solution synergy of the resolution path. In the demand mapping path, the study adopts cognitive psychology and user experience research methods, combining KE (Kansei Engineering) and QFD (Quality Function Deployment) to transform users’ implicit demands into specific design elements; meanwhile, in the conflict resolution path, the study utilizes TRIZ (Theory of Inventive Problem Solving) based on design science and systems engineering theory. In the conflict resolution path, based on design science and system engineering theory, TRIZ and AHP (Analytic Hierarchy Process) are used to optimize the multi-dimensional balance of functional requirements, aesthetic performance, and interactive experience contradictions [
3]. Zhu et al., show how AHP can transform user requirements into weighted design outputs, further verifying the value of this method in interface design [
4]. In addition, Talero Sarmiento et al. provide theoretical support for design conflict resolution by prioritizing heuristic usability evaluations through AHP [
5]. The study of Van der Linden et al. emphasizes the importance of balancing technical functionality and emotional resonance during the design process, further reinforcing the innovativeness of combining user emotions with technical design [
6]. In practice, the mechanism provides practical guidance for interface design through the establishment of a “requirements–design” matrix, which ultimately realizes user requirements through the efficient expression and harmonization of design elements.
With the continuous advancement of AI deep learning algorithms and the optimization of big data models, generative AI is driving innovation in information production and dissemination models, significantly improving productivity and accelerating the digital transformation of various industries [
7]. The popularization of AIGC technology has enabled intelligent tools to quickly penetrate various industries, bringing efficiency improvements and innovative solutions to production processes [
8]. In the field of design, intelligent tools represented by MidJourney have broken through the traditional limitations of designer experience, and, through efficient algorithm generation and data support, they can quickly generate and accurately match complex content [
9]. This technology not only shortens the design cycle but also provides more possibilities when facing diverse needs, demonstrating the powerful driving force of technological innovation in digital and intelligent transformation [
10].
In the “demand mapping” path, AIGC technology not only accelerates content generation, but also explores users’ emotional needs in depth through data analysis and accurately matches users’ psychological expectations [
11]. By combining users’ emotional needs with AIGC technology, interface design can better satisfy users’ needs, enhance emotional resonance and user satisfaction, and then improve the overall quality of the user experience. Norman emphasized the key role of emotion in usability results in
The Design of Everyday Things, which shows that the impact of emotional experience on user satisfaction cannot be ignored. In addition, Weichbroth proposed a validated framework for integrating affective and cognitive dimensions into usability analysis, providing theoretical support for the effective incorporation of emotional factors in design [
12]. These theories provide new research directions and solutions for the optimization of ordering interface design.
Meanwhile, current design research shows a trend of multi-method integration, which provides a solid methodological foundation for systematically solving design conflicts. KE can transform users’ implicit needs into design elements to optimize a product or service. AHP is a multi-objective decision analysis methodology that evaluates and compares the priorities of different solutions by constructing a hierarchical model. QFD is a technique for transforming user needs into design requirements to help teams understand and deliver on user expectations. TRIZ, on the other hand, analyzes technical contradictions and proposes innovative solutions to optimize design and functionality. However, the methodological challenge lies in combining emotionally driven perceptual insights with analytically weighted and creative solutions, especially in an AIGC-driven interface design process. Ge Junchao explored how KE can enhance market competitiveness by meeting users’ sensory needs and guiding designers to incorporate these needs into product design, suggesting directions for future research [
13]. The combination of AHP and QFD with KE, applied to the design of age-appropriate home intelligent systems, shows good prospects and has been applied to the design of NiNiGou cultural and creative products and surgical assistive devices [
14,
15,
16]. In addition, the combination of gray number theory with KE and QFD has been proposed for the AI-driven design of product identification forms [
17]. Al-Dwairi A proposed a methodology that combines QFD and TRIZ to generate innovative solutions to design problems. The method proposes an improved quality function deployment diagram (HOQ) for identifying and prioritizing conflicts between and user requirements design elements [
18]. Xiangdong Li’s team systematically reviewed the related research progress in the area of intelligent generation and evaluation of graphical user interfaces (GUI), focusing on the algorithmic model-driven perspective; they discussed the innovation of design methodologies, the evolution of multimodal technology paths, and the construction of a collaborative HOQ framework in this area [
19]. Meanwhile, Zhu Tiantian et al. proposed a new method for capturing users’ perceptual needs and transforming them into preliminary prototypes and hints for AI-generated content, so as to achieve design generation and iterative optimization. They verified the practical effectiveness of this approach with good results using a saddle-shaped design as an example [
20]. Cavallin E suggested that designers working with AI can optimize the design process, improve efficiency, and create designs that are more in line with consumer preferences [
21]. These studies provide innovative applications of multiple methods and techniques in the field of design, but there are limitations, especially in the areas of emotional design, user diversity, design innovation, and the originality of AI-generated content. By integrating emotion-driven approaches to innovative solutions of AHP, the weighted analysis of QFD, and TRIZ, this study aims to fill the gaps in the field of interface design, especially in the context of AIGC technology. It systematically combines these methods to enhance the efficiency and effectiveness of the design process. There is a disconnect between the current research at the level of methodology and technical realization, especially in the process of requirement transformation; the existing system lacks the ability to construct cross-domain knowledge graphs, which leads to difficulties in the efficient migration of user requirements. At the same time, the fragmented design process has synergistic deficiencies in the links of requirement analysis, solution generation, and validation and evaluation, which leads to the insufficient matching of perceived requirements with design solutions. In addition, multimodal requirement modeling faces cross-dimensional parameter coupling problems, and the traditional single-threaded design process also leads to long iteration cycles. In order to break through these barriers, there is an urgent need to construct a KE-based theoretical framework of a dual-path collaboration mechanism, using the requirement mapping path and contradiction resolution path to improve the requirement conversion efficiency and solution quality.
This study focuses on the design of an ordering interface, integrating KE, AHP, QFD, TRIZ, and AIGC to ensure the scientific and systematic nature of the design solution. First, KE focuses on users’ emotional experiences and perceptual needs, providing user-oriented theoretical support for the design. AHP breaks down complex problems into hierarchical levels to ensure the comprehensiveness and accuracy of the design. QFD precisely translates user needs into design elements, optimizing resource allocation and improving development efficiency. TRIZ resolves technical contradictions in design through innovative thinking, reducing innovation costs and enhancing service quality. AIGC plays a crucial role in the creative and prototyping stages, rapidly generating and optimizing design solutions to significantly enhance design efficiency and innovation. By integrating these theoretical models, the “dual-path collaboration mechanism” proposed in this study effectively integrates demand mapping and conflict resolution, providing a systematic methodological framework that balances their synergistic effects. The second part of this study reviews the relevant theories and integration challenges, while the third part validates the application value of this framework.
2. Literature Review
2.1. Kansei Engineering
Kansei Engineering (KE) is an engineering approach that translates users’ emotions, perceptions, and psychological needs into design elements; it was first proposed by Nagamachi, a Japanese technologist [
22]. It optimizes product design and user experience by collecting sensory information and combining it with engineering techniques [
23]. Its core premise lies in understanding and expressing user emotions and integrating these responses into product design, service development, and technological innovation to enhance users’ emotional satisfaction and the market competitiveness of products or services.
Research into Kansei Engineering focuses on two directions. The first involves using the process of user-centered innovation design to measure and capture users’ psychological needs, in which KE guides design decisions. For example, the ear thermometer shape design combines KE with AHP to help determine the design solution that best meets users’ emotional needs [
24]. In addition, KE combined with the KANO model has been applied to sustainable service design to effectively capture and address user needs [
25].
The second direction involves using Kansei Engineering as a key indicator in product development, especially in combination with other innovation methods to improve development efficiency. For example, D Zhong’s study demonstrated the improvement of design efficiency through an emotional needs-oriented knowledge management model [
26], and Yang, C also pointed out that combining KE with TRIZ can effectively meet user needs [
27].
In recent years, Kansei Engineering has not been limited to engineering but has been widely used in many fields, showing its strong adaptability and versatility. Lai applied Kansei Engineering to the exterior design of new energy vehicles using an Internet big data mining methodology; the focus of this study was to use Kansei Engineering to enhance the design process [
28]. A modified Kansei Engineering approach was used to extract emotional attributes in product design in Čok’s study, which investigated the impact of e-bike form design elements on user perception [
29]. In addition, Gong proposed a Kansei Engineering–design thinking framework for product design that allows designers to incorporate user feelings as design elements, which involves the selection of a perceptual vocabulary to describe emotional values [
30]. Zuo developed a subjective product evaluation system for KE-AHP, which emphasizes the importance of product evaluation in enhancing product competitiveness, demonstrating that Kansei Engineering not only helps designers to capture emotional needs but also provides an effective evaluation tool to help market positioning and the optimization of products [
31]. Although Kansei Engineering can effectively capture users’ emotional needs, it still faces many challenges, such as the difficulty of quantifying emotional needs and the insufficiency of evaluating consumer satisfaction; its quantification and accurate description of these needs is a challenge, and the method relies on designers’ intuitive understanding and lacks systematic emotional depth analysis, which may lead to bias, especially in groups with large cultural or individual differences.
In order to solve these problems, in the Dual-Path Optimization Model, KE is used in combination with AHP, TRIZ, etc. AHP helps to clarify the priority of emotional needs, which makes KE more accurate in transforming users’ emotions; TRIZ ensures that the integration of emotional needs does not affect technical feasibility by resolving the technical contradictions. This combination ensures emotional consistency and promotes the balance between functional and emotional needs.
Therefore, the role of the combination is crucial; it accurately filters and transforms users’ emotional needs through data mining and model building and, at the same time, works synergistically with AHP, QFD, TRIZ and other methods to promote the balance between functionality and emotion in designs using KE in the “dual-path optimization” model [
32]. Emotional engineering not only improves the user experience of design but also provides more accurate decision support for innovative design.
2.2. Analytical Hierarchy Process
The analytic hierarchy process (AHP) was proposed by Thomas L. Saaty, an American operations researcher, in the early 1970s, with the aim of constructing a multi-criteria decision-making model through the combination of qualitative analysis and quantitative calculations [
33]. Its core value lies in deconstructing the complex system into goal, criterion, and indicator layers and analyzing the weights through judgment matrices to finally realize the optimal solution ranking [
34]. For example, Sheng applied AHP to military cabin color factor extraction and established the optimal color sequence and design factor space [
35]; Jadhav used AHP for the prioritization of home plumbing service design, highlighting the importance of the system design elements [
36]; Wang evaluated the product attributes and market trends of children’s smart mugs through AHP, and put forward a quantitative data-based design concept [
37]; Liu proposed an evaluation system for restaurant seating design based on AHP and FAHP, emphasizing meeting user needs and enhancing product competitiveness [
38].
The application of AHP in interface design is promising, especially in interface prioritization by analyzing the design elements hierarchically and specifying the weights, thus helping designers to rationally order multiple complex decision problems. However, a major limitation of AHP is the lack of consideration of emotional depth. In emotional design, users’ emotional needs are often subjective and difficult to quantify, and AHP focuses on structured quantitative data that may not adequately capture the complexity of emotional needs. In addition, AHP lacks adaptability to dynamic demand changes, especially in rapidly changing product development, and it cannot flexibly respond to changes in user needs or environmental conditions related to design elements.
To compensate for this shortcoming, this study combines AHP with KE and utilizes KE’s quantitative measurement of emotional needs to provide emotional-needs-related support for AHP. In the Dual-Path Optimization Model, AHP helps designers to clarify the priority of requirements and ensure the scientific and systematic design objectives by classifying user requirements, functional requirements, and emotional requirements in a hierarchical way. Through this hierarchical structure, designers can clearly identify the needs that need to be prioritized and avoid neglecting critical emotional needs. Second, the combination of KE and TRIZ further enhances the precision and innovation of design. In KE’s emotional needs analysis, AHP helps to provide prioritization for emotional needs, so that the design not only meets functional needs, but also fits with users’ emotional needs. In the conflict resolution of TRIZ, AHP can effectively differentiate the priorities of technical and emotional needs, so as to provide a clear direction for TRIZ and ensure that the user’s emotional needs are satisfied while technical conflicts are resolved.
Therefore, AHP not only provides a systematic analysis framework for complex decision-making problems in interface design but also works synergistically with other methods to ensure that the design solution comprehensively and efficiently realizes the transformation of needs and the resolution of technical conflicts.
2.3. Quality Function Deployment
Quality Function Deployment (QFD), first introduced in 1972 at the Mitsubishi Kobe Shipyard in Japan, is a systematic process of translating customer requirements into product characteristics, design elements, and production details, with the aim of developing products that satisfy customers’ needs [
39]. The core concept of QFD lies in analyzing and quantifying the relationship between user requirements and design elements; it uses the “quality house” to calculate and classify them, which guides product design and development by prioritizing critical requirements [
40]. This process effectively improves design quality, shortens engineering cycles, optimizes the design and manufacturing process, and reduces the number of product parts. The key tool of QFD, the “Quality House”, is used to map the relationships between customer requirements and design elements [
41]. This includes user requirements, design elements, the correlation matrix, competitive analysis, and requirement importance ratings [
42]. Experts assess the relevance of requirements to design elements through multi-criteria decision analysis and provide a basis for subsequent design decisions [
43].
However, QFD has some limitations, especially in terms of real-time prototype feedback and rapid iteration. Although QFD is capable of comprehensively translating user requirements in the early stages of design, it relies on static requirement inputs and lacks the ability to respond to real-time changes in the design process. In addition, QFD usually relies on expert judgment and lacks automated quantitative support for some complex emotional requirements, which may lead to the neglect or misunderstanding of emotional requirements.
In the Dual-Path Optimization Model, the combination of QFD with AHP, TRIZ and KE compensates for these shortcomings. First, AHP provides requirement prioritization for QFD, thus ensuring that the design solution addresses user requirements according to priority. By prioritizing emotional and functional requirements through the AHP, QFD translates these requirements into specific design elements and clarifies the relationships between the elements through the Quality House. This integration ensures that the design meets both functional and emotional needs. Second, QFD helps designers identify potential conflicts by creating a mapping diagram between requirements and design elements, providing a basis for TRIZ to resolve technical conflicts and ensuring that the design is always in line with the user’s needs while resolving technical conflicts. Finally, QFD ensures that emotional needs are reflected in product design by transforming emotional needs into specific design elements, while KE provides accurate measurements of emotional needs to ensure that customer needs in QFD not only include functional needs, but also reflect the user’s emotional demands. In this way, the design not only meets the technical requirements, but also resonates with the user’s emotions.
As one of the core methods of the Dual-Path Optimization Model, QFD can not only systematically analyze and process user requirements but also synergize with AHP, TRIZ, and KE to ensure that the design solution comprehensively and accurately meets user requirements, realizes the organic unity of functionality, emotion, and technology, and enhances the science and accuracy of design decisions, which further promotes the development of the design process. The process is made scientific and accurate, further promoting design innovation and the optimization of the user experience.
2.4. Theory of Inventive Problem Solving
The Theory of Inventive Problem Solving (TRIZ), developed by Genrich Altshuller and his team, is a highly effective innovation methodology intended to help designers analyze and resolve conflicts and contradictions in design and to optimize design solutions. The core of TRIZ lies in identifying and eliminating technological contradictions and improving design outcomes using innovative approaches [
44].
TRIZ has been successfully combined with AHP, QFD, ergonomics, and other methods to achieve notable results. For example, Wen Junzhong’s team integrated the AHP/FBS/TRIZ methodological framework to overcome the innovation bottleneck in orchard management machine design [
45]; Zhao Qiming’s group improved the human–computer interaction and operational safety of a micro-tillage machine by integrating TRIZ and ergonomics [
46]; and Su Jianning et al. enhanced the efficiency of a rosebud picking machine using an integrated AHP/QFD/TRIZ design method [
47].
Although TRIZ offers strong advantages in resolving technical conflicts, it primarily focuses on technical aspects and tends to overlook emotional needs and user experience. This limitation may result in a disconnect between the design solution and user expectations. Moreover, the theoretical nature of TRIZ may hinder designers from effectively translating its principles into practical solutions.
In this study, through the Dual-Path Optimization Model, AHP and TRIZ are effectively combined to align demand priorities with design elements, enabling the reconciliation of users’ emotional needs with technical requirements. AHP is used to determine the prioritization of user needs, while TRIZ addresses technical contradictions with innovative solutions, ensuring that the final design is both user-centered and technically feasible.
The integration of QFD further strengthens the role of TRIZ in resolving design conflicts. Within QFD, user requirements are translated into design attributes and structured through the “House of Quality.” TRIZ is then applied to identify and resolve potential conflicts among these attributes, thereby enhancing the functionality and coherence of the design.
Additionally, TRIZ contributes to functional optimization through technological innovation, while Kansei Engineering ensures that the design emotionally resonates with users. The synergy between these approaches facilitates a balanced integration of function and emotion.
Therefore, the role of TRIZ in the Dual-Path Optimization Model is essential. By working in conjunction with AHP, QFD, and Kansei Engineering, TRIZ not only resolves design contradictions but also supports the harmonization of functional and emotional needs, ultimately enhancing user experience and design innovation.
2.5. AI-Generated Content
The design optimization process of Artificial-Intelligence-Generated Content (AIGC) provides key technical support. AIGC simulates human creative cognition through deep neural networks to generate design solutions that meet user needs [
48]. For example, AIGC tools such as MidJourney and Stable Diffusion have been widely used in the design field [
49]. Designers only need to provide information such as product requirements, functional requirements, and design constraints, and AIGC tools can generate multiple design solutions, accelerate prototype generation, and provide support for resolving emotional and functional conflicts.
In terms of emotional requirements, AIGC is able to quickly generate design solutions that accurately capture and reflect the emotional characteristics of users. For example, Yuying Pei’s team revealed the relationship between visual cognitive paths and creative outputs through a two-dimensional analysis model of eye tracking and creative evaluation [
50]. This analysis shows that designers can verify the visual and emotional effects of design solutions through AIGC at an early stage to ensure that the design meets the emotional needs and aesthetic preferences of users, and that it is not only a technological aid, but also a core part of realizing emotion-driven design.
TRIZ can help identify technical conflicts and provide methodological support for innovation, but it is often a challenge to translate these theories into concrete design solutions, and AIGC is able to generate multiple prototypes of design solutions based on TRIZ analysis, thus effectively resolving technical conflicts.
Combining AIGC with other technologies significantly improves design efficiency and facilitates the innovative design process of the “demand–design–evaluation” model [
51]. For example, Song Yu’s research group innovatively proposed a feature deconstruction algorithm for ink painting, digitally encoding traditional brush strokes based on a semantic segmentation network and realizing the intelligent regeneration of oriental aesthetic elements such as “mood” and “white space” [
52]. Chenlu Wang’s team constructed an electric motorcycle shape-generating system for female users by combining the Shape Grammar Engine with the User Perception Engineering Model [
17]. Jian Zhang’s group developed a semantic extraction framework for ancient architectural patterns based on the TF-IDF algorithm, successfully realizing the intelligent derivation design of the Yongle Palace algal well pattern [
53]. The AIGC tool generated multiple design options, helping the team to quickly evaluate and optimize the design to ensure the fit with the user-perceived needs. Similarly, Xie Chenhui et al. developed a parametric design platform for children’s furniture based on the ControlNet architecture, which supported the transformation of designs from concepts to engineering drawings through the semantic analysis of sketches linked to a safety specification database [
54].
Although AIGC has made significant progress in generating design solutions, it still has limitations in terms of its cognitive capabilities that may lead to unpredictable design solutions being generated. To overcome this limitation, a combination of the KE, AHP, QFD, and TRIZ methods can provide more objective and comprehensive decision support to ensure that the final design solution not only meets the user’s needs but also effectively resolves conflicts in the design.
Therefore, this study constructs a “dual-path design optimization framework of resolution”, which aims to realize the accurate transformation of user requirements and the innovative resolution of design conflicts through the integration of interdisciplinary methods, and the AIGC tool in this framework mapping conflict involves several steps. First, through user requirements and design mapping, user needs and preferences are input to quickly generate compliant design options. Then, based on the prioritized requirements identified using methods such as AHP and QFD, the AIGC tool generates more targeted design outputs to ensure that the design is aligned with critical requirements. Next, AIGC accelerates rapid prototyping and iteration, reducing manual effort by testing multiple design options. Working with design experts, the experts evaluated the AIGC-generated designs to ensure they met emotional and functional requirements. Finally, by integrating user feedback, the AIGC tool adjusts design variables to continuously optimize the design. Overall, the AIGC tool enables a more refined and flexible design process through efficient parametric design, rapid iteration, and expert collaboration, while closely matching user needs.
2.6. Method Synergy in Dual-Path Optimization Models
In the Dual-Path Optimization Model, the synergy of various methods drives the overall optimization of the design. KE ensures that the design touches the emotions of the user by accurately capturing and transforming the user’s emotional needs, not neglecting the emotional needs, and thus enhancing the user experience; this improves the user experience by efficiently prioritizing the user’s needs, functional needs, and emotional needs. As such, AHP provides a scientific decision-making basis for design by effectively prioritizing user needs, functional needs, and emotional needs. After prioritizing the needs, QFD translates these needs into specific design elements and systematically analyzes and optimizes the design process through the “Quality House” to ensure that the design solution balances functional and emotional needs, while TRIZ effectively identifies and resolves technical contradictions in the design, using innovative problem solving methods to ensure that the design meets functional needs while at the same time improving the user experience. TRIZ effectively identifies and resolves technical conflicts in the design through innovative problem-solving methods, ensuring that the design realizes functional requirements without losing innovation and technical feasibility.
The effective combination of these methods forms the core of the Dual-Path Optimization Framework, where AHP, QFD, TRIZ and KE work together to optimize the design in both the functional and emotional dimensions. AIGC, as a supporting tool, helps designers to quickly generate design solutions while ensuring the synergies between the methods are efficiently realized. AIGC not only accelerates the design process but also helps to effectively integrate the complex emotional and technical contradictions to ensure that the final design solution meets the user’s emotional needs, as well as the technical feasibility requirements. Through this interdisciplinary integration, this study realizes the precise transformation of design goals and promotes the practice and development of innovative design, as shown in
Figure 1 and
Figure 2.
3. Research Process and Methods
In recent years, the proportion of digital services in the catering industry has continued to rise, and the demand for high-quality interfaces has also increased. Excellent ordering interface design has become an important manifestation of user experience and brand value. However, at present, domestic interface designs are mostly based on imitating mature foreign cases, and designs with truly independent innovation characteristics are relatively scarce, resulting in serious homogeneity among ordering interface styles on the market. Many designs lack coordination in terms of the layout proportions, interaction logic, etc. In the existing design process, the selection and development of interface design solutions are often overly influenced by the designer’s personal style preferences or the subjective decisions of product managers, resulting in a disconnect between the design solution and user needs, and even an imbalance between functionality and aesthetics, which has an adverse impact on product competitiveness and user satisfaction. Therefore, it is particularly necessary to explore a scientific and systematic interface design evaluation method and introduce more user data and objective indicators into the design process. This will effectively improve design quality, reduce decision-making bias, and inject more innovative possibilities into interface design. The specific steps are as follows:
Under the framework of “Kansei Engineering”, this study first collects experimental samples through focus group discussions and identifies four sample types that are representative of most of the food ordering interface designs in the market. The study compiled 90 experimental samples from the official websites, apps, third-party delivery platforms, and the mobile ordering apps of various restaurant brands; we then randomly selected 30 samples to be processed in order to ensure the representativeness and diversity of the samples.
Using a Houyi collector to take 5317 user comments from major food ordering platforms, the collection time range was from January to March 2025, and we pre-processed the comment data as follows: filtering keywords, segmenting words, and deleting deactivated words using NLP technology to obtain the cleaned data. Finally, we screened 187 high-frequency perceptual words through word frequency analysis. After collecting and organizing, the extracted perceptual imagery words were classified using the KJ method (constructive card classification). Vocabulary that conforms to the modern design context was selected to ensure that the perceptual imagery words accurately reflect users’ needs, and nine groups of perceptual imagery words were obtained. Then, based on 30 experimental samples and 9 groups of emotional imagery words, we collected 75 valid questionnaires through a questionnaire survey.
In order to establish an effective quantitative system of emotional imagery, the weight of each perceptual imagery word was determined. The mean score data of the questionnaire results were imported into SPSSAU software and tested for reliability. We used PCA to analyze the experimental data and extract the key perceptual imagery words pooled. Twelve experts in the design field (including senior design directors, professors, master’s degree students, etc.) were invited to assess the eight extracted groups of key perceptual imagery words in pairs. A judgment matrix was established using AHP (hierarchical analysis), and weight values were calculated via expert scoring (1–9 scale method). The consistency of the judgment matrix was ensured, and the CR values were calculated for validation to ensure the scientificity and accuracy of the method. Based on the expert assessment results, the weights of each group of perceptual imagery word pairs were calculated and prioritized.
To accurately map user requirements to design elements to ensure the comprehensiveness of the design solution, morphological analysis was used to deconstruct the design of the ordering interface. It was divided into five elemental variables through group discussion. On this basis, a QFD mapping model was established to transform user requirements into specific design elements. The core requirement weights derived from AHP were used as the left wall requirements of the quality house, and the interface design elements were mapped to the roof area as design elements. The focus group assessed the correlation between requirements and design elements through the Delphi symbol system: Δ means 1 point (weak correlation), ○ means 3 points (medium correlation), ● means 5 points (strong correlation), and blank means no correlation. A multidimensional correlation matrix between requirements and design elements was established based on the symbolic score data. We calculated the importance of design elements according to the weighted sum formula, derived the absolute and relative weights of elements, visualized the weights of user requirements and design elements, and helped to optimize design decisions.
The technical conflicts in design are solved using TRIZ theory to optimize the conflict between the functional and emotional needs of interface design. The positive and negative correlations between the factors can be clearly identified through the roof part of the quality house: “+” means a positive correlation, “-“ means a negative correlation, and a blank space means no correlation. Based on the contradictions and conflicts obtained from the quality house, and taking into account the specific situation and requirements of the design of the ordering interface, we identified the appropriate invention principles in TRIZ theory to be practiced to solve the contradictions and conflicts in the design.
We used generative AI tools to quickly generate design solutions and verify their effectiveness. Based on the identified weights (KE, AHP, QFD and TRIZ outputs), design cues were provided to the AIGC tool, which generated three design solutions based on these cues. The stability and effectiveness of the AIGC-generated design solutions were verified through user evaluations, questionnaires, and controlled experiments. Through user feedback and evaluations, the design solutions were adjusted to ensure that the emotional and operational needs of users are met. The whole research process is shown in
Figure 3.
3.1. Interface Design Sample Selection
Kansei Engineering plays a crucial role in this study, especially in extracting from the interface design the vocabulary of perceptual imagery, and in capturing users’ emotional needs. KE provides accurate emotional data for interface design optimization by quantifying users’ emotional needs [
24].
In order to select experimental samples of the ordering interfaces with distinctive stylistic imagery, as well as ensuring that the chosen samples adequately represent the characteristics of different ordering interface designs, in-depth interviews were conducted with experts and user groups from diverse backgrounds. These included five restaurant managers, who provided feedback on the practical use of ordering interfaces—especially regarding ease of use, efficiency, and how to optimize the customer’s ordering experience. Two professors of visual communication design evaluated the visual appeal of the interfaces and the effectiveness of the design elements from the perspective of design theory and artistic expression. One professor of industrial design assessed the functionality and operability of the interfaces through the lens of ergonomics and user experience. Five master’s students in visual design contributed innovative insights by introducing emerging design trends and creative perspectives. Additionally, two master’s students in industrial design offered valuable input on balancing user needs with functionality and aesthetics. Feedback from this diverse group ensured the comprehensiveness and representativeness of the selected samples, providing multidimensional support for optimizing the ordering interface design. Two rounds of screening were conducted.
In the first round of independent scoring, all participants independently scored the ordering interface based on its stylistic features, ease of use, visual appeal, and innovative design. Each participant evaluated the characteristics of each ordering interface sample based on their own professional background and design experience and selected those samples with distinctive styling features that met the needs of the study.
In the second round, all participants came together for a collective discussion based on the scoring results of the first round. Participants shared their opinions and rationales and had in-depth exchanges on the design features, functionality, and user experience of each ordering interface. The purpose of the discussion was to identify the final four types of typical samples to ensure that the selected samples could comprehensively demonstrate the design features of different ordering interfaces and were highly representative.
During the screening process, a Kendall W consistency test was conducted to ensure the consistency of opinions among the reviewers. The test results show that Kendall W = 0.73,
p < 0.01, indicating that the results of the two rounds of screening have a high degree of reliability and consistency. Based on the test results, four types of typical ordering interface samples were finally identified and provided sufficient support for subsequent design optimization and research. The results are shown in
Figure 4.
3.2. Interface Design Sample Collection
This study uses systematic sampling to collect samples, and the data sources cover three mainstream channels:
Brand-owned platforms (official websites/APPs, accounting for 40%),
Third-party food delivery platforms (Meituan/Ele.me account for 35%),
WeChat/Alipay mini-programs (accounting for 25%), identified through stratified random sampling.
In total, 30 experimental samples were drawn from the 90 candidate samples initially screened according to the four types of interface types, with 7–8 samples in each type. The χ2 test showed that there was no significant difference in the type distribution. The sample screening criteria include:
- 4.
interface integrity,
- 5.
average daily visits > 500 times,
- 6.
no major UI revisions in the past six months.
- 7.
the final sample was processed in a random sequence generated by SPSSAU, and the results are shown in
Figure 5.
3.3. Extraction of Perceptual Image Vocabulary in Interface Design
In total, 5317 user reviews were taken from multiple food ordering platforms using a Houyi collector [
55]. The time range of the comment capture spanned January–March 2025, totaling 90 days, in which the number of comments on the Meituan platform was 2233, accounting for 42.01%; there were 2020 comments on the HungryMe platform, accounting for 37.99%; for KFC, there were 423, accounting for 7.95%; the number of comments on Pizza Hut was 396, accounting for 7.44%; and the number of comments on other mini-program platforms was 245 or 4.60%. NLP was used to filter keywords and clean the data, and the reviews were segmented using a word segmentation tool; deactivated words were removed. The number of number of words in the text after preprocessing was 1,042,532. After filtering the deactivated words, the size of the dataset was 683,917 words, with 47 virtual generic words in the group of 118 deactivated words, accounting for 43%. There were 47 platform feature values (e.g., “red packet”, “full reduction”), accounting for 24.87%, and 24 catering-irrelevant words (such as “takeout”, “customer service”), accounting for 12.70%. Then, we calculated the word frequency and filtered out the high-frequency words; the retention threshold of high-frequency words was ≥50 occurrences, totaling 187 [
56].
Then, by referring to the related books and academic literature, we compiled a total of 90 perceptual imagery words to describe the sorting interface [
57]. This was undertaken to improve the rigor of the selection, reduce the selection bias, and ensure the representativeness and relevance of the perceptual descriptors. In this study, 12 experts were invited to form a focus group, including two design directors with more than 10 years of design experience, two professors of visual communication design, one professor of industrial design, five master’s degree students of visual design, and two master’s degree students of industrial design, of whom 40% were female. Focus groups were formed to optimize the process using a mixed-methods approach: first, the KJ method was used to openly classify the words, and the inter-group consistency was calculated to be α = 0.78 using SPSSAU software. A focus discussion was conducted to eliminate words with a correlation lower than 0.3 to form 15 pairs of candidate words; then, three rounds of Delphi anonymous voting were conducted with a consensus rate of greater than 80%. This result was combined with the validation of the third-party restaurant manager, and the intra-group correlation coefficients were analyzed using SPSSAU software. The intra-group correlation coefficient was analyzed, resulting in ICC = 0.82. For the statistical testing, Cronbach’s α = 0.89, χ
2 = 32.7, the
p value is less than 0.01, and nine representative pairs of perceptual imagery vocabulary words were finally identified: complex–simple, uncomfortable–comfortable, unpleasant–pleasant, fuzzy–interpretive, outdated–modern, inauthentic–credible, unidirectional–interactive, indifferent–friendly, distracted–focused, and indifferent–friendly (see
Table 1). Audio, video and documentary evidence mechanisms were used throughout the process to ensure transparency [
58].
Based on the 7-point Likert scale (−3~+3), a related questionnaire (see
Table 2) was designed to quantify the users’ perceptual evaluations of the interface design by combining the above selected 30 samples of the ordering interface and the 9 groups of perceptual image words. The subjects were asked to rate the performance of each sample on each perceptual dimension based on their own subjective feelings. After the questionnaire design was completed, it was distributed to the target user groups and subjects were asked to rate the performance of each sample on each perceptual imagery dimension according to their own subjective feelings. Finally, a total of 75 valid questionnaires were collected, with a validity rate of 92.59%. The average scores of each group of sensual imagery words were calculated and are shown in
Table 3.
3.4. Emotional Image Words for Ordering Interfaces
The main aim of principal component analysis (PCA) is to extract the principal components that can maximize the explanation of the variance in the data, helping us to identify the underlying patterns and important features in the data, which can reduce the problem of multiple covariance between the variables and make the data easier to interpret in a high-dimensional space. This can reduce multiple highly correlated perceptual image words into a few principal components, thus simplifying the data structure and avoiding the redundant information interference, making the subsequent analysis more clear and effective [
59].
In this study, we use PCA to deal with the correlation between perceptual imagery words and the problem of excessive data dimensionality. In order to explore the sorting interface, the correlations between the data were analyzed using SPSSAU software. The results showed that the Cronbach’s alpha coefficient reached 0.927, indicating that the questionnaire had high internal consistency and good data reliability. Meanwhile, the KMO value was 0.742, indicating that the variables had correlations suitable for factor analysis. In addition, the results of Bartlett’s test of sphericity showed that the approximate chi-square value was 171.912, the degree of freedom was 36, and the significance
p-value was less than 0.05, which further confirmed that the correlation between the variables was statistically significant and suitable for PCA analysis [
60]. According to the judgment criteria of the scree plot, the first three principal components with eigenroot values greater than 1 were selected. The first principal components “complex–simple”, “uncomfortable–comfortable”, “fuzzy–intuitive”, and “distraction” can be categorized as operation and function; the second principal components “outdated–modern” and “indifferent–friendly” can be categorized as related to visual and emotional impact; and the third principal components “unpleasant–enjoyable”, and “unidirectional–interactive” can be categorized as related to interaction and feedback experience, as shown in
Table 4. This not only simplified the structure of variables but also makes our interpretation of the data more intuitive and clear.
3.5. Constructing the AHP Judgment Matrix
The main role of the hierarchical analysis method (AHP) in this study is to systematically evaluate user needs in the design of food ordering interfaces. AHP divides the need hierarchy into goal, criterion, and indicator layers by constructing a judgment matrix, thus ensuring scientific, systematic, and structured design decisions. In addition, AHP provides support for the application of KE, which can effectively integrate users’ emotional needs into the design optimization process, bringing the interface design more in line with users’ actual needs.
By sorting out and summarizing the user requirements of the ordering interface design, the requirement hierarchy is divided into three layers: the goal layer, the criterion layer, and the indicator layer. The first layer (goal layer) is defined as the perceived semantics of the ordering interface A. This represents the ultimate goal of this study, i.e., the interface design’s comprehensive satisfaction of users’ emotional and functional needs. The second layer (criterion layer) consists of three aspects: “Operation and Functionality B
1”, i.e., focusing on the simplicity of the interface’s operation and the completeness of its functionality; “Visual and Emotional Impact B
2” evaluates the visual appeal of the interface and its emotional impact on the user. “Interaction and Feedback Experience B
3” assesses the smoothness of user interaction with the interface and the timeliness of feedback. The third layer (indicator layer) is defined as the eight affective imagery words extracted from the above principal-component-based analysis, which are used as specific indicators for assessing the criterion layer. The final hierarchical model of the ordering interface is shown in
Figure 6.
Based on the user requirement classification system of the perceptual semantics of the ordering interface, a multi-objective decision-making model is constructed using the AHP hierarchical analysis method to quantify the requirements weights [
61]. In the decision-making process, we invited 12 experts with design backgrounds to form an expert group, including two senior design directors (with more than 10 years of practical experience in the industry, familiarity with the solutions to actual design projects, and an ability to provide valuable advice on the user experience, technical feasibility, and commercialization of interfaces), and three university professors (with rich theoretical backgrounds and project guidance experience, especially in the field of interface design, perception analysis and user behavior); they were able to provide innovative and forward-looking design insights. The team also included seven design graduate students. We conducted a pairwise comparison of the elements of the criteria layer and the indicator layer and standardized the criteria according to the Saaty 1–9 scaling method construct [
62]. The judgment matrix was constructed according to the principle of antisymmetry, i.e., for each pair of elements A and B, if the importance of A with respect to B is x, then the importance of B with respect to A is 1/x. In addition, a scale from 1 to 9 is included in the criterion to quantify the difference in importance between the two. The scale values follow the principle of symmetry: when the elements are of equal importance, they are assigned a value of 1, and when there is a significant difference in importance, they are assigned a value of 9 [
63]. The specific scaling criteria are detailed in
Table 5.
The maximum feature root λmax is calculated using the eigenvector method, the eigenvector W is normalized, and the reasonableness of the judgment logic is verified according to the consistency ratio CR value. The judgment matrix passes the consistency test when the CR < 0.1, and, if it does not meet the requirements, the consistency test needs to be performed again [
64]. The calculation process is shown in Equations (1)–(3), where n is the order of the matrix, a
ij is the element of the jth row and jth column, and w
i is the corresponding eigenvector element. calculated using this formula. The λ
max is the basis for the subsequent consistency test. Through the matrix eigenvalue decomposition and consistency verification mechanism, this method effectively reduces the influence of subjective judgment bias on weight allocation and provides a quantitative basis for prioritization decisions in interface design elements.
The research team strictly followed the AHP method, and the expert group carried out systematic pairwise comparison of the evaluation elements of the criterion layer to construct a judgment matrix with hierarchical characteristics. After the eigenvector normalization and weight calculation, the matrix formed the priority ranking of each indicator in the criterion layer. The results are shown in
Table 6.
According to the indicators in the table, the eigenvalue λmax is calculated as:
According to the above steps, the consistency index CI is calculated:
According to
Table 7, when the matrix order
n = 3,
The stochastic consistency ratio CR calculated using this method is 0.0332, which is less than 0.10 and meets the consistency requirements, indicating that the program is effective [
65]. On this basis, the comparison matrix is constructed and the secondary weight values of all sub-criteria-level indicators under the three criteria are calculated separately. The relevant judgment matrices and weight values are shown in
Table 8,
Table 9 and
Table 10. The CR value of the three judgment matrices is less than 0.10, which meets the consistency test and reflects real expert opinion.
In this study, the hierarchical total ranking method is used to realize the multilevel synthesis of criterion layer weights. The second-level weights of the sub-criteria layer are multiplied by the corresponding first-level criterion layer weights, and the synthesized weight values [
66] are obtained after normalization, as shown in
Table 11. The analysis results show that the contribution of each dimension of the criterion layer to the decision-making goal is ranked as follows: B1 operation and function are the most important, B2 visual and emotional influence are the second most important, and B3 interaction and feedback experience are the third.
3.6. Analysis of the Meal Ordering Interface
Morphological analysis is a systematic approach used to analyze and solve problems. It breaks down complex problems into multiple dimensions and variables and then finds innovative solutions or optimized designs through different combinations of variables [
67]. It was originally proposed by Swiss scientist Fritz Zwicky and has been widely used in the fields of engineering design, product development, and policy making. After we invited two university professors, five industrial designers, and eight visual designers to discuss and deconstruct the ordering interface samples, the ordering interface design was finally classified into five elemental variables: the interface structure, visual design, functional cues, emotional design, and interactive experience [
68], as shown in
Table 12.
3.7. Establishing a QFD Design Factor Mapping Model
To ensure the scientificity and reliability of our design decisions, this study uses the hierarchical analysis method (AHP) to determine the weights of each index and then combines it with the quality function development (QFD) to carry out the design optimization [
69]. QFD quantifies and visualizes the relationship between user requirements and product technical characteristics, so as to determine the absolute and relative weights of each technical characteristic and to make clear the priority between each design requirement [
42]. The weights of the three core requirements from the AHP output are used as the left wall requirements of the quality house, and the interface design elements are mapped to the roof area as design elements [
70]. Correlations between requirements and features were assessed via a focus group (members as above) using the Delphi symbol system: Δ (weak = 1 point), ○ (medium = 3 points), ● (strong = 5 points). Based on the symbolic scoring data, a multidimensional correlation matrix between requirements and design elements was established and the importance of each design element was calculated using the weighted summation formula [
71] as shown in
Figure 7.
We calculated the absolute weights and relative weights of design elements [
62]. The calculation formulas are shown in (7) and (8).
In the formula, W
j denotes the absolute weight value of technical requirements, Wi denotes the weight value of user requirements (see
Table 8 for the combined weight value of each specific sub-division of requirements), P
ij denotes the correlation coefficient (the three symbols correspond to the QFD of the quality house, in which the strong correlation ● = 5, the medium correlation ○ = 3, and the weak correlation ∆ = 1), and W
k denotes the relative weight value of technical requirements:
The following conclusions are drawn; see
Table 13.
Based on the analysis of the weighting data and the construction of the mapping model, this study proposes the following conclusions and further deepens the theoretical background and empirical analysis of design optimization:
First, among all the design elements, module partitioning, state hints, dynamic information and feedback mechanism have high weight values in the three dimensions of function, vision and interaction, which are the key elements for interface design optimization. Among them, state cues (W
j = 5.3846, W
k = 0.1713) had the highest weight, which was demonstrated by Kauttonen, Janne, et al., who proved that the P300 amplitude is positively correlated with the clarity of the state cues. This suggests that clear and intuitive state cues are crucial for users to receive feedback on their operations [
72]. Dynamic information (W
j = 4.3896, W
k = 0.1397) plays an important role in improving the immediacy of information interactions and the smoothness of operations [
73]. The feedback mechanism (W
j = 5.2574, W
k = 0.1672) is a central factor in the user’s perception of the interaction quality and system response. In addition, the rationality of module division (W
j = 2.5422, W
k = 0.0810) directly affects the layout logic of functional modules and the user’s ability to understand the interface information. Therefore, functional optimization should first focus on the above key elements in order to improve the user’s basic operation experience.
Second, color scheme, font style and contrast are the core elements of visual design; they are crucial for improving the attractiveness and readability of the interface. Among them, contrast (W
j = 3.4995, W
k = 0.1113) has a higher weight, indicating that the optimization of contrast plays a key role in the display of the information hierarchy and the visual experience [
74]. The role of the color scheme (W
j = 1.2810, W
K= 0.0408) and font style (W
j = 1.3940, W
K = 0.0444) in enhancing the aesthetics and consistency of the interface should not be ignored. Therefore, the optimization of visual design should focus on the coordination of contrast, color schemes and fonts to ensure that users can quickly identify information and perceive the aesthetic value of the interface [
74].
Finally, dynamic information and feedback mechanisms have higher weights in the interaction experience, W
j = 4.3896, W
k = 0.1397 and W
j = 5.2574, W
k = 0.1672, respectively, suggesting that immediate feedback and interaction guidance are crucial to user experience. The optimization of interaction design should focus on the dynamic presentation of information and the timeliness of responses to ensure that users can receive clear feedback during the operation process, so as to improve user engagement and satisfaction [
75].
In general, the design of the ordering interface should be based on functionality, combined with visual appeal and interactive fluency. Module partitioning, status prompts, dynamic information and feedback mechanisms are the core elements of optimized interface design, which should focus on three aspects: function, vision and interaction. Meanwhile, the importance of color scheme, font style and contrast in the visual dimension also indicates that interface optimization needs to focus on the overall coordination of design elements. In the design implementation stage, the above key elements are integrated and sketched, and the AIGC generation tool is used to quickly generate and verify the optimization effect, so as to achieve the comprehensive improvement of the food ordering interface design.
3.8. Analysis of Contradictions in Ordering Interface Design
In the process of ordering interface optimization, TRIZ theory, an important method for solving engineering problems, is combined with the QFD quality function; this can effectively solve the contradictions and conflicts in the design [
27]. Through the roof part of the Quality House, we can clearly see the positive and negative correlations between the factors: “+” means positive correlation, “−” means negative correlation, and the blank space means there is no correlation between the technologies [
76].
In the process of optimizing the design of the ordering interface, four groups of design elements showed significant positive correlations and three groups of design elements showed negative correlations, which provided an important basis for the optimization of the design strategy. There is a strong positive correlation between color scheme and contrast, status alert and feedback mechanism, dynamic information and operation convenience, and emotional language and user return, which indicates that these design elements can promote each other in the optimization process and jointly enhance user experience. However, there are negative correlations between illustration and decoration and contrast, font style and color scheme, and user reward and dynamic information, indicating that the optimization of certain design elements may have an inhibiting effect on other requirements. Therefore, in design implementation, it is necessary to balance the positive and negative correlations and ensure the coordination and optimization of functions, visual design and interactive experience through scientific analysis and reasonable trade-offs, so as to achieve the overall improvement of the interface design effect [
77].
According to the contradictions and conflicts obtained from the Quality House, combined with the specific situation and requirements of the interface design for ordering, the appropriate invention principles in TRIZ theory are determined to solve the contradictions and conflicts in practice, as shown in
Table 14.
The first contradiction is between illustrations, decoration and contrast. Abundant illustrations and decorations may interfere with the contrast of the main information area and affect the visibility of the information. Therefore, it is recommended to adopt the separation principle to limit illustrations and decorations to non-information areas or background areas, to avoid interfering with the contrast of the main information area in terms of functional differentiation, and to ensure that users can quickly and accurately access key information.
The second contradiction is the contradiction between font style and color scheme. Complex font styles may weaken the simplicity of the color scheme and the overall sense of visual hierarchy [
78]. In this regard, we can combine the principle of color change to optimize the collocation of font style and background color and keep the high contrast between text and background, which can enhance the readability of text and ensure the visual consistency and aesthetics of the interface.
The third contradiction is the contradiction between user rewards and dynamic information. Excessive user reward information may occupy the dynamic information area, causing information overload and reducing the efficiency of the interface [
79]. We suggest adopting the principle of self-service and designing an independent user reward module, so that users can actively query the reward information. At the same time, the dynamic information area is dedicated to ordering status or real-time feedback, which improves the efficiency of the functional partition of the interface and the smoothness of information transfer.
The fourth contradiction is between the color scheme and the contrast. The design of the color scheme may not be sufficient to support the optimization of the contrast of the interface, affecting the hierarchy and clarity of information. According to the principle of local quality, it is appropriate to adopt a high-contrast color scheme in the main information area to enhance the readability of the information, while soft colors are used in the decorative area to ensure the balance between functionality and aesthetics.
The fifth contradiction is the contradiction between status prompts and feedback mechanisms. Insufficient coordination between status prompts and feedback mechanisms may affect the timeliness and effectiveness of interaction. In this regard, we recommend adopting the principle of pre-action to plan the trigger logic of the state prompts and feedback mechanism in advance, to ensure that the user can obtain clear feedback immediately after the operation, so as to improve the smoothness and responsiveness of the interaction experience.
The sixth contradiction is between dynamic information and operation convenience. Complex dynamic information design may increase users’ cognitive burden and reduce operation convenience [
80]. We suggest adopting the replacement principle to replace complex dynamic effects with more efficient and concise forms of dynamic information presentation to reduce visual interference and information redundancy, so as to improve the fluency of user operations and interface response speeds.
The seventh contradiction is between emotional language and user return. The design of emotional language may increase the complexity of interface content, while user rewards need to be presented in a timely manner, which can easily result in information stacking. We recommend combining the dynamic principle to dynamically generate personalized user reward content and achieve the balance between emotional language and reward mechanisms through flexible presentation, so as to ensure the simplicity and efficiency of the interface while enhancing the emotional connection of the user experience.
Guided by the TRIZ invention principle, targeted solutions are proposed in combination with the actual needs of the food ordering interface. These solutions can effectively solve the contradictions and conflicts in the design, achieve the coordination and optimization of function, visual effect and interactive experience, and provide systematic optimization ideas for the design of the ordering interface generated by the subsequent AIGC.
4. Design Generation and User Evaluation
This study is based on the generative artificial intelligence (AIGC) technology architecture, which realizes dynamic mapping between user demand parameters and creative outputs through a deep learning framework and multimodal data training [
81]. With its well-trained models and the deep learning capability of massive data, AIGC is able to generate relevant innovative content according to the given design conditions and demands, which effectively promotes perceptual design and engineering multifaceted integration, thus significantly improving the creative efficiency of designers [
82].
In the application of specific generative tools, MidJourney is chosen as the design generation platform in this study. MidJourney can provide users with accurate image generation services through its powerful generative capabilities and flexible cueing mechanism, which combines Generative Adversarial Networks (GANs) and dynamic cueing optimization algorithms. By using the text–image model, designers are able to semantically deconstruct and weight perceptual images to generate design solutions that meet the user’s perceptual needs. In particular, in the design of the ordering interface, MidJourney’s cue word function is used to accurately adjust the design elements to ensure that the design meets the user’s functional needs, emotional demands, and visual preferences.
In this process, the neural network processes user-input design parameters (e.g., “modular layout”, “feedback mechanism”, “font style”, etc.) and combines them with the design parameters derived from the AHP–QFD method. The neural architecture processes user input design parameters (e.g., “modular layout”, “feedback mechanism”, “font style”, etc.) and combines them with weights derived from the approach to guide the generation of design outputs. Specifically, the neural architecture can dynamically generate multiple candidate design outputs based on the priorities and weights of these design inputs, ensuring that the generated design solutions meet the specific requirements of users in terms of functionality, emotional needs and aesthetic experience (AHP–QFD) [
83].
Meanwhile, the use of APIs allows designers to modify the generated design outputs in real time [
84]. During the design process, the input parameters (e.g., adjusting the weights between color scheme and contrast) used to refine the design bring it in line with user needs, which greatly enhances the flexibility and operability of the design and enables the generated design to be highly compatible with the emotional and visual needs of users while meeting the basic functional requirements.
AIGC provides a powerful tool to ensure that the design can be continuously optimized and conform to specific user needs and design goals, which not only improves the efficiency and quality of the ordering interface design, but also provides a theoretical and practical path that can be referred to for generative design in other fields.
4.1. Generating a Design for the Ordering Interface
In MidJourney, controlling the weight of cue words can be achieved using “::”. For example: keyword1::weight1 keyword2::weight2 .... This directs more attention to certain words or concepts when generating images [
85].
Based on the previous conclusions, we can determine that module partitioning, status alerts, dynamic information and feedback mechanisms are the core elements required to optimize the interface design. Meanwhile, color scheme, font style and contrast also play an important role. Subsequently, based on the weight values, the top five functional elements with the highest weight values were selected, as shown in
Table 13. In order to simplify the parameter coding and AIGC processing logic of the subsequent design hints, the original relative weight value (W
k) is multiplied by 100 and then rounded up to obtain the integerized “perceptual weight index”. The perceived intention words of the interface for design ordering were as follows: 17 for state hints, 17 for feedback mechanisms, 15 for ease of operation, 14 for dynamic information columns, and 12 for modularized layout. This generates the design cue: “A restaurant ordering interface, including the main menu area, dish display area, shopping cart and order confirmation area, with intuitive status alerts::17, interactive feedback mechanism::17, ease of operation design::15, dynamic information display bar::14, simple modular interface layout::12, natural light source, soft-focus lens, high-definition, modern minimalist style, warm colors and soft light -v 5 -ar 9:16 -s 250.” Then, we adjust the relevant parameter settings: see
Figure 8.
In the design process, the weighted sum formula is used to calculate the design elements, and the design is optimized according to these calculations, so that the weights of the elements are reasonably adjusted according to the actual importance of the requirements used. The method of multiple iterations and local adjustments is used to reduce the impact of deviation through multiple corrections and the optimization of the design scheme; this finally forms the interface design that meets the user’s perceptual needs and ultimately generates three design schemes. See
Figure 9.
4.2. Design Efficiency Verification
In order to verify the efficiency of the Dual-Path Optimization Model in UI design tasks, six graduate students who are proficient in UI design were invited to act as the control group [
86]. All graduate students had professional UI design abilities and proficient software skills. They participated in the execution of the traditional design process and the “two-path optimization model” process, carrying out three types of standardized design for the ordering interface. The actual time consumed in each design phase was recorded through time logs, and the time required by the traditional manual design method and the “two-path optimization model” process was determined. The results show that, in the first-draft-generation stage, the traditional design method takes 42.5 h, while the “two-path optimization model” process takes only 1.2 h, which is the most significant time compression. The Dual-Path Optimization Model saved the most time in the full schematic design phase, with a reduction of 123.9 h. In the design conception phase, the time difference between the traditional method and the optimization model is relatively small due to the need for creative diffusion, as shown in
Table 15. These data indicate that the Dual-Path Optimization Model has significant advantages in improving design efficiency, especially in the first draft and the generation of the complete solution.
4.3. AIGC Generation Stability Verification
In order to validate the stability and repeatability of the ordering interface design, a three-stage control strategy is used to ensure the reliability of the results [
87]. First, the same design cues were independently generated 10 times and global consistency was quantified using the Structural Similarity Index (SSIM = 0.82 ± 0.03) and CLIP semantic similarity (0.76 ± 0.05). The average retention rate of the key design elements was 89.4%, with a
p-value of less than 0.05. Second, the randomness of the design styles was significantly reduced by transforming the AHP weights into what became a fixed parameter of MidJourney through weight locking and reinforcing the interface design elements. The experimental results show that the variance of the ordering interface design is reduced by 62% after optimization with σ
2 = 0.08 → 0.03. The sensitivity test shows that, when the weights fluctuate ±10%, the SSIM change rate is less than 5% (
p > 0.1), which indicates that the method has high robustness and can support the application of ordering interface design.
4.4. User Evaluation
The online questionnaire assessment method is used to verify the perceived needs of the ordering interface design program, and a quantitative user perception assessment system is constructed through the questionnaire star platform [
55]. The data collection process implements a multi-platform stratified sampling strategy, and the questionnaire links are accurately placed on social media (WeChat, Weibo, Xiaohongshu) and professional design communities (Zhanku, Pinterest, Behance), effectively covering the user groups aged 18–65 years old with interface cognitive abilities. After filtering using the screening criteria (no visual perception impairment, experience in operating mobile terminals), a total of 135 valid samples were obtained (the validity rate of the questionnaire was 95.5%), as shown in
Figure 10. In the “operation and function” scheme, the scores of complexity–simplicity, discomfort–comfort, ambiguity–intuition, and distraction were relatively high, all above 8. In addition, the vocabulary scores of “Visual and Emotional Impact “and “Interaction and Feedback Experience “are clearly directional. The evaluation results show that users’ satisfaction with these three design solutions is high, indicating that all of these solutions can effectively meet users’ perceived needs for interface design. This result verifies the feasibility and scientificity of the key input statements, which reduces the randomness of MidJourney’s output and increases the controllability of the results at the same time. This reduces the randomness of MidJourney’s diagrams and increases the controllability of the results, allowing us to calculate the design elements’ weighted summation formula and optimize the design based on the results of these calculations.
5. Discussion
In this study, the proposed dual-path design optimization framework of “requirement mapping–contradiction resolution” was successfully applied to the design of food ordering interfaces. We achieved certain application results. However, the analysis still needs to be deepened and integrated. In particular, it is necessary to address theories from a wider range of fields, exploring the connections and differences between related literature on interface design, emotional user experience, and generative artificial intelligence and this research framework. Therefore, future research will compare and contrast this framework with existing design literature to further validate its theoretical contributions and generalizability, exploring its potential for wider applications.
From a methodological perspective, this study also has some limitations. First, the small sample size of the expert assessment fails to adequately represent the diversity of various design contexts and user needs, which may limit the broad applicability of the model results. In addition, the lack of empirical user feedback further limits the practical value of the results. Therefore, future research will expand the sample size, adopt a combination of subjective and objective collection methods, and incorporate user feedback to enhance the scientific and practical feasibility of the study.
This study focuses on the design optimization of the interface, but the applicability of the model to other digital domains or different cultures and user backgrounds necessitates an investigation of the application of the framework to other domains, such as e-commerce, education, etc., in order to validate its universality. User needs and design elements may differ in different domains, so applying the model to these domains for research can further prove its effectiveness. In addition, users in different cultures may differ in their emotional needs, aesthetic preferences, and interaction habits, and the question of how to adapt the design framework to different cultures is another important direction. Through cross-cultural comparisons and global user data analysis, the design elements and weights in the model can be optimized to better meet the needs of global users.
In addition, the lack of sensitivity analysis and scenario modeling has prevented the robustness of the model from being fully validated. Sensitivity analysis can help identify fluctuations in the model’s performance in different environments, while scenario modeling can help simulate diverse user needs and further assess the model’s effectiveness under different conditions. Future research could incorporate these analytical approaches to provide a more comprehensive assessment and ensure the model’s adaptability in complex real-world environments.
Generative AI has significantly improved design efficiency and creative outputs in the current design field, but it also raises several ethical issues, such as data privacy, algorithmic bias, and creative plagiarism, especially in terms of data handling, user privacy protection, and originality. Therefore, future research needs to focus on these ethical challenges and propose practical solutions. This may include the development of more transparent and fair algorithms to ensure that AGCI complies with privacy protection regulations when processing user data, as well as the establishment of corresponding legal frameworks and industry standards to regulate the copyright attribution and creation process of AI-generated content. In addition, promoting the fairness, transparency and interpretability of AIGC technology may help reduce algorithmic bias and safeguard the diversity and inclusiveness of design outcomes.
At the same time, limitations at the technical level should be of concern. Overfitting the training data may lead to a lack of true innovation in the generated designs, and over-reliance on historical data and pre-existing patterns may limit the performance of AI in terms of novelty and uniqueness. Therefore, future research should not only address ethical issues but also focus on technical bottlenecks to develop more innovative and diverse generation algorithms to minimize the risk of overfitting and ensure the uniqueness and creativity of AI-generated designs.
In addition, AIGC provides significant support in the design creativity stage, but its output cannot completely replace the manual design, although it can make MidJourney move gradually closer to our design needs by constantly refining the key prompt statements. However, when there are too many design elements, its output comes with a great deal of randomness, and the pictures are more inclined to the artistic style, and if it is applied to the landing product when the key phrases are too broad and the number is too large, it cannot show the designers’ desired outputs.
Future research should not only further improve the design optimization framework proposed in this study but also pay attention to the wide application of generative AI in affective design, as well as cross-domain migration capability, ethical issues, and methods of combining it with artificial design. Through multi-dimensional research, more complete and in-depth theoretical guidance can be provided for emotionally sensitive interface design and its application in digital AIGC products.
6. Conclusions
In this study, an innovative dual-path design optimization framework of “demand mapping–contradiction resolution” is proposed by integrating several theoretical models: KE, AHP, QFD, and TRIZ. This significantly improves the efficiency of the ordering interface design, its visual attractiveness, and the satisfaction of users’ perceptual needs. Firstly, KE provides demand-oriented theoretical support for interface design by capturing users’ emotional needs and aesthetic preferences; AHP analyzes complex problems hierarchically and clarifies the weight of each user’s demand, thus ensuring scientific and precise design decisions; QFD accurately transforms user demands into design elements, effectively optimizing resource allocation and improving design efficiency; and TRIZ provides innovative solutions to design conflicts and ensures a good balance between functionality and aesthetics in interface design. This combination of multi-theoretical models not only provides a systematic methodology for ordering interface design but also provides a useful reference for research in other digital interface design fields.
Second, this study innovatively introduces AIGC technology into the design process, specifically applying the MidJourney tool. We combine users’ perceptual needs and design weights to quickly generate diversified design solutions, which not only greatly improves the design efficiency, but also quickly produces results that meet the users’ psychological expectations when responding to the diverse user needs. In addition, through weight locking and parameter adjustment, this study ensures the stability and repeatability of the AIGC results, which provides a practical basis for the wide application of AIGC technology in the design field.
Finally, the study verifies the effectiveness of the optimized ordering interface through user evaluations and feedback mechanisms. Questionnaire surveys and statistical analyses clarify user preferences across different design solutions, offering robust data support for further design refinement.
Future research may continue exploring how to apply this framework in evolving practical contexts, ensuring that interface designs consistently align with user expectations and market trends—thereby fostering sustained innovation and development across various design domains.


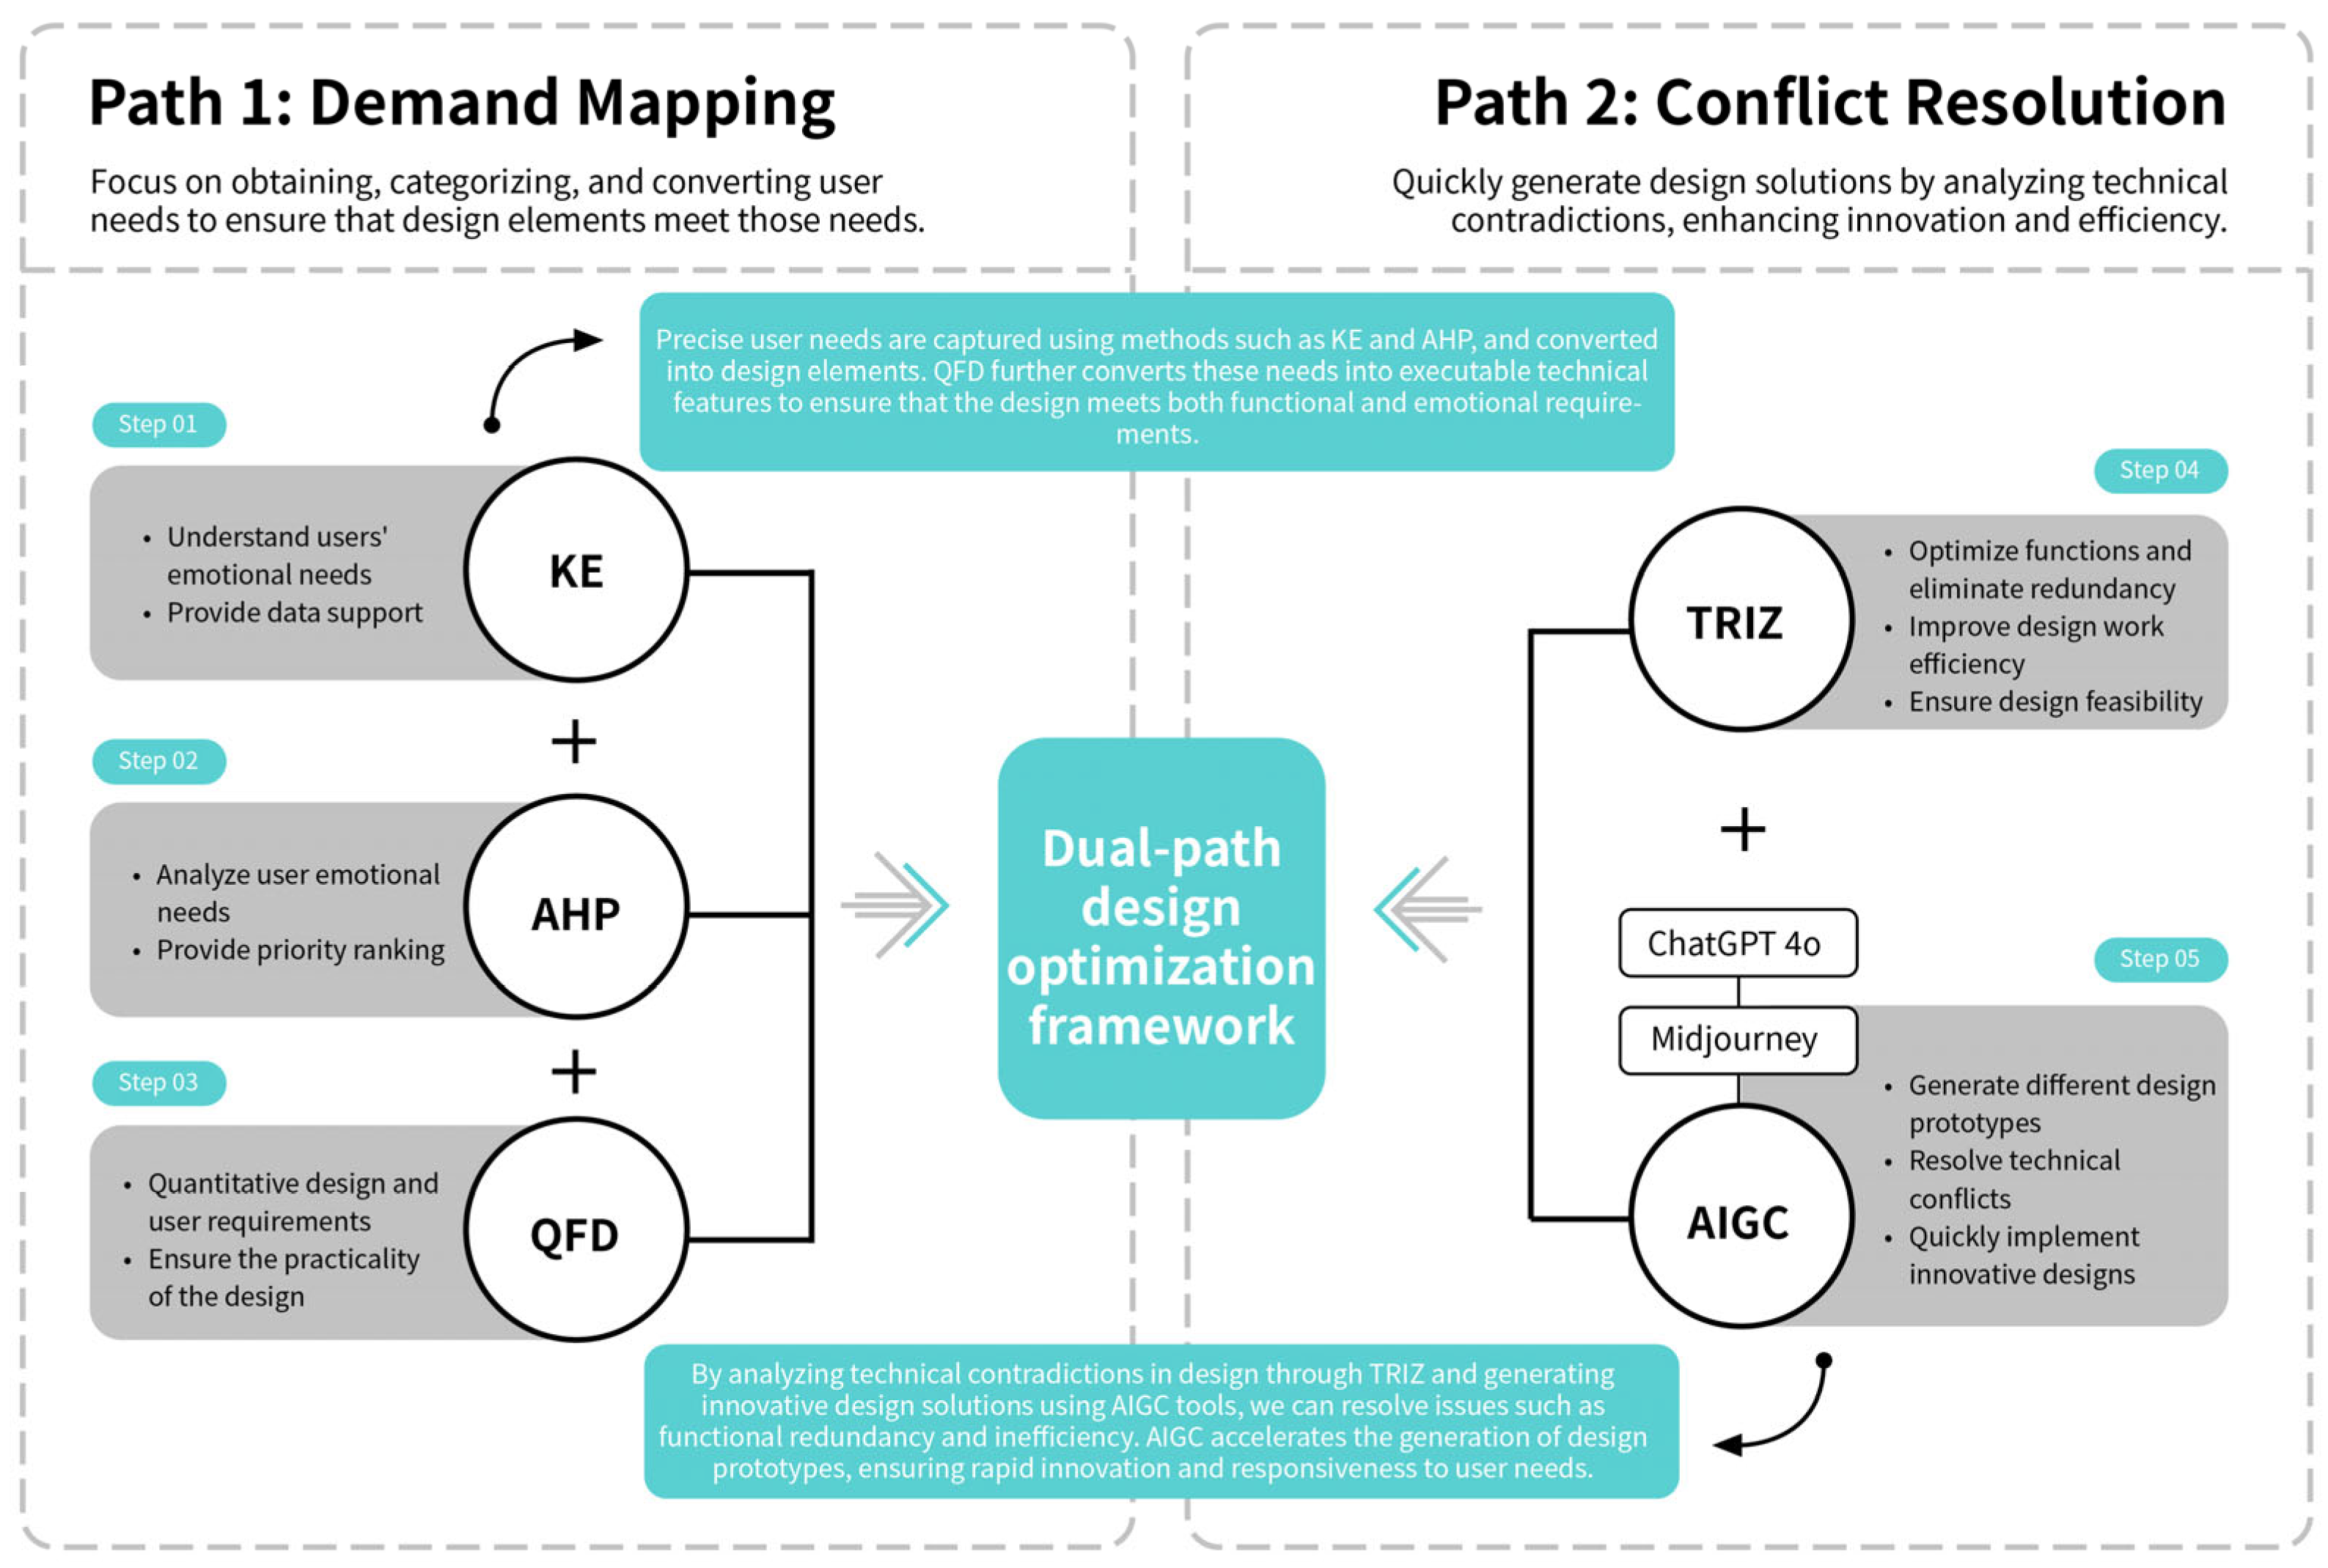
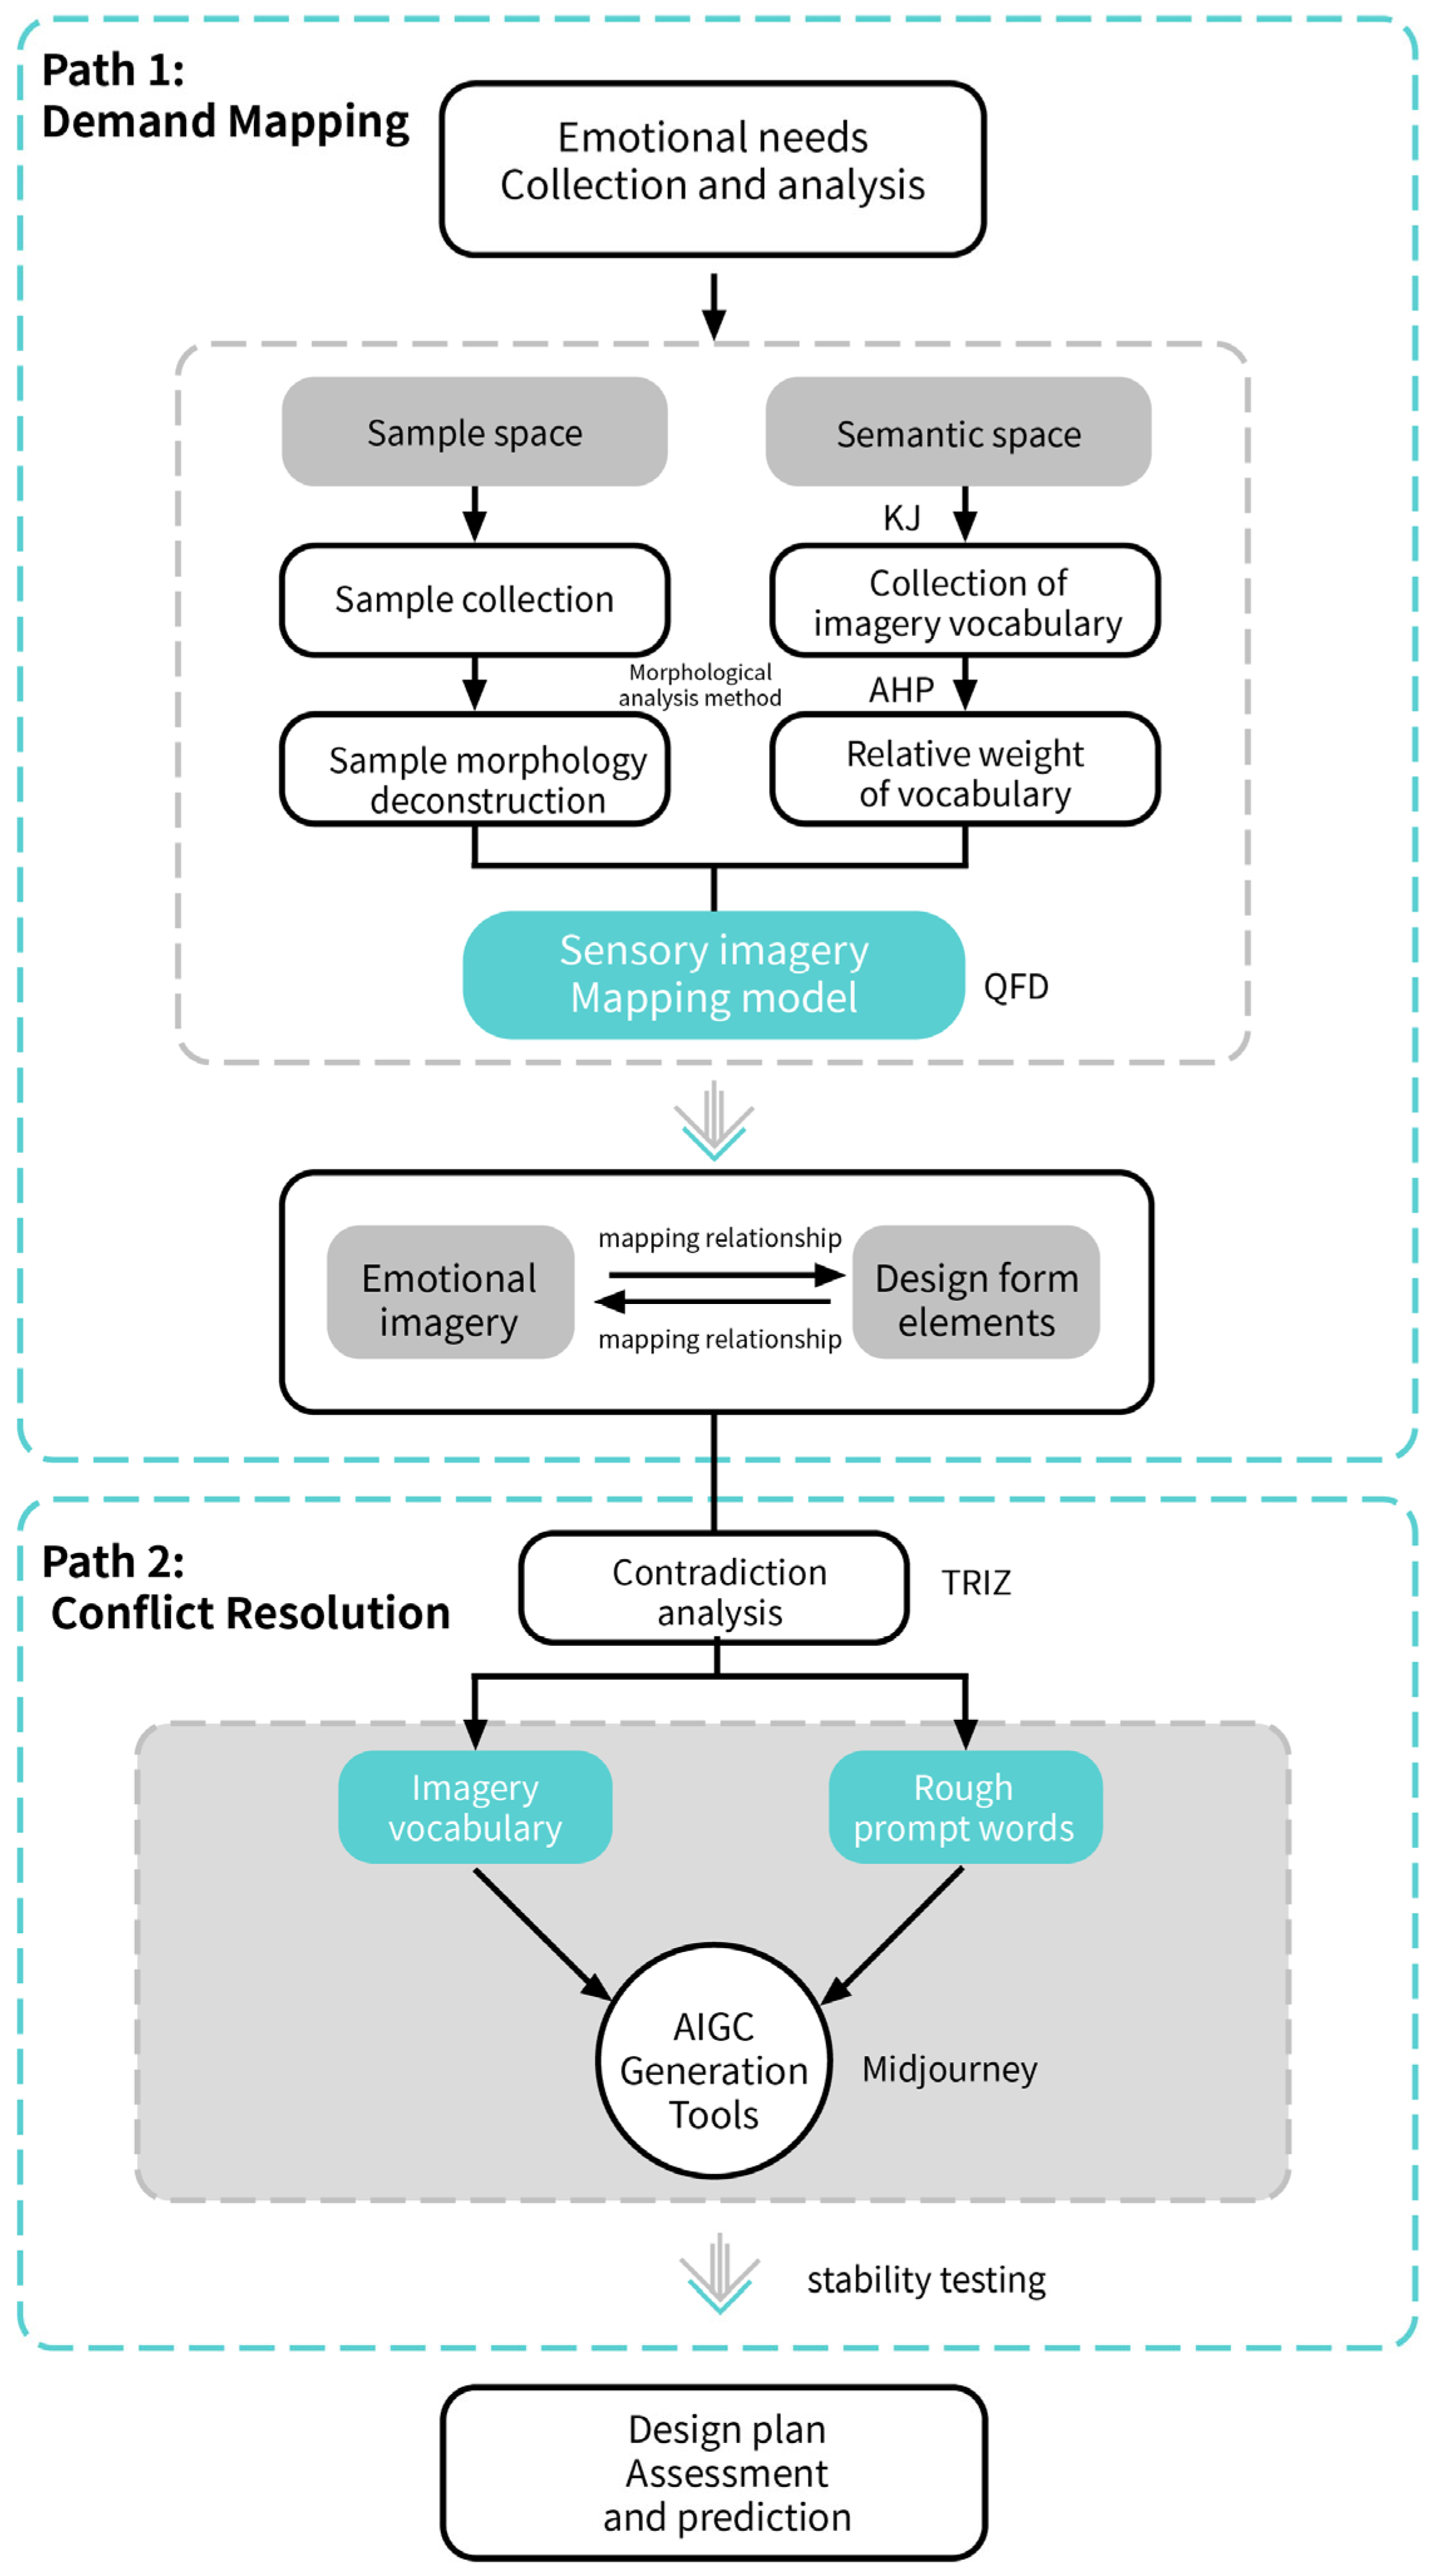
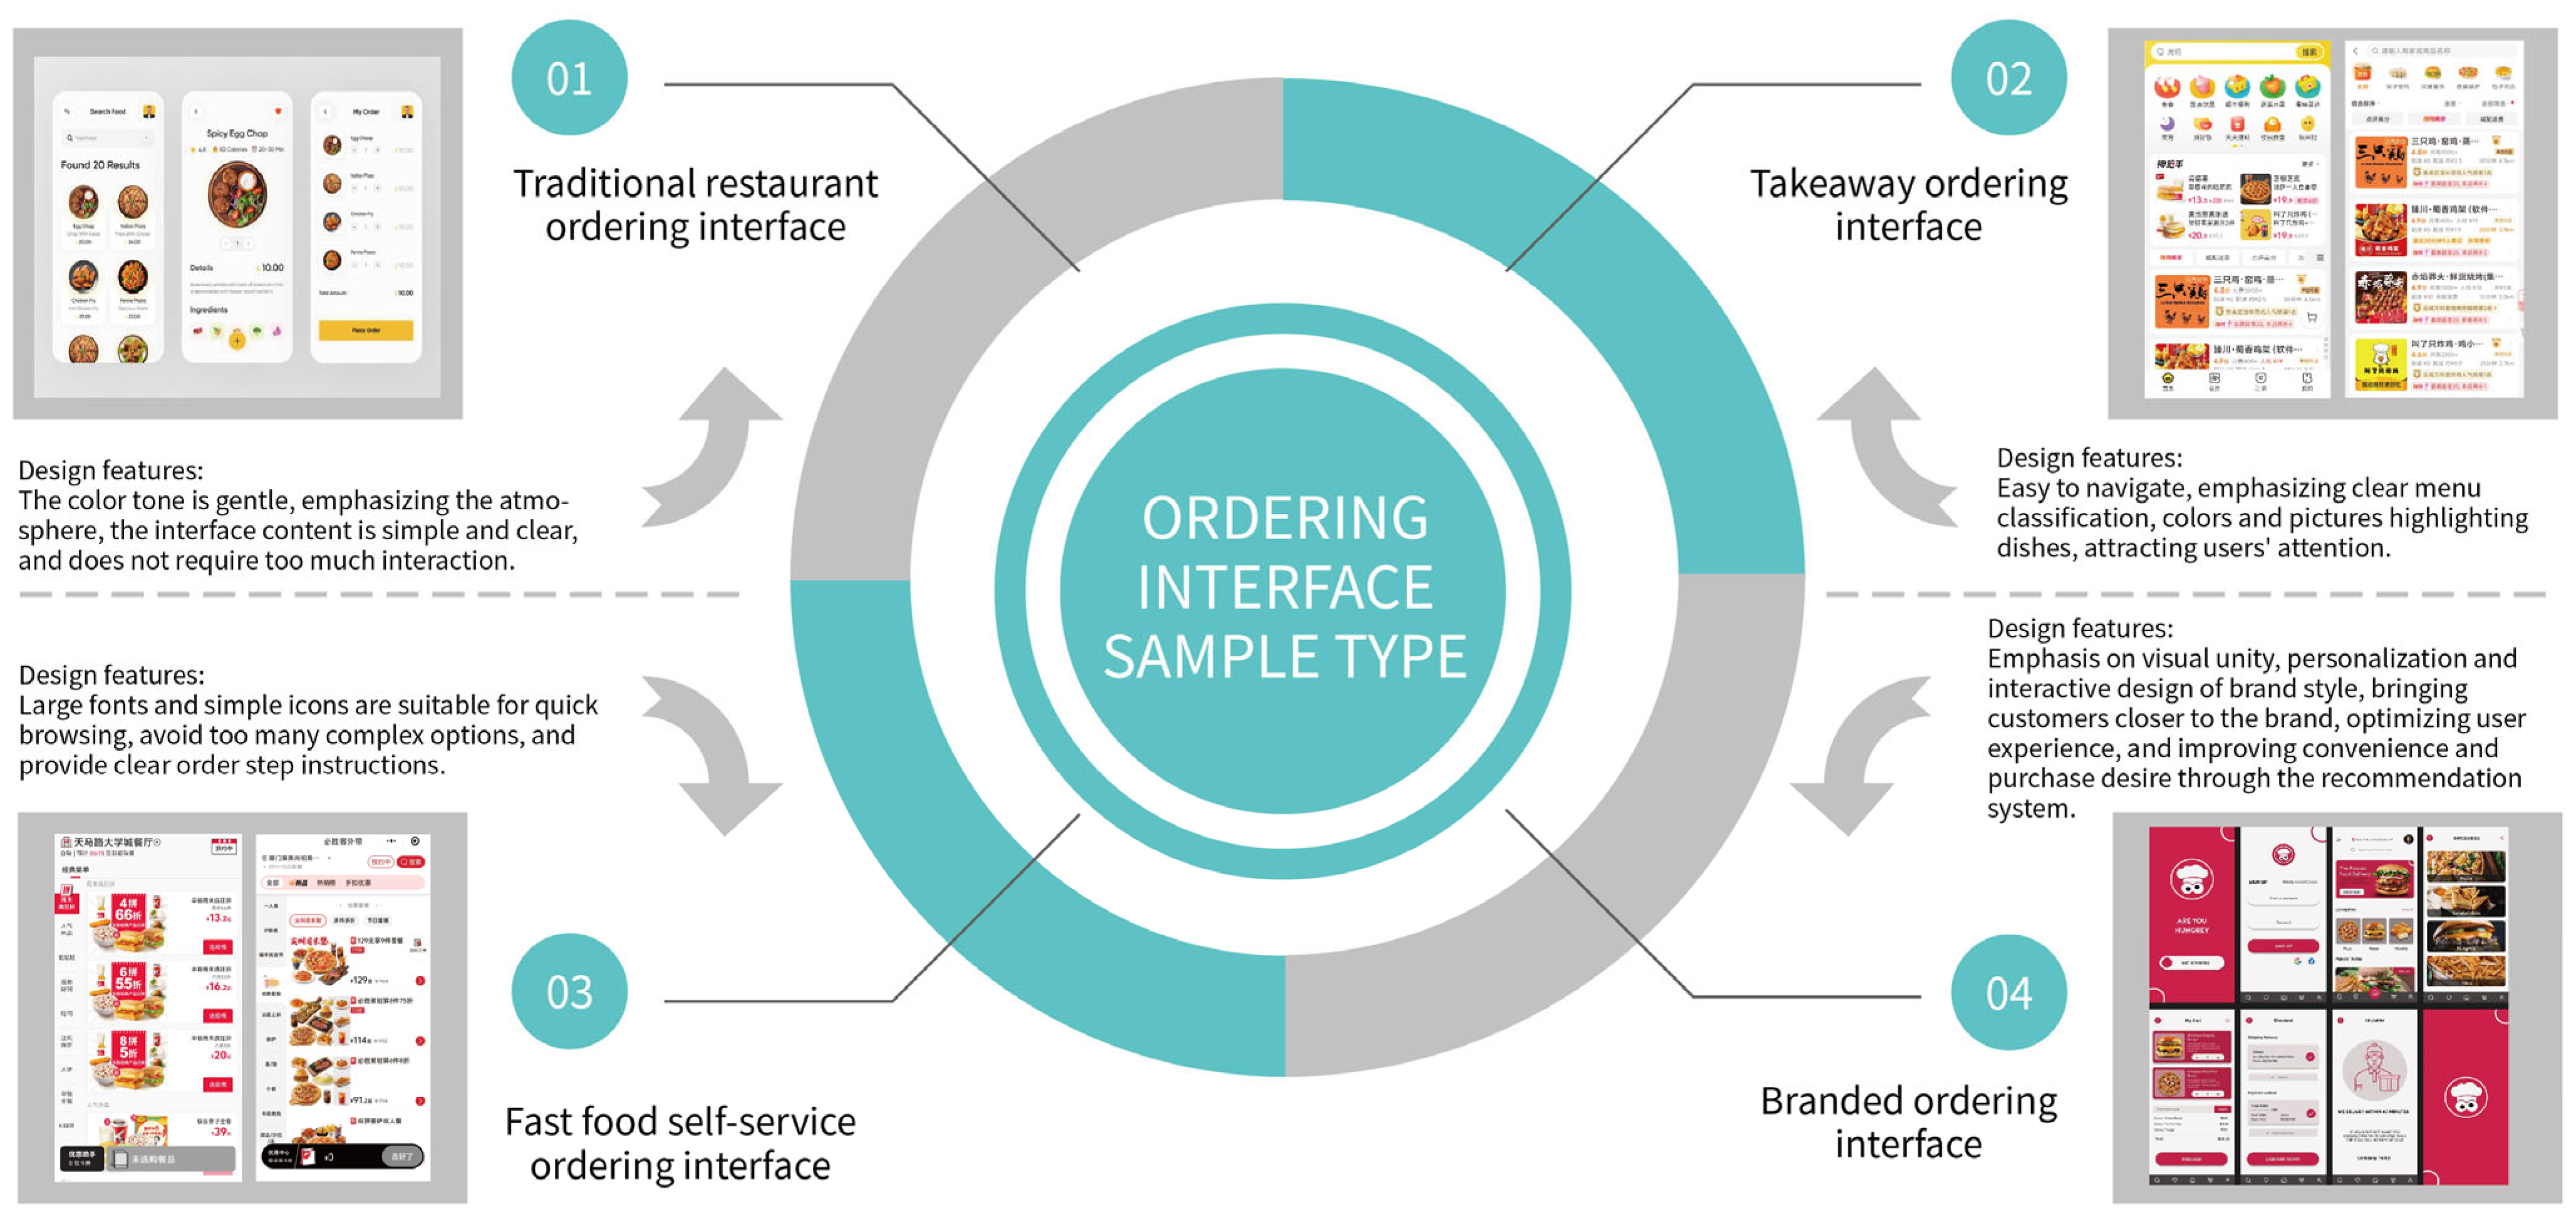
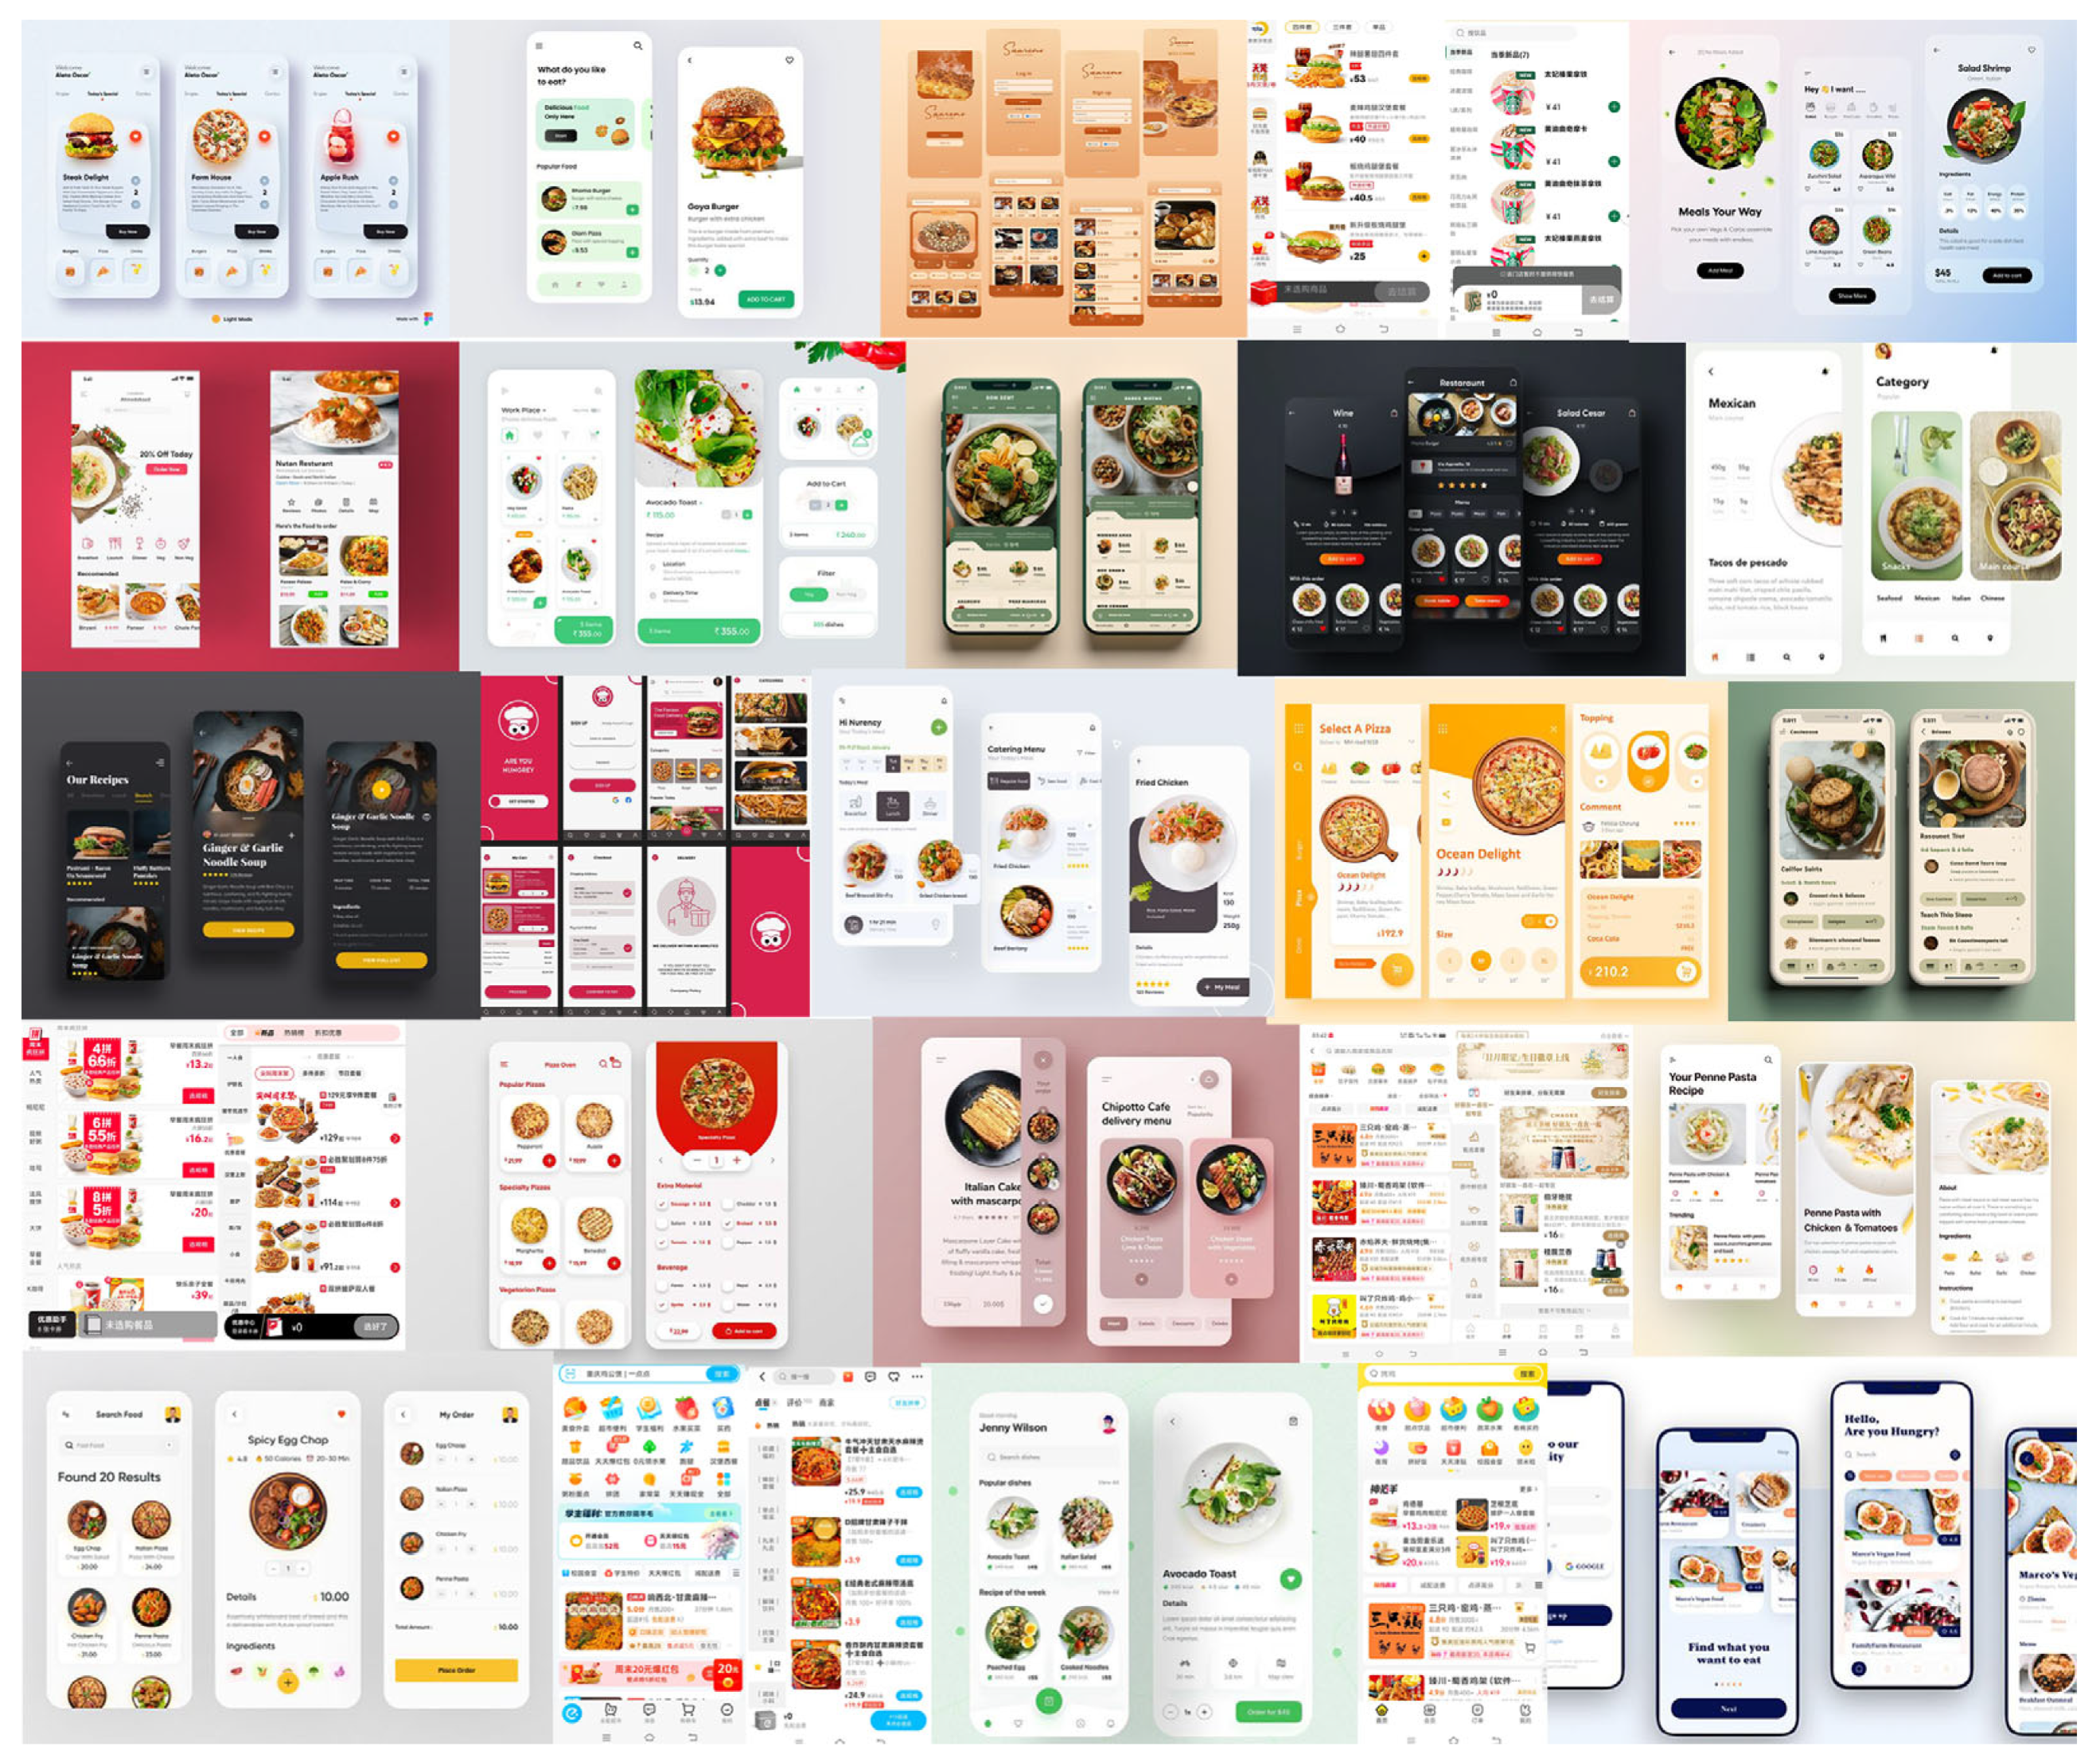
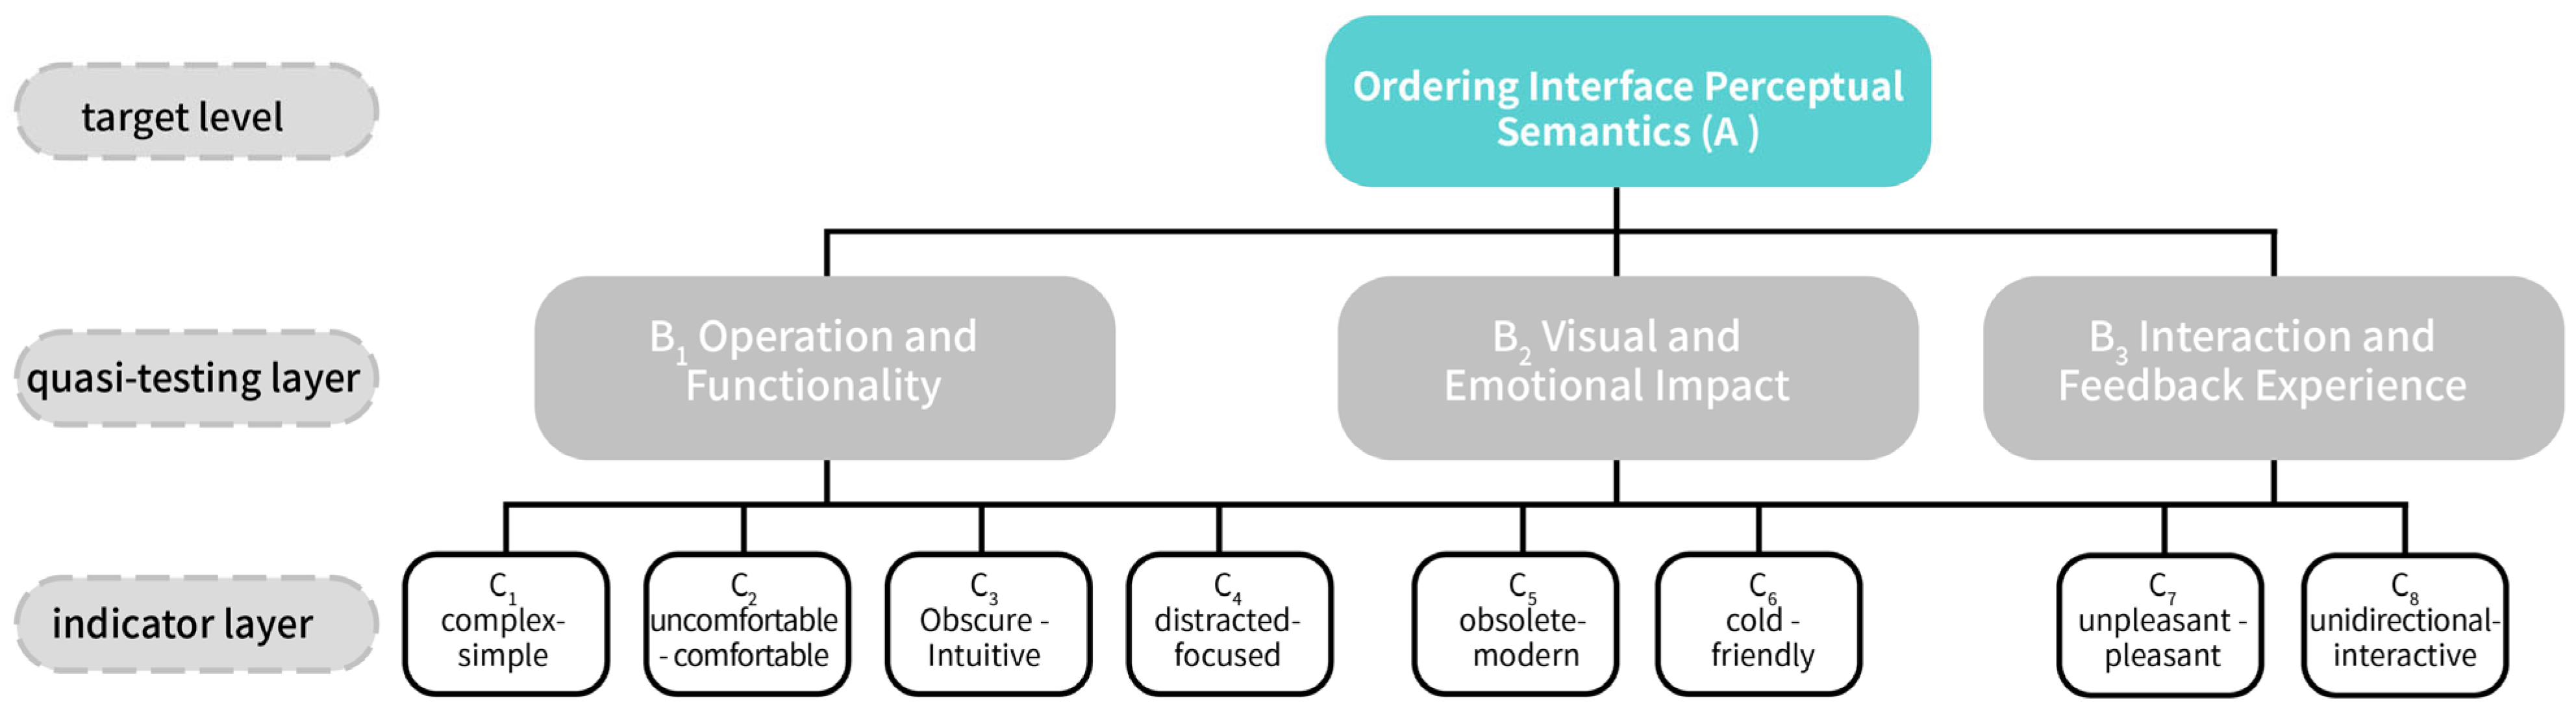
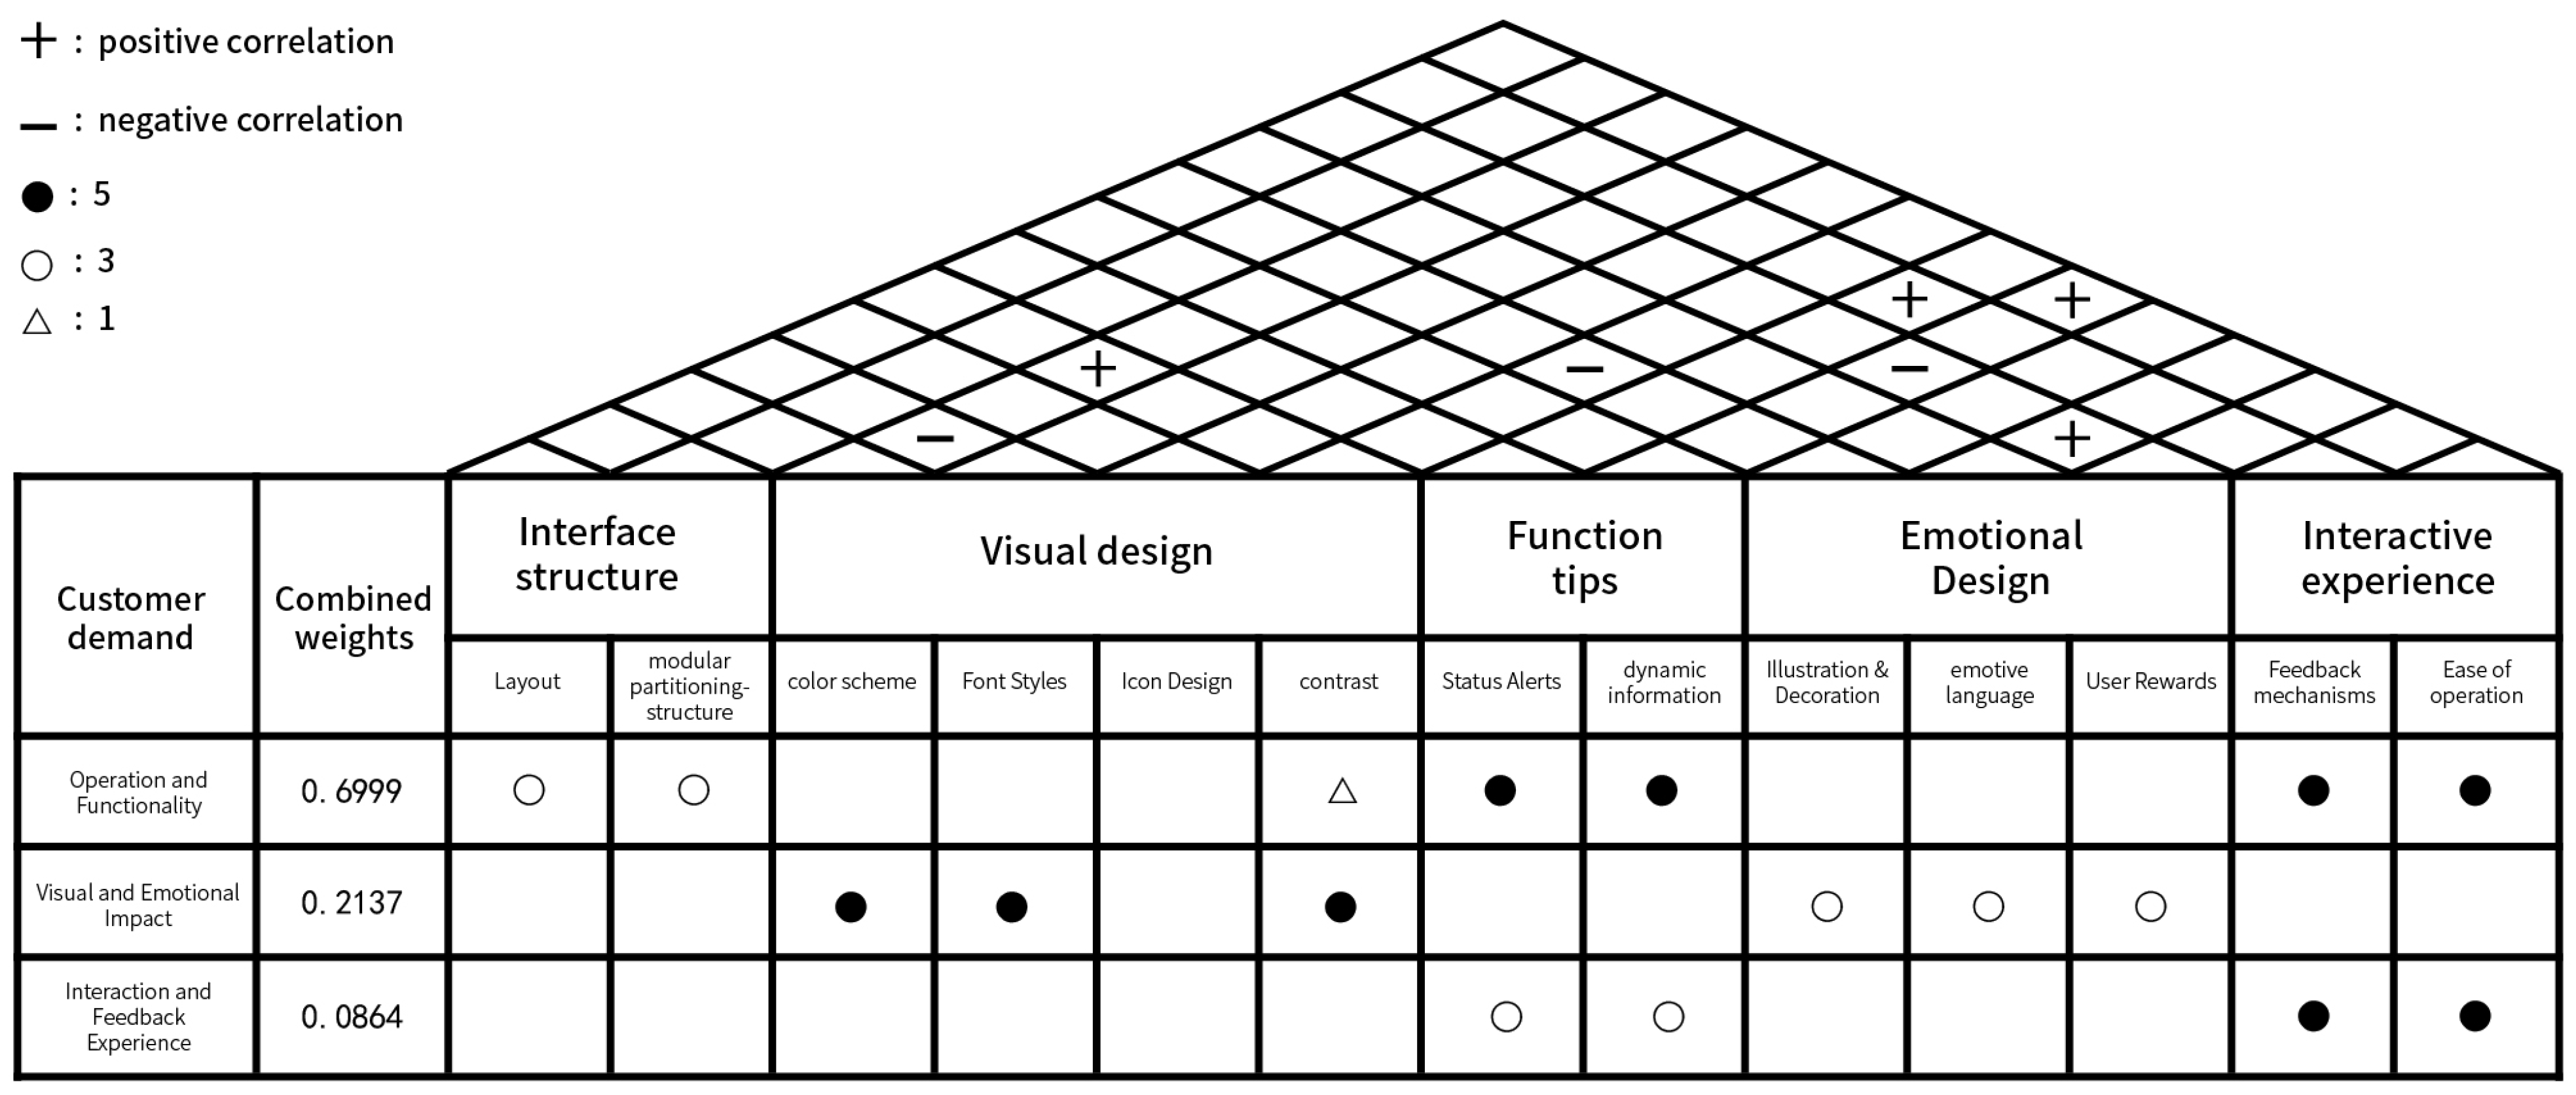
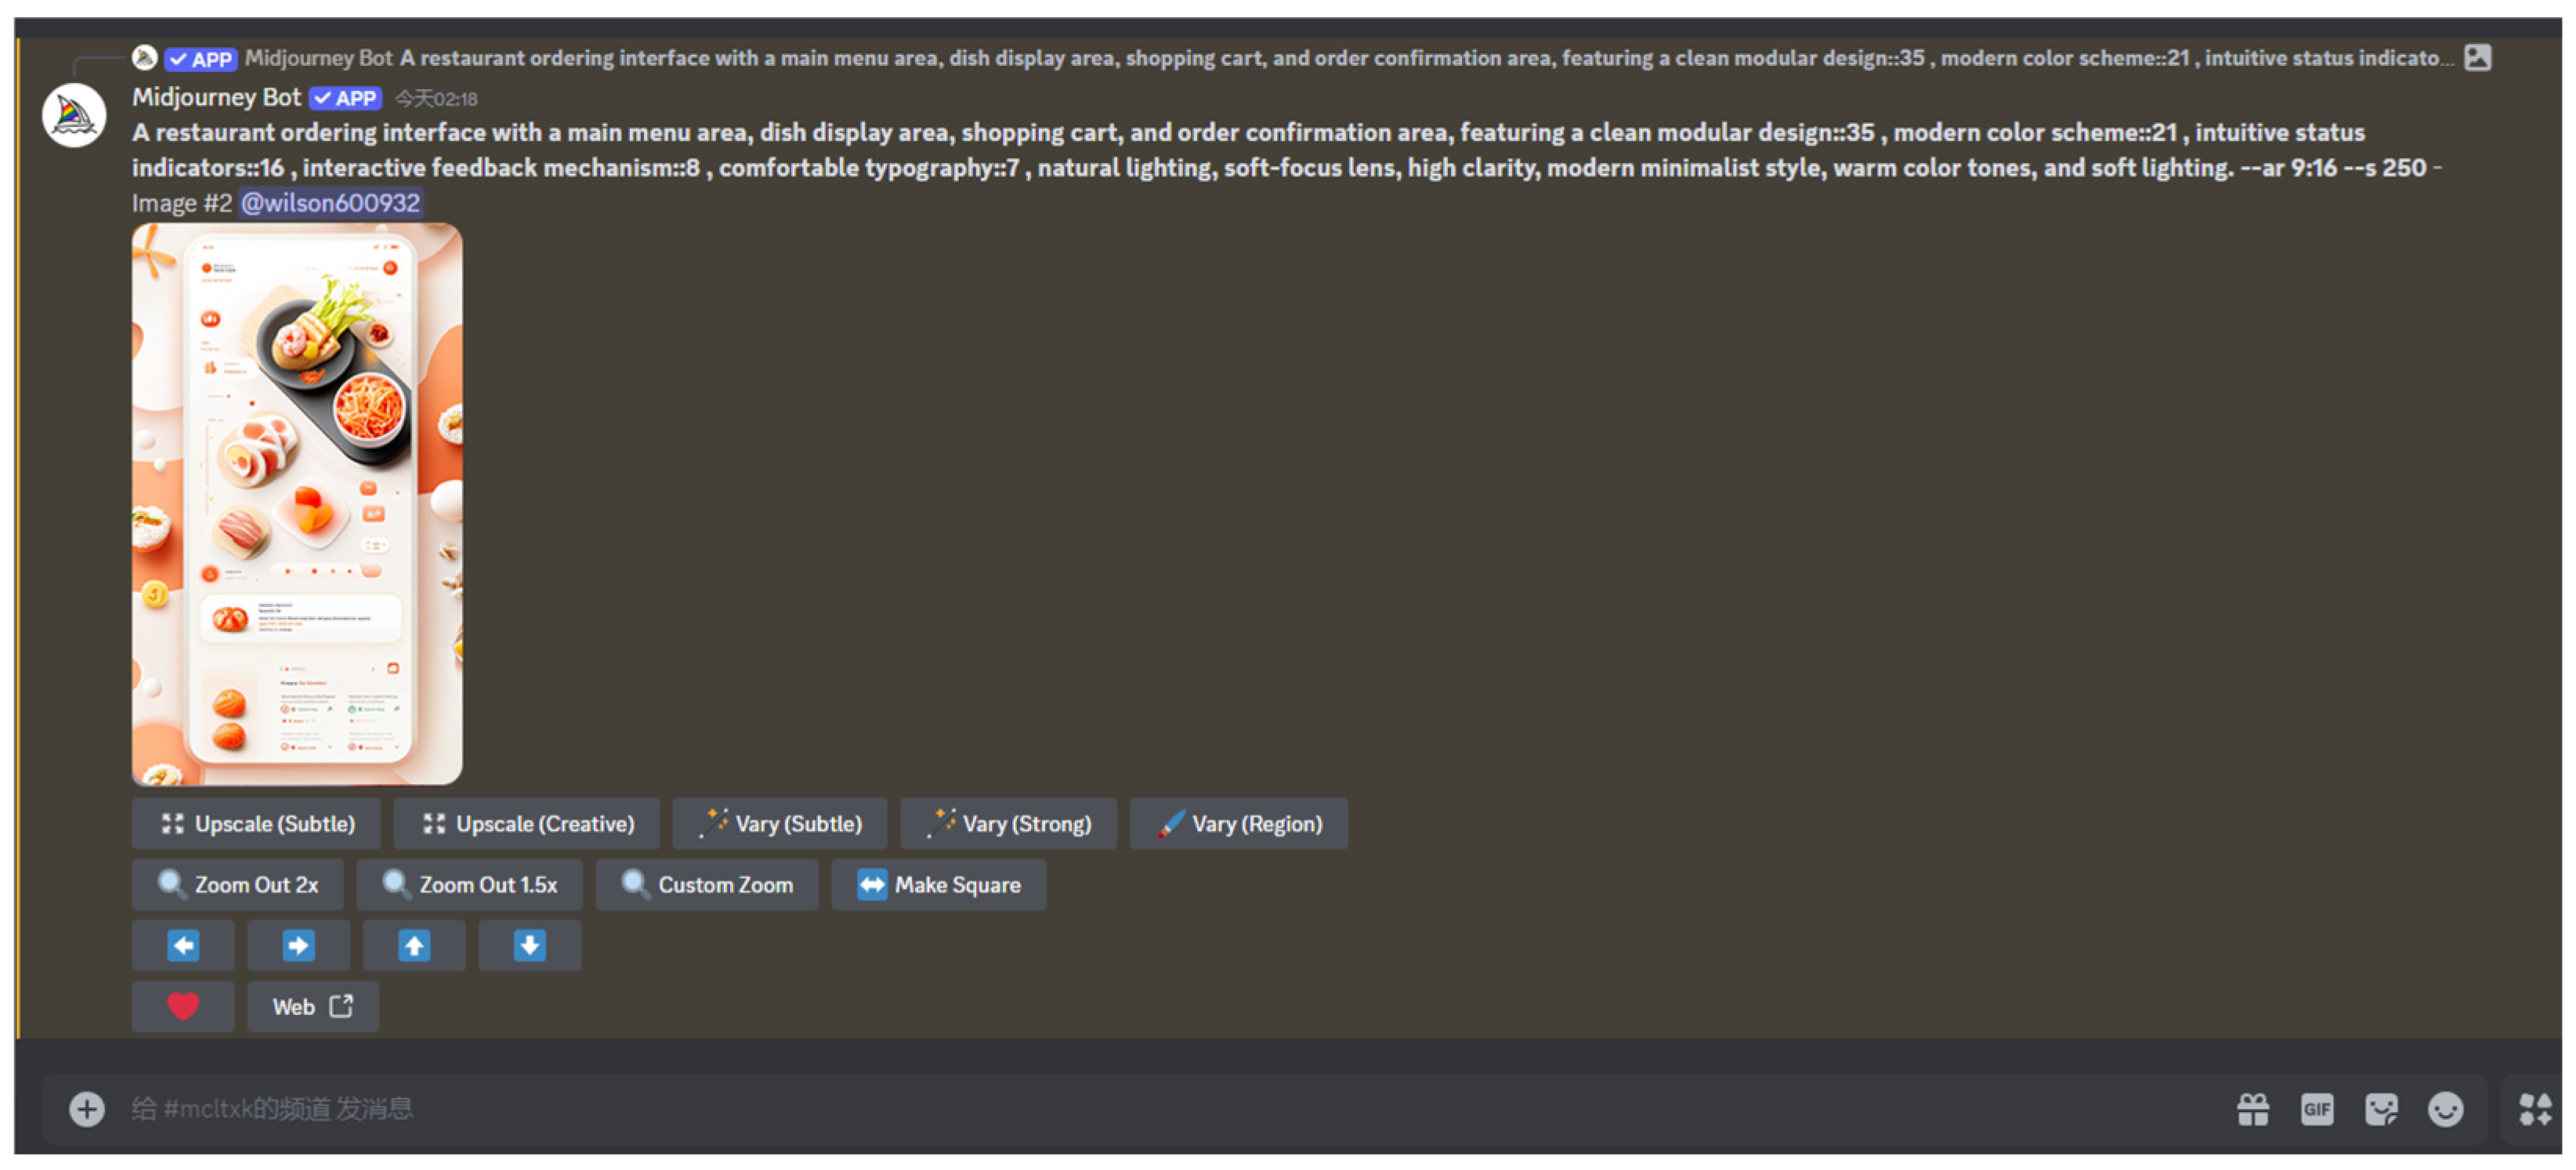
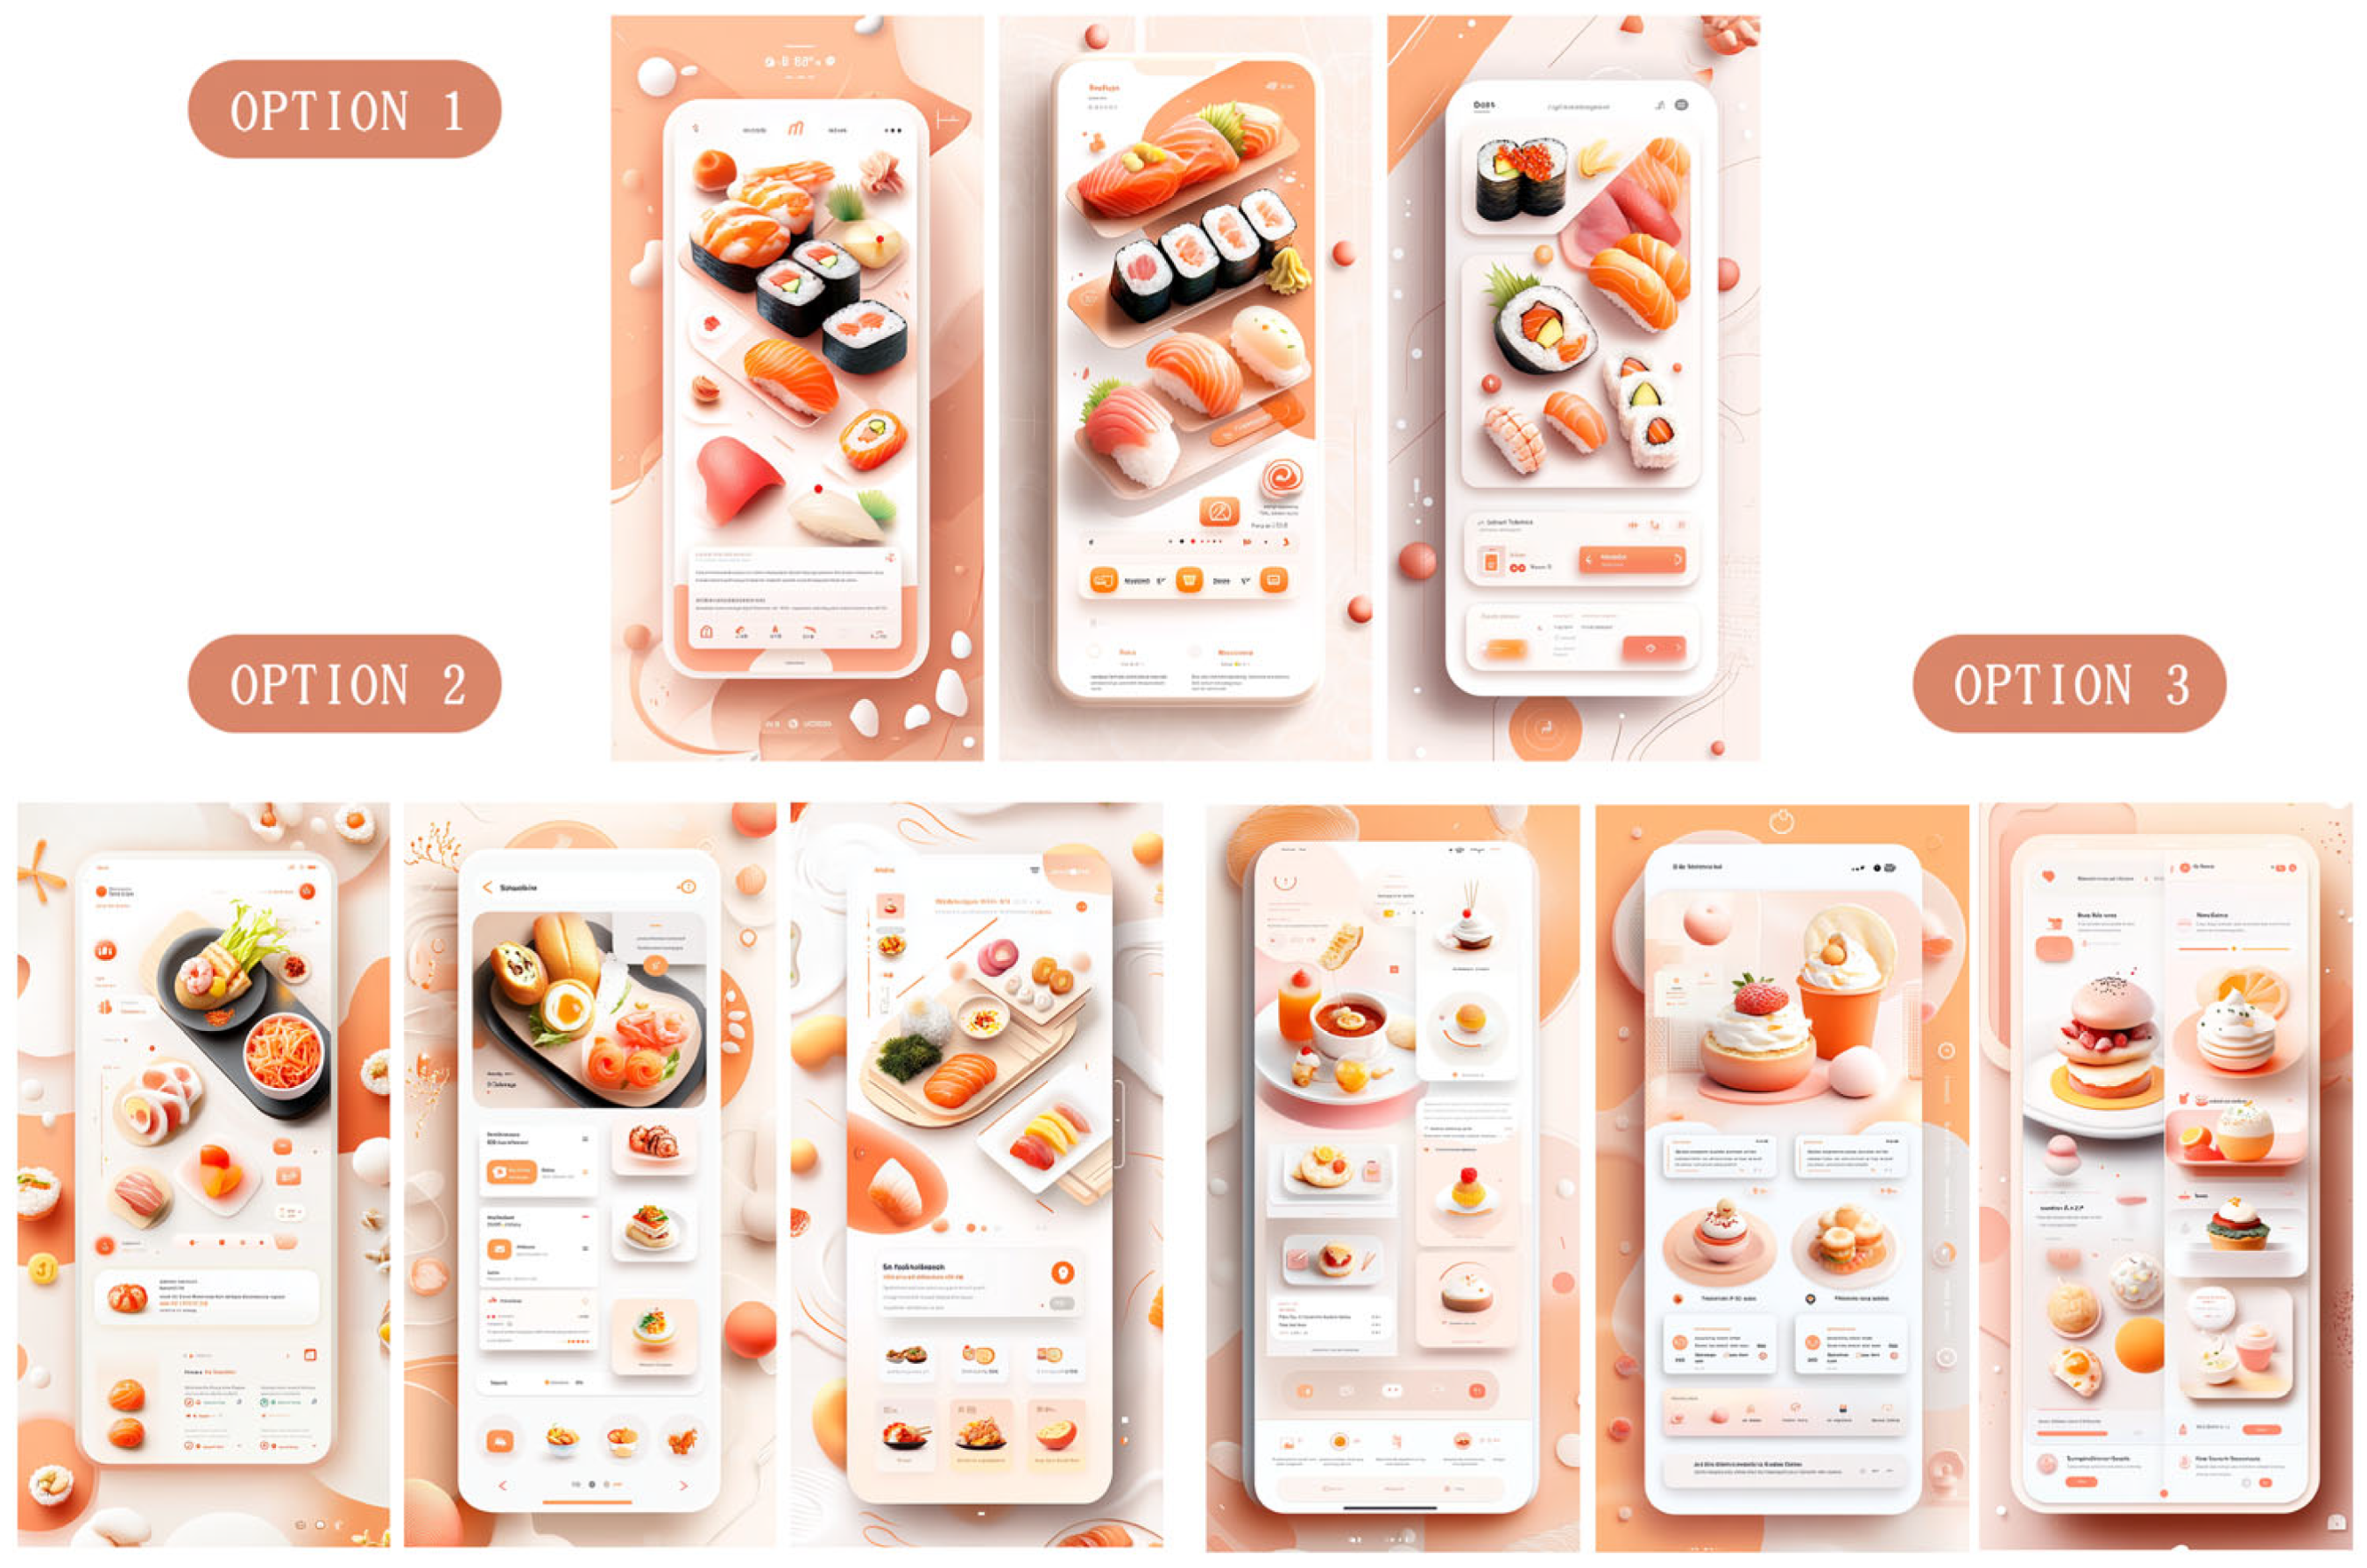
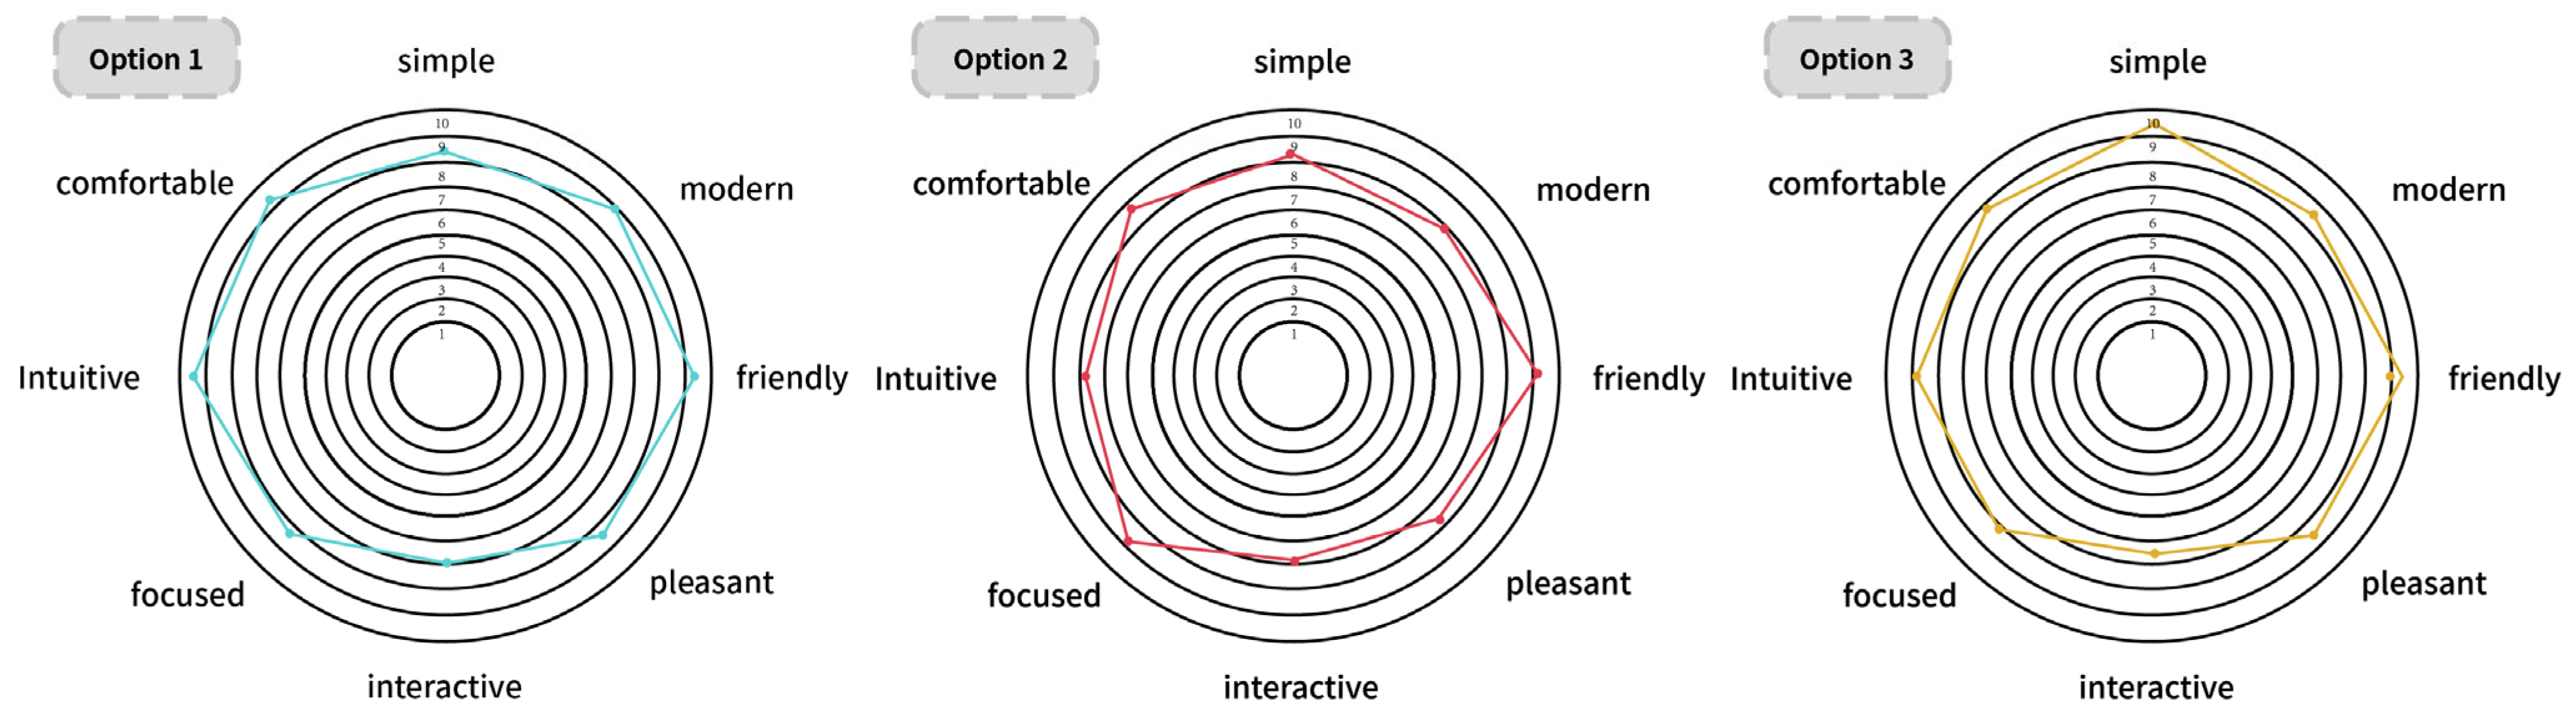
