Article

An Intelligent Thermal Management Strategy for a Data Center Prototype Based on Digital Twin Technology

1
School of Aeronautics Science and Engineering, Beihang University, Beijing 100191, China
2
China Communications Information & Technology Group Co., Ltd., Beijing 101399, China
3
School of General Engineering, Beihang University, Beijing 100191, China
4
Institute of Thermodynamics, Technical University of Munich, 80333 Munich, Germany
*
Author to whom correspondence should be addressed.
Appl. Sci. 2025, 15(14), 7675; https://doi.org/10.3390/app15147675
Submission received: 5 June 2025 / Revised: 30 June 2025 / Accepted: 30 June 2025 / Published: 9 July 2025
(This article belongs to the Special Issue Multiscale Heat and Mass Transfer and Artificial Intelligence)

Abstract

Data centers contribute to roughly 1% of global energy consumption and 0.3% of worldwide carbon dioxide emissions. The cooling system alone constitutes a substantial 50% of total energy consumption for data centers. Lowering Power Usage Effectiveness (PUE) of data center cooling systems from 2.2 to 1.4, or even below, is one of the critical issues in this thermal management area. In this work, a digital twin system of an Intelligent Data Center (IDC) prototype is designed to be capable of real-time monitoring the temperature distribution. Moreover, aiming to lower PUE, Deep Q-Learning Network (DQN) is further established to make optimization decisions of thermal management during cooling down of the local hotspot. The entire process of thermal management for IDC can be real-time visualized in Unity, forming the virtual entity of data center prototype, which provides an intelligent solution for sustainable data center operation.

1. Introduction

Data centers constitute the critical information infrastructure underpinning global digitalization, with accelerating service demand driven by data-intensive technologies, including artificial intelligence, smart energy systems, distributed manufacturing, and autonomous vehicles [1]. This growth trajectory, however, engenders substantial sustainability challenges: data centers contribute to roughly 1% of global energy consumption and 0.3% of worldwide carbon dioxide emissions [1,2], and this energy consumption has doubled every four years over the past decade [3]. Such resource intensity directly contravenes international carbon neutrality imperatives, positioning energy optimization in data centers as a research priority of significant environmental and economic consequence. Energy consumption in data centers mainly attributes to the cooling systems, which occupy nearly 50% of the total energy usage [4,5]. Power Usage Effectiveness (PUE), defined as the ratio of total facility energy to IT equipment energy, has emerged as the principal metric for evaluating energy efficiency. The lower the PUE, the higher the energy efficiency of a data center. Reducing PUE from present averages of nearly 1.4 towards optimal theoretical values of 1.0 requires significant improvements in cooling strategies, especially as server densities continue to increase.
High-efficiency cooling strategies have drawn significant attention to lower PUE. Beyond traditional data centers, the concept of intelligent data centers (IDCs) has been recently proposed with the development of artificial intelligence (AI) technology. For example, the DeepMind group from Google [6,7] has implemented AI-controlled water-cooling systems to save energy consumption of Google cloud data centers. The performance leveraging AI techniques has shown a decline in annual average PUE to ~1.1, which saves a total energy consumption of 15~40%. Aiming to achieve the intelligent thermal management, real-time temperature prediction of data center and smart cooling decision have shown to play significant roles in IDC [8]. Previous research of real-time temperature prediction for IDC has mainly focused on the development of a data-driven method, which realizes a prediction error of about 3% at the inlet temperature of the server rack [9]. Recently, physics-informed neural networks (PINNs) [10,11,12] and physics-guided machine learning (PGML) [13] are further developed for IDC flow and heat transfer simulations. Leveraging the advantages of computational fluid dynamics (CFD) [14], the machine-learning technique provides an alternative fast and accurate method to accelerate CFD [15,16,17,18] for IDC applications. In order to comprehensively assess thermal performance, the requirement of high-fidelity temperature field reconstruction is still significant during the decision-making process.
Furthermore, optimizing cooling decision-making in IDC is actually a trade-off between the performance and energy consumption, where AI has made a great contribution [19,20,21,22,23]. Deep Reinforcement Learning (DRL) are developed to make cooling policy to optimize the tradeoff between energy-consuming constraints and PUE reduction targets [24,25,26,27,28]. Deep Q-Network Agent (DQN), as one of the DRL algorithms [29], is considered a powerful tool to make smart cooling decisions in this work due to its great potential in unknown environment decision-making and performance enhancement [30,31,32]. However, DRL algorithms frequently prioritize singular objectives (e.g., PUE minimization) while neglecting thermal homogeneity constraints due to too few detecting temperature sensors. In addition, implementation frameworks lack integrated visualization and control interfaces for operational deployment. A digital twin platform [23,33,34,35] further fulfils the integrated functions, which can be potentially used to equip with the real-time thermal prediction model and the intelligent decision-making method for IDC systems. Our work addresses these deficiencies through a comprehensive digital twin framework incorporating three fundamental innovations: a U-Net architecture for real-time thermal field reconstruction, a multi-objective DQN agent coordinating PUE reduction with thermal uniformity and hotspot mitigation, and a Unity-based visualization platform enabling interactive management.
In this paper, we established a U-Net algorithm firstly to predict the thermal environment for an IDC prototype in real time. The predictive model works as a surrogate model to fast reconstruct a temperature field in the IDC system. Moreover, to achieve the intelligent decision-making for thermal management, the DQN-based technique is further developed considering PUE reduction, system temperature uniformity and local hotspot inhibition, respectively. Finally, the entire real-time prediction and smart decision-making neural networks are integrated in our IDC digital twin platform based on Unity, allowing the real-time visualization, analysis and intelligent thermal management for IDC prototype. Our work advances IDC operational intelligence beyond energy optimization toward holistic operational excellence, encompassing predictive maintenance, automated thermal diagnostics, and energy efficiency enhancement. By establishing a closed-loop control paradigm integrating physical infrastructure with virtual management systems, this research contributes both methodological frameworks and empirical validation for next-generation sustainable data centers.
Our paper’s structure is arranged as follows: Section 2 introduces the setup details of the experimental IDC prototype and the real-time thermal environment reconstruction method. Section 3 provides the DQN-based intelligent thermal management technique development, which is one of the main focus and developments in this proposed work. Finally, Section 4 exhibits a case study using DQN-based intelligent thermal management based on the digital twin platform. Section 5 concludes with research contributions and future directions.

2. IDC Prototype Details and Fast Thermal Reconstruction Method

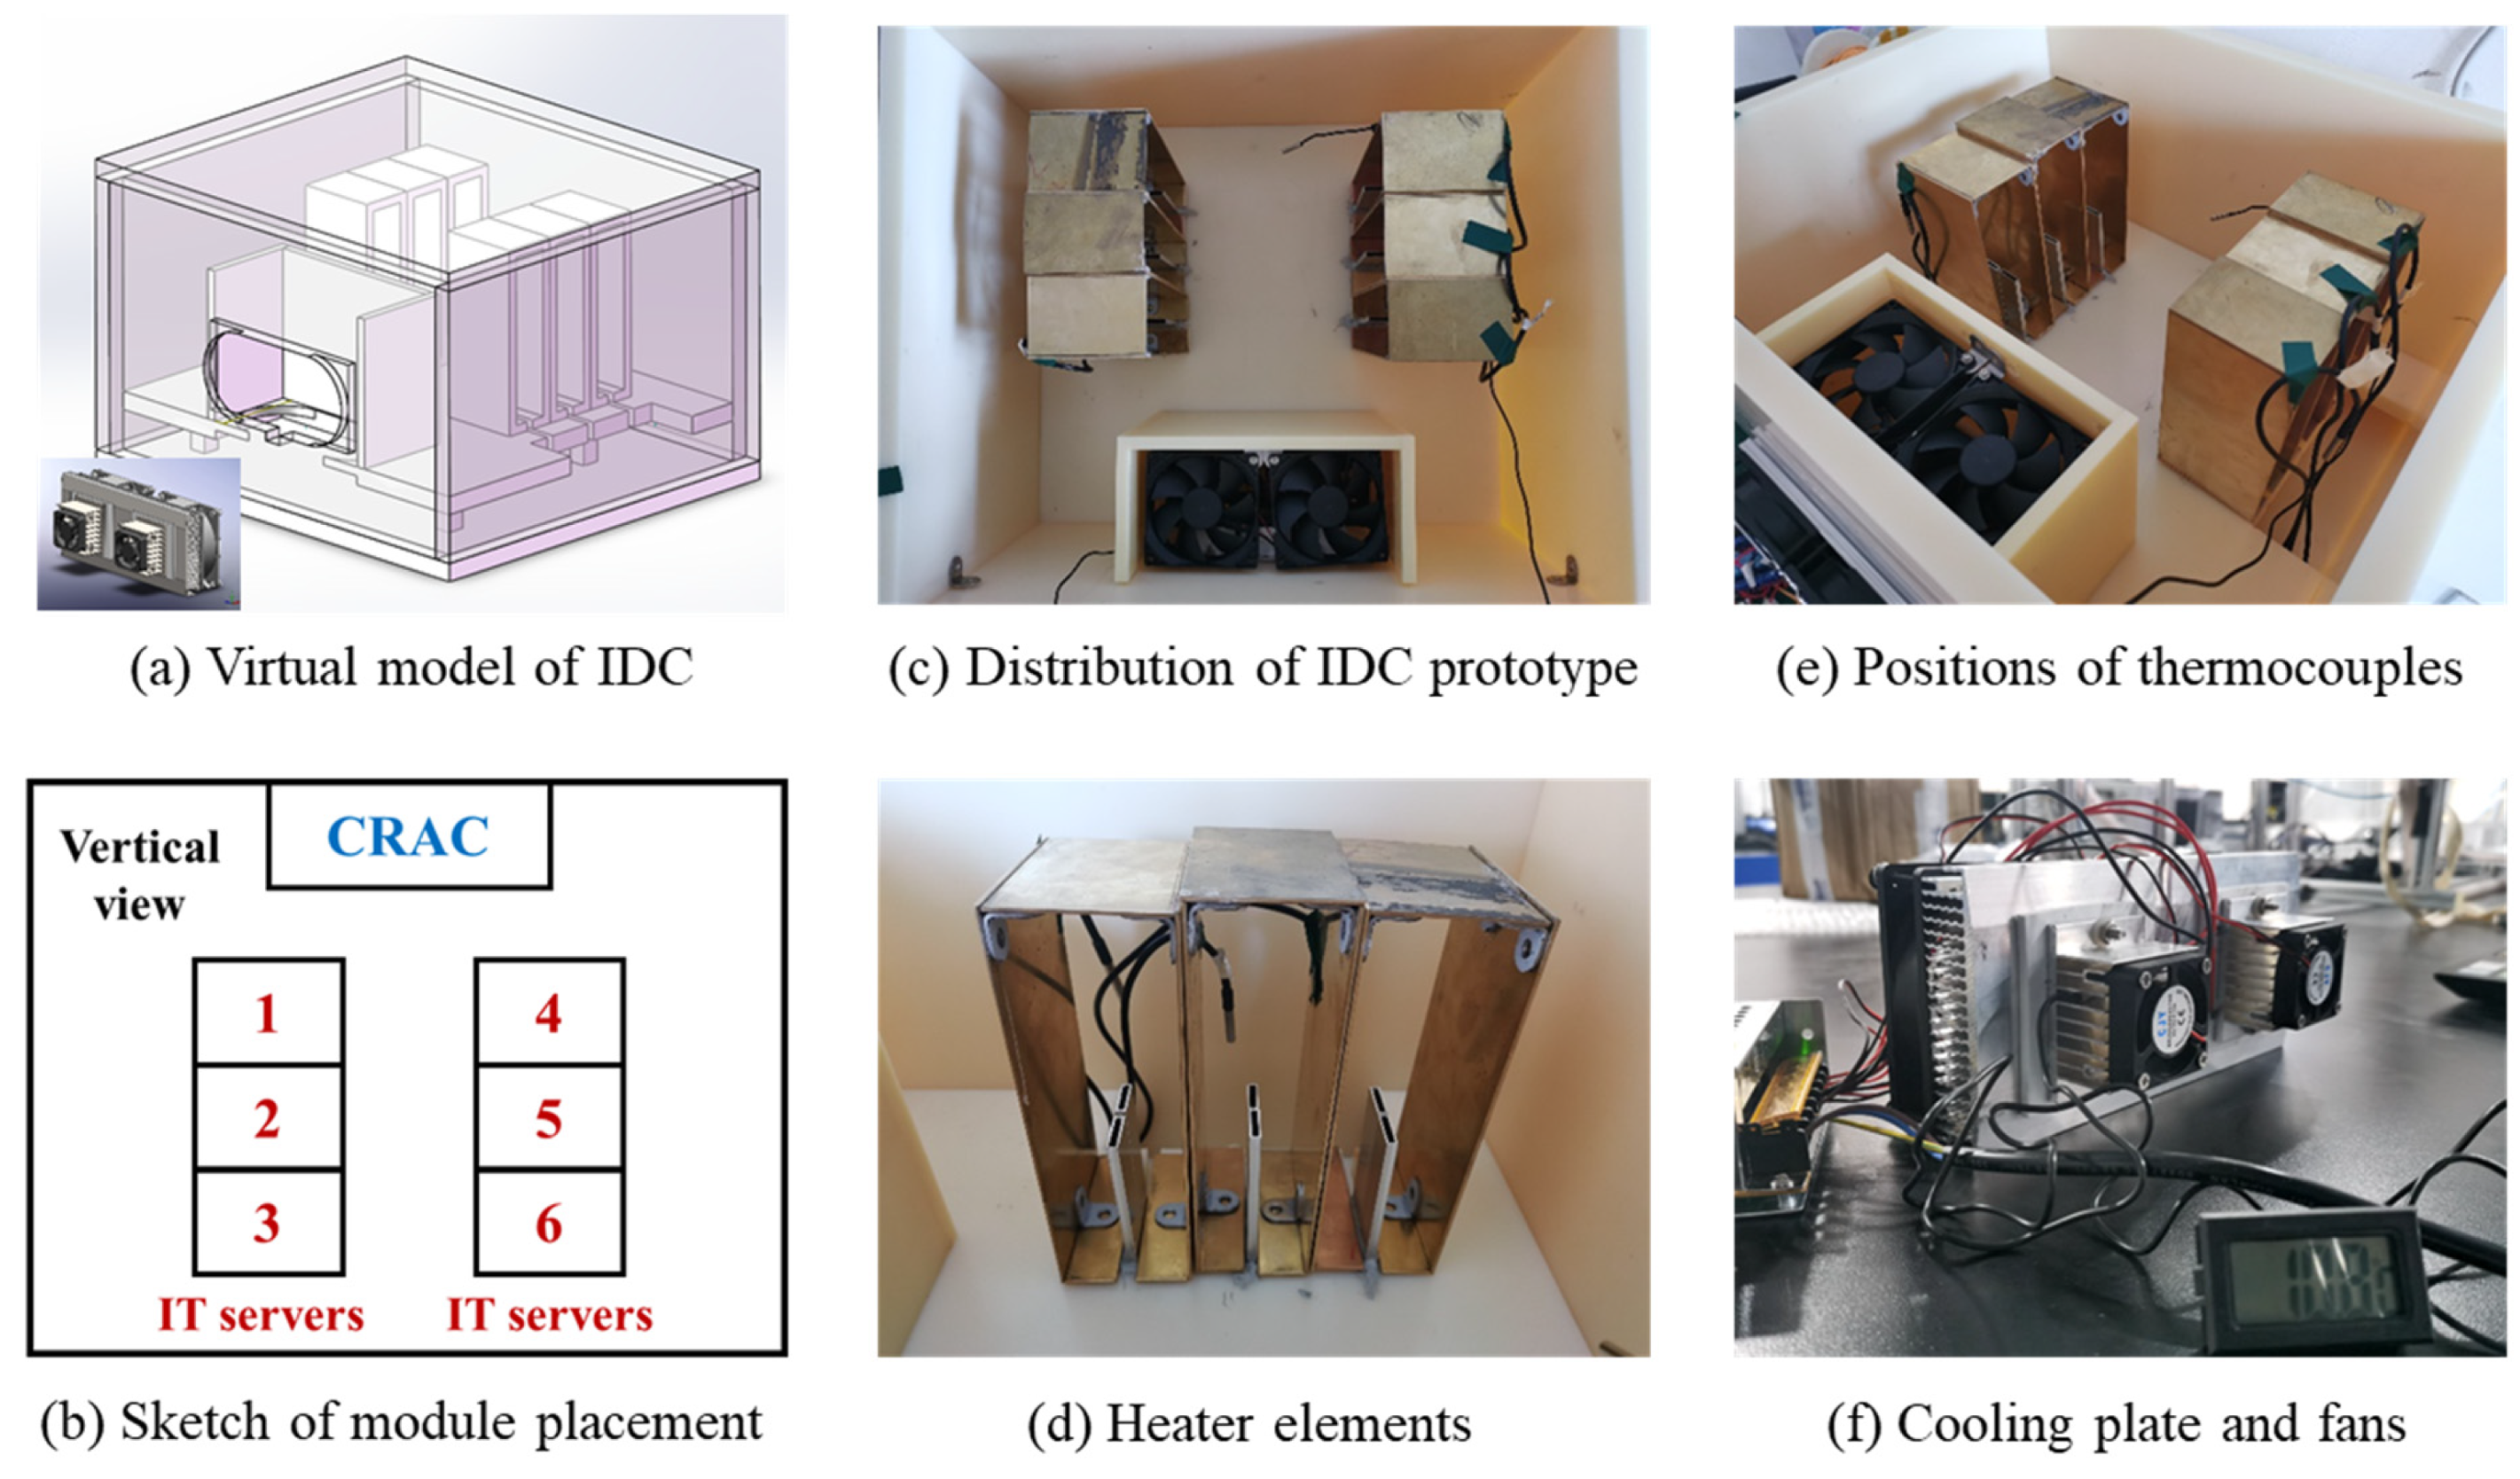
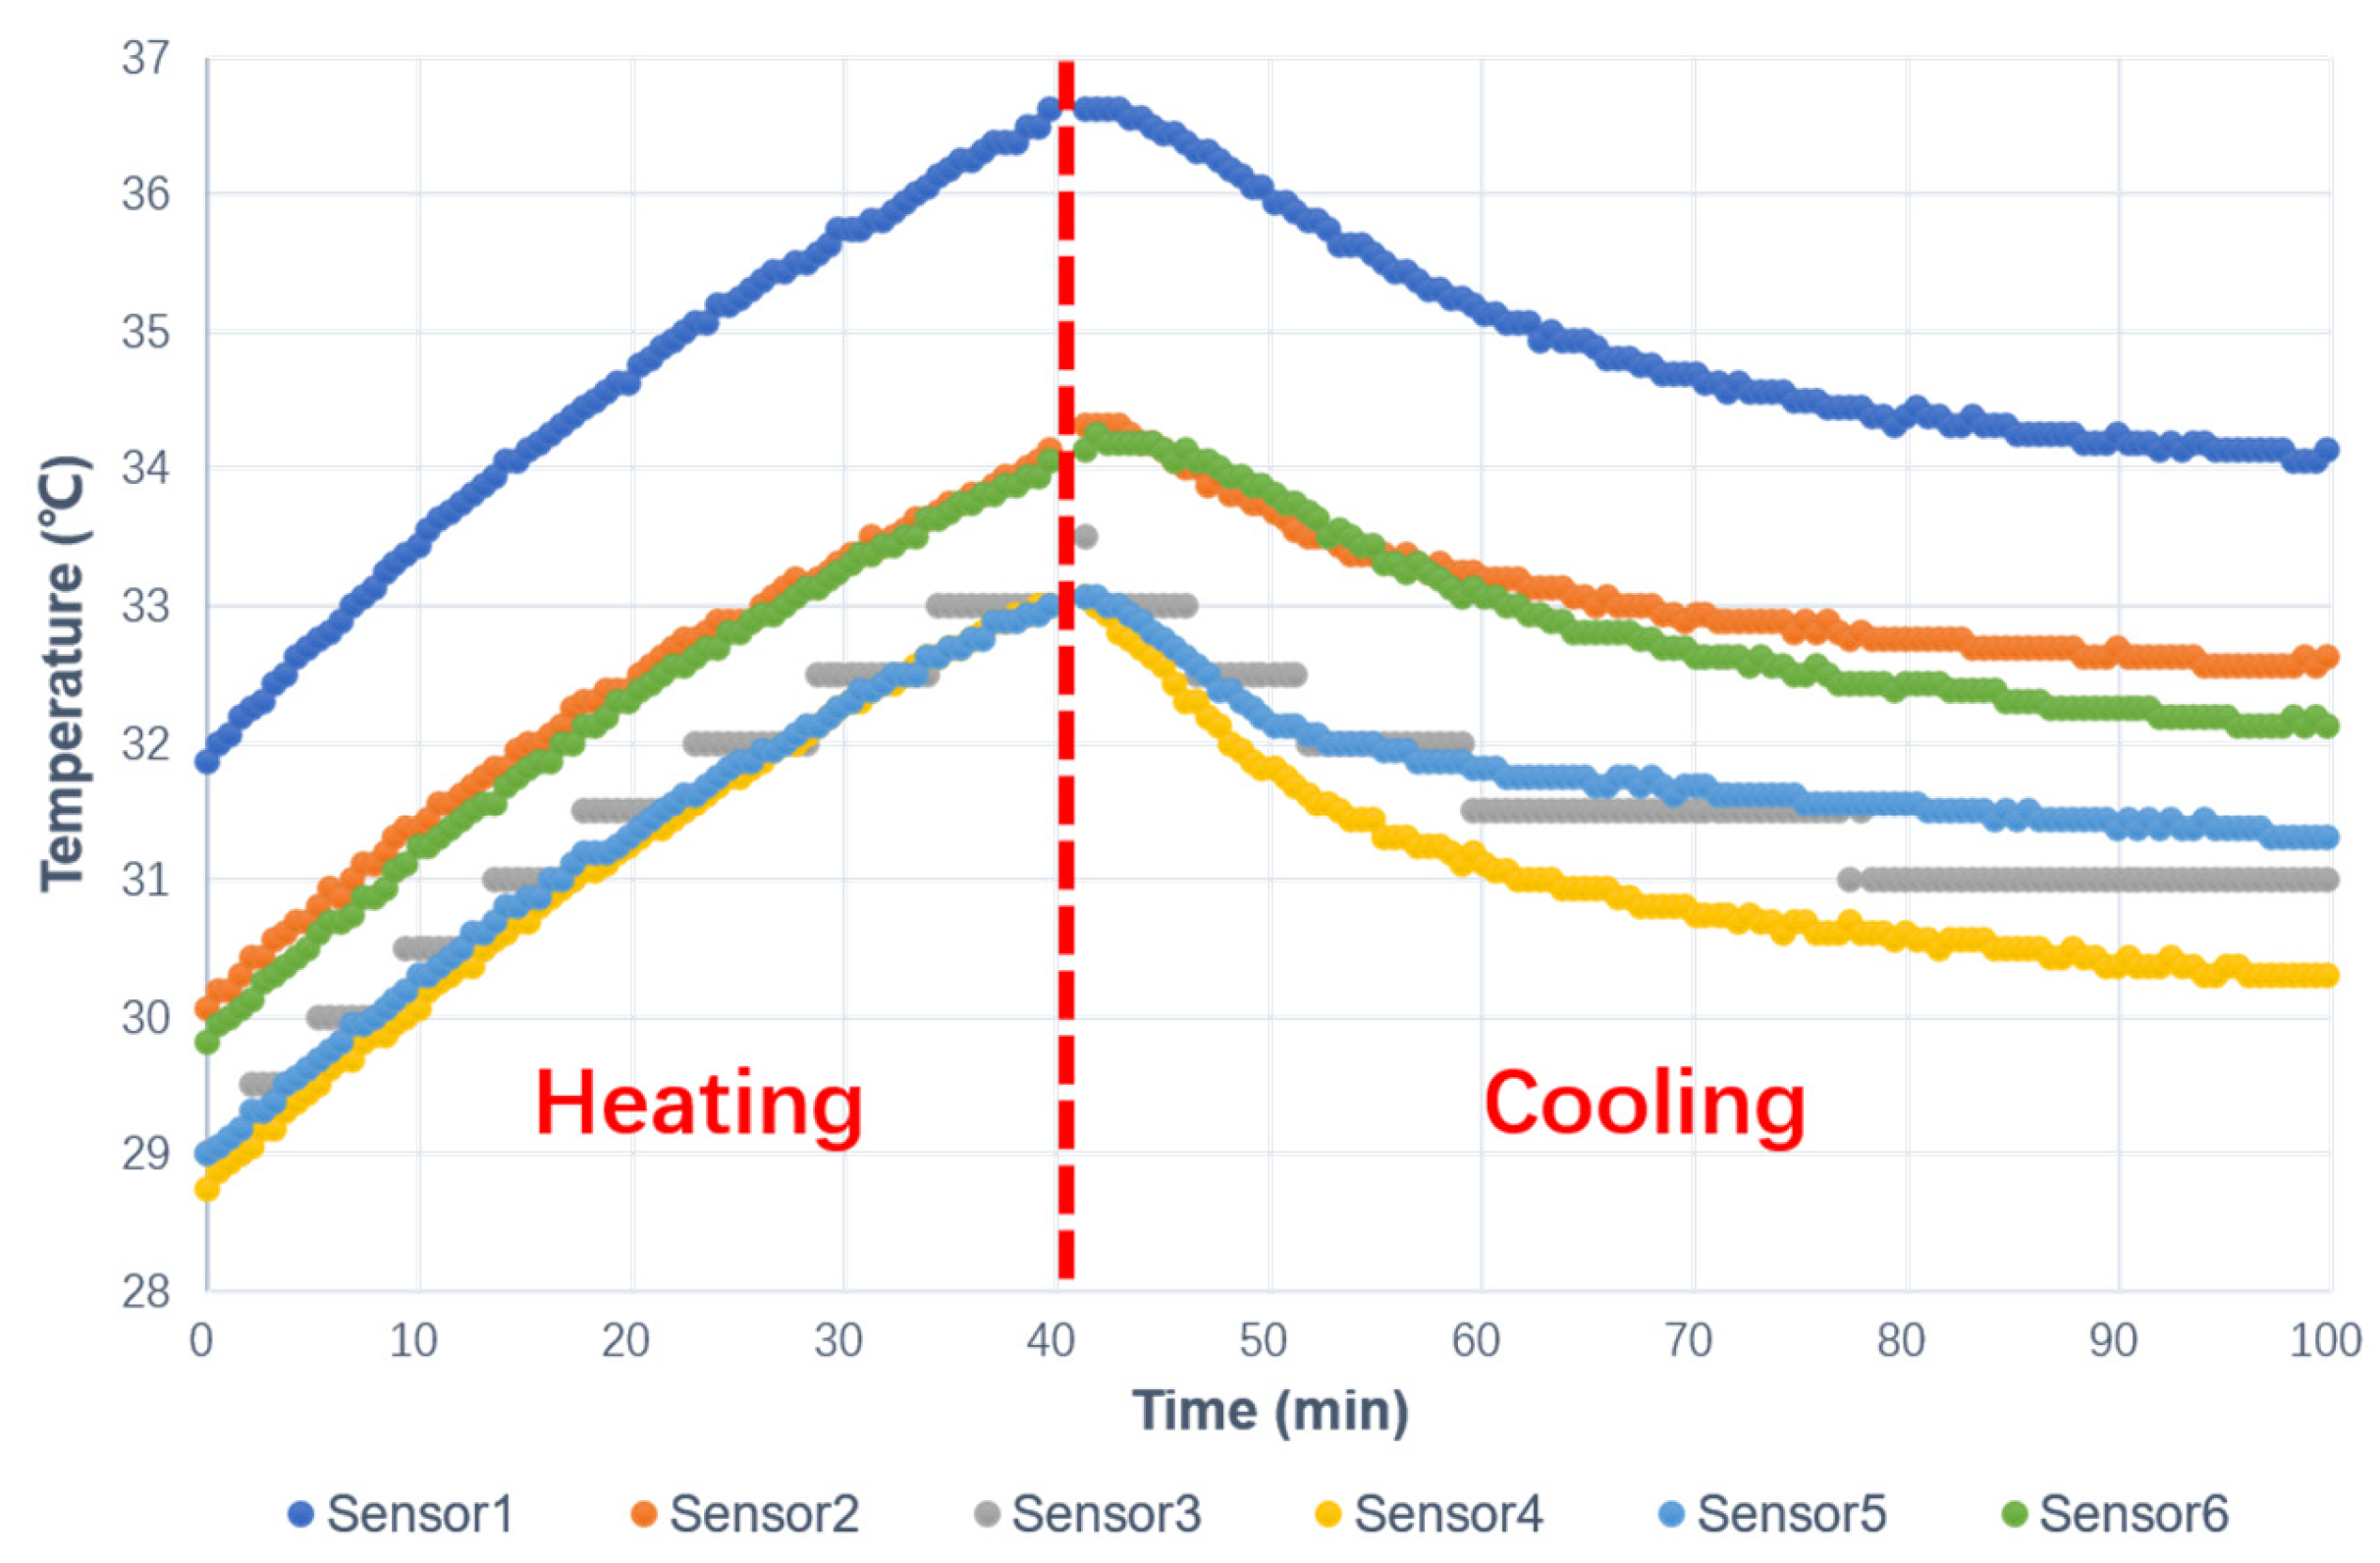
2.1. Experimental Setup of IDC Prototype

A scale-reduced prototype of IDC at the laboratory level is developed experimentally, as shown in Figure 1, which includes a computer room air conditioner (CRAC) and six IT equipment servers. The IDC prototype has a total length of 52 cm, a width of 46 cm, and a height of 34 cm. The core unit of CRAC is installed between the CRAC cabinet and the outside environment. Six IT servers are placed in 2 rows × 3 columns with heating cores inside each server. The floor is raised with a height of 4.4 cm, which allows the cold air from the CRAC unit to flow beneath the floor. Two outlets of the air flow are located at the left and right side of the room, respectively, constituting the cold aisles of the IDC with the cold air rising and flowing past the heating servers.
For the IDC prototype materials, polymethyl methacrylate (PMMA) is employed as the wall, which provides thermal insulation between IDC and the surrounding environment. Copper plates and PTC heating elements are considered to represent the heating servers in the data center. Semiconductor cooling sheets in the CRAC prototype are associated with the two fans during air cooling, as shown in Figure 1f.
To evaluate the heating performance of the PTC elements and the cooling capability using the semiconductor cooling sheets, the temperature measurement of six servers using thermocouples is conducted, as shown in Figure 2. Six thermocouples are installed between the walls and each of the servers to record the temperature during the heating and cooling process. The test during the heating process is performed with all the PTC heating elements in the six servers turned on. Subsequently, all cooling units in the CRAC are turned on during the cooling process. It can be observed from Figure 2 that, although there are some discrepancies among the six thermocouples, a similar temperature rises with 4~5 °C during the heating process, followed by a decrease of 2~3 °C during the cooling process. According to this temperature evaluation test, a specific temperature of 33 °C is considered as a hotspot criterion of IDC, which leads to the automatic operation of CRAC units using the following DQN decision-making strategy.

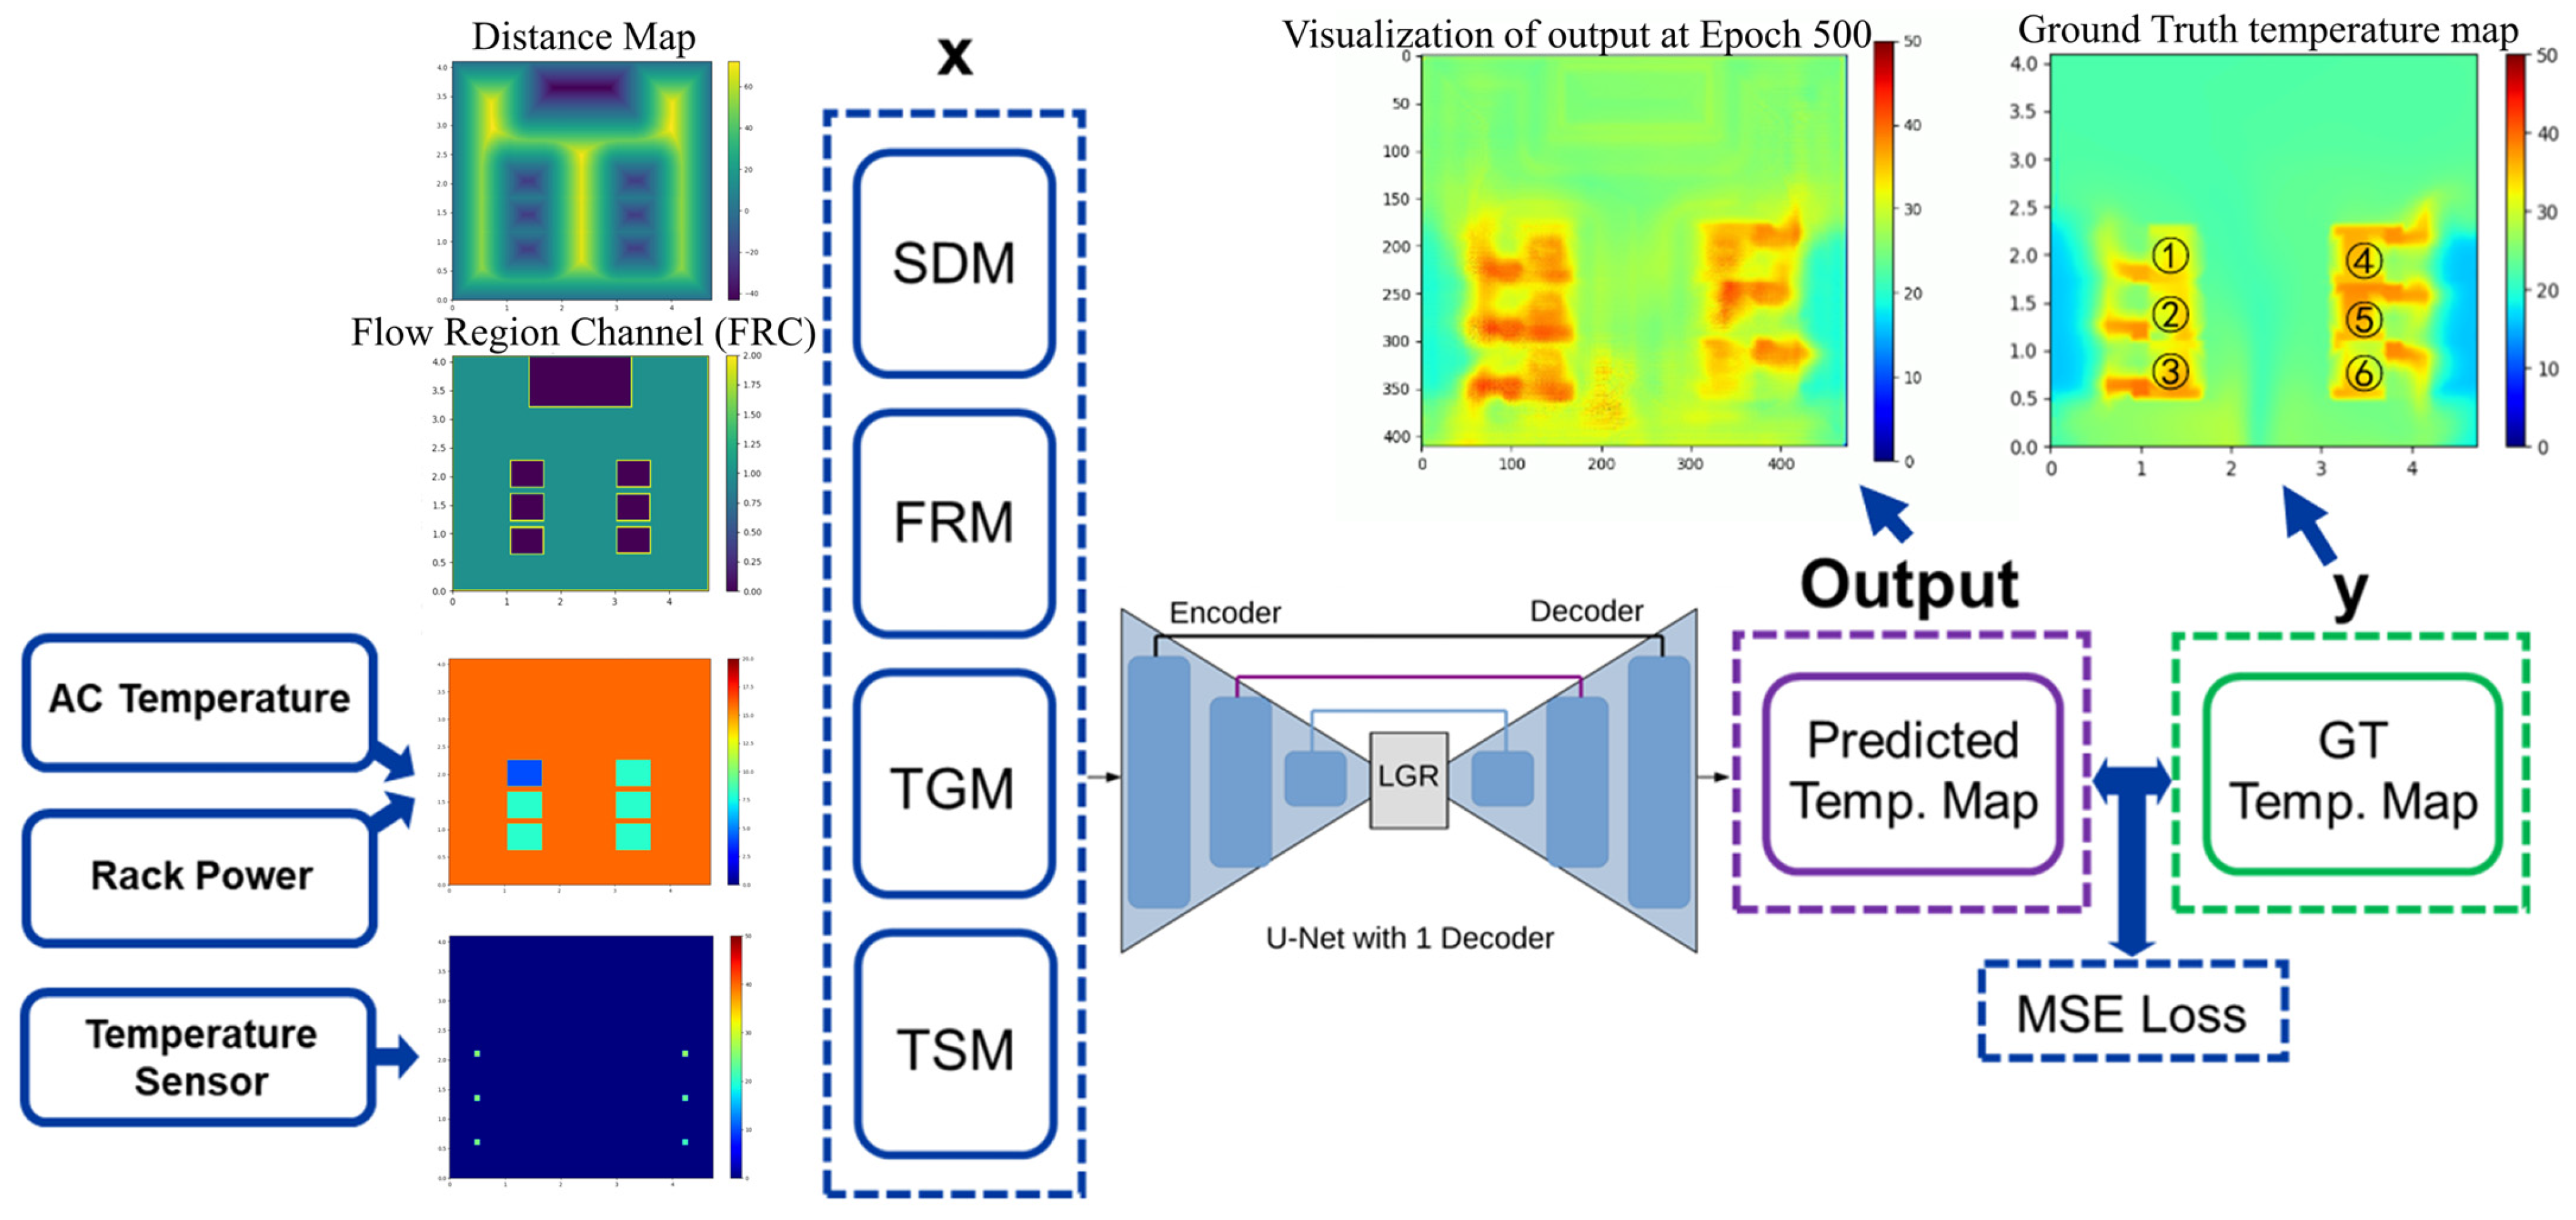
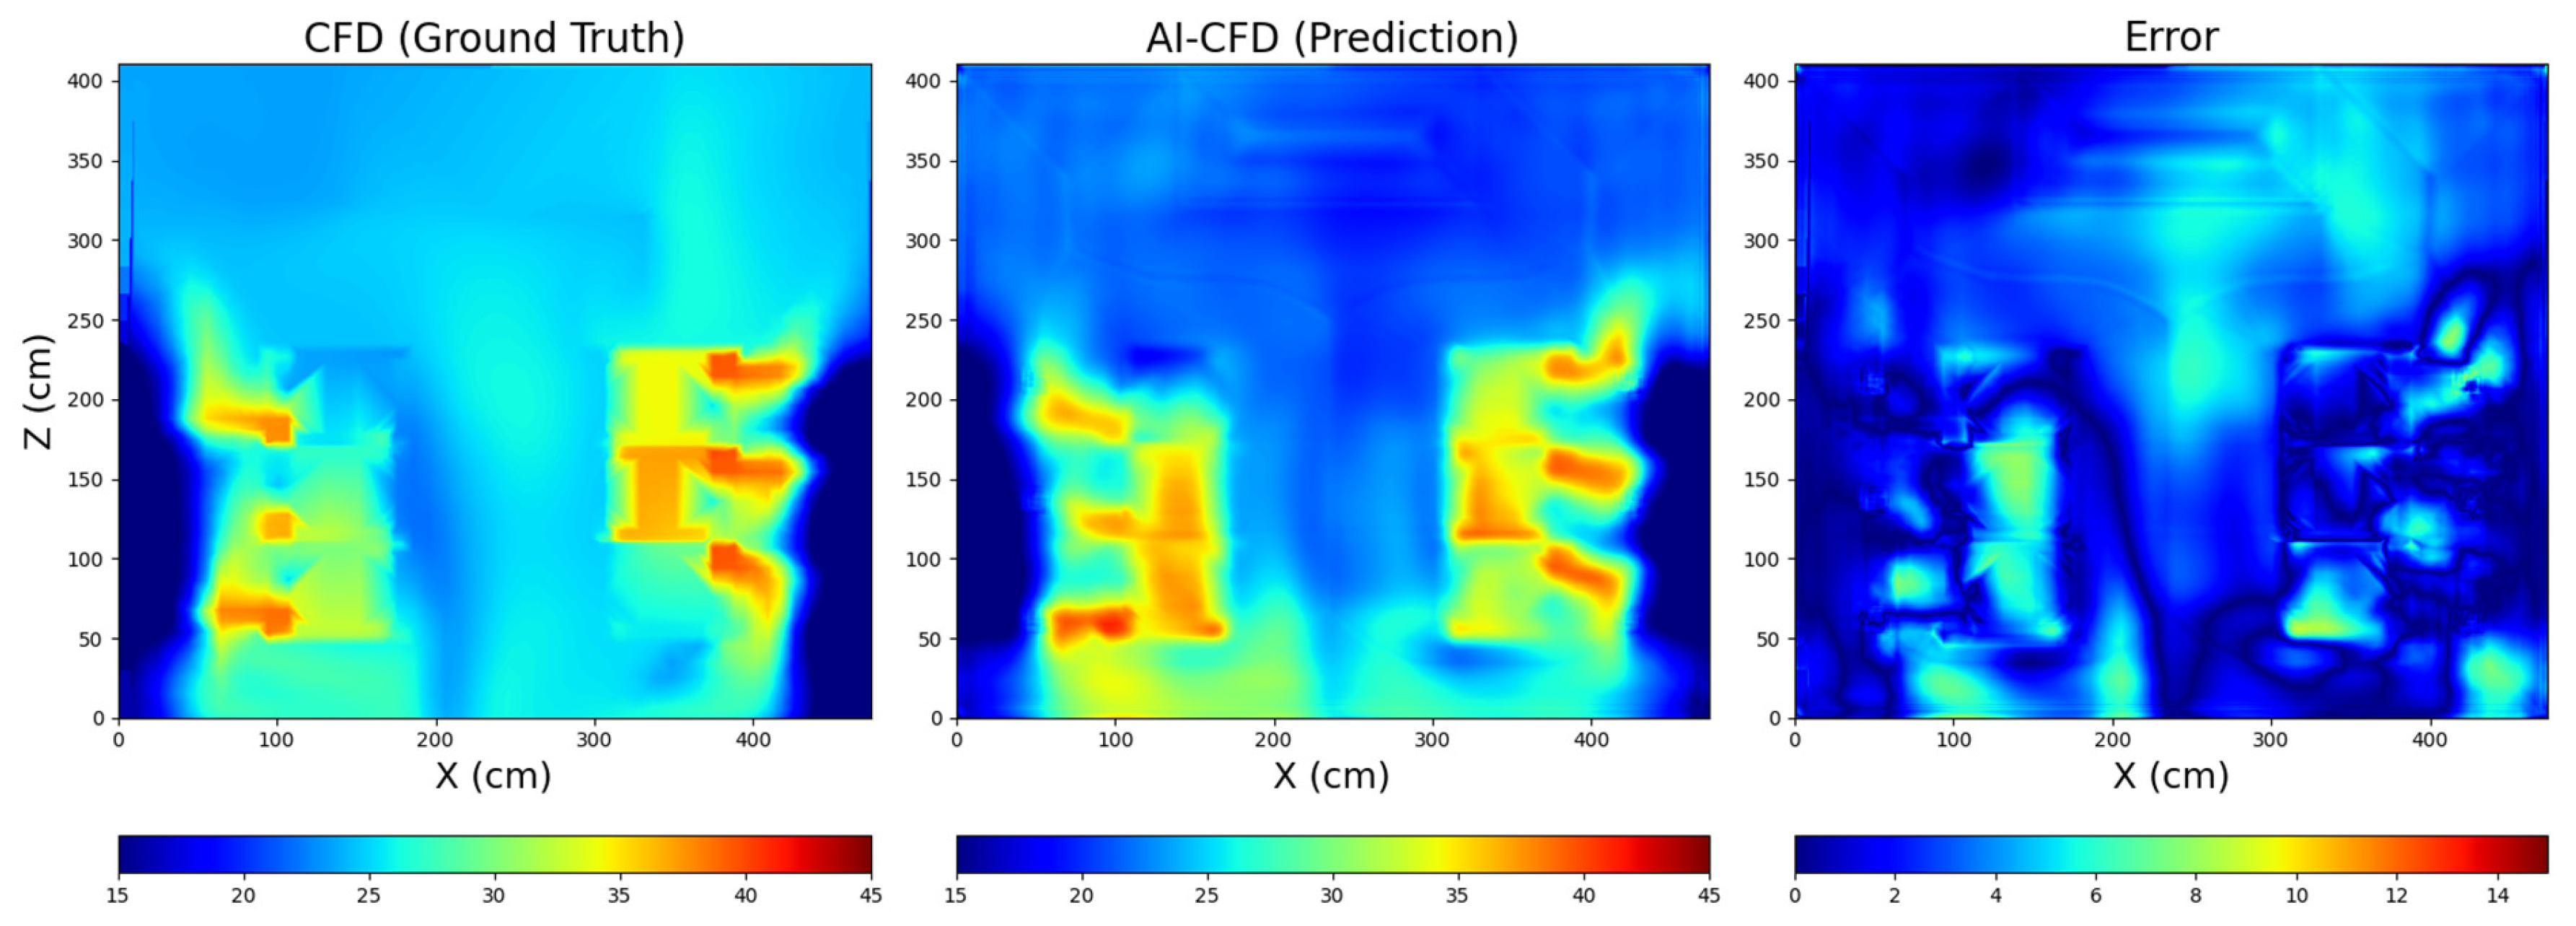
2.2. Real-Time Thermal Environment Reconstruction Method

Considering the large time consumption to obtain a large quantity of data through testing, an experiment-validated CFD model provides a fast and accurate way to simulate the temperature, velocity, and pressure of flow in the data center. 6SigmaDCX R15 is used to generate datasets for real-time temperature prediction training. The controlled variables are the cabinet power and the setting temperature of the air conditioner. The real-time prediction method is an autoencoder-based U-Net neural network model, which can predict temperature fields of DC in real time. Based on the existing work of Ribeiro et al. [10], we modified their architecture to predict flow temperature of a two-dimensional plane. The architecture of the overall network is shown in Figure 3. The proposed network takes the current power of servers, CRAC temperature, and temperature sensor data as inputs and outputs a two-dimensional array as the predicted temperature field.
This model works as a surrogate model during DQN training, providing high accurate temperature distribution. After optimizing hyperparameters during ablation studies, we prepared a test set of five simulations, which are new to the model, to evaluate the accuracy and robustness of predictions using mean absolute error (MAE) and mean absolute percentage error (MAPE).
The results show that predictive MAE reduces to 2.27 °C, and MAPE reduces to 9.21%, providing accurate and reliable predictions, as listed in Table 1. For instance, Figure 4 shows an example of the predicted two-dimensional temperature field in the test set, together with the ground truth temperature field and the prediction error. The testing results proves that our predictive model has strong robustness and high accuracy, making it applicable for temperature field reconstruction during the decision-making process.

3. DQN-Based Intelligent Thermal Management Technique

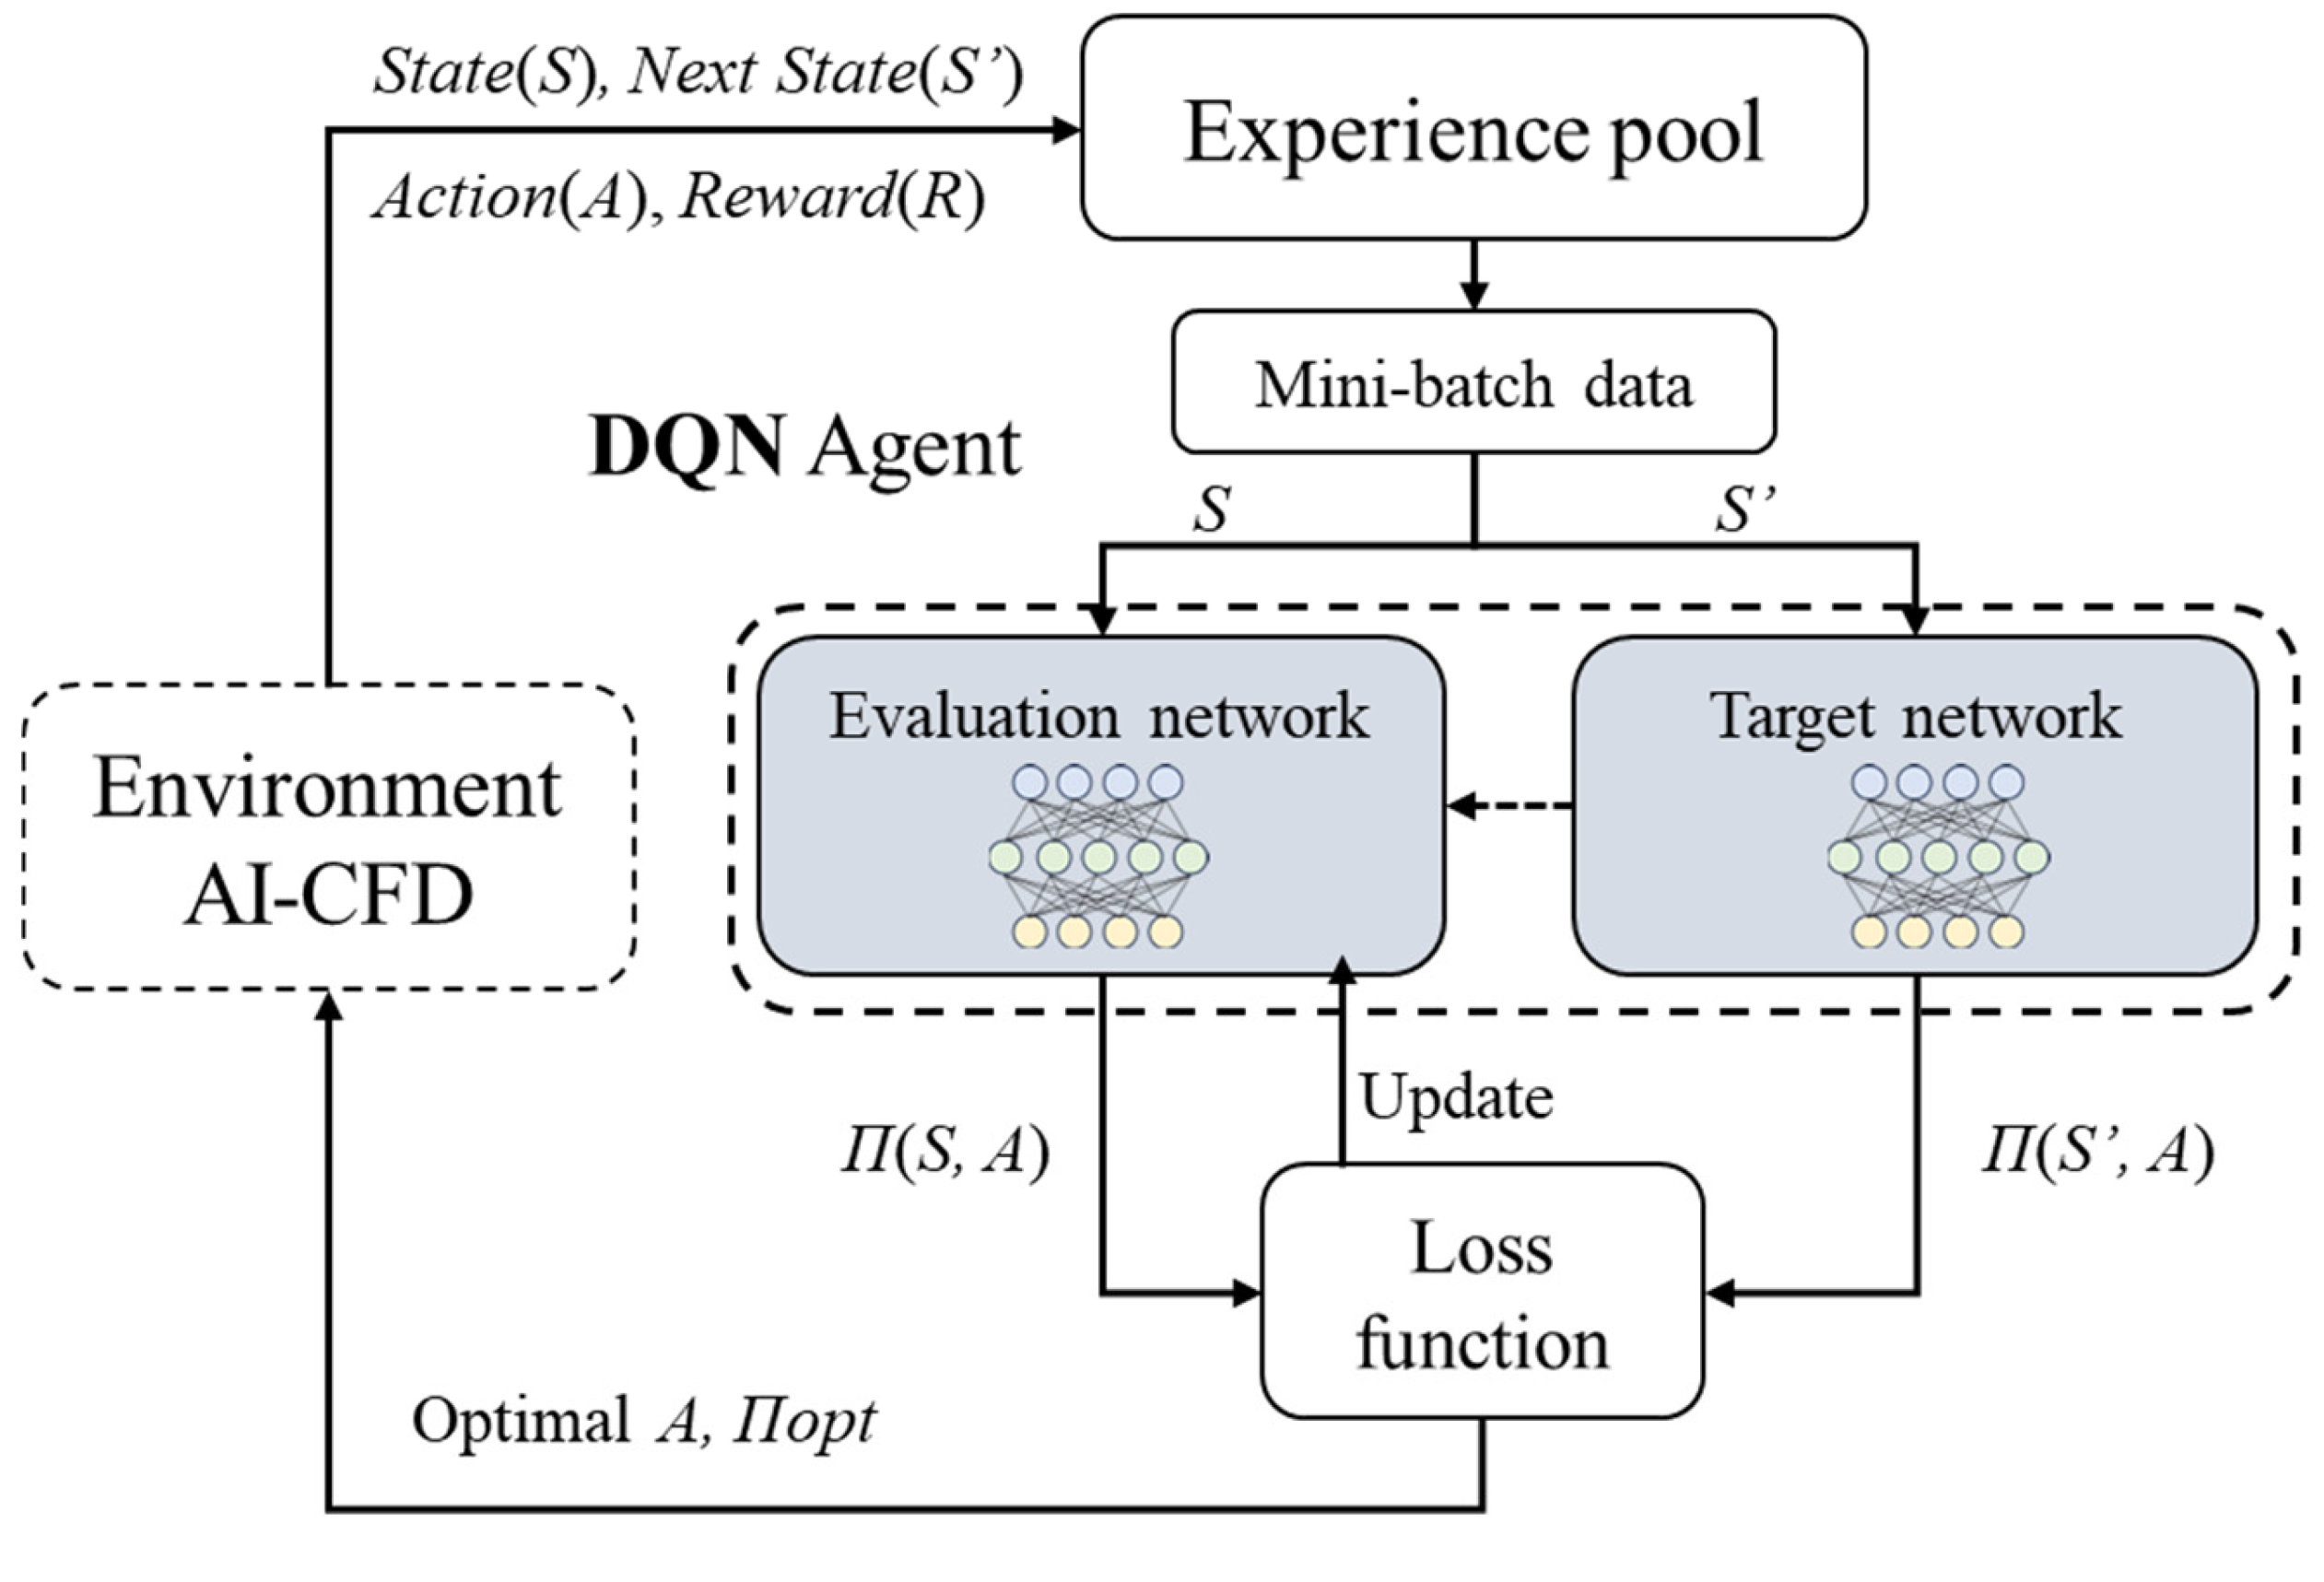
3.1. The Architecture Design of the DQN Decision-Making Agent
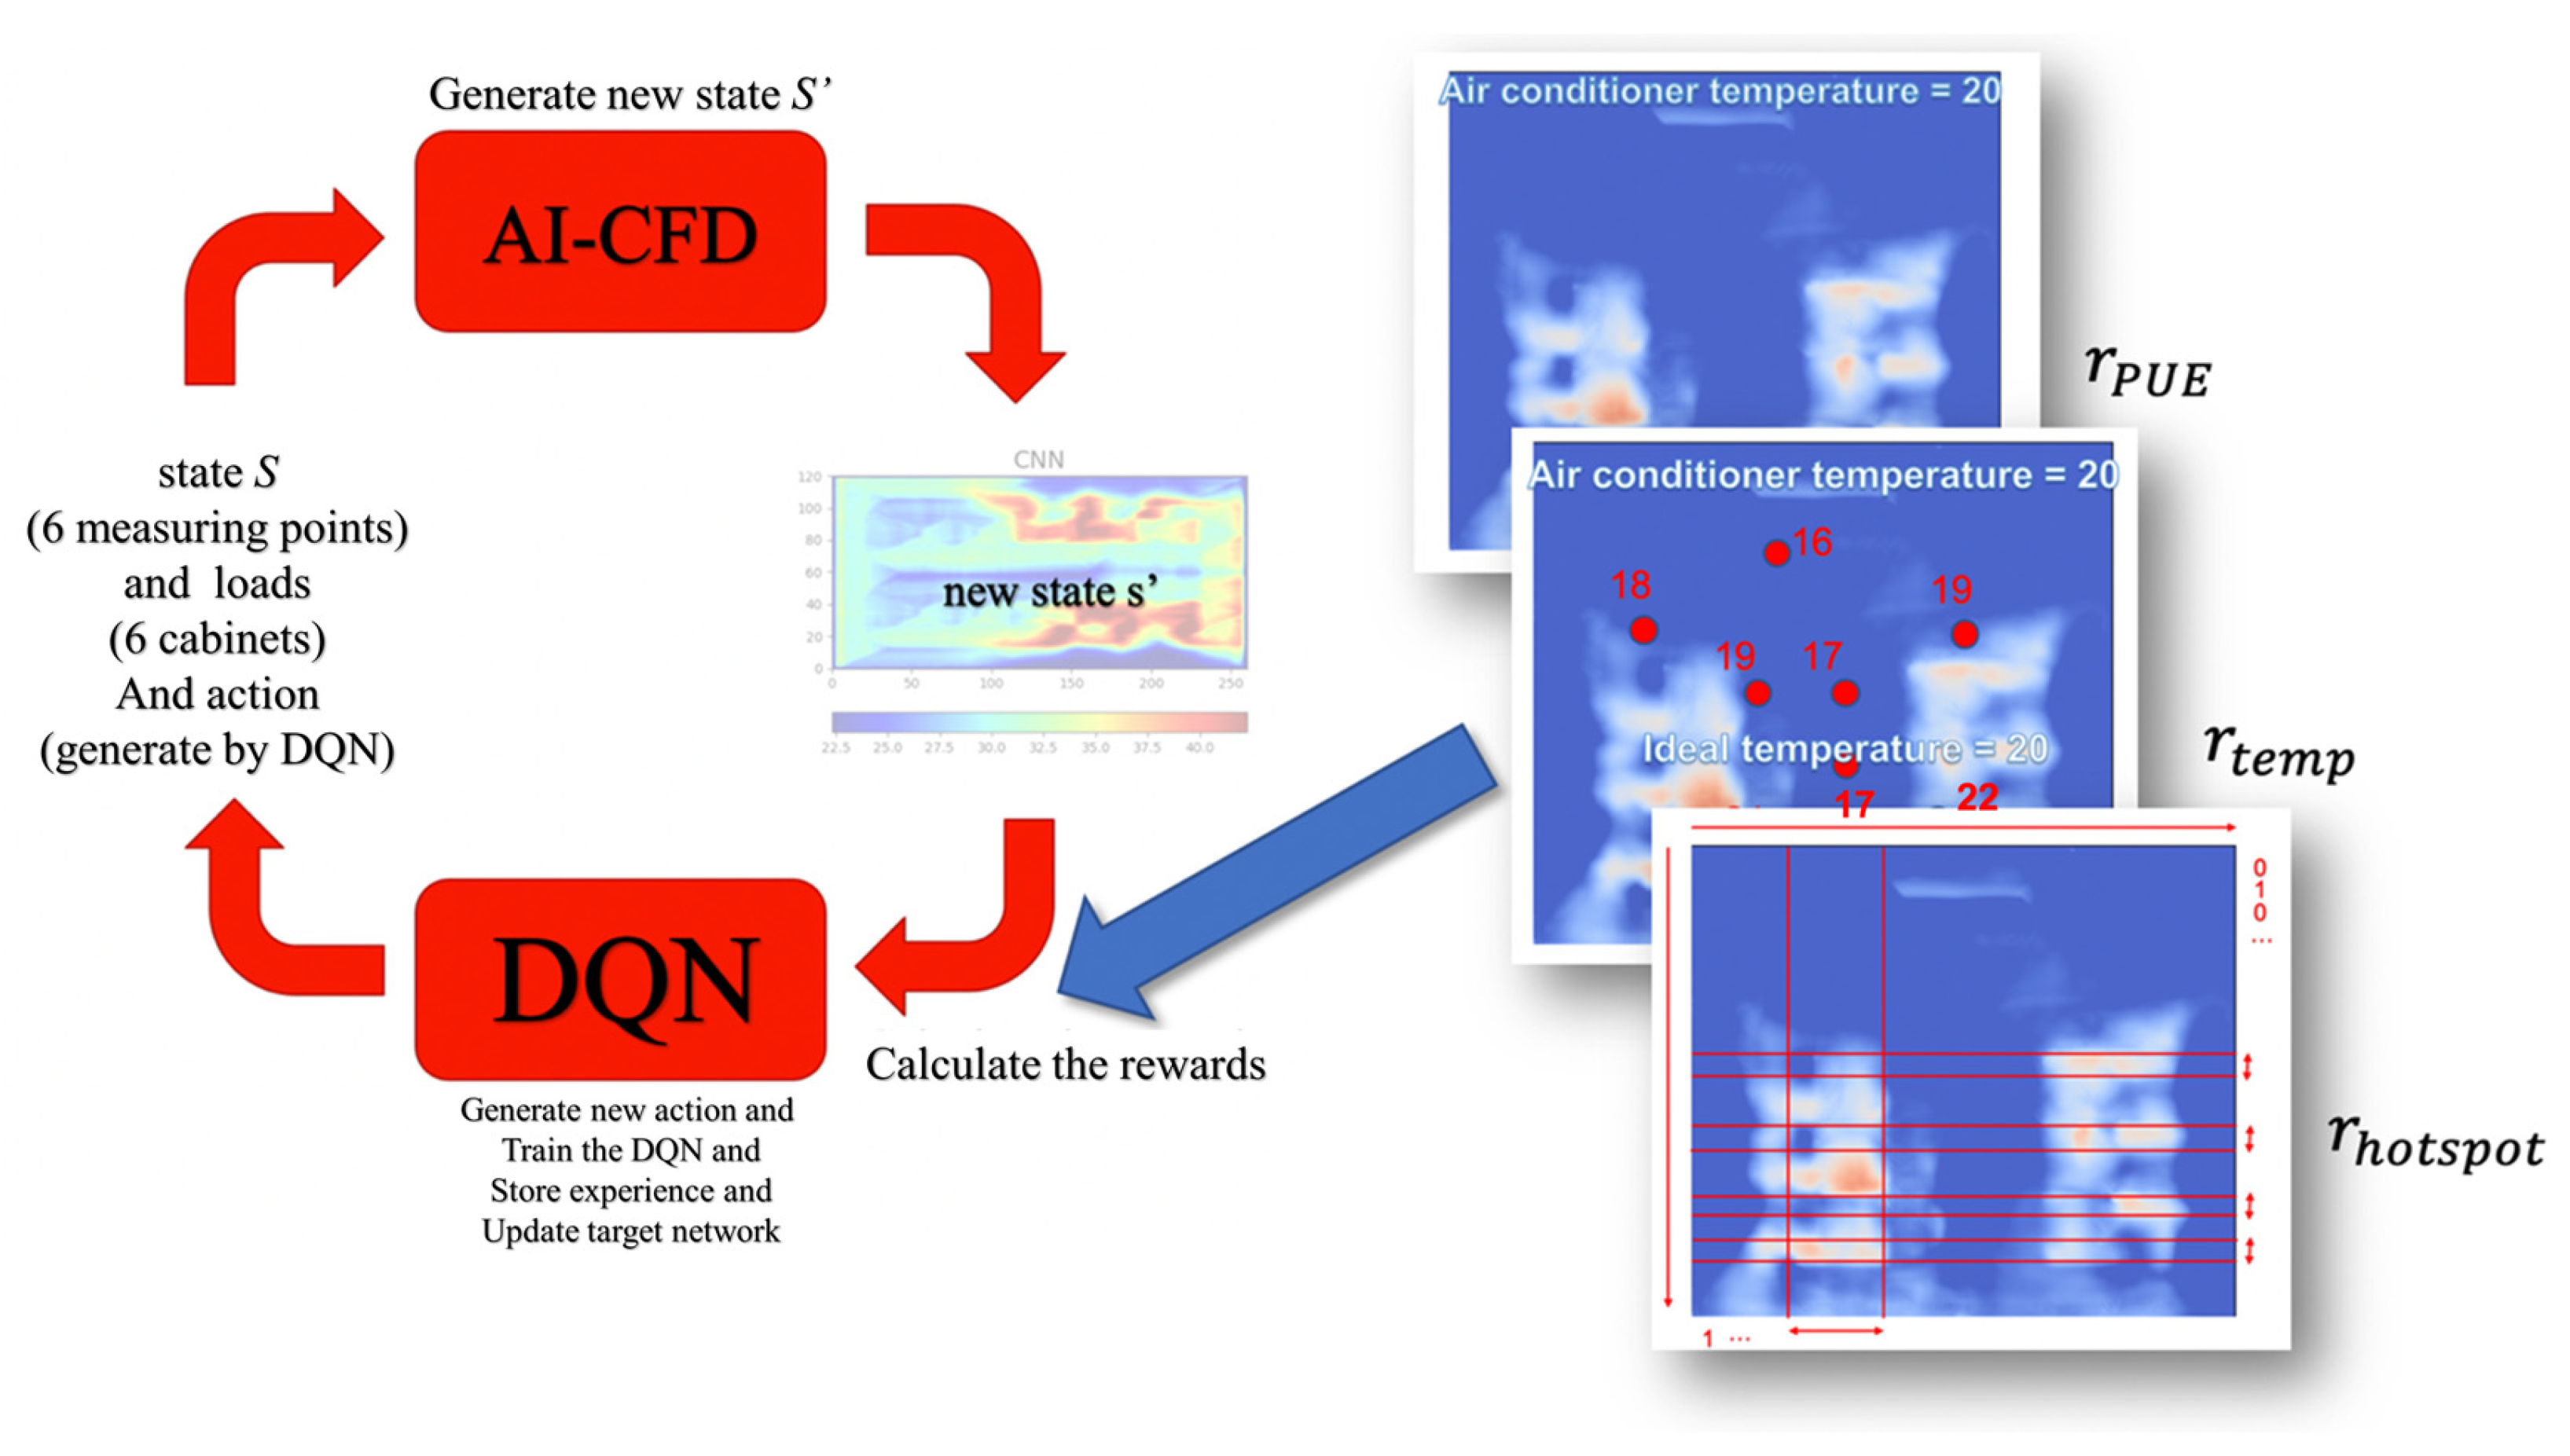
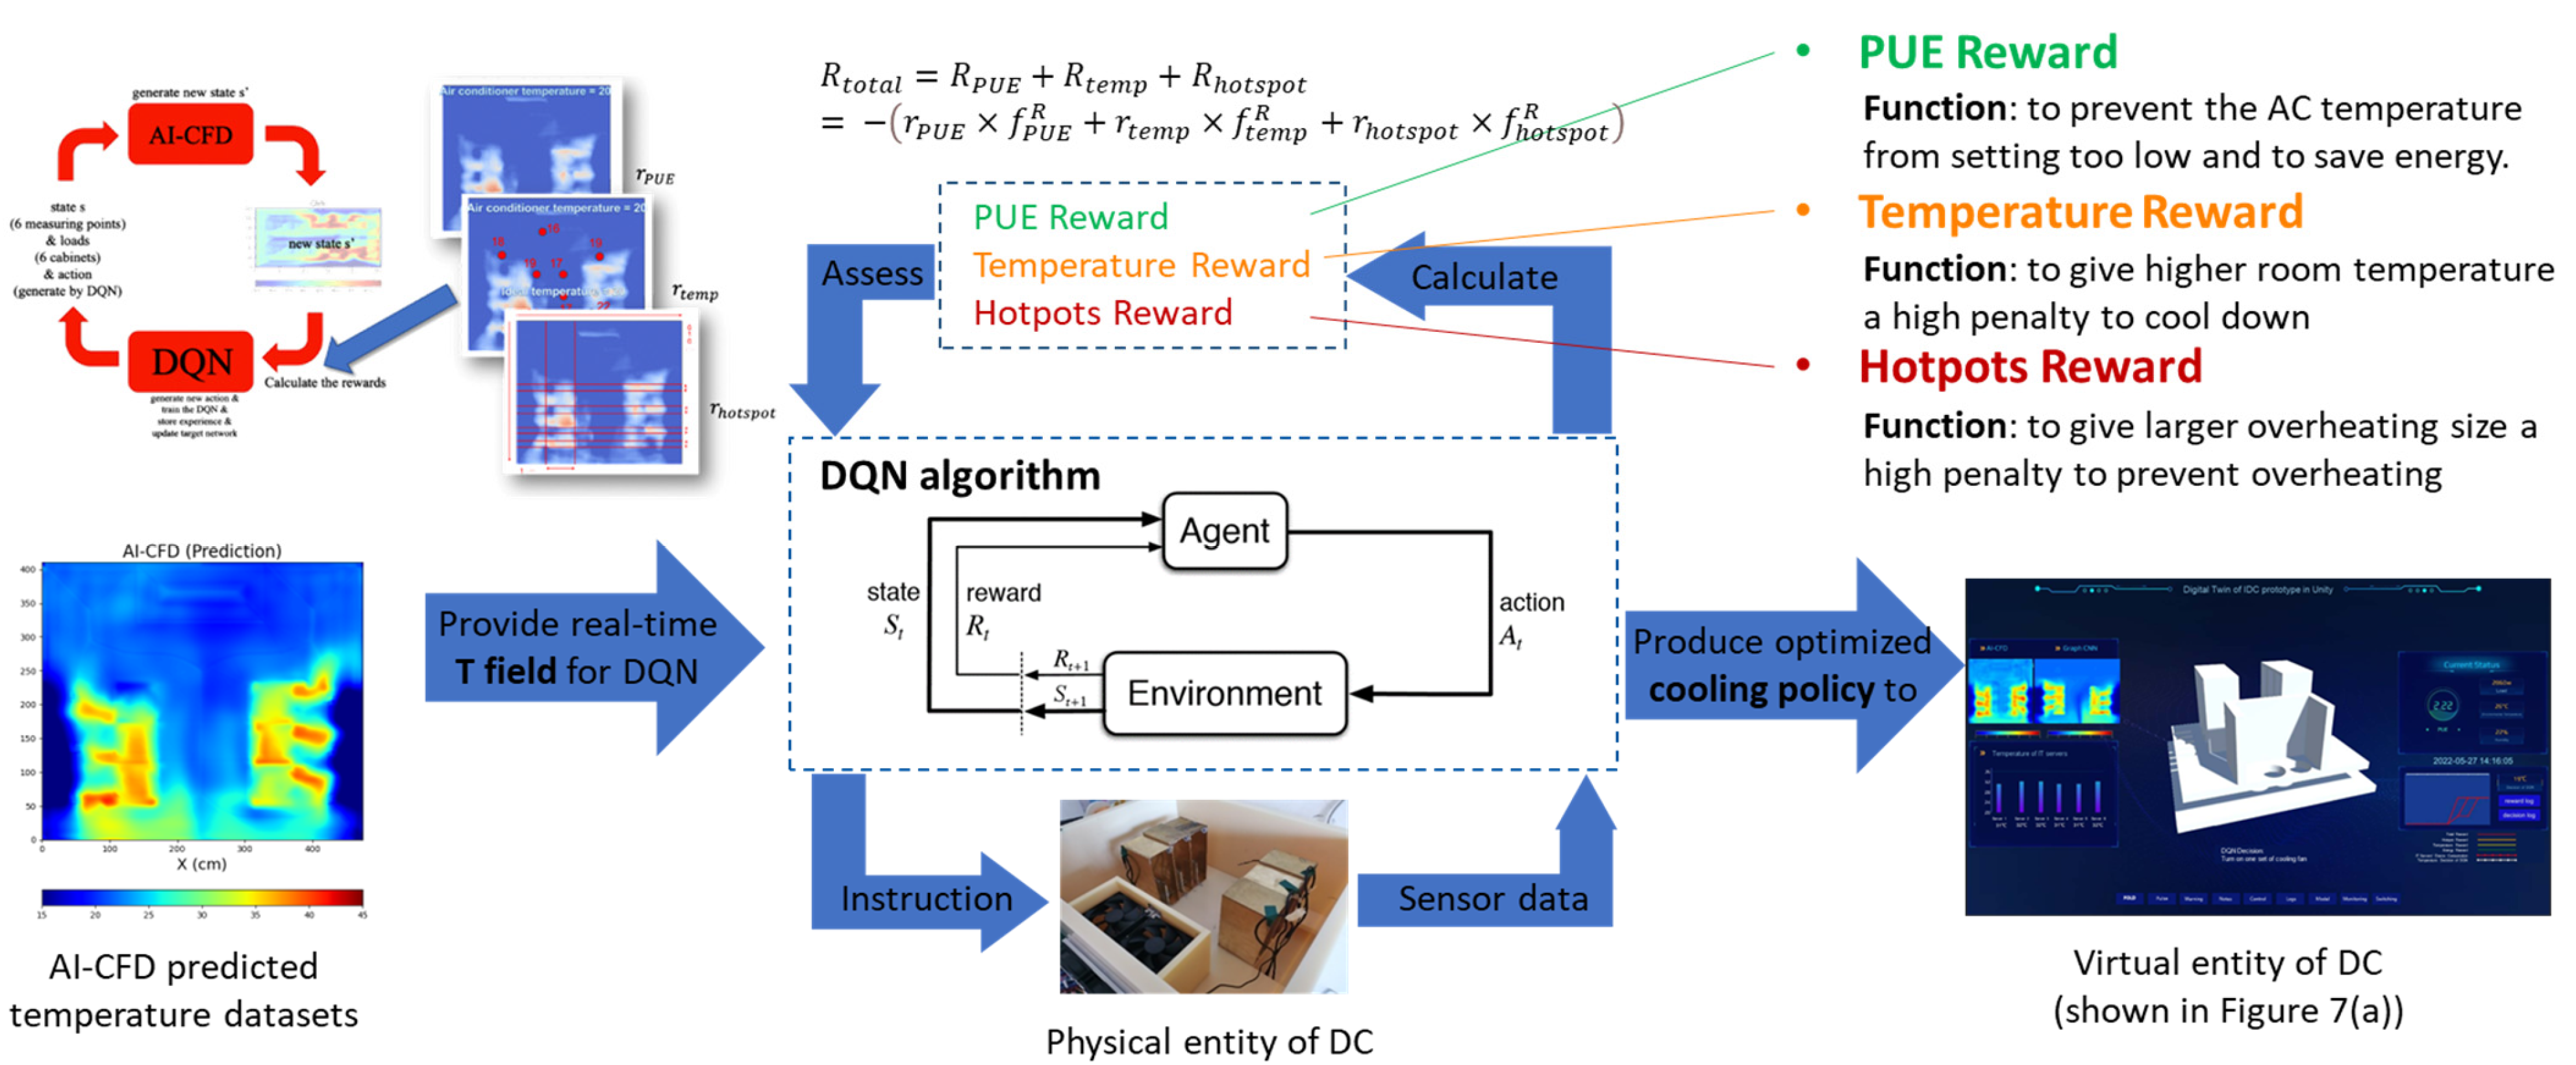
Deep reinforcement learning is defined as the process in which an agent continuously interacts with the environment to seek optimal decisions. The process of making optimal decisions, considering the uncertainties of heater load and energy consumption, can be modeled as a Markov Decisional Process (MDP). The architecture structure of the DQN decision-making agent is illustrated in Figure 5.
The training process employs a dual-network architecture comprising an evaluation network for action generation and a target network for value estimation. Both networks have three hidden layers with widths of 24-48-24, and are initialized with identical parameters. Since the cooling process is modeled as an MDP for decision-making, critical components (S, A, E, R, P) are setting, where S is state, A is action space, R is reward, E is dynamic environment changing with A and P stands for state-transition function. A replay memory buffer, termed as the experience pool, stores state transitions (St, At, Rt+1, St+1), while an initial state S0 is randomly sampled from the state space S. As illustrated in Figure 5, the iterative training cycle starts with the evaluation network generating action At for the current state St. The fast thermal reconstruction module computes the real-time temperature distribution, from which the multi-objective reward Rt+1 is derived via reward functions. Subsequent state St+1 is determined based on the simulated data, with episodes terminating when rewards fall below a minimum threshold.
Parameter optimization occurs through periodic sampling of batched experiences from the replay memory. The target network periodically synchronizes with the primary network parameters to stabilize training. This architecture decouples policy evaluation from improvement while experience replay mitigates temporal correlations, collectively enhancing convergence robustness. The learning rate is initialized at 0.1 for preliminary exploration, with systematic hyperparameter optimization conducted in subsequent phases.

3.2. Reward Details

The agent aims to find a policy π that generates optimal action in each episode, converging to the optimal policy πopt.
π o p t = arg max π E π k = 0 γ k R i + k + 1 | S i , A i
where, γ is the discount factor of cumulative reward for balancing immediate and long-term rewards. The reward design is significant to be clarified for guiding the agent to find the optimal strategy. In this work, the proposed DQN agent considers three states, which are AC temperature, IT consumption and temperature at certain points, respectively. Three rewards are further established: PUE reduction, temperature uniformity and local hotspot inhibition. Moreover, aiming to enhance the sensitivity during temperature variation, additional evaluation points are added to the locations with larger temperature gradients.

3.2.1. Reward of PUE Reduction

PUE, as one of the most critical indicators for evaluating the energy-saving performance of an IDC system [36], is defined as the ratio of total facility energy to IT equipment energy. To simplify the energy structure, another facility energy is assumed to solely originate from air conditioning (AC) systems in this work. Therefore, PUE can be further reformulated as:
PUE = 1 + P A C   /   P I T
where, PIT represents the time-varying IT equipment energy consumption, emulating daily workload fluctuations. Hereinto, the AC energy consumption PAC is governed by:
P AC = r A C ( T env T set ) + P A C basic ,     if   T env > T set 0 ,     otherwise
where, Tenv and Tset denote the environmental temperature and CRAC set temperature value, respectively; while rAC and PACbasic are predefined coefficients. The PUE reward RPUE incentivizes energy efficiency by penalizing deviations from the ideal PUE value of 1:
R P U E = r P U E 1 P U E
where, rPUE is a tunable reward coefficient. This formulation guides reinforcement learning agents to optimize Tset dynamically, balancing cooling costs against IT workload variations.

3.2.2. Reward of Temperature Uniformity

The reward of temperature uniformity is mainly used to evaluate global temperature uniformity across the DC using thermocouples. An ideal temperature Tideal of 20 °C is targeted for all monitoring points. For a flattened sensor array Ltemp = [T1, T2, …, Tn], the temperature deviations are computed as:
L e r r = T 1 T i d e a l , T 2 T i d e a l , , T n T i d e a l
It should be noted that negative deviations are further converted via calculations L e r r = L e r r + L e r r / 2 . The thermal reward penalizes both the magnitude and spatial variability of overheating:
R t e m p = r t e m p μ L e r r + σ L e r r
where, μ and σ denote the mean and standard deviation, respectively; rtemp is a tunable reward coefficient. This dual-term formulation promotes both proximity to Tideal and homogeneous temperature distribution, mitigating localized overheating risks.

3.2.3. Reward of Local Hotspot Inhibition

The hotspot penalty mechanism quantifies thermal anomalies of temperature contours. A threshold Tthres filters overheating regions, producing a binary matrix Mover where elements exceeding Tthres are retained:
M o v e r = T 11 T t h r e s T q 1 T t h r e s T 1 p T t h r e s T q p T t h r e s
To avoid overestimating hotspots, spatial dispersion is assessed via non-zero rows ( N o v e r r o w ) and columns ( N o v e r c o l ) in Mover, for example:
M o v e r = 0 1 2 0 0 0 0 0 1 N o v e r r o w = 2 , N o v e r c o l = 2
The reward penalizes cumulative dispersion to discourage local overheating:
R h o t s p o t = γ h o t s p o t N o v e r r o w + N o v e r c o l
where, rhotspot is a tunable reward coefficient. This metric incentivizes decentralized thermal management, suppressing localized hotspots while maintaining computational efficiency.

3.2.4. Total Reward

After demonstrating all the above three reward functions, the total reward function can be written as:
R = R P U E + R t e m p + R h o t s p o t = r P U E 1 P U E r t e m p μ L e r r + σ L e r r γ h o t s p o t N o v e r r o w + N o v e r c o l
The global reward mechanism synthesizes three critical operational objectives through weighted summation, as illustrated in Figure 6, where the reward functions receive the current state and return a local reward value, and the reward ratios give the three local rewards a global weight and add them together as a total reward. Tunable coefficients {rPUE, rtemp, rhotspot} govern the prioritization of energy efficiency, thermal uniformity, and hotspot inhibition, respectively.
When hotspot avoidance becomes dominant, setting γhotspot ≫ {γPUE, γtemp} imposes severe penalties for localized overheating, forcing the agent to prioritize cooling interventions despite increased energy costs. Similarly, if energy efficiency is emphasized, Elevating rPUE relaxes thermal constraints, permitting higher baseline temperatures to minimize cooling energy expenditure at the risk of marginal thermal deviations. This framework formalizes the inherent trade-off between energy conservation and thermal stability inherent in data center operations. The DQN agent learns adaptive policies that dynamically balance these competing objectives through gradient-driven optimization of the CRAC set temperature value Tset, guided by the operator-defined coefficient ratios.

4. A Case Study: DQN-Based Intelligent Thermal Management System

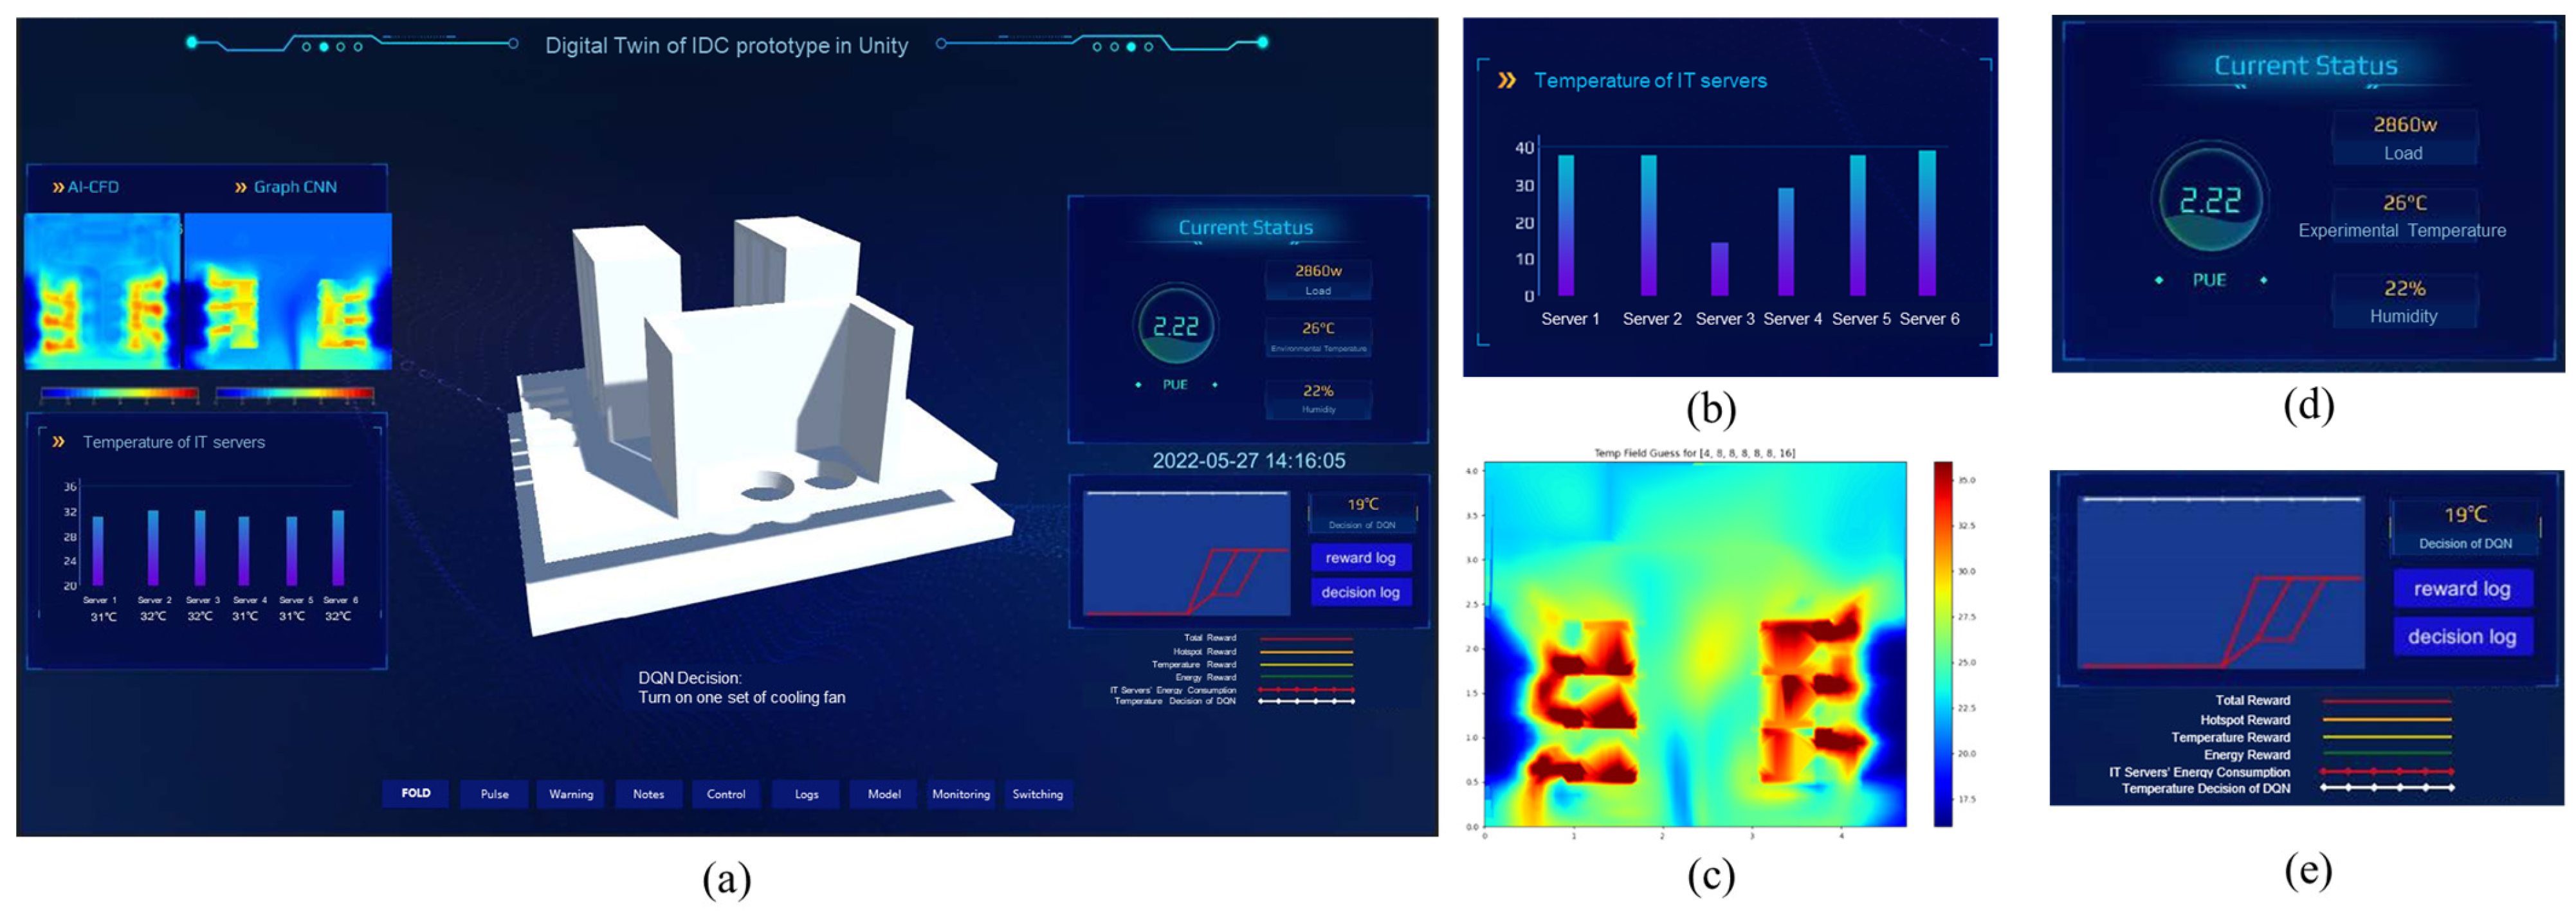
4.1. Implementation of Digital Twin Platform for IDC Prototype

According to the digital twin framework of Tao et al. [37], a scaled data center experiment prototype with sensors and control hardware (Arduino and Actuators) are established as physical entity. The virtual entity built in Unity includes a 3D model, information display window and control widgets. Services include the learning-based prediction module, DQN decision-making module and CFD simulation module. All devices in the system are wired, which allows data and signals to be transmitted internally.
Figure 7a displays the user interface, where real-time temperature sensor data is visualized in the bottom-left chart shown in Figure 7b. Based on the temperature readings, CRAC temperature, and server power, the fast thermal environment reconstruction module predicts a two-dimensional thermal map which updates every five seconds in the upper-left figure illustrated in Figure 7c. From the predicted thermal field, the deep Q-learning network identifies potential local hotspots and optimizes the temperature setpoint for the CRAC units. According to the new CRAC temperature and server powers, the power usage effectiveness can be calculated as the total power divided by the total server power and displayed on the upper-right panel in Figure 7d. The optimization process of the Deep Q-Learning network can be seen on the bottom-right figure in Figure 7e, where the reward curves are plotted. The inclined profiles of the total rewards are expected during the optimization process.
An intelligent cooling decision module is designed based on DQN, which receives the sensors’ value in an IDC test-bed and temperature map generated by a prediction module to give an optimized cooling policy to the digital twins. Accordingly, the monitor can manipulate according to the DQN decision directly. The above functional modules are integrated in the digital twin system. The scope of the IDC digital twin system is illustrated in Figure 8.
As a result, the DQN decision agent in the Digital Twin system is not only capable of recommending an AC set temperature value for the current measured condition but also of exhibiting all the evolution records of thermal management decisions and rewards.

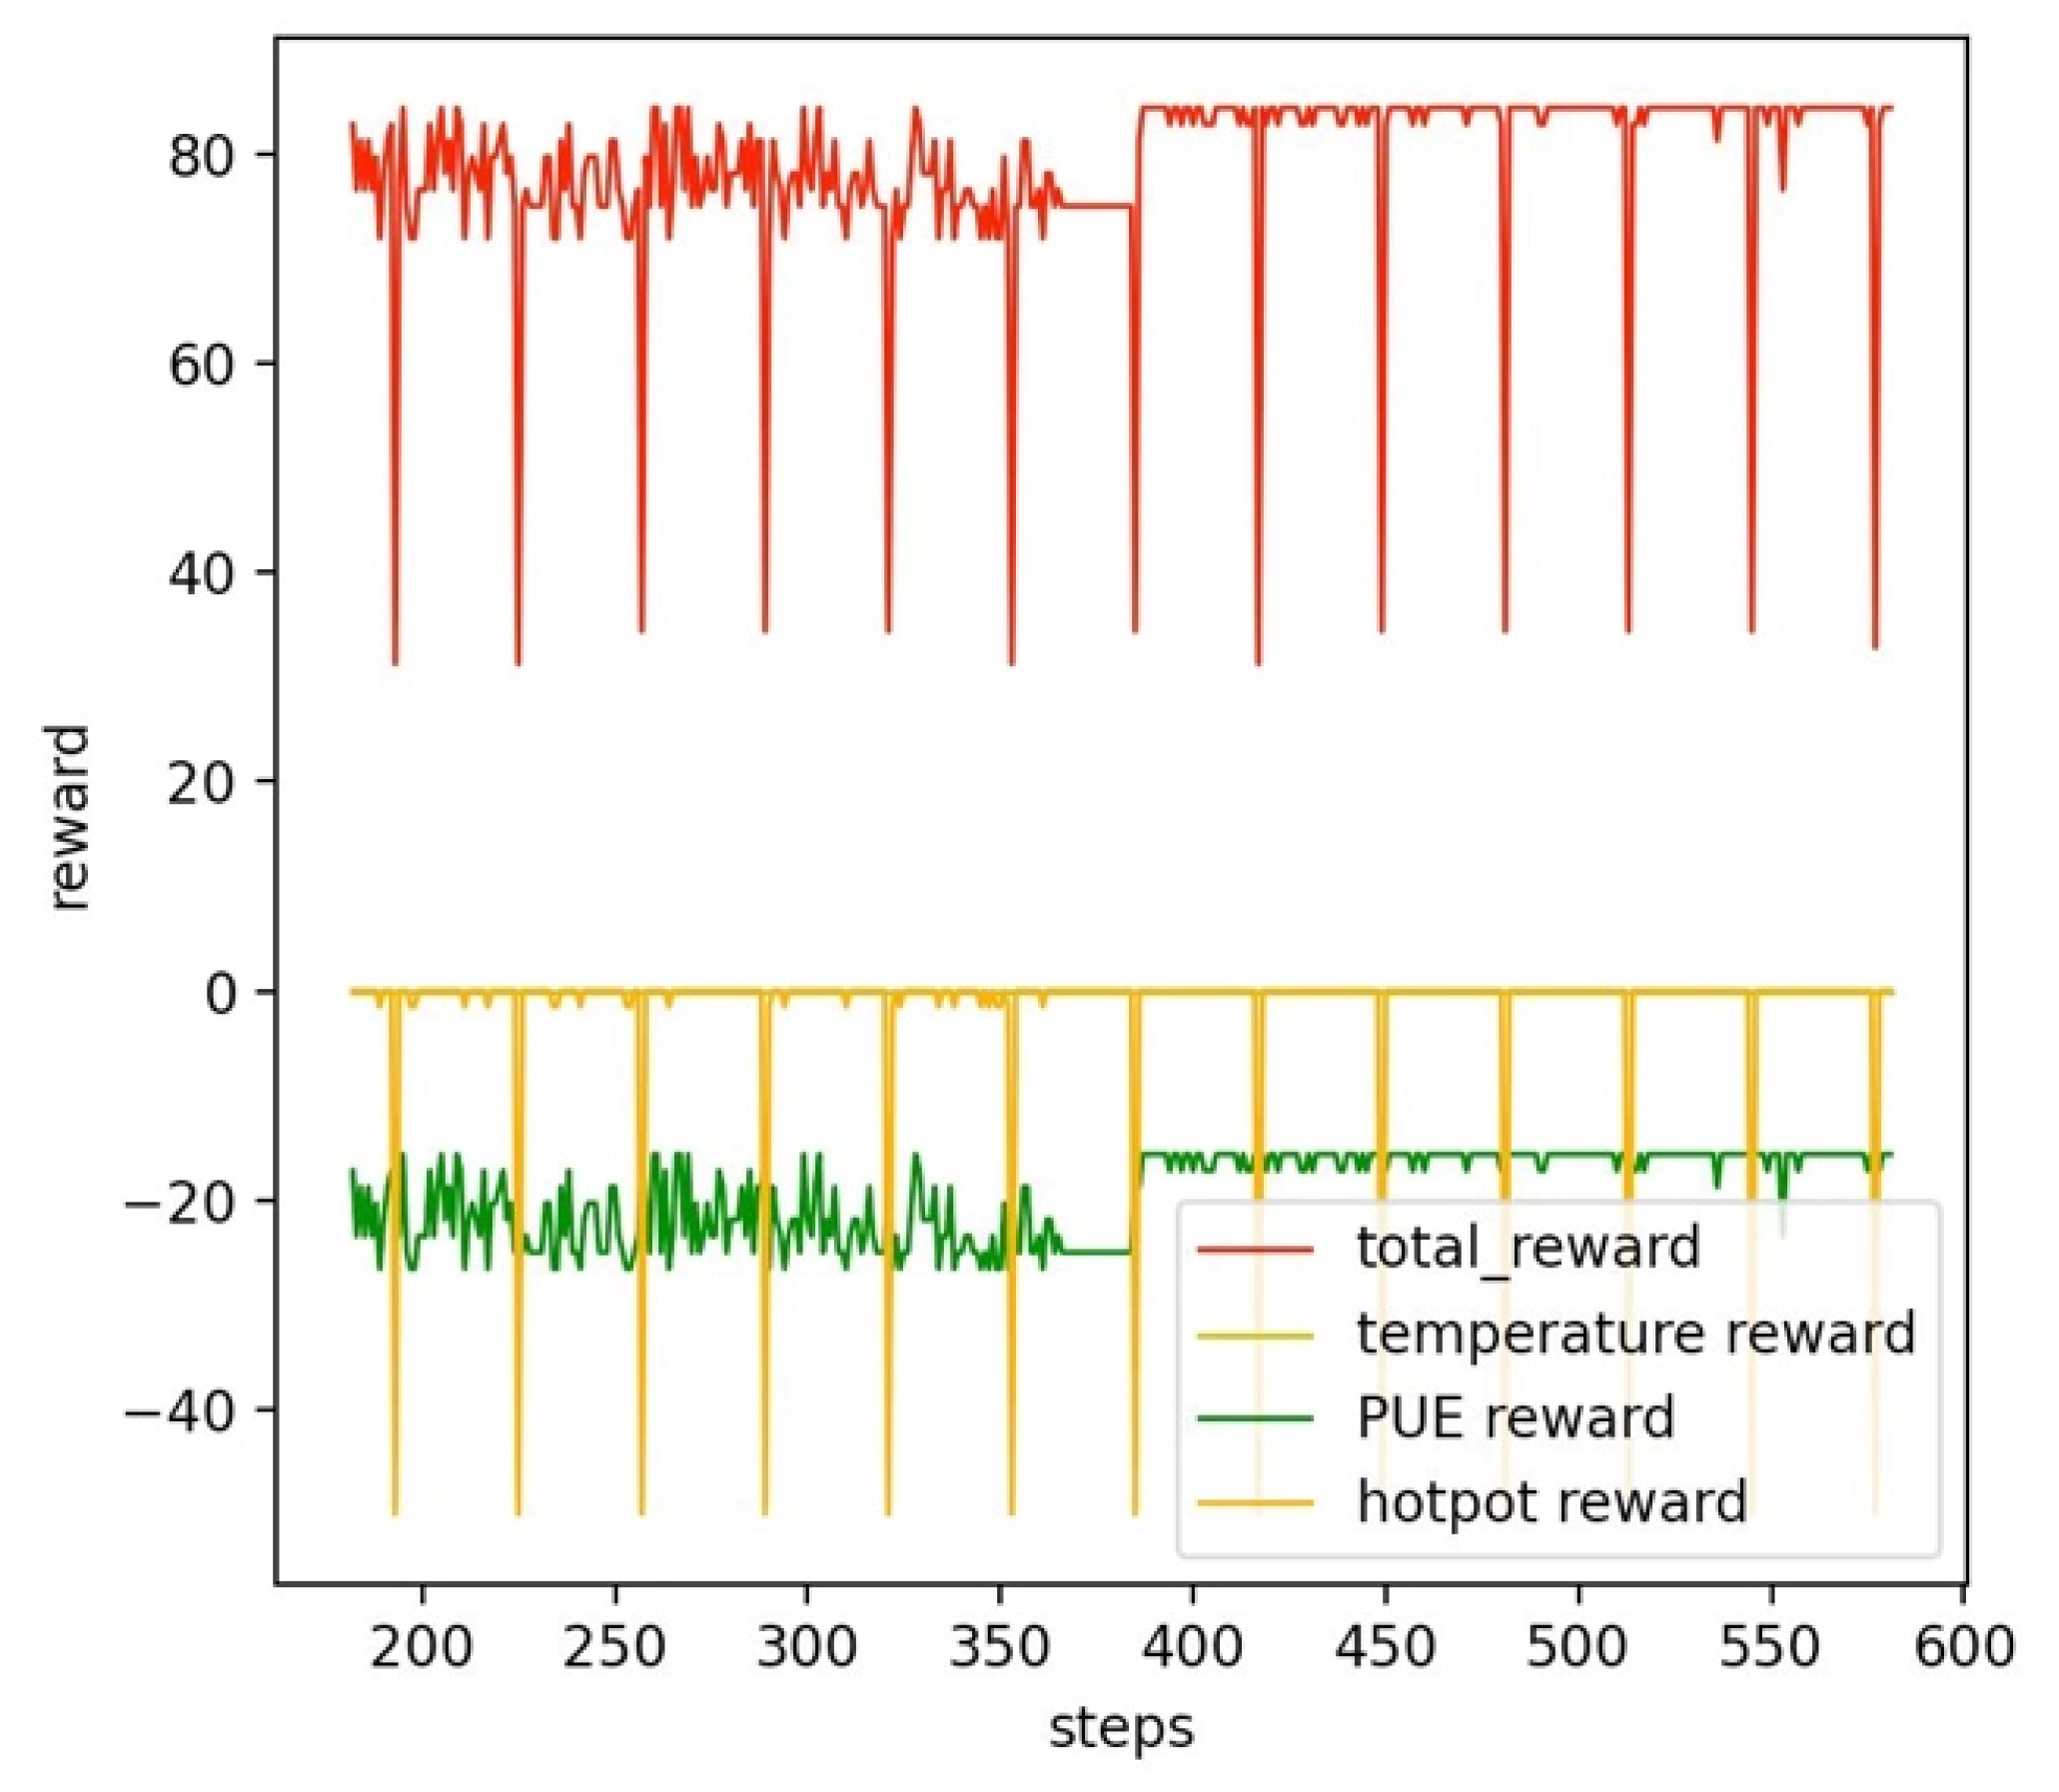
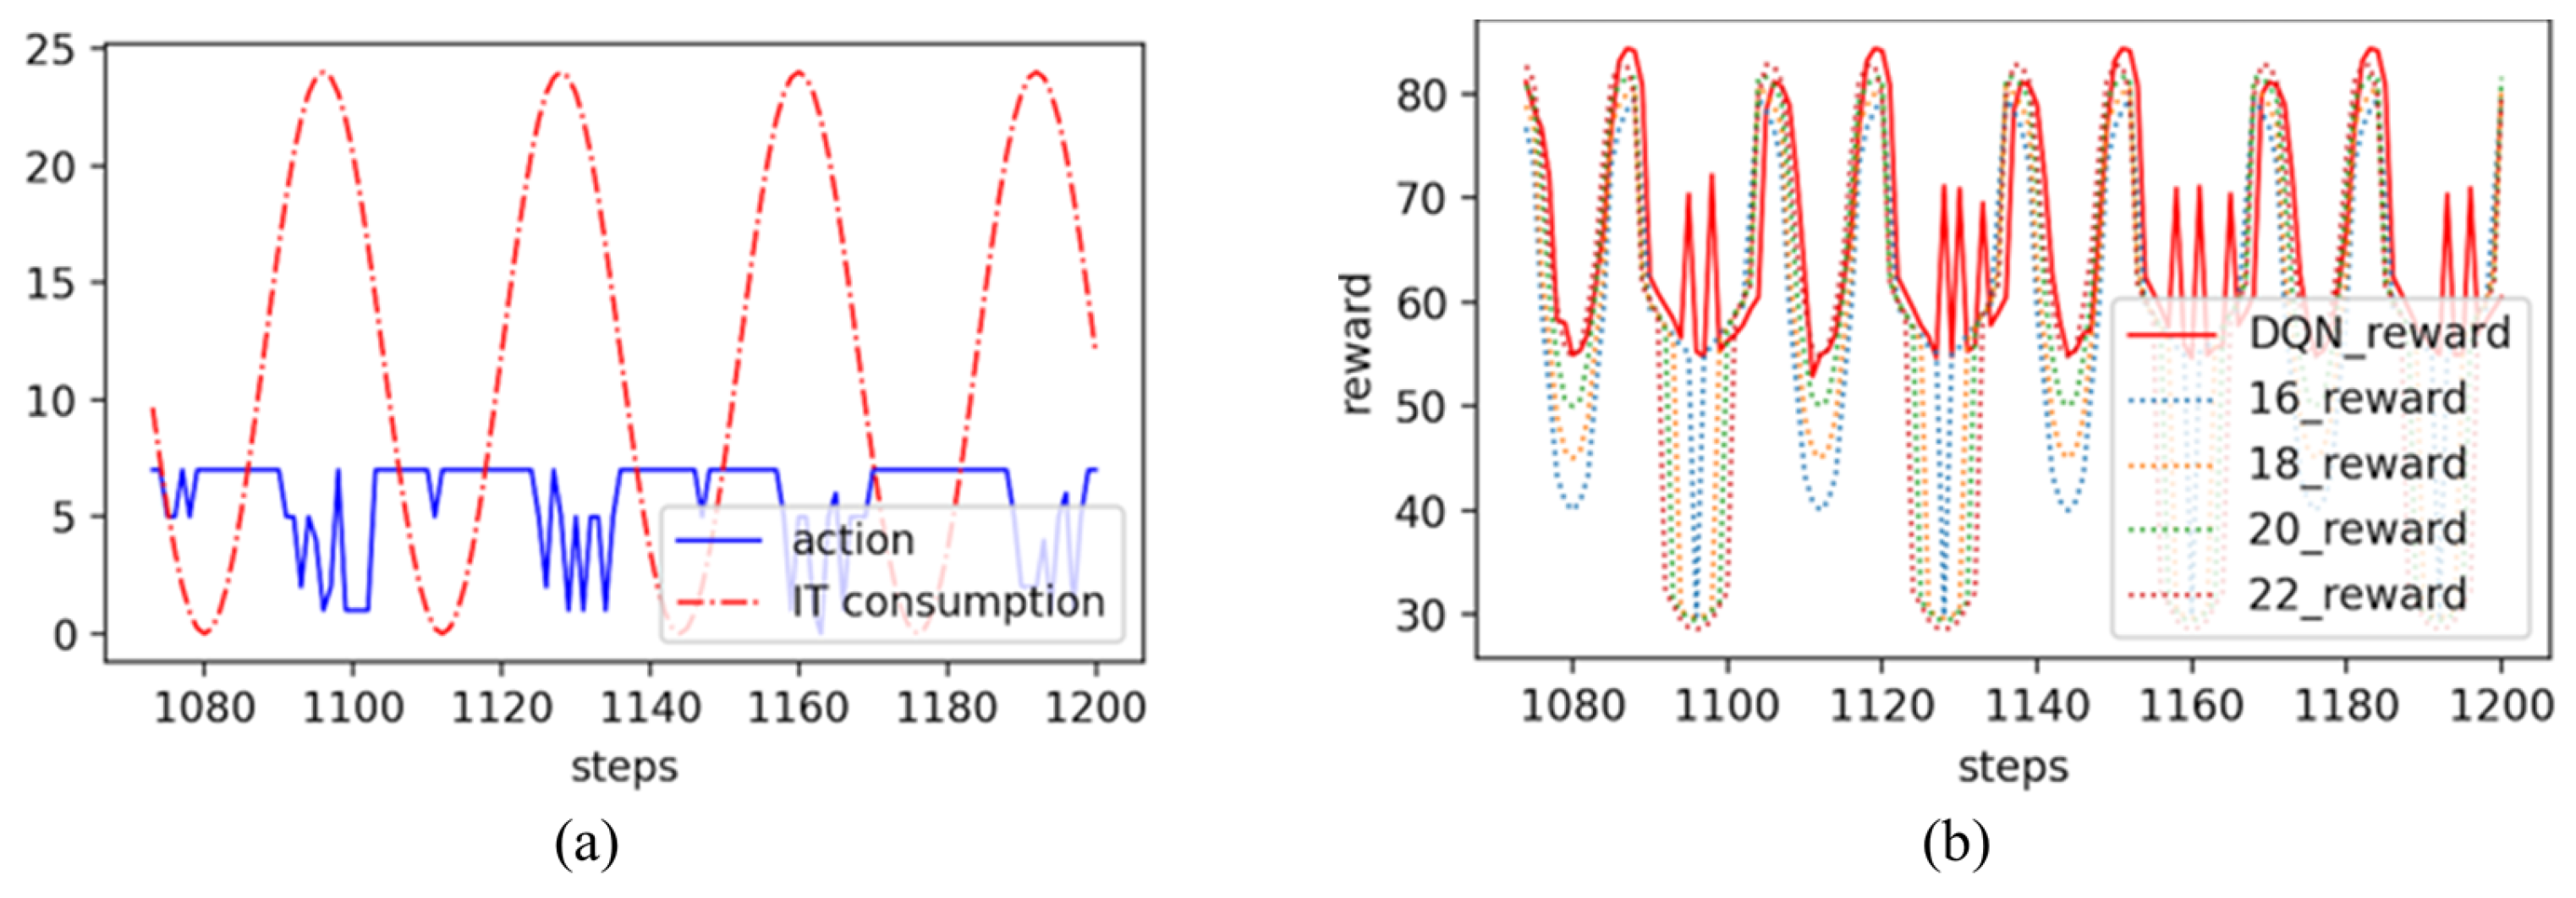
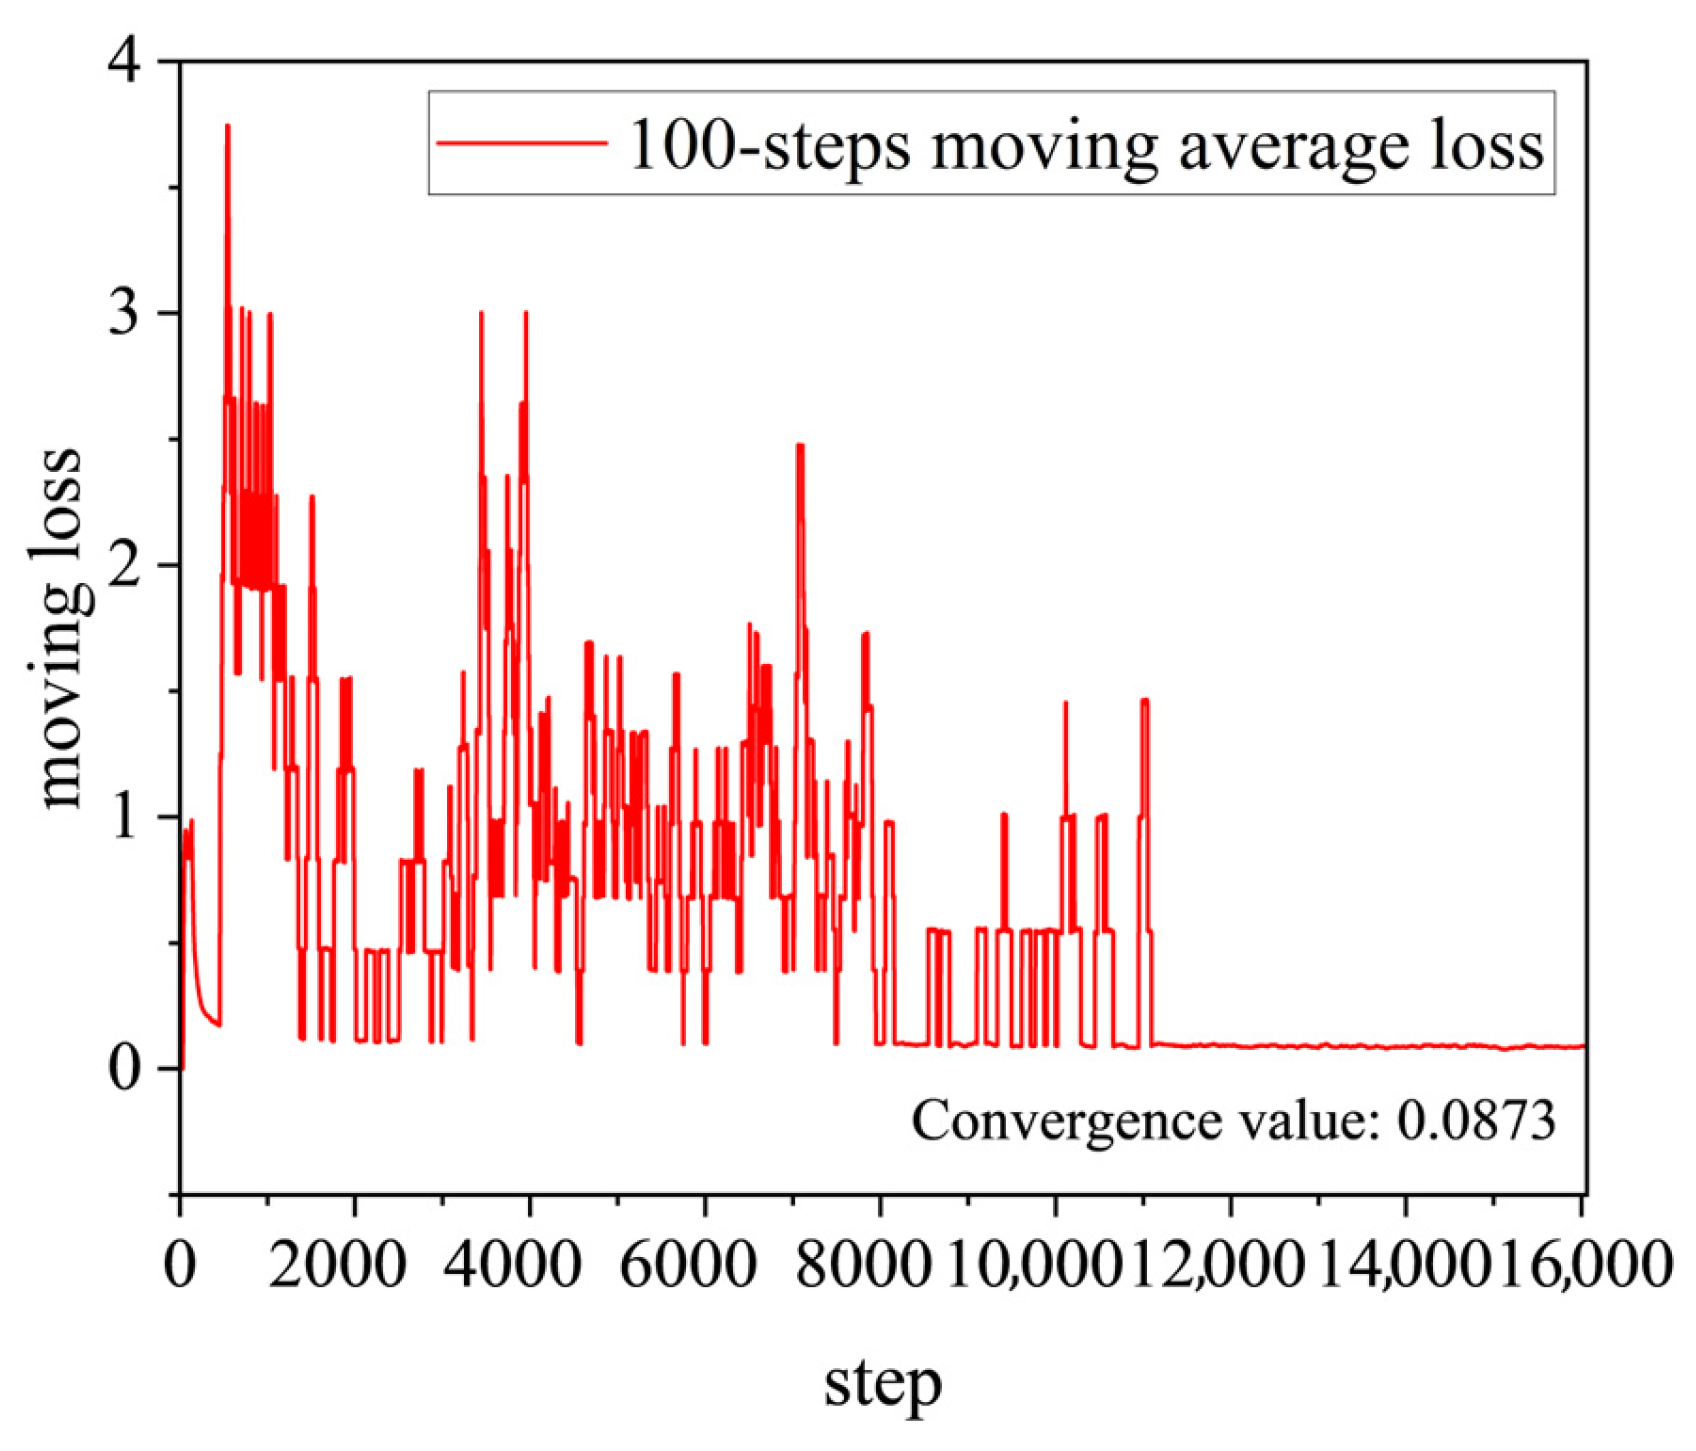
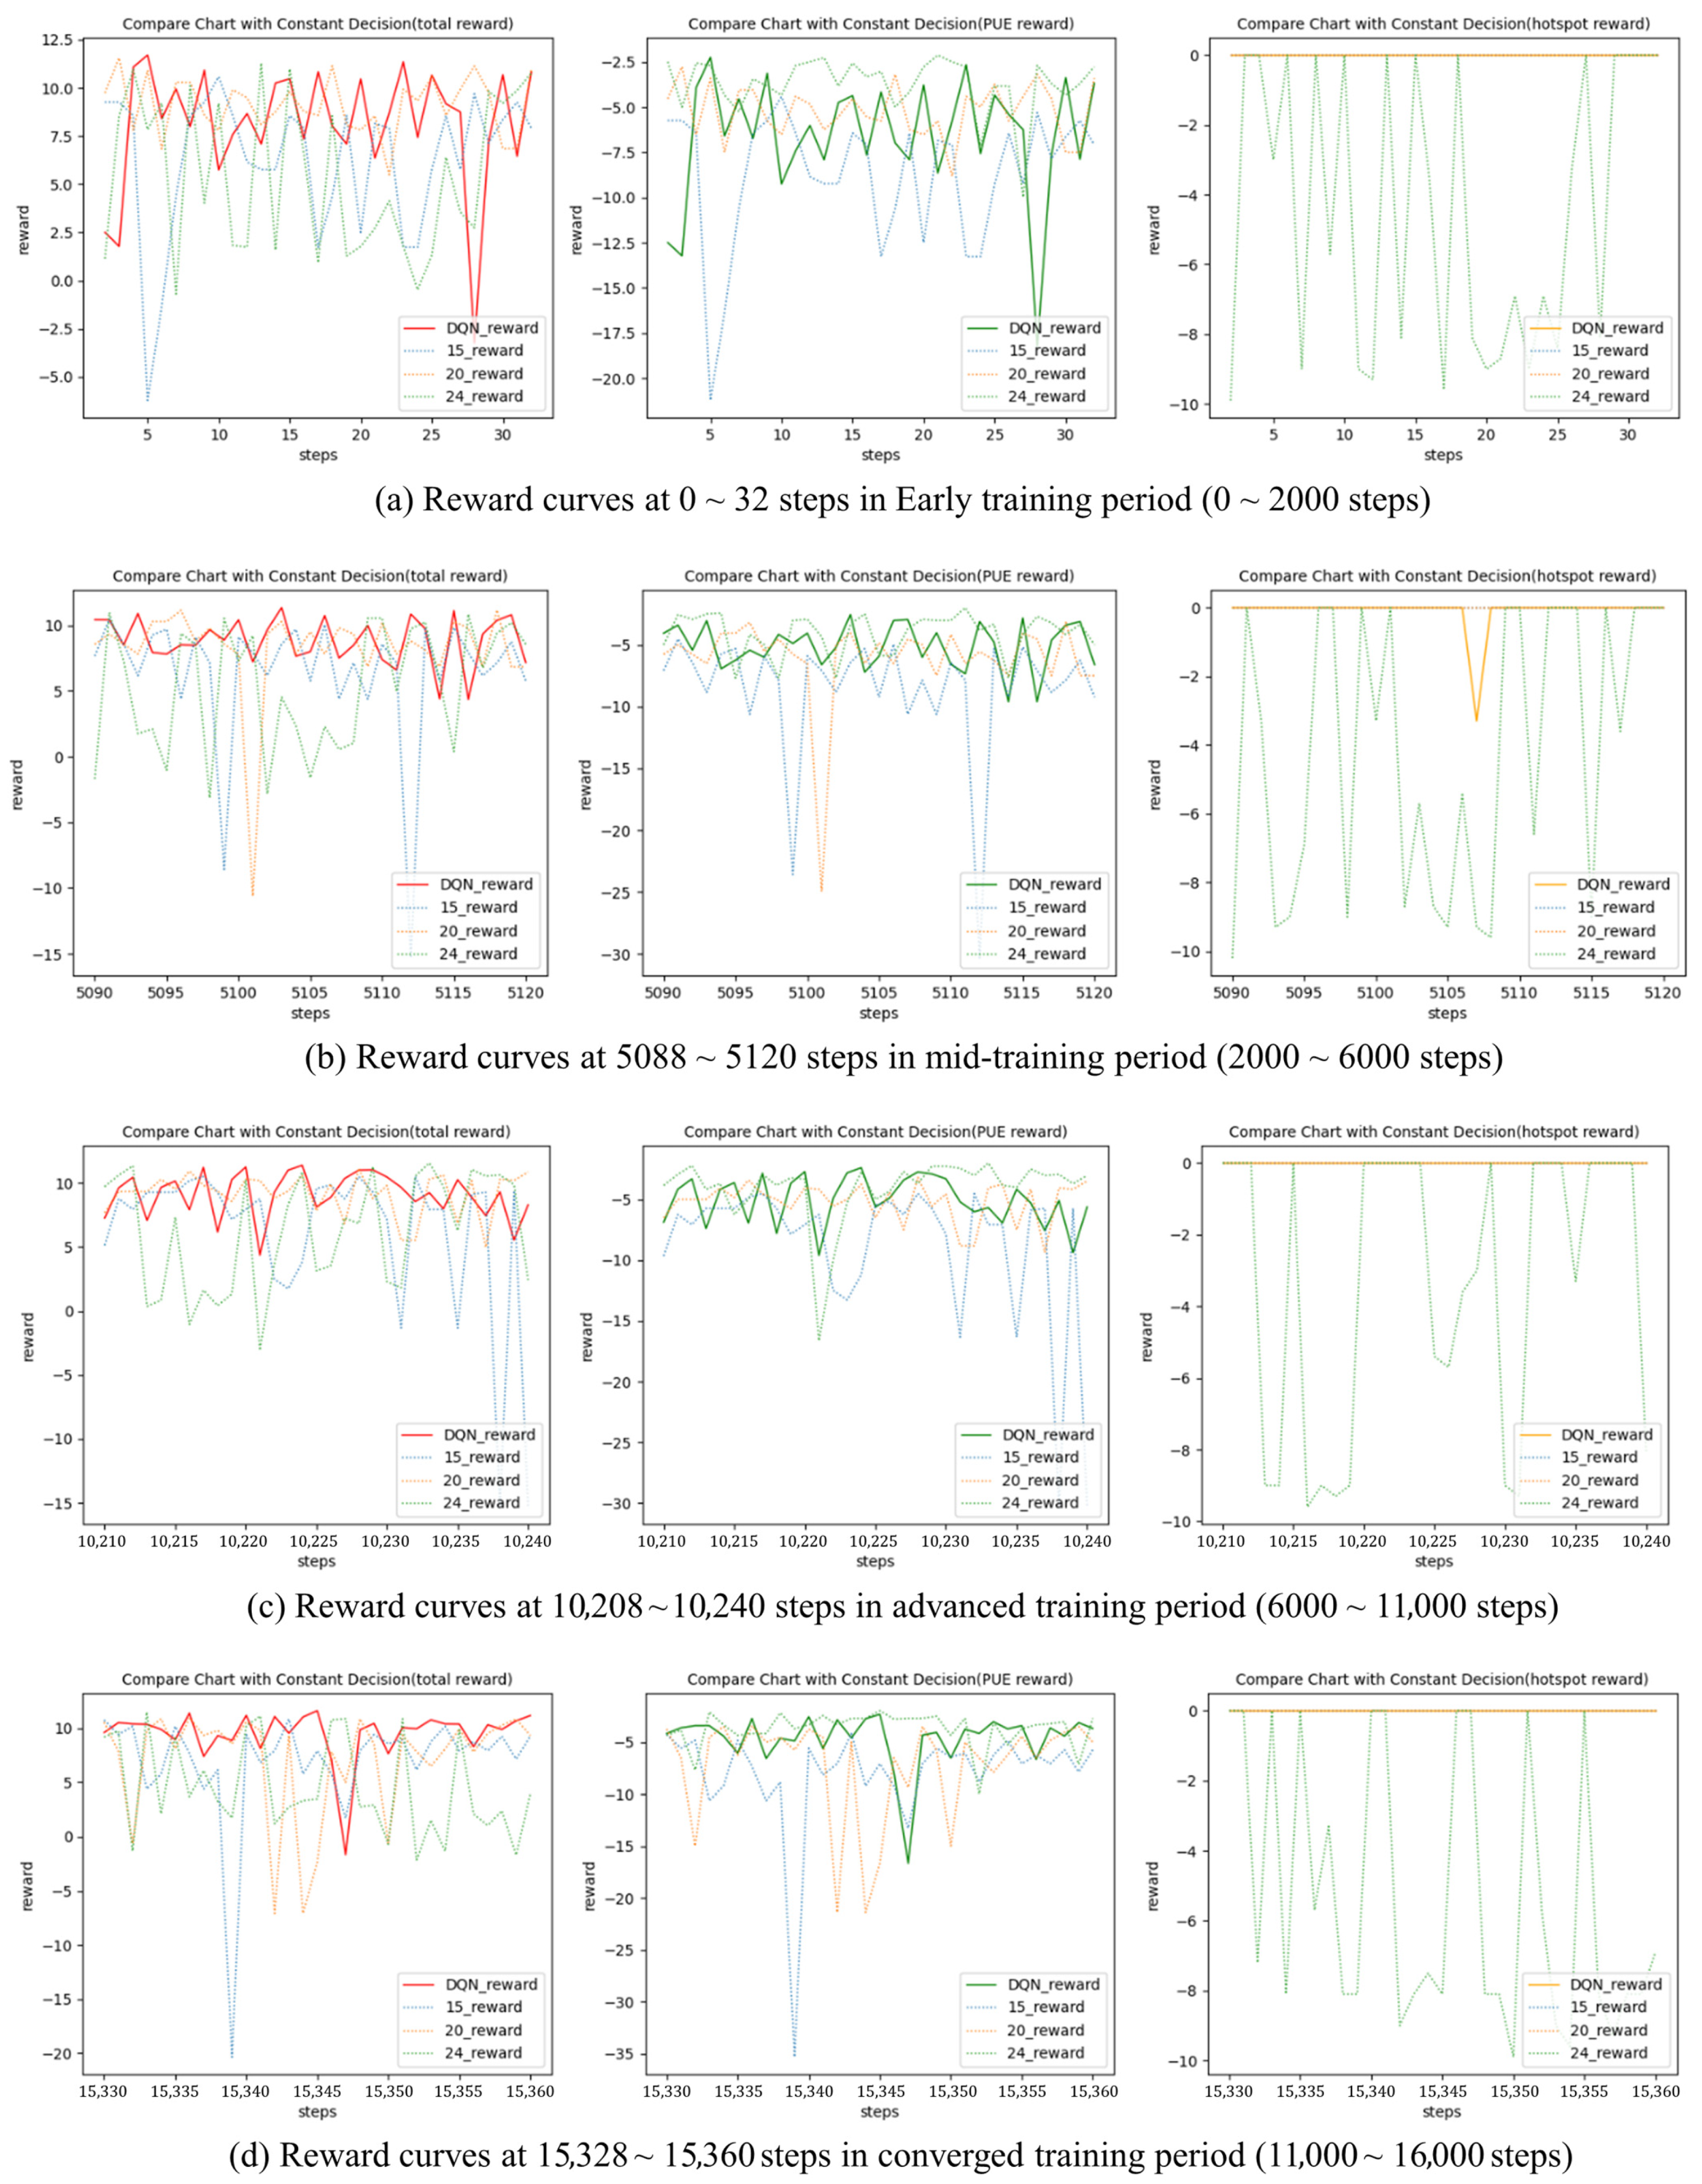
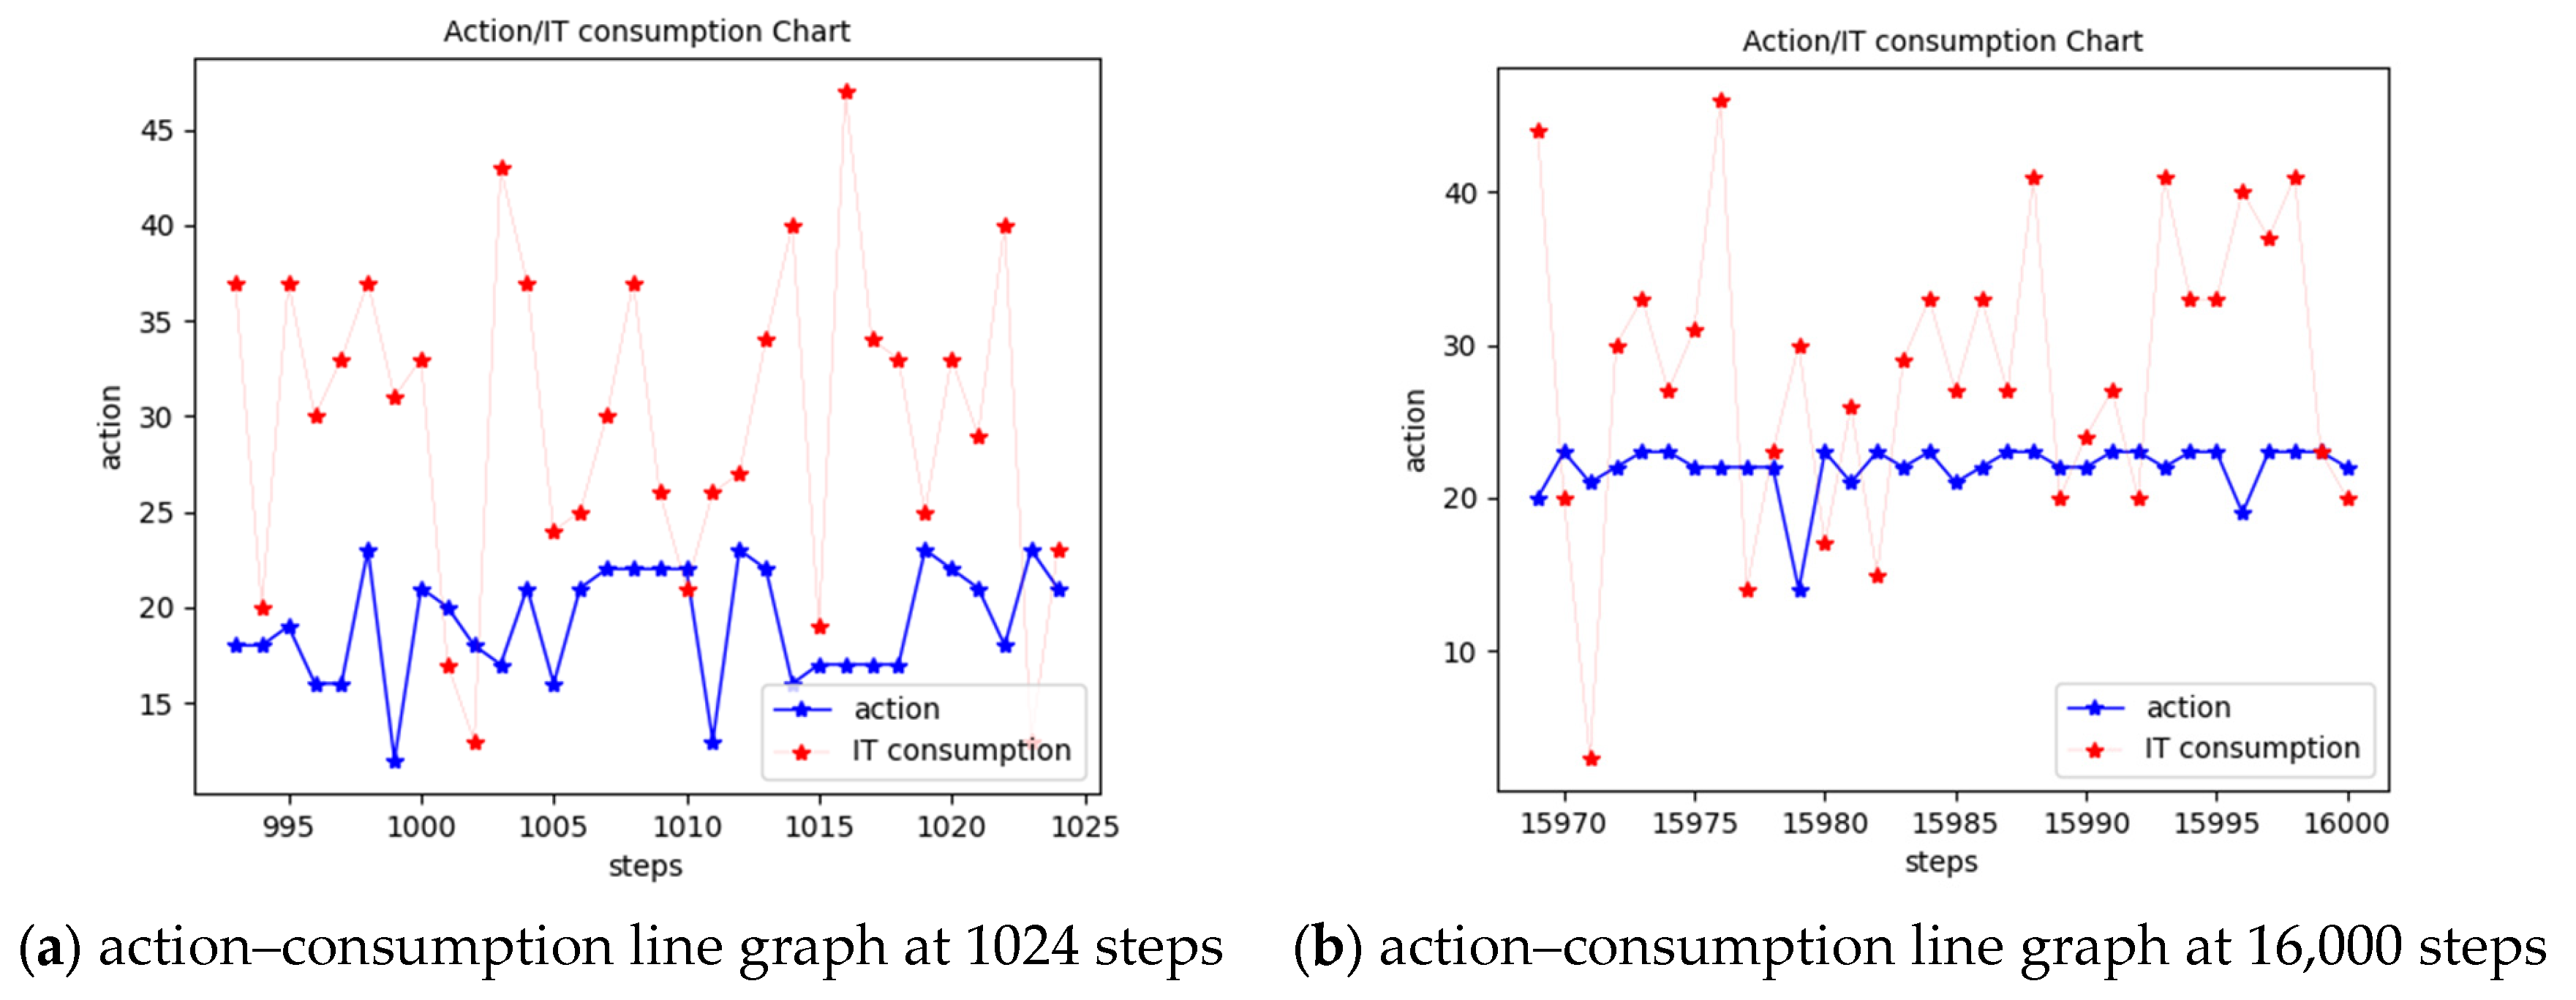
4.2. Performance of DQN-Based Intelligent Decision Making

In order to verify the ability of the DQN finding optimal cooling policy, a constant IT consumption circumstance is firstly set, where IT servers of constant heating power are given as input. Reward of DQN should finally converge to a particular optimal value. Since the state is steady and the IT consumption is a fixed value for each equipment, there is only one optimized steady state for each temperature set point.
As demonstrated in Figure 9, the green line represents the PUE reward, the orange line represents the hotspot reward, the yellow line represents the temperature reward and the red line represents the total reward plus a threshold value. Due to that locations of temperature measuring points are random, which values are usually close to the ideal temperature, Rtemp converges to zero during most of the training process.
During the exploration phase (steps 200–350), periodic oscillations in the PUE reward and intermittent hotspot penalties indicate active policy iteration. After step 380, both rewards stabilize: the PUE reward converges to a constant value while the hotspot reward remains zero, demonstrating policy convergence to a steady-state configuration. Convergence within 380 steps highlights the algorithm’s efficiency under simplified operational constraints.
To further analyze the robustness of the decision-making performance, the DQN model is tested under a more complex situation where the servers’ heating powers vary as a sinusoidal pattern.
P i = 12 × 1 + sin t i m e × 2 π s t e p
The training results show that our DQN model generates optimal cooling policies with the highest reward. As demonstrated in Figure 10a, when the IT servers’ consumption reduces, the DQN decided on a higher cooling system temperature in order to save energy. And when the IT consumption rises, the DQN agent preferred to decide on a relatively lower temperature to prevent the hotspot zone formation. The changing relationship of the reward curve and IT consumption curve has a strong correlation after being well trained, as illustrated in Figure 10b. It proves that our DQN model has strong adaptability and high robustness of decision-making performance when facing changing heating power of servers.
However, the workload distribution in reality is actually to be random, and this fact brings difficulties to deal with the cooling optimization problem. Realistic workload variability introduces state-space complexity through combinatorial explosion. Six IT servers have four discrete power levels P = {0, 3, 7, 10}; the state space cardinality grows as 46 = 4096. To maintain tractability, experiments restrict IT servers from the physical testbed to empirically operate in the power range of P = {0, 3, 7, 10}. The detailed configuration information of the DQN architecture is provided in Table 2.
This configuration balances exploration–exploitation dynamics while mitigating training instability through learning rate annealing. The training result presents convergence characteristics for the setting workload regime, demonstrating policy robustness under constrained combinatorial complexity. As demonstrated in Figure 11, the training loss converges at around 11,000 steps, having a convergent value of 0.0873.
Figure 12 systematically compares the DQN agent’s reward performance against three fixed-temperature baselines (15 °C, 20 °C, 24 °C) across four critical training stages. The first stage is the early training period, which is 0–2000 steps. Figure 12a represents the initial exploration phase where the untrained agent exhibits highly stochastic behavior. It indicates that total rewards marginally exceed those of a fixed 24 °C policy but underperform compared to a constant 20 °C baseline. While hotspot penalties remain absent due to stringent reward weighting (evidenced by suppressed green traces), the PUE reward stagnates near median values, indicating negligible energy savings.
The mid-training period (2000–6000 steps) and advanced training period (6000–11,000 steps) are shown in Figure 12b,c. It reveals incremental total reward improvements, though PUE efficiency remains comparable to untrained levels. The critical transition occurs in the converged training period (11,000–16,000 steps), as illustrated in Figure 12d, where the trained agent achieves PUE parity with the 24 °C policy while simultaneously suppressing thermal anomalies, evidenced by total reward dominance over both fixed-temperature benchmarks. The DQN hotspot reward arises from the 24 °C baseline’s excessive hotspot generation (right panels), penalized through the multi-objective reward structure. In the final period, the DQN achieves optimal trade-off and robust convergence, balancing all rewards and outperforming all baselines in total reward.
In addition, we can conclude from Figure 13 that the DQN model generates more stable and robust cooling actions after being well trained (Figure 13b) compared with the early untrained agent (Figure 13a). The DQN successfully learns to elevate setpoints facing different workloads of the IT servers’ power consumption, achieving optimal balance between PUE and hot-area reduction.
This strategic setpoint elevation directly reduces cooling energy expenditure, validating the DQN’s capacity to balance PUE minimization against thermal risk mitigation. The results quantitatively demonstrate that reward-weighted reinforcement learning successfully reconciles competing operational objectives inherent in data center thermal management.
As shown in Table 3, the total reward of DQN performs an average of −5.96, while 15 °C, 20 °C and 24 °C separately perform averages of −8.05, −8.20 and −9.64. The DQN decision-making agent performs at least a 26% increase in total reward. As for the PUE reward, which represents the energy-saving performance, the DQN agent averages at −4.52, while the three compare conditions each average at −7.53, −7.05 and −3.90. DQN performs a 40% and 36% improvement in energy saving compared with the constant 15 °C and 20 °C.
Since real-time control is required for thermal management in our prototype, the DQN model needs to generate policy in second-level when applied in testbed. Though the training of DQN costs much time, the process of making optimal policy with a well-trained model can be conducted within 1.5 s. The detailed time consumption is summarized in Table 4.

4.3. Thermal Management Process Using a DQN-Based Intelligent Strategy

Figure 14a shows a thermal management process conducted under the DQN decision. Figure 14b shows the reduction of monitoring temperature in an IDC prototype, indicating the optimal cooling policy successfully conducted by DQN.
In the running process, the DQN model can save the sensor’s log and use it as memory to enhance the training. Yet, because of the speed of the temperature transition in the real model DC, this function of DQN cannot be effectively evaluated and presented. Derived from the concept of post-training in DQN, this should enable the DQN decision-making agent to fit into the real DC quickly and to have an adaptive ability.
In the test of the DQN decision-making agent on the real-scaled DC model and Digital Twins, it is possible to automatically control the cooling system’s set point using the light information collected from the real DC. The temperature results demonstrated that the DQN can perform a function to lower the PUE and prevent overheating. The DQN decision will change with the temperature and IT consumption information that was collected from a real DC model. It can adjust the decision-biased direction by changing the reward ratio in the DQN training, and it can also apply a post-training method to a real DC. We can also store the running data in the database; DQN will draw memory from the database and improve its accuracy towards a particular DC.

5. Conclusions

In this study, we present a digital twin framework that integrates a functional data center prototype with its interactive virtual twin, enabling real-time thermal management through deep reinforcement learning. Our Unity-based digital twin provides immersive visualization of temperature dynamics and server workloads, while the DQN agent autonomously optimizes cooling setpoints to balance energy efficiency and thermal safety. By implementing the U-net algorithm for real-time temperature prediction and DQN for policy optimization, our system achieves the best comprehensive performance balancing PUE reduction, thermal uniformity and local hotspot inhibition for IDC systems, compared to traditional strategies.
We proposed this method to provide an intelligent solution for sustainable data center operation. Future research will focus on exploring graph neural networks for 3D thermal field prediction and continuous control using advanced architecture, such as DDPG.

Author Contributions

Conceptualization, H.Y. and G.Y.; methodology, H.Y. and Z.Z.; formal analysis, H.Y. and Z.Z.; investigation, H.Y. and Z.Z.; writing—original draft preparation, H.Y. and T.X.; writing—review and editing, D.Y. and G.Y.; visualization, H.Y. and Z.Z.; supervision, G.Y.; project administration, D.W.; funding acquisition, G.Y. All authors have read and agreed to the published version of the manuscript.

Funding

This work is supported by the China Communications Information & Technology Group Co., Ltd.

Institutional Review Board Statement

Not applicable.

Informed Consent Statement

Not applicable.

Data Availability Statement

The data are available from the corresponding author upon reasonable request.

Conflicts of Interest

The authors declare that this study received funding from China Communications Information & Technology Group Co., Ltd. The funder was not involved in the study design, collection, analysis, interpretation of data, the writing of this article or the decision to submit it for publication. And authors Hang Yuan and Duobing Yang were employed by the company China Communications Information & Technology Group Co., Ltd. The remaining authors declare that the research was conducted in the absence of any commercial or financial relationships that could be construed as a potential conflict of interest.

References

  1. Masanet, E.; Shehabi, A.; Lei, N.; Smith, S.; Koomey, J. Recalibrating global data center energy-use estimates. Science 2020, 367, 984–986. [Google Scholar] [CrossRef] [PubMed]
  2. Jones, N. How to stop data centres from gobbling up the world’s electricity. Nature 2018, 561, 163–166. [Google Scholar] [CrossRef]
  3. Cho, J.; Woo, J. Development and experimental study of an independent row-based cooling system for improving thermal performance of a data center. Appl. Therm. Eng. 2020, 169, 114857. [Google Scholar] [CrossRef]
  4. Dayarathna, M.; Wen, Y.; Fan, R. Data center energy consumption modeling: A survey. IEEE Commun. Surv. Tutor. 2015, 18, 732–794. [Google Scholar] [CrossRef]
  5. Zhang, X.; Lindberg, T.; Xiong, N.; Vyatkin, V.; Mousavi, A. Cooling energy consumption investigation of data center it room with vertical placed server. Energy Procedia 2017, 105, 2047–2052. [Google Scholar] [CrossRef]
  6. Li, L.; Zheng, W.; Wang, X.; Wang, X. Data center power minimization with placement optimization of liquid-cooled servers and free air cooling. Sustain. Comput. Inform. Syst. 2016, 11, 3–15. [Google Scholar] [CrossRef]
  7. Shehabi, A.; Smith, S.; Sartor, D.; Brown, R.; Herrlin, M.; Koomey, J.; Masanet, E.; Horner, N.; Azevedo, I.; Lintner, W. United States Data Center Energy Usage Report; Lawrence Berkeley National Laboratory: Berkeley, CA, USA, 2016. [Google Scholar]
  8. Qingshan, J.; Jingxian, T.; Junjie, W.; Xiao, H.; Yiting, L.; Heng, X. Reinforcement learning for green and reliable data center. Chin. J. Intell. Sci. Technol. 2020, 2, 341–347. [Google Scholar]
  9. Athavale, J.; Yoda, M.; Joshi, Y. Comparison of data driven modeling approaches for temperature prediction in data centers. Int. J. Heat Mass Transf. 2019, 135, 1039–1052. [Google Scholar] [CrossRef]
  10. Cai, S.; Mao, Z.; Wang, Z.; Yin, M.; Karniadakis, G.E. Physics-informed neural networks (PINNs) for fluid mechanics: A review. Acta Mech. Sin. 2021, 37, 1727–1738. [Google Scholar] [CrossRef]
  11. Cai, S.; Wang, Z.; Wang, S.; Perdikaris, P.; Karniadakis, G.E. Physics-informed neural networks for heat transfer problems. J. Heat Transf. 2021, 143, 060801. [Google Scholar] [CrossRef]
  12. Rao, C.; Sun, H.; Liu, Y. Physics-informed deep learning for incompressible laminar flows. Theor. Appl. Mech. Lett. 2020, 10, 207–212. [Google Scholar] [CrossRef]
  13. Pawar, S.; San, O.; Aksoylu, B.; Rasheed, A.; Kvamsdal, T. Physics guided machine learning using simplified theories. Phys. Fluids 2021, 33, 011701. [Google Scholar] [CrossRef]
  14. Ribeiro, M.D.; Rehman, A.; Ahmed, S.; Dengel, A. DeepCFD: Efficient steady-state laminar flow approximation with deep convolutional neural networks. arXiv 2020, arXiv:2004.08826. [Google Scholar]
  15. Kochkov, D.; Smith, J.A.; Alieva, A.; Wang, Q.; Brenner, M.P.; Hoyer, S. Machine learning–accelerated computational fluid dynamics. Proc. Natl. Acad. Sci. USA 2021, 118, e2101784118. [Google Scholar] [CrossRef] [PubMed]
  16. Kashefi, A.; Rempe, D.; Guibas, L.J. A point-cloud deep learning framework for prediction of fluid flow fields on irregular geometries. Phys. Fluids 2021, 33, 027104. [Google Scholar] [CrossRef]
  17. Jiang, J.; Li, G.; Jiang, Y.; Zhang, L.; Deng, X. TransCFD: A transformer-based decoder for flow field prediction. Eng. Appl. Artif. Intell. 2023, 123, 106340. [Google Scholar] [CrossRef]
  18. Jindal, L.; Doohan, N.V.; Vaidya, S.; Patel, H.; Deo, A. Deep learning-based heat optimization techniques for forecasting indoor temperature changes. Spat. Inf. Res. 2024, 32, 107–117. [Google Scholar] [CrossRef]
  19. Brandi, S.; Piscitelli, M.S.; Martellacci, M.; Capozzoli, A. Deep reinforcement learning to optimise indoor temperature control and heating energy consumption in buildings. Energy Build. 2020, 224, 110225. [Google Scholar] [CrossRef]
  20. Geyer, P.; Singh, M.M.; Chen, X. Explainable AI for engineering design: A unified approach of systems engineering and component-based deep learning demonstrated by energy-efficient building design. Adv. Eng. Inform. 2024, 62, 102843. [Google Scholar] [CrossRef]
  21. Wang, M.; Wang, Z.; Geng, Y.; Lin, B. Interpreting the neural network model for HVAC system energy data mining. Build. Environ. 2022, 209, 108449. [Google Scholar] [CrossRef]
  22. Mnih, V.; Kavukcuoglu, K.; Silver, D.; Rusu, A.A.; Veness, J.; Bellemare, M.G.; Graves, A.; Riedmiller, M.; Fidjeland, A.K.; Ostrovski, G. Human-level control through deep reinforcement learning. Nature 2015, 518, 529–533. [Google Scholar] [CrossRef]
  23. Zhang, Z.; Zeng, Y.; Liu, H.; Zhao, C.; Wang, F.; Chen, Y. Smart DC: An AI and digital twin-based energy-saving solution for data centers. In Proceedings of the NOMS 2022-2022 IEEE/IFIP Network Operations and Management Symposium, Budapest, Hungary, 25–29 April 2022; pp. 1–6. [Google Scholar]
  24. Li, Y.; Wen, Y.; Tao, D.; Guan, K. Transforming cooling optimization for green data center via deep reinforcement learning. IEEE Trans. Cybern. 2019, 50, 2002–2013. [Google Scholar] [CrossRef] [PubMed]
  25. Grishina, A.; Chinnici, M.; Kor, A.-L.; Rondeau, E.; Georges, J.-P. A machine learning solution for data center thermal characteristics analysis. Energies 2020, 13, 4378. [Google Scholar] [CrossRef]
  26. Wang, R.; Cao, Z.; Zhou, X.; Wen, Y.; Tan, R. Green Data Center Cooling Control via Physics-Guided Safe Reinforcement Learning. ACM Trans. Cyber-Phys. Syst. 2024, 8, 1–26. [Google Scholar] [CrossRef]
  27. Ran, Y.; Zhou, X.; Hu, H.; Wen, Y. Optimizing data center energy efficiency via event-driven deep reinforcement learning. IEEE Trans. Serv. Comput. 2022, 16, 1296–1309. [Google Scholar] [CrossRef]
  28. Wei, D.; Jia, Y.; Han, S. Reinforcement learning control for data center refrigeration systems. Comput. Eng. Sci. 2025, 47, 422. [Google Scholar]
  29. Silver, D.; Huang, A.; Maddison, C.J.; Guez, A.; Sifre, L.; Van Den Driessche, G.; Schrittwieser, J.; Antonoglou, I.; Panneershelvam, V.; Lanctot, M. Mastering the game of Go with deep neural networks and tree search. Nature 2016, 529, 484–489. [Google Scholar] [CrossRef]
  30. Yang, D.; Wang, X.; Shen, R.; Li, Y.; Gu, L.; Zheng, R.; Zhao, J.; Tian, X. Global optimization strategy of prosumer data center system operation based on multi-agent deep reinforcement learning. J. Build. Eng. 2024, 91, 109519. [Google Scholar] [CrossRef]
  31. Wang, Y.; Sun, Y.; Cheng, B.; Jiang, G.; Zhou, H. DQN-Based Chiller Energy Consumption Optimization in IoT-Enabled Data Center. In Proceedings of the 2023 IEEE 23rd International Conference on Communication Technology (ICCT), Wuxi, China, 20–22 October 2023; pp. 985–990. [Google Scholar]
  32. Cao, H.; Xu, X.; Li, C.; Dong, H.; Lv, X.; Jin, Q. DDQN-based data laboratory energy consumption control model. Int. J. Sens. Netw. 2024, 44, 157–168. [Google Scholar] [CrossRef]
  33. Zohdi, T. A digital-twin and machine-learning framework for precise heat and energy management of data-centers. Comput. Mech. 2022, 69, 1501–1516. [Google Scholar] [CrossRef]
  34. Zhu, H.; Lin, B. Digital twin-driven energy consumption management of integrated heat pipe cooling system for a data center. Appl. Energy 2024, 373, 123840. [Google Scholar] [CrossRef]
  35. Piras, G.; Agostinelli, S.; Muzi, F. Smart Buildings and Digital Twin to Monitoring the Efficiency and Wellness of Working Environments: A Case Study on IoT Integration and Data-Driven Management. Appl. Sci. 2025, 15, 4939. [Google Scholar] [CrossRef]
  36. Tao, F.; Cheng, J.; Qi, Q.; Zhang, M.; Zhang, H.; Sui, F. Digital twin-driven product design, manufacturing and service with big data. Int. J. Adv. Manuf. Technol. 2018, 94, 3563–3576. [Google Scholar] [CrossRef]
  37. Malone, C.; Belady, C. Metrics to characterize data center & IT equipment energy use. In Proceedings of the Digital Power Forum, Richardson, TX, USA, 18–20 September 2006. [Google Scholar]
Figure 1. Experimental setup of IDC prototype. (a) Virtual model. (b) IDC placement from vertical view. (c) Distribution of IDC prototype. (d) Heater elements. (e) Positions of thermocouples. (f) Colling plate and fans.
Applsci 15 07675 g001
Figure 2. Temperature measurement of six servers using thermocouples during the heating and cooling process. The cooling action starts from the time marked at the read dash-line.
Applsci 15 07675 g002
Figure 3. The overall network architecture of a fast thermal reconstruction method, where SDM is signed distance map, FRM is flow region map, TGM is temperature guess map, and TSM is temperature sensor map. The circled numbers in ground truth field are consistent with the numbers of IT servers in Figure 1b.
Applsci 15 07675 g003
Figure 4. Predicted 2D temperature field in the test set, where server powers are set as 14 kW, 2 kW, 14 kW, 14 kW, 14 kW, 14 kW, respectively, and the CRAC temperature is set to 12 °C.
Applsci 15 07675 g004
Figure 5. Structure of the DQN algorithm.
Applsci 15 07675 g005
Figure 6. The reward design for the proposed DQN decision making agent: PUE value, temperature uniformity and local hotspot. The red dots represent the locations of monitoring sensors. The double arrows indicate the observing regions of hotspot reward, which is explained in Section 3.2.3 in detail.
Applsci 15 07675 g006
Figure 7. Digital twin system of IDC prototype based on Unity. (a) The UI of virtual twin. (b) Dynamic charts of real-time temperature value from sensors in testbed. (c) Fast reconstructed temperature field from surrogate model. (d) The real-time indicators of current status. (e) Reward curves of DQN decision process.
Applsci 15 07675 g007
Figure 8. The scope of the IDC digital twin system.
Applsci 15 07675 g008
Figure 9. Reward curves of DQN decisions on constant server consumption.
Applsci 15 07675 g009
Figure 10. (a) The optimal actions of DQN corresponding to IT consumption. (b) Reward profiles of DQN decision, constant AC temperature 16, 18, 20 and 22 °C after convergence.
Applsci 15 07675 g010
Figure 11. The 100-steps moving average loss curve of the DQN training process.
Applsci 15 07675 g011
Figure 12. Reward profiles of DQN decision and constant AC temperature 15, 20 and 24 at different time steps.
Applsci 15 07675 g012
Figure 13. Optimal actions of DQN and corresponding IT power consumption at different training steps.
Applsci 15 07675 g013
Figure 14. DQN works with Digital Twins to control the cooling system in a real-scaled model.
Applsci 15 07675 g014
Table 1. Predicting error of the surrogate model.
Learning RateDataset SizeTemperature Guess Map (TGM)MAE (°C)MAPE
0.000391 simulationsInterpolation2.279.21%
Table 2. Hyperparameter setting of DQN architecture for discrete heating power.
ParametersValue
Learning ratelr = 0.0001
Exponential decayλ = 0.95
Discount factorγ = 0.5
Exploration parametersϵ0 = 0.6, ϵmin = 0.2 ϵdecay = 0.99
Reward weightsRtemp = 0.2, RPUE = 2.5, Rhotspot = 0.3
Thermal thresholdTthres = 50 °C, Tideal = 25 °C
Experience replay capacityC = 104
Table 3. Average reward value comparison table.
DQNConst. 15 °CConst. 20 °CConst. 24 °C
Total−5.96−8.05−8.20−9.64
PUE−4.52−7.53−7.05−3.90
Hotspot0.090.180.27−3.47
Table 4. Time consumption of DQN in training process and deploying process.
Training 16,000 EpisodesDeploying
Time35.59 h (128,112.47 s)1.46 ± 0.1 s
DevicesNVIDIA GeForce RTX 4070 SUPER (28 GB) with Intel Core i7-9700 CPU, Beihang University, Beijing, China.
Disclaimer/Publisher’s Note: The statements, opinions and data contained in all publications are solely those of the individual author(s) and contributor(s) and not of MDPI and/or the editor(s). MDPI and/or the editor(s) disclaim responsibility for any injury to people or property resulting from any ideas, methods, instructions or products referred to in the content.

