1. Introduction
In modern medicine, radiation therapy remains a cornerstone in cancer treatment. As the most widely established modality, it benefits from decades of clinical research and extensive infrastructure in radiotherapy centers worldwide. Over time, the field has evolved from individualized anatomical treatments toward a more sophisticated, personalized approach that integrates technological advancements for precise dose delivery with biological insights into tumor characteristics and resistance mechanisms [
1]. Photon therapy is a conventional method that uses ionizing X-ray radiation to target and eradicate cancerous tissues. The primary mechanism involves damaging the DNA of malignant cells, leading to cell death and ultimately controlling or eliminating tumor growth. However, a significant limitation of X-ray therapy is its inability to selectively target tumors at varying depths while sparing adjacent healthy tissue. This issue arises from the inherent nature of photon energy deposition in tissue, where, after a brief accumulation, the radiation dose increases with depth, potentially resulting in unintended damage to healthy tissues beyond the tumor site [
2].
To address this limitation, particle beam therapy, using protons and heavy ions, has emerged as a more precise modality, offering enhanced protection for normal tissues by concentrating energy deposition at a specific depth. Proton therapy, a leading form of particle therapy, was first introduced in a clinical setting at Loma Linda University Medical Center (CA) in 1990. By the end of 2022, over 300,000 patients had been treated with proton therapy [
3]. Currently, more than 140 proton therapy facilities are operating worldwide, with more than 20 additional centers under construction [
4].
Proton therapy has gained attention because of its superior dose-distribution properties. As protons travel through tissue, their velocity decreases as energy is lost through inelastic Coulombic interactions with atomic nuclei. Near the end of their path, protons deposit most of their energy, resulting in a low entrance dose, followed by a sharp increase at the maximum peak, and a steep fall-off at the end of the range. This peak, known as the “Bragg peak”, occurs near the end of the proton beam range, which is determined by the energy of the protons [
5].
As illustrated in
Figure 1, which compares the depth-dose distribution characteristics of the X-rays and the proton beam, the peak of the proton depth-dose distribution occurs at a specific depth. The position of this peak can be adjusted by varying the proton energy to target a desired depth. In addition, the Bragg peak profile characterizes the depth-dose distribution of a proton beam, highlighting key dosimetric parameters. The range at 100% dose (R
BP) marks the location of the peak dose deposition. The range at 80% dose (R
80) is commonly used to define the clinical target position due to its stability and reproducibility [
6]. The distal fall-off width (W
80–20), defined as the distance between the 80% and 20% dose levels on the distal edge of the Bragg peak, reflects the sharpness of dose fall-off and is critical for assessing beam precision and minimizing dose to surrounding healthy tissues.
This unique feature allows for precise targeting of the tumor while protecting surrounding healthy tissue [
7], potentially reducing collateral damage to healthy cells. With the advancement of pencil beam scanning, protons can now be precisely directed using intensity-modulated proton therapy (IMPT) [
8]. This advanced technique enables controlled energy deposition within the tumor at a predetermined depth or over a narrow range, minimizing exposure to healthy tissues around the tumor. These characteristics make proton and other charged-particle therapies more advantageous for cancer radiation therapy than conventional photon beams.
Additionally, from a radiobiological perspective, charged particle beams provide a high linear energy transfer (LET) around the Bragg peak [
9]. LET refers to the energy that charged particles deposit per unit length as they move through a material or tissue. LET increases progressively as the particles approach the Bragg peak and reaches a sharp peak near the distal end due to energy loss from successive nuclear and electromagnetic interactions. This high LET region creates dense ionization clusters that effectively damage DNA and are less influenced by oxygen levels. This characteristic allows it to overcome the radioresistance of hypoxic tumor cells, which is a limitation of conventional photon therapy [
10].
In radiobiological studies, LET is typically averaged based on dose deposition (LET
d) rather than track length (LET
t). A systematic review of 354 proton therapy publications revealed that 69% reported LET
d [
11]. However, calculating LET accurately is challenging because primary protons continuously lose energy and produce secondary particles. Additionally, researchers have different methods for averaging, specifying mediums, normalizing densities, and including secondary particles. These variations can result in significantly different LET values, hindering the development of reliable relative biological effectiveness (RBE) models. RBE evaluates therapeutic efficacy by comparing clinical outcomes with those achieved using standard radiation, usually Co-60 and X-ray irradiation. However, the RBE of particle therapy remains poorly quantified due to its dependence on multiple factors, including LET [
12,
13,
14,
15].
Since LET is strongly correlated with RBE—and directly correlates under constant radiobiological conditions—accurate LET characterization is crucial for conducting RBE-weighted dose calculations in treatment planning systems (TPSs) [
16,
17]. However, most clinical TPSs rely on a fixed RBE value of 1.1 [
18], which may underestimate the true effectiveness of high-LET areas at the distal Bragg peak and increase the risk of damage to surrounding healthy tissues. This limitation presents a critical gap in ensuring that the tumor receives the optimal dose and the appropriate LET distribution. Addressing this gap requires the implementation of MC simulations, which offer the precision necessary to correlate the Bragg peak with LET positioning. Further investigation is required to refine these correlations and enhance TPS accuracy in clinical applications. The purpose of this study is to characterize the proton beam energy and energy spread obtained from the proton cyclotron accelerator at King Chulalongkorn Memorial Hospital in Bangkok, Thailand. The objective parameters include the Bragg peak position, R
80, distal fall-off, and LET
d values.
2. Materials and Methods
To establish beam parameters for machine setup, comparison with TPSs, and other experimental planning, MC simulations were implemented to provide high accuracy in dose calculations. These simulations account for secondary particles, such as neutrons, light ions, electrons, X-rays, and gamma rays, generated during the tracking process, which significantly influence the dose distribution, LET, and DNA damage. For realistic simulation conditions, beam parameters were obtained from measurements of the cyclotron proton accelerator at King Chulalongkorn Memorial Hospital.
2.1. Cyclotron Accelerator Specifications
The cyclotron accelerator at King Chulalongkorn Memorial Hospital is the Varian ProBeam Compact spot scanning system (Varian Medical Systems, Palo Alto, CA, USA). This system utilizes a pencil beam scanning technique to deliver IMPT, enabling precise dose distribution around the target volume. The energy is varied using an energy degrader, providing an energy range of 220 MeV down to 70 MeV, corresponding to an increase in the transverse beam size (
) from approximately 3.5 to 6.0 mm with a decreasing beam energy after exiting the windows [
19].
Degradation directly influences the beam properties in the exit windows, including energy spread (), transverse beam size (), and the divergence. In this work, we focus on the energy spread and the transverse beam size. The measured Bragg peak in the water phantom was used to characterize the energy spread, and the measured transverse beam size at the target entrance was incorporated into the MC simulations to optimize the beam size at the defined source position, ensuring precise modeling and accurate dose calculations.
2.2. Monte Carlo Simulation: GEANT4 Simulations
A key challenge of this study lies in integrating machine parameters from the cyclotron accelerator, such as the average beam energy (E
mean), the energy spread (
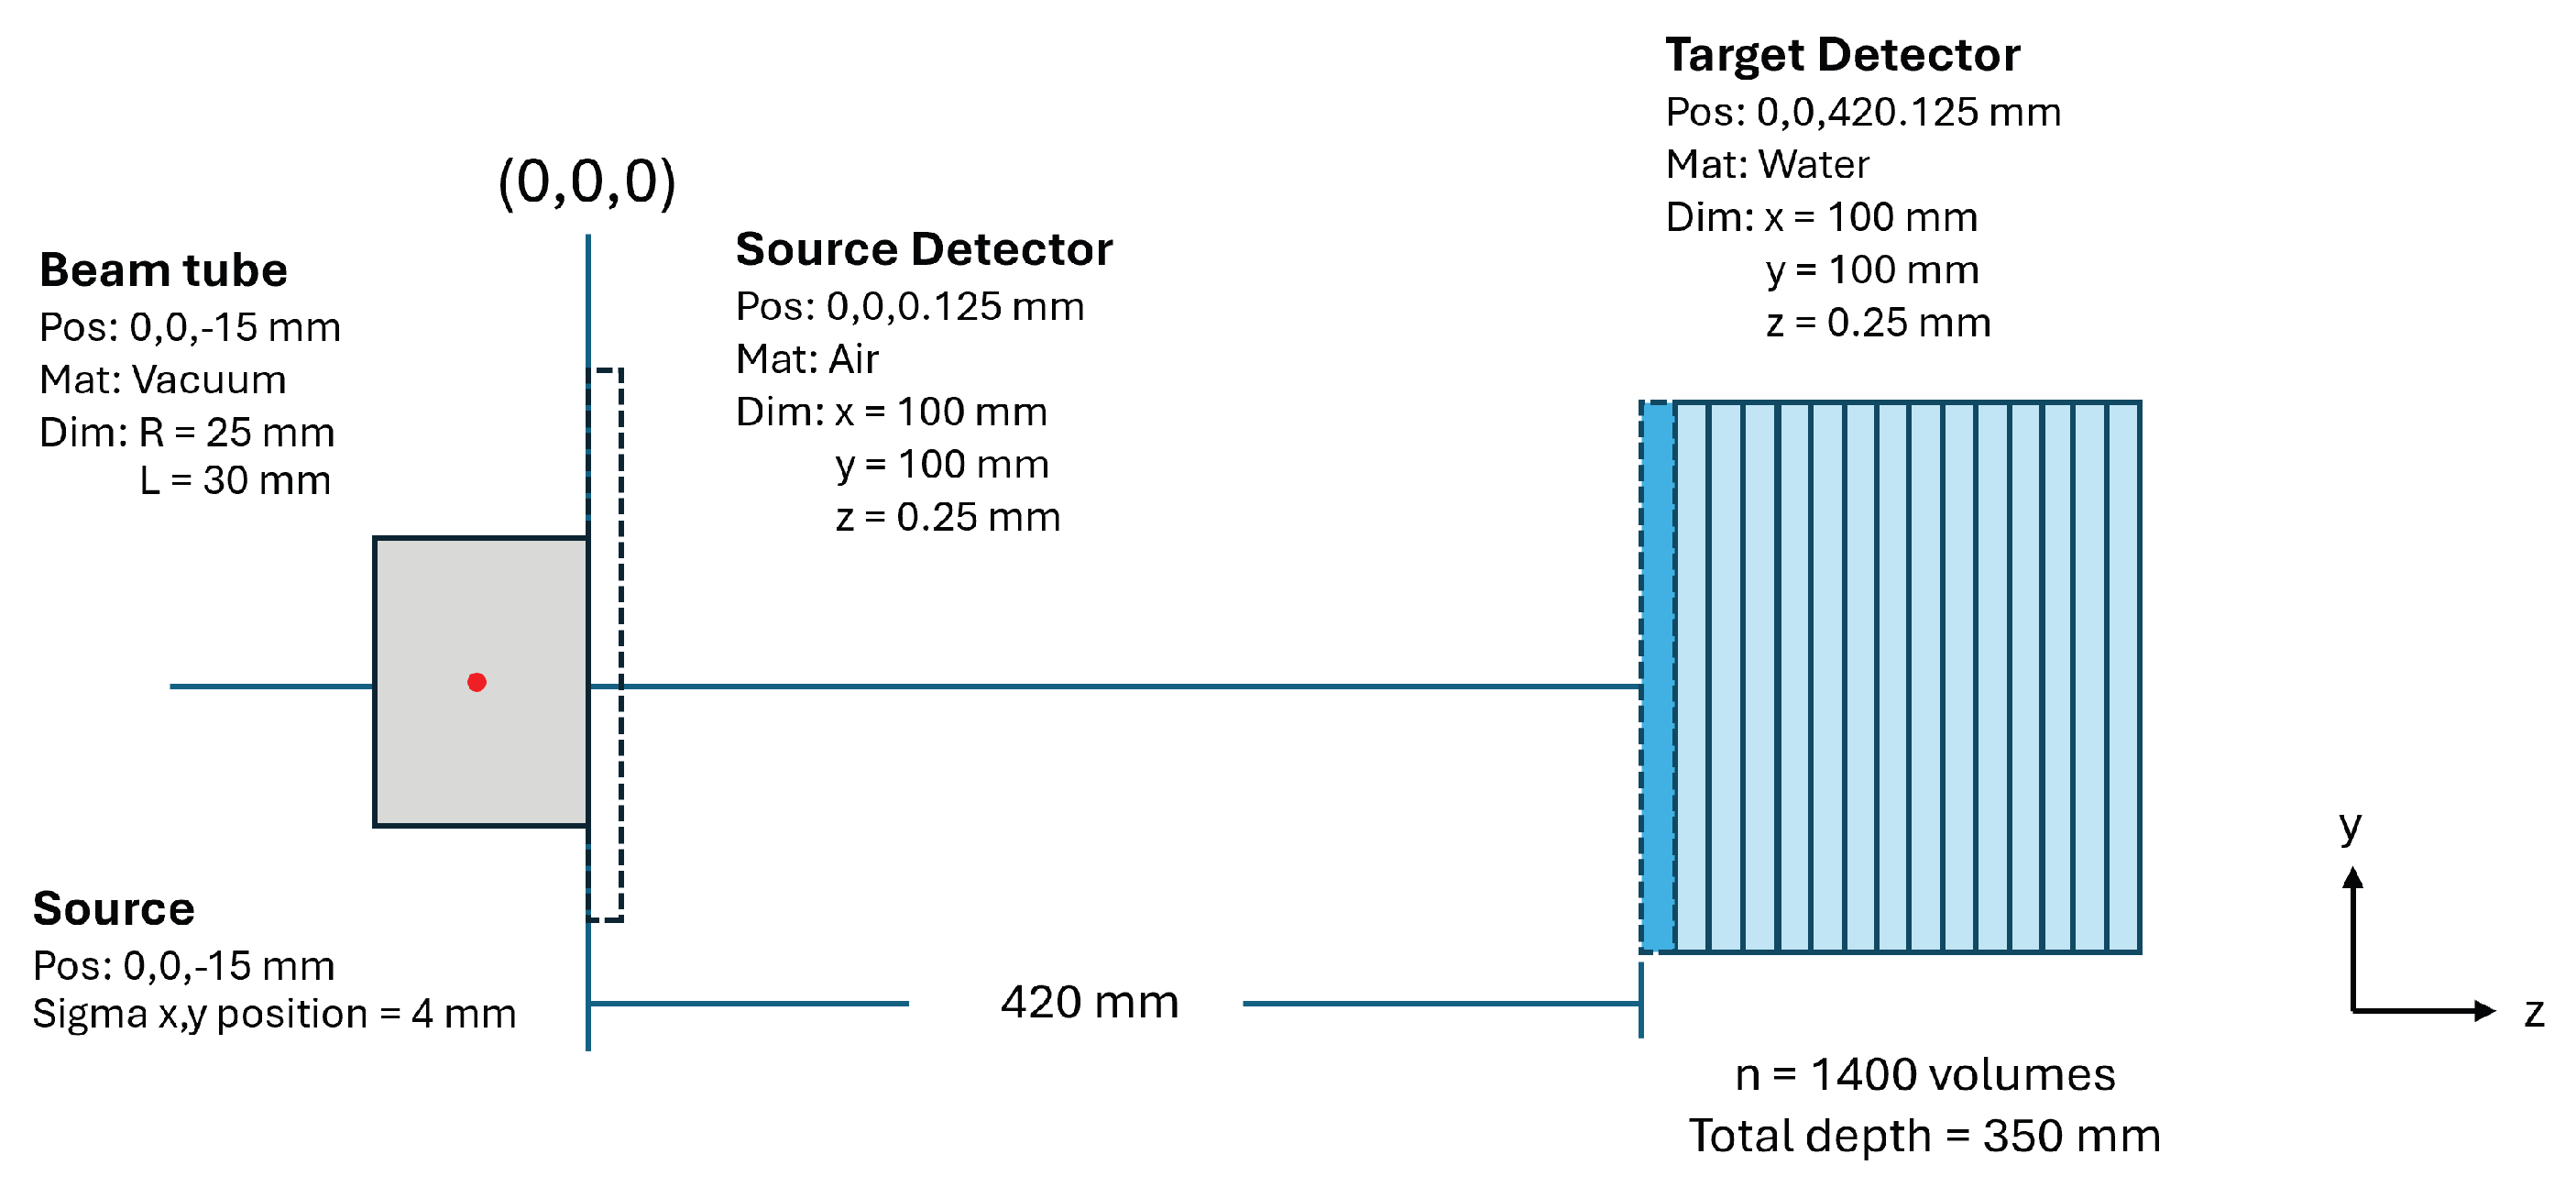
) and the influence of the transverse beam size, dose, and LET, into the simulation. These parameters are rigorously examined, and their impacts are presented in this paper. In the simulation, the source of the beam is defined as a virtual source located at the treatment head before the exit window. As can be seen in
Figure 2, the distance from the source to the phantom surface was set at 420 mm. For this study, a cubic water phantom (50 × 50 × 40 cm
3), which matches the dimensions of a standard phantom used in beam commissioning, was modeled. A virtual sensitive detector, positioned immediately in front of the exit window, was used to capture the beam profile data.
The simulation was performed using GEANT4 (version 11.0) [
20], a widely recognized open source tool, to model the treatment process. The QGSP_BIC_HP reference physics list was used for all simulations in this study, which is a comprehensive physics list that covers a wide range of hadronic interactions. It is used to simulate the interaction of high-energy protons and neutrons with tissue in radiation therapy applications. To measure depth-dose and beam profiles, the water phantom was subdivided into 1400 thin slabs, each 0.25 mm thick, arranged across a total depth of 350 mm, sufficient to cover the full range of proton energies used in this study. Proton particles were generated using the G4ParticleGun() class. The particle gun was positioned at the center of the vacuum tube to generate a focused beam with a defined beam size and energy spread.
To generate particles with a Gaussian distribution of beam size and energy spread, the function G4RandGauss::shoot(mean, sigma) was employed, where the mean and sigma were defined to cover the values of interest in this study.
3. Energy and Energy Spread Characterization
The proton energy significantly influences the depth position of the Bragg peak. The impact of energy spread on the depth-dose distribution is well documented in the literature [
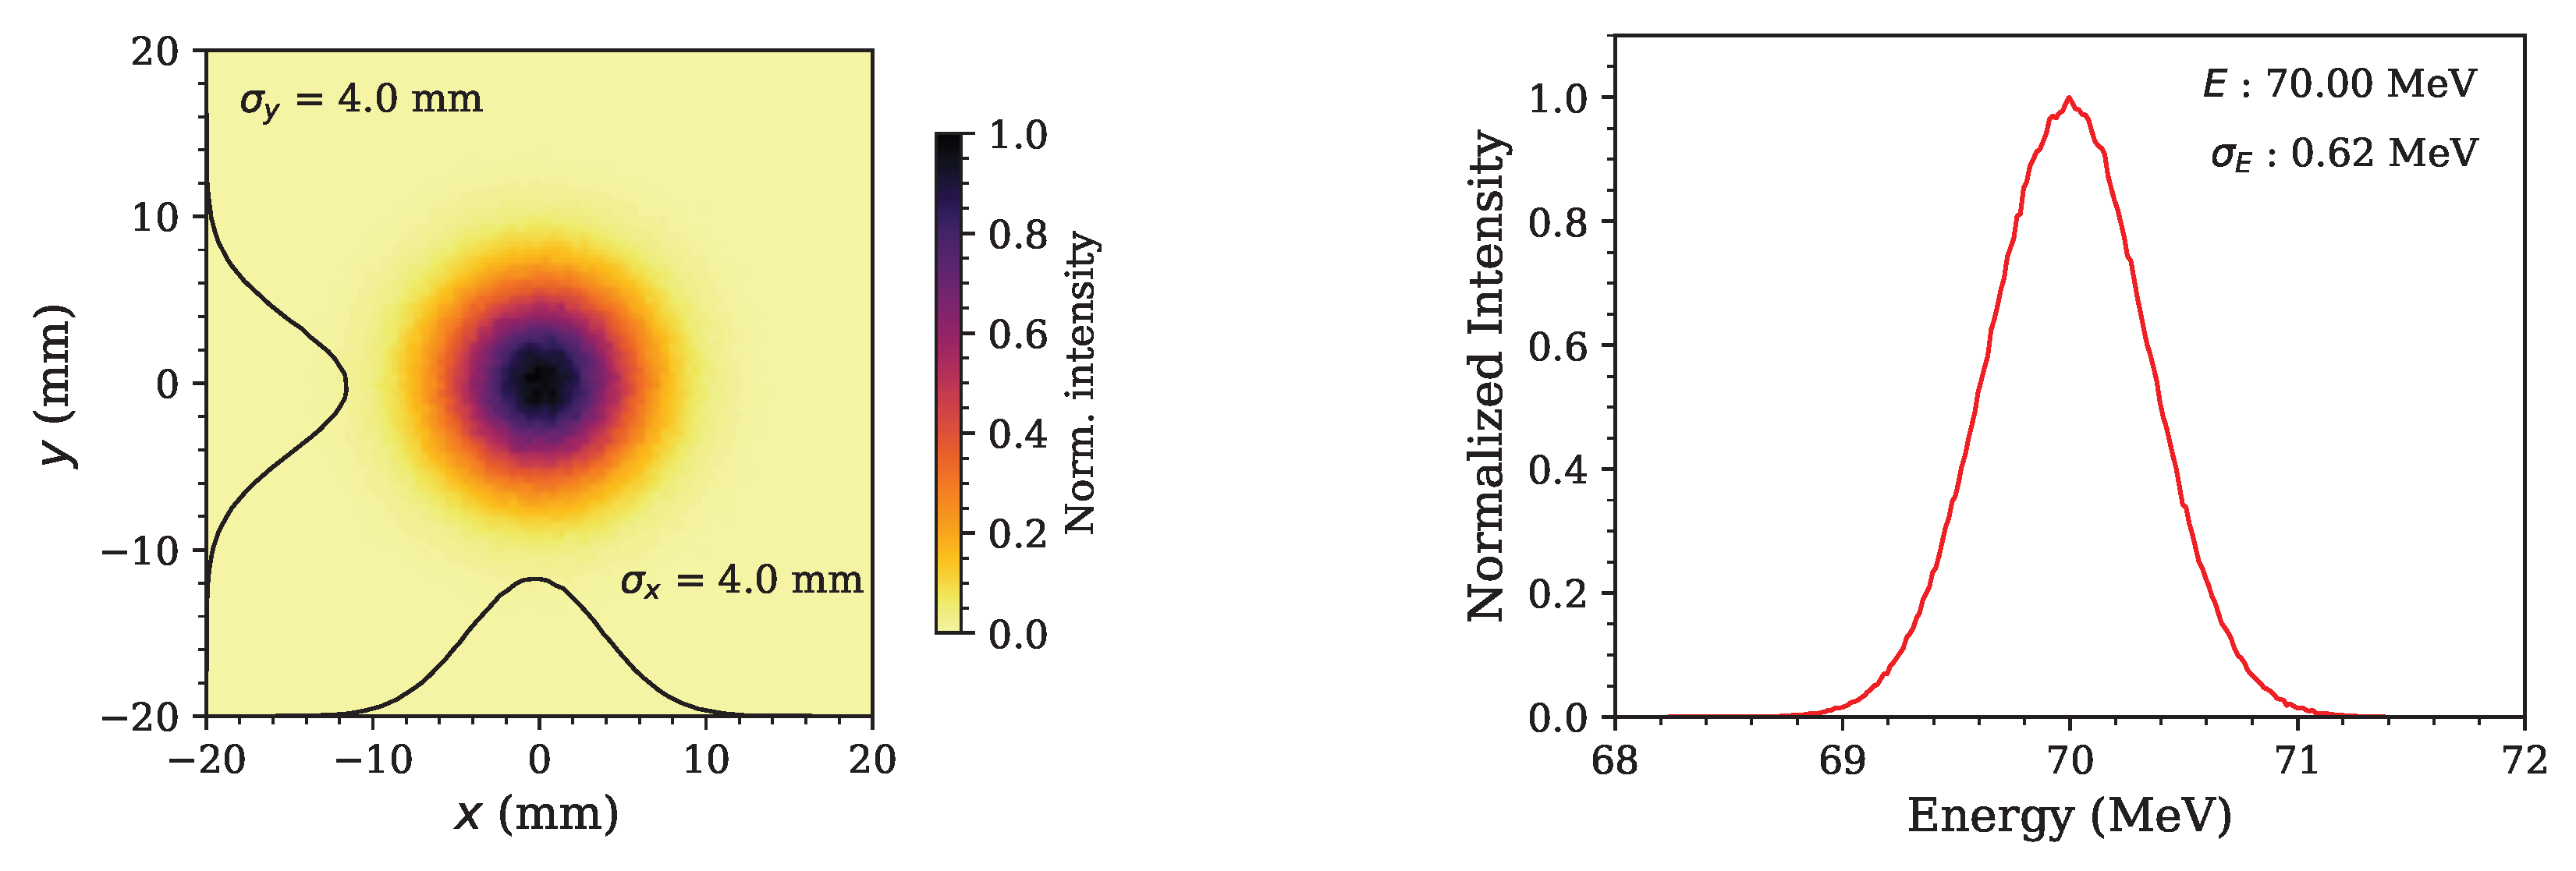
21]. This effect is characterized by a decrease in peak intensity and a shift in the Bragg peak position as the energy spread increases. To investigate these phenomena, we conducted an MC simulation. In this simulation, a round beam was initialized at the source position, with the transverse beam properties modeled as a Gaussian distribution, resulting in a beam size of 4 mm, as illustrated in
Figure 3. The initial beam parameters are summarized in
Table 1. Proton beam energies were varied from 70 MeV to 220 MeV, with an energy spread modeled as a Gaussian distribution with a standard deviation of up to 5%.
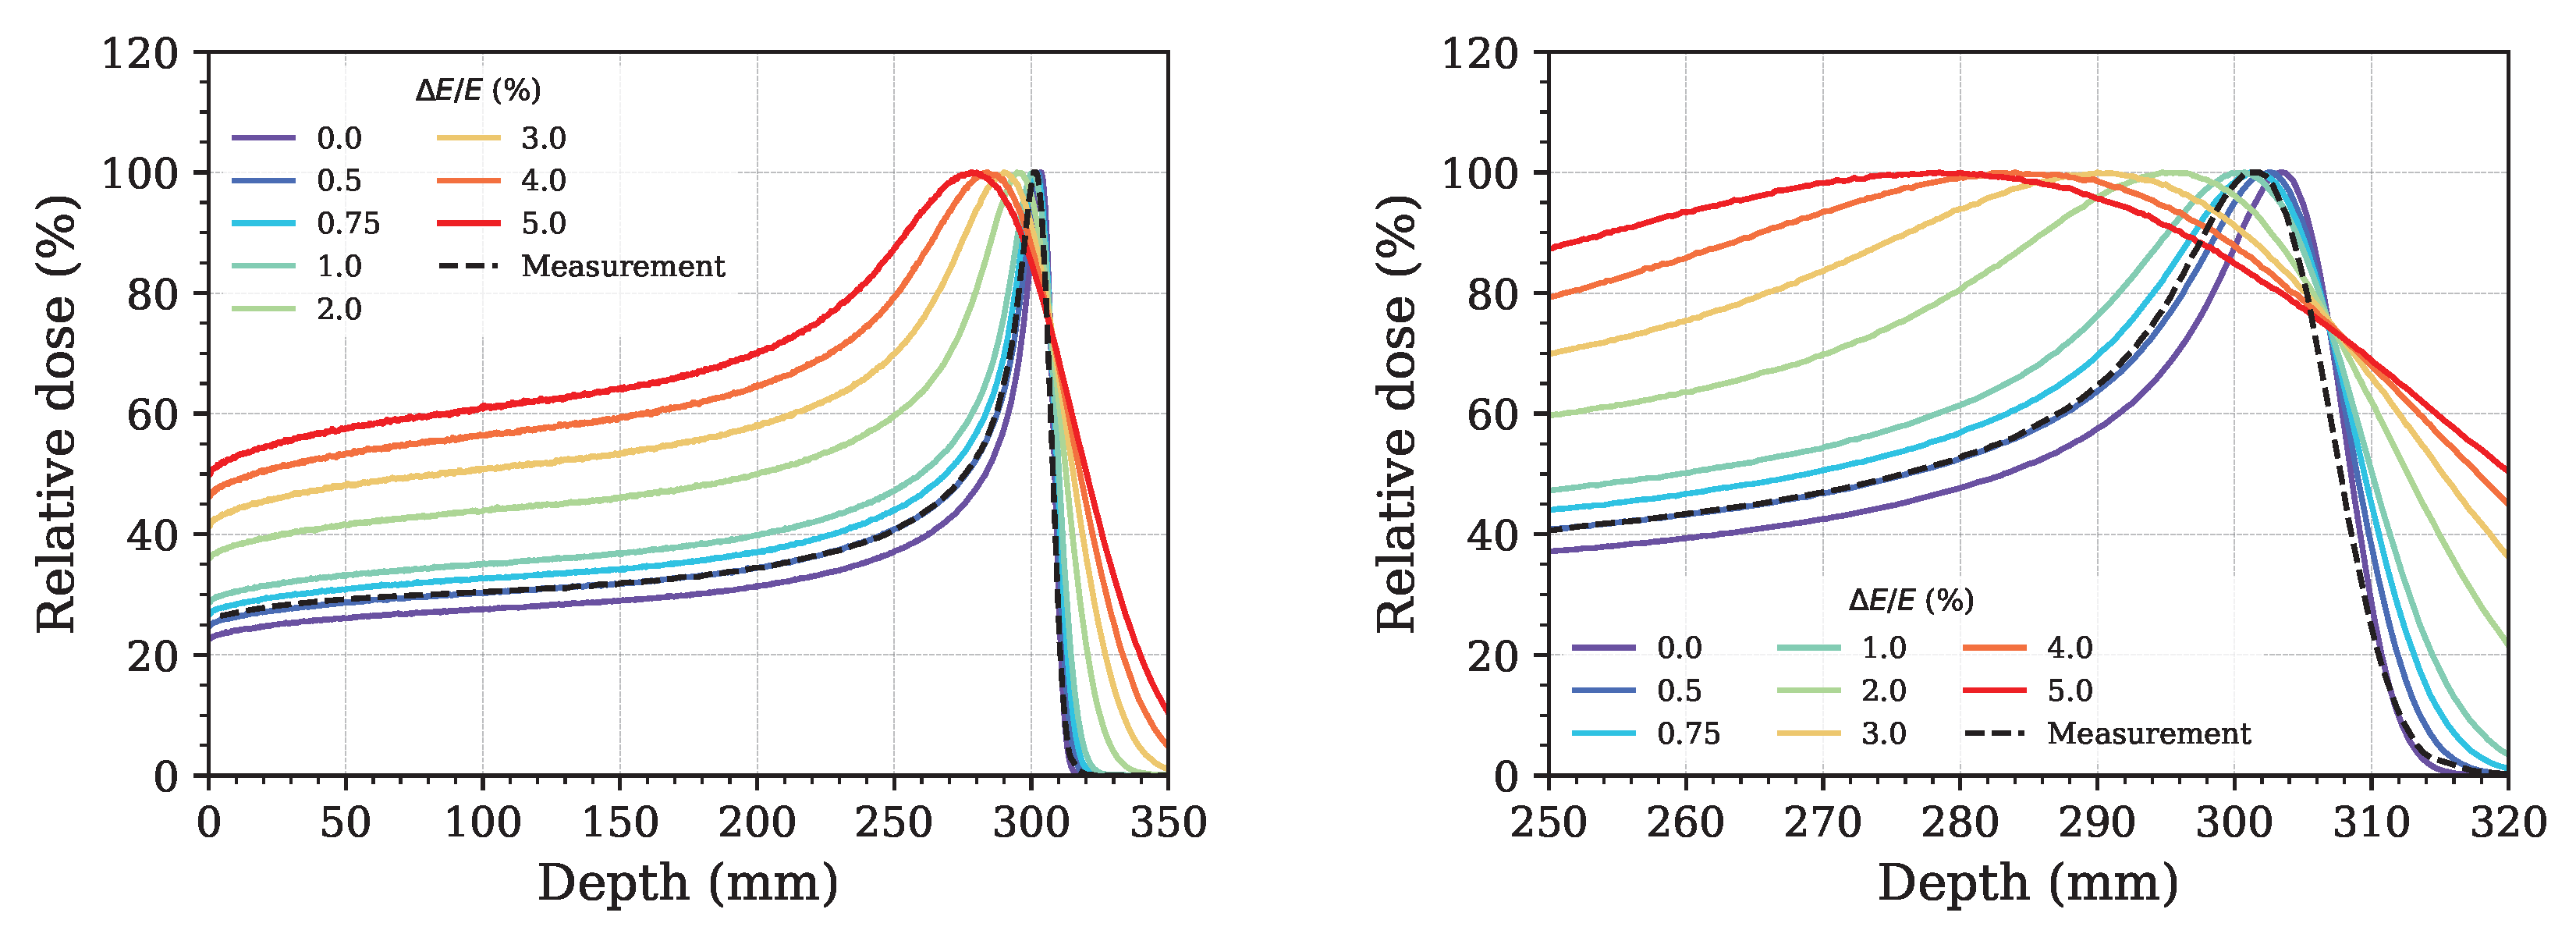
The simulated results of the energy spread investigation are shown in
Figure 4. The results are presented as the dose profile per proton particle as a function of depth position, with the left plot representing 220 MeV and the right plot displaying energies ranging from 70 MeV to 220 MeV. A shift in the Bragg peak position to lower depths occurs as the energy spread increases, accompanied by a decrease in peak intensity with increasing energy spread.
As listed in
Table 2, for the 220 MeV proton beam, the Bragg peak position shifts to a lower depth by approximately 23 mm when the energy spread increases to 5%. Simultaneously, the peak dose intensity decreases by 50%. The energy spread has less influence on the R
80 position, which more reliably represents the range position for each mean energy than the Bragg peak position.
Subsequently, the distal fall-off length increases linearly with increasing energy spread. These values, along with the distal fall-off length, will be used to match the depth-dose profile obtained from experiments conducted with a water phantom. This matching process provides the energy spread of the proton beam at the exit window for proton energies of 70 MeV, 100 MeV, 150 MeV, and 220 MeV.
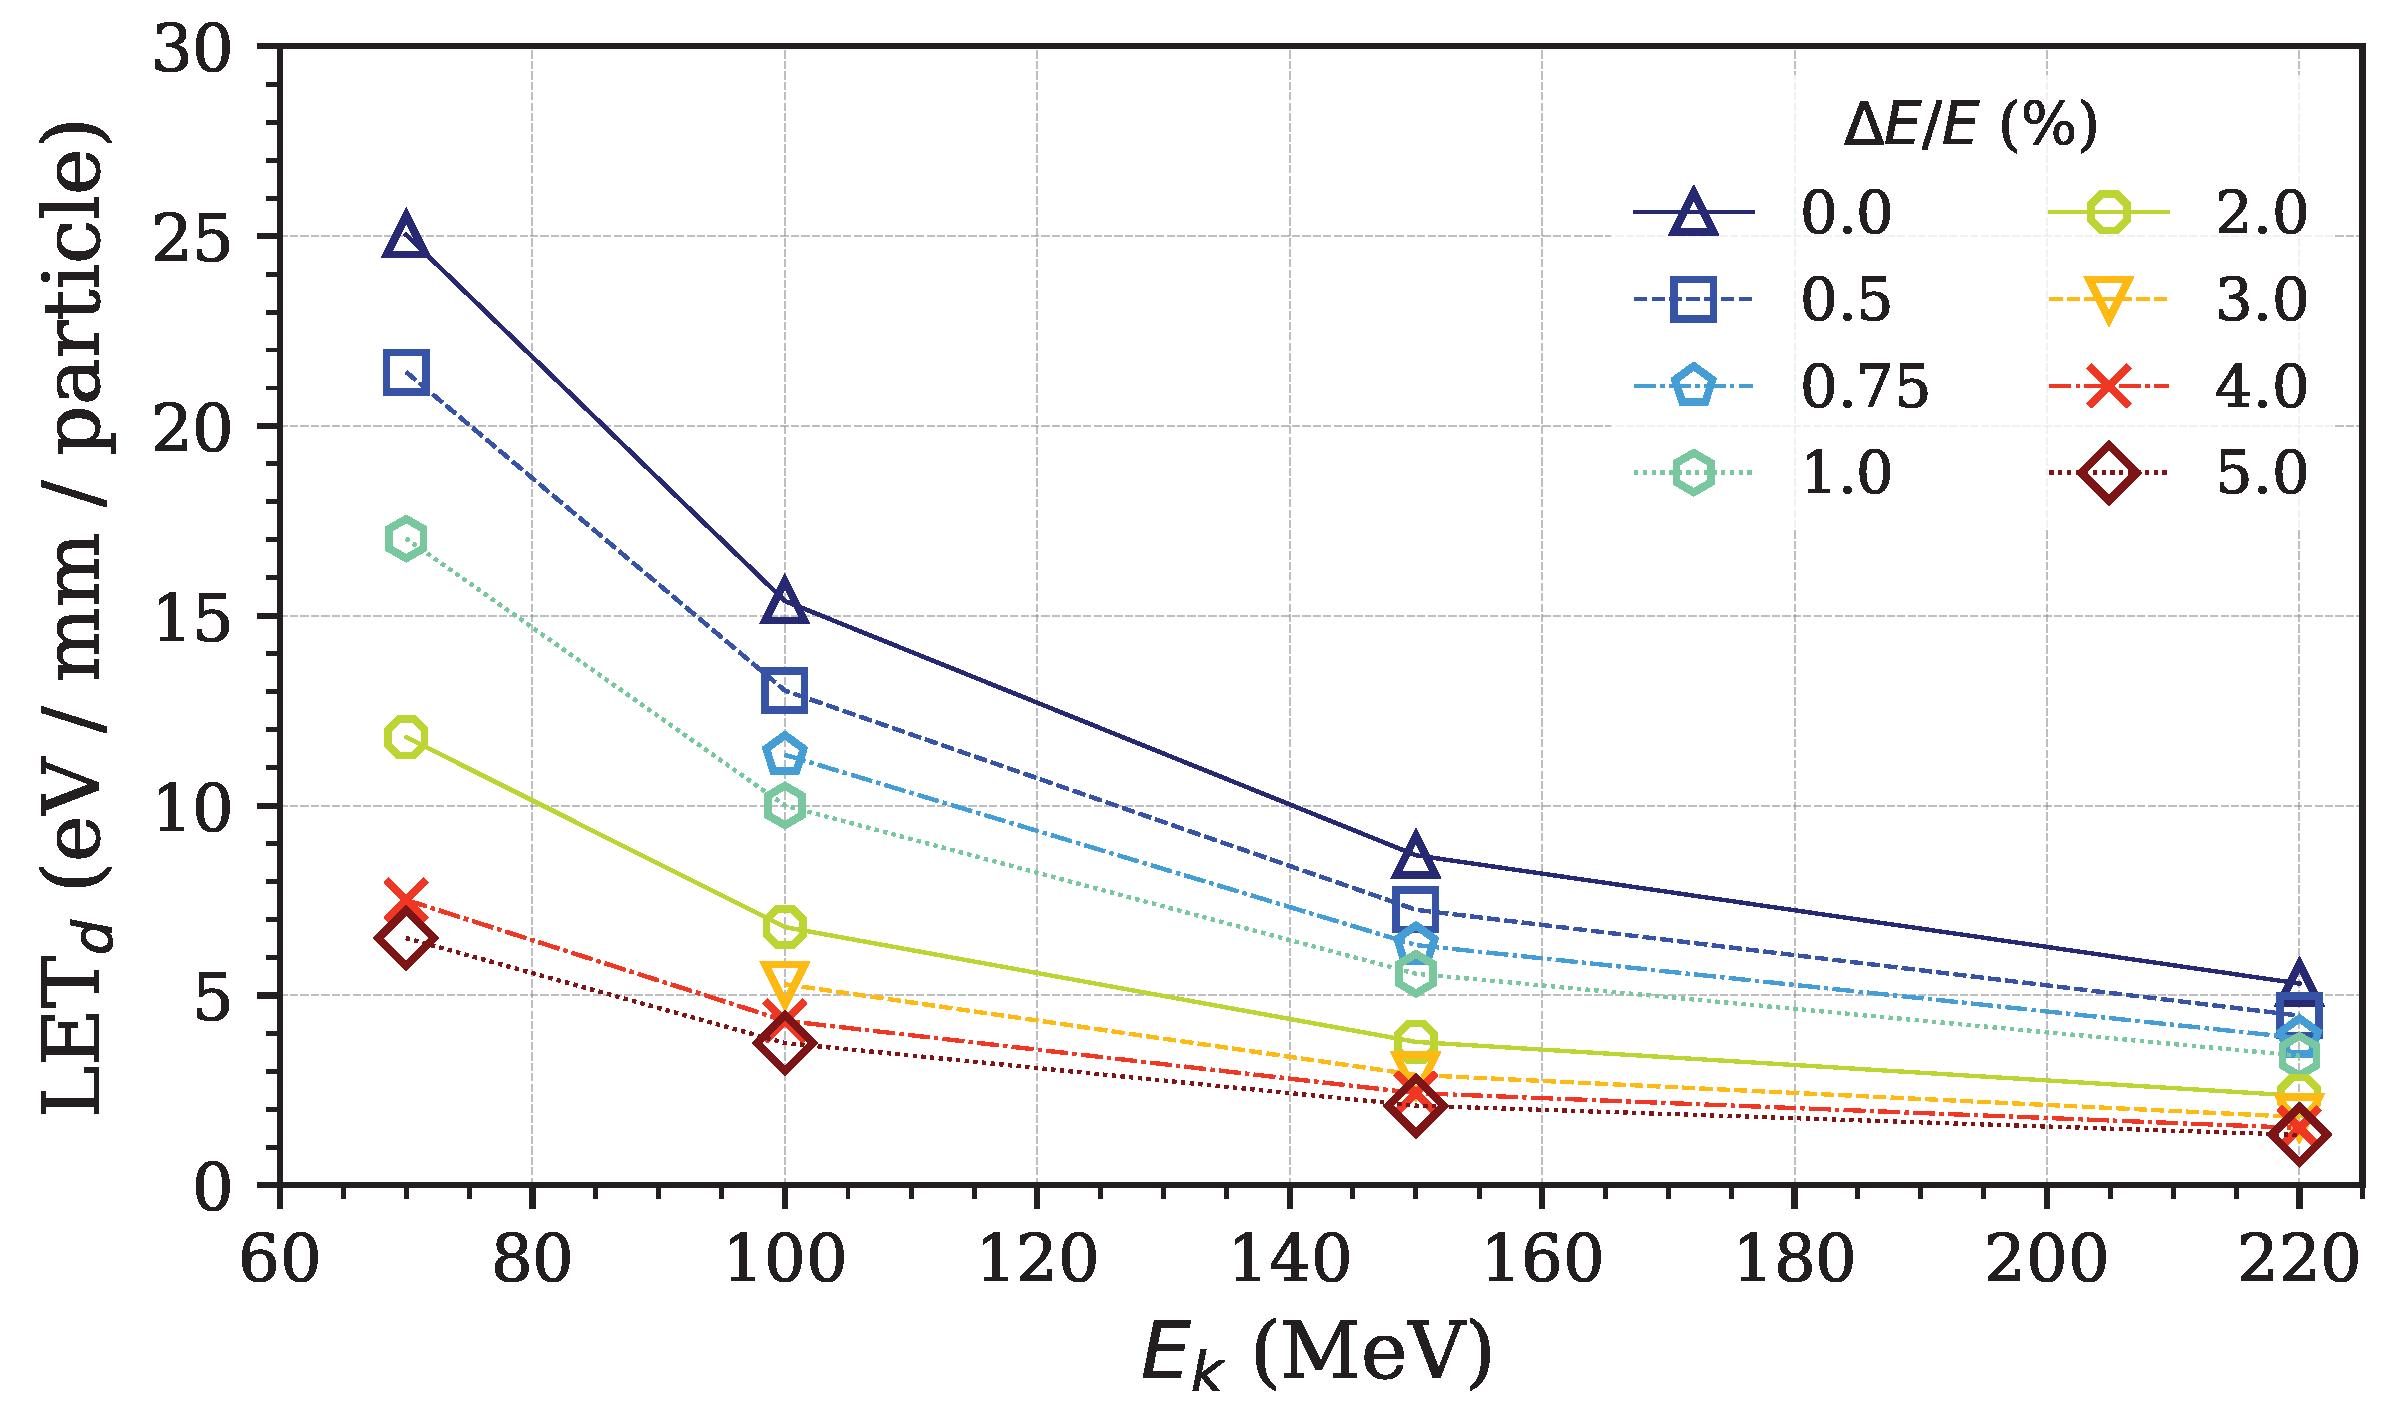
In addition to its impact on Bragg peak position, energy spread also significantly influences the linear energy transfer dose (LET
d), as illustrated in
Figure 5. The results demonstrate that LET
d decreases with increasing proton energy. Specifically, lower-energy protons (e.g., 70 MeV) exhibit higher LET
d values due to their shorter range and denser energy deposition, whereas higher-energy protons (e.g., 220 MeV) show lower LET
d values as they travel further with less energy deposited per unit length. This behavior aligns with the well-established physical characteristics of proton interactions in matter. Furthermore, an increase in energy spread results in a reduction in the peak LET
d, highlighting the importance of beam quality in treatment planning.
The measured integral depth doses correspond to beam energies of 70 MeV, 100 MeV, 150 MeV, and 220 MeV. Their normalized dose profiles are shown in
Figure 6. The Bragg peak positions, R
80, and distal fall-offs were analyzed and are listed in
Table 3. Due to the lesser influence of energy spread on R
80, the Bragg peak and distal fall-off are utilized to match the depth-dose distribution and determine the energy spread of the proton beam.
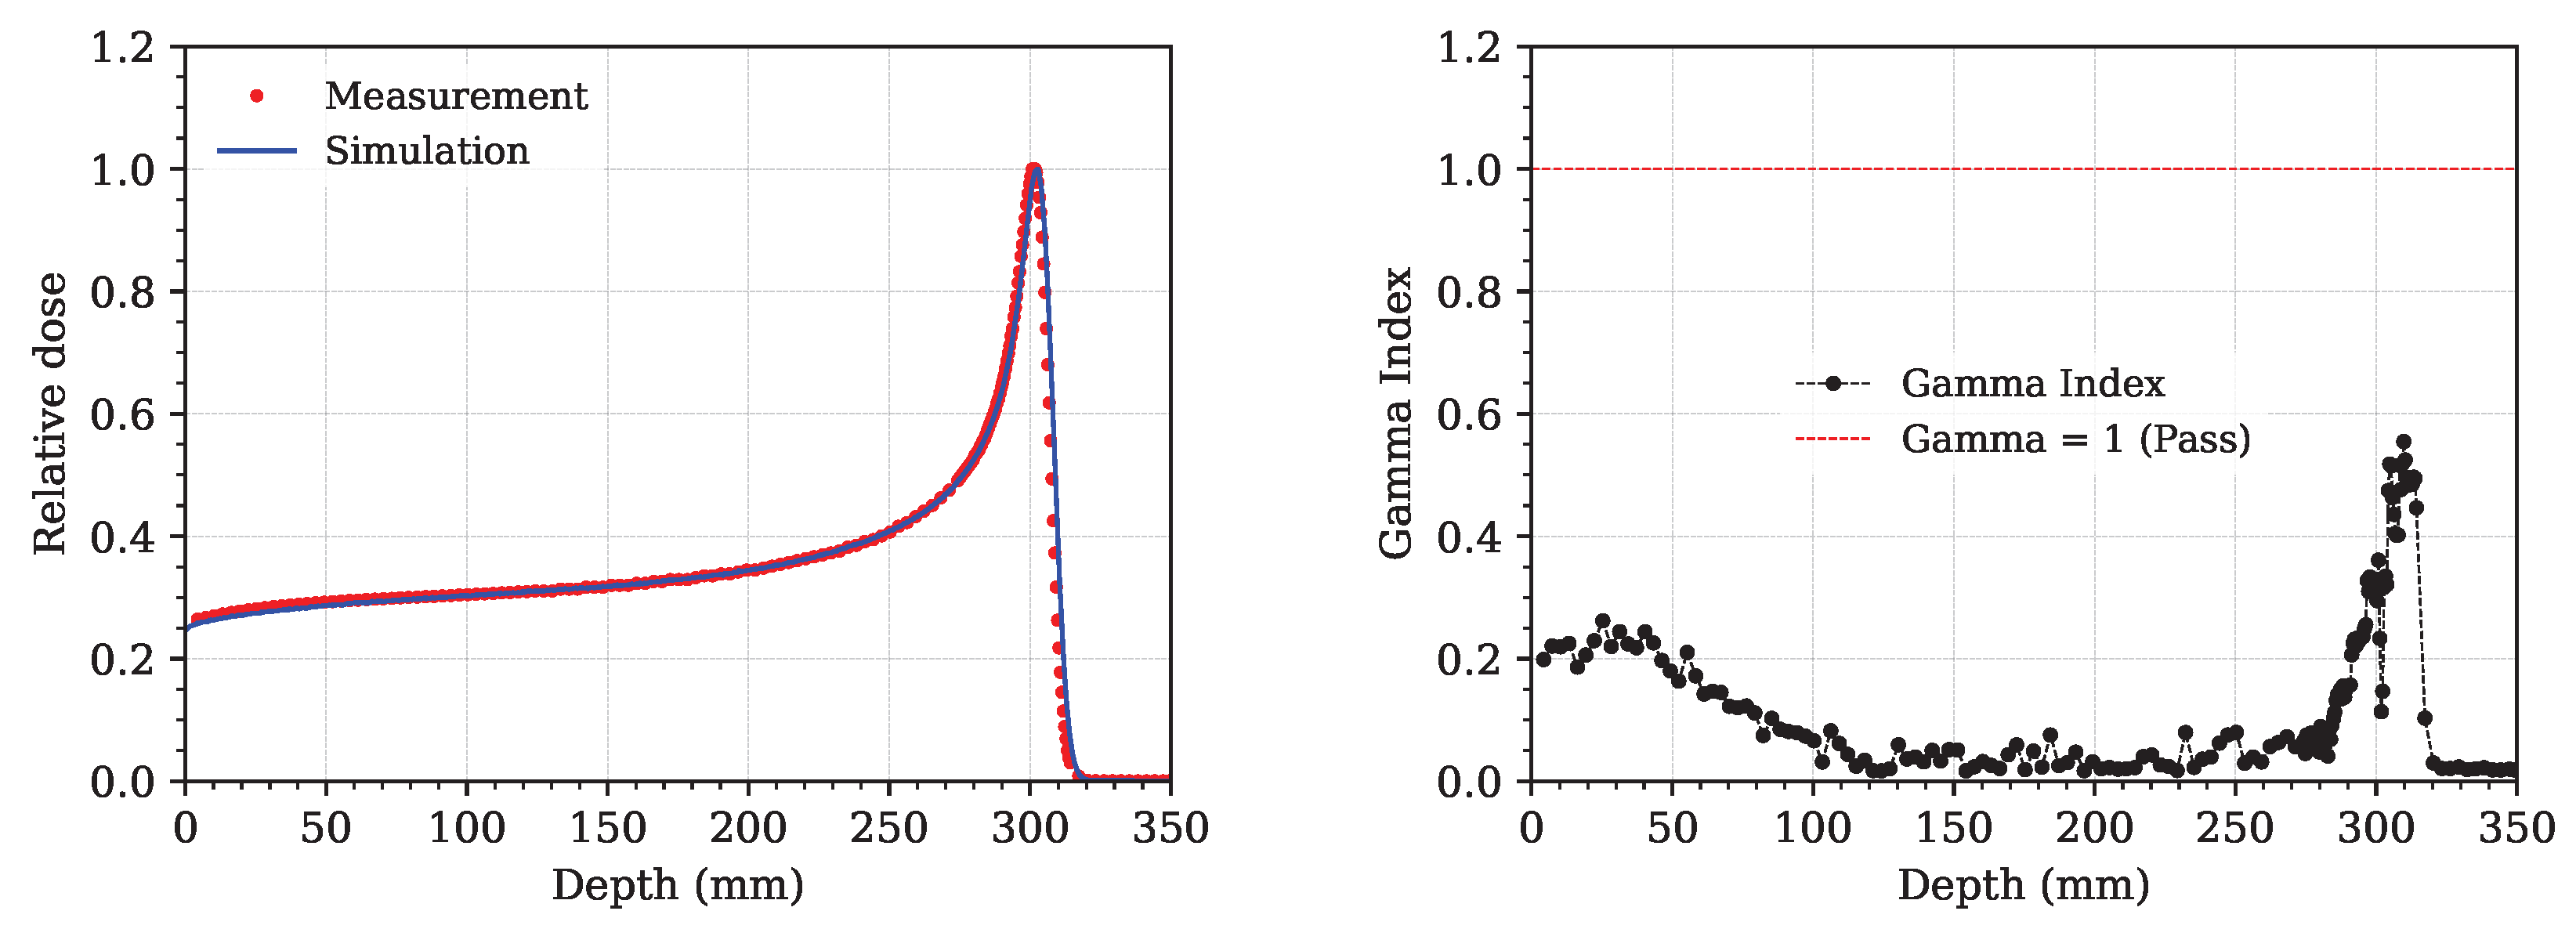
The simulated integral depth doses for each energy spread are normalized and plotted against the measured depth-dose profile for the proton energy of 220 MeV. The calculated distal fall-off for each energy was used to match the depth-dose distribution. For example, the measured depth dose of the 220 MeV proton beam closely matches the shape of the simulated energy spread of 0.5%, as indicated in
Figure 7.
The Gamma Index (
) is a widely used quantitative metric in radiotherapy for evaluating the agreement between a calculated dose distribution—typically generated by a treatment planning system (TPS)—and a measured or reference dose distribution [
22]. This metric simultaneously considers both the dose difference (
) and the spatial distance (
) between corresponding points in the two distributions, providing a comprehensive assessment of dosimetric accuracy. In this study, the reference distribution corresponds to the measured dose, while the evaluated distribution is derived from simulation results. The
-index is computed for each point in the reference distribution by identifying the minimum Euclidean distance in the evaluated distribution that satisfies both the dose and distance criteria. Mathematically, the
-index at a reference point is defined as
where
Here,
denotes the spatial location in the experimental (measured) dose distribution, while
represents the corresponding location in the simulated distribution. The term
is the spatial distance between the evaluated point
and the reference point
, and
is the dose difference between the experimental and simulated values at those points. A reference point is considered to pass the gamma test if
, indicating that at least one evaluated point lies within the acceptance ellipsoid defined by the criteria. The most commonly adopted acceptance criteria are a 3% dose difference and a 3 mm distance-to-agreement (3%/3 mm), as originally proposed by Low et al. [
23].
By applying the
-index analysis using Equations (
1) and (
2), with the standard criteria of
mm and
, the results—illustrated in the right plot of
Figure 8—demonstrate that the
-index remains below 1 for all comparison points. This confirms that the beam energy spread of 0.5% at 220 MeV satisfies the acceptance criteria, indicating a high level of agreement between the simulated and measured dose distributions. Furthermore, the optimal energy spreads determined for other investigated proton energies are 1.5%, 1.25%, and 1% for beams of 70 MeV, 100 MeV, and 150 MeV, respectively.
To investigate the depth-dose distribution, Bragg peak position, and peak LET
d position for each proton energy, the resulting energy spreads for the four energies were collected and used as the initial proton beam energy spreads for the MC simulation. The Bragg peak positions, R
80, peak LET
d positions, and distal fall-off were monitored and are summarized in
Table 4 and
Table 5. Typically, R
80 is considered and defined as the target position [
6,
19]. The variation in peak position and R
80 is less than 1% compared to the measured data for all the considered energies.
The peak position of the LET
d value shifts approximately 1 mm away from R
80, as illustrated in
Table 5. This information will be utilized as a guide for predicting the position of the desired peak LET
d for each proton beam energy, using the R
80 depth position, which is crucial for effectively killing cancer cells.
4. Conclusions
The proton beam characterization included energy spread, transverse beam size, and transverse beam emittance. This study initially focused on the energy spread, which directly influences the depth-dose distribution in terms of the intensity and depth position of RBP, R80, as well as the distal fall-off length. To investigate this effect, the energy spread of the proton beam was examined for proton energies of 70 MeV, 100 MeV, 150 MeV, and 220 MeV. The depth-dose distribution was simulated using GEANT4-based Monte Carlo simulations. The proton beam energy and energy spread were varied over the ranges of 70 MeV to 220 MeV and 0% to 5%, respectively.
Two key effects of the energy spread on the depth-dose distribution were observed. First, the dose intensity decreases as the energy spread increases. Second, the shape of the dose profile changes, with the Bragg peak shifting to a shallower depth as the energy spread increases. The RBP, R80, and distal fall-off were analyzed, revealing that the energy spread has a stronger influence on the Bragg peak position and distal fall-off than on R80. This confirms why R80 is widely used to define the depth position.
The distal fall-off length from the simulation was utilized to match the measured W80–20 length in order to determine the energy spread corresponding to each energy. Matching results indicated that the optimal energy spreads for 70 MeV, 100 MeV, 150 MeV, and 220 MeV are 1.5%, 1.25%, 1%, and 0.5%, respectively. These optimized energy spreads provide close agreement between the simulated and measured Bragg peak and R80 positions, with a relative error of less than 1%.


 ,
, 


