1. Introduction
Cardiovascular diseases remain one of the leading causes of mortality worldwide, highlighting the increasing importance of early detection and continuous monitoring technologies. Traditional methods for measuring heart rate and cardiovascular indicators typically rely on photoplethysmography (PPG) and electrocardiography (ECG), which, while accurate, often require dedicated biosignal sensors, specific sensor placements, and relatively expensive equipment [
1,
2].
With the advancement of wearable technologies, various smart devices now incorporate multiple embedded sensors, enabling biosignal acquisition through more cost-effective and non-invasive means. In particular, the Inertial Measurement Unit (IMU)—a standard component in most wearable devices—offers significant advantages due to its low power consumption and accessibility, eliminating the need for additional sensors [
3,
4].
An IMU typically consists of a three-axis accelerometer and a three-axis gyroscope, capable of detecting fine body movements and vibrations. These micro-movements, induced by cardiac activity, can be interpreted as ballistocardiography (BCG) signals. By analyzing these signals, it becomes possible to estimate various cardiovascular indicators such as heart rate (HR), pulse transit time (PTT), and heart rate variability (HRV) [
5,
6].
Recent studies have demonstrated the potential of extracting biosignals from IMU data using advanced signal processing and deep learning techniques. For example, transformer-based and Bi-LSTM-based models have been applied to detect heart rate from BCG signals with promising results [
7,
8]. However, this research area remains in its early stages, and further investigation is necessary to enhance signal quality and measurement accuracy. Compared to optical PPG-based methods, IMU-based approaches are often more robust to motion artifacts and impose less computational load, making them better suited for mobile and wearable environments.
This study proposes a novel heart rate estimation method based solely on IMU data from wearable devices, without relying on additional physiological sensors. The proposed technique utilizes three-axis accelerometer and gyroscope data collected from the user’s head or wrist to extract features of the BCG signal and continuously estimate heart rate using advanced signal processing techniques. The effectiveness of the proposed approach is validated through comparative experiments with commercially available PPG-based wearable devices.
The remainder of this paper is organized as follows.
Section 2 reviews prior studies on BCG and IMU-based biosignal monitoring.
Section 3 presents the proposed heart rate estimation methodology.
Section 4 details the experimental setup and performance evaluation. Finally,
Section 5 concludes the paper and discusses future research directions.
2. Related Work
In recent years, ballistocardiography (BCG) has gained considerable attention as a non-invasive technique for monitoring cardiovascular health. Various studies have explored various sensor types and signal processing methods to improve the accuracy and feasibility of BCG-based heart rate and blood pressure estimation.
Reyes-González et al. [
9] introduced a BCG measurement approach using Polymer Optical Fiber (POF) sensors and evaluated different signal extraction methods, including Hilbert Transform, Power Spectrum Density (PSD), and Savitzky–Golay filtering. Gjerde et al. [
10] developed a wearable full-body BCG sensor utilizing a soft bladder array connected to a barometric sensor, demonstrating its potential for continuous blood pressure monitoring via pulse transit time (PTT) estimation.
Other studies have adopted optical fiber-based solutions. Zhao et al. [
11] proposed an envelope extraction-based method using an optical fiber sensor for estimating heart rate variability (HRV) and PTT, while Zhang et al. [
12] leveraged a back-mounted optical fiber sensor to detect early diastolic ventricular vibrations, enabling the estimation of left atrial pressure in patients with heart failure.
Contact-based pressure sensors have also been explored. Watanabe [
6] investigated how BCG signal quality is affected by the position of a pressure sensor tube under various cushion conditions, finding that placement beneath the neck yielded the most effective measurements. Hytonen et al. [
13] extracted BCG signals using a digital accelerometer and demonstrated its feasibility as an alternative to electrocardiography (ECG).
Non-contact methods were explored by Yoshioka et al. [
14], who used video photoplethysmography (PPG) and microwave sensors to estimate blood pressure by analyzing BCG-derived PTT, achieving a moderate correlation with systolic pressure (r = −0.64).
Machine learning and deep learning techniques have recently been integrated into BCG signal processing. For instance, Kim et al. [
15] used a Transformer-based network to estimate heart rate from BCG signals, while Lee et al. [
16] adopted a Bi-directional Long Short-Term Memory (Bi-LSTM) network for real-time regression-based heart rate estimation.
In parallel, increasing attention has been given to the use of inertial measurement unit (IMU) sensors for heart rate monitoring. Some studies focus on sensor fusion techniques. Zhang et al. [
17] and Temko [
18] combined PPG with IMU data to eliminate motion artifacts and enhance real-time heart rate estimation. Conversely, Jeong et al. [
19] demonstrated that BCG signals can be effectively derived using a single accelerometer, enabling accurate heart rate monitoring without ECG. Hernandez et al. [
20] proposed a low-power IMU-based regression model suited for wearable use cases.
More recent efforts by Zhou [
21] and Biswas [
22] showed that IMU-only systems, empowered by deep learning models such as convolutional neural networks (CNNs) and LSTMs, can achieve reliable heart rate estimation without the need for optical sensors. However, these approaches depend heavily on high-quality training data and often require model retraining to generalize across diverse user conditions.
In summary, while sensor fusion approaches involving PPG and IMU provide high accuracy, they entail increased system complexity and power consumption. In contrast, IMU-only methods offer advantages in terms of hardware simplicity and lower cost, albeit with trade-offs in accuracy and robustness. Against this background, our study proposes a heart rate estimation technique that exclusively utilizes IMU sensors commonly embedded in wearable headsets. This method aims to balance signal fidelity and system simplicity, potentially paving the way for lightweight and scalable BCG-based cardiovascular monitoring in wearable devices.
3. Verification Method
In this study, we propose a heart rate estimation method based on the principle of ballistocardiography (BCG) using a sensor that combines a three-axis accelerometer and a three-axis gyroscope, referred to as a six-axis Heart Rate Sensing Device. This method estimates heart rate by detecting body movements or vibrations associated with heartbeats.
This falls within the typical error range of 3–8 bpm observed in commercial wearable devices.
Table 1 presents the heart rate measurement accuracy of several representative wearable devices.
An error level of 4–5 bpm is generally considered acceptable in consumer-grade wearable devices. At this level of accuracy, the method can be applied to a range of practical applications, such as heart rate tracking during exercise, stress or sleep estimation, daily health reporting, and exercise intensity control based on heart rate zones. Although it does not meet clinical-grade standards, it offers sufficiently competitive accuracy for non-medical purposes. Accordingly, our goal is to achieve this level of bpm accuracy using only a six-axis sensor.
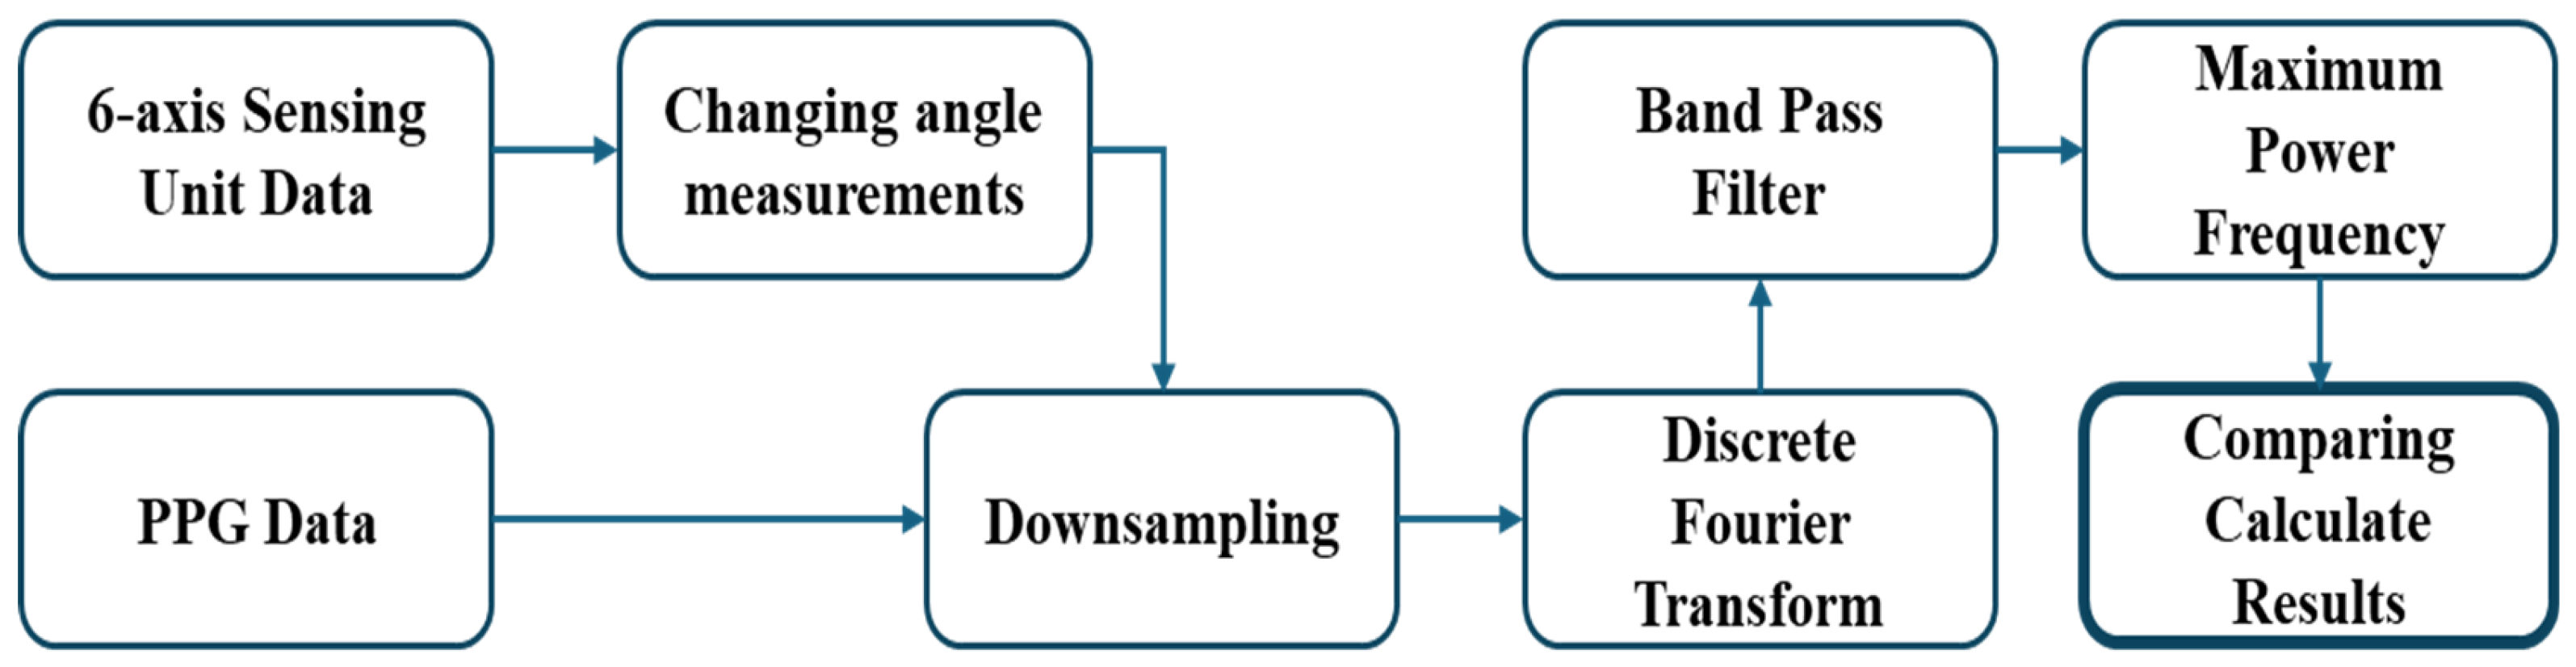
To validate the heart rate estimated using the proposed approach, we performed a comparative analysis by converting the data obtained from the six-axis Heart Rate Sensing Device and collecting reference data from a photoplethysmography (PPG) sensor. The procedure for receiving and comparing data from both devices is illustrated in
Figure 1. For the six-axis Heart Rate Sensing Device, an additional step—‘Changing angle measurements’—is required, while the remaining processing steps are applied identically to both the six-axis device and the PPG sensor.
3.1. Six-Axis Heart Rate Sensing Device
The three-axis accelerometer in the six-axis Heart Rate Sensing Device (six-axis HRSD) is a sensor that measures linear acceleration along three orthogonal axes: X, Y, and Z. Based on Micro-Electro-Mechanical System (MEMS) technology, it operates using a mass-spring system structure. When the accelerometer moves or tilts, the internal mass is displaced, causing a change in capacitance or resistance. This change is then converted into an electrical signal proportional to the acceleration. The sensor’s output is calibrated relative to the gravitational acceleration (g ≈ 9.8 m/s2), enabling the measurement of tilt and movement direction relative to the Earth’s surface.
The three-axis gyroscope in the six-axis HRSD measures angular velocity around the X, Y, and Z axes by utilizing the Coriolis effect. When the gyroscope rotates along a specific axis, the vibration direction of the internal micromechanical vibrating mass is displaced. This displacement is detected by the sensor and converted into an electrical signal proportional to the angular velocity. In other words, the gyroscope quantifies rotational motion, and its output is typically expressed in radians per second (rad/s) or degrees per second (°/s).
3.2. Sensor Fusion
In the fields of wearable technology and motion tracking systems, the integration of accelerometers and gyroscopes plays a critical role in enhancing the accuracy and reliability of data collection [
17]. While each sensor independently measures linear acceleration and angular velocity, they both have inherent limitations such as noise and drift errors, which can reduce accuracy when used alone. To mitigate these constraints, it is necessary to monitor the same physical phenomena simultaneously with both sensors and integrate their data. By fusing data from two or more sensors, the limitations of each individual sensor can be compensated for, resulting in more precise measurements.
Sensor fusion technology is used to combine data collected from different sources to overcome the limitations of individual sensors and provide more reliable information. Specifically, the fusion of accelerometers and gyroscopes plays a key role in compensating for the intrinsic error characteristics of each sensor, enabling a more accurate analysis of motion dynamics. Such fusion is typically implemented using advanced filtering techniques, such as Kalman filters or complementary filters [
18,
19].
For instance, in pedestrian dead reckoning (PDR) technology, which utilizes smartphones equipped with both accelerometers and gyroscopes, various filtering techniques including the Kalman filter can be applied to improve location tracking accuracy in indoor environments. In particular, the Kalman filter excels at handling time-varying data and allows for the fusion of multiple sensor inputs in dynamic environments with high uncertainty, thereby reducing measurement errors and enabling more reliable state estimation [
18].
For practical implementation, integrating a three-axis accelerometer and a three-axis gyroscope within a single device is the most effective approach. In this study, we utilized the LSM6DSOTR module from STMicroelectronics, which includes both a three-axis accelerometer and a three-axis gyroscope. This sensor configuration offers rapid responsiveness to external perturbations, allowing gyroscope data to be prioritized initially to ensure high initial accuracy.
However, since the drift error of the gyroscope can accumulate during long-term tracking, we use accelerometer data, which is less sensitive to accumulated error, as a reference signal for drift error correction to maintain accuracy over time. This systematic sensor fusion approach ensures continuous and reliable motion tracking, serving as a key component in motion analysis applications that require high reliability.
3.3. Data Acquisition and Transformation Methodology
In this study, instead of relying solely on the magnitude of the acceleration vector during the preprocessing stage, we employed a method that calculates the tilt angles of each axis relative to gravitational acceleration, enabling a more precise analysis of the sensor data. This approach involves computing the resultant vector of acceleration along the X, Y, and Z axes based on gravitational acceleration (R), as defined by the mechanical principle in Equation (1).
Such an analytical strategy enhances the tracking performance of angular velocity, allowing for a more refined understanding of the device’s orientation in three-dimensional space. Furthermore, to maximize the utility of the data, we integrated trigonometric functions into the analysis to convert the measured acceleration data into angular displacement. By applying this method, the device’s motion can be measured more reliably in reference to gravity, enabling the quantification of displacement while minimizing the influence of external forces.
This technique serves as a critical component in applications requiring high-precision orientation and motion tracking, such as navigation assistance systems and human motion analysis.
In this analysis, the direction of the gravitational acceleration vector is defined as angles
,
, and
, with respect to each axis. These directional components are visually illustrated in
Figure 2. To quantify rotational motion, accelerometer data was transformed using trigonometric functions to calculate angular velocity, as described in Equation (2).
Furthermore, as shown in Equation (3), a complementary filter approach was used to estimate tilt angles: the angle estimated from the gyroscope was processed with a High Pass Filter to eliminate low-frequency noise, while the angle estimated from the accelerometer was processed with a Low Pass Filter to reduce high-frequency noise. The two filtered outputs were then combined to estimate the final tilt angle.
In this study, data was collected using a six-axis sensor at a high-resolution sampling rate of 255 Hz. This enabled the precise detection of subtle vibrational movements induced by heartbeats within the cardiovascular system. In the proposed method, as shown in Equation (4), the Root Mean Square (RMS) differences in the continuously measured data along the X, Y, and Z axes were calculated to quantitatively assess these fine movements.
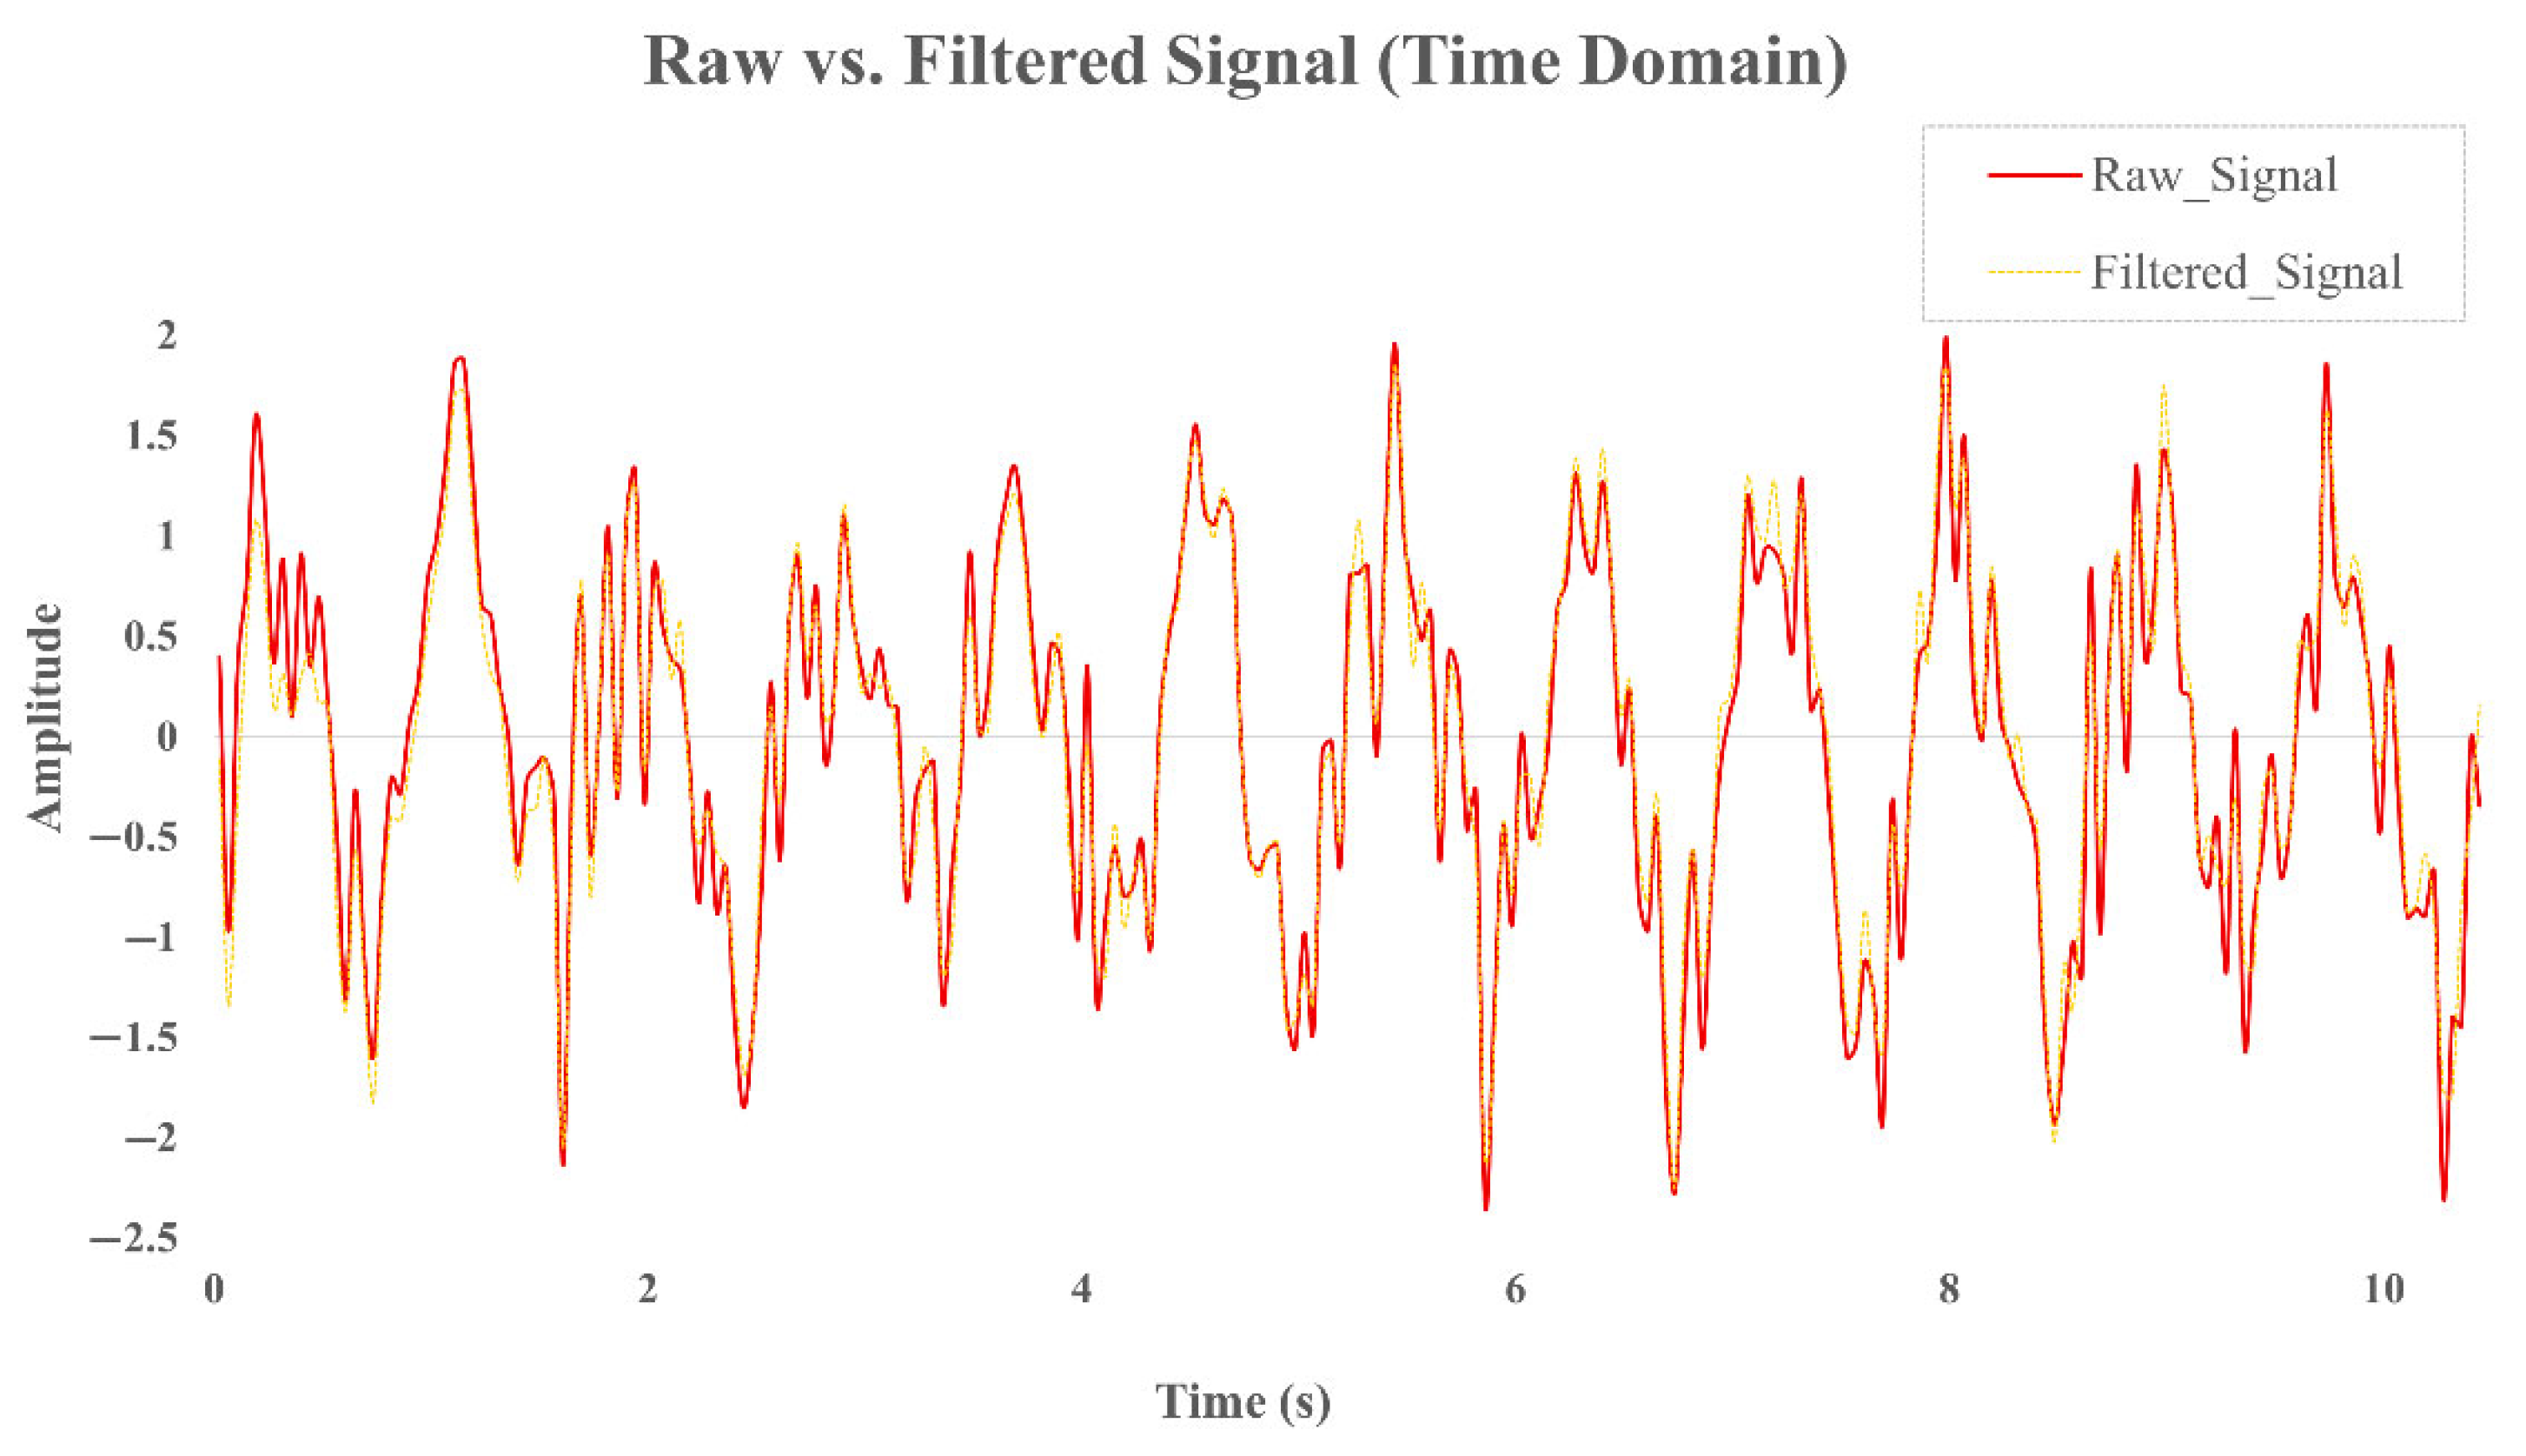
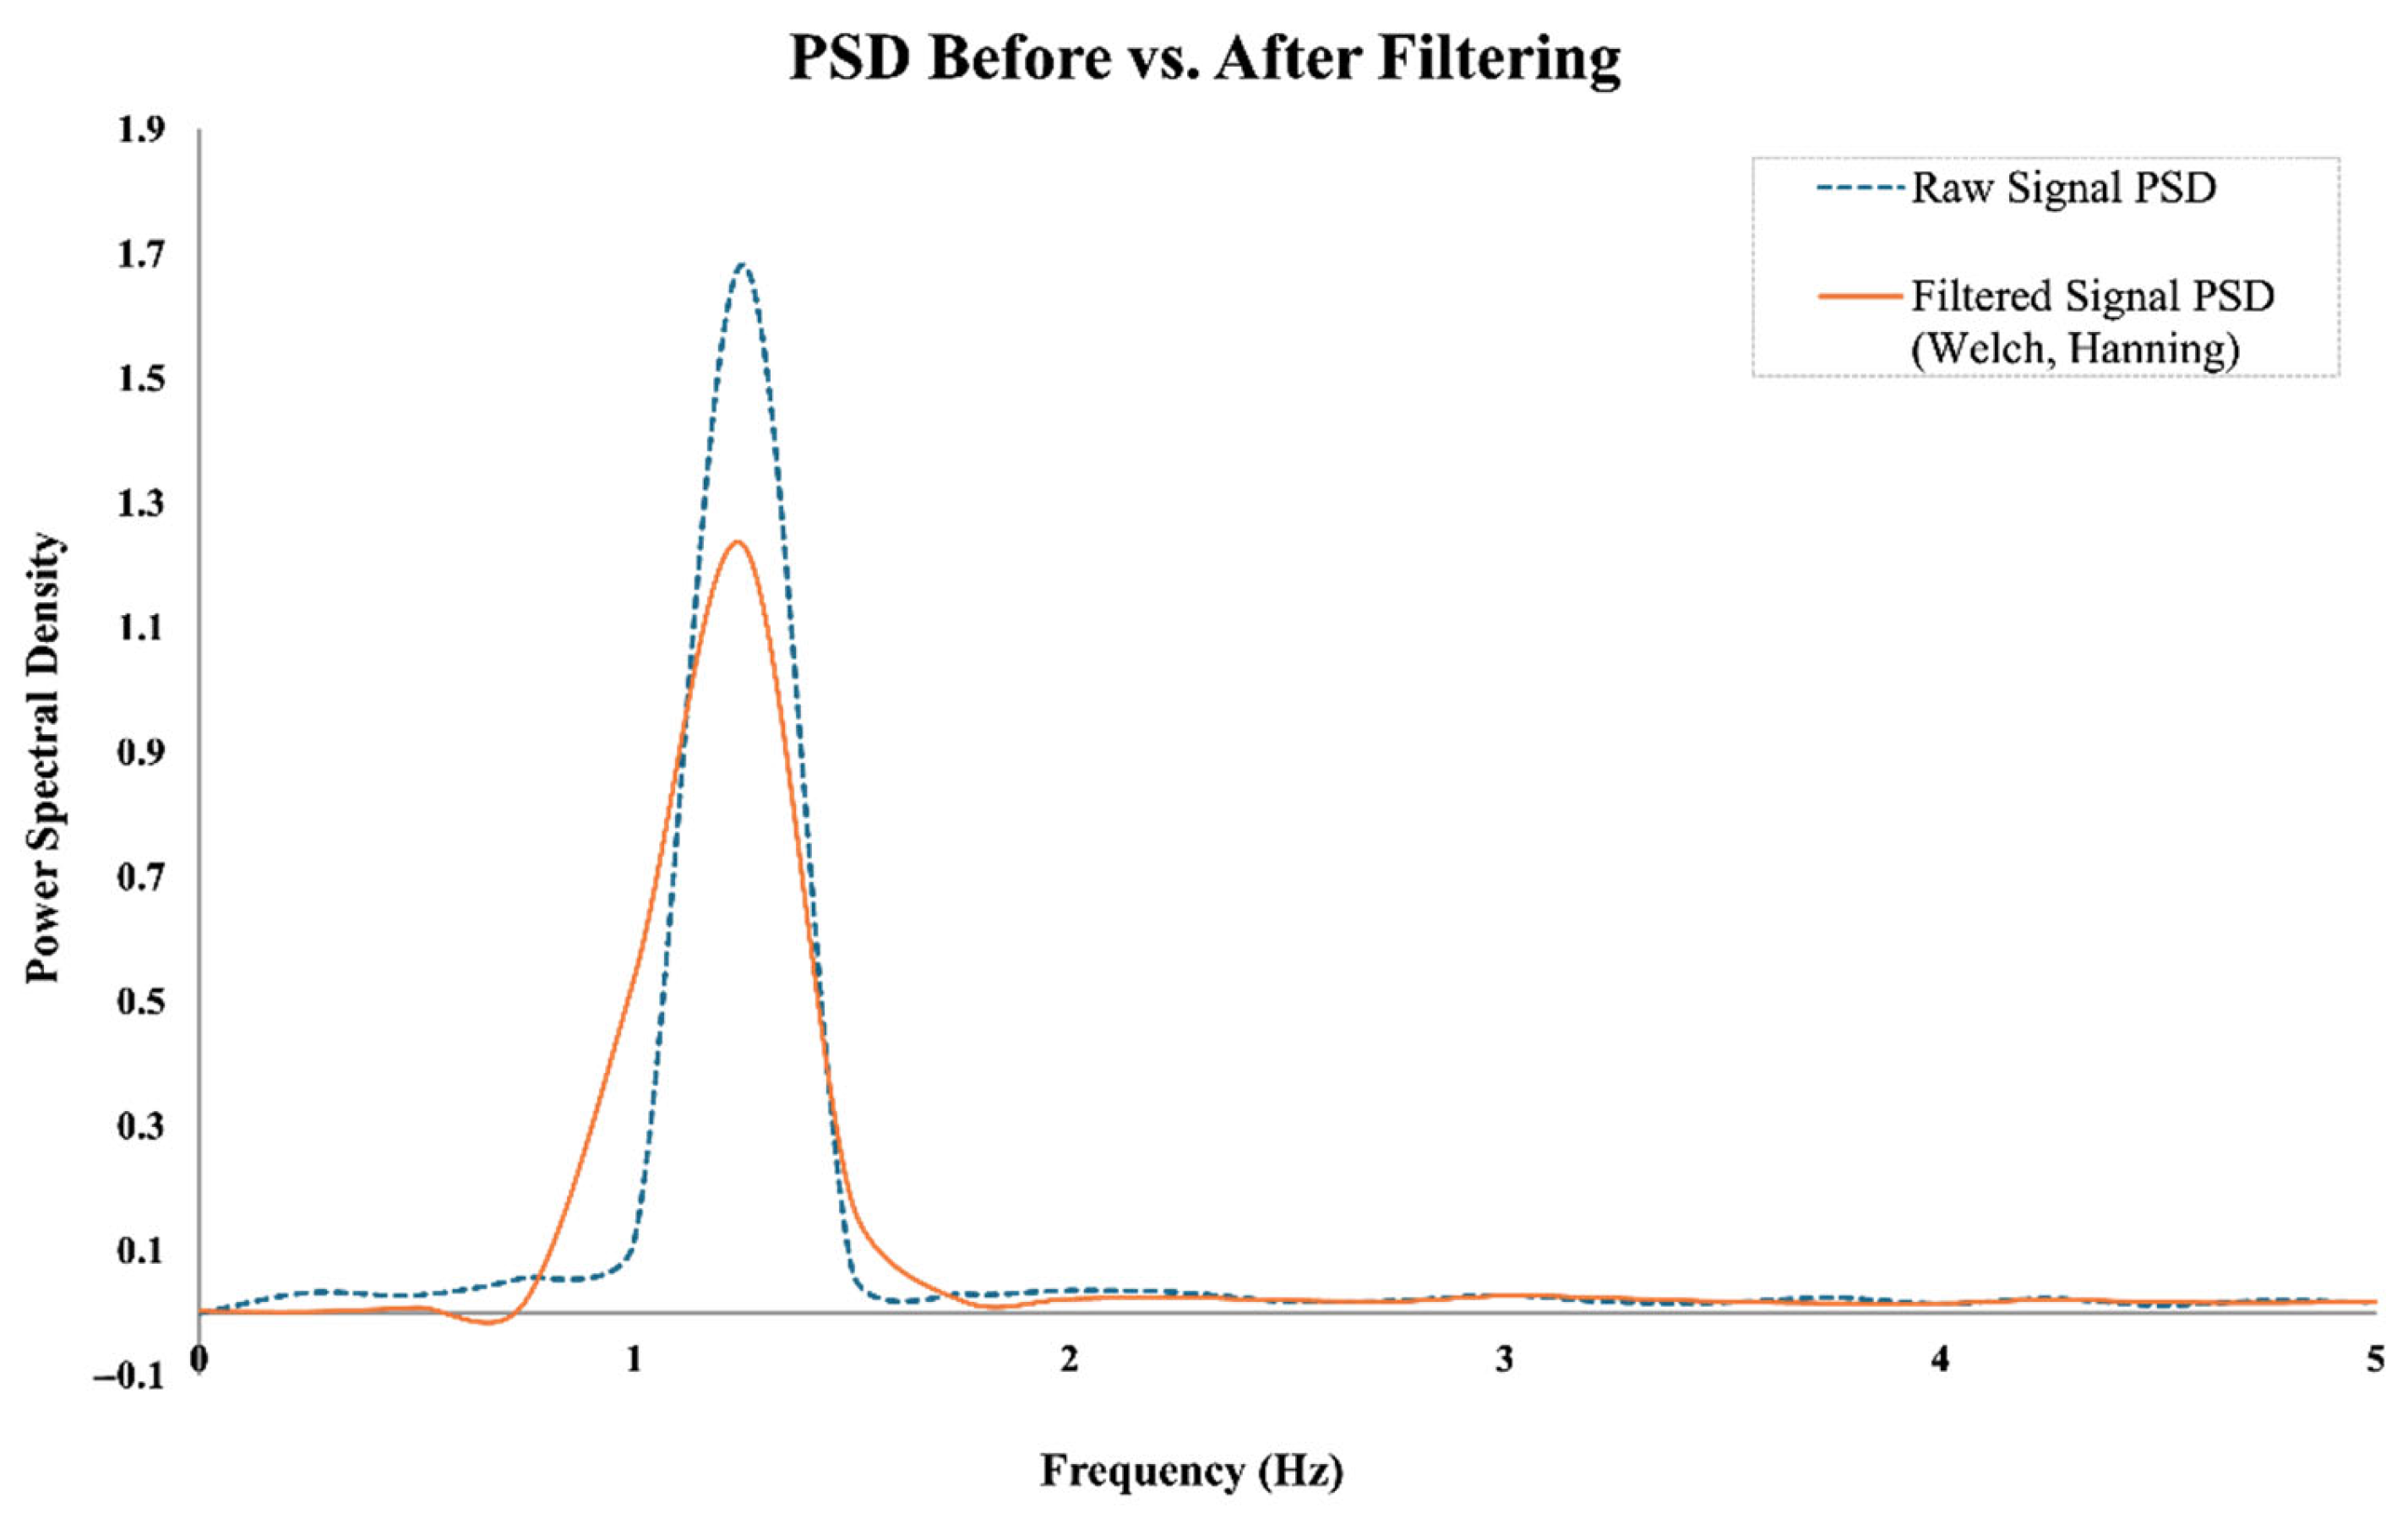
To suppress low-frequency drift and enhance the visibility of periodic cardiac components, a high-pass filter with a cutoff frequency of 0.5 Hz was applied. This drift correction step effectively preserves essential heart rate signals without introducing distortion in the target frequency band (0.8–2.0 Hz). To illustrate the effects of the preprocessing steps,
Figure 3 presents the time-domain signals before and after filtering, while
Figure 4 shows the corresponding power spectral densities (PSDs). As shown, the band-pass filter effectively removes baseline drift and high-frequency noise, while the Welch-based PSD analysis improves spectral stability and enhances the visibility of the dominant frequency component within the expected heart rate range.
This method also attenuates spectral leakage and suppresses side lobes in the frequency domain, thereby enhancing the clarity of dominant spectral components such as those induced by cardiac rhythms.
The preprocessed data was then downsampled from 255 Hz to 25 Hz following a low-pass FIR filter (cutoff: 10 Hz) to prevent aliasing. Downsampling to 25 Hz was selected to retain sufficient resolution for HR detection while reducing computational load and noise.
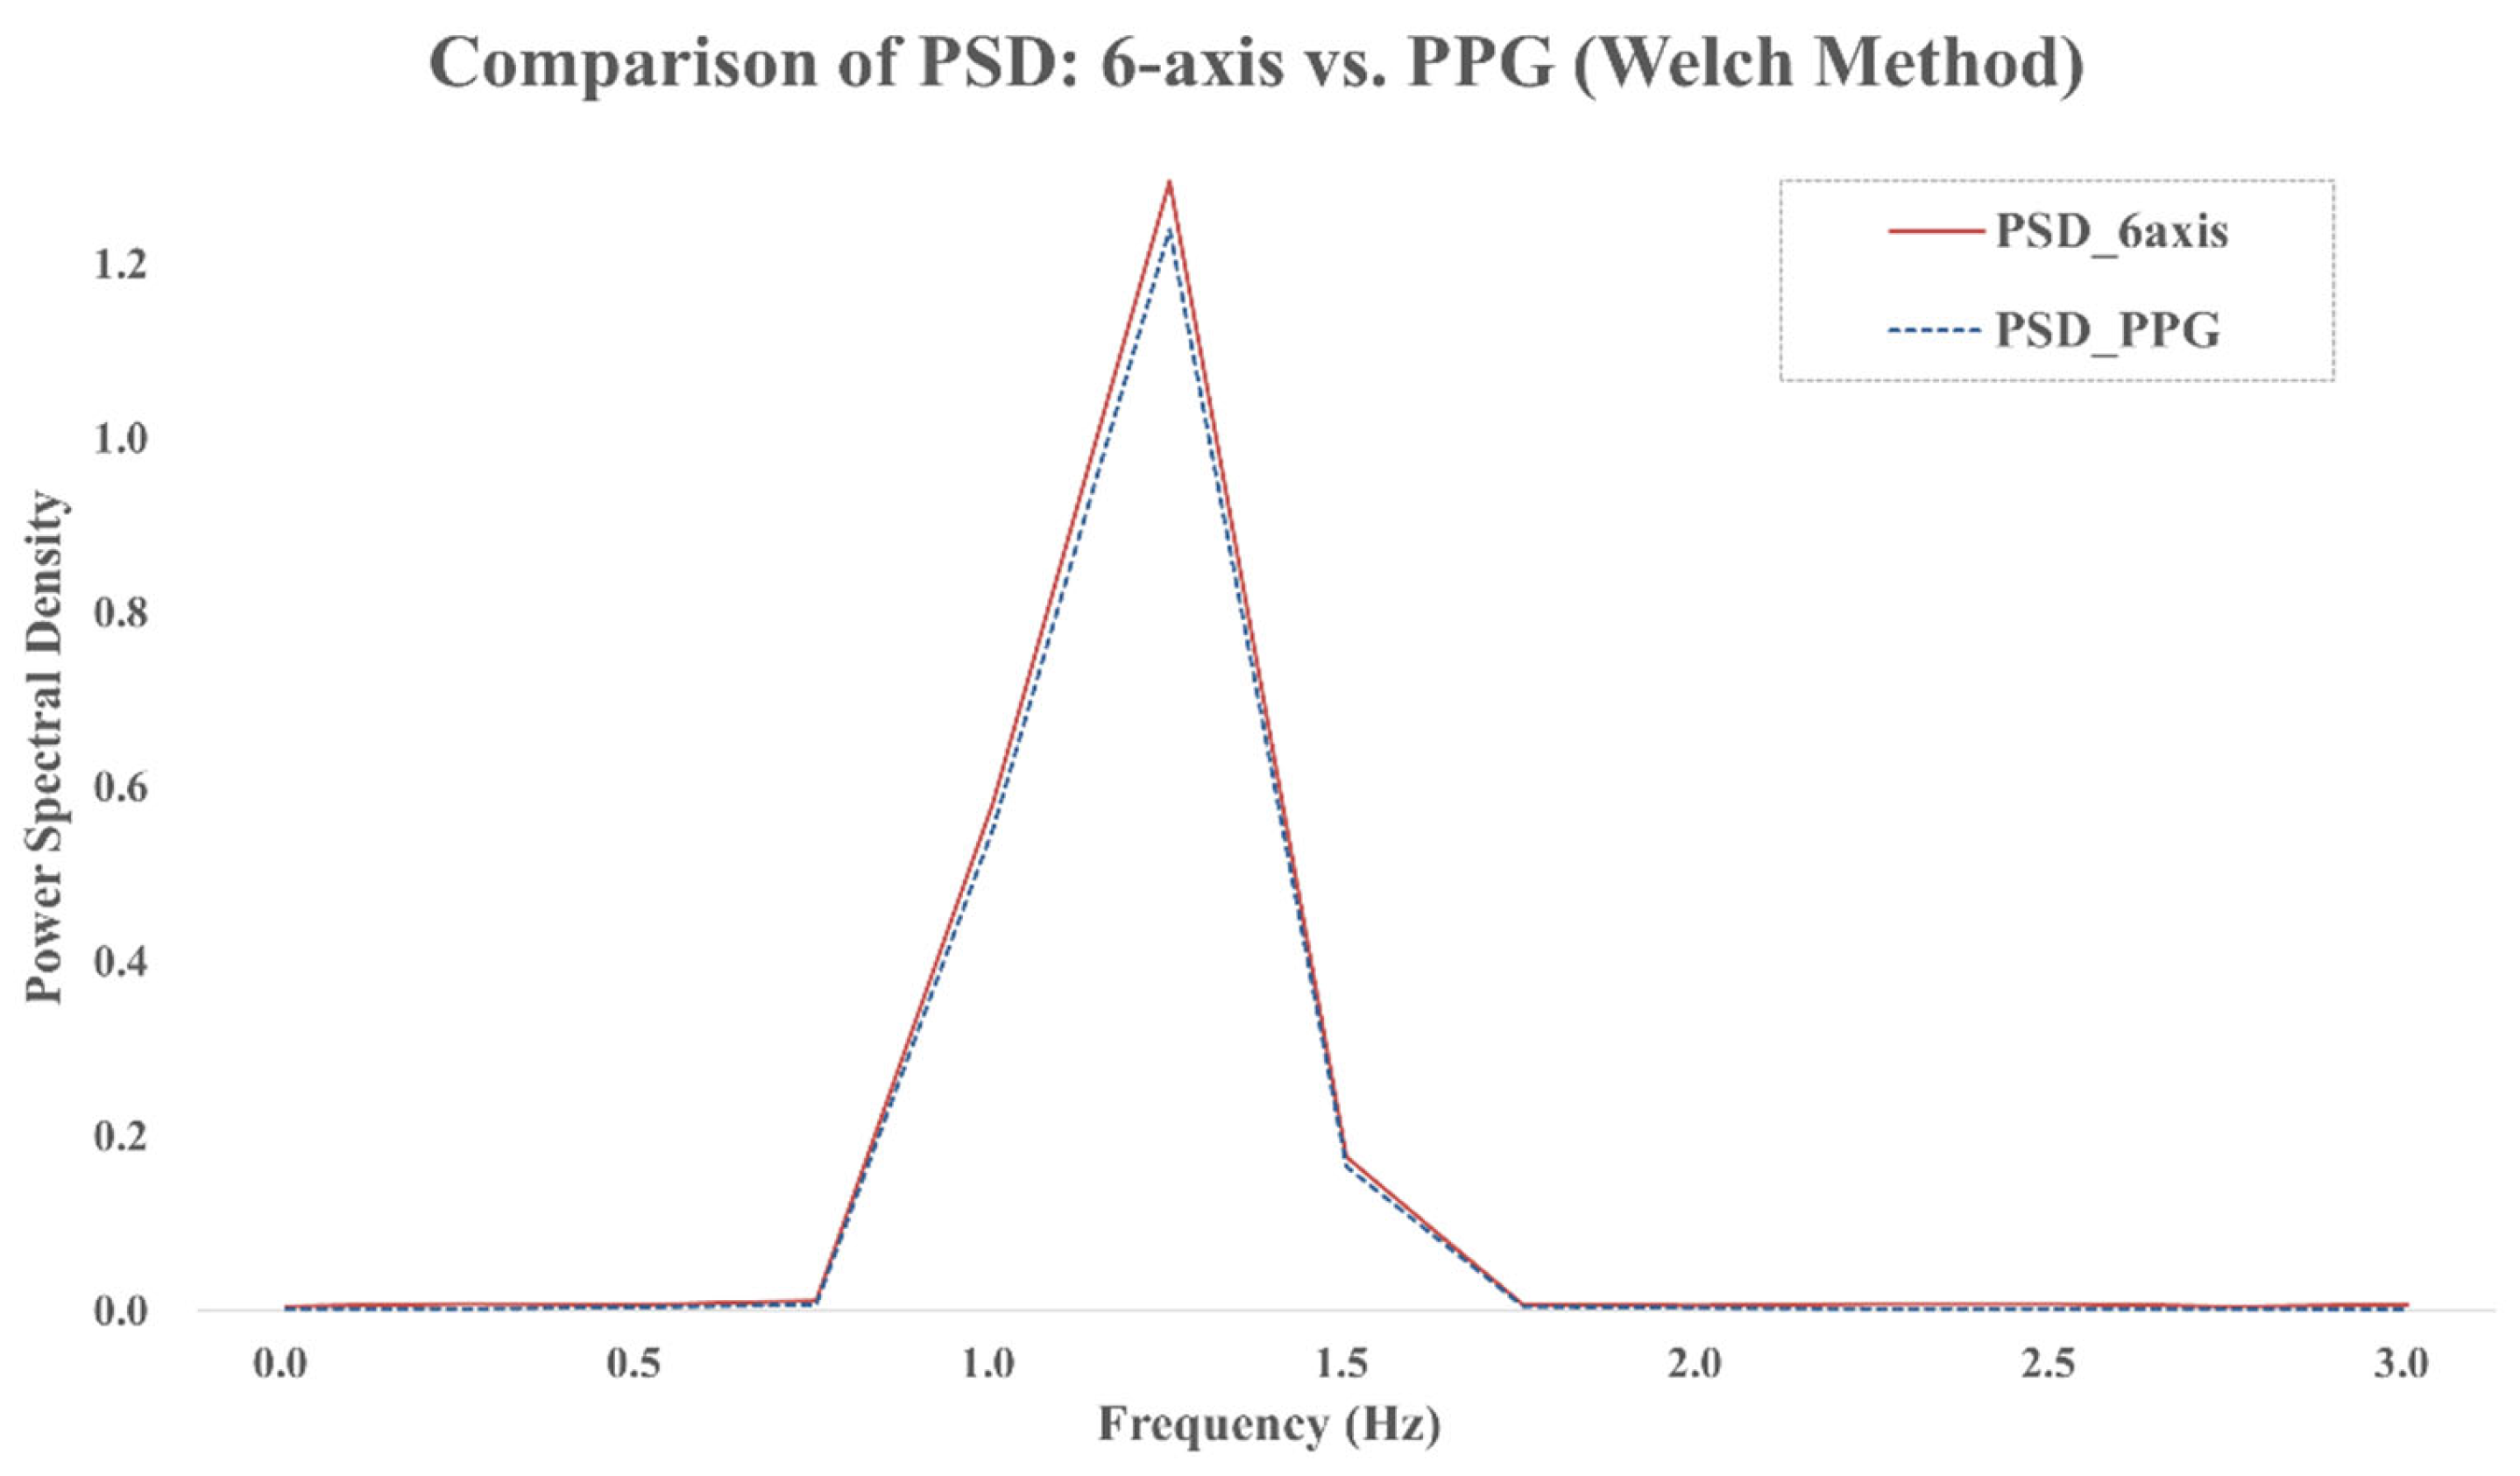
For spectral analysis, we adopted the Welch method using a 4 s Hanning window with 50% overlap (see
Figure 5). This approach reduces the variance of the PSD estimate and enhances the reliability of spectral peak detection.
Figure 5 shows the PSDs of both the six-axis signal and the PPG reference, where the dominant spectral components align within the 0.8–2.0 Hz range. This alignment supports the feasibility of frequency-based heart rate detection using inertial signals. The dominant peak in this band was identified and converted to beats per minute (bpm) to estimate heart rate (HR), as shown in Equation (5).
The above pipeline—filtering, downsampling, windowing, PSD computation, and peak detection—was consistently applied to both the six-axis sensor and PPG data. The effectiveness of each analysis stage was validated by comparing results using paired t-tests and Bland–Altman plots across data from 20 participants.
4. Experiments and Results
To validate the effectiveness of the proposed heart rate estimation method, we conducted experiments involving 20 adult participants aged between 30 and 40 years (14 males, 6 females). This age range was selected to minimize variability due to age-related physiological differences, ensuring a relatively homogeneous autonomic response across the cohort. Participants were fitted with the six-axis HRSD on the crown of the head and a TP320 PPG sensor on the index finger (
Figure 6).
Figure 6a shows the front view of the participant, while
Figure 6b presents the rear view.
For comparative analysis, optical-based PPG signals were utilized to measure changes in blood flow within the body, considering both reflection and transmission characteristics [
20]. Frequency domain analysis of PPG signals allows for the evaluation of autonomic nervous system responses that correspond to the normal heart rate range in adults (60–120 bpm). This enables a deeper exploration of physiological information related to heart rate variability. In this study, PPG data was collected using the TP320 sensor (LAXTHA Inc., Daejeon, South Korea). The TP320 SpO
2 sensor utilizes a photoplethysmography (PPG) principle, employing dual-wavelength light sources (infrared and red LEDs) and a photodiode. Variations in light absorption caused by pulsatile blood flow are captured to derive heart rate and SpO
2 measurements (see
Figure 7).
The TP320 device demonstrated high validity for heart rate measurement, with a Pearson correlation coefficient of 0.96 and a mean absolute error of 2.4 bpm when compared to ECG. Furthermore, test–retest reliability analyses yielded an ICC of 0.92, indicating strong measurement consistency. These results suggest that TP320 is both a valid and reliable tool for wearable cardiac monitoring in clinical and daily settings [
23].
After preprocessing (high-pass filtering, downsampling, and RMS calculation), Welch’s method was employed to compute the Power Spectral Density (PSD) from the six-axis and PPG signals. By reducing variance in the spectral estimate, this method enabled a more robust identification of the dominant frequency within the 0.8–2.0 Hz range. Heart rate (HR) was then calculated by converting this peak frequency to beats per minute (bpm).
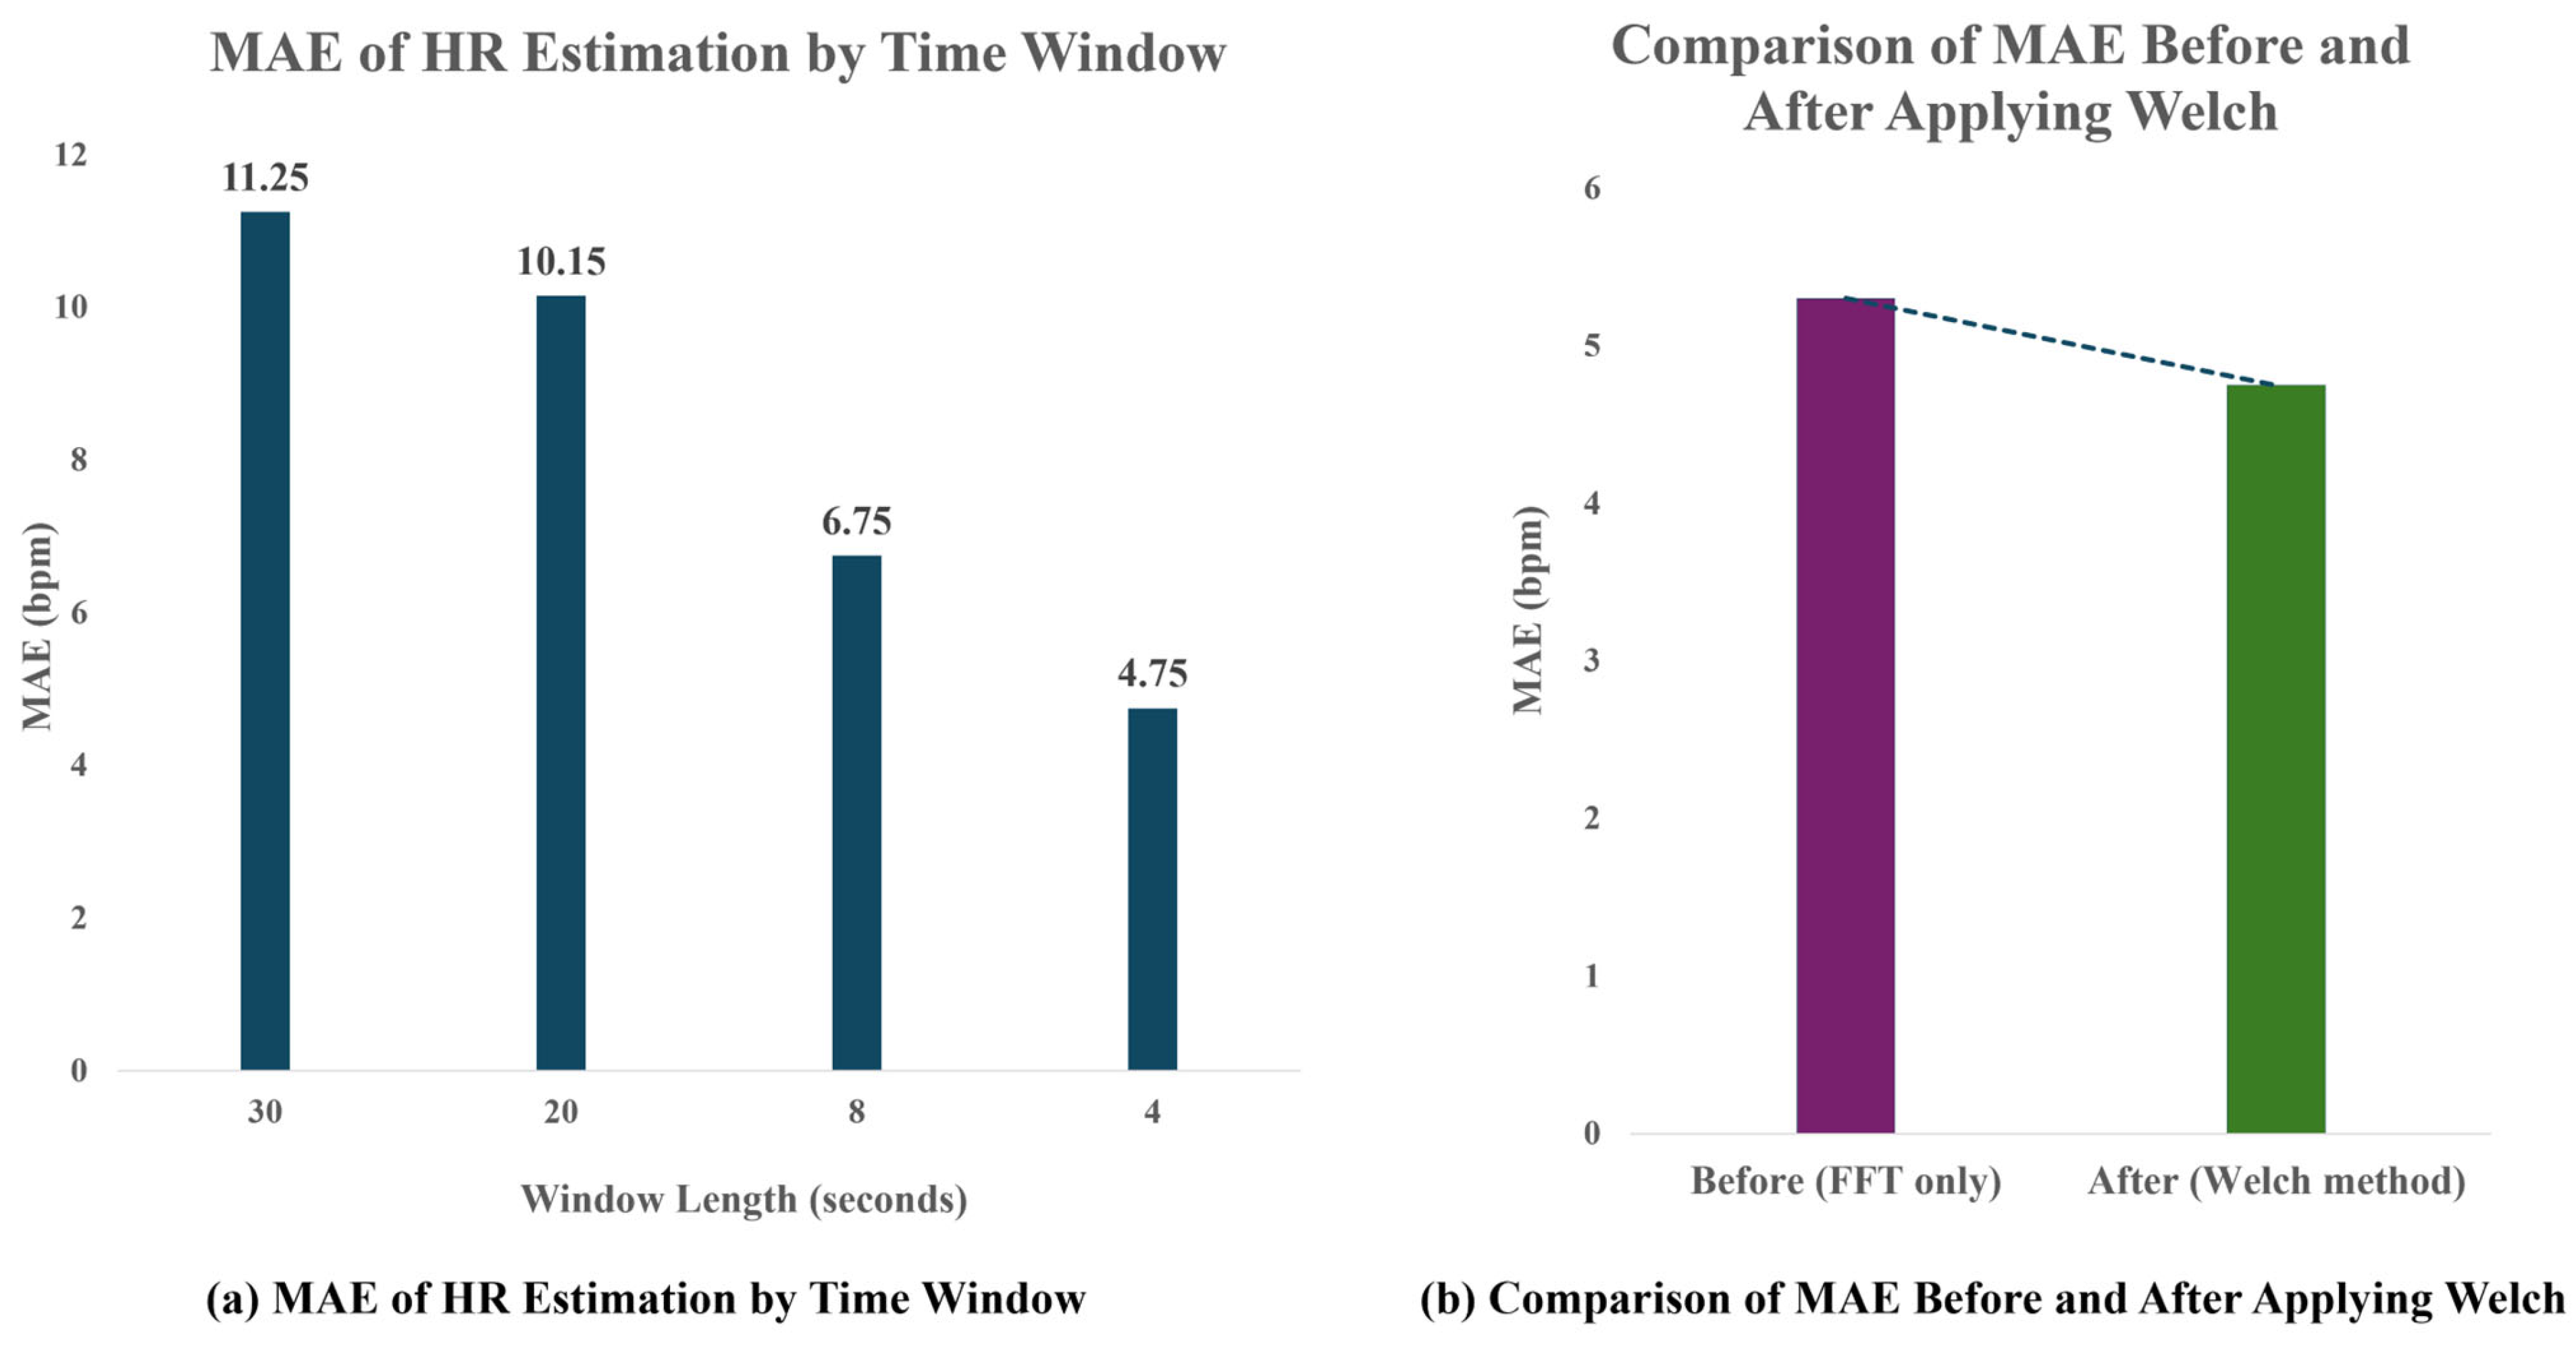
To determine the optimal analysis window size, various time windows (4 s, 8 s, 20 s, and 30 s) were applied, and the corresponding HR estimation accuracy was compared using Mean Absolute Error (MAE) against the PPG reference. As shown in
Figure 8, a 4 s analysis window achieved the lowest mean absolute error (MAE) of 4.75 bpm, demonstrating the best performance for short-term heart rate (HR) estimation. Additionally, the application of Welch-based spectral analysis reduced the MAE from 5.3 bpm to 4.75 bpm compared to the conventional FFT-based approach, indicating improved robustness and accuracy in frequency-domain HR detection. Although a 4 s window theoretically limits frequency resolution to 0.25 Hz, the use of Welch’s method—with 50% overlap and Hanning windowing—compensates for this limitation by increasing the robustness of spectral peak detection. This allows reliable heart rate estimation even with short time signals.
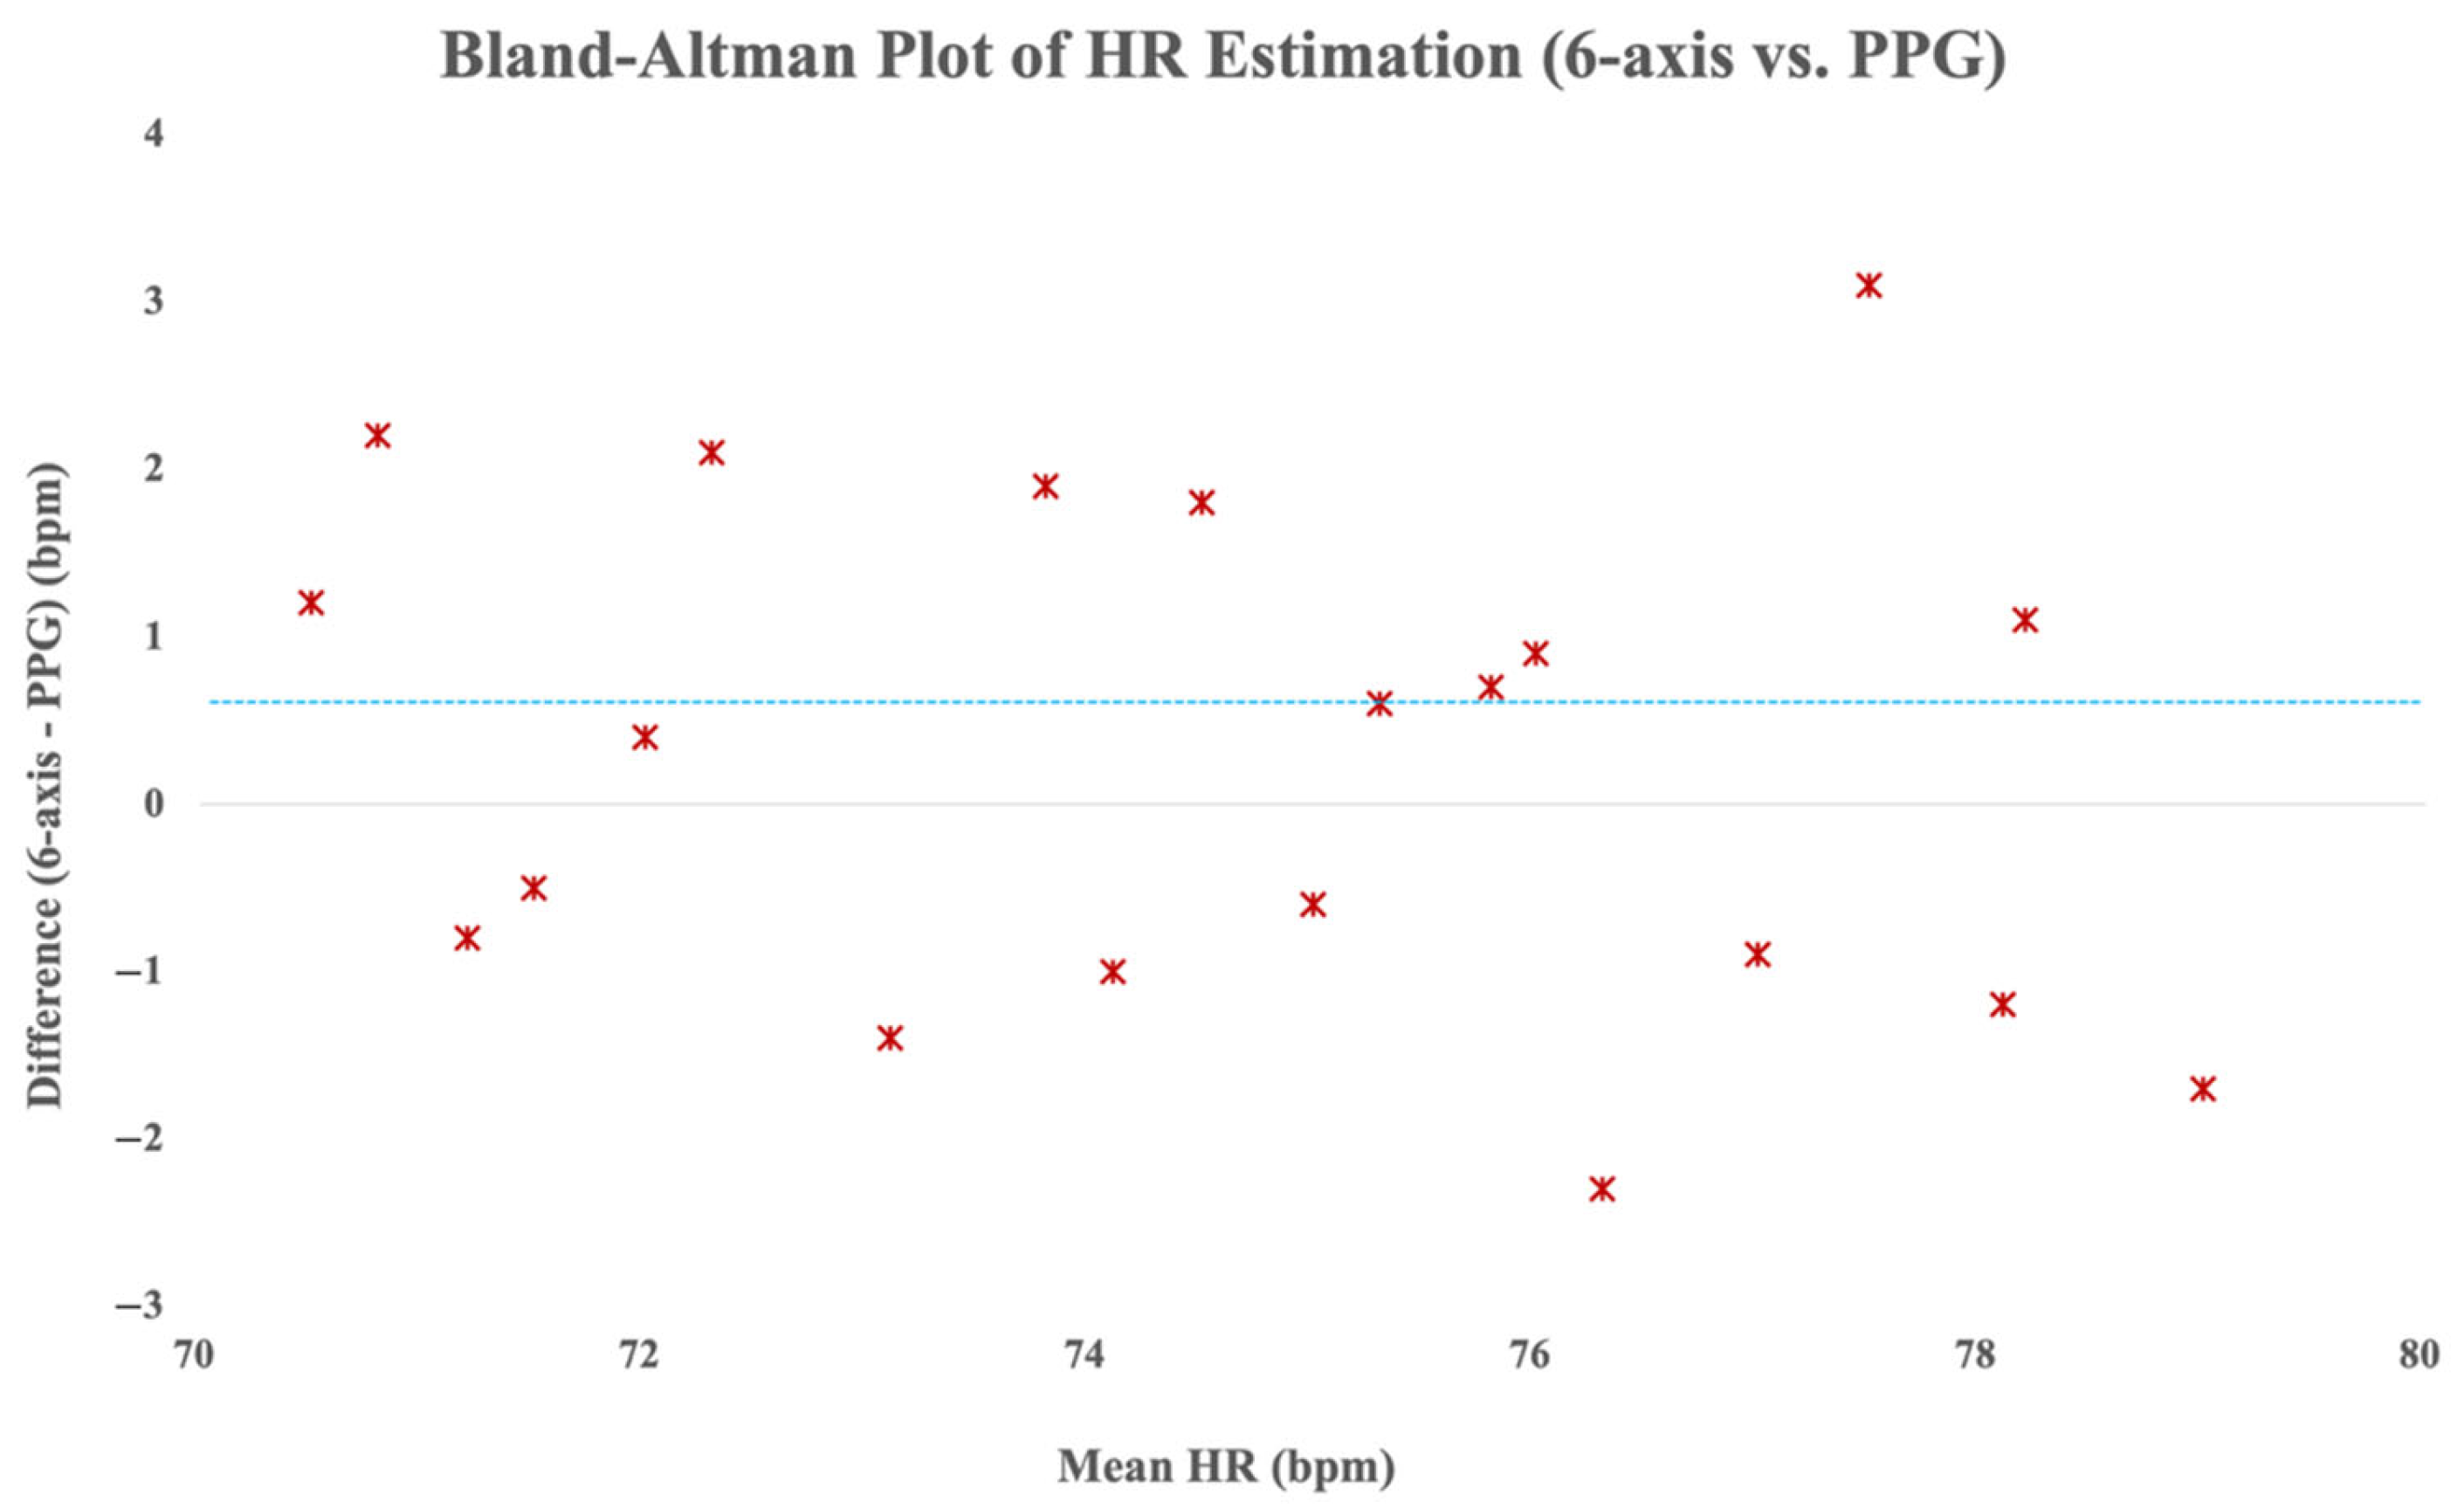
Additionally, Bland–Altman analysis was performed to evaluate agreement between the HR values derived from the six-axis sensing method and the reference PPG data. As depicted in
Figure 9, the majority of the heart rate differences fell within the ±5 bpm limits of agreement, and as indicated by the blue dashed line, the mean difference was only 0.6 bpm. The Bland–Altman analysis demonstrated a mean difference of 0.6 bpm between the six-axis sensor and the reference PPG, indicating a negligible positive bias with high agreement. This suggests strong consistency and practical interchangeability of the proposed method with conventional PPG-based HR monitoring.
Furthermore, although the signal processing pipeline was modified to include adjustments to filter parameters and Welch-based PSD analysis, the mean absolute error (MAE) remained at a comparable level of 4.75 bpm. This consistency is likely due to both pipelines effectively preserving the dominant heartbeat components within the 0.8–2.0 Hz range, as also confirmed by the Bland–Altman analysis.
5. Conclusions
This study proposed a novel heart rate estimation technique based on a six-axis Heart Rate Sensing Device (HRSD) that leverages ballistocardiographic (BCG) principles. By utilizing accelerometer and gyroscope data commonly available in wearable devices, our method enables continuous, non-invasive heart rate monitoring without requiring optical sensors.
Experimental results from 20 participants demonstrated that a 4 s analysis window yielded the highest estimation accuracy, with a mean absolute error (MAE) of 4.75 bpm. The signal processing pipeline—including sensor fusion, high-resolution sampling, filtering, PSD analysis using the Welch method, and dominant frequency extraction—proved effective in isolating heartbeat-induced vibrations, even within short analysis windows.
Compared to optical PPG-based systems, our approach offers three major advantages: (1) lower power consumption due to the use of embedded inertial sensors; (2) robustness against environmental factors such as lighting or skin tone; and (3) suitability for long-term monitoring in mobile or immersive environments such as VR/AR headsets.
Despite these strengths, limitations remain. The method’s sensitivity to sensor placement and motion artifacts needs further refinement. Additionally, broader validation across diverse populations and real-world scenarios is required to enhance generalizability. Future research will focus on improving robustness through AI-based signal enhancement, adaptive windowing, and sensor placement optimization.
Ultimately, this study contributes a promising and scalable method for heart rate monitoring in next-generation wearable systems, particularly those requiring non-contact sensing in dynamic environments.
Author Contributions
Conceptualization, J.K. (Jinman Kim) and J.K. (Joongjin Kook); methodology, J.K. (Jinman Kim) and J.K. (Joongjin Kook); software, J.K. (Jinman Kim); validation, J.K. (Jinman Kim) and J.K. (Joongjin Kook); formal analysis, J.K. (Joongjin Kook); investigation, J.K. (Jinman Kim); resources, J.K. (Jinman Kim); data curation, J.K. (Jinman Kim) and J.K. (Joongjin Kook); writing—original draft preparation, J.K. (Jinman Kim) and J.K. (Joongjin Kook); writing—review and editing, J.K. (Joongjin Kook); visualization, J.K. (Jinman Kim); supervision, J.K. (Joongjin Kook); project administration, J.K. (Joongjin Kook); funding acquisition, J.K. (Joongjin Kook). All authors have read and agreed to the published version of the manuscript.
Funding
This research received no external funding.
Institutional Review Board Statement
Not applicable.
Informed Consent Statement
Not applicable.
Data Availability Statement
The original contributions presented in this study are included in the article. Further inquiries can be directed to the corresponding author(s).
Conflicts of Interest
The authors declare no conflicts of interest.
References
- Colombo, F.; Islam, M.M. An Overview of the Sensors for Heart Rate Monitoring Used in Extramural and Home Settings. Biosensors 2022, 12, 431. [Google Scholar] [CrossRef]
- Hytonen, J.; Peltokangas, M.; Vehkaoja, A. Accurate Heartbeat Detection on Ballistocardiogram Accelerometric Traces. IEEE Trans. Instrum. Meas. 2020, 69, 9326–9334. [Google Scholar] [CrossRef]
- Ochi, H.; Shimamoto, S.; Liu, J.; Yamaoka, Y. Non-contact Blood Pressure Estimation with Pulse Wave employing Microwave Reflection. In Proceedings of the 2021 IEEE International Conference on Communications Workshops (ICC Workshops 2021), Virtual, Online, 14–23 June 2021; pp. 1–6. [Google Scholar] [CrossRef]
- Reyes-González, D.; Rodríguez, A.; Zárate, L. BCG Measurement Using Polymer Optical Fiber Sensors. Opt. Fiber Technol. 2019, 52, 101976. [Google Scholar] [CrossRef]
- Gjerde, M.; Holme, B.; Langø, T. A Wearable System for Full-Body Ballistocardiography. Biomed. Signal Process. Control 2018, 40, 174–182. [Google Scholar] [CrossRef]
- Watanabe, K.; Kurihara, Y.; Kobayashi, K.; Suzuki, K. Ballistocardiogram (BCG) Measurement by a Differential Pressure Sensor. IEEE Sens. J. 2020, 21, 8583–8592. [Google Scholar] [CrossRef]
- Kim, H.; Park, J.; Lee, S. Heart Rate Estimation from BCG Using Transformer-Based Deep Learning. Sensors 2023, 23, 2461. [Google Scholar] [CrossRef]
- Lee, D.; Kwon, H.; Son, D.; Eom, H.; Park, C.; Lim, Y.; Seo, C.; Park, K. Beat-to-Beat Continuous Blood Pressure Estimation Using Bidirectional Long Short-Term Memory Network. Sensors 2021, 21, 96. [Google Scholar] [CrossRef] [PubMed]
- Reyes González, L.R.; Rodríguez Cobo, L.; López Higuera, J.M.; Universidad de Cantabria. Comparison of ballistocardiogram processing methods based on fiber specklegram sensors. IEEE Sens. J. 2022, 22, 20524–20530. [Google Scholar] [CrossRef]
- Gjerde, S.; Steffensen, T.; Vestad, H.; Steinert, M. Windows to the Sole: Prototyping Soft Sensors for Wearable Ballistocardiography. In Proceedings of the 2022 IEEE-EMBS International Conference on Wearable and Implantable Body Sensor Networks (BSN), Ioannina, Greece, 27–30 September 2022; IEEE: Piscataway, NY, USA, 2022; pp. 1–4. [Google Scholar]
- Zhao, H.; Zhu, G.; Liu, F.; Liu, X.; Yuan, J.; Zhou, X. Non-Invasive Optical Fiber Sensing Vital Signs Monitoring Based on Envelope Extraction BCG Data Processing. In Proceedings of the2022 IEEE 7th Optoelectronics Global Conference (OGC), Shenzhen, China, 6–11 December 2022; IEEE: Piscataway, NY, USA, 2022; pp. 124–127. [Google Scholar]
- Zhang, L.; Cai, P.; Deng, Y.; Lin, J.; Chu, Z.; Shi, Q.; Ye, F.; Hu, J.; Yang, C.; Li, P.; et al. Ballistocardiography to identify high left atrial pressure in patients with heart failure. Ann. Palliat. Med. 2021, 10, 8155–8168. [Google Scholar] [CrossRef] [PubMed]
- Hytonen, R.; Tshala, A.; Schreier, J.; Holopainen, M.; Forsman, A.; Oksanen, M.; Findling, R.D.; Nguyen, L.N.; Sigg, S.; Jahne-Raden, N. Analysing Ballistocardiography for Pervasive Healthcare. In Proceedings of the 2020 16th International Conference on Mobility, Sensing and Networking (MSN), Tokyo, Japan, 17–19 December 2020; IEEE: Piscataway, NY, USA, 2020; pp. 86–91. [Google Scholar]
- Yoshioka, M.; Bounyong, S. Analysis of Pulse Transit Time Derived from Imaging Photoplethysmography and Microwave Sensor-based Ballistocardiography. In Proceedings of the IEEE/CVF Conference on Computer Vision and Pattern Recognition (CVPR) Workshops, Seattle, WA, USA, 13–19 June 2020; IEEE: Piscataway, NY, USA, 2020; pp. 1156–1162. [Google Scholar]
- Han, H.; Kim, K.; Lee, S. Transformer Networks for Heartbeat Detection from Ballistocardiograms. arXiv 2024, arXiv:2412.14376. [Google Scholar] [CrossRef]
- Sen, S.; Zhou, M.; Yoon, S. Non-Invasive Heart Rate Estimation from Ballistocardiograms Using Bidirectional LSTM Regression. IEEE J. Biomed. Health Inform. 2021, 25, 3396–3407. [Google Scholar] [CrossRef]
- Zhang, Z.; Pi, Z.; Liu, B. TROIKA: A General Framework for Heart Rate Monitoring Using Wrist-Type Photoplethysmographic Signals During Intensive Physical Exercise. IEEE Trans. Biomed. Eng. 2015, 62, 522–531. [Google Scholar] [CrossRef] [PubMed]
- Temko, A. Accurate Heart Rate Monitoring During Physical Exercises Using PPG. IEEE Trans. Biomed. Eng. 2017, 64, 2016–2024. [Google Scholar] [CrossRef] [PubMed]
- Sabatini, A.M. Estimating Three-Dimensional Orientation of Human Body Parts by Inertial/Magnetic Sensor Fusion. Sensors 2011, 11, 1489–1525. [Google Scholar] [CrossRef] [PubMed]
- Hernandez, J.; Li, Y.; Rehg, J.M.; Picard, R.W. Cardiac Stress Recognition from Wearable Motion Sensors. In Proceedings of the 33rd Annual ACM Conference on Human Factors in Computing Systems (CHI) 2015, Seoul, Republic of Korea, 18–23 April 2015; pp. 715–724. [Google Scholar] [CrossRef]
- Zhou, T.; Zhang, X.; Wang, H.; Zhang, Q.; Ma, T. Remote Heart Rate Estimation via Convolutional Neural Networks with Transformers. J. Franklin Inst. 2023, 360, 11217–11236. [Google Scholar] [CrossRef]
- Biswas, D.; Veluvolu, K.C. Heart Rate Estimation from Wrist-Worn Inertial Sensors via PPG-Inspired Deep Learning. Sensors 2019, 19, 2987. [Google Scholar] [CrossRef]
- TP320. Available online: http://www.laxtha-eshop.kr/goods/view?no=6 (accessed on 19 April 2025).
| Disclaimer/Publisher’s Note: The statements, opinions and data contained in all publications are solely those of the individual author(s) and contributor(s) and not of MDPI and/or the editor(s). MDPI and/or the editor(s) disclaim responsibility for any injury to people or property resulting from any ideas, methods, instructions or products referred to in the content. |
© 2025 by the authors. Licensee MDPI, Basel, Switzerland. This article is an open access article distributed under the terms and conditions of the Creative Commons Attribution (CC BY) license (https://creativecommons.org/licenses/by/4.0/).


