
A Study on the Effectiveness of Tool Box Meeting Educational Materials Based on Information Quantity


Abstract
1. Introduction
2. Worker Safety Training
2.1. Legal Safety Training
2.2. TBM
3. Materials and Methods
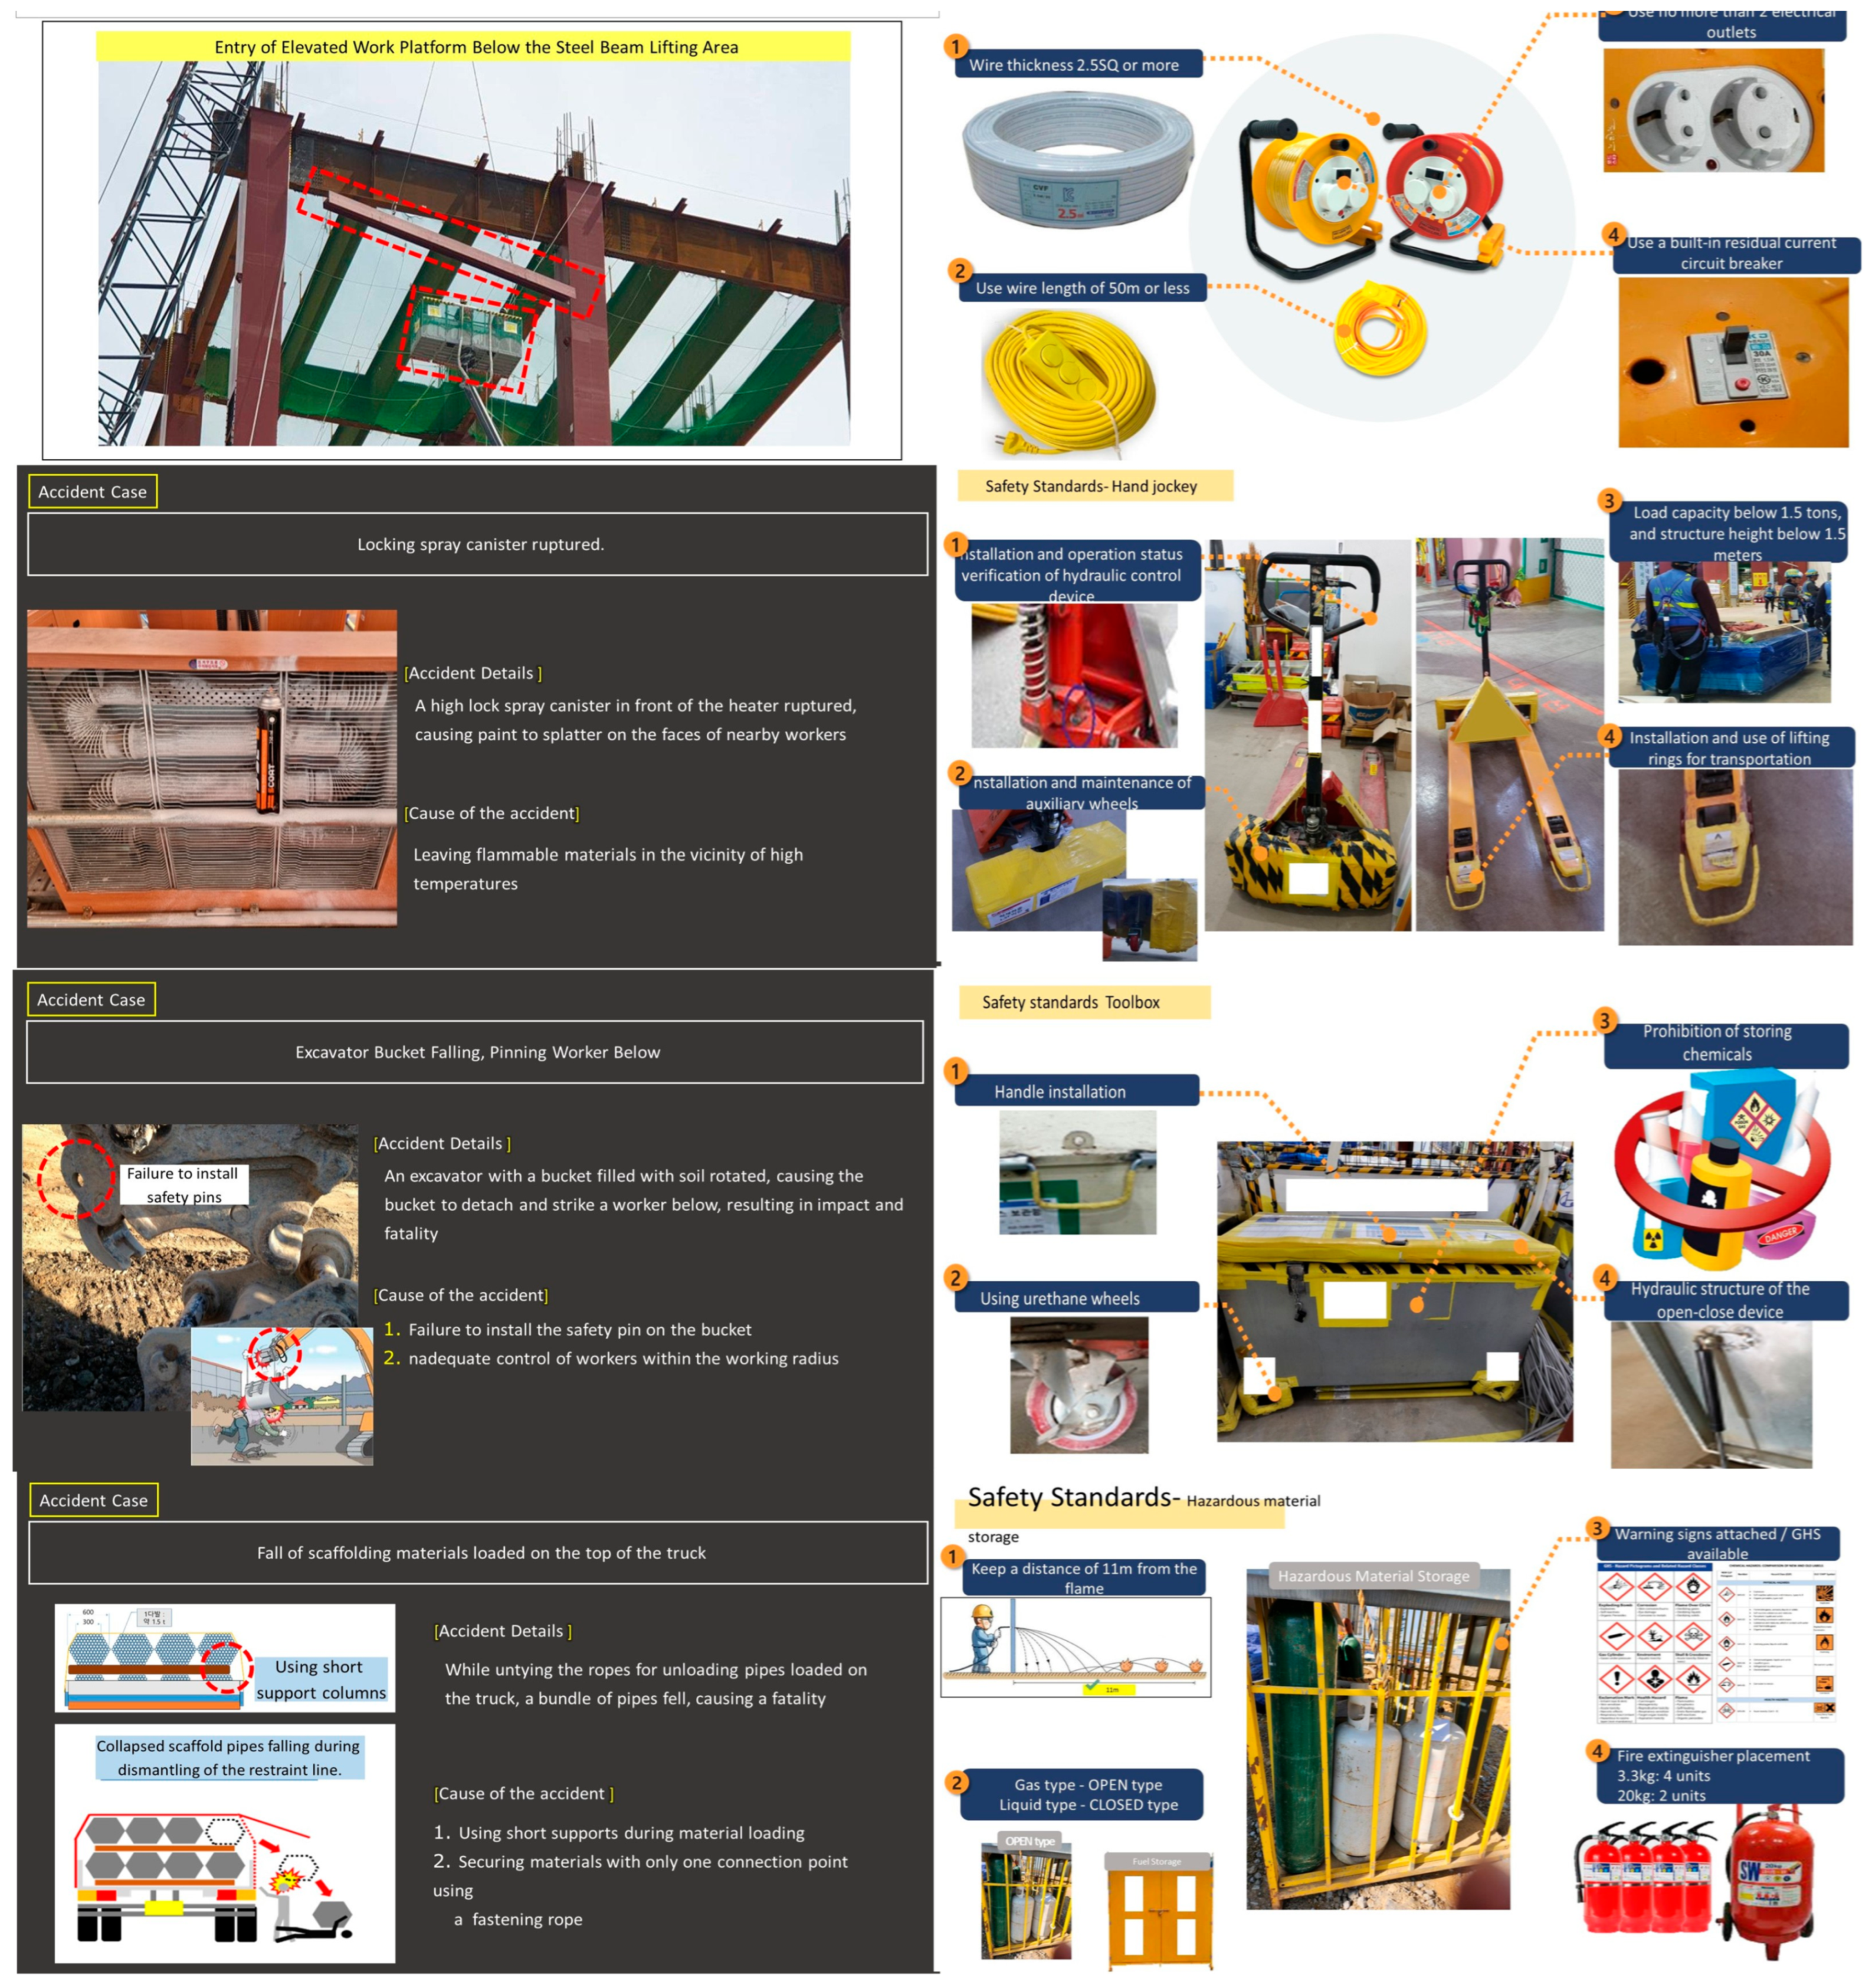
3.1. Experimental Design
3.2. Participants
3.3. Materials and Procedure
4. Recall Test Results
4.1. Impact of Visual Information Complexity
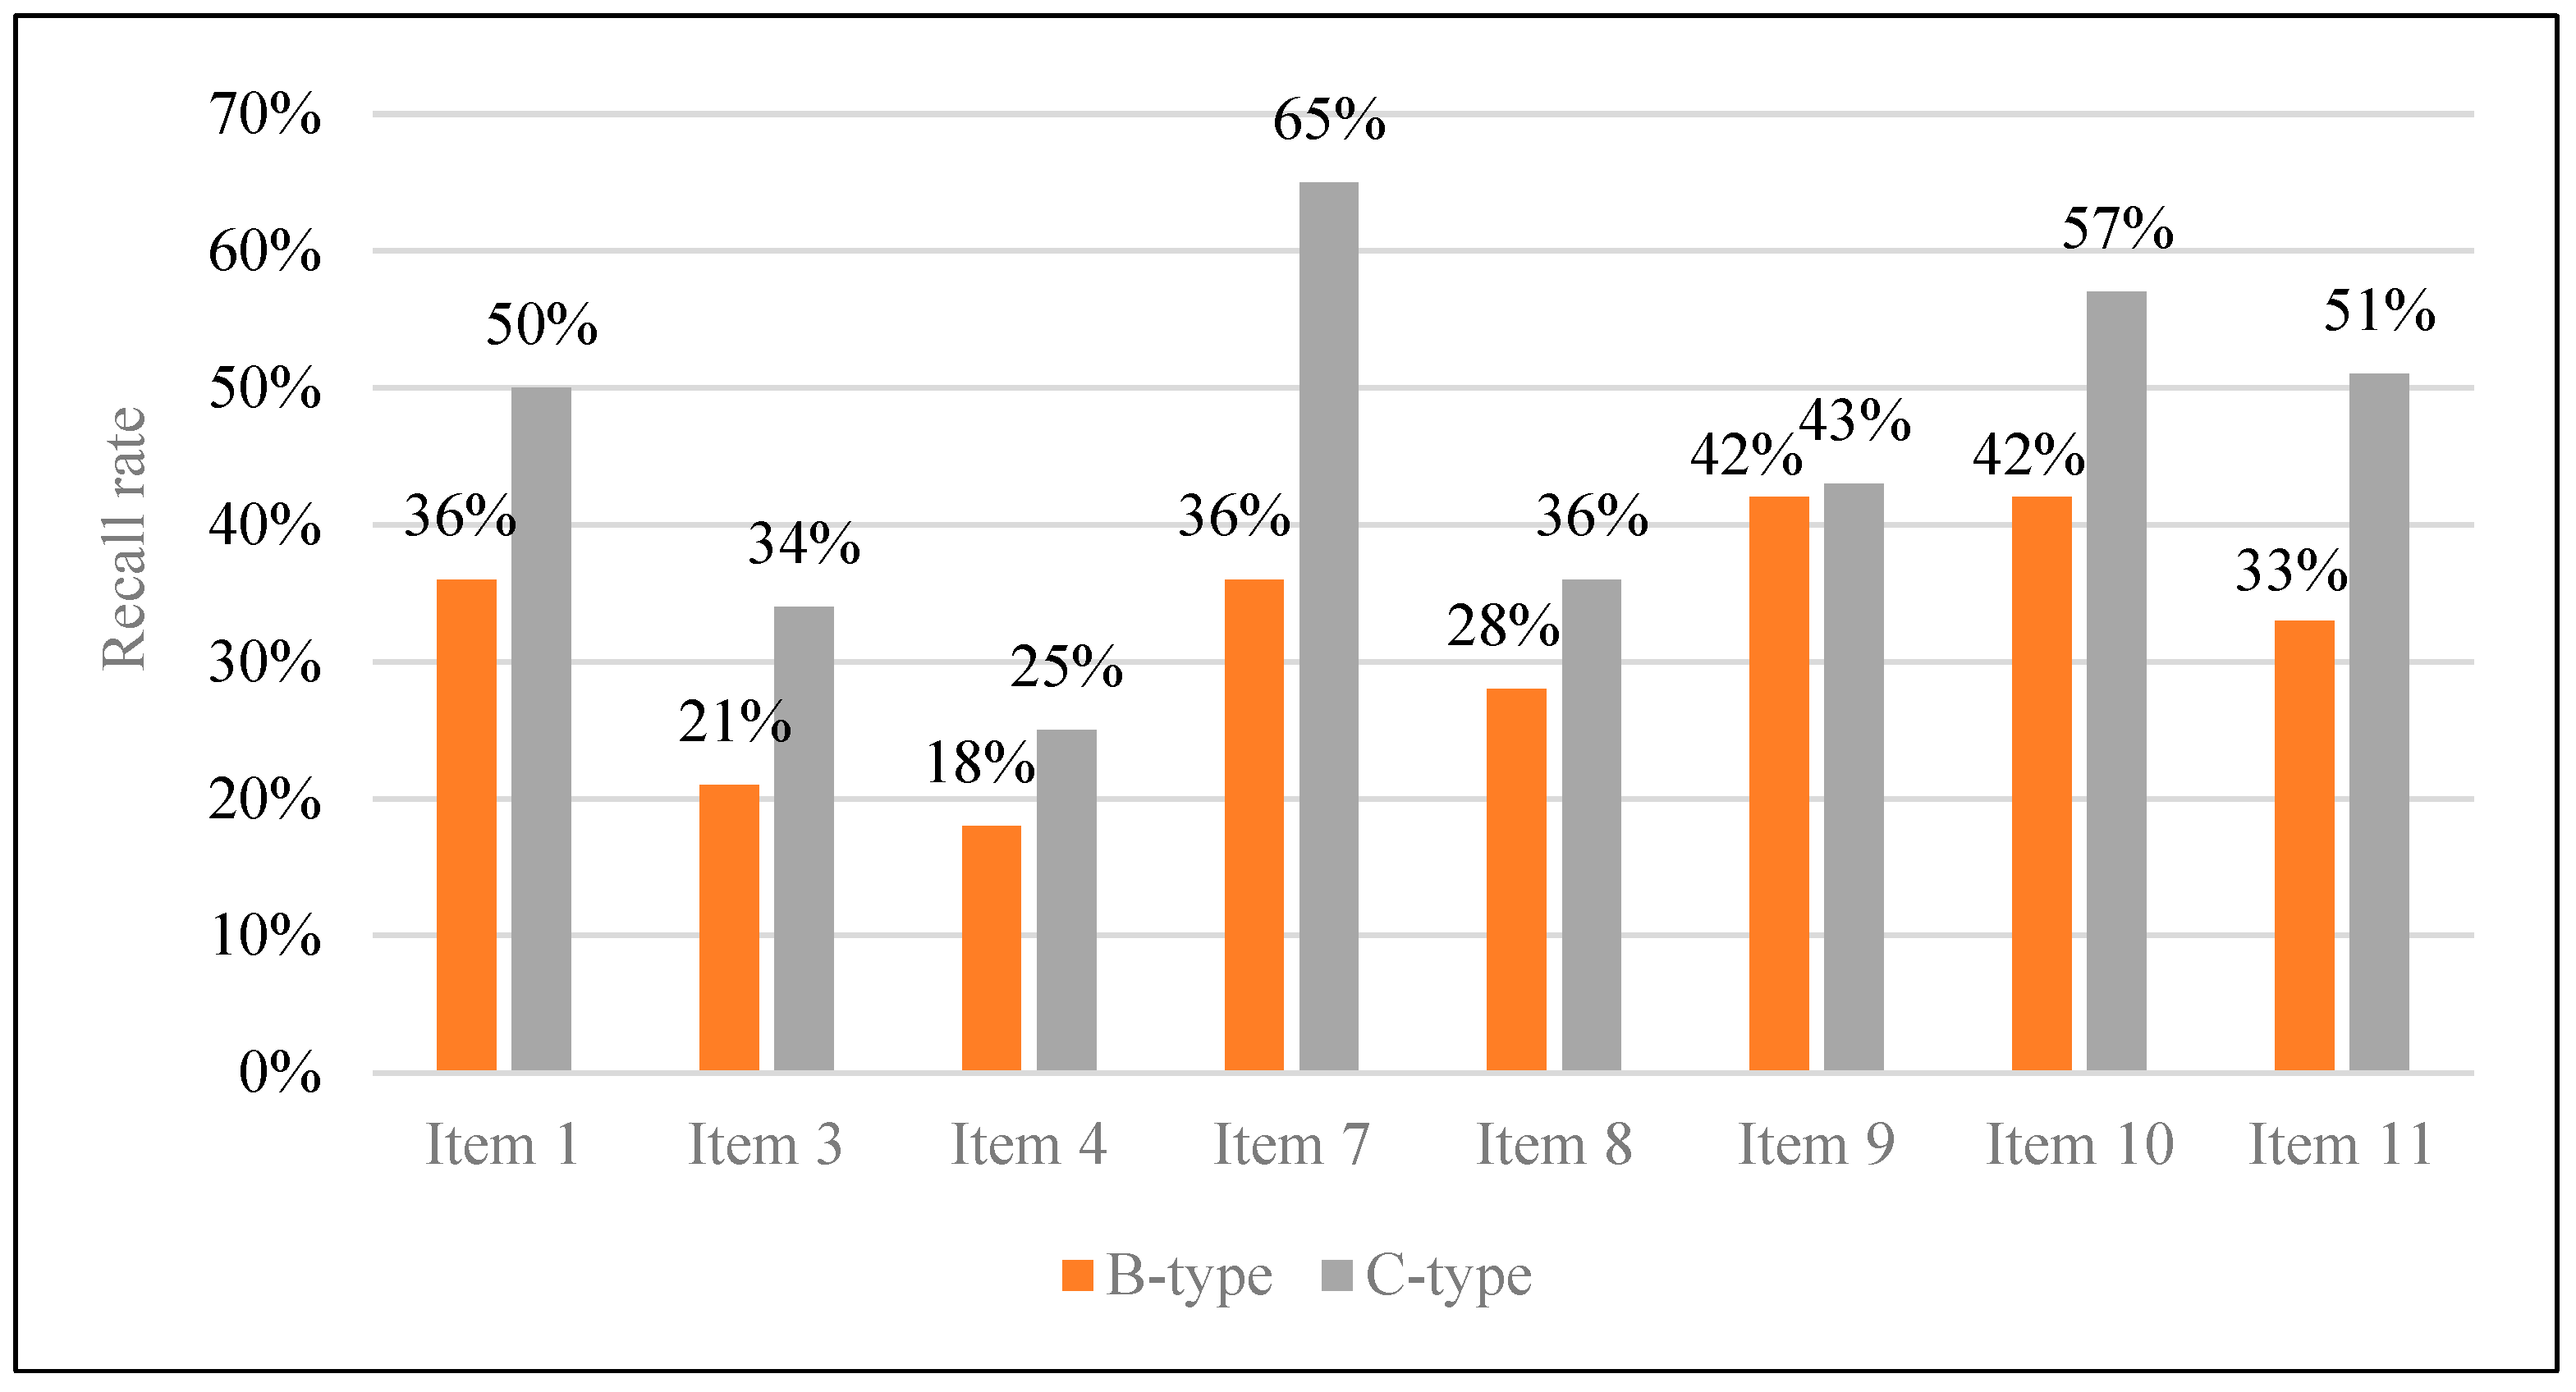
4.2. Impact of Number of Educational Items
4.3. Effect of Individual Characteristics
4.3.1. Age
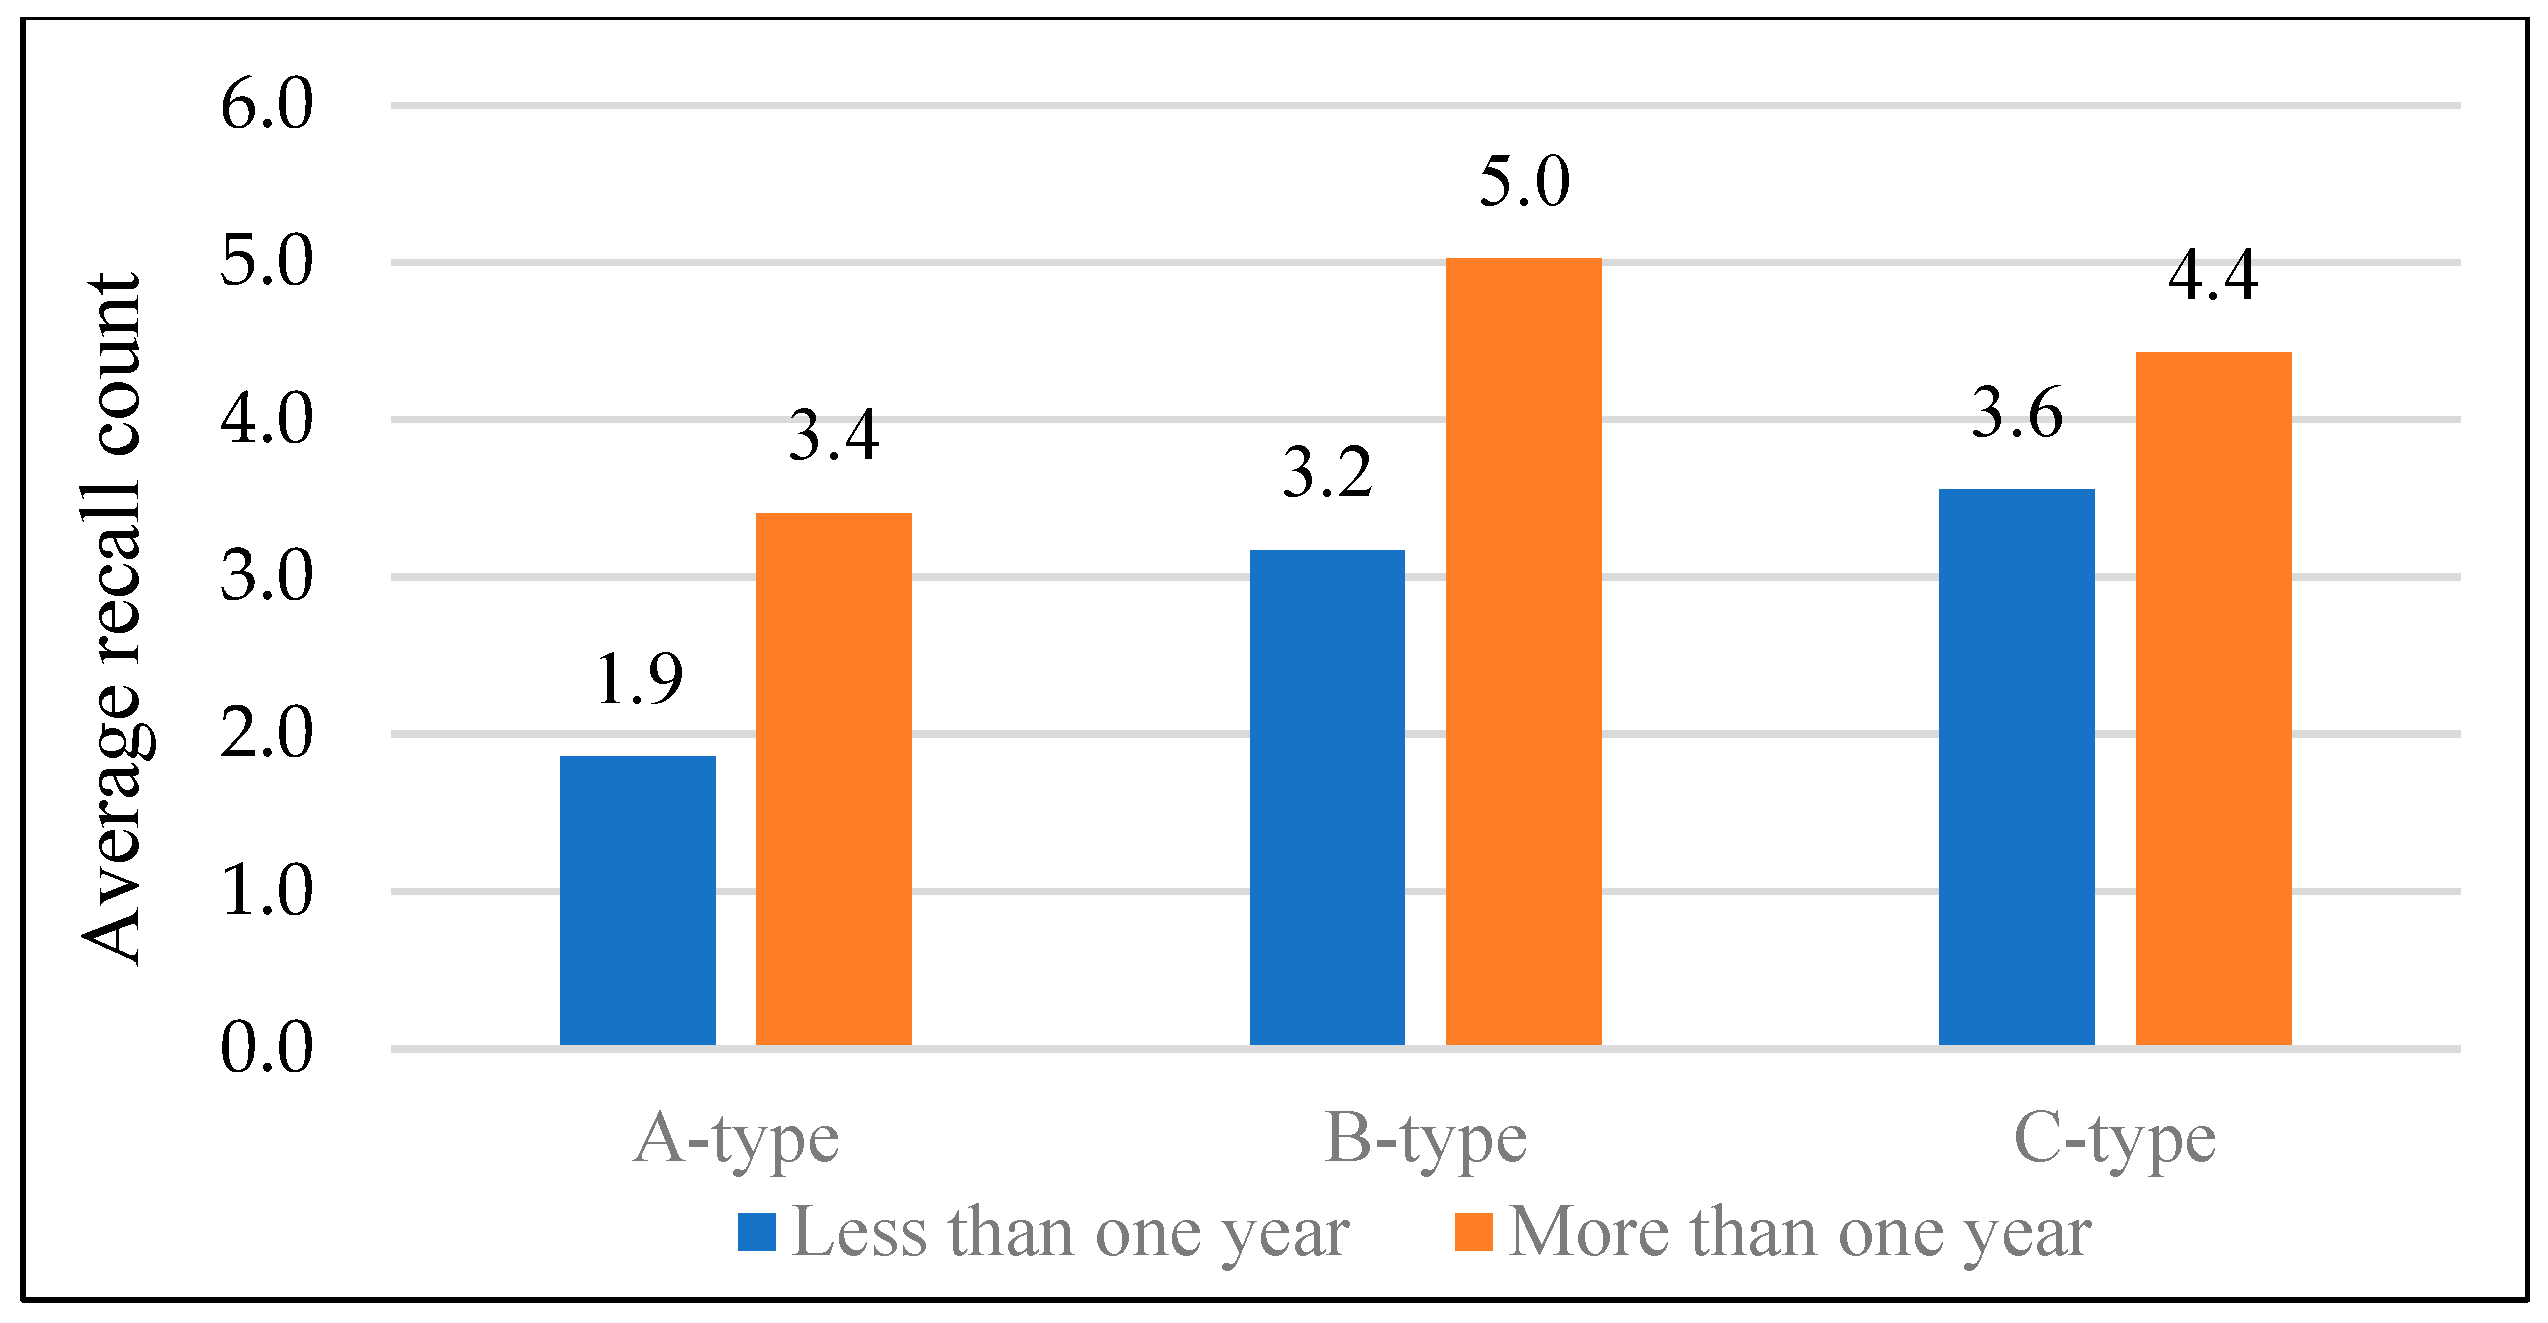
4.3.2. Work Experience
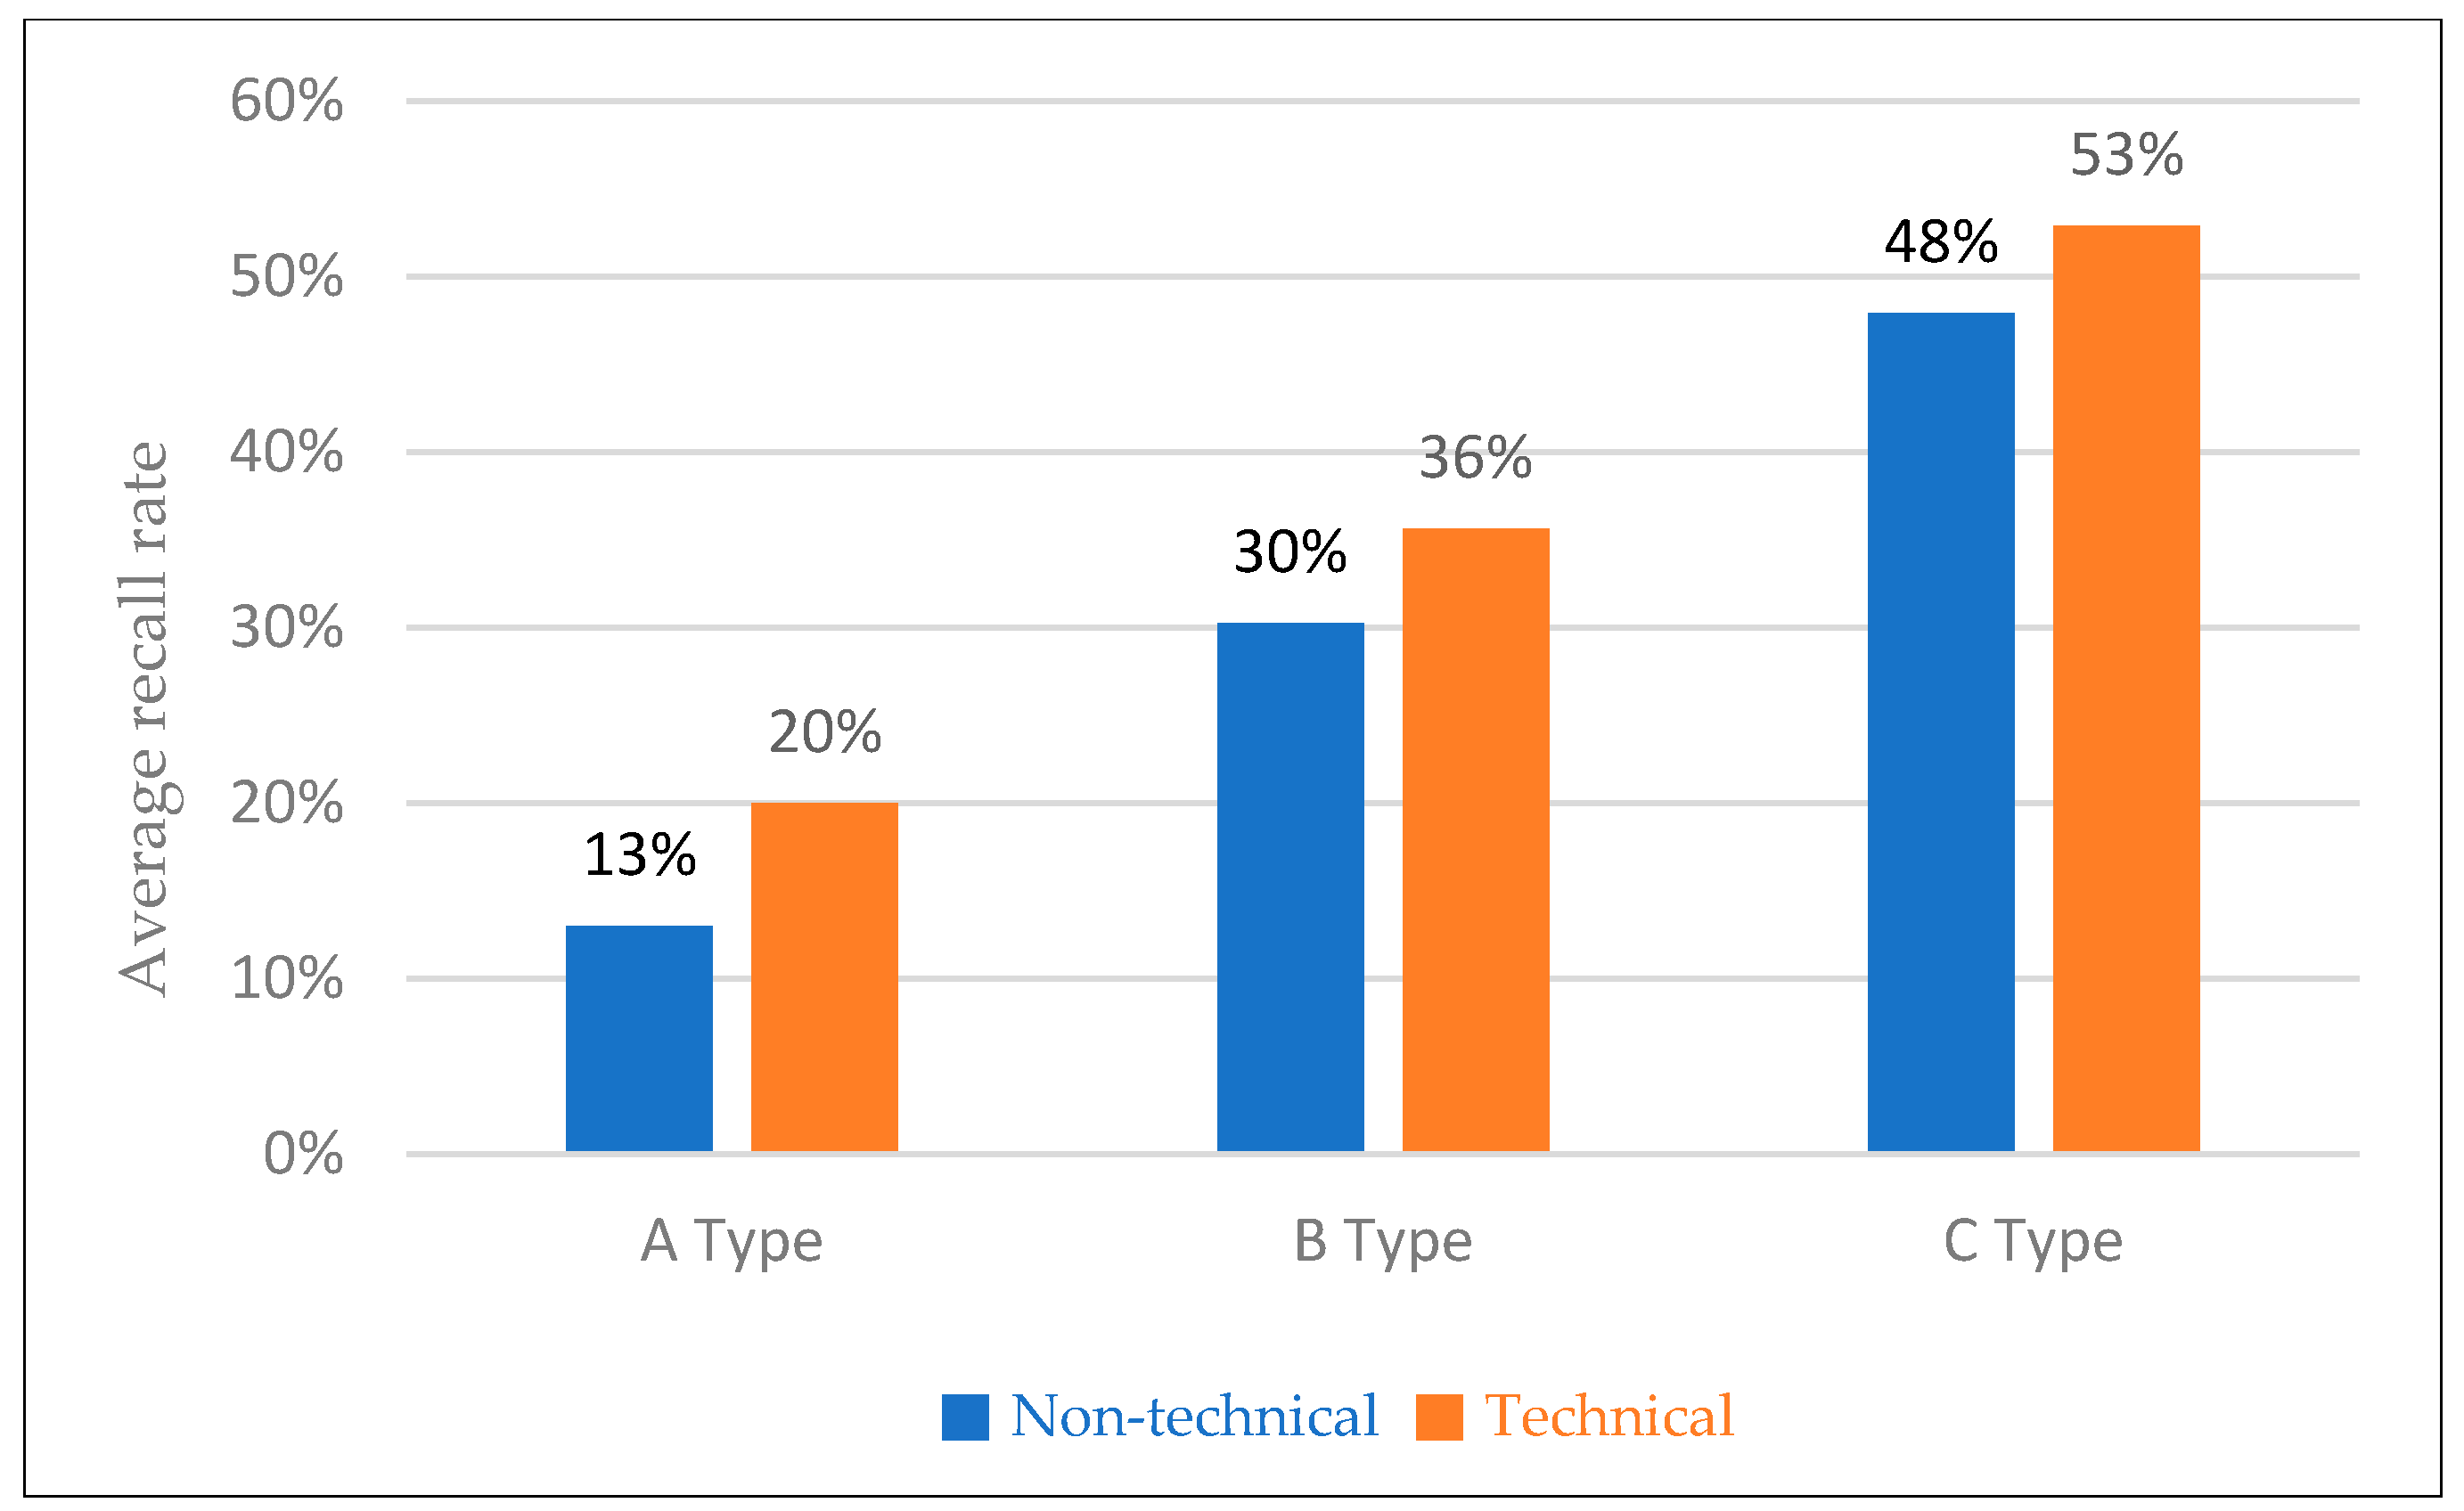
4.3.3. Job Position
4.3.4. Accident Experience
5. Discussion
6. Conclusions
Author Contributions
Funding
Institutional Review Board Statement
Informed Consent Statement
Data Availability Statement
Conflicts of Interest
References
- National Statistics Portal. Overall Accident Status and Analysis—By Industry (Subcategories of Industry). Available online: https://kosis.kr/statHtml/statHtml.do?orgId=118&tblId=DT_11806_N000&conn_path=I3 (accessed on 3 February 2025).
- Chandler, P.; Sweller, J. Cognitive load theory and the format of instruction. Cogn. Instr. 1991, 8, 293–332. [Google Scholar] [CrossRef]
- Sweller, J. Cognitive load theory, learning difficulty, and instructional design. Learn. Instr. 1994, 4, 295–312. [Google Scholar] [CrossRef]
- Moreno, R.; Mayer, R. Cognitive principles of multimedia learning: The role of modality and contiguity. J. Educ. Psychol. 1999, 91, 358–368. [Google Scholar] [CrossRef]
- Baddeley, A. The magic number and the episodic buffer. Behav. Brain Sci. 2001, 24, 117–118. [Google Scholar] [CrossRef]
- Mayer, R.E. Multimedia Learning; Cambridge University Press: Cambridge, UK, 2001. [Google Scholar]
- Sweller, J.; Ayres, P.; Kalyuga, S. Cognitive Load Theory; Springer: New York, NY, USA, 2011. [Google Scholar]
- Moreno, R.; Mayer, R.E. Interactive multimodal learning environments. Educ. Psychol. Rev. 2007, 19, 309–326. [Google Scholar] [CrossRef]
- Jalani, N.H.; Sern, L.C. The example-problem-based learning model: Applying cognitive load theory. Procedia Soc. Behav. Sci. 2015, 195, 872–880. [Google Scholar] [CrossRef]
- Park, Y.H. The Impact of Cognitive Load of Instructional Items, Presentation Methods, and Working Memory Capacity on Young Children’s Learning Outcomes. Master’s Thesis, Seoul National University, Seoul, Republic of Korea, 2021; pp. 31–34. [Google Scholar]
- Cherry, K. What Is Memory? Verywell Mind. Available online: https://www.verywellmind.com/what-is-memory-2795006 (accessed on 4 July 2025).
- Atkinson, R.C.; Shiffrin, R.M. Human memory: A proposed system and its control processes. In Psychology of Learning and Motivation; Spence, K.W., Spence, J.T., Eds.; Academic Press: New York, NY, USA, 1968; pp. 89–195. [Google Scholar]
- Ebbinghaus, H. Memory: A Contribution to Experimental Psychology. Ann. Neurosci. 2013, 20, 155–156, Original Work Published 1885. [Google Scholar] [CrossRef] [PubMed]
- Baddeley, A.; Eysenck, M.W.; Anderson, M.C. Memory, 2nd ed.; Psychology Press: New York, NY, USA, 2015. [Google Scholar]
- Haupt, T.C. A study of management attitudes to a performance approach to construction worker safety. J. Constr. Res. 2003, 4, 87–100. [Google Scholar] [CrossRef]
- Becker, P.; Morawetz, J. Impacts of health and safety education: Comparison of worker activities before and after training. Am. J. Ind. Med. 2004, 46, 63–70. [Google Scholar] [CrossRef] [PubMed]
- Ministry of Employment and Labor. Safety and Health Training Guide. Available online: https://www.moel.go.kr/policy/policydata/view.do?bbs_seq=20220200966 (accessed on 3 February 2025).
- Ministry of Employment and Labor. Enforcement Rules of the Industrial Safety and Health Act. Appendix 4: Training Hours by Safety and Health Education Program. Available online: https://www.law.go.kr/법령별표서식/(산업안전보건법%20시행규칙,20230928,별표4) (accessed on 3 February 2025).
- Ministry of Employment and Labor. Regulations on Safety and Health Education [Notice No. 2022-71 of the Ministry of Employment and Labor]; Ministry of Employment and Labor: Gwacheon, Republic of Korea, 2022.
- Kumar, M.N.; Kannan, B.; Thangaraj, G. Developing the safety culture through risk assessment by implementing MS-5 in toolbox talk. Int. J. Adv. Trends Eng. Technol. 2019, 65–72. [Google Scholar]
- Peters, R.H. (Ed.) Strategies for Improving Miners’ Training; Mining Publication: London, UK, 2002; Report No. 2002-156; pp. 1–54. [Google Scholar]
- Kaskutas, V.; Jaegers, L.; Dale, A.M.; Evanoff, B.A. Tool box talks: Insights for improvement. Prof. Saf. 2016, 61, 33–37. [Google Scholar]
- Harrington, D.; Materna, B.; Vannoy, J.; Scholz, P. Conducting effective tailgate trainings. Health Promot. Pract. 2009, 10, 359–369. [Google Scholar] [CrossRef] [PubMed]


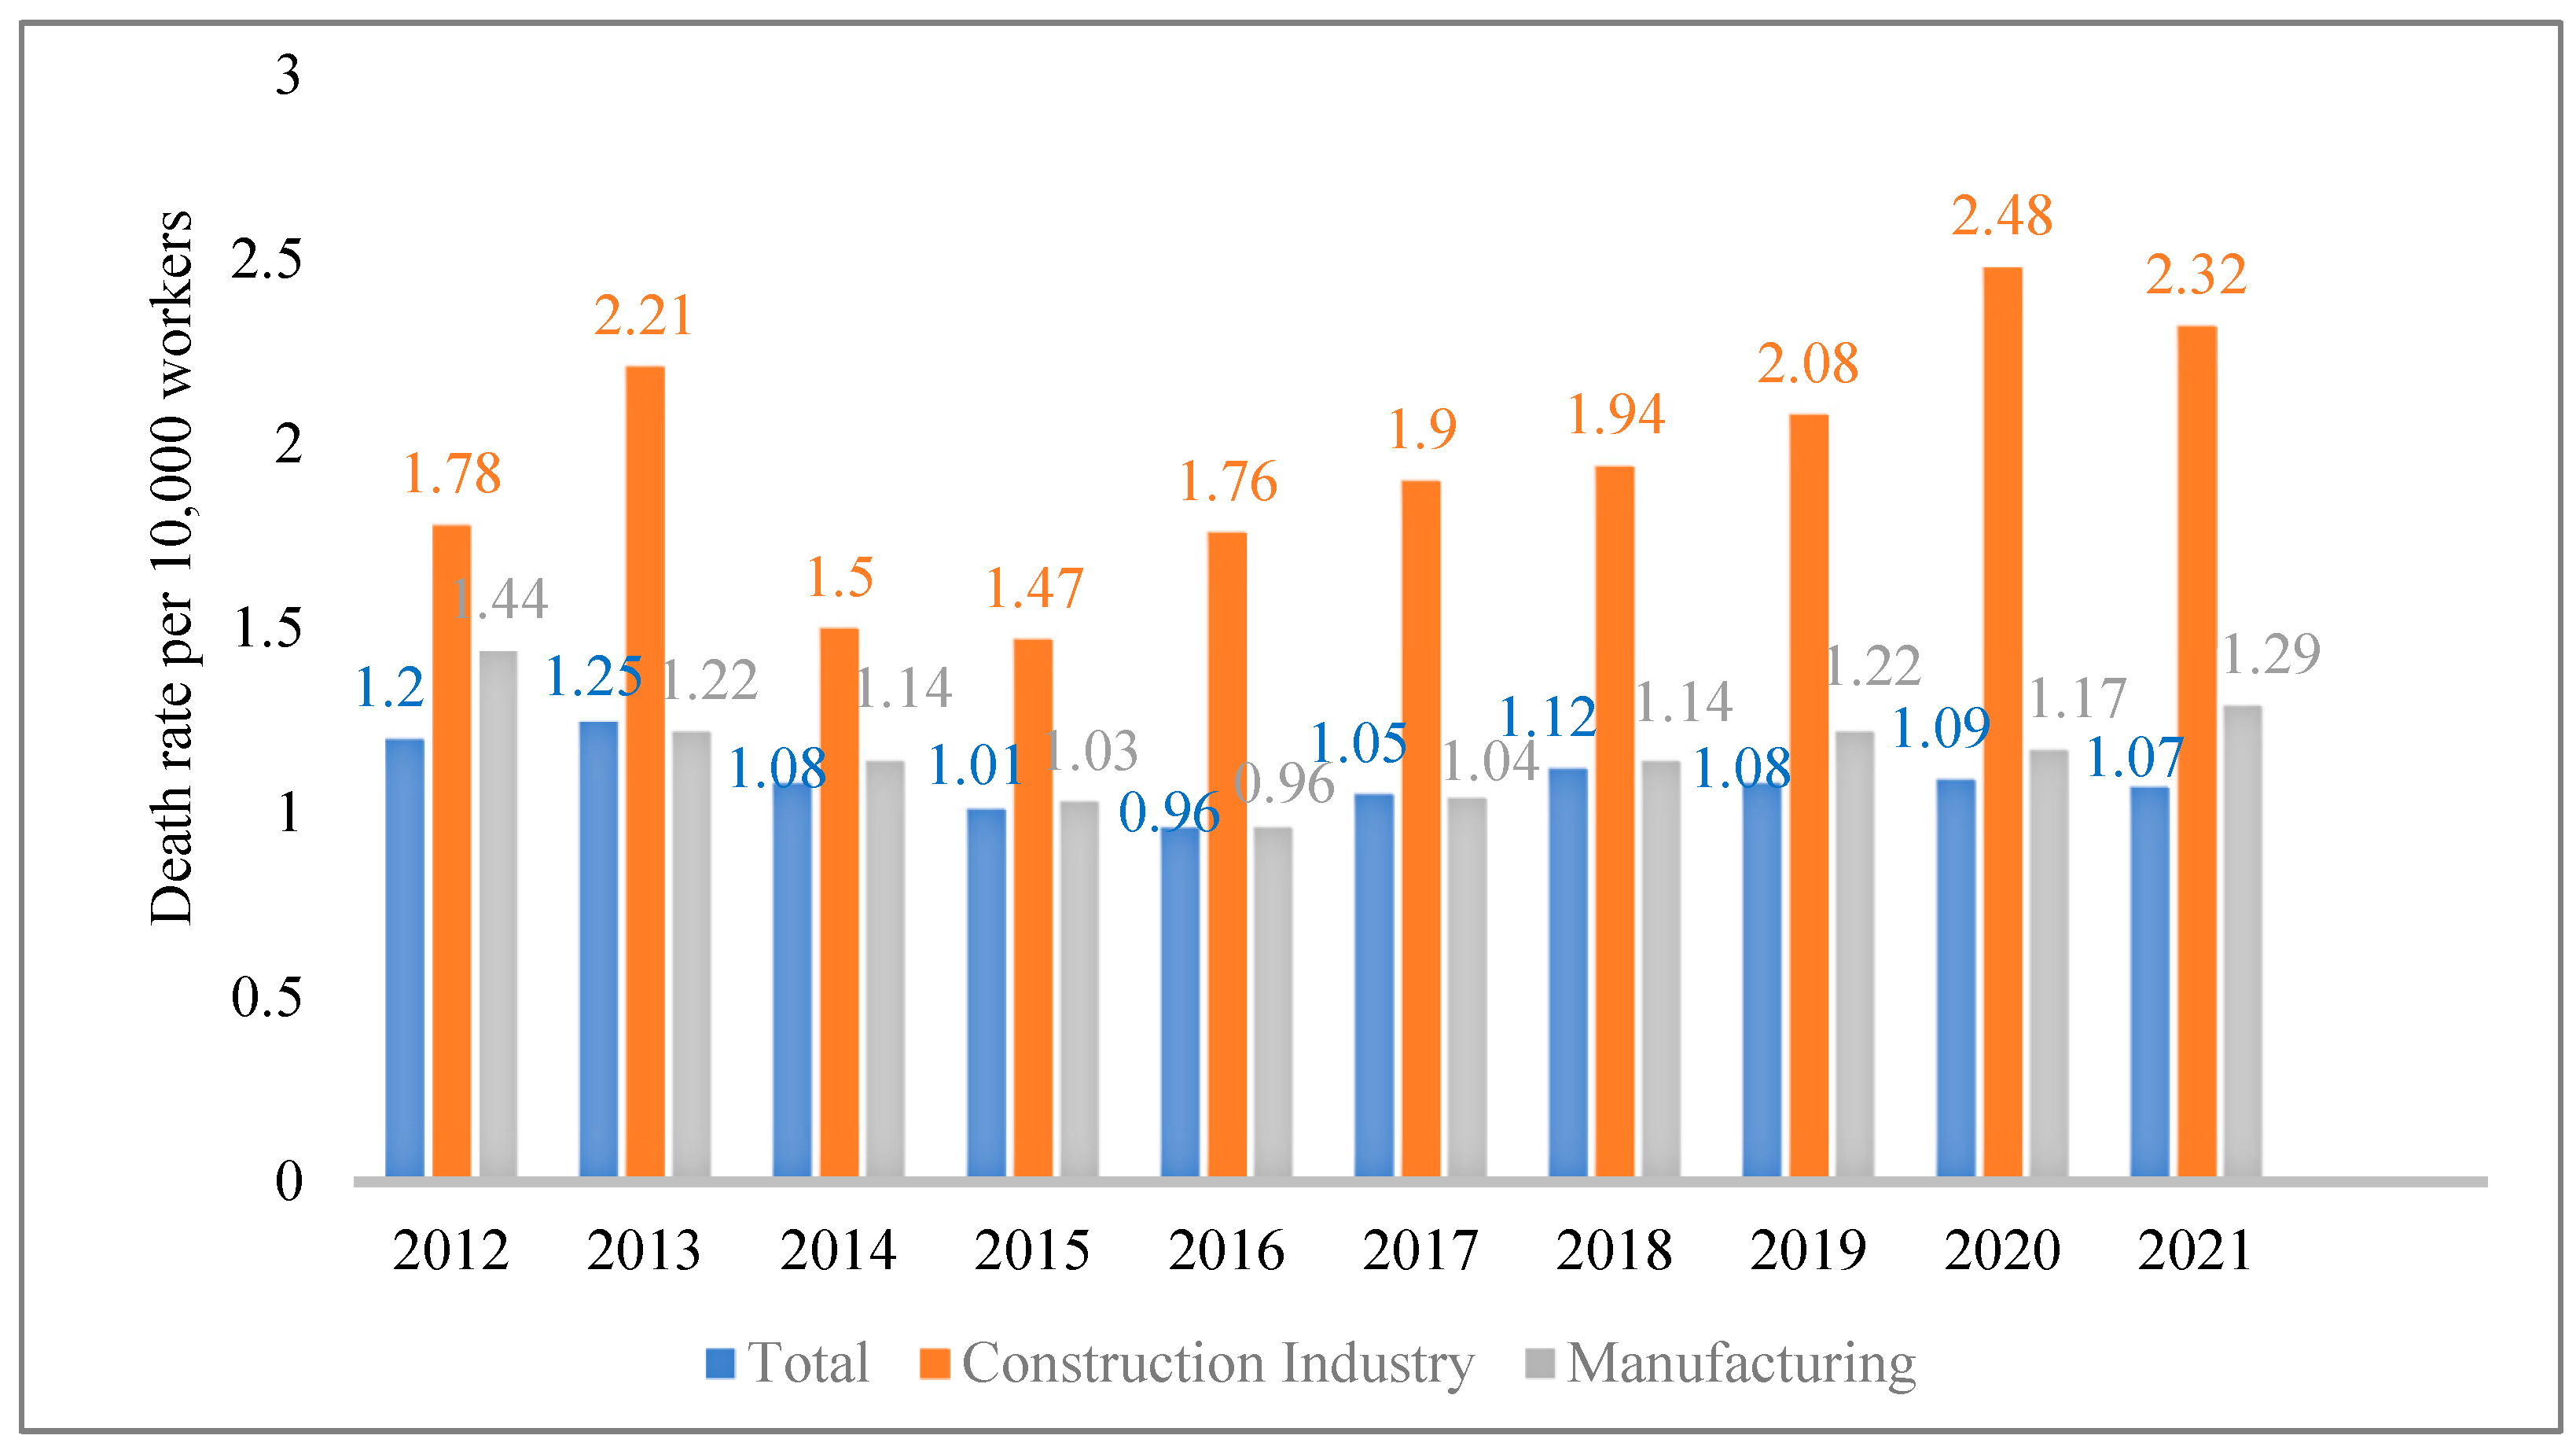
| Industry | Number of Employees | Number of Work Injury Cases | Number of Fatalities |
|---|---|---|---|
| Construction industry | 2,378,751 | 29,943 | 551 |
| Manufacturing industry | 3,959,780 | 31,709 | 512 |
| Mining industry | 10,257 | 3336 | 349 |
| Other industries | 12,957,777 | 57,725 | 668 |
| Total | 19,306,565 | 122,713 | 2080 |
| Group | Number of Items | Visual Complexity | Explanation Style |
|---|---|---|---|
| A | 13 | High | Visual-focused materials with dense information |
| B | 13 | Medium (Simplified from A) | Simplified visuals matched with verbal guidance |
| C | 8 | Medium (Same as B) | Reduced number of items for focused delivery |
| Curriculum | Target Group | Duration | Frequency | |
|---|---|---|---|---|
| Regular training | Office workers | More than 3 h | Per quarter | |
| Workers other than office workers | Workers directly engaged in sales | More than 3 h | Per quarter | |
| Workers other than those directly engaged in sales | More than 6 h | Per quarter | ||
| Manager | More than 16 h | Per year | ||
| Recruitment training | Temporary workers | More than 1 h | Per occurrence | |
| Permanent worker | More than 8 h | Per occurrence | ||
| Training for changes in work tasks | Temporary workers | More than 1 h | Per occurrence | |
| Permanent worker | More than 2 h | Per occurrence | ||
| Special training | Temporary workers engaged in specified tasks | More than 2 h | Per occurrence | |
| Temporary workers engaged in tower crane signaling work | More than 8 h | Per occurrence | ||
| Workers, excluding temporary workers, engaged in specified tasks | More than 16 h For short-term or intermittent tasks, at least 2 h. | Per occurrence | ||
| Basic safety and health training for the construction industry | Temporary workers | More than 4 h | Only once | |
| Step | Content | |
|---|---|---|
| 1 | Gathering | Meeting at the work site by work team (up to 15 people) |
| 2 | Greetings and stretching | Mutual salutation, checking physical condition, warming up, etc |
| 3 | Personal protective equipment (PPE) check | Check the condition of personal protective equipment |
| 4 | Emergency Evacuation procedures | Check emergency evacuation routes, emergency contact network, and AED location |
| 5 | Hazard prevention Training | Communicate work details, hazards, and safety measures |
| 6 | Hazardous work demonstration | Explain hazards or demonstrate safe work methods |
| 7 | Hazard identification | Clearly specify and identify hazardous factors |
| 8 | Notification delivery | All notices, conflicts with other tasks, and other necessary items |
| Group of People | Total | χ2 | |||||
|---|---|---|---|---|---|---|---|
| A | B | C | (p) | ||||
| Nationality | Local | Persons | 115 | 112 | 113 | 340 | 0.000 (1.000) |
| % | 100 | 100 | 100 | 100 | |||
| Foreigner | Persons | 0 | 0 | 0 | 0 | ||
| % | 0 | 0 | 0 | 0 | |||
| Gender | Male | Persons | 107 | 104 | 102 | 313 | 0.302 (0.860) |
| % | 93.0 | 92.0 | 91.1 | 92.1 | |||
| Female | Persons | 8 | 9 | 10 | 27 | ||
| % | 7.0 | 8.0 | 8.9 | 7.9 | |||
| Age | Twenties | Persons | 21 | 25 | 22 | 68 | 4.724 (0.803) |
| % | 18.4 | 22.1 | 19.5 | 20.0 | |||
| Thirties | Persons | 33 | 25 | 23 | 81 | ||
| % | 28.9 | 22.1 | 20.4 | 23.8 | |||
| Forties | Persons | 25 | 25 | 24 | 74 | ||
| % | 21.9 | 22.1 | 21.2 | 21.8 | |||
| Fifties | Persons | 34 | 38 | 43 | 115 | ||
| % | 29.8 | 33.6 | 38.1 | 33.8 | |||
| 60 and above | Persons | 1 | 0 | 1 | 2 | ||
| % | 0.9 | 0.0 | 0.9 | 0.6 | |||
| Construction experience | Less than one year | Persons | 28 | 35 | 43 | 106 | 15.534 (0.114) |
| % | 24.6 | 31.0 | 38.1 | 31.2 | |||
| Less than 1 to 2 years | Persons | 18 | 16 | 9 | 43 | ||
| % | 15.8 | 14.2 | 8.0 | 12.6 | |||
| Less than 2 to 3 years | Persons | 8 | 9 | 11 | 28 | ||
| % | 7.0 | 8.0 | 9.7 | 8.2 | |||
| Less than 3 to 5 years | Persons | 12 | 18 | 20 | 50 | ||
| % | 10.5 | 15.9 | 17.7 | 14.7 | |||
| Less than 5 to 10 years | Persons | 26 | 24 | 16 | 66 | ||
| % | 22.8 | 21.2 | 14.2 | 19.4 | |||
| More than 10 years | Persons | 22 | 11 | 14 | 47 | ||
| % | 19.3 | 9.7 | 12.4 | 13.8 | |||
| Accident experience | Indirect experience | Persons | 43 | 51 | 45 | 139 | 5.008 (0.286) |
| % | 37.7 | 45.1 | 39.8 | 40.9 | |||
| Direct experience | Persons | 9 | 4 | 3 | 16 | ||
| % | 7.9 | 3.5 | 2.7 | 4.7 | |||
| No experience | Persons | 62 | 58 | 65 | 185 | ||
| % | 54.4 | 51.3 | 57.5 | 54.4 | |||
| Variable | Type | Average | Standard Deviation | F | p | Post-Verification |
|---|---|---|---|---|---|---|
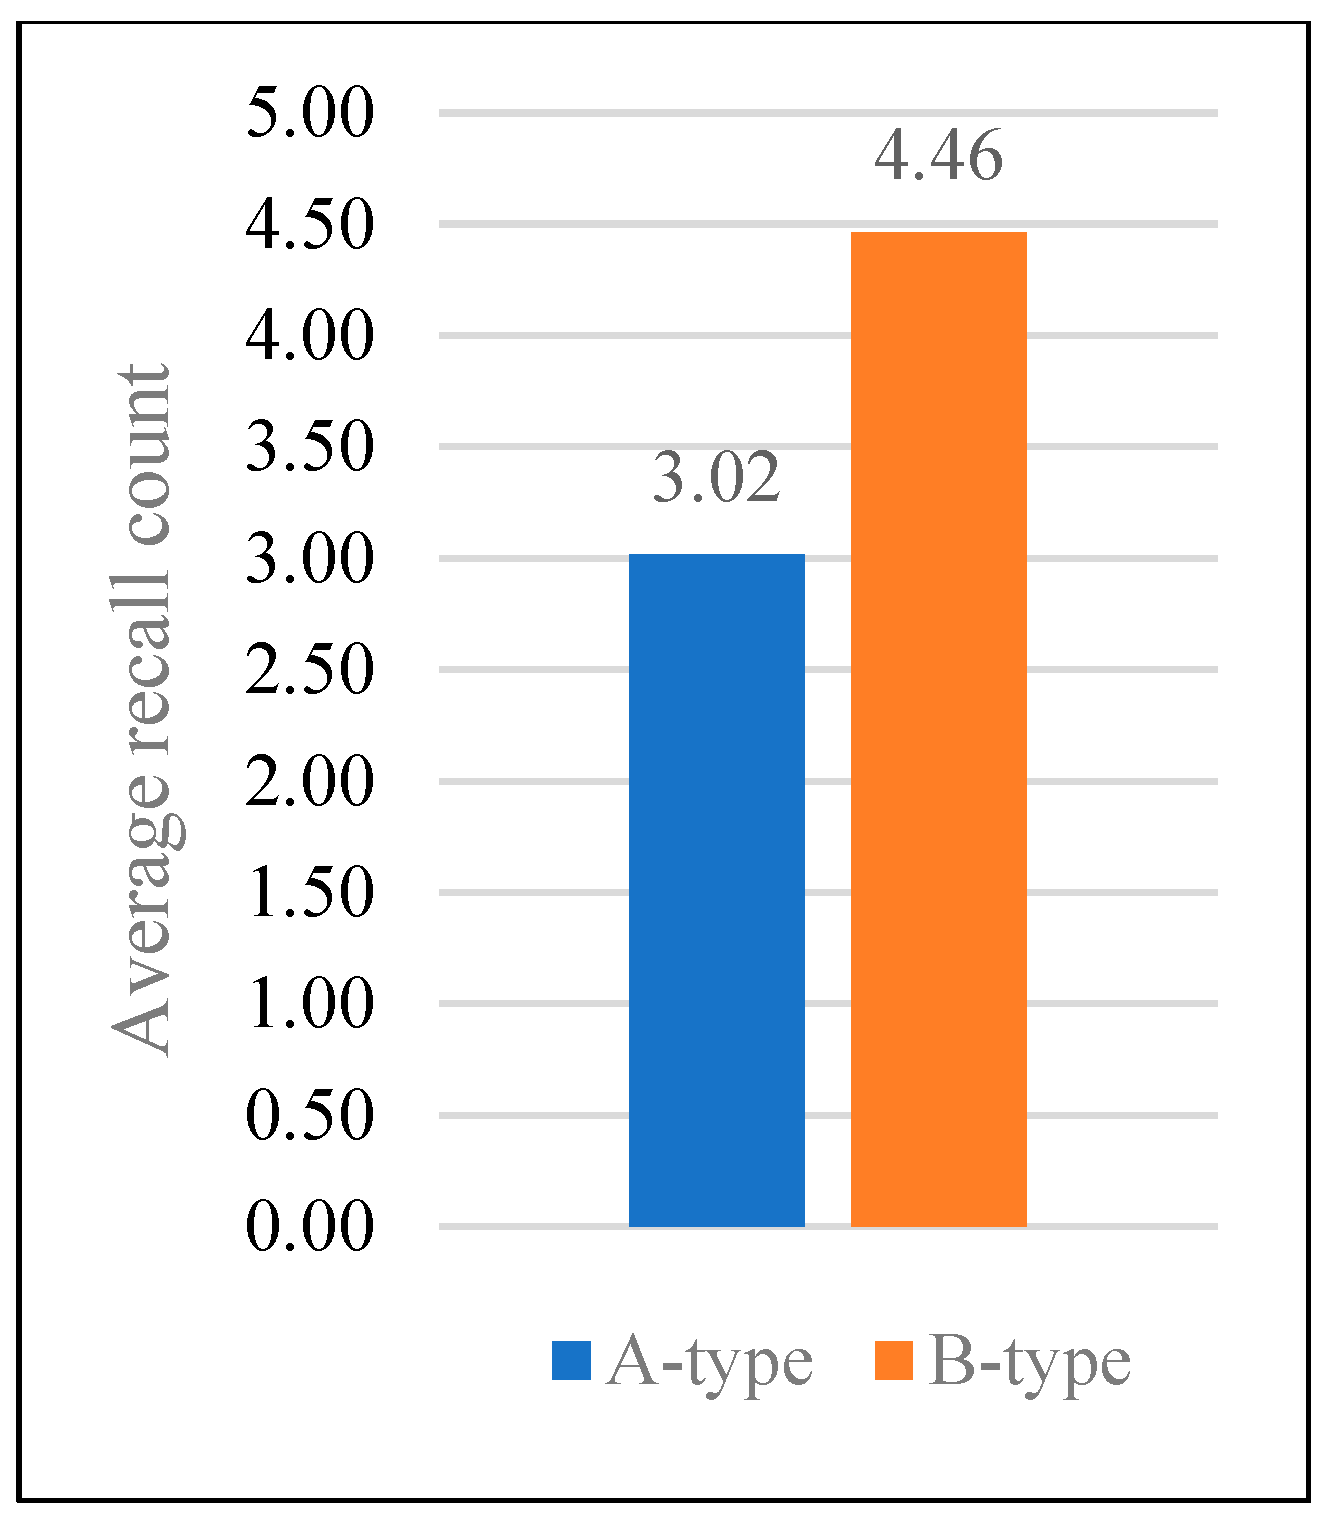
| Recall count | A | 3.02 | 2.517 | 10.441 | 0.000 ** | B,C > A |
| B | 4.46 | 2.623 | ||||
| C | 4.14 | 2.064 | ||||
| Total | 3.87 | 2.485 | ||||
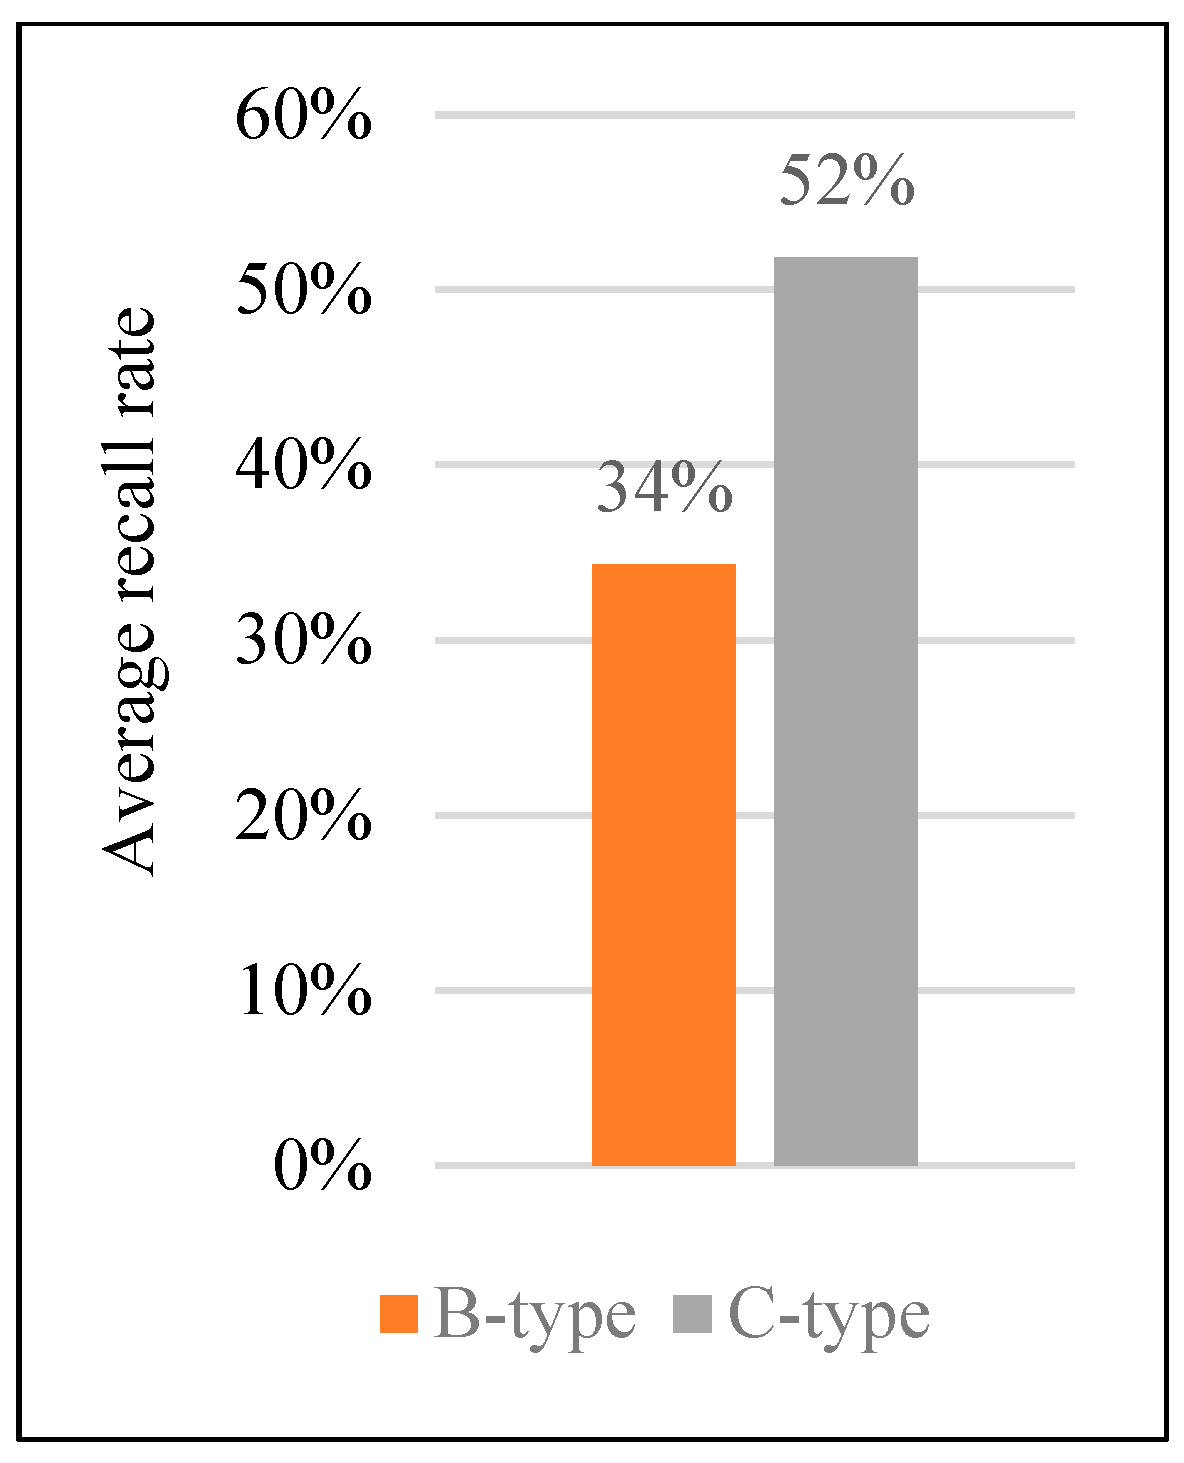
| Recall rate | A | 0.23 | 0.191 | 61.884 | 0.000 ** | C > B > A |
| B | 0.34 | 0.202 | ||||
| C | 0.52 | 0.258 | ||||
| Total | 0.35 | 0.257 |
| Variable | Type | Age | Average | Standard Deviation | F | p | Post-Verification |
|---|---|---|---|---|---|---|---|
| Recall count | A | Twenties (a) | 2.86 | 2.435 | 4.295 | 0.003 ** | d > b |
| Thirties (b) | 1.79 | 1.916 | |||||
| Forties (c) | 3.36 | 2.871 | |||||
| Fifties (d) | 4.15 | 2.376 | |||||
| 60 and over (e) | 2.00 | 0.000 | |||||
| Total | 3.04 | 2.520 | |||||
| B | Twenties | 3.56 | 2.022 | 1.569 | 0.201 | n/a | |
| Thirties | 4.44 | 2.709 | |||||
| Forties | 4.48 | 2.903 | |||||
| Fifties | 5.03 | 2.726 | |||||
| Total | 4.45 | 2.646 | |||||
| C | Twenties | 3.95 | 1.588 | 0.959 | 0.433 | n/a | |
| Thirties | 4.35 | 2.347 | |||||
| Forties | 4.42 | 2.185 | |||||
| Fifties | 3.88 | 1.966 | |||||
| 60 and over | 1.00 | 0.000 | |||||
| Total | 4.08 | 2.032 | |||||
| Recall rate | A | Twenties (a) | 0.18 | 0.173 | 4.758 | 0.001 ** | d > b,e |
| Thirties (b) | 0.10 | 0.145 | |||||
| Forties (c) | 0.20 | 0.213 | |||||
| Fifties (d) | 0.29 | 0.186 | |||||
| 60 and over (e) | 0.10 | 0.000 | |||||
| Total | 0.19 | 0.191 | |||||
| B | Twenties | 0.27 | 0.155 | 1.572 | 0.200 | n/a | |
| Thirties | 0.34 | 0.210 | |||||
| Forties | 0.35 | 0.224 | |||||
| Fifties | 0.39 | 0.211 | |||||
| Total | 0.34 | 0.204 | |||||
| C | Twenties | 0.50 | 0.199 | 0.955 | 0.436 | n/a | |
| Thirties | 0.55 | 0.293 | |||||
| Forties | 0.55 | 0.273 | |||||
| Fifties | 0.49 | 0.246 | |||||
| 60 and over | 0.13 | 0.000 | |||||
| Total | 0.51 | 0.254 |
| Variable | Type | Work Experience | Average | Standard Deviation | F | p | Post-Verification |
|---|---|---|---|---|---|---|---|
| Recall count | A | Less than one year (a) | 1.86 | 1.900 | 3.936 | 0.003 ** | d > a |
| Less than 1 to 2 years (b) | 3.22 | 2.669 | |||||
| Less than 2 to 3 years (c) | 2.13 | 2.295 | |||||
| Less than 3 to 5 years (d) | 4.75 | 2.800 | |||||
| Less than 5 to 10 years (e) | 2.69 | 2.223 | |||||
| More than 10 years (f) | 4.14 | 2.624 | |||||
| Total | 3.03 | 2.526 | |||||
| B | Less than one year (a) | 3.17 | 2.216 | 3.214 | 0.010 * | e > a | |
| Less than 1 to 2 years (b) | 4.25 | 1.732 | |||||
| Less than 2 to 3 years (c) | 5.11 | 2.205 | |||||
| Less than 3 to 5 years (d) | 5.06 | 2.999 | |||||
| Less than 5 to 10 years (e) | 5.63 | 2.975 | |||||
| More than 10 years (f) | 4.73 | 2.724 | |||||
| Total | 4.45 | 2.646 | |||||
| C | Less than one year | 3.56 | 1.803 | 1.497 | 0.197 | n/a | |
| Less than 1 to 2 years | 4.67 | 1.658 | |||||
| Less than 2 to 3 years | 3.64 | 1.963 | |||||
| Less than 3 to 5 years | 4.80 | 2.016 | |||||
| Less than 5 to 10 years | 4.50 | 2.394 | |||||
| More than 10 years | 4.14 | 2.349 | |||||
| Total | 4.08 | 2.032 | |||||
| Recall rate | A | Less than one year | 0.10 | 0.132 | 3.931 | 0.003 ** | d > a |
| Less than 1 to 2 years | 0.21 | 0.204 | |||||
| Less than 2 to 3 years | 0.11 | 0.189 | |||||
| Less than 3 to 5 years | 0.32 | 0.217 | |||||
| Less than 5 to 10 years | 0.17 | 0.165 | |||||
| More than 10 years | 0.28 | 0.205 | |||||
| Total | 0.19 | 0.191 | |||||
| B | Less than one year (a) | 0.24 | 0.171 | 3.180 | 0.010 * | e > a | |
| Less than 1 to 2 years (b) | 0.33 | 0.133 | |||||
| Less than 2 to 3 years (c) | 0.39 | 0.170 | |||||
| Less than 3 to 5 years (d) | 0.39 | 0.232 | |||||
| Less than 5 to 10 years (e) | 0.43 | 0.231 | |||||
| More than 10 years (f) | 0.36 | 0.210 | |||||
| Total | 0.34 | 0.204 | |||||
| C | Less than one year | 0.45 | 0.225 | 1.492 | 0.198 | n/a | |
| Less than 1 to 2 years | 0.58 | 0.208 | |||||
| Less than 2 to 3 years | 0.46 | 0.244 | |||||
| Less than 3 to 5 years | 0.60 | 0.251 | |||||
| Less than 5 to 10 years | 0.56 | 0.300 | |||||
| More than 10 years | 0.52 | 0.294 | |||||
| Total | 0.51 | 0.254 |
| Variable | Type | Position | Average | Standard Deviation | F | p | Post-Verification |
|---|---|---|---|---|---|---|---|
| Recall count | A | Team leader | 3.46 | 2.883 | 1.897 | 0.155 | n/a |
| Technical position | 3.12 | 2.286 | |||||
| Non-technical position | 2.23 | 2.338 | |||||
| Total | 3.03 | 2.526 | |||||
| B | Team leader | 4.45 | 2.296 | 0.779 | 0.461 | n/a | |
| Technical position | 4.66 | 2.805 | |||||
| Non-technical position | 3.93 | 2.344 | |||||
| Total | 4.45 | 2.646 | |||||
| C | Team leader | 3.89 | 2.804 | 0.544 | 0.582 | n/a | |
| Technical position | 4.25 | 2.071 | |||||
| Non-technical position | 3.83 | 1.807 | |||||
| Total | 4.06 | 2.033 | |||||
| Recall rate | A | Team leader | 0.22 | 0.216 | 2.022 | 0.137 | n/a |
| Technical position | 0.20 | 0.178 | |||||
| Non-technical position | 0.13 | 0.171 | |||||
| Total | 0.19 | 0.191 | |||||
| B | Team leader | 0.34 | 0.176 | 0.774 | 0.464 | n/a | |
| Technical position | 0.36 | 0.217 | |||||
| Non-technical position | 0.30 | 0.181 | |||||
| Total | 0.34 | 0.204 | |||||
| C | Team leader | 0.49 | 0.350 | 0.548 | 0.580 | n/a | |
| Technical position | 0.53 | 0.259 | |||||
| Non-technical position | 0.48 | 0.226 | |||||
| Total | 0.51 | 0.254 |
| Variable | Type | Accident Experience | Average | Standard Deviation | F | p | Post-Verification |
|---|---|---|---|---|---|---|---|
| Recall count | A | Indirect | 3.37 | 2.582 | 0.964 | 0.384 | n/a |
| Direct | 3.44 | 3.046 | |||||
| No | 2.73 | 2.410 | |||||
| Total | 3.03 | 2.526 | |||||
| B | Indirect | 4.92 | 2.741 | 2.394 | 0.096 | n/a | |
| Direct | 5.75 | 3.202 | |||||
| No | 3.95 | 2.460 | |||||
| Total | 4.45 | 2.646 | |||||
| C | Indirect | 4.31 | 2.076 | 0.615 | 0.543 | n/a | |
| Direct | 3.33 | 3.215 | |||||
| No | 3.95 | 1.964 | |||||
| Total | 4.08 | 2.032 | |||||
| Recall rate | A | Indirect | 0.22 | 0.195 | 0.951 | 0.389 | n/a |
| Direct | 0.22 | 0.228 | |||||
| No | 0.17 | 0.184 | |||||
| Total | 0.19 | 0.191 | |||||
| B | Indirect | 0.38 | 0.212 | 2.413 | 0.094 | n/a | |
| Direct | 0.45 | 0.246 | |||||
| No | 0.30 | 0.190 | |||||
| Total | 0.34 | 0.204 | |||||
| C | Indirect | 0.54 | 0.259 | 0.603 | 0.549 | n/a | |
| Direct | 0.42 | 0.403 | |||||
| No | 0.50 | 0.246 | |||||
| Total | 0.51 | 0.254 |
Disclaimer/Publisher’s Note: The statements, opinions and data contained in all publications are solely those of the individual author(s) and contributor(s) and not of MDPI and/or the editor(s). MDPI and/or the editor(s) disclaim responsibility for any injury to people or property resulting from any ideas, methods, instructions or products referred to in the content. |
© 2025 by the authors. Licensee MDPI, Basel, Switzerland. This article is an open access article distributed under the terms and conditions of the Creative Commons Attribution (CC BY) license (https://creativecommons.org/licenses/by/4.0/).
Share and Cite
Bang, D.P.; Kwon, Y.B.; Choi, D.C.; Park, J.Y. A Study on the Effectiveness of Tool Box Meeting Educational Materials Based on Information Quantity. Appl. Sci. 2025, 15, 7650. https://doi.org/10.3390/app15147650
Bang DP, Kwon YB, Choi DC, Park JY. A Study on the Effectiveness of Tool Box Meeting Educational Materials Based on Information Quantity. Applied Sciences. 2025; 15(14):7650. https://doi.org/10.3390/app15147650
Chicago/Turabian StyleBang, Dae Pyeong, Young Beom Kwon, Doo Chun Choi, and Jong Yil Park. 2025. "A Study on the Effectiveness of Tool Box Meeting Educational Materials Based on Information Quantity" Applied Sciences 15, no. 14: 7650. https://doi.org/10.3390/app15147650
APA StyleBang, D. P., Kwon, Y. B., Choi, D. C., & Park, J. Y. (2025). A Study on the Effectiveness of Tool Box Meeting Educational Materials Based on Information Quantity. Applied Sciences, 15(14), 7650. https://doi.org/10.3390/app15147650