Article

Mobile Mapping Approach to Apply Innovative Approaches for Real Estate Asset Management: A Case Study

by
Giorgio P. M. Vassena
3DGeoLab, Department DICATAM, University of Brescia, 25123 Brescia, Italy
Appl. Sci. 2025, 15(14), 7638; https://doi.org/10.3390/app15147638
Submission received: 14 February 2025 / Revised: 4 April 2025 / Accepted: 23 April 2025 / Published: 8 July 2025
(This article belongs to the Section Civil Engineering)

Abstract

Technological development has strongly impacted all processes related to the design, construction, and management of real estate assets. In fact, the introduction of the BIM approach has required the application of three-dimensional survey technologies, and in particular the use of LiDAR instruments, both in their static (TLS—terrestrial laser scanner) and dynamic (iMMS—indoor mobile mapping system) implementations. Operators and developers of LiDAR technologies, for the implementation of scan-to-BIM procedures, initially placed particular care on the 3D surveying accuracy obtainable from such tools. The incorporation of RGB sensors into these instruments has progressively expanded LiDAR-based applications from essential topographic surveying to geospatial applications, where the emphasis is no longer on the accurate three-dimensional reconstruction of buildings but on the capability to create three-dimensional image-based visualizations, such as virtual tours, which allow the recognition of assets located in every area of the buildings. Although much has been written about obtaining the best possible accuracy for extensive asset surveying of large-scale building complexes using iMMS systems, it is now essential to develop and define suitable procedures for controlling such kinds of surveying, targeted at specific geospatial applications. We especially address the design, field acquisition, quality control, and mass data management techniques that might be used in such complex environments. This work aims to contribute by defining the technical specifications for the implementation of geospatial mapping of vast asset survey activities involving significant building sites utilizing iMMS instrumentation. Three-dimensional models can also facilitate virtual tours, enable local measurements inside rooms, and particularly support the subsequent integration of self-locating image-based technologies that can efficiently perform field updates of surveyed databases.

1. Introduction

The construction and real estate sectors are undergoing a significant transformation due to the implementation of the BIM approach, which is increasingly being required by various global standards. Indeed, BIM technology possesses significant potential to enhance automation within the Architecture, Engineering, and Construction (AEC) sector and is progressively becoming a standard in numerous nations [1,2,3,4,5,6,7,8,9,10,11,12].
Based on the assumption that the BIM model is available when working on construction sites and particularly when managing large building assets, a number of technologies have been developed through dedicated software platforms that enable the tracking and asset management phases of even extensive building assets. Specifically, some application platforms allow the recognition of assets in the field while concurrently geo-locating them by using images acquired by mobile cameras. Consequently, appropriate software platforms facilitate centralized asset management through the population of management databases and enable sophisticated functionalities that permit field operators to autonomously find out where they are within the building and identify and “tag” objects and elements in the field, thus allowing real time compilation and updating of what is happening in the field, rather than merely managing the collection of such valuable information and data in real time from the operations center.
Unfortunately, although it is possible to tag objects in images, in the absence of a three-dimensional model of the surveyed environments, it is not possible to geolocate the detected objects. A possible solution could consist in the use of instruments capable of simultaneously acquiring both the three-dimensionality of the environments and high-quality photographs, such as the latest generation laser scanners such as the Z+F IMAGER® 5010C with the HDR I-Cam camera [13], but the timelines and, consequently, the costs of such survey activities are incompatible with the timelines of a rapid acquisition of assets in the field using the previously described systems [14].
An interesting technological innovation has been the introduction of high resolution cameras within iMMS systems. These instruments are highly competitive in terms of accuracy and acquisition speed of the three-dimensional component, allowing for the simultaneous capture of high-quality/high resolution images. This has enabled the use of these devices even for applications within large real estate portfolios, offering sustainable advantages in terms of surveying time and costs compared to the static laser scanning method. Through camera integration, iMMS systems simultaneously provide the recognition and geolocation of assets, the generation of site maps, and the enabling of three-dimensional measurements throughout buildings. Web-based virtual tour navigation within the buildings can also be implemented, and a 3D point cloud of the site can be obtained.
The article presents, in Section 2, “State of the art of systems for Indoor Mobile Mapping (iMMS)”, the evolution over time and the state-of-the-art of indoor mobile mapping (iMMS) technologies and possible future developments, highlighting the characteristics, merits, and limitations of this approach for geospatial applications.
Section 3, ‘Building Asset Facility Management’ introduces the concept of building asset management, explores the technologies currently used for this purpose, and discusses how mobile mapping devices can contribute to the field.
Section 4, ‘A Case Study in Milan, Italy’, describes the successful case study conducted at the Municipality of Milan, where iMMS technologies were used to carry out an asset census of the municipality’s entire housing property stock. A major real estate asset management company initiated the project to rapidly perform geometric surveying, inventory, and updating of assets within the housing portfolio.
Section 5, ‘Instruments Used in Milan and the Specific Mapping Approach Applied to the Case Study’, discusses the application of iMMS technology for asset surveying. It provides a detailed analysis of the technical choices made, including sensors, instruments, and surveying procedures.
Section 6, “Milan Project: Technical Specifications and Procedures to Ensure High-Quality Work”, provides a detailed overview of the procedures applied in the City of Milan surveying project, focusing on the organization of surveying activities and the measures adopted to ensure high-quality execution.
Section 7, ‘Assets recognition from images and populating the database’, provides a detailed description of the survey process, allowing technicians to navigate virtual tours within the three-dimensional photographic model to identify building assets in the images.
Section 8, ‘Archiving of Surveyed Data and Management of Survey Results’, explains the data flow and the process used by the project developer to archive the survey results.
Section 9, ‘Major Project Issues and Survey Results’, highlights key challenges encountered during the project’s execution and presents examples of outliers identified during the survey activities.
Section 10, ‘Discussion and Future Developments’, offers general reflections on the project’s implementation and explores potential future applications of technological innovations in projects similar to the Milan project. It also presents possible directions for further studies and advancements.
Section 11, ‘Conclusions’, summarizes key insights and considerations that emerged from the project, emphasizing how this initiative aligns with recent technological advancements.

2. State-of-the-Art of Systems for Indoor Mobile Mapping (iMMS)

The increasing demand for three-dimensional surveys to extract BIM models of existing buildings has been accompanied by the increasingly widespread use of terrestrial laser scanners (TLSs) [15,16,17,18,19,20,21]. In all those cases where restoration or renovation of an existing building is to be carried out, if the project is to be realized with a BIM approach, it is necessary to do a three-dimensional survey and then an extraction from the point cloud model of a parametric model. The laser scanner survey operation and subsequent modeling of pipes, pipelines, and tanks have rapidly become standard in industrial settings, particularly in oil and gas facilities, where the operation, known as “scan to BIM”, has found rapid application and success [22,23]. The regular and standard geometries of the service networks of these facilities have rapidly demonstrated the high effectiveness and productivity of automatic or semi-automatic geometry recognition, in particular in oil and gas environments using point clouds acquired by static laser scanners [17,23,24,25].
In contrast, in the fields of construction and real estate, these tools are significantly less effective. Consequently, the modeling operations, specifically the scan-to-BIM process, are primarily based on the operator’s manual actions, resulting in significant costs and time. Nevertheless, operational issues remain to be resolved and effectively managed, such as using artificial intelligence algorithms. The scan to BIM in real estate and construction is primarily based on the creation of catalogs of known geometries, which the operator has to recognize and apply to the point cloud model of reality, rather than on processes that allow the automatic extraction of geometries from the point cloud [26,27].
The scan-to-BIM process is challenging for many projects with restricted budgets. Because of this challenge, the laser scanner is frequently employed in surveying applications on existing buildings, resulting in the production of 2D representations of floor plans and elevations. The point cloud is used just to extract point cloud profiles, and the restitution of the floor plans, profiles, sections, and elevations to CAD is performed manually by operators. Consequently, the BIM model is generated by starting from the floor plans and manually adding the heights measured by the laser scanner model into the modeling software. Further difficulties that have limited the laser scanner’s widespread adoption are attributable to the fact that to merge the three-dimensional scans obtained from various stationing positions with the laser scanner, each scan must observe at least three targets that are common to the adjacent scans. The processing times required to obtain the complete point cloud model, in the case of buildings with a regular structure such as those described in this article, are nevertheless lengthy, with an estimated duration of approximately three times the time required to scan the point cloud in the field. The processing time can be much longer in the case of more complex buildings, as stated by Naif Adel Haddad [13] “the amount of energy and time to create an accurate and faultless model is many times larger than scanning time (roughly by factor 5 to 10 or even more)”.
Initially, this issue was one of the main challenges that data-processing software developers and TLS instrument manufacturers attempted to speed up the alignment processes between scans. The operation of locating and recognizing targets or markers used to align adjacent scans, as well as the on-the-field displacement of printed targets or spheres, are time-consuming procedures. On the other hand, the effectiveness of automatic alignment algorithms might not produce accurate and stable results [28,29,30,31,32]. For this reason, the utilization of targets for align scans is still prevalent in outstanding applications, as it ensures the quality and accuracy of the registration process.
Consequently, if it is necessary for engineering reasons to extract a BIM model of a site, it is necessary to run a TLS survey, resulting in the incurred costs of this operation. In the circumstance that the BIM model is only functional for facilitating the implementation of digital procedures to improve the efficiency of building management procedures, as in our scenario, these expenses are totally unrealistic.
The introduction of mobile surveying technologies has been a significant contributor to the reduction of surveying costs in this context. It was around the year 2000 that the scientific community became interested in the development of mobile mapping systems (MMS) [33,34,35].
The market saw the emergence of surveying systems based on mobile mapping technology between the years 2000 and 2005. These instruments were equipped with a LiDAR sensor, a camera, an inertial IMU system, a DMI, and GNSS receivers [36]. Outdoor mobile mapping systems can efficiently map extensive open areas, such as metropolitan centers and infrastructure. Nevertheless, outdoor mobile mapping systems have not influenced the construction and civil engineering sectors, as their operation relies on determining the instrument’s position using the GNSS approach, either in real time kinematic (RTK) mode or through post-processing. However, in buildings and residential construction, GNSS signals are often untrackable. This issue has typically restricted the use of outdoor mobile mapping instruments in these environments [37,38,39,40].
Since the 1990s, researchers, particularly in the field of robotics, have been developing and testing algorithms for self-localizing robots in confined environments, such as warehouses. Such an algorithm is known as SLAM (Simultaneous Localization and Mapping), a concept proposed and defined by Smith in 1986 [41], which permits an instrument equipped with appropriate sensors to autonomously determine its position within a building or a three-dimensional environment (initially applications involved automatic positioning within automated warehouses) simply by observing its own position with respect to a 3D panorama of fixed elements in space, such as walls, floors, and pillars [42,43,44]. By analyzing the changes in its position relative to a static environment, the instrument applies SLAM algorithms to estimate its trajectory and achieve self-localization within that environment. Consequently, the device can indirectly survey the 3D geometry of the surroundings. This solution allows operation in environments where GNSS signals are not receivable and can therefore be employed indoors, hence the designation of indoor mobile mapping systems (iMMS).
The SLAM positioning and 3D survey were initially introduced in robotics, allowing a robot to estimate its own position and orientation in space, thanks to measurements of multi-beam Lidar and IMU sensors, starting from an unknown location [45]. Commercial SLAM solutions for professional operators began to emerge in the 2010s, and these devices primarily started using multi-beam LiDAR sensors from the automotive sector, coupled with IMU sensors of variable accuracy [46,47].
At the moment, SLAM-based iMMS offers efficient indoor surveys within buildings, urban areas, tunnels, and underground mines, with extremely fast timelines and local accuracies in the range of approximately 5 mm/2 cm. There are also numerous applications in environmental, geospatial, cultural heritage, and even BIM modeling [48,49]. In fact, it is possible to utilize the point cloud generated by these systems for BIM modeling [50], which is used for BIM with a Level of Development (LoD) classification compatible with the accuracies of the iMMS. The main limitation of such solutions lies primarily in local accuracy and in the geometric drift that affects the SLAM algorithm, in particular in medium- to large-scale surveys. In order to reduce the effects of such geometric drift, numerous SLAM-based tools are forced to ensure that the starting point of the mapping procedure coincides with the endpoint of the survey [51].
Nonetheless, these technologies have the significant advantage of facilitating the rapid survey of large sites, producing survey accuracies frequently aligned with the requirements of a real estate rehabilitation project, typically within 1–2 cm locally and several centimeters in the global model. SLAM technology greatly simplifies field measuring processes while simultaneously reducing their costs. Since centimeter-level accuracy is not required for the global model in geospatial projects, the setup of control points or control scans can be abandoned in such applications [52,53]. An important advantage of SLAM-based iMMS techniques is the ability to operate in hybrid environments, which include both outdoor and indoor conditions, with the primary constraint being the need for adequate three-dimensional geometry in the surveyed areas [54,55]. This limitation precludes open areas lacking geometrical features, such as broad spaces characterized by highly regular geometries, such as regular concrete road tunnels. Moreover, SLAM requires that the surveyed geometry remain stable, and consequently, measurements in densely vegetated areas with strong winds that cause significant leaf movement should be avoided.
The data processing approach of static laser scanners differs substantially from the process of producing the point cloud from iMMS instruments. The point cloud generated in a post-processing phase by the SLAM algorithm does not perfectly match the data acquired by the LiDAR sensor. First of all, the operator’s trajectory is estimated by the SLAM algorithm by combining the raw data acquired by the LiDAR sensor and the IMU. Such an operation is performed in post-processing, and various system manufacturers and research teams have developed proprietary solutions to improve and optimize the estimation of the instrument’s trajectory [56]. For example, the research group at the JRC of the European Commission has developed the local maps approach [57], which consists of “a robust Global Matching technique focused on 3D mapping applications using laser range finders”. The method operates on the presumption that the projection of the observed coordinates along the gravity direction during the mapping process can identify locations. By aligning their 2D projective representations and utilizing the corresponding dimensional reduction, the relative poses between pairs of 3D point clouds are calculated in order to improve the trajectory evaluation performed by the SLAM algorithm. After the trajectory is estimated, the software generates the point cloud at the required resolution, taking into account any geometric constraints, which typically consist of control points. It is obvious that the quality of the point cloud model generated is directly correlated with the accuracy of the trajectory estimation provided by the instrument.
Consequently, surveyors familiar with TLS devices may find it contradictory that remaining stationary with the iMMS device during the acquisition, for instance in a specific area of a building, significantly increases the amount of data to be processed but does not increase the density of the point cloud model that the system will generate at the conclusion of the post-processing process.
Finally, we can conclude that the introduction of the SLAM solution has immediately represented a valuable aid in making surveying operations of large real estate complexes faster and more sustainable [58,59,60]. For the first SLAM-based systems, the most significant limitation was the high level of noise of the three-dimensional data and the geometric drifts affecting the trajectory estimated by the algorithm. For these reasons, SLAM devices have been utilized primarily in applications where the main goal was not to achieve high accuracy in three-dimensional surveying. Experiences such as Microsoft’s indoor localization competition [61] or IPIN (International Conference on Indoor Navigation and Positioning) [62,63] have made significant and valuable contributions to the development of SLAM algorithms [64,65,66,67,68,69].
To use such systems for the surveying of building geometries and for the geolocation of objects and their attributes, which is the focus of this contribution, it is essential to concurrently capture images of the navigated environments along with geometries. Initially, systems capable of acquiring geometries and simultaneously capturing high-quality images were limited to equipment mounted on mobile trolleys, such as Viametris® iMS3D (Louverné, France) [69,70], NAVVIS® M3 (Munich, Germany) [71,72], and Trimble® (Westmister, CO, USA) TIMMS [73,74].
The main advantage of such instruments was clearly to relieve the operator from carrying heavy instruments and to provide high resolution images. On the other hand, managing such a large number of high resolution images required a sufficiently powerful data processing unit and, consequently, an adequate battery pack. The combined effect of the two components resulted in significant weight of the PC and batteries, necessitating the use of trolleys (Figure 1) to move the instrument. This significantly restricted the use of such solutions in complex locations such as multi-level building sites and industrial facilities due to the difficulty of accessing and moving with a trolley in areas with stairs, steps, and uneven surfaces.
Without going into the specifics of obsolete platforms, modern developments have transformed these systems into solutions that are more manageable for operators. Examples of such instruments include the Gexcel Heron® Twin Color (Brescia, Italy) (Figure 2) [75,76], Viametris® MS-96 [77], and NAVVIS® [78,79] (Figure 3a) and Leica® BLK2Go® (Heerbrugg, Switzerland) [80,81] (Figure 3b), which, despite employing different solutions, stand out by increased portability, with wearable solutions that can be carried on the operator’s shoulders, facilitating access to multi-level buildings or construction sites.
The latest wearable solutions are also enriched by synchronized panoramic cameras that support the generation of colorized three-dimensional models and particularly allow the production of virtual tours inside the mapped areas. This enables the easy identification of objects and elements within the scanned sites while enabling their localization, the measurement of interior geometries, and the acquisition of three-dimensional data if BIM model extraction is required.
Portable systems can now be used in an affordable and logistically feasible way for the 3D mapping of complexes in the geospatial domain, extending beyond strictly topographical contexts [69].

3. Building Asset Facility Management

As stated in the introduction, the purpose of this article is to investigate how mobile mapping technologies can facilitate the use of new technologies for locating, identifying, and cataloging assets inside buildings. This is particularly relevant for managing large real estate portfolios.

3.1. A General Introduction to Building Asset Management

Facility management is becoming increasingly important in the building restoration and maintenance industry due to its ability to streamline processes and significantly reduce management costs. A field survey of assets for large real estate properties serves to update and enrich the asset information that, in technical terms, accompanies the database already available within the management information system of the company responsible for managing the buildings.
Numerous experiences have shown that the asset survey must enable:
  • Increasing the amount of data available, while correcting any errors and inaccuracies in the information system;
  • Providing the property manager with valuable support in overseeing the financial aspects and resources designated for facility operations, as well as evaluating and managing expenses associated with building maintenance, repairs, renovations, and utilities to ensure the efficient allocation of resources;
  • Overseeing and authorizing contracts and service providers for various services, including sanitation, cleaning, and security;
  • Conducting routine inspections, modifications, and maintenance to guarantee the facility’s daily operations;
  • Improving the management of flat relocations;
  • Overseeing the proper maintenance of essential services, including heating and water
  • Ensuring facilities comply with government regulations, health and safety standards, and energy efficiency requirements;
  • Supervising teams of employees or third-party contractors responsible for security, maintenance, and cleaning;
  • Supervising the implementation of improvements and upgrades;
  • Facilitating the design of exceptional maintenance work and optimizing the scope of contracts for the procurement of works, goods, and services;
  • Possessing the necessary indicators to conduct comprehensive analyses of asset management performance and potential development scenarios.
At present, the collection of primary site geometry and the cataloging and inventory of a large amount of data are primarily conducted using various software applications. These applications typically rely on digital devices, such as cameras or notepads, to gather field data. Surveyors use a tablet with a floor plan, usually in PDF format, as a backdrop, walking through the building while geolocating information using dedicated software [82]. Consequently, several applications have been developed to facilitate and regulate such activities. For example, Acca®’s applications (Bagnoli Irvino, Italy) [83] are widely used in Italy, where this case study is conducted. However, numerous other software applications, often originating from the construction sector and categorized under the term “building asset management software”, include tools such as Asset Panda® (Frisco, YX, USA) [84], Faciliteasy® (Tamil Nadu, India) [85], Asolvi® (Trondheim, Norway) [86], and UpKeep® (Los Angeles, CA, USA) [87], to name a few of the most popular. These platforms offer capabilities, such as inventory management, inspection, maintenance management, and the scheduling and planning of maintenance activities. Nearly all of these programs also feature field apps for data acquisition in situ.
An operator, visiting the building according to the PDF floor plans of the various levels, may match each location (e.g., room, lobby, hallway, etc.) with the collection of assets and items located within that specific area. Consequently, it is possible to execute the cataloging and inventorying of sensors and assets inside the building (such as temperature sensors, fire sensors, intrusion sensors, etc.), rather than cataloging the location and attributes of lighting, doors, locks, switches, plugs, and speakers. Such programs frequently incorporate advanced functionalities for site document management, cost analysis, and maintenance and asset management operations. These programs can automatically run if the building plans and/or the corresponding BIM model are available. Data collection activities for populating building asset databases are conducted manually by operators and typically do not allow dimensional measurements, such as the dimension of doors or the height of a parapet or electric button from the ground.

3.2. iMMS Platforms for Asset Management Applications: General Principles

The software-based systems discussed in Section 3.1, particularly those using tablets to upload maps of visited areas, have evident disadvantages. Building plans must be available, object recognition must be performed by the operator in the field without a photographic record of the current condition, and 3D measurements cannot be taken. Additionally, 3D measurements of the entire or partial environments traversed cannot be extracted. The introduction of mobile mapping devices integrated with high-quality cameras has expanded the potential uses of iMMS systems. Initially developed as self-locating devices and later used for rapid surveys in indoor environments, iMMS instruments can now efficiently record assets in various contexts, thus supporting geospatial applications (Figure 4 and Figure 5).
Moreover, alongside the three-dimensional survey of the sites, the imaging features enable the recognition of assets within buildings and allow for three-dimensional measurements. In addition, if not yet available, it is possible to obtain floor plans or elevations of buildings.
SLAM surveying allows, at the same time, to be employed for classical surveying activities, while photographic acquisitions can be used for the recognition and positioning of assets within buildings, as well as for evidentiary documentation of the actual state of a building. By positioning, in this case, we do not mean just the spatial coordinates of where such an asset is located, but rather the knowledge of the environment in which the assets are situated. For example, knowing the location of a fire extinguisher placed inside a building means also being able to indicate in which room, in which building, and on what floor of that building the fire extinguisher is located. This example illustrates that the way to carry out a classic survey with iMMS instrumentation aimed at topographic mapping of a building is radically different from the process for an asset survey activity. Different objectives are pursued with different methods and procedures, which will be appropriately described in the following paragraphs. Surveying with dynamic instrumentation, therefore, allows for the production of different deliverables.
The deliverables that can be obtained from iMMS instruments are analyzed in the following paragraphs, where the challenges and methods for extracting these products are described, along with general operational advice based on activities focused on asset management rather than accurate 3D topographic surveying. Depending on the deliverables to be extracted from a survey using dynamic instrumentation, the choice of iMMS instrumentation to be used in surveying activities is also determined. The following paragraphs aim to provide guidelines for selecting mobile surveying systems based on the deliverables intended for asset management activities.

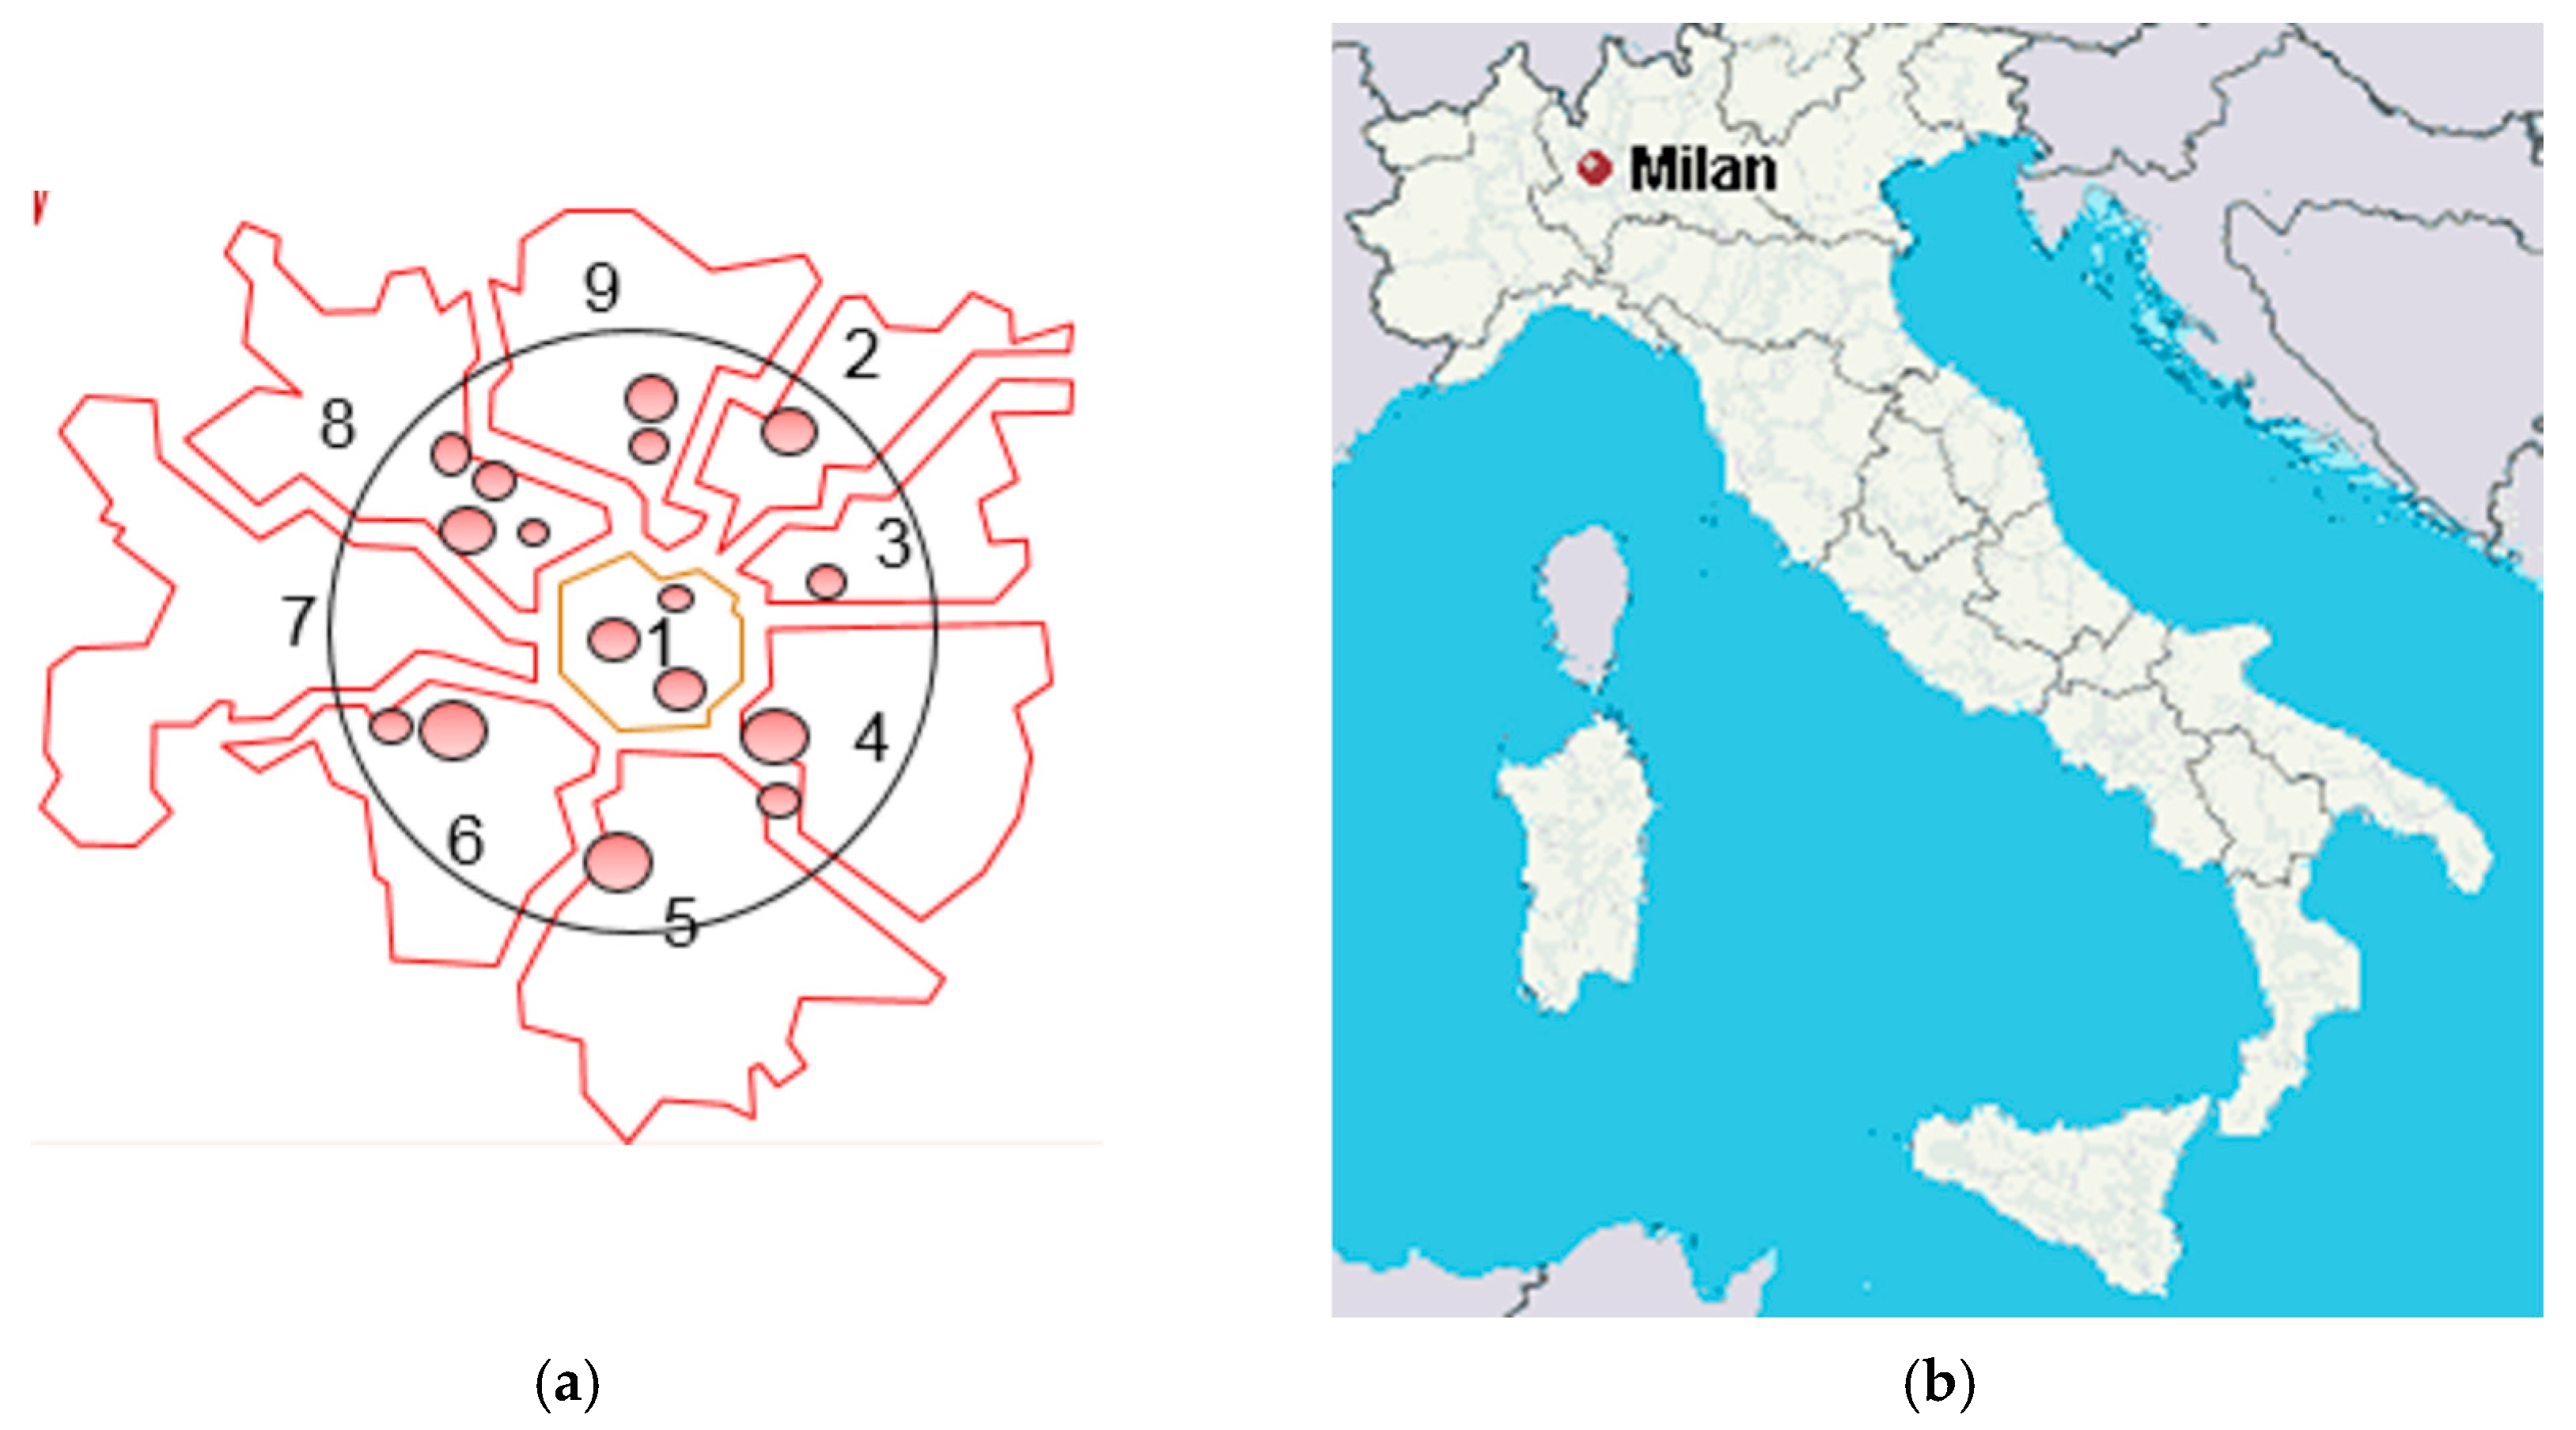
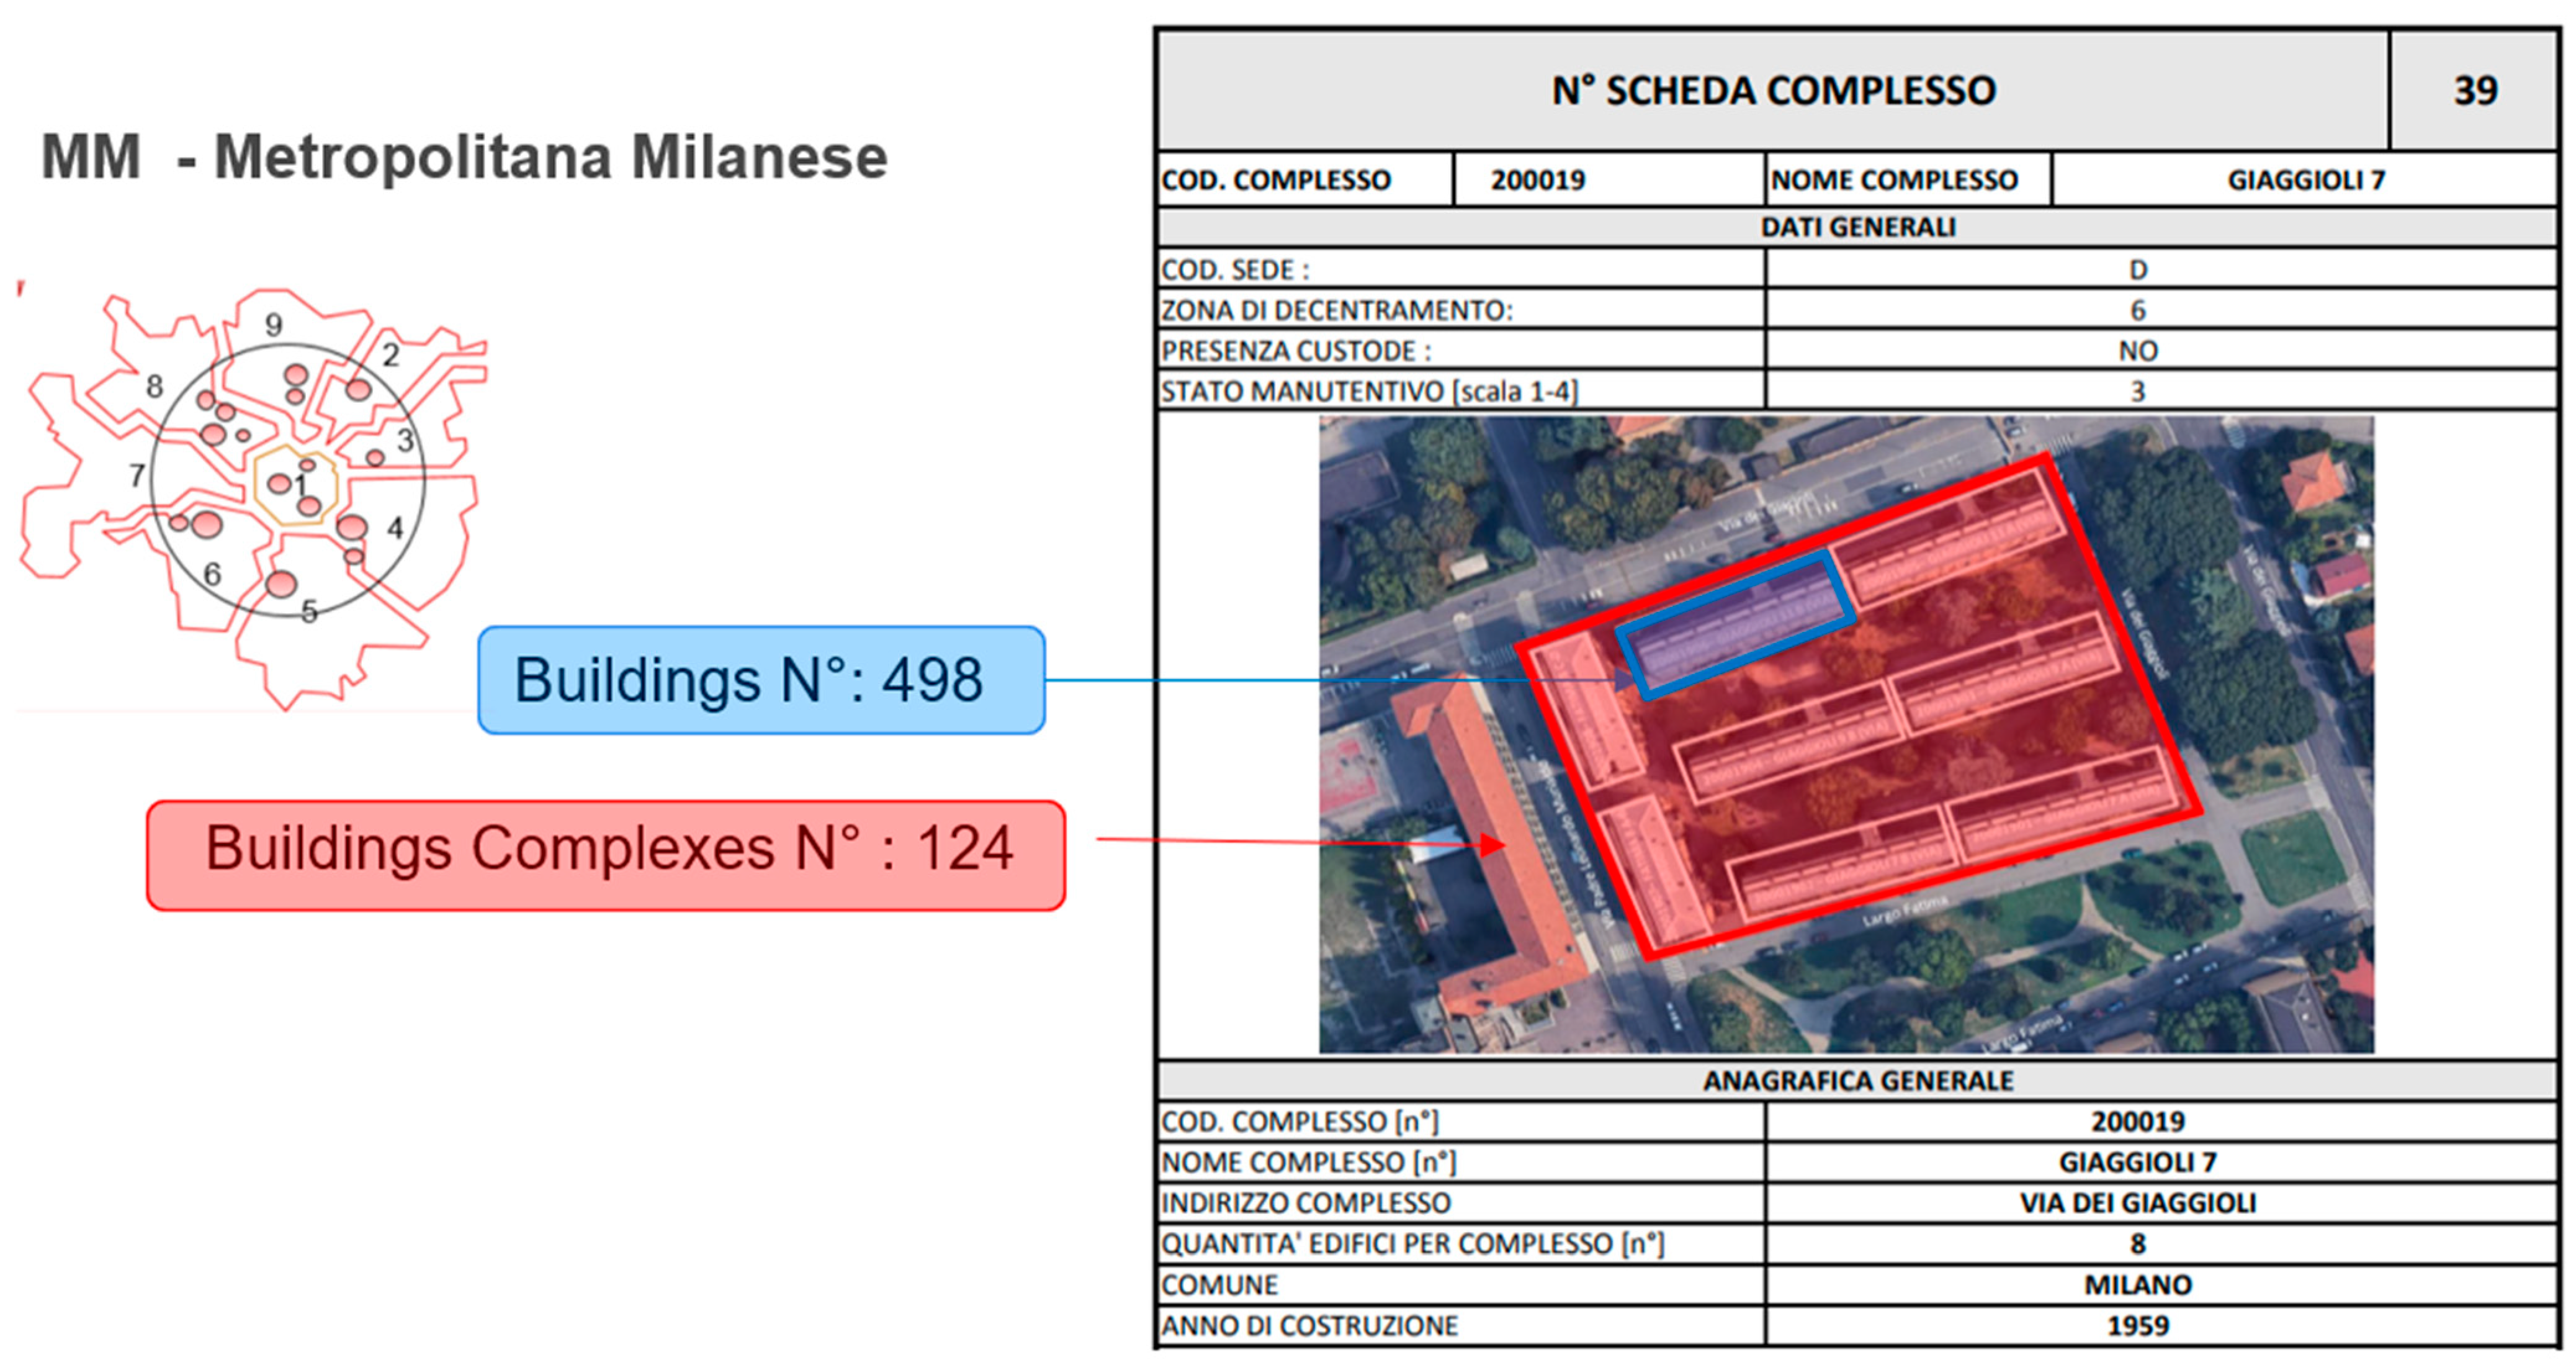
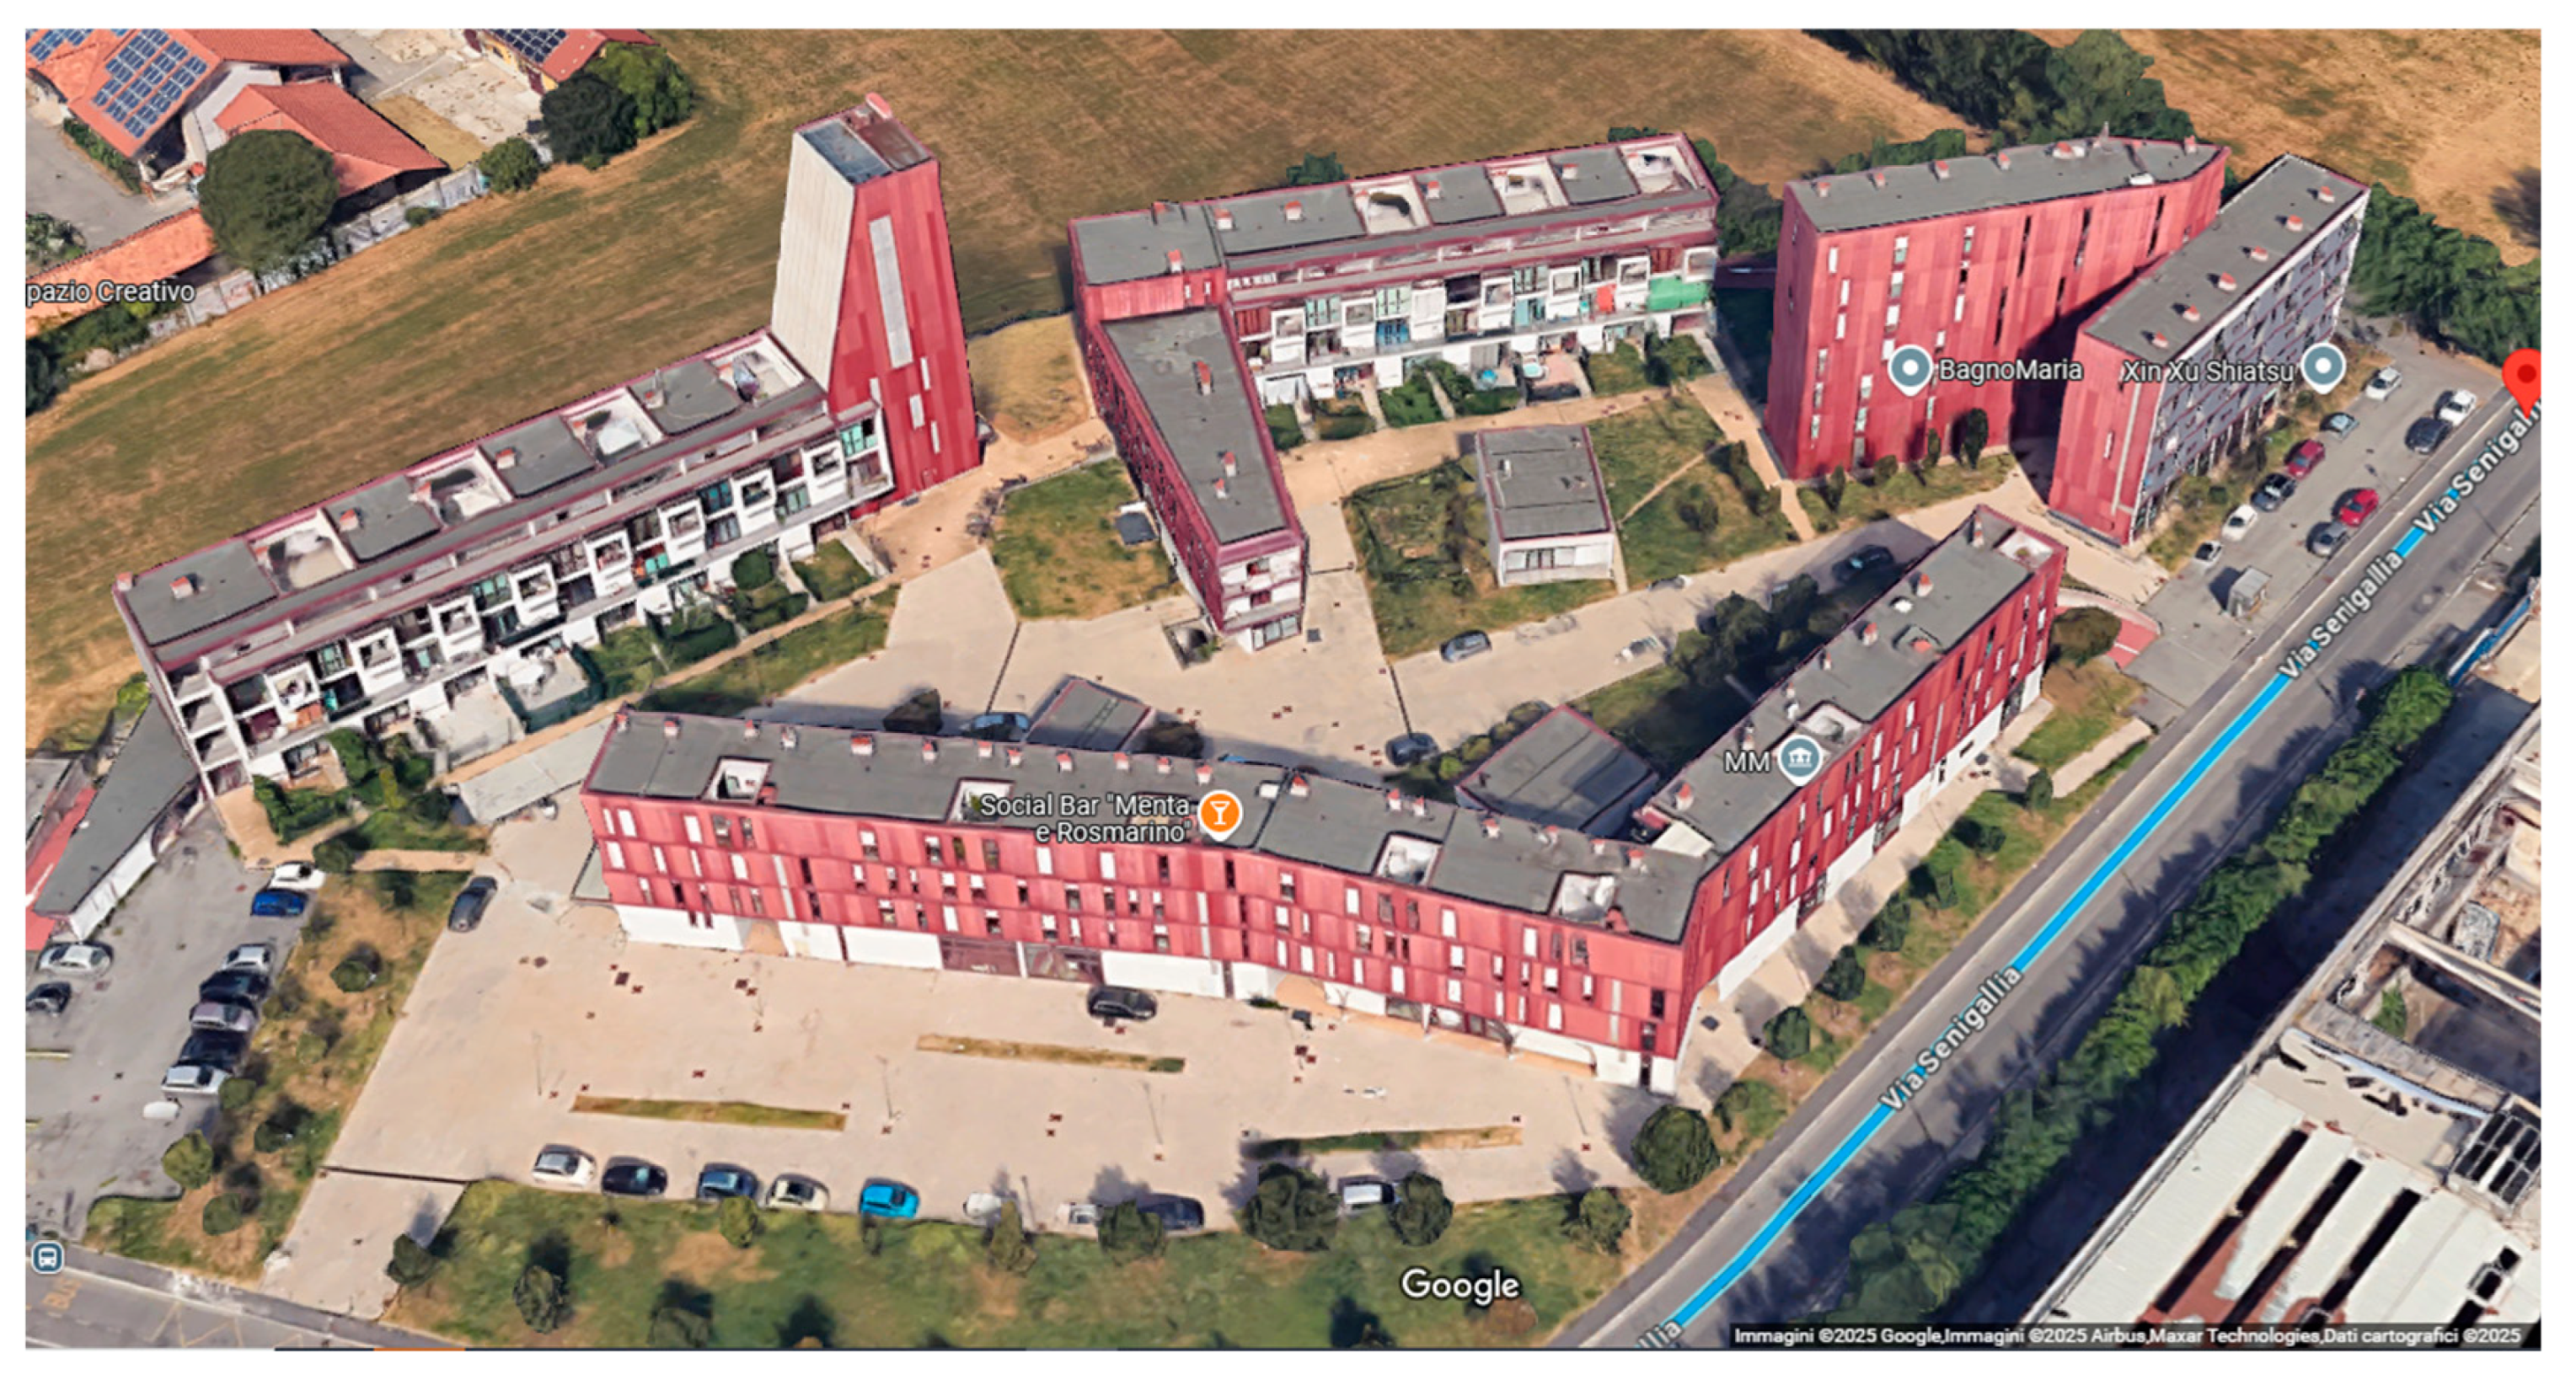
4. A Case Study in Milan—Italy

4.1. Introduction

The methodology employed in Milan, northern Italy, is noteworthy in relation to the state-of-the-art technologies applied. The case study facilitated the examination, analysis, and definition of functional procedures for a systematic asset survey using the iMMS approach on a large real estate property, specifically that of the Municipality of Milan in northern Italy. The project pertains to the Municipality of Milan, which, in 2015, delegated the management of its public housing assets to the company MM spa [88]. The housing inventory of the City of Milan consists of approximately 1100 structures, organized into over 300 complexes. These buildings house nearly 30,000 units, around 1300 of which are for non-residential purposes, referred to as “miscellaneous uses”, including stores, workshops, and offices. Additionally, there are about 9500 units, including garages and parking spaces, bringing the total to nearly 40,000 units under management. This statistic includes around 1500 housing units located in adjacent municipalities or beyond the City of Milan. The public housing inventory maintained by the Municipality of Milan shows clear historical stratification (Figure 6), primarily linked to the cyclical pattern of housing initiatives aimed at supporting economically disadvantaged segments of the population during the previous century.
The development of this housing stock can be delineated into three primary phases: the years immediately following World War II, the mid-1960s, and the mid-1980s. After these three phases, the municipal authority gradually withdrew from the construction of housing for the economically disadvantaged population. The chronological organization of building initiatives resulted in a notably diverse inventory. MM decided to undertake a project aimed at closing the knowledge gap within a significant portion of the managed heritage sector. For these structures, covering both internal and external shared areas as well as technological facilities, a decision was made to conduct a field survey campaign in preparation for further targeted census efforts. The project activities are overseen by MM’s “Housing Division”, which is responsible for managing the public housing inventory owned by the City of Milan (Figure 7), from which all contracts, including the one in question, related to maintenance activities on the buildings are processed. The project involves 498 structures, organized into 142 complexes, spread across 9 regions of responsibility.
A building complex is a collection of one or more buildings that are managed under a centralized governance structure (Figure 8). The position and site address of the central gatehouse are often the primary identifiers of a complex, as the buildings within it typically share the same boundaries. These boundaries are often defined by a gate or walkway that clearly marks the complex’s area of authority.
Each building complex is characterized by a specific sheet that describes the main features of the complex (Figure 9).
As can be seen, the complex sheet contains numerous useful pieces of information for the survey activity, such as the presence or absence of a caretaker, the number of buildings, landings, cellars, and technical rooms, as well as the extent of the outdoor areas surrounding the building. These sheets allowed, during the planning phase of the survey activities, to estimate with good accuracy the extent of the sites to be surveyed. In particular, Table 1, which describes the number of environments that the project had to survey, shows the significance and scale of the surveying project.
The number of staircases to be surveyed is extremely high, so this required excluding all mobile mapping instruments that require the survey trajectory to be closed or looped. This would have meant traversing more than 3000 staircases twice, many of which are more than 5–6 floors high. The number of apartments is also considerable. The project does not include the surveying of the interiors of the apartments, but for each apartment, it is required to capture a photograph and the data of the entrance door, as well as the information entered into the intercoms of these apartments.
Typically, the administration of routine and extraordinary maintenance contracts for the buildings in a complex is conducted through an aggregated approach. Additionally, buildings within a complex often share essential services, such as the heating plant, connections for technical services such as water distribution or electricity, and garbage collection spaces, rather than individual access to parking areas and/or garages for apartment owners or residents. The data acquired in the field during the surveying process are primarily intended to update and enrich the information assets that, in the technical domain, accompany the database already available within the management information system used by MM. The asset survey should enable the following:
  • Increasing the amount of available data while correcting any errors and inaccuracies in the information system.
  • Providing valuable support to MM for monitoring the financial aspects and resources allocated to facility operations, evaluating and managing expenses related to building maintenance, repairs, renovations, and utilities, and ensuring the efficient allocation of resources.
  • Supervising and empowering contracts and service providers for various services, such as sanitation, cleaning, and security.
  • Conducting periodic checks, adjustments, and maintenance to ensure the smooth daily operation of the facility.
  • Improving the management of apartment relocations.
  • Overseeing the proper management of essential services, including heating and water.
  • Ensuring that facilities comply with government regulations, health and safety standards, and energy efficiency requirements.
  • Supervising teams of employees or third-party workers responsible for security, maintenance, and cleaning.
  • Supervising the implementation of developments and improvements.
  • Supporting the planning of extraordinary maintenance works and optimizing the organization of contracts for the acquisition of works, products, and services.
  • Providing the necessary indicators for the development of detailed analyses regarding asset management performance and potential development scenarios.
Based on the previously mentioned general goals, MM determined that the survey should proceed with the implementation of the most innovative technologies to ensure the following detailed results:
  • To obtain a current status of the common areas in all surveyed buildings, enabling the extraction of accurate plans of these spaces with local centimeter-level precision.
  • To enable the collection of local three-dimensional measurements and the subsequent association of assets within the buildings with each area. While global centimeter-level accuracy is not necessary for surveying entire complexes and buildings, the focus is on cost containment. Additional requirements include the ability to navigate items topologically and unambiguously, as well as ensuring measurement accuracy and geolocation.
  • To acquire photographic and geometric documentation that allows for the identification of assets and items within the buildings, facilitating the integration and updating of data already present in the company’s information system.
  • To enable the storage of photographic and three-dimensional documentation in formats not restricted by proprietary software, ensuring compatibility for future visualization.
  • To enable the acquisition of a three-dimensional point cloud model of the buildings, which will support the future implementation of automatic self-location applications, and to define an online platform for the exchange of three-dimensional and photographic data.

4.2. Project Technical Specifications

Taking into account the provided details, a list of survey criteria was created to be accomplished:
  • To identify all necessary assets and categorize them into several classifications such as rooms, staircases, public areas, external pathways, and technical rooms;
  • To facilitate centimeter-level local measurements;
  • To disseminate the survey results on the cloud as a virtual tour, enabling MM technical staff to identify the assets and populate the database;
  • Point clouds and RGB data must be stored on a server without utilizing proprietary formats, but using open formats such as E57, JPG, TIFF, or LAS;
  • A quality assurance mechanism must be established to facilitate real time quality monitoring of the survey;
  • To provide a 3D point cloud model in a way that allows running innovative autolocalization systems based on the matching between point clouds and images taken from a camera carried by the operators

4.3. Characteristics of the Instrument and of the Surveying Methodology for the 3D Survey of the Buildings

To carry out the building’s 3D capture activity and complete the task outlined in the previous paragraphs, an indoor mapping system based on SLAM technology and multi-beam LiDAR sensors was chosen. This system can provide a 3D model of the surroundings, along with synchronized and calibrated high resolution panoramic images. The selection process focused on systems that also possessed high-quality photographic acquisition capabilities. This was essential to facilitate the identification of assets and items in the common areas of the buildings through the examination of the spherical images captured by the system.

5. Instrument Used in Milan and the Specific Mapping Approach Solution Applied to the Case Study

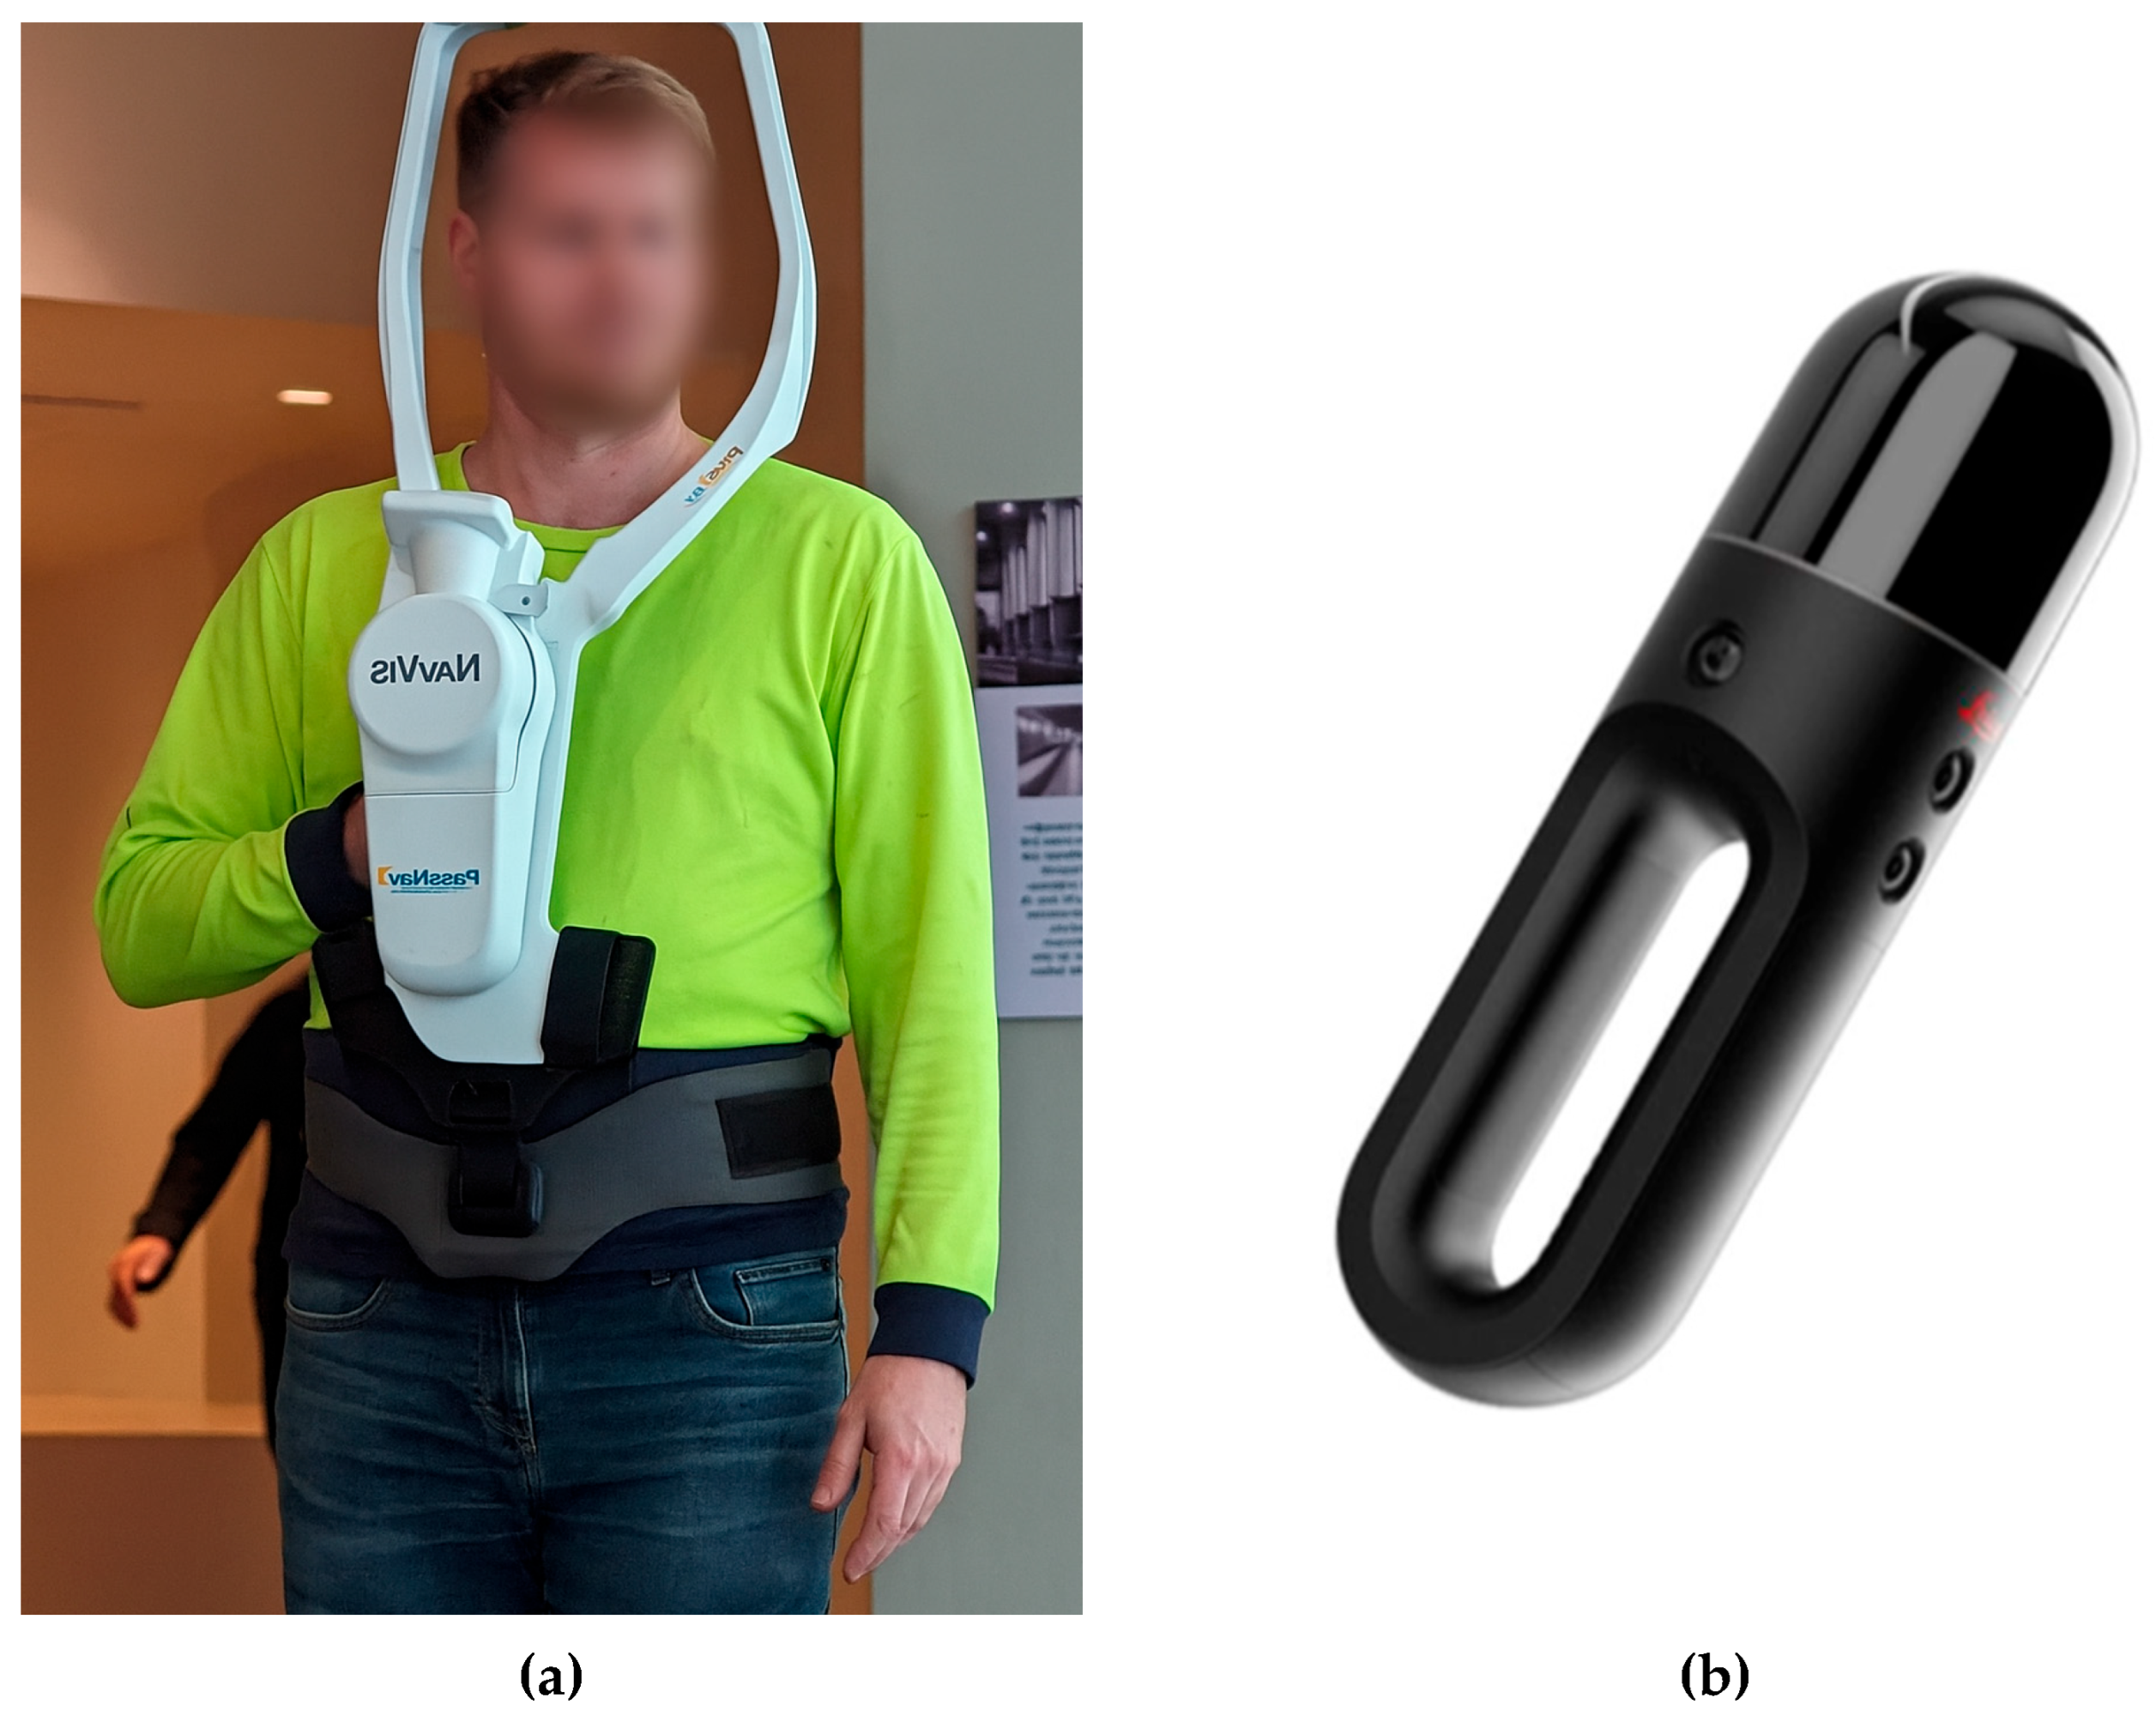
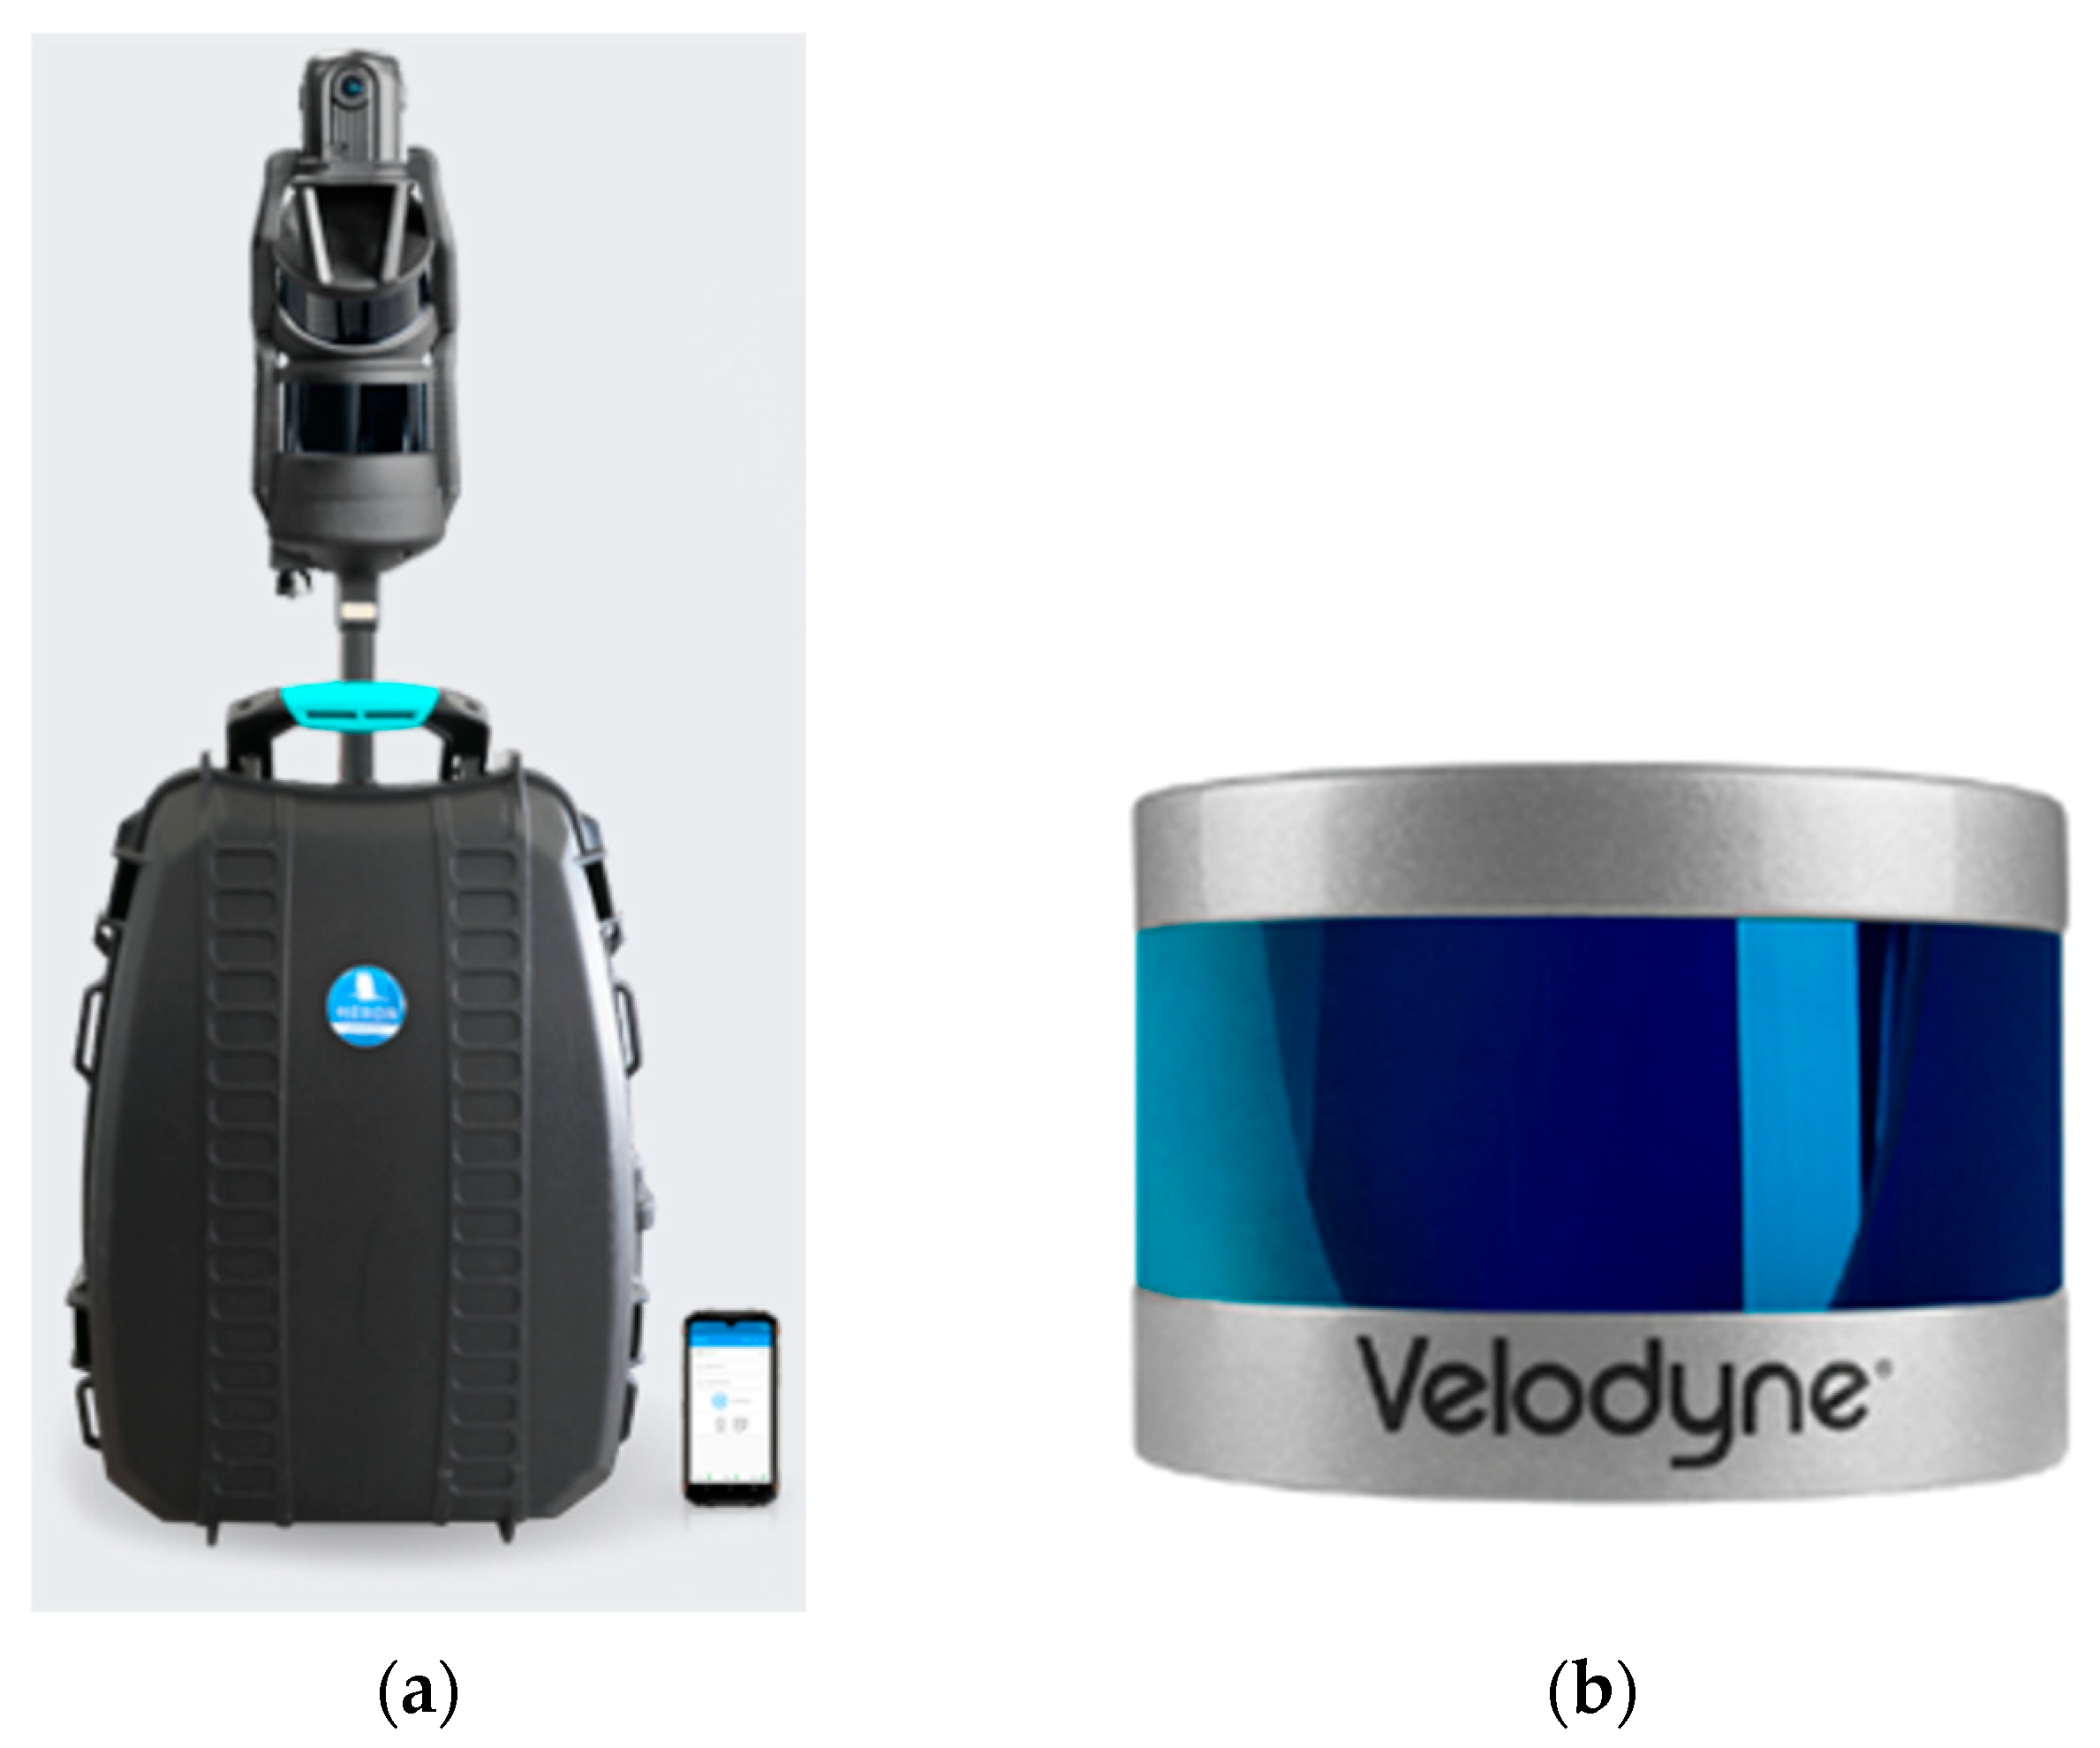
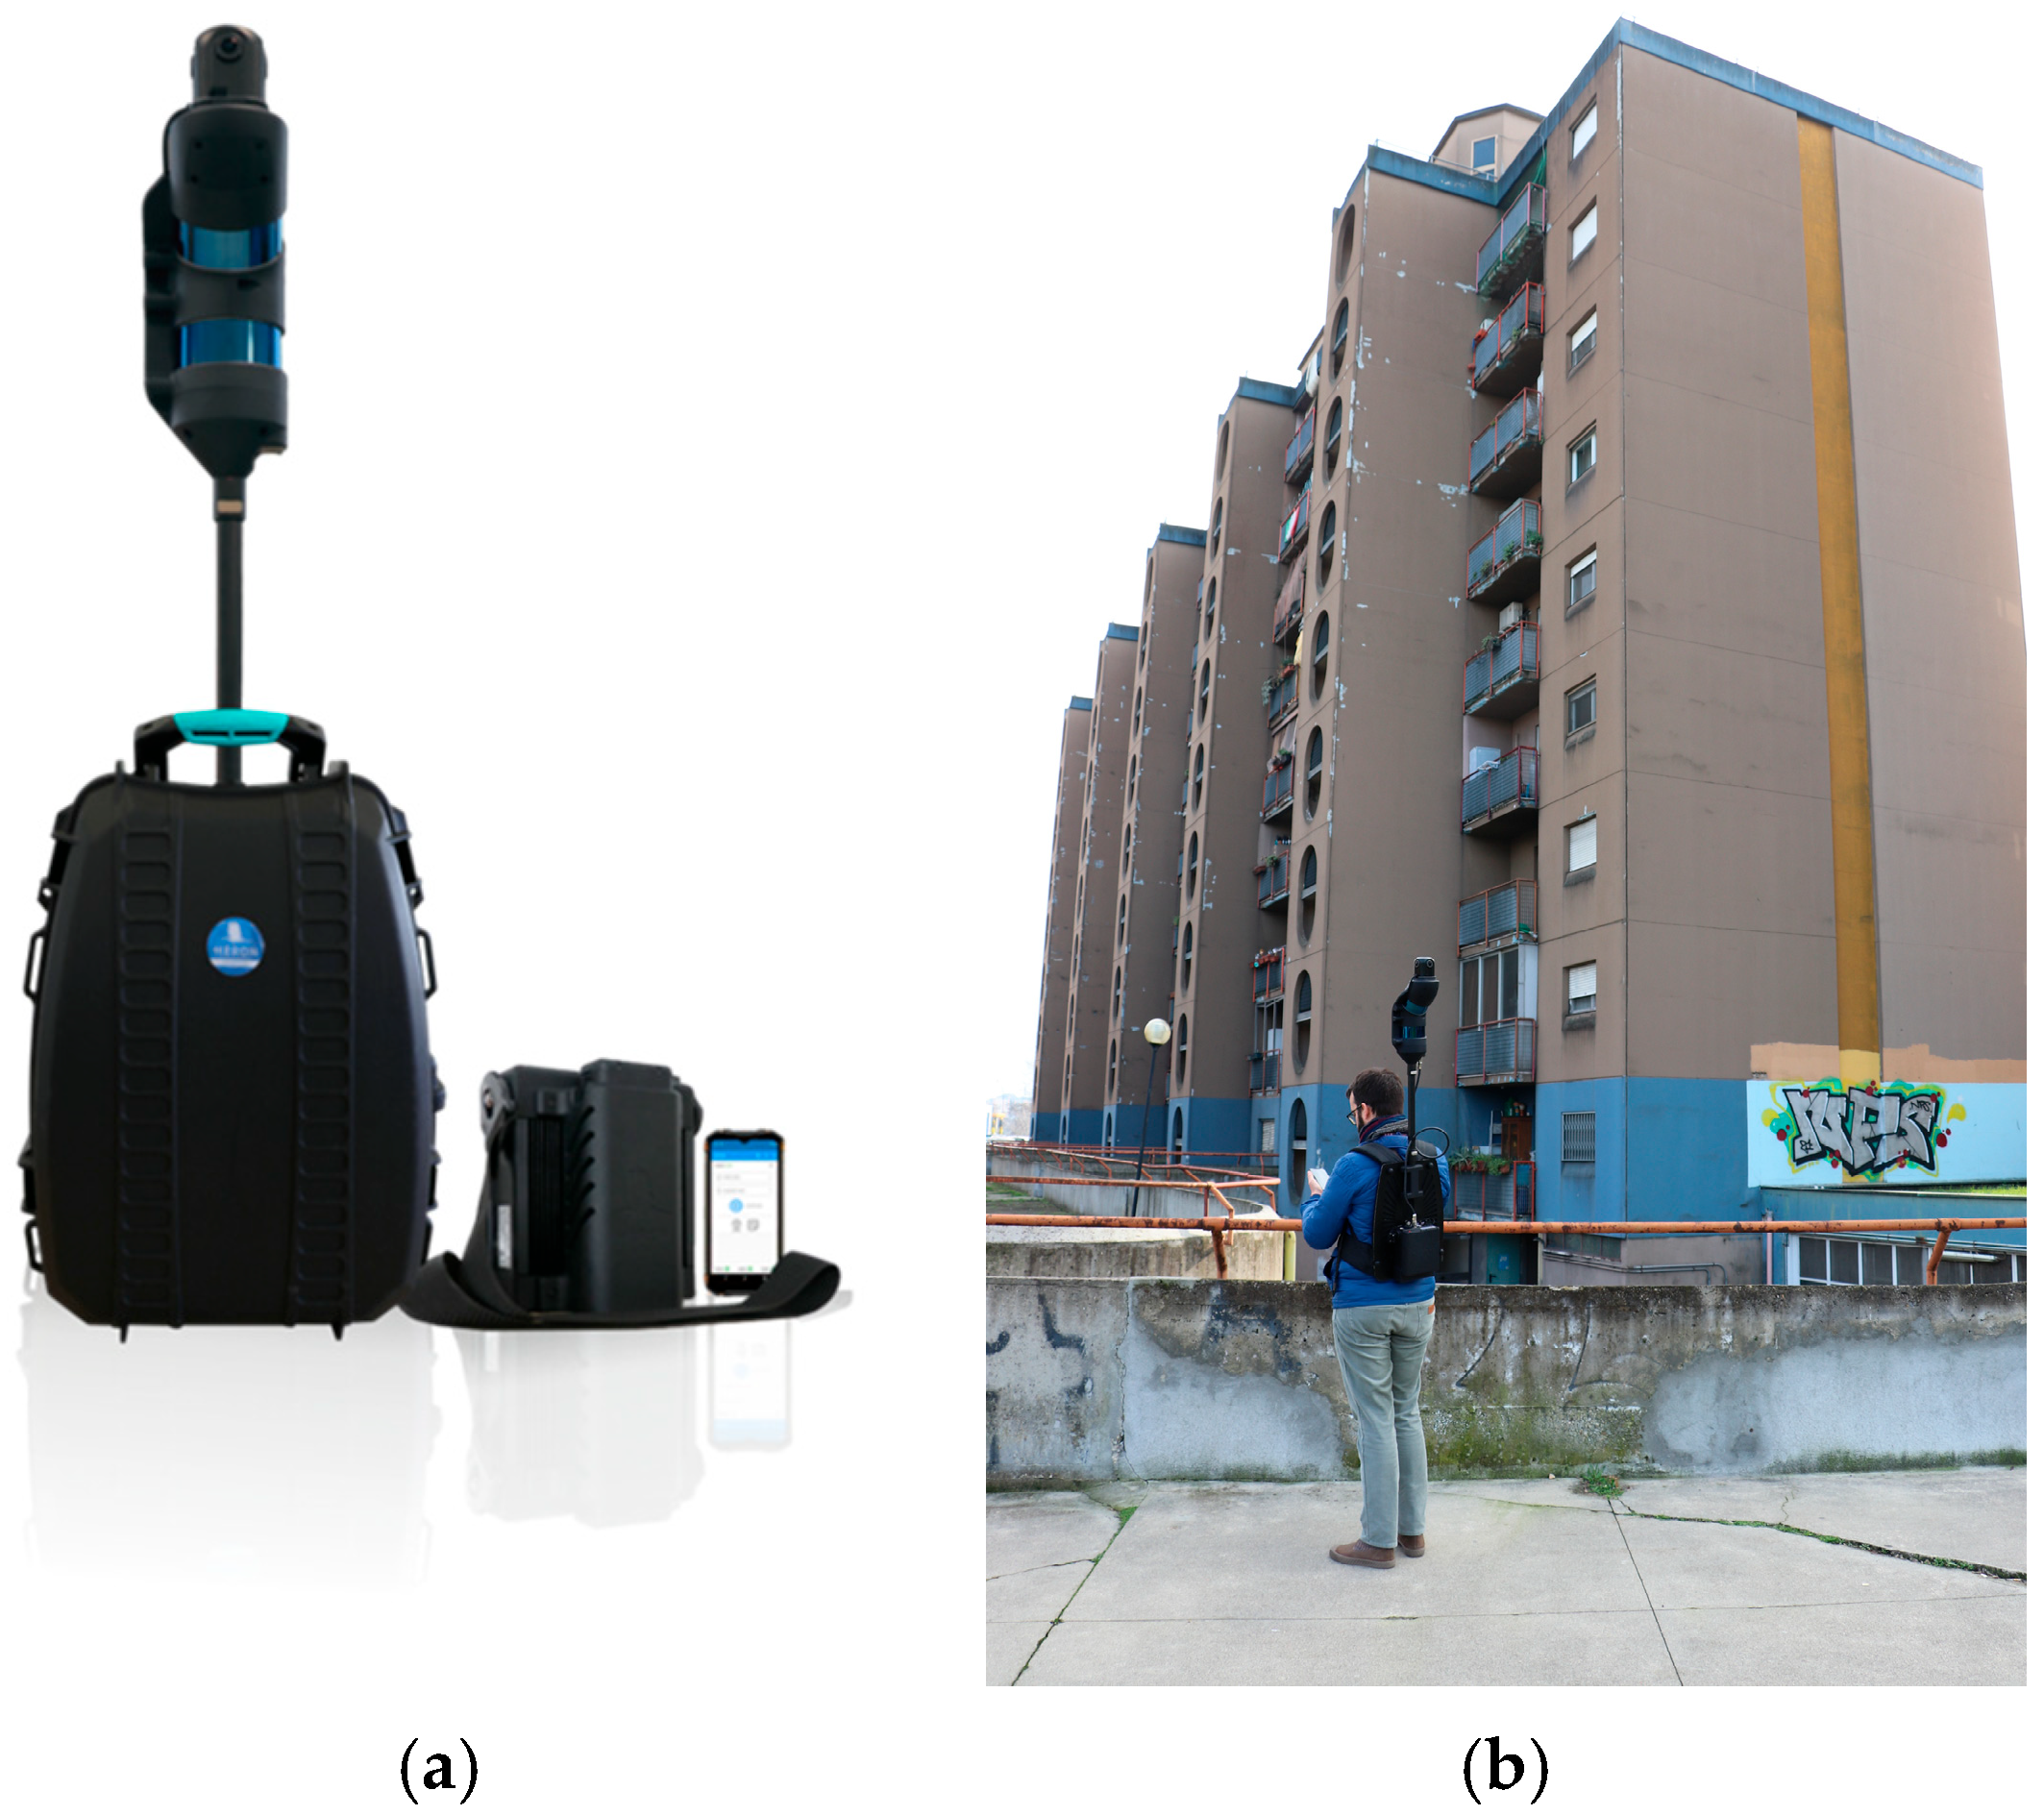
5.1. Heron® Backpack—Mobile Mapping System

The Heron® MS Twin Color mapping system, produced by Gexcel [89], was utilized in the project [90]. The manufacturer offers various versions of the instrument. The main version used in the project (2021–2022 version) includes a smart controller that incorporates the device’s intelligence and a compact battery pack. The capture head (Figure 10a) [91] consists of an IMU, two lidar sensors (Velodyne® 16-line multibeam) (San Jose, CA, USA) (Figure 10b) [91], and a panoramic camera with two lenses, which can concurrently capture RGB video at 24 Hz with 4K resolution (for point cloud colorization) or high-quality 5K RGB photos upon request (to support 360° virtual tours).
At the conclusion of the survey operations, the acquired data, consisting of LiDAR measurements, IMU measurements, and panoramic images, are processed for individual trajectories. This activity is performed using the Heron Desktop® application Version 2.6.0.0 [92] supplied with the instrument, which processes the raw data and applies a patented SLAM algorithm to estimate the instrument’s trajectory. The procedure utilizes IMU data to determine the sensor’s approximate location and spatial orientation. This is further enhanced by a registration process employing the renowned Iterative Closest Point (ICP) technique to align each point cloud (a singular 360° scan) with its predecessors. The processing workflow (Figure 11) follows three main steps: odometry, local maps, and global optimization.
The odometer step consists of calculating an initial estimate of the trajectory, followed by the instrument during the survey.
The initial trajectory estimate is obtained using a geometric SLAM algorithm, and this result is simultaneously compared with the IMU estimate to provide a co-evaluation of both: convergence between the two methods is indicated by green coloring.
The second step, local maps, is a way of segmenting the point cloud, previously represented as a continuous acquisition, into data chunks generated by dividing the acquisition trajectory into chunks of defined length.
The local map representation creates rigid groups of points that can be aligned during the global optimization phase. “3D local maps” subdivide the surveyed point clouds into sectors (Figure 12) similar to static scans acquisitions at a generation distance defined according to the geometries of the surveyed environments.
The aim of this final operation is to refine the estimated trajectory, allowing for some flexibility in the alignment of individual data chunks within it to compensate for sensor drift. For surveys that consisted of multiple acquisitions, manual connections between local maps were used to link the roof, exterior, and ground floor, and then the entire network of connections between local maps was optimized. This process reduces the error between local maps through iterations that find the best fit between point clouds. Figure 13 shows views of the 3D network of connections between local maps during the global optimization process.
Each colored dot represents a local map, i.e., a point cloud—a segment of the acquisition that can be freely adjusted in position during the optimization process (the dot is placed at the center of mass of the local map). Each blue line represents an iterative best-fit constraint between two overlapping local maps. The entire global optimization results in an optimized estimate of the survey trajectories. In cases of low overlap and point matching, no connections are made between local maps. This approach avoids the restriction, often found in SLAM tools, that the survey start position must coincide with the survey end position [93,94]. If, as designed in the survey phase, the survey paths have limited overlap between trajectories, the algorithms in Heron Desktop® allow the merging of these trajectories. This enables the generation of a single point cloud with associated spherical images for the entire complex. This process requires significant expertise and experience from the operators. The final point cloud, along with the corresponding spherical images, constitutes the final deliverable of the survey. The mobile mapping device and Heron Desktop® processing software can also incorporate point cloud data acquired from other instruments to support the acquisition or processing phases. This can be done by loading the external point cloud into the system’s memory during real time acquisition or into the software during post-processing. The sensors have a nominal accuracy of ±3 cm, attributed to the Velodyne® VLP-16 sensors used [91]. Enhanced local accuracy can be achieved with the Hesai® 32-line sensors (Shanghai, China) (Figure 14) [95], which offer a nominal range precision of 5 mm (1 σ) and an accuracy of ±1 cm. These sensors were recently introduced in the Heron® device (Figure 15) by the manufacturer, Gexcel.
The methods implemented to ensure adherence to MM requirements are outlined below. Due to the project’s significant innovation, the technical specifications were defined through the execution of a prototype project conducted prior to the commencement of the survey operations on a building complex. This facilitated the development of methods for field surveying, data processing, and the evaluation of ongoing activities.

5.2. Accuracy of the Survey with iMMS for Geospatial Applications

It is essential to clearly establish that the level of accuracy required in the project is defined to prevent errors in item recognition and the misallocation of assets to inappropriate areas of the building. Essentially, the SLAM survey aims to enable the recognition of the geometries of the various sections or components of a building, with the goal of locating the assets within it. These assets should be accessible through a virtual tour, with transitions between congruent spherical views, and geometrically located within their respective rooms (e.g., the height of a switch relative to the floor level, the width of a door, and the distance between the edge of a window and the adjacent edge of the room). Thus, the virtual tour also provides a global three-dimensional geometric representation, but its accuracy characteristics are not the primary objective. If accuracy were to be the main focus, a rigorous topographical approach would be required, which is unmanageable due to the cost and investment associated with asset mapping projects. In general, the accuracy of a SLAM survey with an asset management objective must first ensure the local congruence of the three-dimensional representation.
Indeed, if certain areas of buildings are present in three-dimensional views acquired by surveyors at different times or along intersecting survey paths, these detections must be congruent. Therefore, special attention must be paid to the local relative accuracy between different acquisitions, rather than, as is customary in classical topographic surveys, focusing on global topographic accuracy. In fact, the global accuracy of the model for a large area diminishes due to the SLAM tendency to drift along long paths. This is why the final point cloud of the environment (Figure 16) is established through an offline post-processing procedure executed using the Heron Desktop® software, which employs a comprehensive SLAM approach. The 3D map is generated by utilizing all the measurements collected throughout the survey.
This involves a global registration of all the scans, which minimizes misalignment errors among the point clouds and closes any loops in the trajectory. Unfortunately, good global accuracy, as stated before, requires topographic framing operations and time-consuming data processing, which are incompatible with the costs of an expedient survey. For these reasons, the local relative accuracy required between overlapping acquisitions can also be very high, i.e., in the order of 2 to 5 cm, while the global accuracy has been limited to an order of 10 to 20 cm, i.e., the order of magnitude of a SLAM survey in the absence of topographic geometric constraints. Nonetheless, we must remember that the performance of the SLAM algorithms can be significantly impacted by the geometric characteristics of the surveillance area and by the presence of closed loops in the surveying trajectories.

5.3. Possible Improvements of the Global Accuracy

As cited in Section 5.2, SLAM-based devices tend to drift along long paths due to the very structure of the algorithm. In the case of building surveys such as those in the Milan project, where the development paths are limited to a maximum of 100 to 300 m, maximum deviations of around 10–20 cm have typically been observed.
In order to keep these deviations under control, the post-processing software of the data acquired with Heron®, i.e., the Heron Desktop® software, allows users to insert control points or control scans (i.e., georeferenced point clouds that are part of static scans) before generating the point cloud. However, such an approach would have required defining a control topographic network for each building complex, effectively doubling the survey costs. One approach that is generally employed in SLAM systems to contain the drift in surveying trajectory estimation is the aforementioned method of performing closed-loop survey geometries. This would have posed a significant constraint for building surveying activities, forcing, for example, the surveying of the stairs of a building, up and down, i.e., two times.

5.4. Surveying Trajectory Organization

In a survey with Heron® SLAM instrumentation, trajectory crossing is frequently recommended to improve the robustness and accuracy of the resulting three-dimensional point cloud model, as shown in Figure 17.
In fact, the post-processing algorithm in the Heron Desktop® software, provided in conjunction with Heron® for post-processing with the SLAM algorithm, allows the link between surveys performed with crossed trajectories to be strengthened through a patented approach called the Virtual Scans approach. For the geospatial applications addressed here, if the goal is the recognition of assets from images and their relative localization with respect to the surveyed environments, each overlap of trajectories is a source of potential difficulties in object recognition, due to double imaging of the same element, and a potential source of difficulties in navigation and object recognition/positioning. In fact, if within a virtual tour there is no continuity in spherical views, it is possible to both get lost in navigation and fail to perform the operation of unambiguous recognition and location of assets. Therefore, in these activities, trajectory crossing should theoretically be avoided as much as possible. However, thanks to Heron Desktop®’s patented algorithm, trajectory crossing allows for alignment between geometries and spherical views, thus automatically ensuring congruence between spherical views and three-dimensional models acquired from different paths that occasionally cross. Where interferences/overlaps between trajectories are planned, it is necessary for the union of the surveyed model to perform a fusion of the overlapping detection paths, thus minimizing the gaps between the trajectories and, consequently, between the pixels of the acquired images.

5.5. Quality and Use of Pictures

In surveys with geospatial goals, the photographic component of the survey plays a critically important role, as it is from this information that operators can recognize assets and populate the asset management database. Indeed, MM technicians must be able to navigate through virtual tours along the routes and recognize the details required to populate the comprehensive database. An important factor in the choice of the Heron® system, therefore, was the quality of the image and its resolution, appropriately tailored to the needs of the project. Considering that the surveys mostly take place inside the buildings and very close to the building’s body, it was considered sufficient for the resolution of the RGB images to be greater than or in the order of 5K, with a strong emphasis on the overall image quality, which should not be blurred, dark, or over/underexposed. Indeed, the quality of an image is often confused with its mere resolution. Therefore, the characteristics of the images had to be such that the technicians could recognize the items and assets present in the mapped areas from the photos, and in particular the attributes associated with them. In the case of the Milan project, the company that won the contract was required to have iMMS systems equipped with lighting to ensure image quality even for measurements taken in the evening hours or under low-light conditions. For more specific details, such as names on intercoms or technical identification plates of machinery in building thermal power plants, the option to associate an externally acquired photograph (from a smartphone, PDA, or tablet) as an integrative document, attached as an attribute to the surveyed asset, was provided. Obviously, a mobile system with higher photographic resolutions would have made it possible to avoid such procedures. A system capable of acquiring very high resolution images, however, would require the mobile system to have simultaneously large computing, data management, and storage capabilities capable of handling the high resolution acquired in the field. However, this implies (as already stated in Section 3) that the instrument would have high power consumption and therefore require a sufficiently large battery pack on board. All of this leads to a larger system footprint and greater weight for the instrumentation, details that make the instrument less flexible and harder to use in articulated and complex spaces with numerous scales, as required by the Milan project.

5.6. Resolution and “Density” of the Images

As mentioned, the Heron® mobile mapping system allows images to be acquired at a frequency of 24 Hz and 4K resolution, rather than images at 5K resolution on-demand. For the Milan project, the mode of photographic acquisition for each type of asset has been defined. Recall that the project’s goal is to enable its technicians to navigate within the survey through a simple photo-to-photo approach, allowing even three-dimensional measurements to be made by operating directly on the spherical photos. In the technical specifications, therefore, it was detailed which items required 4K photographic acquisition and which items required a minimum of 5K resolution. This was done to minimize the weight of the survey files. To avoid splitting in image views, it is possible to filter the number of spherical images, defining a minimum spatial distance below which spherical views are not displayed, thus preventing excessive spatial overlap between adjacent spherical views. For Heron® instrumentation, this function is available in the Reconstructor® software—Version 4.4.2. (Figure 18), employed to export the spherical views associated with the point cloud.
Therefore, for the surveys in Milan, a 5K high resolution photo acquisition was defined, with a relative distance between spherical image acquisitions of no less than 5 m. In cases where, on the contrary, images were acquired automatically and in low resolution by the system, during post-processing, the images closer than 5 m were removed, since 4K continuous resolution captures too many images. Thus, the goal was to manage data acquisition limited to the needs of the project, as it is necessary to consider that the management and storage of computer-heavy data is a major source of cost, both in terms of slowing down and burdening data processing and in terms of storing and saving such data over time.

5.7. Anonymization

In activities such as the Milan project survey, it is important to consider that the management, storage, and dissemination of photographic data can be a critical issue and can have a significant impact on the project’s costs. National regulations can indeed be very restrictive on this matter, particularly regarding the privacy of individuals who may be photographed by the mobile system. If the surveyed environments are open to the public or in the presence of guests of such facilities (residents, company employees, patients, or hospital staff, etc.), the photographs document and capture faces of people, license plates of cars, and other sensitive elements, which numerous international and/or national regulations prohibit from being stored. In the case of the Milan project, this procedure has not been implemented, since the images acquired are solely functional for asset recognition and are in no way shared or disseminated outside the operational chain of the project. However, effective software, such as the platform, is available that allows for the automatic anonymization of images acquired in the field, including the anonymization of license plates, faces, bodies of people, and vehicles.
It is therefore possible to activate processes in near real time so that as soon as possible, during or at the conclusion of mapping operations, the images are processed to anonymize the sensitive elements present in the photographic shots.

6. Milan Project: Technical Specifications and Procedures to Ensure High-Quality Work

6.1. Organization of a Preventive Pilot Project

Given the complexity of the entire workflow, which involves field surveying, processing of the surveyed data with iMMS, delivery of results to MM technicians, item recognition, general testing of activities, data sharing in the cloud, and data storage, it is considered mandatory that, for projects of this size, a preliminary phase of work be carried out to verify the proposed processes and technologies. In particular, we detail what was carried out in the Milan project, which we believe should be a general rule for such activities:
  • Pilot Complex: prior to the start of work, a Pilot Complex was defined in which data processing, testing of technologies and processes, and the software platforms and hardware tools proposed were tested.
  • Survey methods and procedures: the outcome of the agreed activities in the Pilot Complex is the definition of the survey methods and procedures.

6.2. Detection Methods and Procedures

Surveys using the SLAM approach are very sensitive to surveying dead times. As the operator moves along the buildings of the complex, they simultaneously capture the surrounding environment. To optimize fieldwork, it is essential that the operator know the path to follow in advance, minimizing dead time. Since many complexes consist of several buildings, some as high as 6–7 levels, with paths connecting parking areas at ground level as well as underground, and entrances at multiple levels, defining the optimal route to map all spaces adequately is a task that must be planned ahead of time, before starting the surveying process. Additionally, access to buildings must be preceded by communication with residents, scheduling the opening of doors to allow access and movement of the instrument, as well as entry into areas and technical rooms typically restricted. The surveying activity must also not interfere with any ongoing routine or extraordinary maintenance operations at the buildings and must coordinate with the facility’s operations manager, who holds the keys to all areas and has detailed knowledge of the building complex’s layout.
Specifically, from an organizational point of view, for each of the complexes to be surveyed, the following procedures were defined and executed:
  • Survey and preparation of the corresponding section of the operational report;
  • Survey for data acquisition using innovative mobile mapping tools and preparation of the corresponding section of the operational report;
  • Processing of SLAM data and their structuring;
  • Final delivery of the survey by the contractor and acceptance of the work.
  • Uploading of data to the cloud.
  • Asset recognition activity in the data (images) uploaded to the cloud.

6.3. Site Inspection and Preparation of the Site and Operational Reports

To this purpose, it is evident that extensive professional surveying of large numbers of buildings, where time-use efficiencies of the instrument are critical for cost management, cannot afford to have the surveying activity scheduled in the field without prior inspection by the surveyor. Therefore, it is necessary to organize survey activities carried out by specialized operators who provide clear and detailed instructions to the surveyor about the routes to follow, how to carry out the survey with respect to the difficulties of accessing the different spaces of the buildings, and how to avoid unwanted crossing of trajectories. This includes optimizing surveying paths and the timing of mapping in the field. It is also evident that a survey performed with the correct paths, with respect to the subsequent post-processing data stage, significantly reduces computation time and the possibility of errors in trajectory computation and the generation of the final point cloud.
One detail that may be underestimated in surveying large-scale real estate assets is the importance of this prior organization, which makes the files to be processed unnecessarily heavy:
  • Dynamic survey instrumentation has extreme productivity but simultaneously incurs high instrumentation and data processing costs. Therefore, the operator must be able to walk through building spaces quickly, without downtime, to decrease the incidence of instrumental costs in surveying large building complexes.
  • Mobile mapping systems acquire a large amount of data in the form of three-dimensional data acquired by LiDAR sensors and images. While photographic data is usually acquired “on demand”, three-dimensional data is acquired continuously. So, an operator stopping any movement to decide where to proceed or to open a closed door causes the recording of unnecessary three-dimensional data.
  • Three-dimensional geometric surveying with iMMS, for geometric surveying purposes, considers redundancy in surveying buildings a merit that strengthens and makes the detected point cloud model more accurate. For such applications, the choice and definition of trajectories can also be field-defined, as a double pass in the same areas only results in a minimal loss of time but hardens the survey geometry.
As mentioned in the previous paragraphs, it is also a good practice for the operator to already, during the survey, mark the association between photographic sockets and the naming of the spaces being surveyed (complex/building/stairs/level/corridor/room). In order to carry out this operation, it is necessary to already have a general understanding of the layout of the building complex to be surveyed. It is, of course, essential that the iMMS system used be set up for such a tagging function. These requirements for extensive surveying operations make efficient operational organization essential. One possible solution, proven efficient in the Milan project, is the inclusion of a procedure whereby each building complex is associated with an initial survey, including the drafting of a survey report and the drafting of an operational report at the conclusion of the survey. The reports aim to plan and document the execution of survey activities in the field and to document any problems as they arise, with a view to addressing them in the immediate term. Obviously, as the objects and complexes to be surveyed change, the forms and organization of these reports will vary accordingly.

6.4. Operational Report

The operational report shows the results of the planning for the complex to be surveyed. The contractor shall produce summary plans to support the surveyors’ activities and, in particular:
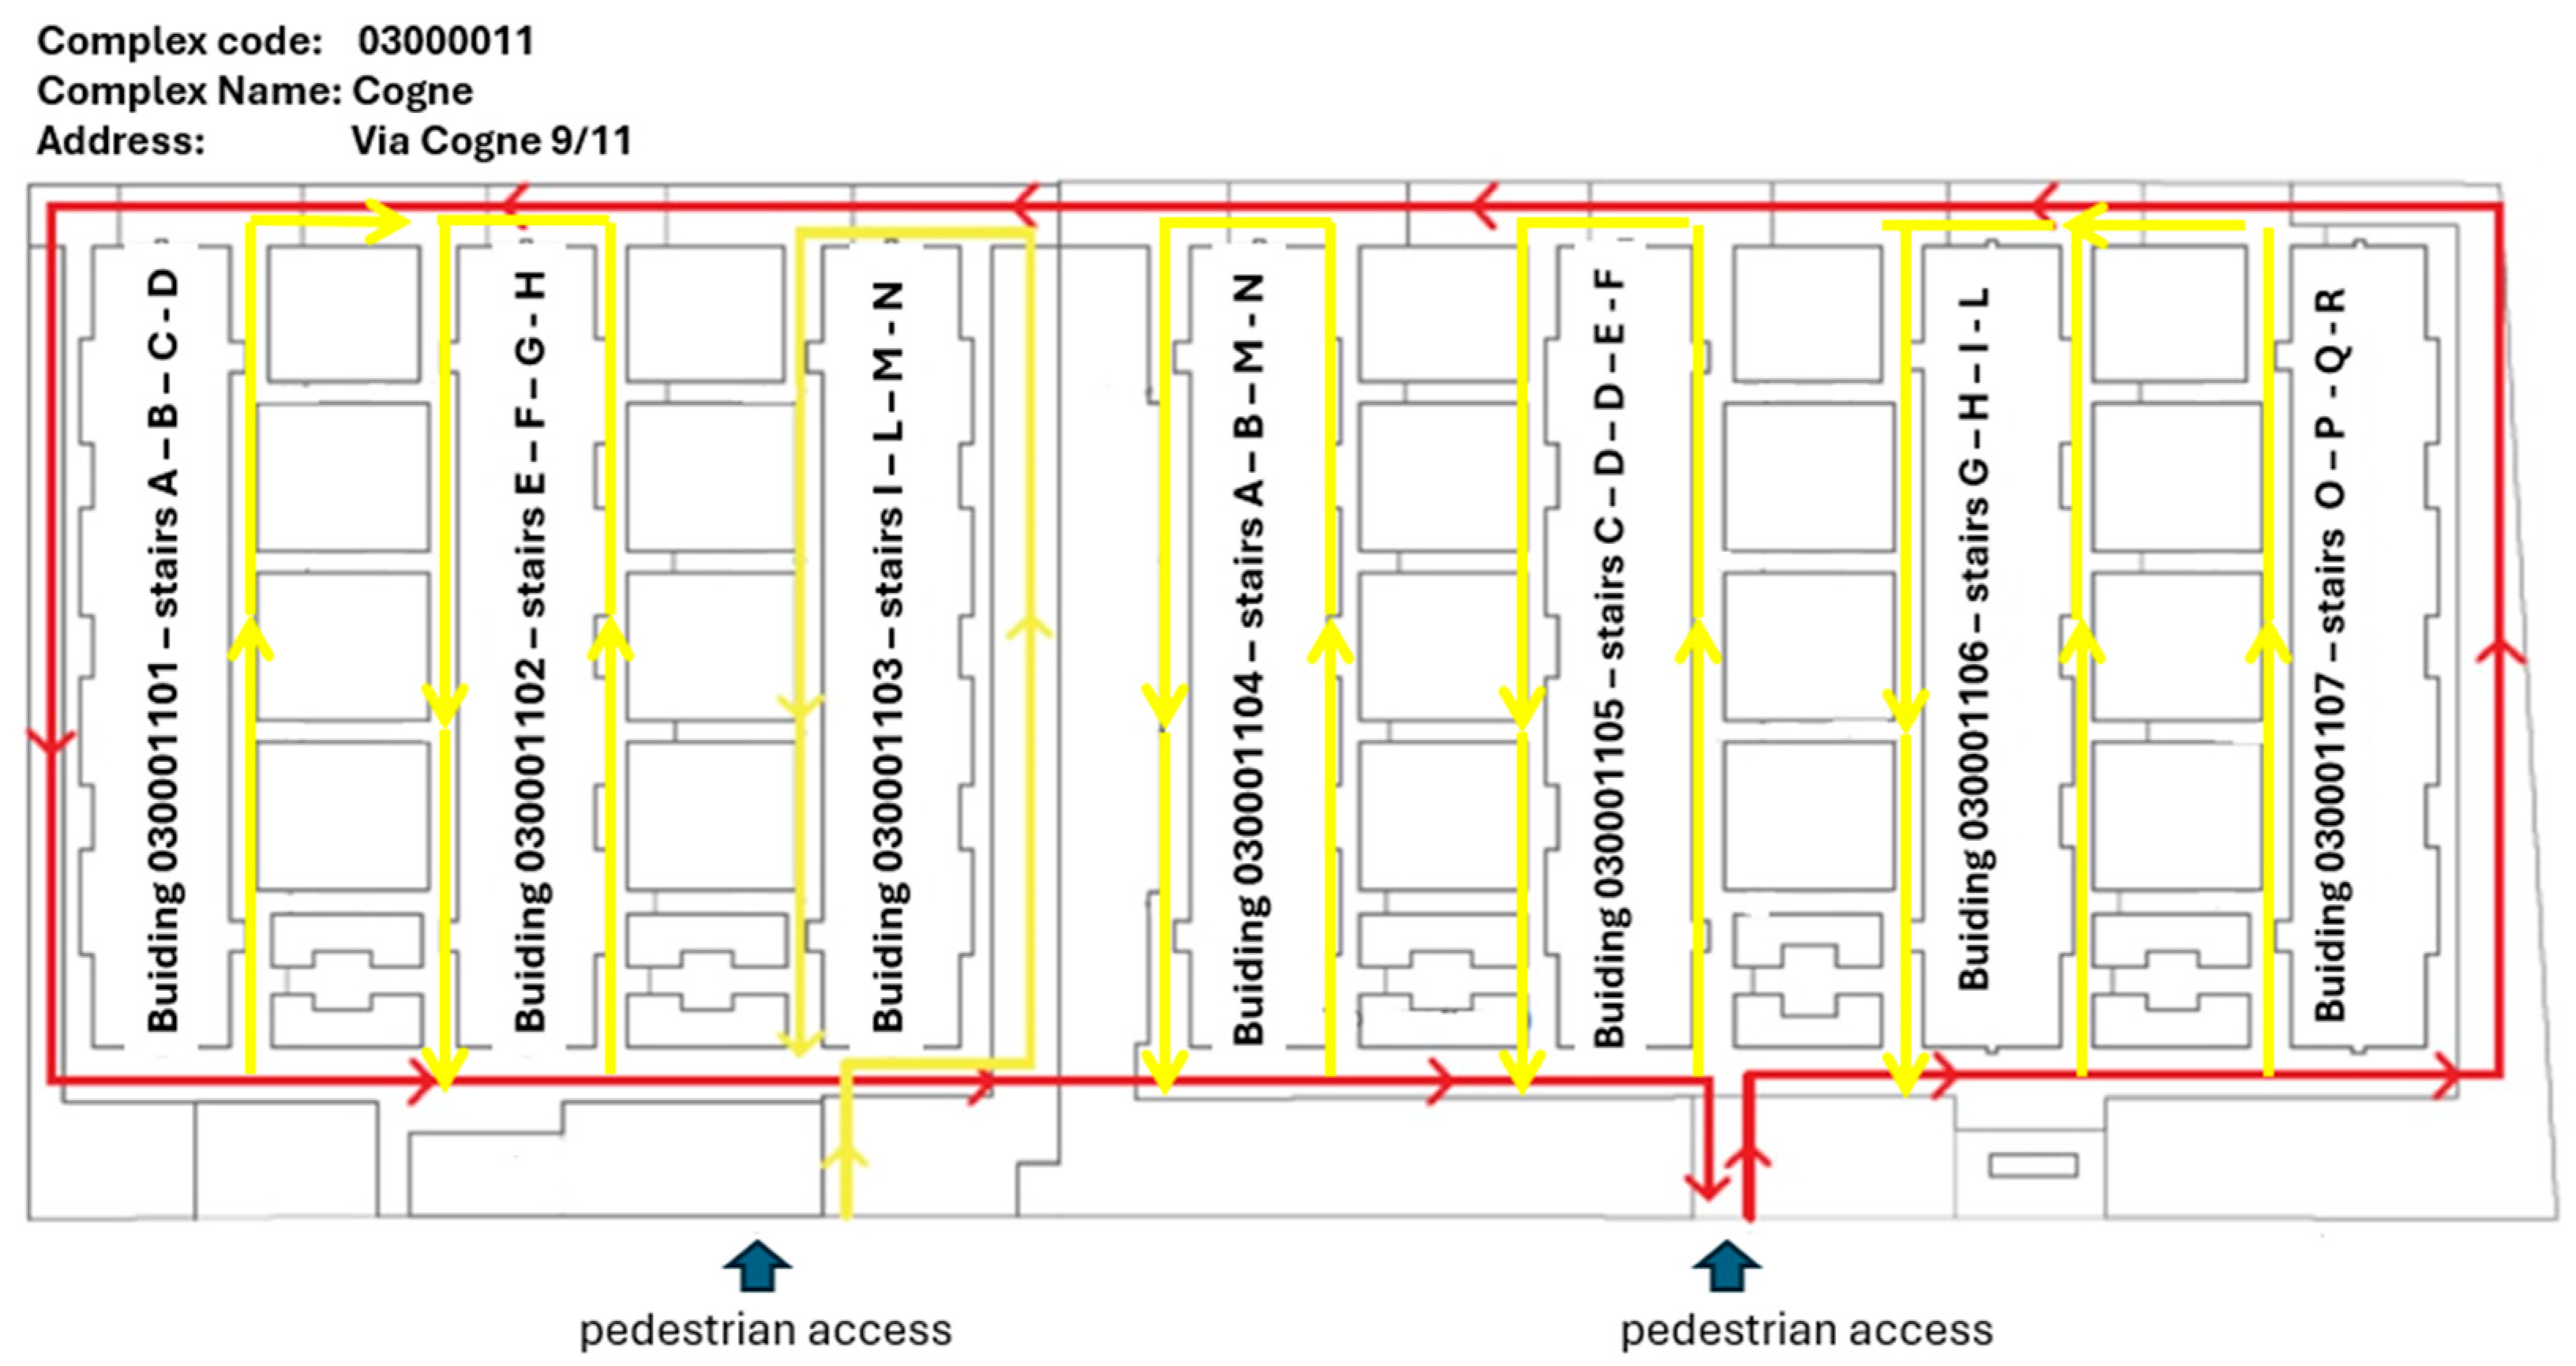
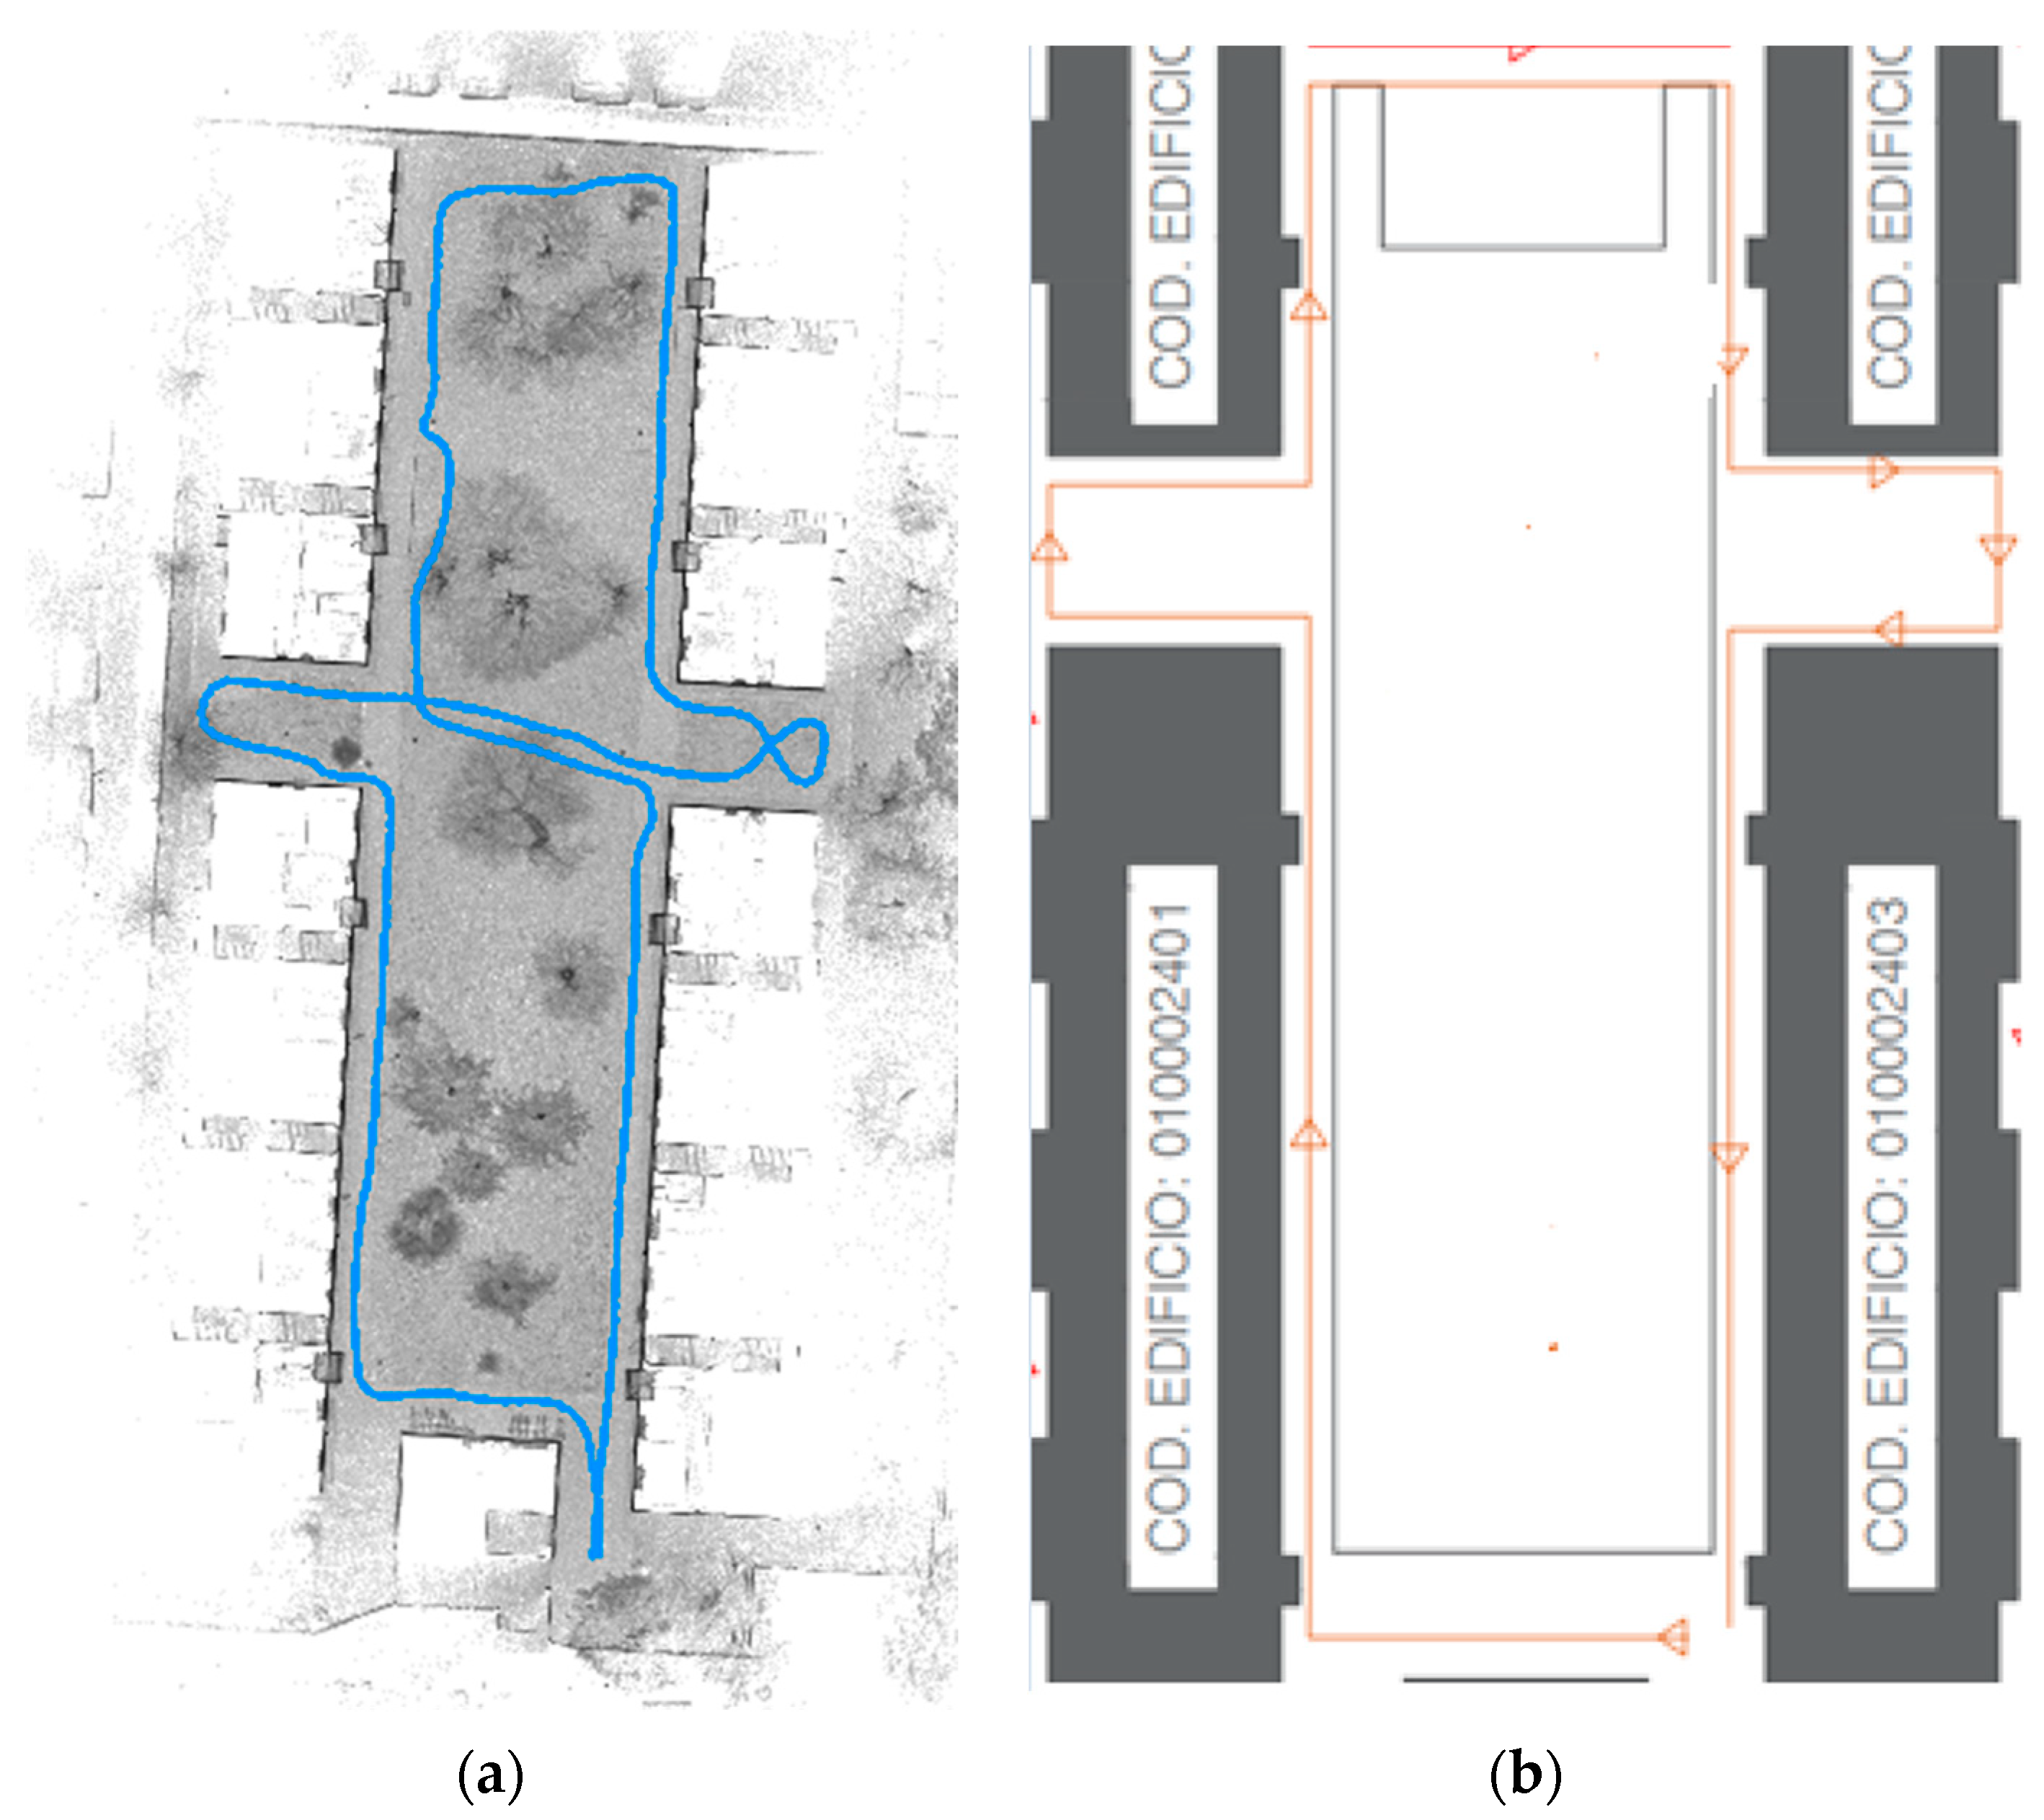
  • Indicate the routes/trajectories to be followed during the survey phases, verifying in advance that these routes are accessible and arranging for the opening of usually closed doors or gates. The routes should be designed to make the survey as efficient as possible;
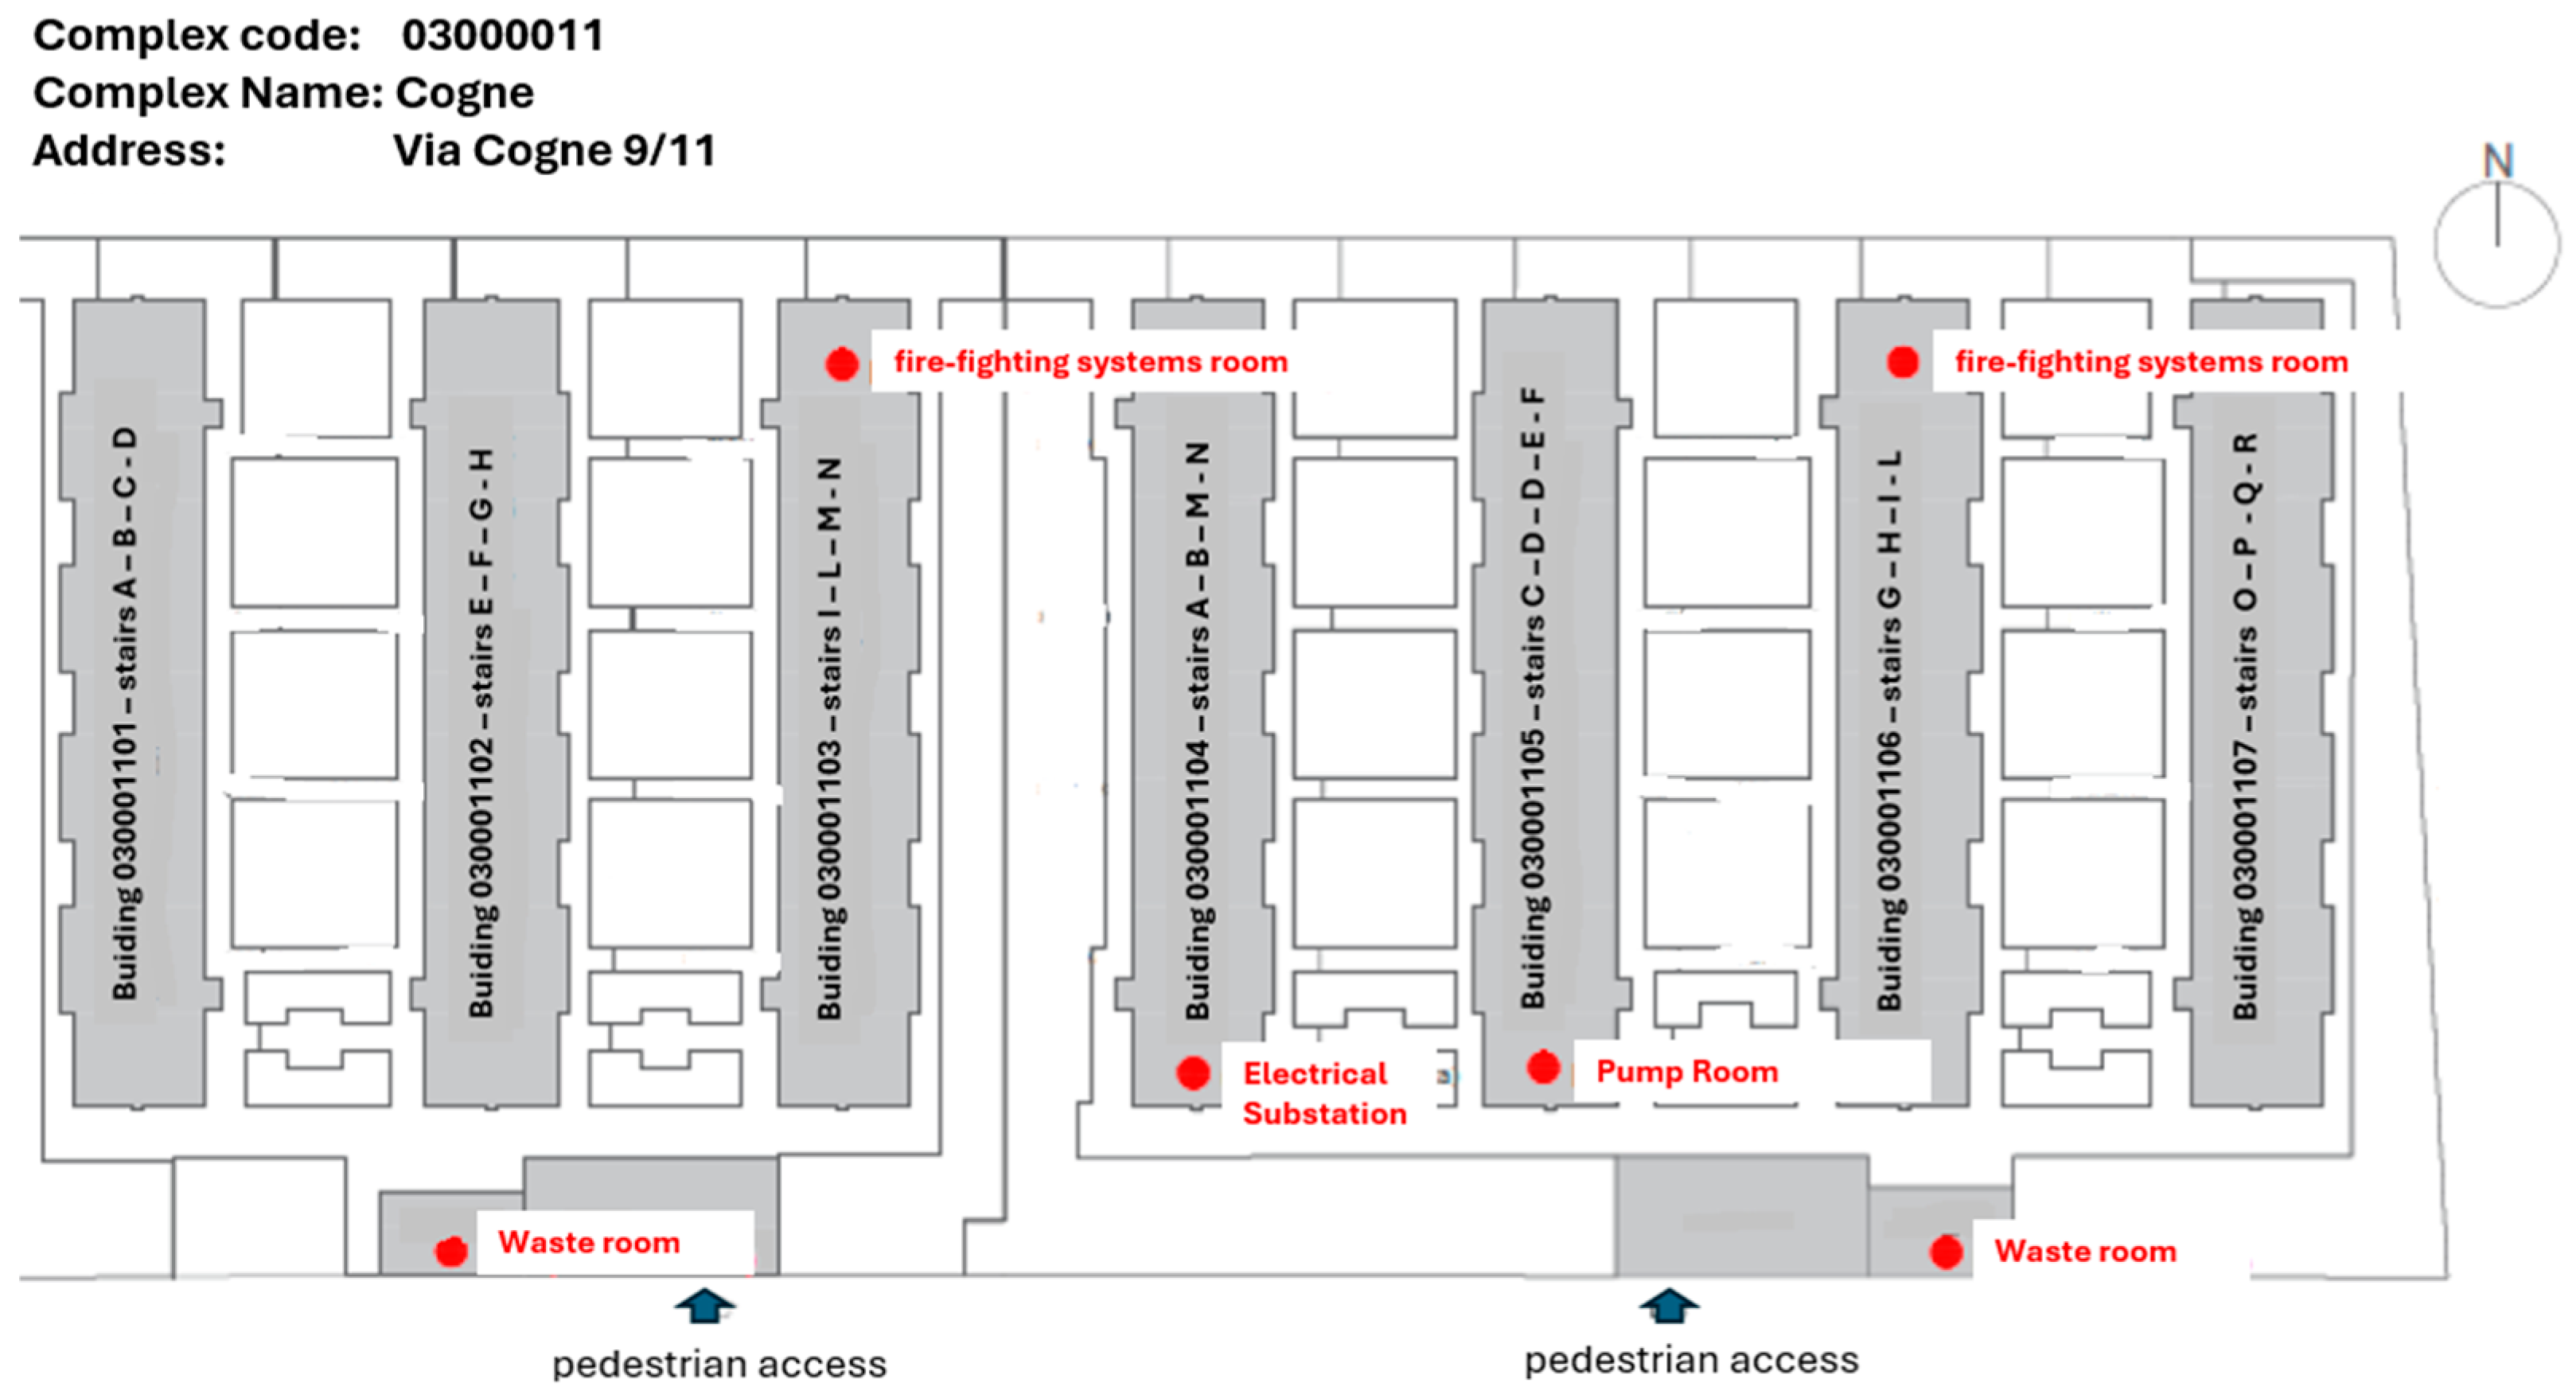
  • Indicate the location of technical and/or service rooms to be surveyed;
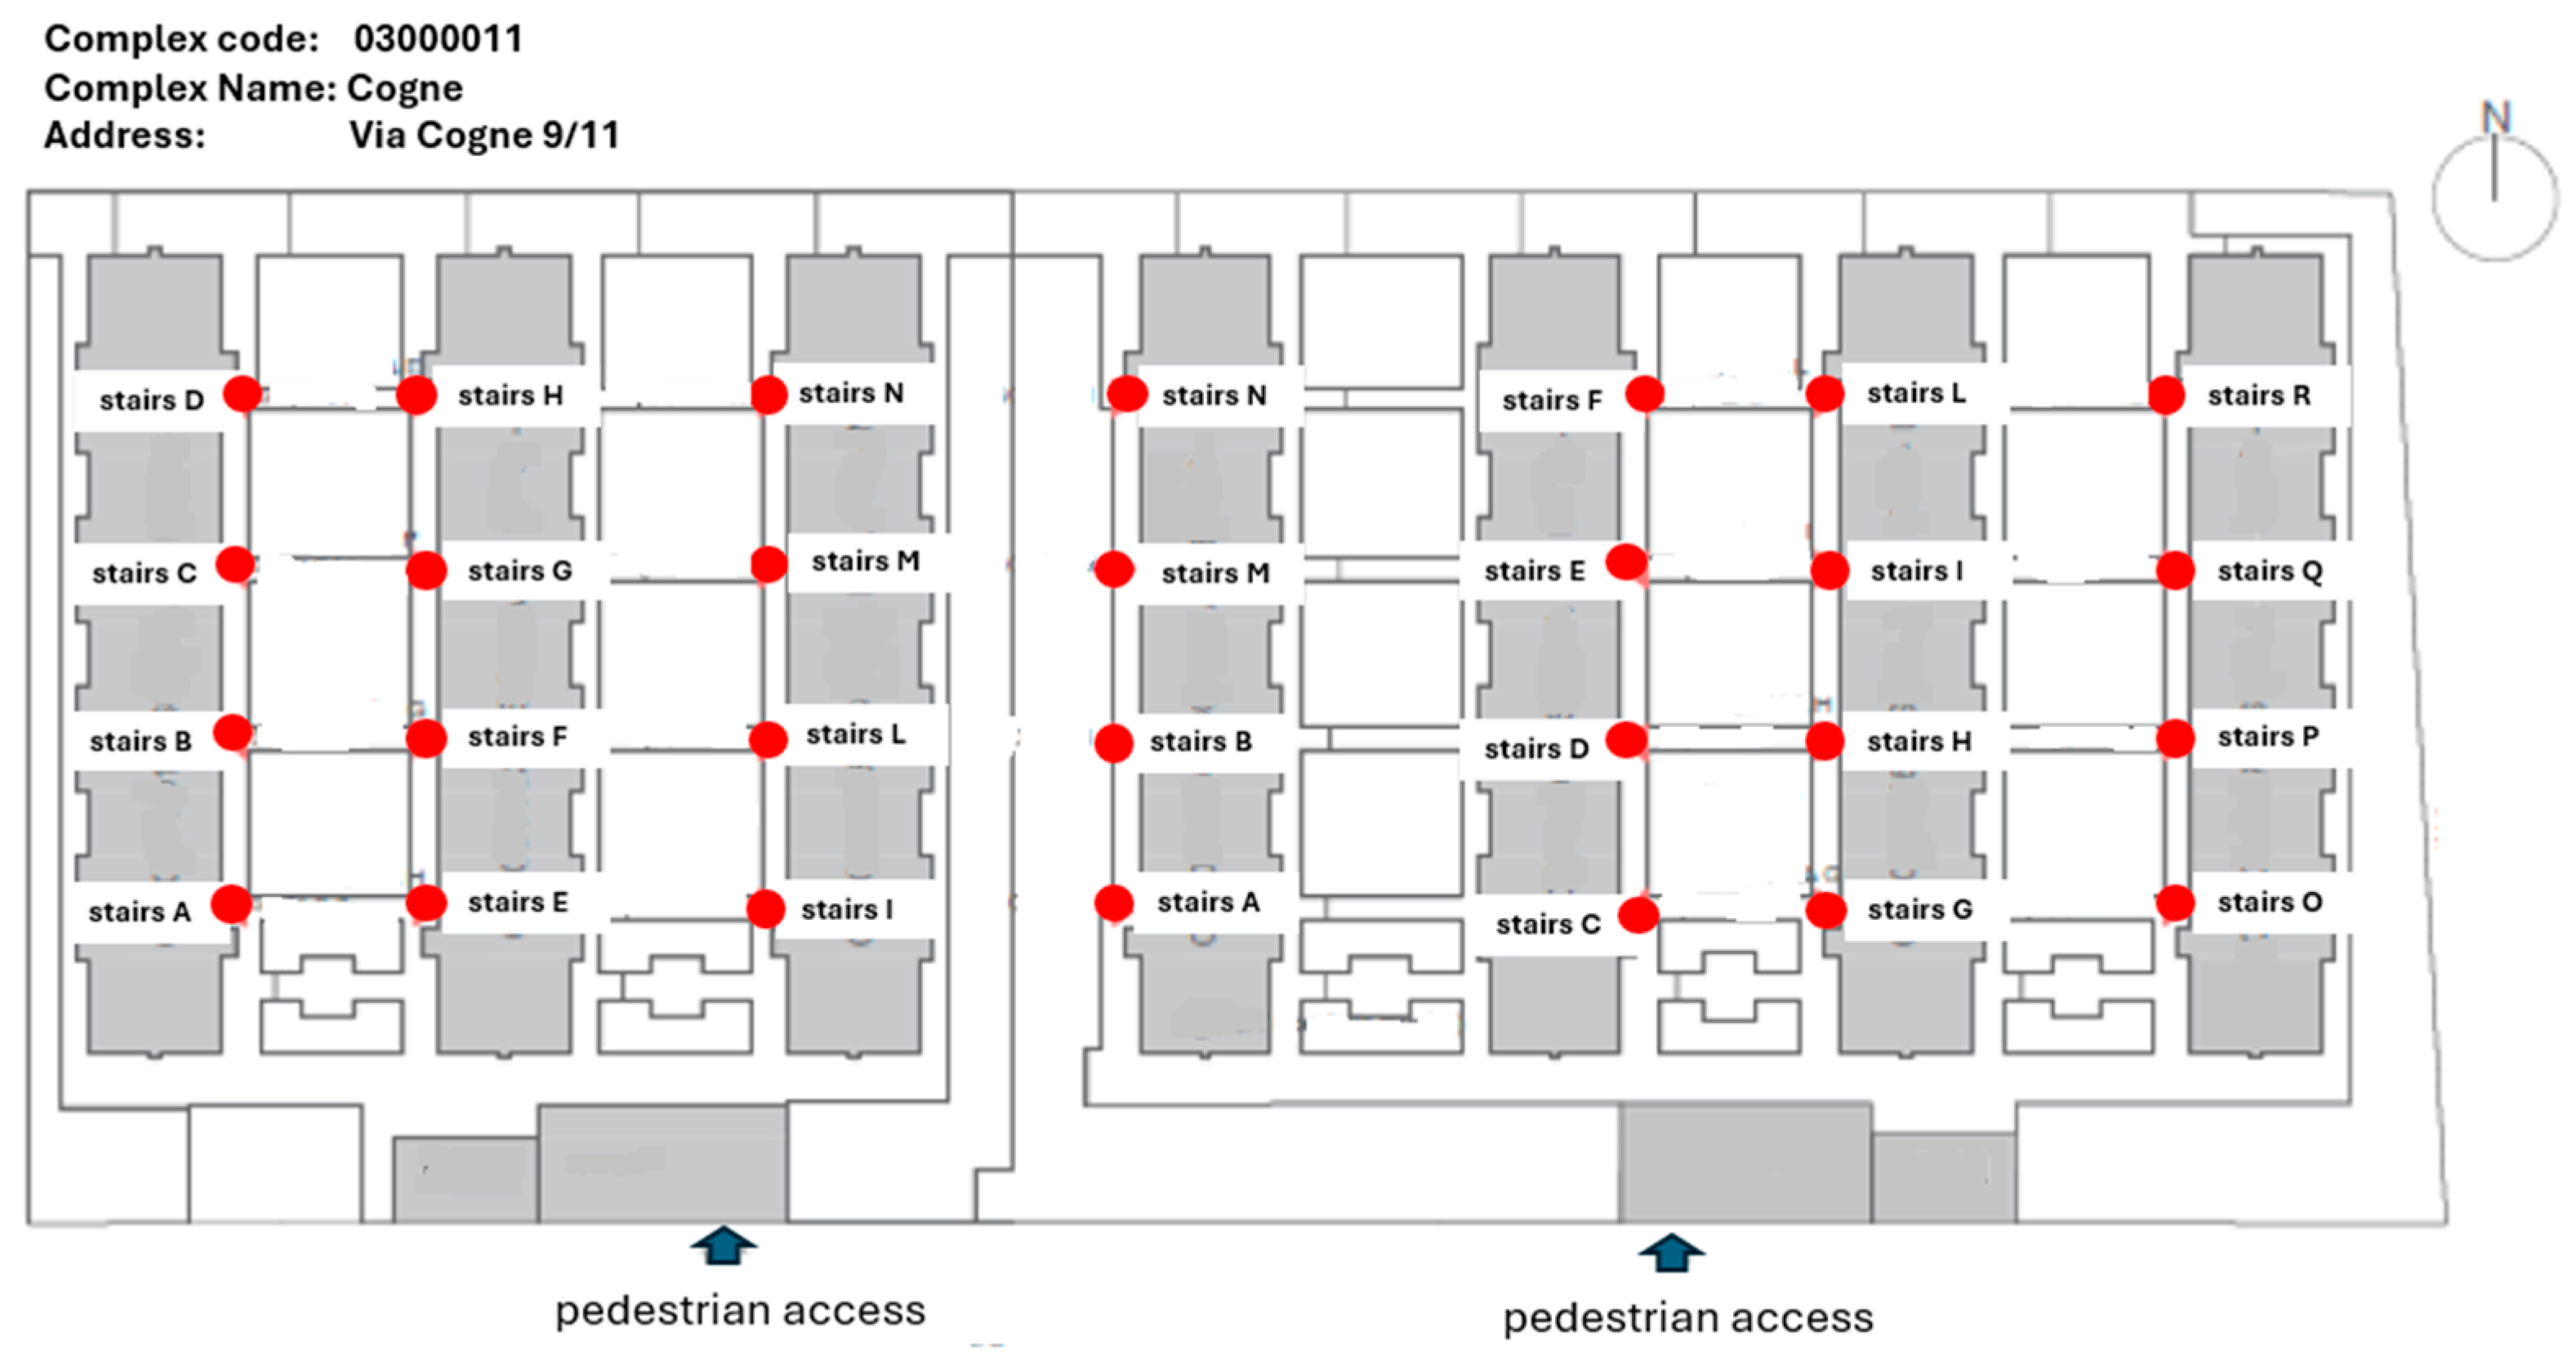
  • Associate each area surveyed with its name/identification code, as mentioned above, which uniquely identifies it. Indeed, the surveyor must be able to know without a doubt the name or code of the spaces he or she is traversing in order to associate that code with the spherical image acquired.
In the case of the Milan project, the areas to be surveyed are divided into three main classes, namely the survey of building stairs, the survey of areas outside buildings, and the survey of technical and/or service rooms. Below (Figure 19) is an example of how it was required to provide a plan of the location of the technical rooms in a building complex and an example (Figure 20) of the location and code for the stairs.
Figure 21 shows an example of how the exterior areas are to be surveyed, with the paths connecting the entrance of the staircases to the survey paths of the exterior areas. In particular, it can be noted that the path for the exterior area of the building complex (in red) is planned to minimize overlaps with the paths for surveying the exterior parts of individual buildings (in yellow). The union of the paths for surveying the exterior parts of the buildings (in yellow) will merge with the surveys of the individual staircases of the buildings. This is because the path for surveying the staircases begins in the exterior area of the building, intersecting the paths for surveying the exterior of the buildings (yellow paths).

6.5. Survey Report

Based on the surveys and the work schedule, the field mapping activity is documented with a survey report being produced. This document indicates the personnel who performed the survey activities and reports any problems that occurred and could have interfered with the survey activity. The survey report contains the surveying route followed by the surveyor (Figure 22a), compared to the survey path planned during operational report (Figure 22b).

6.6. Topological Structuring of the Spaces to Be Surveyed

In the Milan project, it has been requested to associate each recognized asset of the building with its location, not only in terms of coordinates but also in terms of its position within each area of the building (common area, corridor, hallway, floor landing, basement, outdoor space, etc.). This requirement differentiates the survey from the classical specifications of a traditional topographic and/or BIM-oriented survey, which mainly focuses on obtaining an accurate point cloud model to facilitate an appropriate scan-to-BIM process. The structure of the spaces in the complexes is quite simple and consists of surveying the staircases of the buildings, areas outside the buildings, technical rooms, and services (Figure 23). It should be noted that individual apartments, occupied by tenants, as well as appurtenances related to them, are excluded from the surveys.
Associating each spherical image with the appropriate building sector during the post-processing phase turned out to be a very challenging task in practice. In fact, if the association between the spherical photograph and the surveyed building space is performed in real time by the surveyor, this task is quick and accurate. However, performing such an operation in post-processing is particularly burdensome. Nevertheless, the Heron® instrument, like similar instruments of the same type, currently has limited tagging capabilities during the surveying activity, so the association between the image and the space, where possible, had to be done during the post-processing phase.

6.7. Virtual Photographic Tours Functional for the Geospatial Project

Essential to asset management activities is the capability of iMMS surveying to facilitate local three-dimensional measurements and to associate the assets within buildings with their respective areas. As previously stated, achieving global centimeter-level accuracy in topographic surveys of large complexes and buildings is unnecessary for cost containment. However, a certain level of geolocation accuracy is required to ensure the building can be correctly navigated, enabling the unique and topologically unambiguous identification of assets. This requirement is expressed in the need for a maximum deviation between points and/or pixels of contiguous spherical scans or images that are part of the same survey trajectory, rather than from different trajectories where the data overlap. The maximum allowable difference between neighboring data can be defined empirically on a case-by-case basis, depending on the assets to be recognized in the images, geo-localized in the model, and then moved to the database. In conclusion, it is essential to guarantee the model’s navigability and the corresponding alignment accuracy between images, rather than focusing solely on global accuracy.
The surveyed data should therefore enable surveyors to create virtual tours within the surveyed site to perform asset recognition, which is the purpose of the project. A specific feature within the Reconstructor® data post-processing software (version 4.4.2.), provided by the Heron® instrument manufacturer, facilitates the creation of virtual tours of the surveys (Figure 24). While navigation with this tool is efficient, collaborative navigation within web-based platforms is typically preferred for this purpose.

6.8. Survey Deliverables

The surveying process will produce the deliverables presented in the next sections.

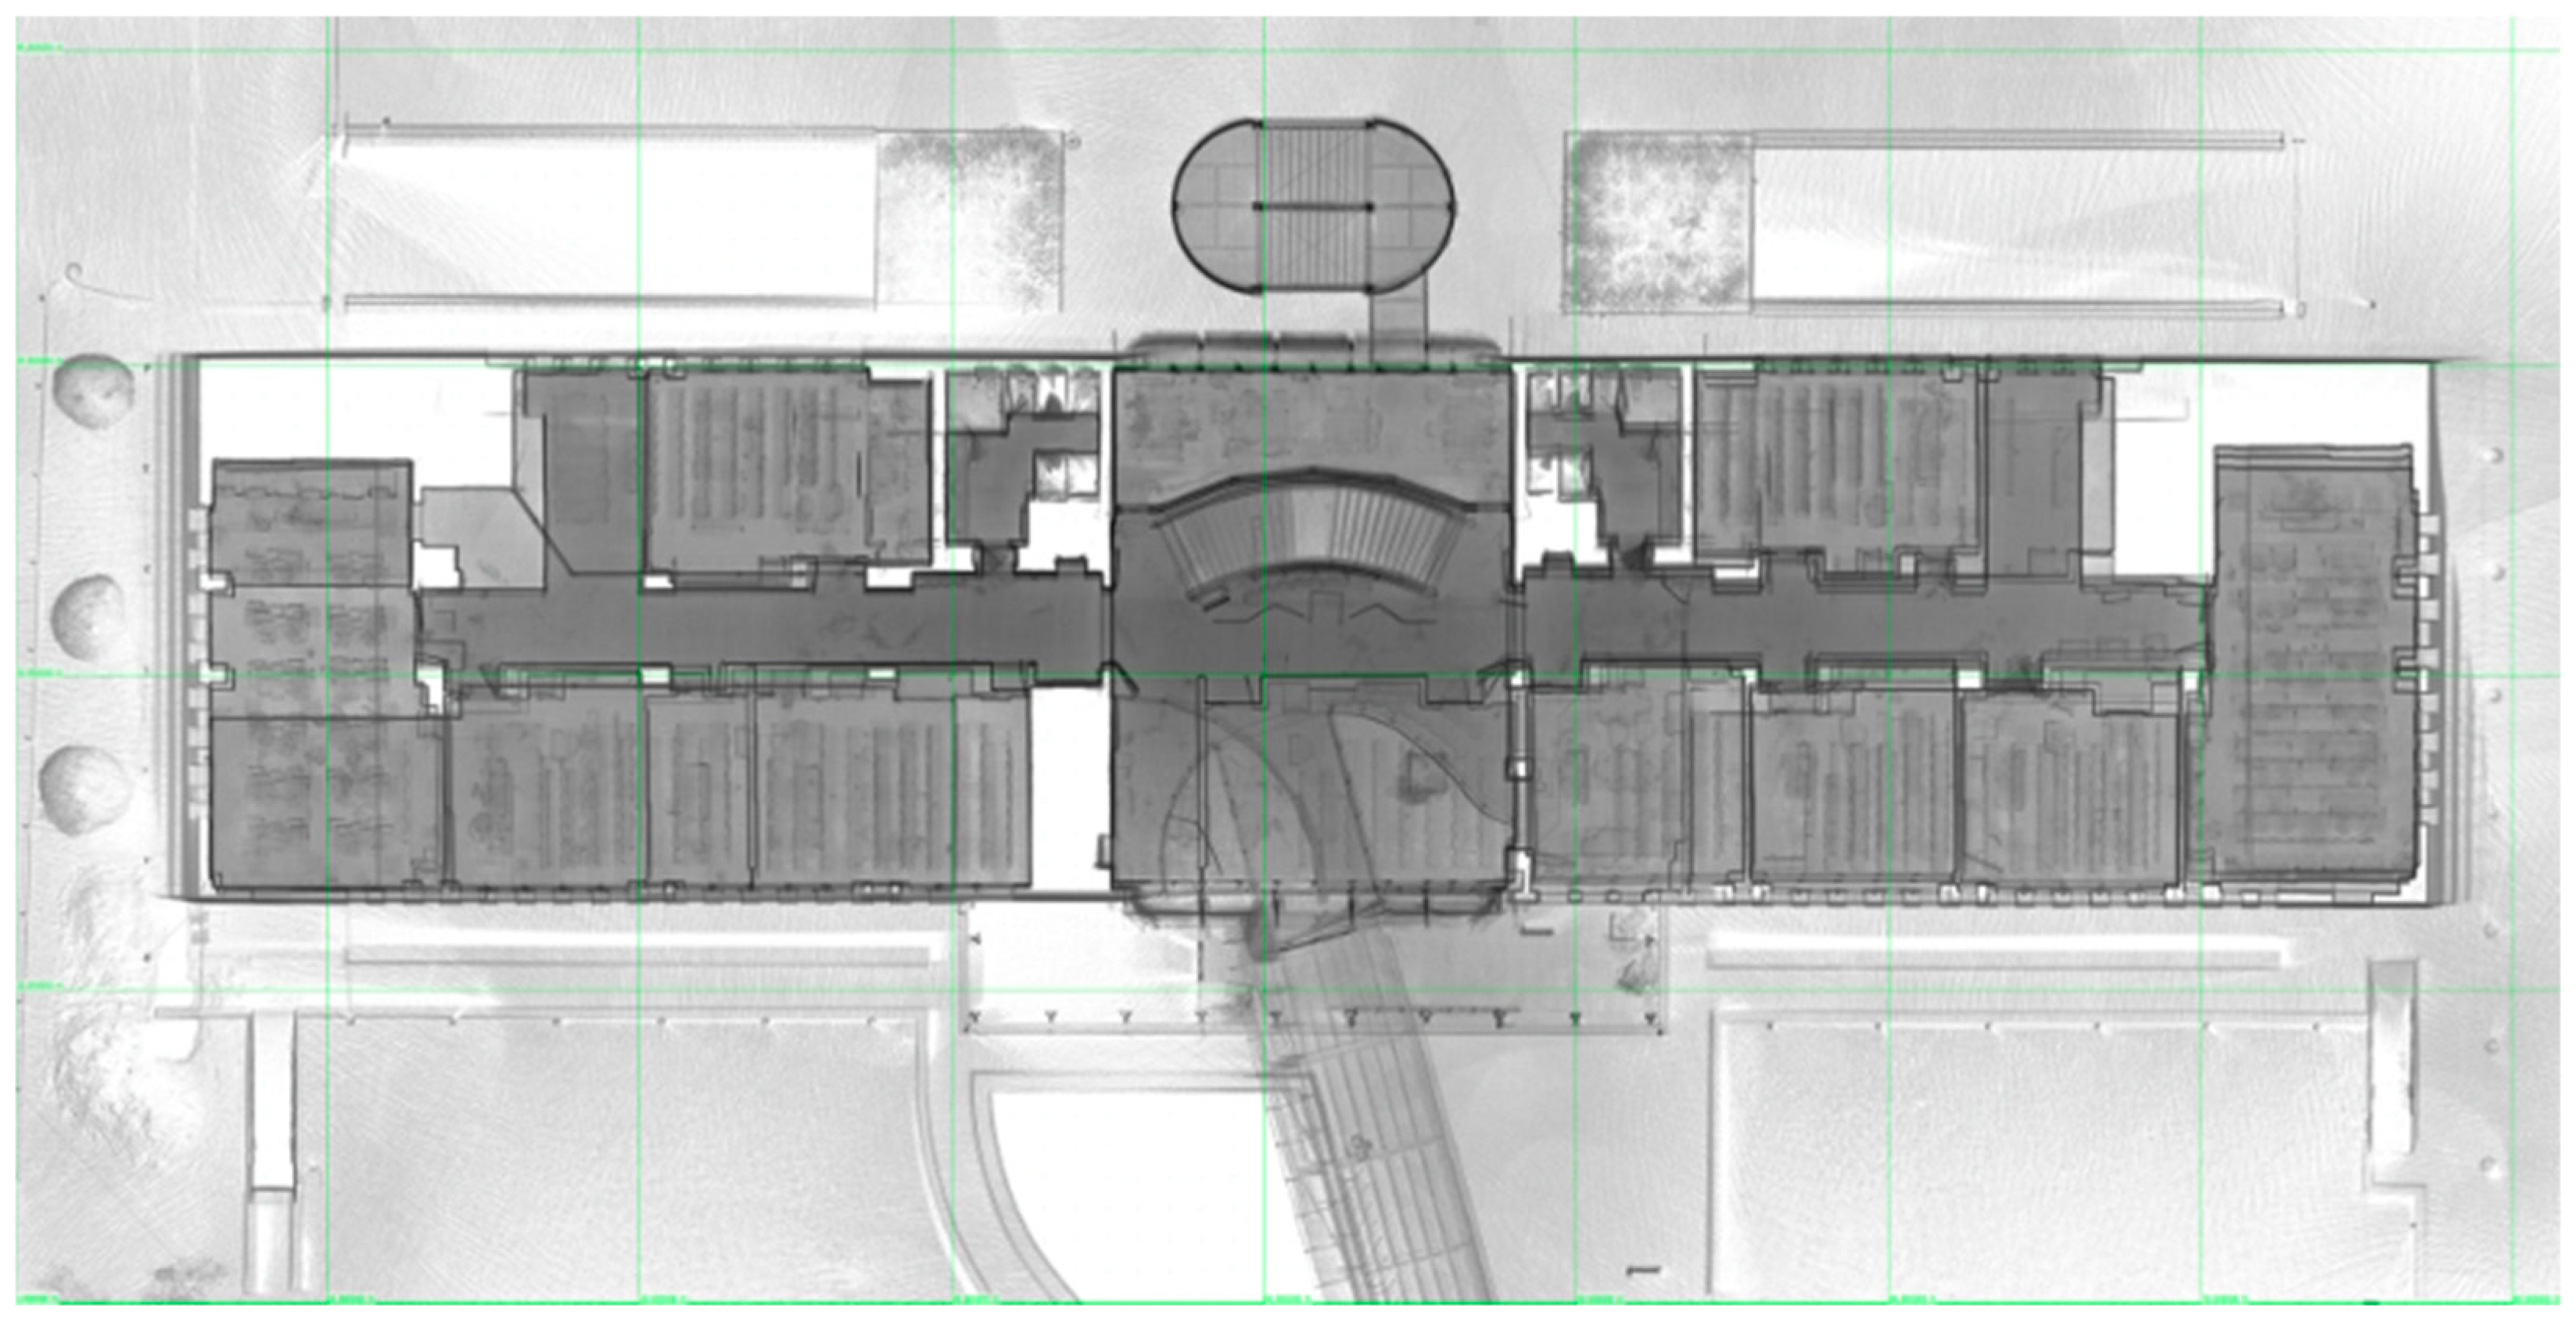
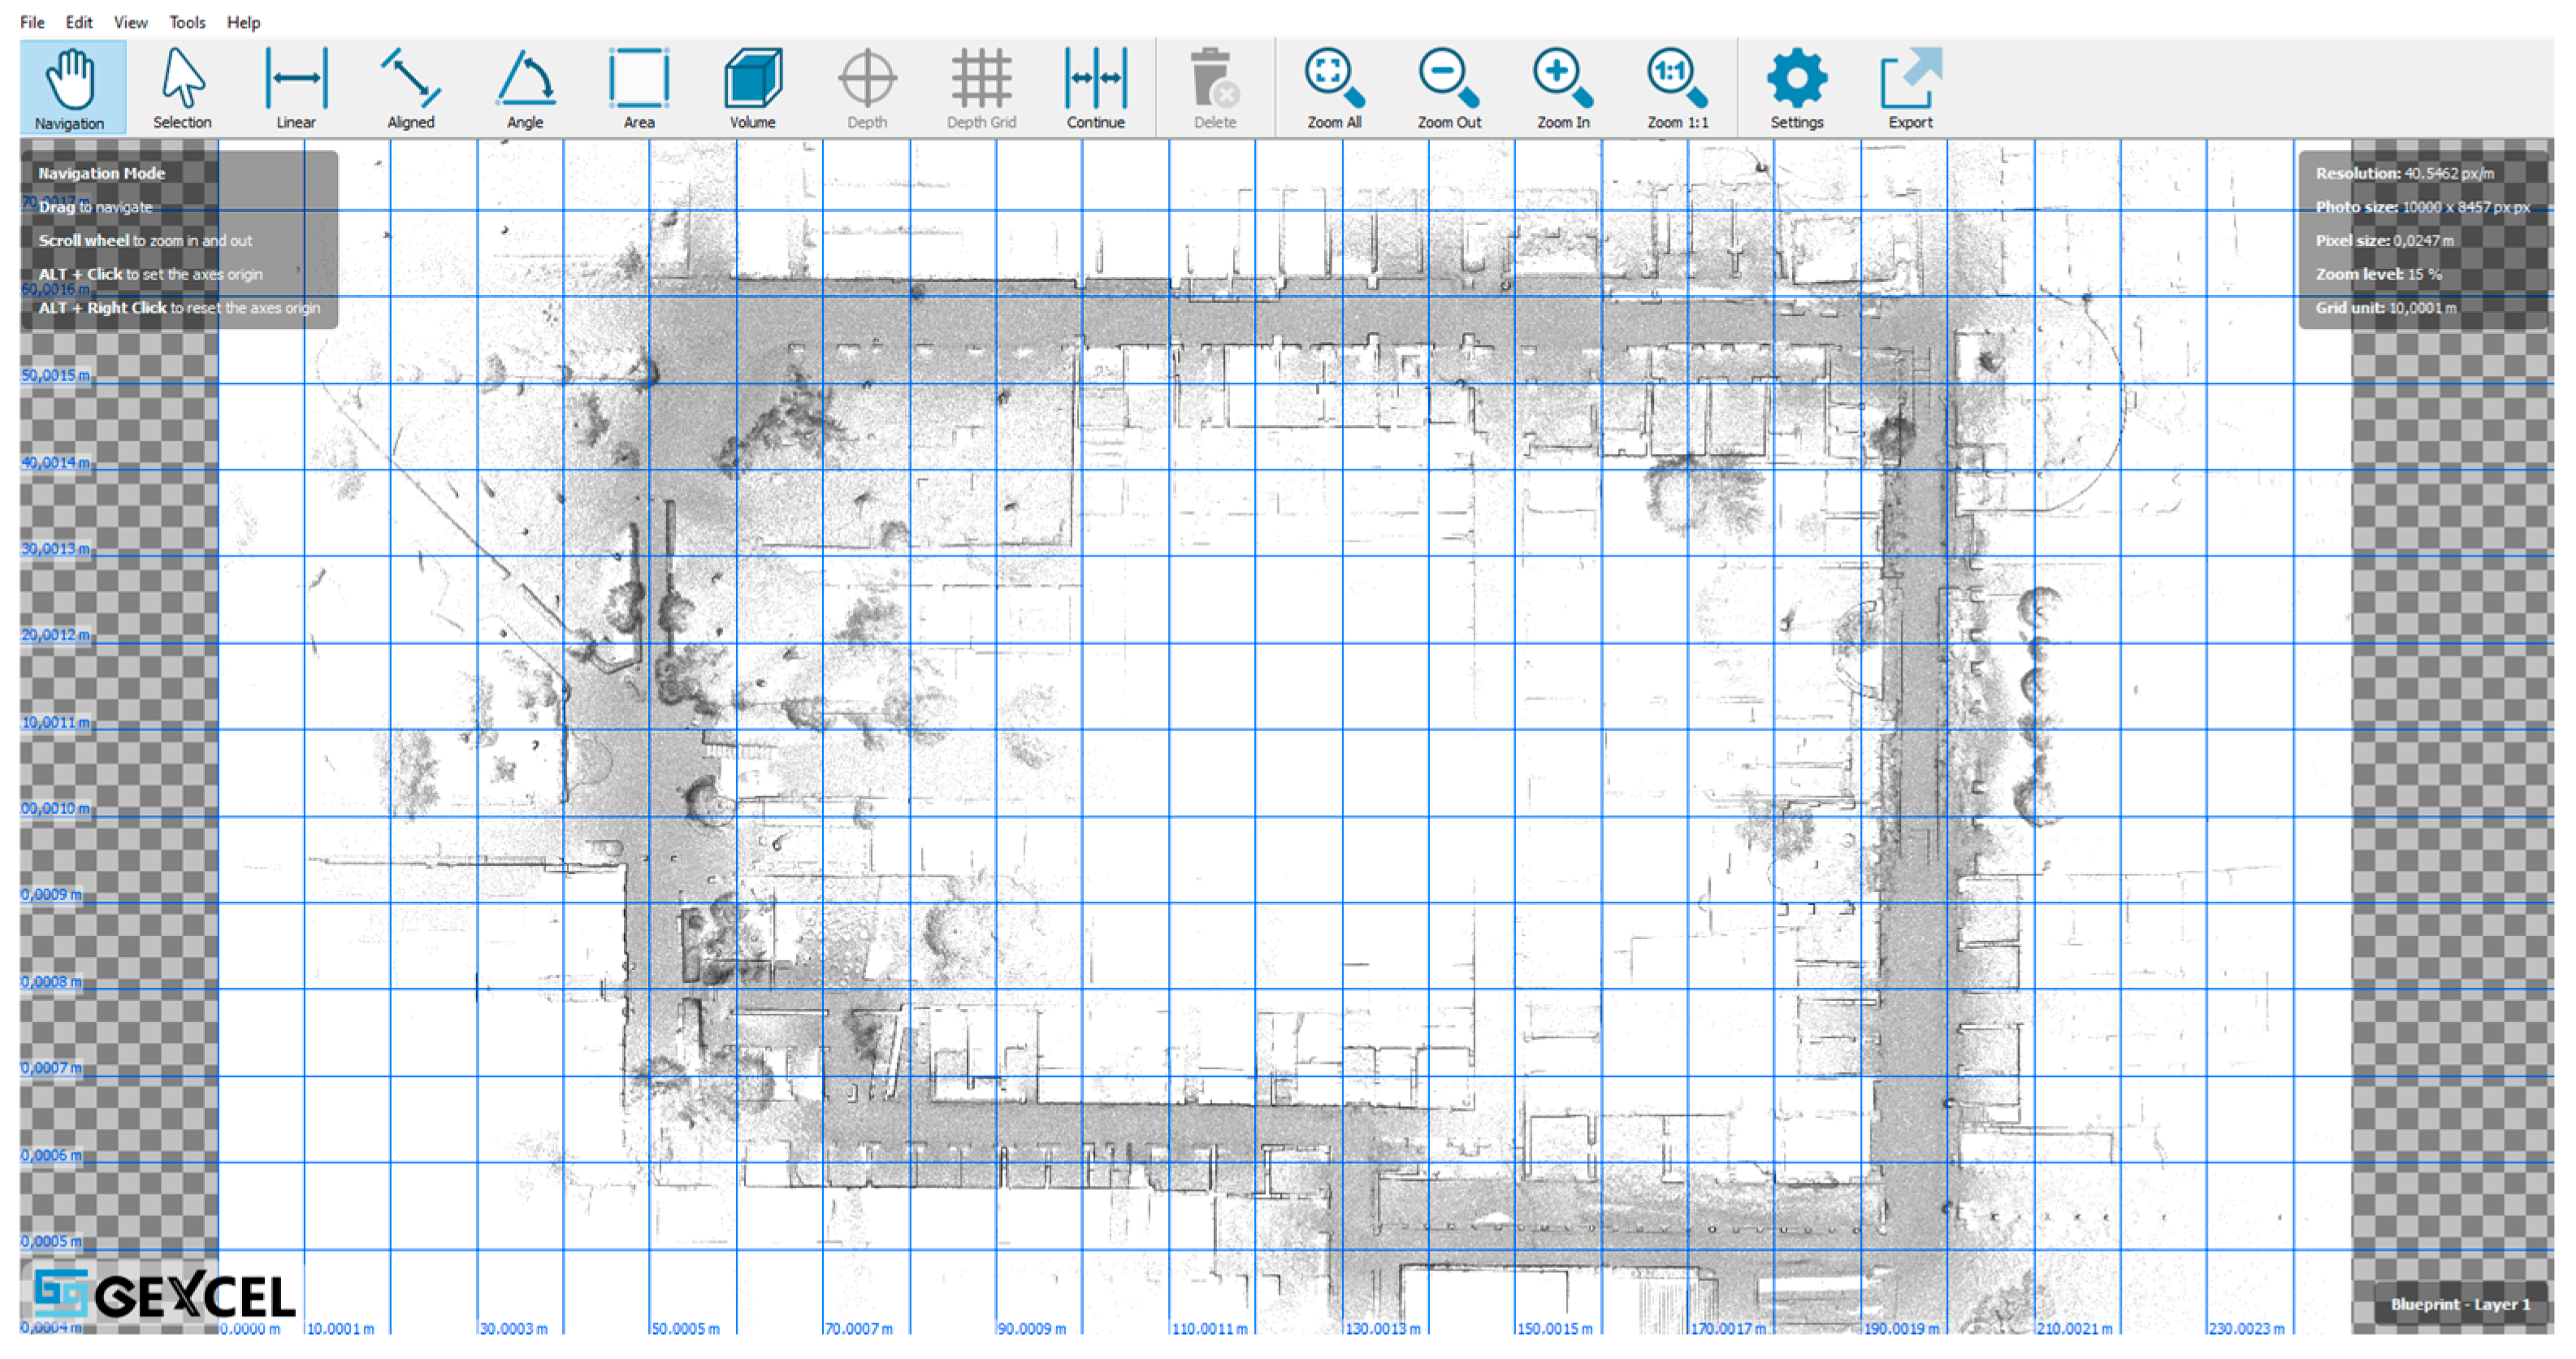
6.8.1. Blueprint Images of Surveyed Areas

By traversing the areas of the buildings, the mobile mapping system creates a three-dimensional survey of the locations. The 3D model, although rich in information, is difficult for non-specialized personnel to consult directly. For this reason, in the Milan survey, it was also possible to produce blueprint plans of the mapped areas by creating an orthophoto of the point cloud. These orthophotos are generated in a scaled JPG image format, which can be opened either in graphic CAD software or in image management programs. A free app is also provided, running on any Windows platform, that allows the blueprint to be viewed (Figure 25) and distances, areas, and elevation differences to be measured with a simple interface. This allows even operators who are not experts in CAD or 3D management platforms to take measurements in the surveyed areas.

6.8.2. Point Cloud with the Associated Spherical Images

For each complex, the survey provides a point cloud model with spherical images. The raw data acquired by Heron® are post-processed with the SLAM algorithm in the Heron Desktop® software, which produces a point cloud model in PLY format. The point cloud model and the images are later transferred to the point cloud software, Reconstructor®, which handles the model georeferencing, editing procedures, and final registration (if needed) with point clouds from static scanners or other Heron® surveying equipment. The project structure in Reconstructor® is named RECPRJ. Directly from the Reconstructor® platform, it is possible to extract the point cloud and co-registered spherical images in E57 format so they can be transferred to third-party applications.

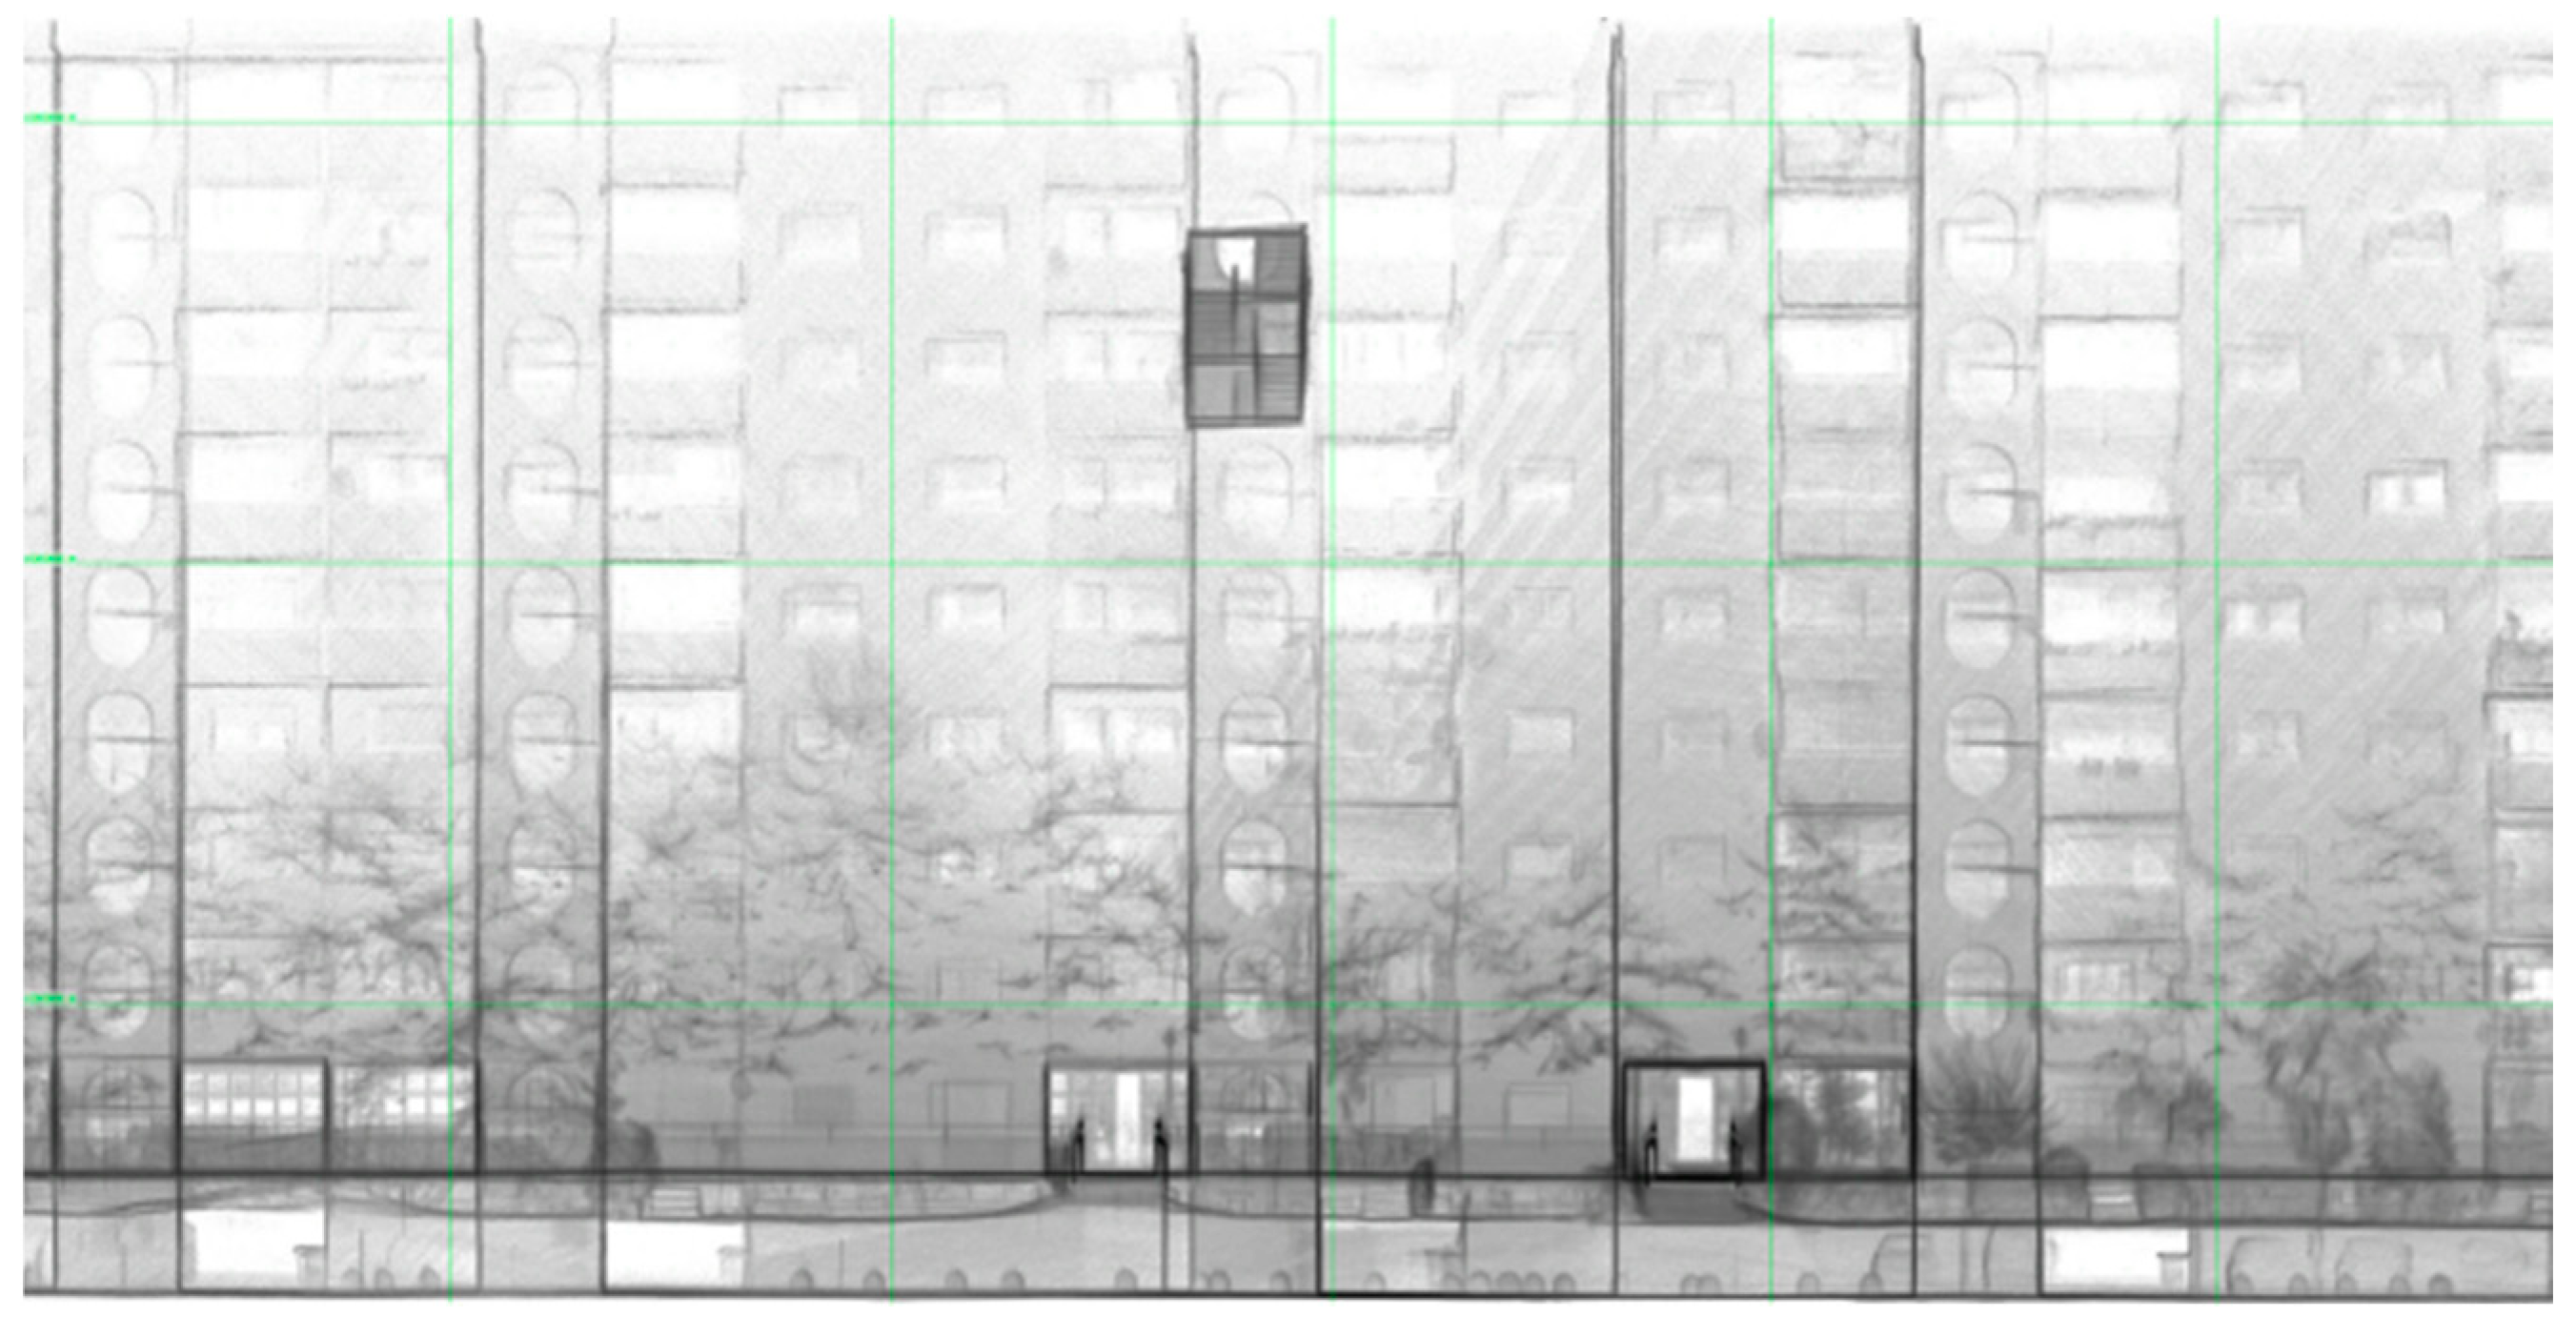
6.8.3. Building Facades Orthophoto Pictures

In addition, although this aspect is beyond the scope of this article, the Milan project required that expedient orthophotos of the point cloud of the buildings’ facades, at a scale of 1:200, be provided using terrestrial laser scanners (Figure 26). The term ‘expeditious’ indicates that the scans were to be performed without topographical support, allowing for potential occlusions in the orthophoto or non-detection of the facade in cases where there were logistical difficulties or challenges in viewing the facades themselves.

6.9. Confidentiality of Data

A crucial aspect, increasingly required in many fields, is the establishment of data confidentiality protocols. Leaving aside issues of quality and regarding privacy of the company’s data management infrastructure, with respect to survey activities and instrumentation characteristics, a few key points should be highlighted.
(a)
First, LiDAR-based systems, even more so if equipped with a camera, are able to acquire a digital twin of the surveyed environments with extreme care and detail. Even the raw data, before its processing, contains sensitive and detailed information. Therefore, if the surveying activity is performed not by the owner of the instrument but by an external service firm, confidentiality rules may require that the data not only be handed over to the client immediately after the completion of measurement operations but also that such data not be stored in the instrument’s memory so that it can be retrieved, even if physically erased from such storage devices. As such, instruments with data storage on removable physical storage media (such as memory cards or USB sticks) may be required.
(b)
Second, the spread of cloud-based data processing services, where the data processing software is not provided to the surveyor but rather takes the form of an online data processing service, may involve uploading the raw data to an online portal. Once data processing is completed, the result is shared with the surveyor. Again, before proceeding with the activation of such procedures, it should be verified with the site owner whether such online data sharing, even if limited to the raw data processing operation, may be permissible under the management and confidentiality protocols of the client. Particularly in industrial or sensitive sites, such procedures may not be allowed. In the case of the Milan project, the issue of sending data for cloud processing did not arise because the chosen instrumentation provides, along with the instrument, the appropriate software for on-premise data processing.

6.10. DB Structure to Be Populated

MM has a structured database that contains a list of approximately 211 items and assets in the common areas of its buildings, each with different attributes to be surveyed and documented. The main purpose of the Milan project was to populate and update that database. This process must be performed by MM technicians, who, by observing the images acquired in the field, must associate each area of the building with the assets present in that area. The recognition, at the moment, must be done in a direct way, and machine learning algorithms, although present in the literature, have not yet been implemented and tested for these activities. The survey must be carried out so that these assets can be recognized in the pictures captured by the mobile mapping system and localized in the correct spaces (e.g., complex/building/stair/level of the stairs). It is therefore obvious that the quality of the images must enable such recognition.
The complexity of asset recognition lies in the fact that a range of collateral information, often very specific, is required for each item. For example, for the item “architectural barriers”, several attributes and data need to be documented, such as:
  • Presence of elements that prevent, restrict, or make it difficult to move or use services, especially for people with limited motor or sensory capacity;
  • Check if entrance halls, hallways, and distribution spaces, in general, have adequate width for the passage of wheelchair users;
  • If the main shared spaces are equipped with furniture elements arranged in such a way as to allow easy mobility and usability for wheelchair users;
  • If indoor floors are made of non-slip materials and free of obstacles;
  • If there are present elements that prevent, restrict, or make it difficult to move or access to services, especially for people with limited mobility capacity or sensory capacity;
  • If there are present solutions to overcome the existence of architectural barriers.
As can be seen, the characteristics of the attributes for each item can also be very complex and difficult to process by automatic systems, although it is assumed that the implementation of artificial intelligence procedures will soon be capable of providing important support for such recognition.

7. Asset Recognition from Images and Populating the Database

7.1. Mobile System Survey Trajectories

In order to enable the technicians to recognize the assets in the different images, it is necessary to ensure the possibility of virtual touring within the survey by the technicians themselves. Therefore, it is first necessary that all trajectories for each building complex are joined together to create a unique point cloud model for the entire complex. This requires that all survey trajectories have an overlap zone with other survey trajectories. When designing surveying paths, it is important to avoid unnecessary redundant detections in the same areas, so surveyors should avoid passing through the same areas’ multiple times as much as possible. On the other hand, a minimum overlap between surveyed areas must be ensured so that they can be joined together to create a single model for the entire building complex. As mentioned earlier, this approach is not optimal in terms of achieving the maximum overall accuracy of the three-dimensional model. However, it allows for having a single model while simultaneously minimizing the size of the surveyed data and reducing the areas of criticality due to the presence of duplicate data in the three-dimensional navigation. An example of this type of path design is shown in Figure 21.

7.2. Trajectory Detection Specifications

Therefore, it is necessary to ensure that, in the case where the surveying trajectories cross each other, the deviation between the spherical photos is less than or on the order of magnitude of the smaller objects to be detected in order to allow their unambiguous identification in the images. Since the smallest elements to be subjected to stacking are the electrical network sockets and switches, a value empirically estimated at 4 cm was set as the limit of geometric deviation between three-dimensional models corresponding to the spherical views. One method of avoiding multiple spherical photos in the same survey area, taken from the same or multiple survey trajectories, is to set up a filter that deletes from the final result the images that are closer than 5 m. Due to the problems that arise from having multiple images acquired in the same area, it follows the good practice to minimize the areas of overlap between surveys with mobile systems. Particularly critical, therefore, are trajectories that, inside or outside buildings, connect through trajectory crossings or overlapping of the same common parts, such as garages, stairs, interior corridors, and paths outside buildings. This guideline, in strictly geospatial applications, conflicts with the operating mode used by SLAM instrumentation, and in particular by the Heron® instrument employed here, which specifies that in order to obtain the highest possible global accuracy from geometric surveying, it is necessary for trajectories to cross frequently and for the areas of overlap detected by different surveying passes to be numerous. It should be remembered that such a procedure is recommended in order to have a very accurate final three-dimensional model of the building complex, a fact, however, that is beyond the requirements of the project.

7.3. Virtual Tour Approach

7.3.1. Model Navigation Modes by Virtual Tour

In order to ensure a virtual tour of the entire complex, i.e., to guarantee continuous navigation within the building complex, it is necessary that all survey trajectories made with Heron® be joined and connected to each other. Continuity of navigation does not require the trajectories to be geometrically accurate, but it does require that, at points of overlap or transition between trajectories, the transition occurs smoothly and without discrepancies.

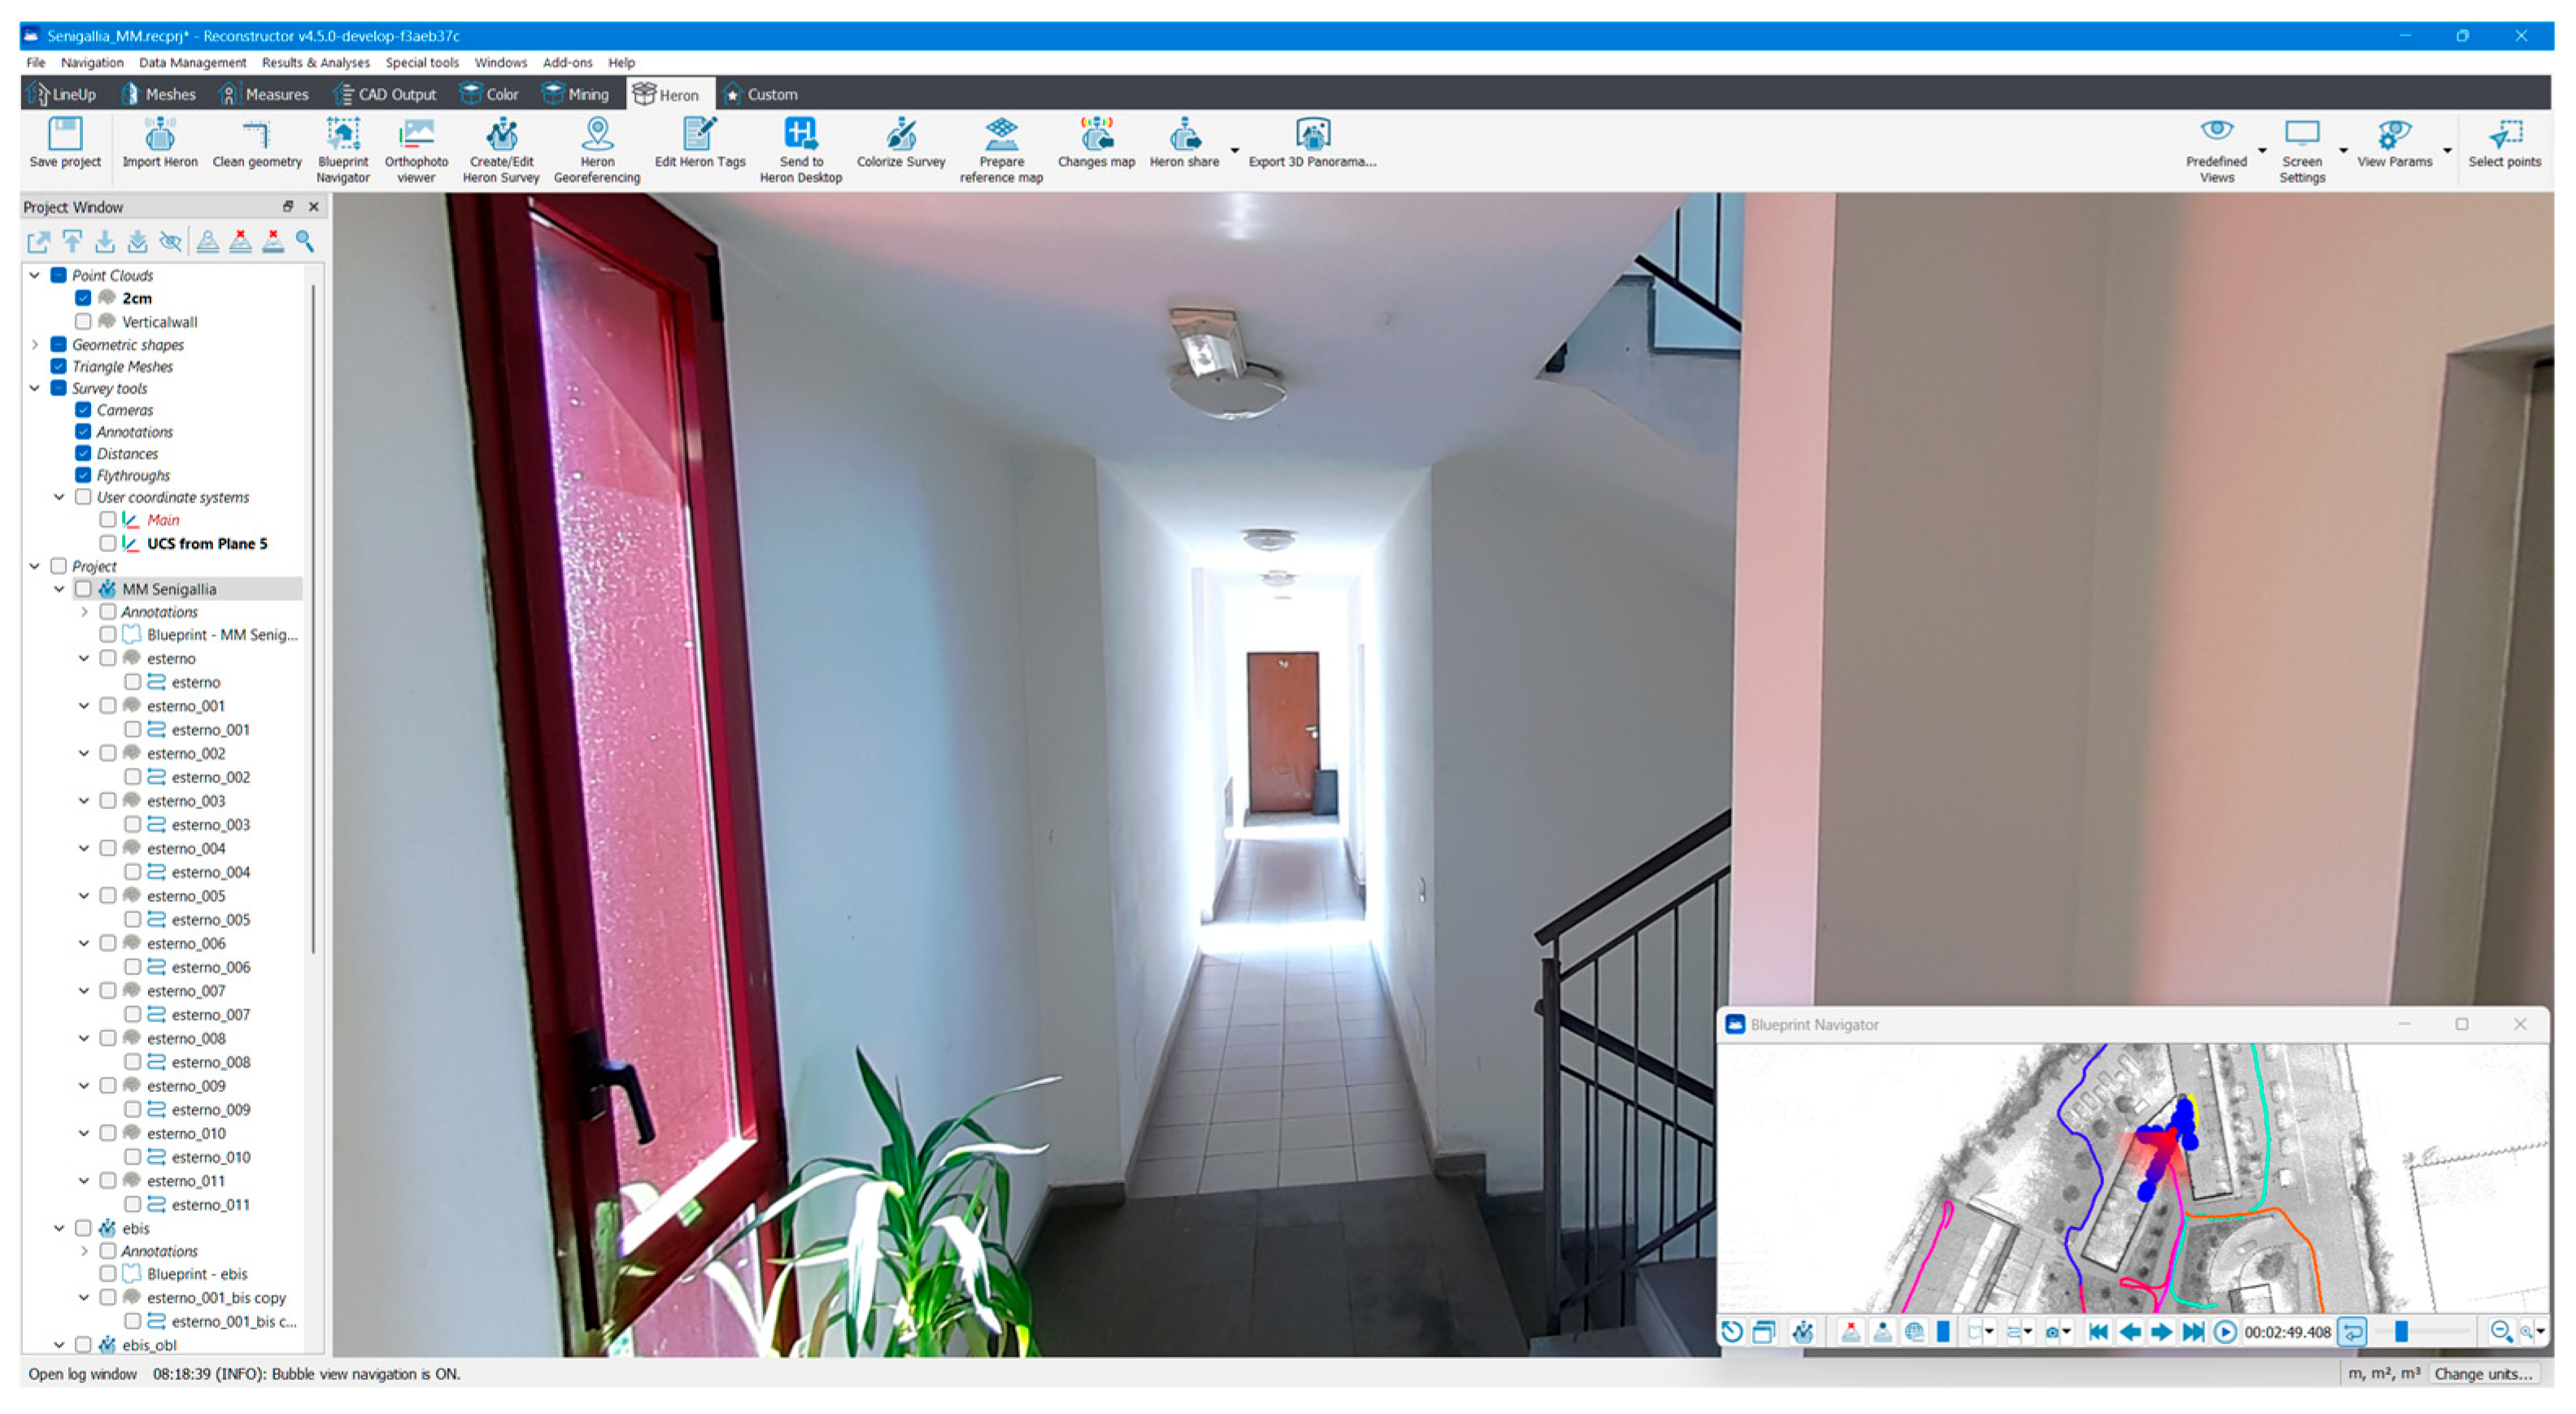
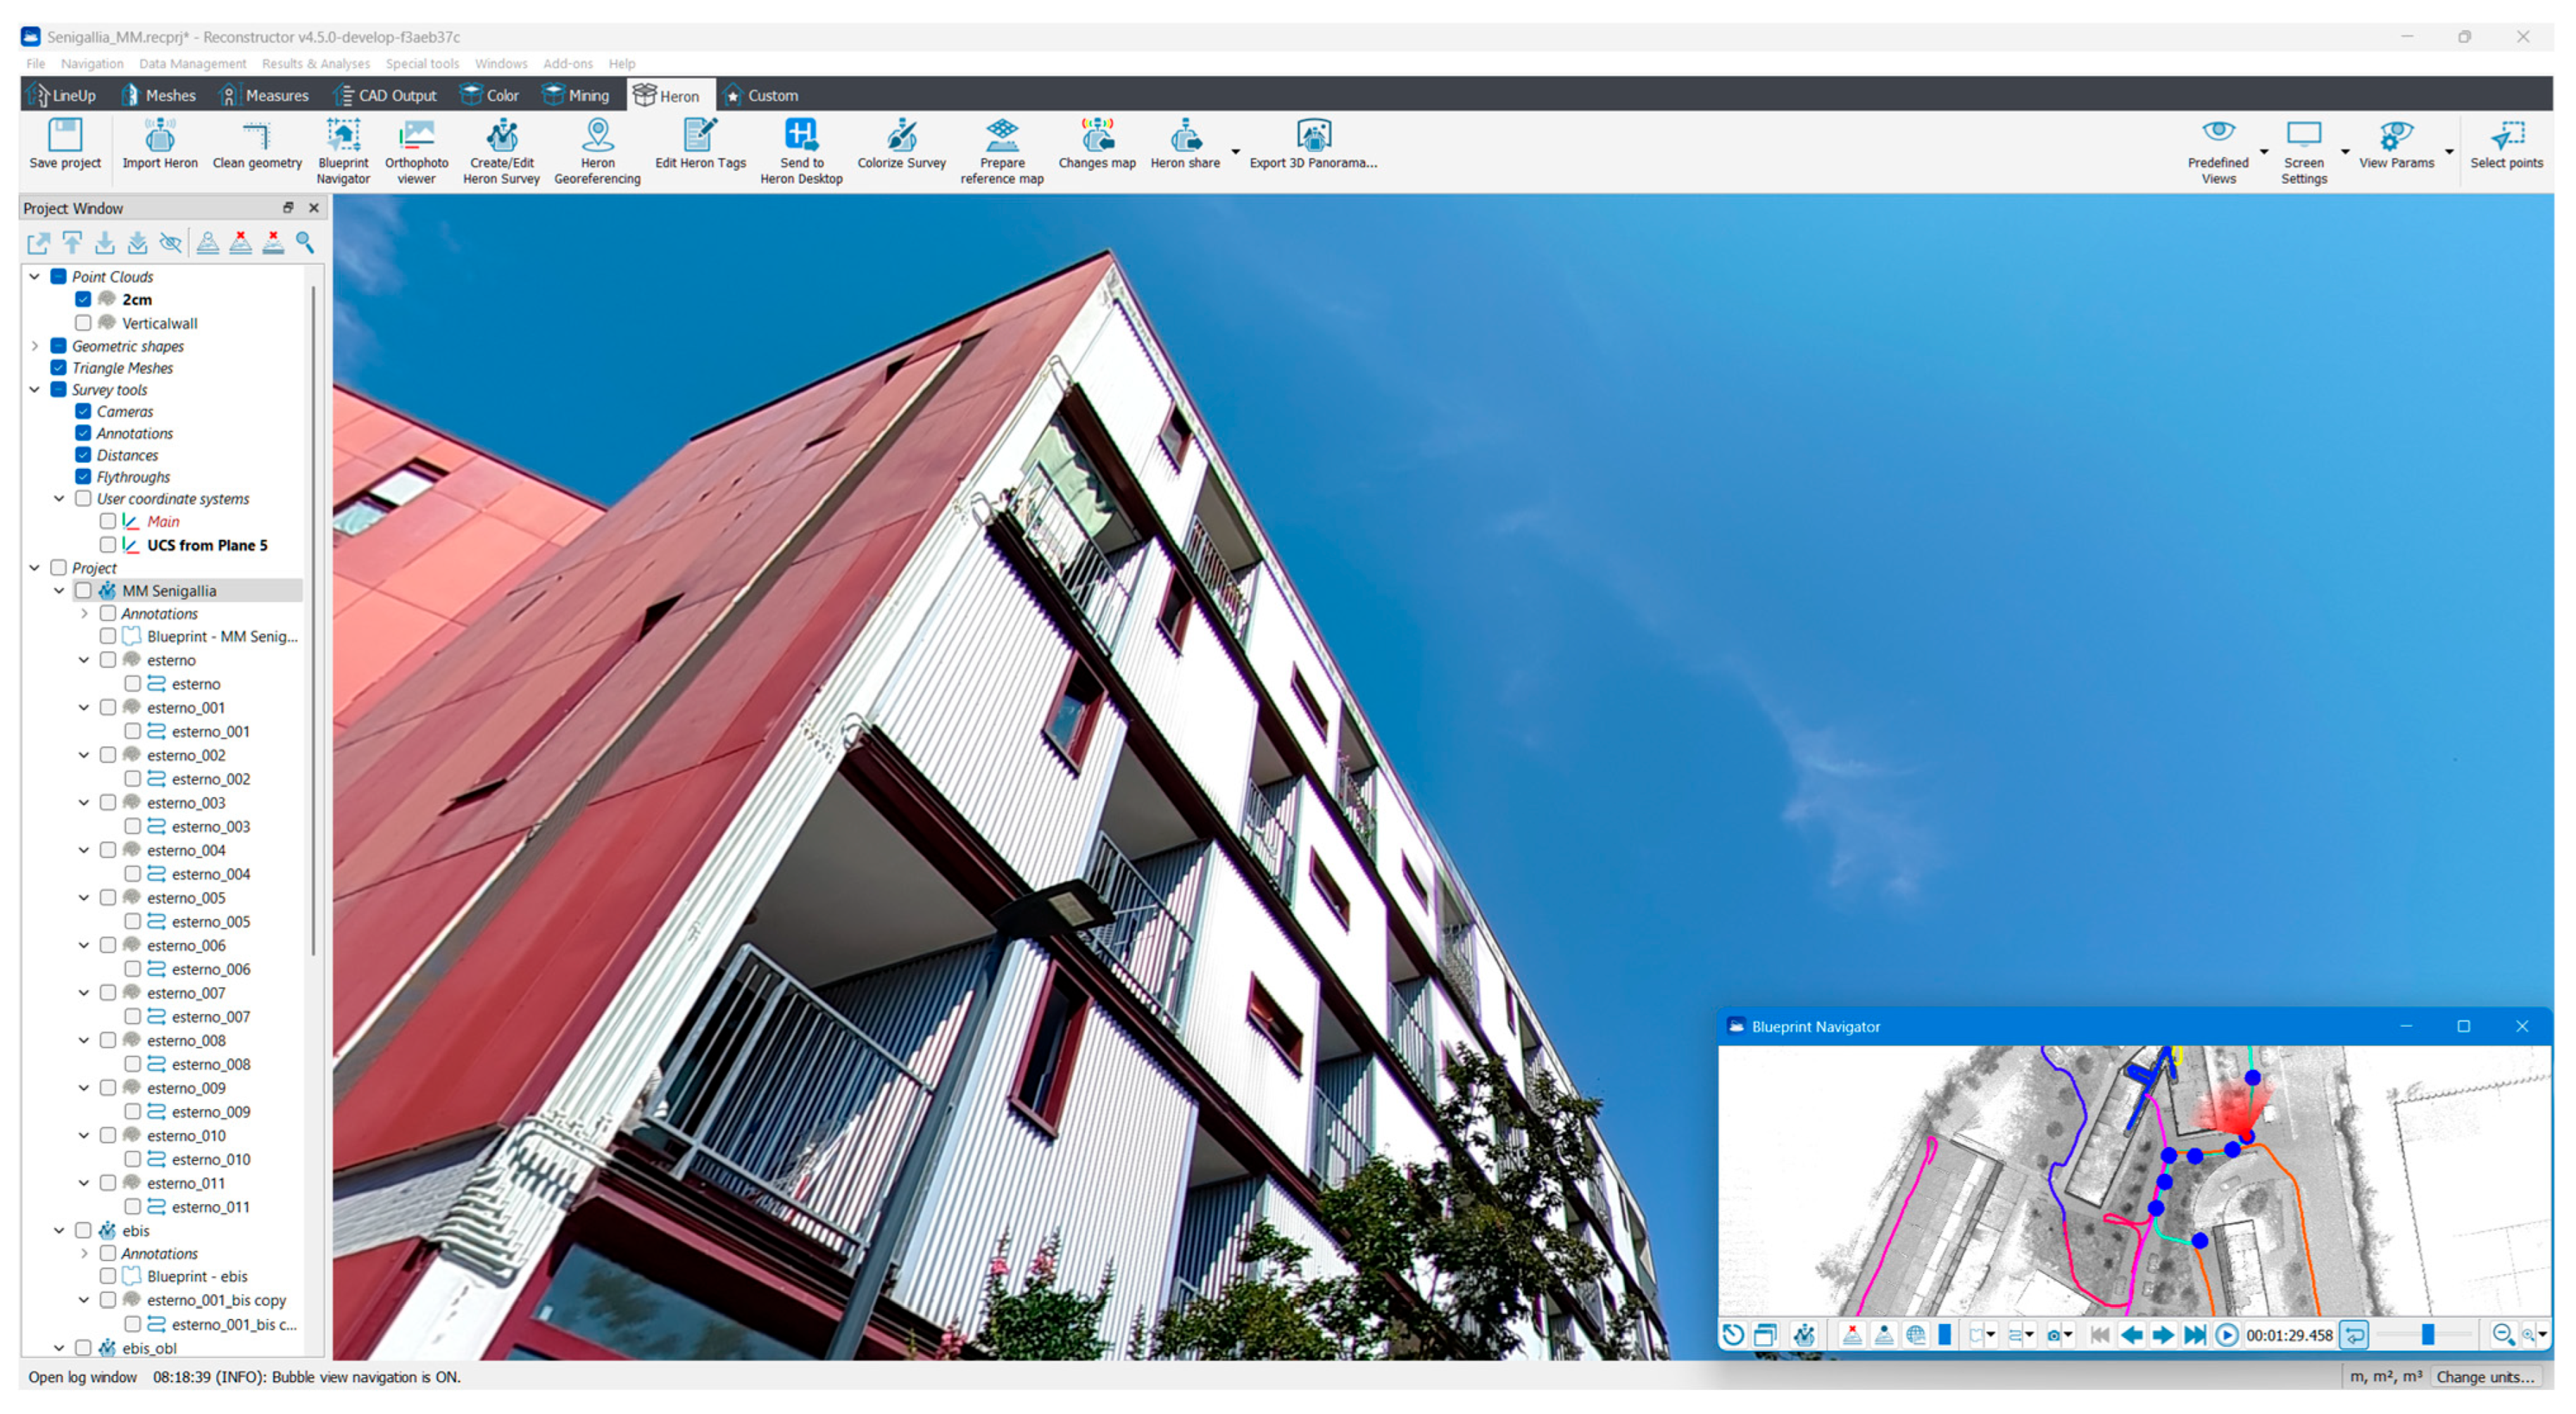
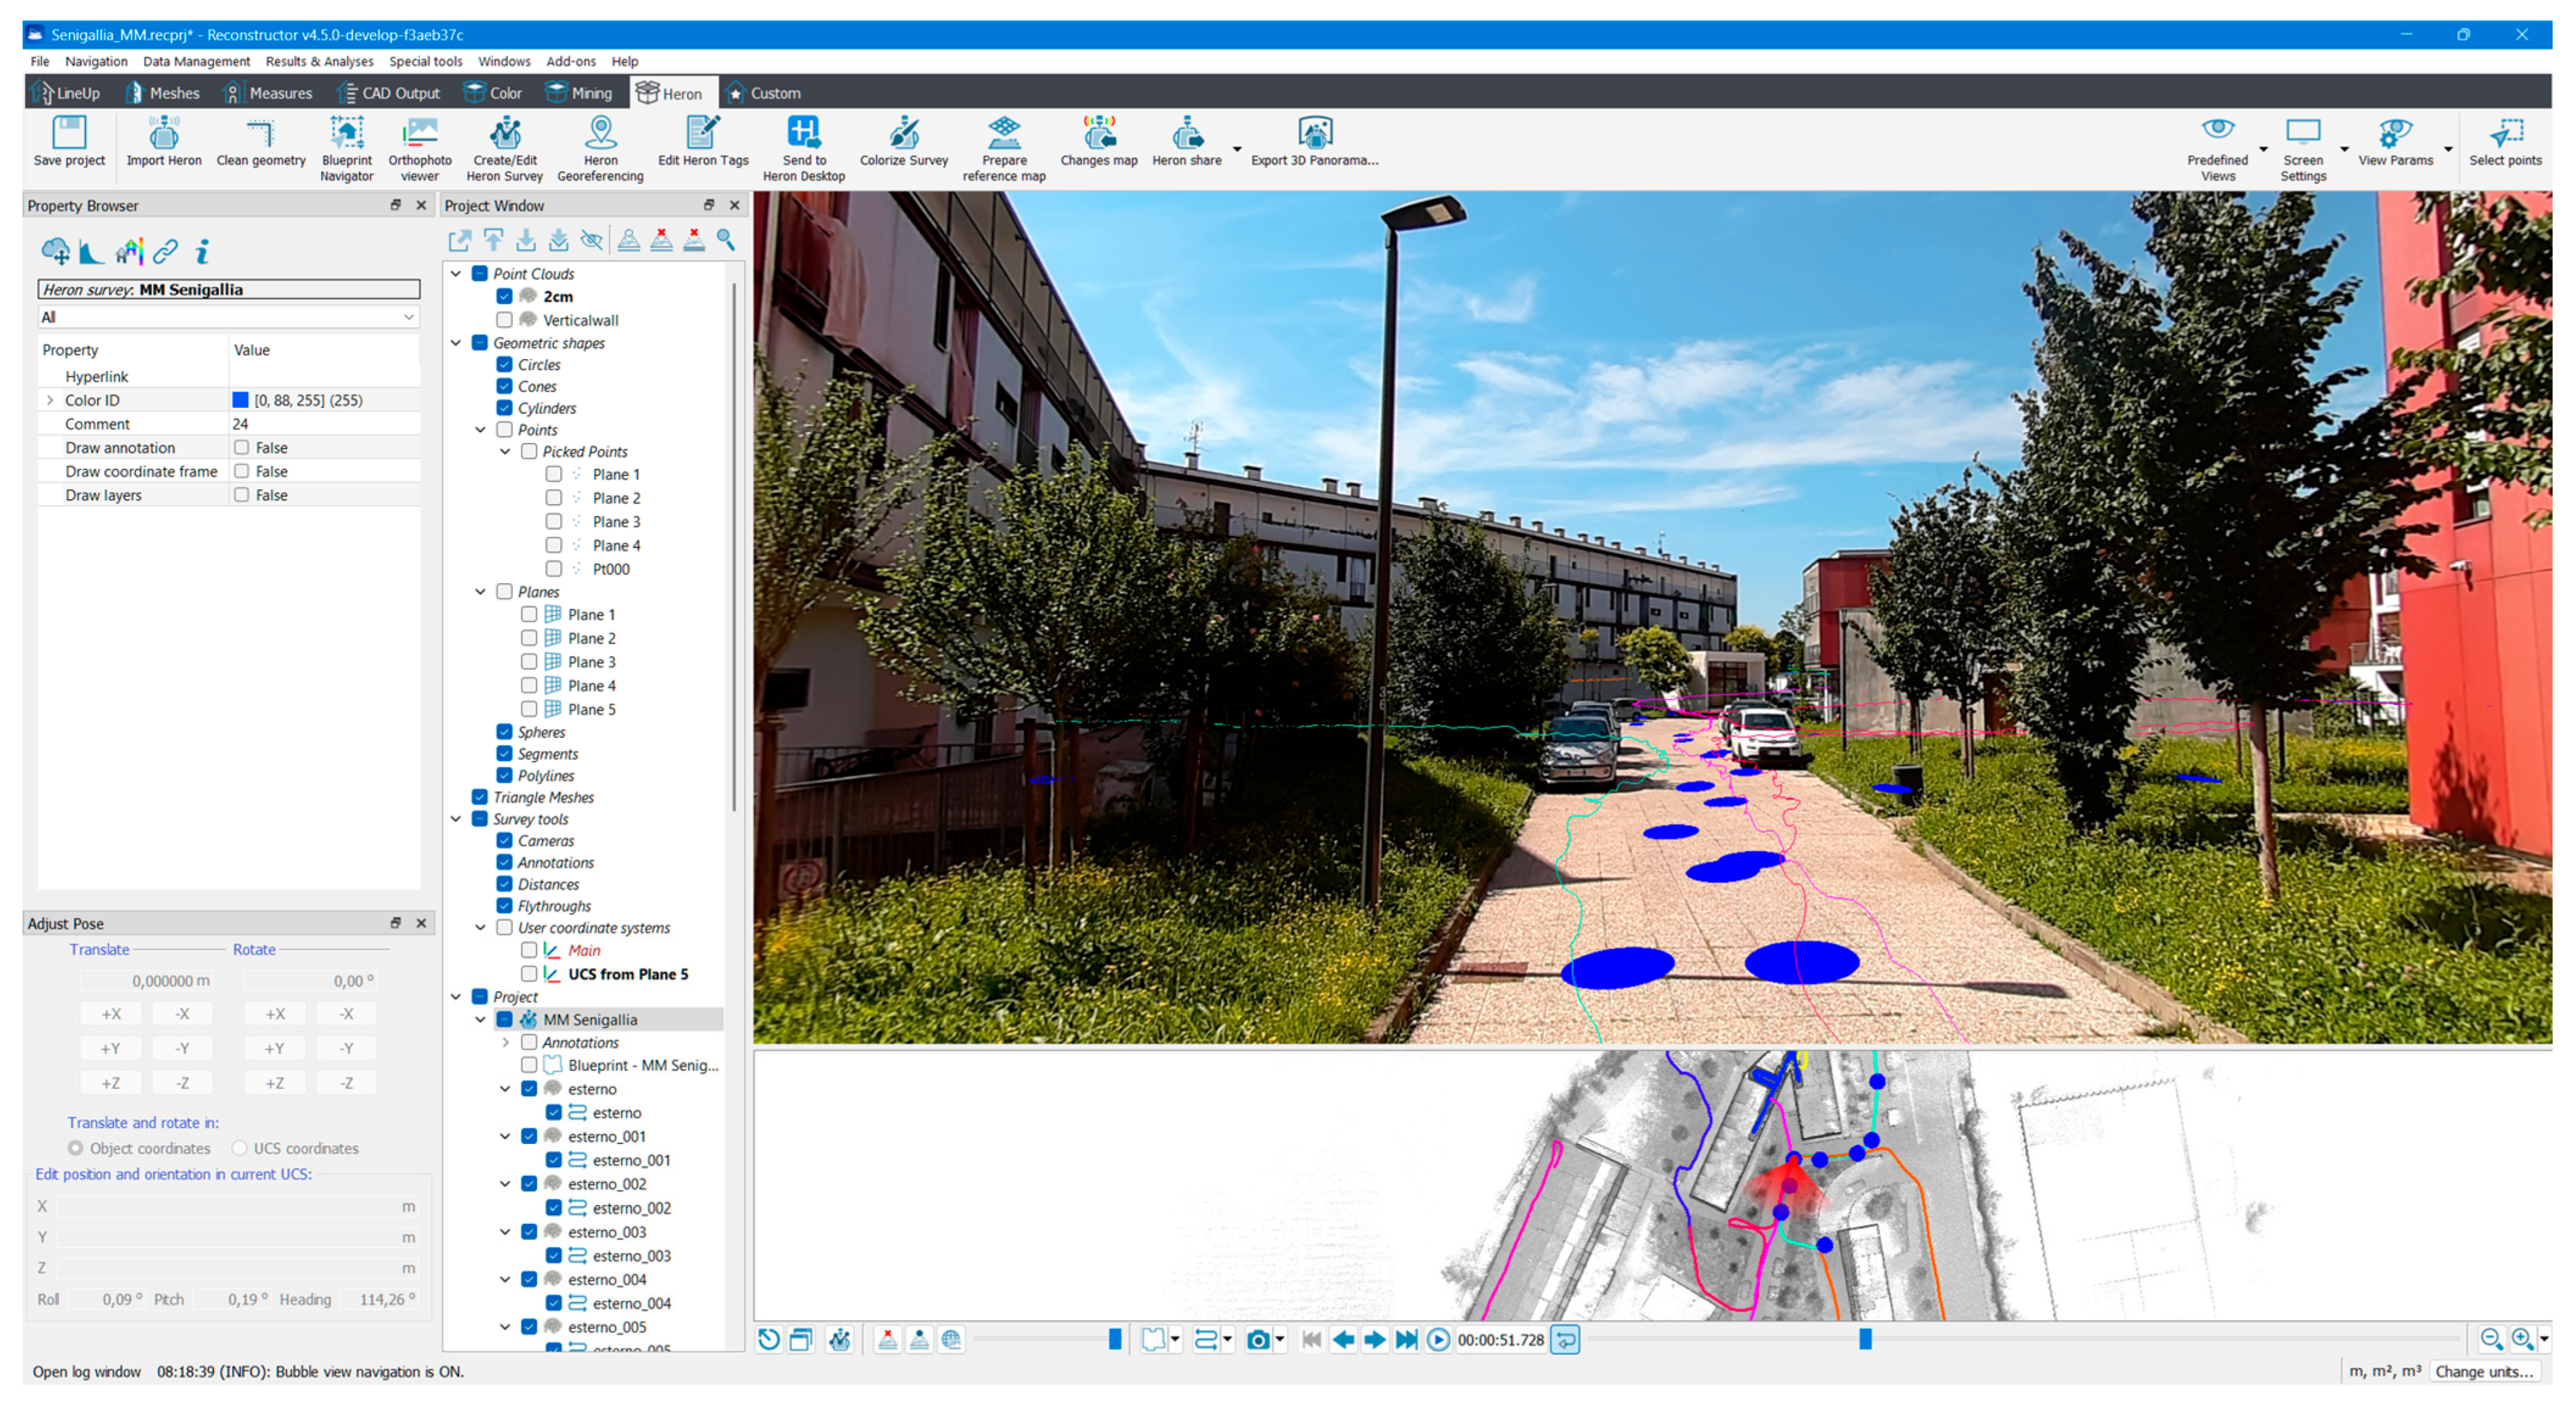
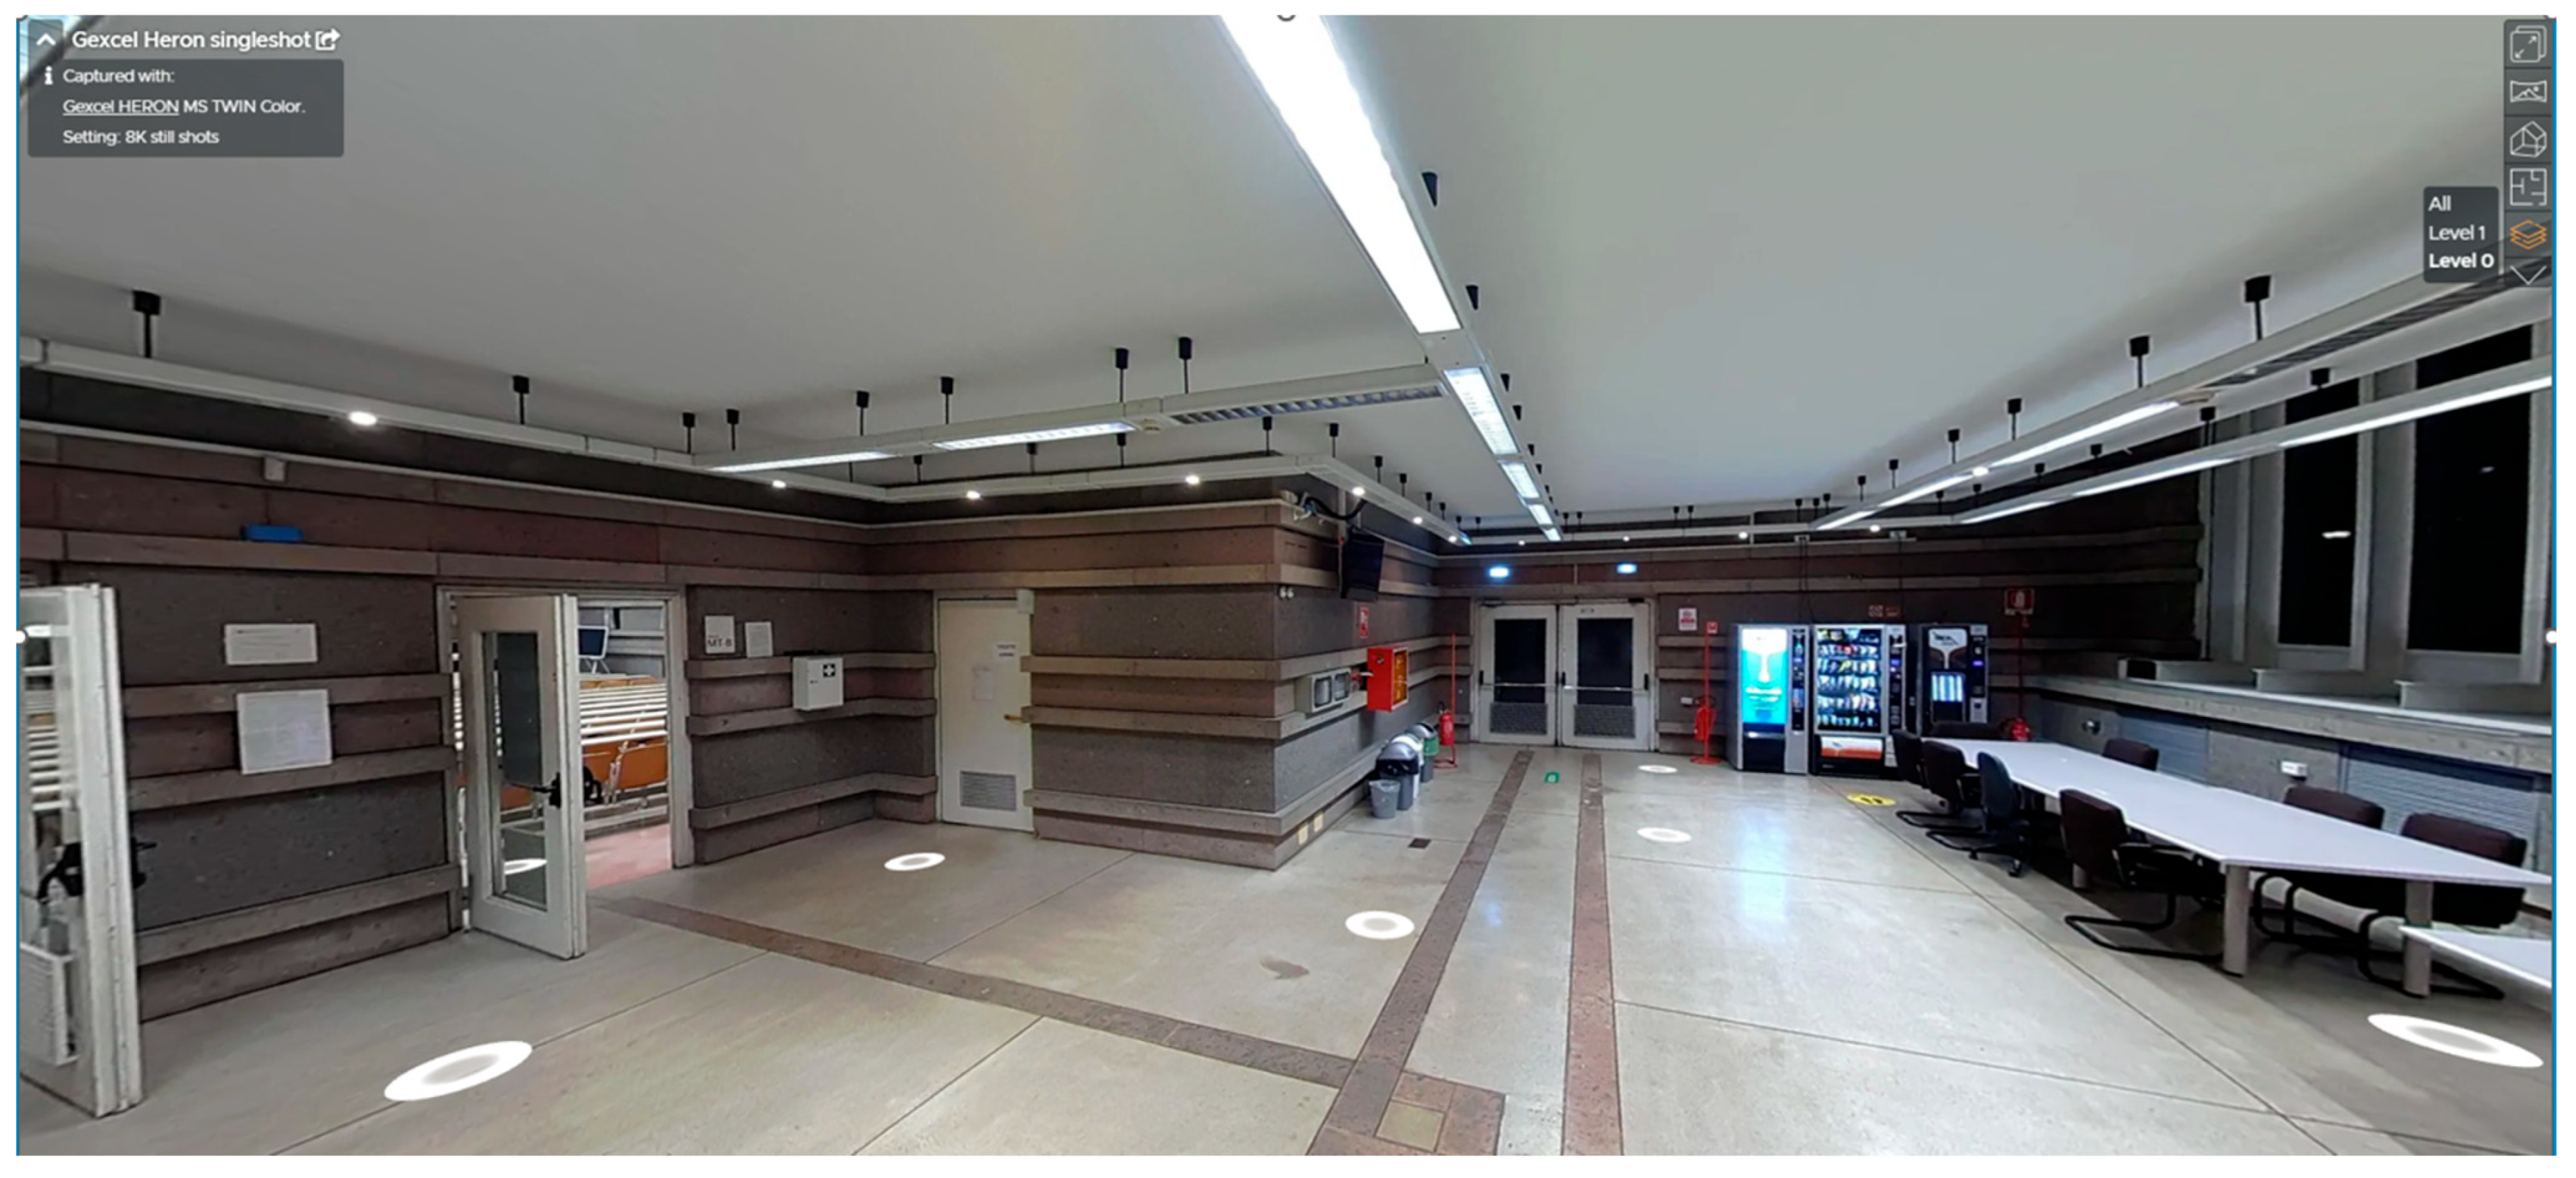
7.3.2. Virtual Tour with Software Reconstructor® Software

The Reconstructor® point cloud management software, supplied with the Heron® system, contains a tool for navigating the Heron® survey, allowing users to move along acquisition trajectories, transitioning from one spherical view to the next (Figure 27). This tool, which operates on a single personal computer, is excellent for observing survey quality, taking three-dimensional measurements, and generating the previously introduced blueprints. Such a platform does not require exporting the model to an interchange format, as this tool is integrated within the software itself. Therefore, the data can be maintained in Gexcel’s proprietary project format. However, this navigation tool does not allow annotations and does not support sharing the navigation among different users, as it is not web-based. On the other hand, it is excellent for fast verification by test engineers of the alignment quality of three-dimensional data (and photographic data) from different trajectories. The three-dimensional data surveyed by mobile systems presents significant sharing challenges, particularly due to the computationally heavy nature of the surveyed point cloud. For this reason, different solutions were explored in the Milan project to facilitate the sharing of the surveyed data among various users.

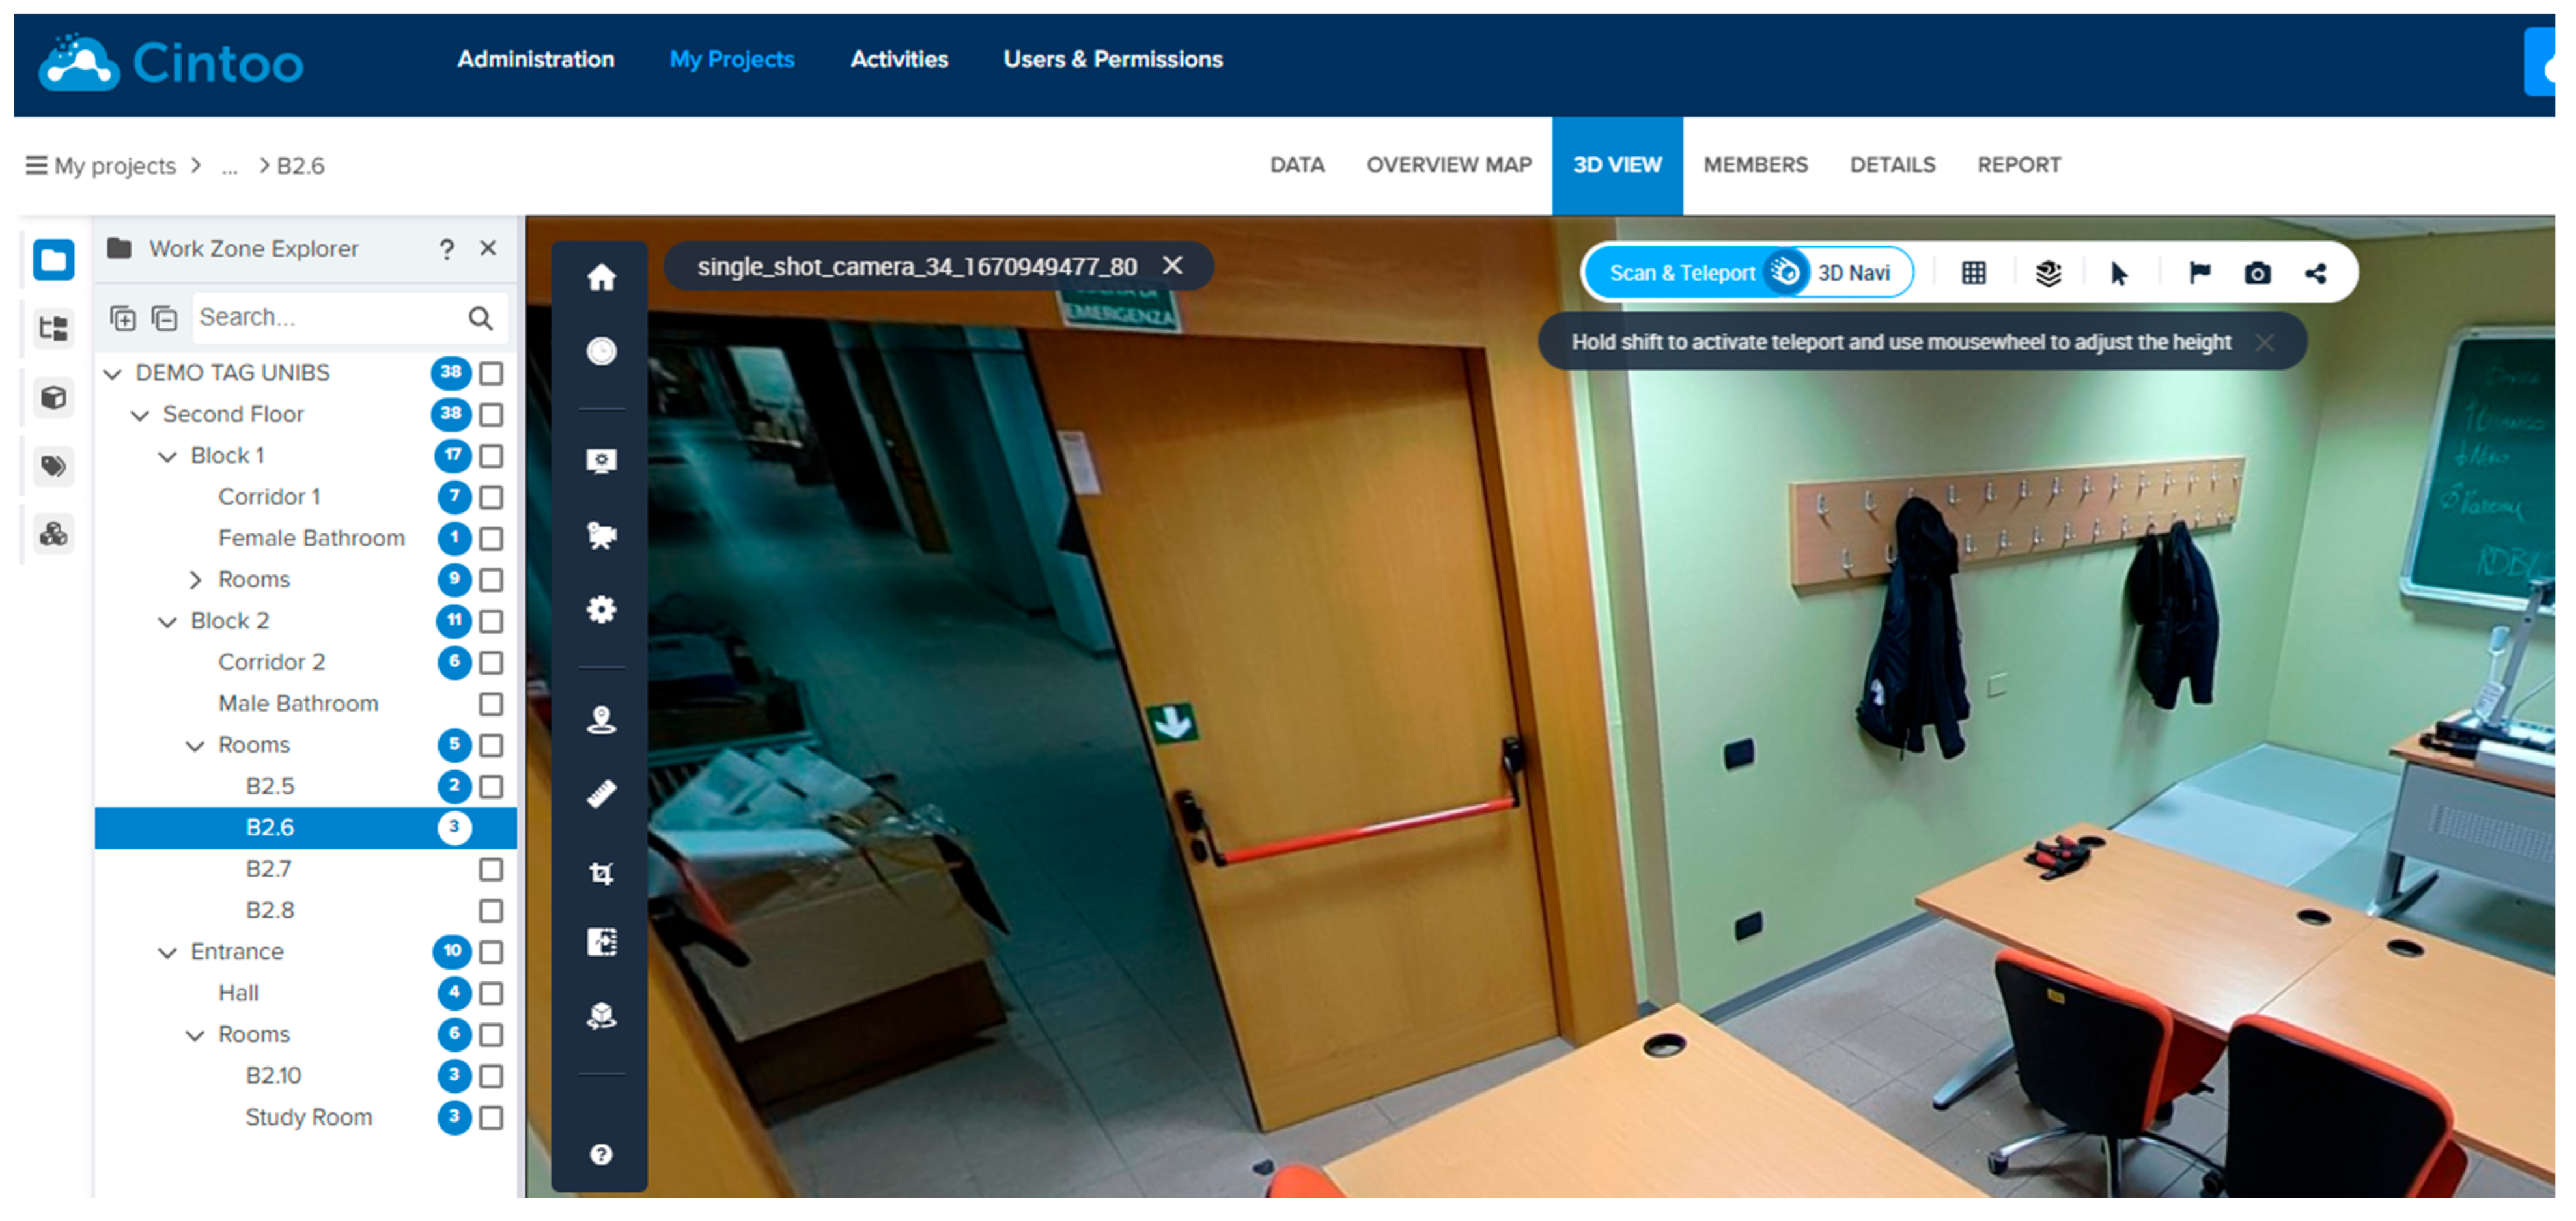
7.3.3. Virtual Tour by Web-Based Platforms

To this purpose, in the Milan project, it was planned that the data would be shared over the network so that operators could perform recognition activities by navigating within the spherical views. Numerous web-based platforms are available to visualize three-dimensional data collected with LiDAR instrumentation, and among them, platforms that provide virtual tour-style navigation, which would allow easy and intuitive navigation between different spherical views, have been analyzed. At the time of starting the project activities, the only platform that simultaneously offered web-based virtual tour-style navigation and at the same time allowed an agile structuring of the views in a tree structure, along with an easy annotation activity, was the Cintoo® platform. The use of such a platform also allows tags to be attached to the recognized elements (Figure 28 and Figure 29).
In this way, when an element with its characteristics is recognized, it is highlighted in the model. Therefore, all operators working on the project will be made aware of which items and objects have already been recognized and recorded in the DB. At the time of writing this paper, other platforms with similar features have been introduced in the market, such as Atis Cloud® [97] and Benaco® (Figure 30) [98,99].

7.4. Virtual Tour Approach

The approach followed to recognize items and their associated attributes in spherical photographs can be managed in two ways:
  • The first, which is essential, is for the images to be navigable in a virtual tour-style mode. The operator recognizes the assets in the image and must annotate separately the location where the asset recognized is located. This approach is very manual, and the operator always has to be aware of the position of the image inside the building complex while traveling along the trajectories.
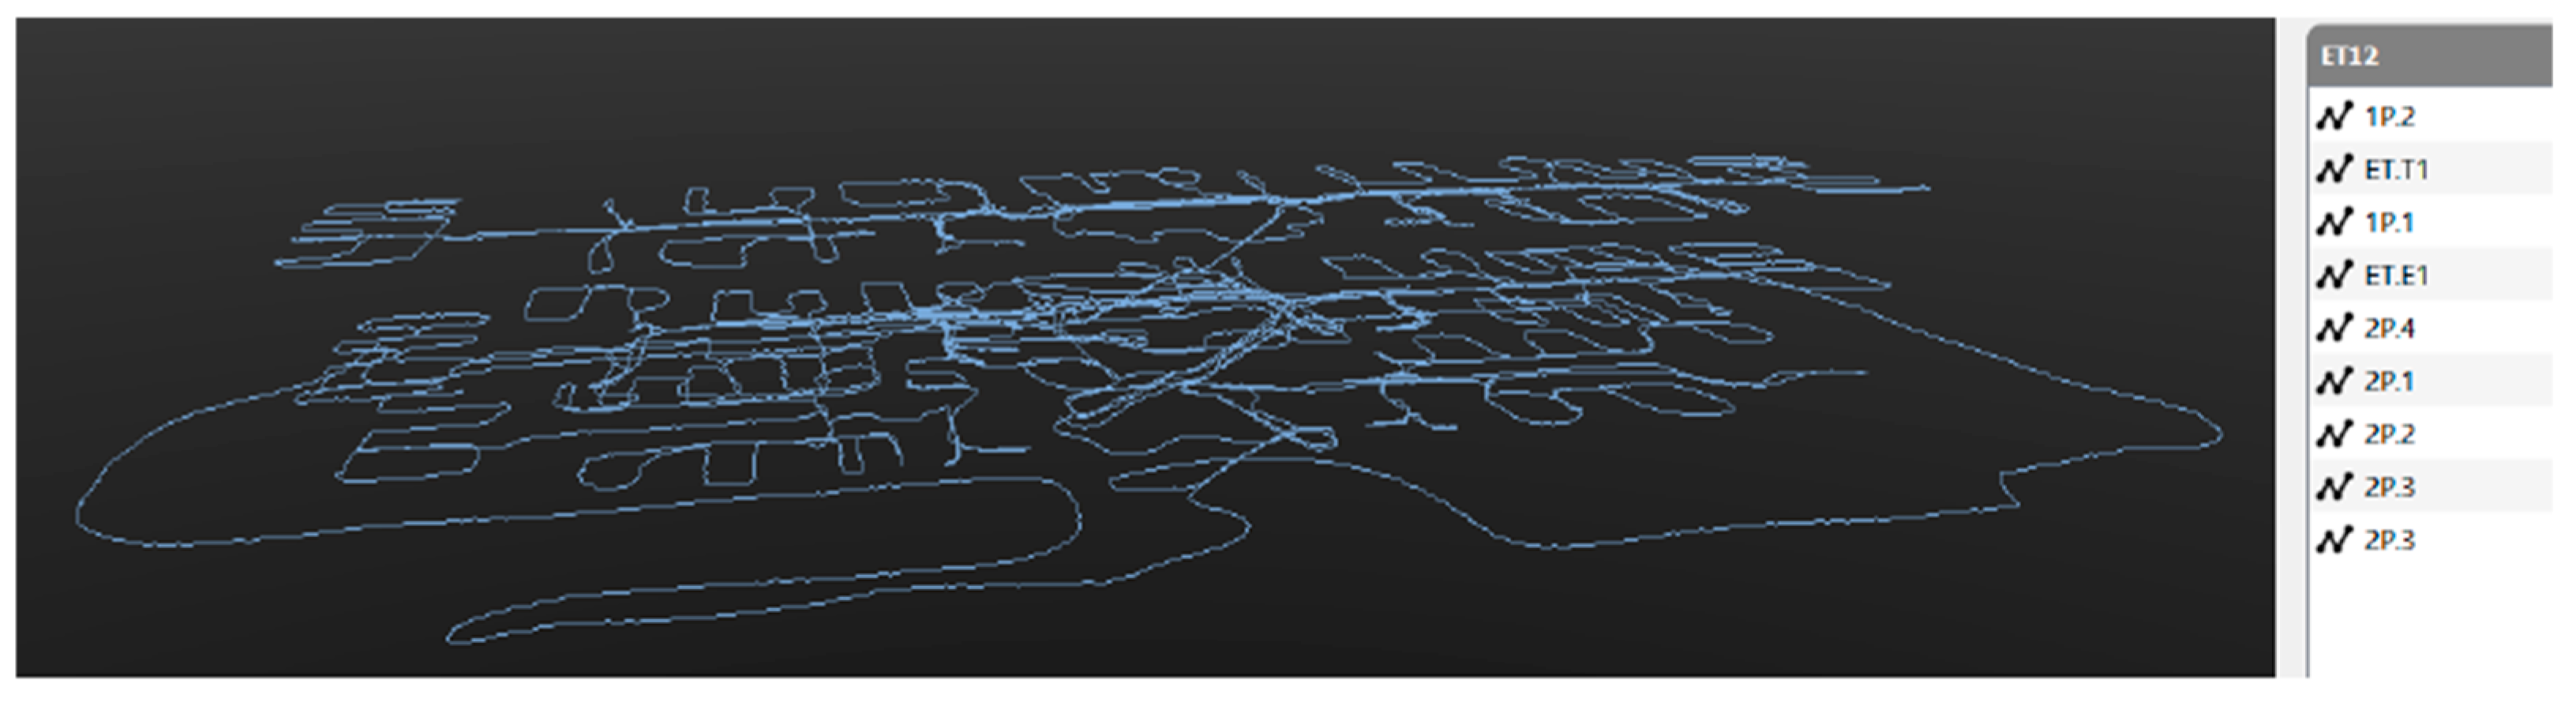
  • The second, which is optimal but not easy to implement, involves having the spherical images organized in a tree structure, in which the corresponding images are listed for each building environment in the agreed structure. This approach first requires that all images be organized in a directory structure and that the software platform used for such navigation allows the organization of the data, i.e., spherical views, with such a structure (Figure 31).
This approach of navigating between areas of the building complex requires that each image be associated with the name or code of the area where that image was acquired in order to facilitate the association of items to different zones of the complex. For example, in the navigation phase for the recognition of items in the images, the operator who intends to observe the spherical image(s) acquired, for example, on the landing located on the third floor of staircase H in Building B of Complex A, will simply have to select the relevant directory in the data navigation platform, and not have to arrive at that data by force through a virtual journey starting from the entrance of the building complex to the required room. In this way, the technician who has to recognize the items can simply type in the name of the area of interest and immediately observe the images captured in that area.

7.5. Improvement on the Instrument

Optimal would be to have an iMMS instrument that is equipped also with a real time tagging system that can be governed directly in the field by the surveyor. A surveyor moving within a building can thus easily and without loss of time signal in the instrument when a room or zone changes, such as moving from a hallway to a room, by linking in real time each spherical image with the physical space in the building complex and/or building in which the image has been acquired. Unfortunately, commercially available iMMS systems, including the Heron® system, have tagging systems that are still very crude and not very effective in the field. For this reason, in the survey activities of the Milan project, image/area code association was only occasionally performed, due to the high costs that such post-processing operations would have required.

8. Archiving of Surveyed Data and Management of Survey Results

For a project of this importance, a crucial aspect is the organization of the flow of the surveyed data, the manner in which the results are delivered, and the archiving of the results. Such data flow must facilitate:
  • The quality control actions of the survey operations and the delivered deliverables.
  • The data navigation and asset recognition operations by MM technicians.
  • The archiving of the survey products.
The project includes an intensive and accurate in-progress review phase of the surveying activities. In particular, an accurate Gantt chart has been drawn up, in which the survey activities have been scheduled. During the survey activities, the surveyors adopted procedures of continuous communication with MM to manage and plan the field survey activities, coordinate access at the building complexes, and manage the survey timelines, processing, and delivery of all deliverables in an organized way.

8.1. In-Process Testing

For such a massive surveying project, practical procedures for verification of activities were rigorously established to minimize the possibility of activities not being carried out with quality. The work-in-progress testing activities required that 5 percent of the surveys be totally verified, and only if frequent nonconformities were found would that number of tests have to be increased. The main objective of the testing of the activities was not only to verify that the results of the surveys complied with the specifications but, more importantly, that the procedures for performing the surveys followed the defined criteria and rules. For all complexes, it was also planned to verify the quality of all acquired images and ensure that there were no problems in uploading the three-dimensional and photographic data to the Cintoo® online data sharing platform. This operation also made it possible to highlight any gross errors in the three-dimensional reconstruction of the model of the surveyed buildings.

8.2. Management of the Raw Field-Detected Data

With regard to the raw data detected in the field, the surveyors, once the post-processing activity of the data detected in the field for a building complex was completed, were required to share the raw data detected by Heron®, the files produced by the SLAM (Heron Desktop®) post-processing software, and the point cloud model and images of the complex in the project format of the Reconstructor® point cloud management software. In this way, the quality test staff was enabled to navigate the project within the Reconstructor® platform, verifying the correct alignment of the point cloud model and compliance with all design specifications. As mentioned in 7.1, for 5 percent of the surveying, the tester group would have to repeat the entire data post-processing process from raw data to the final model. Moreover, within the Reconstructor® platform, the tester provided quality verification of all photographic captures acquired with the mobile system. After the testing operations were completed and only after the delivery of the data in the E57 format with images and subsequent uploading to the Cintoo® platform, the raw data of the Heron® survey (consisting of all acquired images, the data files taken from the LiDAR sensors, and the inertial sensor file), the Heron Desktop® software management files, and the Reconstructor® project files could be removed from the server. Such data are not maintained in the archive.

8.3. Uploading the Data to the Cintoo® Platform

Concurrently with the delivery of the data in formats compatible with the technical platforms for post-processing the data, the surveyor would then upload the model of the complex to the Cintoo® web-based platform. Where possible, this data were uploaded in a tree structure, with the images divided into appropriate directories. The quality test team would perform verification that uploading the data from the technical data processing software Reconstructor® to the Cintoo® web-based platform was performed correctly. On that data, MM technicians could then begin the asset recognition activity by navigating within the Cintoo® platform. In order to limit the cost of managing Cintoo®’s server space, only a limited number of models of complexes were simultaneously maintained online in the shared space.

8.4. Archiving of the Surveyed Data

The final product of the three-dimensional survey consists of a point cloud with associated spherical images acquired by the Heron®, as well as other secondary products such as orthophotos of building facades. Such a data structure from the mobile technology survey is managed in the Milan project by the surveyor within the Reconstructor® software. However, the final product is a unique point cloud model of the entire complex (Figure 32 and Figure 33), often organized in directories according to the structure (Table 1) and in the .e57 interchange format, with images in JPG format.
Such three-dimensional data represents an important value for MM, such that it can be considered as a company asset. Furthermore, in the Milan project, it was placed as a constraint that the final archived data should be in an open format, not locked to proprietary software and formats. So, the entire amount of surveyed data, separated by building complexes and, in turn, in the above-mentioned directory structure, was archived on the company servers. In order to carry out asset recognition activities or for future use of the three-dimensional data with images, technicians should therefore arrange to download the data to the company computers and browse it in Reconstructor®, either through the Cintoo® platform or through different platforms that MM decided to exploit.

9. Major Project Issues and Survey Results

The Milan project, at the time of its launch, did not have any reference examples to follow. For this reason, some of the procedures, although tested at the beginning of the project with a pilot initiative, did not prove to be as effective as expected during the planning phase.

9.1. Experience in the Use of iMMS Tools

One factor that initially created numerous difficulties was the highly innovative approach of the project, as there were no analogous projects that required such an extensive mapping of assets for large real estate portfolios using iMMS devices. Therefore, the surveyors had to build experience in organizing the survey activities and processing the large volume of data collected during the execution of the work itself. In particular, the development of internal procedures to ensure that the work was carried out with quality required time, which led to some delays in the execution of the tasks.

9.2. Procedure for Data Sharing, Delivery, Testing, Archiving, and Asset Recognition

The project included a detailed phase of data sharing to allow for ongoing testing of the survey activities and the delivery of final deliverables. In particular, several phases were planned, including:

9.2.1. Phase 1: Field Survey and Sharing of Raw Data and Initial Survey Results

This first phase included the following steps:
(a)
Before conducting a survey of a building complex, an operational report (see Section 6.4) had to be provided to the Construction Management, i.e., MM. This report described the field operations to be carried out, specifying the date and providing a complete timeline for the survey activities.;
(b)
The operational report needed approval from MM, which was responsible for organizing and providing support to the logistics of the field surveys;
(c)
Upon completion of the field survey operations, the surveyor was required to share the survey report (see Section 6.5), including any issues encountered during the survey;
(d)
As soon as the processing of the collected field data were completed—specifically, the raw data processing using Heron® equipment via Heron Desktop® software—the surveyor had to upload the raw data and the processed output (i.e., the point cloud with images) to the Dropbox platform. This data had to remain available to the inspector for 15 days, allowing for random checks to verify the accuracy of this initial data processing phase. After 15 days, unless otherwise indicated by the inspector via the construction management (i.e., MM), the data could be permanently removed from sharing and deleted;
(e)
The inspector was responsible for conducting random checks on 5% of the collected data.
Below, we provide some comments regarding these operational steps of Phase 1:
(a)
Sharing of the operational report with MM, which was responsible for reviewing and approving this operational plan, proved challenging in practice. This was due to the high frequency of exceptions and operational issues, which made the formal approval process too cumbersome.
(b)
In practice, more frequent informal communication developed between MM and the surveyors, allowing for quicker responses to issues arising in the field;
(c)
The method of sharing the collected raw data using the Dropbox platform is not operationally very efficient. Specific synchronization problems emerged, particularly regarding upload times, making the sharing process overly burdensome for both the surveyor and the inspector.
(d)
Since only 5% of the total surveys needed to undergo full verification, a more efficient approach in future projects would be for the inspector to request access to specific datasets for full verification on-demand, rather than requiring the upload of all raw data.

9.2.2. Phase 2: Delivery of Final Documents, Their Review/Testing, and Final Archiving

Once Phase 1 was completed, Phase 2 followed, which consisted of providing the final deliverables, their quality verification by the inspector, and the final archiving. This phase, in detail, included:
(a)
The point cloud data, along with the spherical images captured by the mobile system and produced by the SLAM Heron Desktop® software in PLY format in Phase 1, is edited, verified, and corrected by the surveyor on the Reconstructor® software platform;
(b)
Multiple surveys are then taken throughout the building complex, particularly the various surveying trajectories undertaken in different periods using the Heron® devices, and are merged within the Reconstructor® platform to generate one single three-dimensional model;
(c)
The three-dimensional model with images is delivered in the Reconstructor® software format, which has been named PRJ.
(d)
Starting from the Reconstructor® platform, the point cloud of the building complex is exported in the e57 open format with images. The data is then archived within the online data storage server platform of MM. The e57 format with images represents the formal final delivery of the collected data for each building complex;
(e)
Based on this data, for each delivered complex, the tester verifies the absence of technical issues in uploading this information to the online data sharing platform, specifically the Cintoo® platform (see Section 7.3), where MM is expected to perform asset recognition using the images;
(f)
Furthermore, the tester was expected to navigate the entire project within the Cintoo® platform, verifying the absence of major errors and ensuring the readability and clarity of the acquired photographic images. In case the tester identified minor errors, such as a few blurred or low quality images, they would notify MM to determine how to handle the nonconformity;
(g)
Once tested, the data has been stored on MM’s servers and periodically uploaded into the Cintoo® web-based platform for asset recognition;
Below, we provide some comments regarding these operational steps of Phase 2:
  • After finishing the data processing activities, it can be said that the decision to use software platforms for data processing from the same manufacturer across the workflow proved to be a clearly good and efficient choice that should consequently be constantly applied to projects comparable to the Milan project. In fact, the Heron Desktop® platform is perfectly integrated with the Reconstructor® software, and the functions to be carried out in the two platforms are well distinguished and harmonized;
  • The procedure to merge the various mapping trajectory into a single model is a process that needs data elaboration skills and correct mapping planning of the surveying phases in the field. For this reason, if logistically possible, it would always be advisable to conduct the survey of building complexes in a single survey phase;
  • Since a free demo version of the Reconstructor® software is available, this choice made it easier for technicians involved in the project to navigate the data;
  • The decision to exchange data in the E57 format was the correct choice in order to be able to use the data in the most various software platforms;
  • The procedure that required the verification of image quality and navigability by virtual tour by uploading the data to the Cintoo® platform and performing that operation on that platform was soon abandoned. In fact, during the project, no problems were ever encountered in loading the point cloud with images on Cintoo®. This was due to the fact that within the Reconstructor® software, used to produce the final point cloud model, there is a function dedicated to exporting the model with images in a format compatible with the Cintoo® platform.
  • The procedure used for validating image quality on the Cintoo® platform proved to be inapplicable; despite the technology’s quality of the platform, the data uploading to the cloud is very time-consuming. Consequently, it was found much more convenient to perform such verifications using the data navigation functions available in the free Reconstuctor® project viewer, thereby restricting the cloud platform’s use to only asset recognition activities. The costs related to uploading the entire Milan project to the cloud would have been prohibitively expensive. For this reason the data of the complexes were loaded into Cintoo® only for the period strictly needed to run the asset recognition process. At the end of the operation, the data have been unloaded from Cintoo® to make room for the data of a new complex, thus drastically reducing the purchased server space.
Ensuring the quality of the images was a very demanding task for the surveyors to guarantee, particularly due to problems of improper lighting of the photographed scene rather than excessive operator movement (Figure 34 and Figure 35).
In a few isolated cases, when systematic image acquisitions of low quality were encountered in the survey of a building complex, it was requested by the tester to repeat the image acquisition. The most challenging issue to manage occurred when a survey revealed a discrete number of low quality images—high enough to cause problems for MM technicians in recognizing the assets but not numerous enough to justify a radical intervention, such as a complete resurvey of the entire complex. This issue was resolved empirically by performing photographic integrations where necessary, but it remains an open topic for potential future projects of this kind. More serious than the quality of the images, but easier to be corrected by a software reworking of the data, were the cases in which the survey trajectories were not joined correctly, thus not allowing the navigation of the model and generating overlaps between the three-dimensional models. In some cases, minor misalignments were found, which were nevertheless required to be corrected (Figure 36).
The work has been successfully completed, and all the data are stored in the servers of MM. Data can now be used to recognize and locate assets or to address a wide variety of building management needs.

9.2.3. Phase 3: Assets Recognition

The final phase of the activity consists of recognizing the assets and elements present in the images and subsequently populating the MM database. This task is currently being carried out by MM technicians. It is not an easy task, and for a future project, it would certainly be more efficient to put out a tender not only for the three-dimensional and image-based surveying of buildings but also for the recognition of assets and the population of a large part of the database. In fact, during the object recognition process from images, doubts and uncertainties can often arise, or difficulties may only become apparent during the actual recognition phase—challenges that were not entirely evident during the testing phase. At that point, it is no longer possible to redo the photographic acquisitions.

10. Discussion and Future Developments

This project has been an opportunity to verify the high potential of mobile mapping systems and the combined survey of three-dimensionality and high resolution images. Numerous improvements are possible, both in the organization of survey processes, partly indicated in Section 9, and in the development and innovation of mobile mapping systems.

10.1. Tagging Tools

An important issue encountered during the survey activities, which was underestimated during the phase of definition of the specifications of the tender, is the necessity for mobile mapping systems to include on-site positioning definition capabilities. It is essential that the surveyor, while in the field, can associate their own position with information indicating the specific area or section of the complex or building they are in. This data structuring is crucial for correctly organizing information within management databases, as performing this task during post-processing is extremely costly and often even impossible. To address this, effective tagging functions must be implemented, allowing the surveyor to easily input relevant information on-site during survey operations.

10.2. Autolocalization Tools

Equally important is the development of technologies that allow the instrument to automatically estimate its position with increasing ease in the phases following the initial survey, once the first data collection has already been completed. Currently, such capabilities are already present in systems such as Heron®, which primarily rely on real time comparison between the instrument’s 3D survey and a “reference” 3D model derived from a previous survey or a parametric three-dimensional model of the building. However, these systems tend to fail, particularly in modern buildings where spaces are repeated cyclically, making it impossible for simple geometric comparisons to automatically determine the surveyor’s correct location.
New approaches based on artificial intelligence algorithms allow a system that simultaneously captures 3D scenes and images to recognize objects within 3D models, thus accurately determining its position. This is achieved not only by comparing the 3D model with reality but also by identifying the location based on the size, position, and characteristics of objects detected in real time. These technologies, known as Visual Place Recognition (VPR), often rely on the integration of 3D measurements, typically LiDAR-based, with RGB photographic acquisitions [100,101,102].

10.3. Object Recognition

First and foremost, the project met the basic requirement of conducting a census of the assets in the buildings. This recognition, which is currently performed directly by technicians, may see the implementation of machine learning and artificial intelligence algorithms. The prospects for the use of such technologies are obviously very interesting. Several tests are under development to apply AI technology in this application field. There are numerous artificial intelligence applications aimed at object recognition, which should be studied in the future for easier and more immediate implementation in asset recognition directly from images in an automated manner. Meanwhile, these photo-based technologies are becoming increasingly widespread [103,104]. Numerous studies are being developed in object recognition through the combined analysis of images and three-dimensional geometries [105,106,107,108].

10.4. Digital Twin and BIM Model Generation

The Milan project required a great effort of both preliminary and organizational study because of its highly innovative approach, which required the definition of survey specifications and data processing and management methodologies from zero. The value of the acquired data is currently showing its full significance, and a lot has to be done to give value to the huge surveying project. In fact, having carried out a survey not only photographically but also with the three-dimensional component, in addition to enabling local measurements to be carried out in the mapped areas, as originally planned, is making it possible to investigate the introduction of innovative technologies. Thus, the Milan project achieved the required result of creating a point cloud-based digital twin of all the building complexes managed by the engineering company. The availability of a three-dimensional model of buildings has enabled the implementation of advanced tools to support building management and maintenance operations. In particular, a 3D model allows the generation of simplified BIM models, which, combined with photographic information, facilitate the development of rapid self-localization tools for operators. This can be achieved using simple cameras mounted, for example, on an operator’s helmet (Figure 37). Software platforms such as Cupix®, version 2.2.1. [109] or self-localization functions integrated into Facility management platforms, such as SiteWalk® by Dalux®, version 1.3.1, provide solutions that allow an operator, equipped with a handheld or helmet-mounted camera, to self-locate within a building simply by capturing images of the surrounding environment (Figure 38). These solutions are gaining popularity.
The operator knows its own position and can therefore tag geolocated information on objects it observes in the image displayed on the handheld device.
By moving through the building and/or construction site, it is possible to associate information, tasks, activities, or non-compliance issues with elements simply by observing them in the image and associating the appropriate information. Of course, it is important to note that for the camera to self-localize, a three-dimensional model, even if approximate, of the site must be known.

11. Conclusions

The Milan project represented an extremely significant pilot project, successfully providing MM with an updated database of the extensive building heritage they manage. The high level of innovation in the project led to delays in the execution of the surveying operations, but they were ultimately completed successfully. At the time of publishing this article, the three-dimensional models with correlated images are being used by MM for populating the database and for performing measurements and metric calculations related to building maintenance activities. The implementation of machine learning algorithms should certainly help speed up the process of recognizing assets in buildings, although implementing automatic algorithms is not simple. Currently, procedures are being studied to allow for the continuous updating of acquired data in order to enrich the database with information and keep it up-to-date. At present, the costs of software platforms for sharing 3D point clouds and images are still too high to enable the simultaneous sharing of all surveys over the network. Operators must upload only the data of the complexes they are working on to the cloud.

Funding

This research received no external funding.

Institutional Review Board Statement

Not applicable.

Informed Consent Statement

Not applicable.

Data Availability Statement

The study describe the procedures applied to the project. The data belongs to MM that consider the data covered by privacy. So no data are available about the project.

Acknowledgments

We thank Tomaso Lamperti, Pietro Bianco, and Maria Carbone of MM for providing sample data and information about the project. We thank Massimo Dierna and Matteo Sgrenzaroli of Gexcel, who, as part of the quality check team, have provided us data and information about the project and about the instrumentation used by the surveyors.

Conflicts of Interest

The author of the paper is the founder of the company Gexcel and has collaborated on the definition of the technical specification of the Milan Project.

References

  1. Rocha, G.; Mateus, L. A survey of scan-to-BIM practices in the AEC industry—A quantitative analysis. ISPRS Int. J. Geo-Inf. 2021, 10, 564. [Google Scholar] [CrossRef]
  2. European Commission, Ministry of Development, Pwc. Roadmap for the Implementation of the BIM Methodology in Public Procurement. In Digitization of the Construction Process in Poland; European Commission, Ministry of Development: Brussels Belgium, 2020. [Google Scholar]
  3. Federal Ministry of the Interior and Community; Federal Ministry of Defence; Bundesbau. BIM Master Plan for Federal Buildings. Explanatory Report; Bundesbau: Berlin, Germany, 2021. [Google Scholar]
  4. Ministry of Digital Governance. Digital Transformation Bible 2020–2025; Ministry of Digital Governance: Athens, Greece, 2021. [Google Scholar]
  5. Ministry of Territorial Cohesion and Relations with Local Authorities. Plan BIM 2022; Ministère de la Cohésion des Territoires et des Relations Avec les Collectivités Locales: Paris, France, 2018. [Google Scholar]
  6. European Commission. Digital Economy and Society Index (DESI) 2022. Integration of Digital Technology; Publication Office of the European Union: Brussels, Belgium, 2022. [Google Scholar]
  7. Mitera-Kiełbasa, E.; Zima, K. BIM Policy in Eastern Europe. Civil. Environ. Eng. Rep. 2024, 33, 14–22. [Google Scholar] [CrossRef]
  8. European Commission. European Construction Sector Observatory: Digitalisation in the Construction Sector, Analytical Report; European Commission: Brussels, Belgium, 2021. [Google Scholar]
  9. Croatian Chamber of Civil Engineers. Guidelines for the BIM Approach in Infrastructure Projects; Croatian Chamber of Civil Engineers: Zagreb, Croatia, 2021. [Google Scholar]
  10. McAuley, B.; Hore, A.V.; West, R.P. The Irish Construction Industry’s State of Readiness for a BIM mandate in 2020. In Proceedings of the Civil Engineering Research in Ireland 2020 Conference, Cork, Ireland, 27–28 August 2020; pp. 740–745. [Google Scholar]
  11. Turk, Ž. Structured analysis of ICT adoption in the European construction industry. Int. J. Constr. Manag. 2023, 23, 756–762. [Google Scholar] [CrossRef]
  12. Wang, Q.; Kim, M.K. Applications of 3D point cloud data in the construction industry: A fifteen-year review from 2004 to 2018. Adv. Eng. Inform. 2019, 39, 306–319. [Google Scholar] [CrossRef]
  13. Fröhlich, C.; Mettenleiter, M.; Held, C.; Blersch, D.; Kurz, S. Umgebungsvermessung anhand von 3D Geometrie mit HDR Farbe und Wärmebilddaten. Automatisierungstechnik 2015, 63, 279–285. [Google Scholar] [CrossRef]
  14. Haddad, N.A. From ground surveying to 3D laser scanner: A review of techniques used for spatial documentation of historic sites. J. King Saud Univ. Eng. Sci. 2011, 23, 109–118. [Google Scholar] [CrossRef]
  15. Keitaanniemi, A.; Virtanen, J.P.; Rönnholm, P.; Kukko, A.; Rantanen, T.; Vaaja, M.T. The combined use of SLAM laser scanning and TLS for the 3D indoor mapping. Buildings 2021, 11, 386. [Google Scholar] [CrossRef]
  16. Dąbek, P.; Wodecki, J.; Kujawa, P.; Wróblewski, A.; Macek, A.; Zimroz, R. 3D point cloud regularization method for uniform mesh generation of mining excavations. ISPRS J. Photogramm. Remote Sens. 2024, 218, 324–343. [Google Scholar] [CrossRef]
  17. Hu, D.; Gan, V.J.; Yin, C. Robot-assisted mobile scanning for automated 3D reconstruction and point cloud semantic segmentation of building interiors. Autom. Constr. 2023, 152, 104949. [Google Scholar] [CrossRef]
  18. Warchoł, A.; Karaś, T.; Antoń, M. Selected qualitative aspects of LiDAR point clouds: GeoSLAM ZEB-REVO and Faro Focus 3D X130. Int. Arch. Photogramm. Remote Sens. Spat. Inf. Sci. 2023, 48, 205–212. [Google Scholar] [CrossRef]
  19. Roggeri, S.; Vassena, G.P.M.; Tagliabue, L.C. Scan-to-BIM efficient approach to extract BIM models from high productive indoor mobile mapping survey. In Proceedings of the International Structural Engineering and Construction, Singapore, 27–30 June 2022; Volume 9, pp. 1–6. [Google Scholar] [CrossRef]
  20. Abreu, N.; Pinto, A.; Matos, A.; Pires, M. Procedural point cloud modelling in scan-to-BIM and scan-vs-BIM applications: A review. ISPRS Int. J. Geo-Inf. 2023, 12, 260. [Google Scholar] [CrossRef]
  21. Coldwell, H.; Qiu, X.; Lei, Z.; Gong, M.; Rankin, J. A Review of Scan-To-BIM Technologies in Assisting Project Coordination and Management. In Transforming Construction with Off-Site Methods and Technologies Conference: Designing Tomorrow’s Construction, Today; Off-Site Construction Research Center, Northumbria University: Fredericton, NB, Canada, 2024. [Google Scholar]
  22. Kim, Y.; Nguyen, C.H.P.; Choi, Y. Automatic pipe and elbow recognition from three-dimensional point cloud model of industrial plant piping system using convolutional neural network-based primitive classification. Autom. Constr. 2020, 116, 103236. [Google Scholar] [CrossRef]
  23. Kawashima, K.; Kanai, S.; Date, H. As-built modeling of piping system from terrestrial laser-scanned point clouds using normal-based region growing. J. Comput. Des. Eng. 2014, 1, 13–26. [Google Scholar] [CrossRef]
  24. Czerniawski, T.; Nahangi, M.; Haas, C.; Walbridge, S. Pipe spool recognition in cluttered point clouds using a curvature-based shape descriptor. Autom. Constr. 2016, 71, 346–358. [Google Scholar] [CrossRef]
  25. Nguyen, C.H.P.; Choi, Y. Comparison of point cloud data and 3D CAD data for on-site dimensional inspection of industrial plant piping systems. Autom. Constr. 2018, 91, 44–52. [Google Scholar] [CrossRef]
  26. Adekunle, S.A.; Aigbavboa, C.; Ikuabe, M. Barriers to Scan to BIM Implementation on Historic Buildings. In International Conference on Engineering, Project, and Production Management; Springer Nature: Cham, Switzerland, 2023; pp. 305–315. [Google Scholar] [CrossRef]
  27. Croce, V.; Caroti, G.; Piemonte, A.; De Luca, L.; Véron, P. H-BIM and artificial intelligence: Classification of architectural heritage for semi-automatic scan-to-BIM reconstruction. Sensors 2023, 23, 2497. [Google Scholar] [CrossRef]
  28. Akca, D. Full automatic registration of laser scanner point clouds. ETH Zurich. 2003, 1, 330–337. [Google Scholar] [CrossRef]
  29. Theiler, P.W.; Schindler, K. Automatic registration of terrestrial laser scanner point clouds using natural planar surfaces. ISPRS Ann. Photogramm. Remote Sens. Spat. Inf. Sci. 2012, 1, 173–178. [Google Scholar] [CrossRef]
  30. Dias, P.; Sequeira, V.; Gonçalves, J.G.; Vaz, F. Automatic registration of laser reflectance and colour intensity images for 3D reconstruction. Robot. Auton. Syst. 2002, 39, 157–168. [Google Scholar] [CrossRef]
  31. Yao, J.; Ruggeri, M.R.; Taddei, P.; Sequeira, V. Automatic scan registration using 3D linear and planar features. 3D Res. 2010, 1, 1–18. [Google Scholar] [CrossRef]
  32. Li, R. Mobile mapping: An emerging technology for spatial data acquisition. Photogramm. Eng. Remote Sens. 1997, 63, 1085–1092. [Google Scholar] [CrossRef]
  33. Bossler, J. Feature Positioning Accuracy in Mobile Mapping: Results Obtained by the GPSV an TM. Int. Arch. Photogramm. Remote Sens. 1996, 31, 139–142. [Google Scholar]
  34. Tao, C.V. Mobile mapping technology for road network data acquisition. J. Geospat. Eng. 2000, 2, 1–14. [Google Scholar]
  35. Hunter, G.; Cox, C.; Kremer, J. Development of a commercial laser scanning mobile mapping system–StreetMapper. Int. Arch. Photogramm. Remote Sens. Spat. Inf. Sci. 2006, 36, 17–18. [Google Scholar]
  36. Dissanayake, M.G.; Newman, P.; Clark, S.; Durrant-Whyte, H.F.; Csorba, M. A solution to the simultaneous localization and map building (SLAM) problem. IEEE Trans. Robot. Autom. 2001, 17, 229–241. [Google Scholar] [CrossRef]
  37. Thrun, S.; Burgard, W.; Fox, D.A. Probabilistic Approach to Concurrent Mapping and Localization for Mobile Robots. Mach. Learn. 1998, 31, 29–53. [Google Scholar] [CrossRef]
  38. Borenstein, J.; Everett, H.R.; Feng, L. Navigating Mobile Robots: Systems and Techniques; AK Peters, Ltd.: Natick, MA, USA, 1997; ISBN 1568810660. [Google Scholar]
  39. Fox, D.; Burgard, W.; Thrun, S. Probabilistic methods for mobile robot mapping. In Proceedings of the IJCAI-99 Workshop on Adaptive Spatial Representations of Dynamic Environments, Stockholm, Sweden, 31 July–6 August 1999. [Google Scholar]
  40. Yamauchi, B.; Schultz, A.; Adams, W. Mobile robot exploration and map-building with continuous localization. In Proceedings of the 1998 IEEE International Conference on Robotics and Automation (Cat. No.98CH36146), Leuven, Belgium, 16–21 May 1998; Volume 4, pp. 3715–3720. [Google Scholar] [CrossRef]
  41. Smith, R.C.; Cheeseman, P. On the Representation and Estimation of Spatial Uncertainty. Int. J. Robot. Res. 1986, 5, 56–68. [Google Scholar] [CrossRef]
  42. Durrant-Whyte, H.; Bailey, T. Simultaneous localization and mapping: Part I. IEEE Robot. Autom. Mag. 2006, 13, 99–110. [Google Scholar] [CrossRef]
  43. Leonard, J.J.; Durrant-Whyte, H.F. Simultaneous map building and localisation for an autonomous mobile robot. In Proceedings of the IEEE International Workshop on Intelligent Robots and Systems (IROS), Osaka, Japan, 3–5 November 1991; pp. 1442–1447. [Google Scholar] [CrossRef]
  44. Castellanos, J.A.; Martnez, J.M.; Neira, J.; Tardós, J.D. Experiments in multisensor mobile robot localization and map building. In Proceedings of the 3rd IFAC Symposium on Intelligent Autonomous Vehicles 1998, Madrid, Spain, 25–27 March 1998; pp. 173–178. [Google Scholar] [CrossRef]
  45. Guivant, J.; Nebot, E.M.; Baiker, S. Localization and map building using laser range sensors in outdoor applications. J. Robot. Syst. 2000, 17, 565–583. [Google Scholar] [CrossRef]
  46. Bula, J.; Derron, M.H.; Mariethoz, G. Dense point cloud acquisition with a low-cost Velodyne VLP-16. Geosci. Instrum. Methods Data Syst. 2020, 9, 385–396. [Google Scholar] [CrossRef]
  47. Huang, L. Review on LiDAR-based SLAM Techniques. In Proceedings of the 2021 International Conference on Signal Processing and Machine Learning (CONF-SPML), Stanford, CA, USA, 14 November 2021; pp. 163–168. [Google Scholar] [CrossRef]
  48. Maset, E.; Cucchiaro, S.; Cazorzi, F.; Crosilla, F.; Fusiello, A.; Beinat, A. Investigating the performance of a handheld mobile mapping system in different outdoor scenarios. Int. Arch. Photogramm. Remote Sens. Spat. Inf. Sci. 2021, 43, 103–109. [Google Scholar] [CrossRef]
  49. Vassena, G.P.; Perfetti, L.; Comai, S.; Mastrolembo Ventura, S.; Ciribini, A.L. Construction Progress Monitoring Through the Integration of 4D BIM and SLAM-Based Mapping Devices. Buildings 2023, 13, 2488. [Google Scholar] [CrossRef]
  50. Labbé, M.; Michaud, F. Online global loop closure detection for large-scale multi-session graph-based SLAM. In Proceedings of the 2014 IEEE/RSJ International Conference on Intelligent Robots and Systems, Chicago, IL, USA, 14–18 September 2014; pp. 2661–2666. [Google Scholar] [CrossRef]
  51. Marotta, F.; Pessina, A.; Vassena, G.; Fassi, F. Accuracy improvement of a IMMS in an urban scenario. Int. Arch. Photogramm. Remote Sens. Spat. Inf. Sci. 2022, 46, 351–358. [Google Scholar] [CrossRef]
  52. Marotta, F.; Perfetti, L.; Fassi, F.; Achille, C.; Vassena, G.P.M. Lidar IMMS vs. handheld multicamera System: A stress-test in a Mountain Trailpath. Int. Arch. Photogramm. Remote Sens. Spat. Inf. Sci. 2022, 43, 249–256. [Google Scholar] [CrossRef]
  53. Perfetti, L.; Vassena, G.P.M.; Fassi, F. Preliminary survey of historic buildings with wearable mobile mapping systems and uav photogrammetry. Int. Arch. Photogramm. Remote Sens. Spat. Inf. Sci. 2023, 48, 1217–1223. [Google Scholar] [CrossRef]
  54. Ehlers, S.F.; Stuede, M.; Nuelle, K.; Ortmaier, T. Map management approach for SLAM in large-scale indoor and outdoor areas. In Proceedings of the 2020 IEEE International Conference on Robotics and Automation (ICRA), Paris, France, 31 May–31 August 2020; pp. 9652–9658. [Google Scholar] [CrossRef]
  55. Ceriani, S.; Sánchez, C.; Taddei, P.; Wolfart, E.; Sequeira, V. Pose interpolation slam for large maps using moving 3d sensors. In Proceedings of the 2015 IEEE/RSJ International Conference on Intelligent Robots and Systems (IROS), Hamburg, Germany, 28 September–2 October 2015; pp. 750–757. [Google Scholar] [CrossRef]
  56. Placed, J.A.; Strader, j.; Carrillo, h.; Atanasov, N.; Indelman, V.; Carlone, L. A Survey on Active Simultaneous Localization and Mapping: State of the Art and New Frontiers. IEEE Trans. Robot. 2023, 39, 1686–1705. [Google Scholar] [CrossRef]
  57. Sequeira, V.; Wolfart, E.; Bovisio, E.; Biotti, E.; Goncalves, J.G. Hybrid 3D reconstruction and image-based rendering techniques for reality modeling. In Videometrics and Optical Methods for 3D Shape Measurement; SPIE: Bellingham, WA, USA, 2020; Volume 4309, pp. 126–136. [Google Scholar]
  58. Lu, Q.; Xie, X.; Heaton, J.; Parlikad, A.K.; Schooling, J.M. From BIM towards digital twin: Strategy and future development for smart asset management. In Service Oriented, Holonic and Multi-agent Manufacturing Systems for Industry of the Future: Proceedings of SOHOMA 2019; Springer: Cham, Switzerland, 2020; Volume 9, pp. 392–404. [Google Scholar] [CrossRef]
  59. Li, M.; Yang, B.; Chen, L. Application of Slam Technology in Integrated Surveying and Mapping of Real Estate. J. Civ. Eng. Urban Plan. 2023, 5, 1–9. [Google Scholar] [CrossRef]
  60. Lymberopoulos, D.; Liu, J. The microsoft indoor localization competition: Experiences and lessons learned. IEEE Signal Process. Mag. 2017, 34, 125–140. [Google Scholar] [CrossRef]
  61. Sánchez, C.; Ceriani, S.; Taddei, P.; Wolfart, E.; Sequeira, V. STeAM sensor tracking and mapping. In Proceedings of the Second Annual Microsoft Indoor Localization Competition, Seattle, WA, USA, 13–16 April 2015. [Google Scholar]
  62. IPIN Conference Web Site. Available online: https://ipin-conference.org (accessed on 23 November 2024).
  63. Renaudin, V.; Ortiz, M.; Perul, J.; Torres-Sospedra, J.; Jiménez, A.R.; Pérez-Navarro, A.; Martín Mendoza-Silva, G.; Seco, F.; Landau, Y.; Marbel, R.; et al. Evaluating Indoor Positioning Systems in a Shopping Mall: The Lessons Learned from the IPIN 2018 Competition. IEEE Access 2019, 7, 148594–148628. [Google Scholar] [CrossRef]
  64. Tucci, G.; Visintini, D.; Bonora, V.; Parisi, E.I. Examination of indoor mobile mapping systems in a diversified internal/external test field. Appl. Sci. 2018, 8, 401. [Google Scholar] [CrossRef]
  65. Lovas, T.; Hadzijanisz, K.; Papp, V.; Somogyi, A.J. Indoor building survey assessment. In the International Archives of the Photogrammetry. Remote Sens. Spat. Inf. Sci. 2020, 43, 251–257. [Google Scholar] [CrossRef]
  66. Maset, E.; Scalera, L.; Beinat, A.; Cazorzi, F.; Crosilla, F.; Fusiello, A.; Gasparetto, A. Preliminary comparison between handheld and mobile robotic mapping systems. In Proceedings of the I4SDG Workshop 2021: IFToMM for Sustainable Development Goals; Springer International Publishing: Cham, Switzerland, 2022; Volume 1, pp. 290–298. [Google Scholar] [CrossRef]
  67. ISO/IEC 18305:2016; Information Technology—Real Time Locating Systems—Test and Evaluation of Localization and Tracking Systems. International Organization for Standardization: Vernier, Geneva, 2016.
  68. Filgueira, A.; Aguila, S.; Arias, P.; Bueno, M. Novel inspection system, backpack-based, for 3D modelling of indoor scenes. In Proceedings of the International Conference on Indoor Positioning and Indoor Navigation (IPIN), Madrid, Spain, 4–7 October 2016. [Google Scholar] [CrossRef]
  69. Maboudi, M.; Bánhidi, D.; Gerke, M. Investigation of geometric performance of an indoor mobile mapping system. Int. Arch. Photogramm. Remote Sens. Spat. Inf. Sci. 2018, 42, 637–642. [Google Scholar] [CrossRef]
  70. Otero, R.; Lagüela, S.; Garrido, I.; Arias, P. Mobile indoor mapping technologies: A review. Autom. Constr. 2020, 120, 103399. [Google Scholar] [CrossRef]
  71. Bavarian Research and Innovation Agency Official Web Site. Available online: https://www.forschung-innovation-bayern.de/en/contact/contact-directions/ (accessed on 12 November 2024).
  72. Lehtola, V.V.; Kaartinen, H.; Nüchter, A.; Kaijaluoto, R.; Kukko, A.; Litkey, P.; Honkavaara, E.; Rosnell, T.; Vaaja, M.T.; Virtanen, J.-P.; et al. Comparison of the Selected State-Of-The-Art 3D Indoor Scanning and Point Cloud Generation Methods. Remote Sens. 2017, 9, 796. [Google Scholar] [CrossRef]
  73. Campi, M.; Di Luggo, A.; Monaco, S.; Siconolfi, M.; Palomba, D. Indoor and outdoor mobile mapping systems for architectural surveys. Int. Arch. Photogramm. Remote Sens. Spat. Inf. Sci. 2018, 42, 201–208. [Google Scholar] [CrossRef]
  74. GPS World Web Site. Available online: https://www.gpsworld.com/new-timms-2-a-maneuverable-indoor-mapper/?utm_source=chatgpt.com (accessed on 25 March 2025).
  75. Gexcel Website. Available online: www.gexcel.it (accessed on 4 January 2025).
  76. Vassena, G.; Perfetti, L.; Fassi, F.; Fellin, A.; Cavallari, L.; Sgrenzaroli, M.; Mainardi, A. Accurate 3D Model Of Venice: Preserving Historical Data And Introducing Slam Imms For Change Detection And Updating Procedures. Int. Arch. Photogramm. Remote Sens. Spat. Inf. Sci. 2024, 48, 453–460. [Google Scholar] [CrossRef]
  77. Viametris Official Website. Available online: https://viametris.com/ms-96/ (accessed on 4 January 2025).
  78. Askar, C.; Scheider, A.; Sternberg, H. Evaluation of a State-of-the-Art Indoor Mobile Mapping System in a Complex Indoor Environment. ZfV-Z. Geodäsie Geoinf. Landmanag. 2023, 5, 300–309. [Google Scholar] [CrossRef]
  79. Gharineiat, Z.; Tarsha Kurdi, F.; Henny, K.; Gray, H.; Jamieson, A.; Reeves, N. Assessment of NavVis VLX and BLK2GO SLAM Scanner Accuracy for Outdoor and Indoor Surveying Tasks. Remote Sens. 2024, 16, 3256. [Google Scholar] [CrossRef]
  80. Leica Geosystem Official. Available online: https://shop.leica-geosystems.com/it/leica-blk/blk2go/overview (accessed on 4 January 2025).
  81. Dlesk, A.; Vach, K.; Šedina, J.; Pavelka, K. Comparison of leica blk360 and leica blk2go on chosen test objects. Int. Arch. Photogramm. Remote Sens. Spat. Inf. Sci. 2022, 46, 77–82. [Google Scholar] [CrossRef]
  82. Dalux Official Website. Available online: www.dalux.com (accessed on 4 January 2025).
  83. Acca Website. Available online: www.acca.it (accessed on 4 January 2025).
  84. Asset Panda Web Site. Available online: https://www.assetpanda.com/ (accessed on 4 January 2025).
  85. Faciliteasy Website. Available online: https://www.faciliteasy.com/industry/building-management/ (accessed on 4 January 2025).
  86. Asolvi Website. Available online: https://www.asolvi.com/property-and-building (accessed on 4 January 2025).
  87. UpKeep Website. Available online: https://b2b.upkeepworld.com (accessed on 4 January 2025).
  88. MM Spa Official Web Site. Available online: https://www.mmspa.eu/en/ (accessed on 20 November 2024).
  89. Gexcel Official Web Site. Available online: https://gexcel.it/en/software/Heron-desktop (accessed on 10 September 2024).
  90. Sgrenzaroli, M.; Ortiz Barrientos, J.; Vassena, G.; Sanchez, A.; Ciribini, A.; Mastrolembo Ventura, S.; Comai, S. Indoor Mobile Mapping Systems and (BIM) digital models for construction progress monitoring. Int. Arch. Photogramm. Remote Sens. Spat. Inf. Sci. 2022, 43, 121–127. [Google Scholar] [CrossRef]
  91. Velodyne Official Web Site. Available online: https://velodynelidar.com/ (accessed on 9 August 2022).
  92. Sánchez-Belenguer, C.; Ceriani, S.; Taddei, P.; Wolfart, E.; Sequeira, V. Global matching of point clouds for scan registration and loop detection. Robot. Auton. Syst. 2020, 123, 103324. [Google Scholar] [CrossRef]
  93. Hess, W.; Kohler, D.; Rapp, H.; Andor, D. Real-time loop closure in 2D LIDAR SLAM. In Proceedings of the 2016 IEEE International Conference on Robotics and Automation (ICRA), Stockholm, Sweden, 16–21 May 2016; pp. 1271–1278. [Google Scholar]
  94. Maset, E.; Scalera, L.; Beinat, A.; Visintini, D.; Gasparetto, A. Performance investigation and repeatability assessment of a mobile robotic system for 3D mapping. Robotics 2022, 11, 54. [Google Scholar] [CrossRef]
  95. Hesai Official Web Site. Available online: https://www.hesaitech.com/ (accessed on 1 November 2024).
  96. Gexcel Official Web Site. Available online: https://gexcel.it/it/software/goblueprint (accessed on 2 January 2025).
  97. Atis Cloud Website. Available online: https://www.atis.cloud/ (accessed on 23 October 2024).
  98. Benaco Ltd. Website. Available online: https://benaco.com/ (accessed on 23 August 2024).
  99. Fangming, L.; Franco, S.; Achille, C.; Vassena, G.P.M.; Fassi, F. The Role of Web Platforms in Balancing Sustainable Conservation and Development in Large Archaeological Site: The Naxos case study. Int. Arch. Photogramm. Remote Sens. Spat. Inf. Sci. 2024, 48, 303–310. [Google Scholar]
  100. Kim, H.; Yang, S.; Kim, J. Crawling Method for Image-Based Space Matching in Digital Twin Smart Cities. In Proceedings of the 2023 IEEE International Conference on Metaverse Computing, Networking and Applications (MetaCom), Kyoto, Japan, 26–28 June 2023; pp. 694–697. [Google Scholar] [CrossRef]
  101. Zamir, A.R.; Mubarak, S. Image geo-localization based on multiplenearest neighbor feature matching using generalized graphs. IEEE Trans. Pattern Anal. Mach. Intell. 2014, 36, 1546–1558. [Google Scholar] [CrossRef] [PubMed]
  102. Heikel, E.; Espinosa-Leal, L. Indoor Scene Recognition via Object Detection and TF-IDF. J. Imaging 2022, 8, 209. [Google Scholar] [CrossRef] [PubMed]
  103. Guerrero-Viu, J.; Fernandez-Labrador, C.; Demonceaux, C.; Guerrero, J.J. What’s in my room? Object recognition on indoor panoramic images. In Proceedings of the 2020 IEEE International Conference on Robotics and Automation (ICRA), Paris, France, 31 May–31 August 2020; pp. 567–573. [Google Scholar]
  104. Alaba, S.Y.; Ball, J.E. A Survey on Deep-Learning-Based LiDAR 3D Object Detection for Autonomous Driving. Sensors 2022, 22, 9577. [Google Scholar] [CrossRef]
  105. Lowe, D.G. Object recognition from local scale-invariant features. In Proceedings of the Seventh IEEE International Conference on Computer Vision, Kerkyra, Greece, 20–27 September 1999; Volume 2, pp. 1150–1157. [Google Scholar] [CrossRef]
  106. Vinodkumar, P.K.; Karabulut, D.; Avots, E.; Ozcinar, C.; Anbarjafari, G. A Survey on Deep Learning Based Segmentation, Detection and Classification for 3D Point Clouds. Entropy 2023, 25, 635. [Google Scholar] [CrossRef]
  107. Casado-Coscolla, A.; Sanchez-Belenguer, C.; Wolfart, E.; Sequeira, V. Point-Cloud Instance Segmentation for Spinning Laser Sensors. J. Imaging 2024, 10, 325. [Google Scholar] [CrossRef] [PubMed] [PubMed Central]
  108. Meger, D.; Muja, M.; Helmer, S.; Gupta, A.; Gamroth, C.; Hoffman, T.; Orwell, J. Curious george: An integrated visual search platform. In Proceedings of the 2010 Canadian Conference on Computer and Robot Vision, Ottawa, ON, Canada, 31 May–2 June 2010; pp. 107–114. [Google Scholar]
  109. Cupix Web Site. Available online: https://www.cupix.com (accessed on 23 November 2024).
Figure 1. The mobile mapping devices installed on the trolley. (a) Viametris® iMS3D [69]; (b) Trimble® TIMMS [74].
Applsci 15 07638 g001
Figure 2. Heron® Twin Color by Gexcel (image from the author).
Applsci 15 07638 g002
Figure 3. (a) VLX2 by NAVVIS® [79]; (b) BLK2GO® by Leica® [81].
Applsci 15 07638 g003
Figure 4. Example of a virtual tour of a survey carried out by iMMS (University of Brescia Campus). The image shows what is visualized by the software and represents a virtual tour through the mapped site. On the left-hand side, the point cloud projection onto the horizontal plane is displayed. The yellow line indicates the trajectory followed by the surveyor, and the blue dots represent the positions where the on-demand spherical images were taken.
Applsci 15 07638 g004
Figure 5. A blueprint of the University of Brescia building, created using a mobile mapping device. The image represents a projection of the 3D point cloud acquired by the indoor mobile mapping system onto a plane. This method of visualizing the point cloud is very user-friendly for technicians who are not experts in working with three-dimensional software tools.
Applsci 15 07638 g005
Figure 6. The graph highlights three key periods of the last century during which major housing interventions were carried out: the immediate postwar period and a second phase in the mid-1960s.
Applsci 15 07638 g006
Figure 7. (a) The buildings of the project, managed by MM inside Milan, are organized in nine main areas. (b) Milan is the main industrial city of Italy, located in the northern part of the country (courtesy of MM).
Applsci 15 07638 g007
Figure 8. Example of the organization of a building complex: In this case, the complex is identified by the code “200019” and named “Gaggioli 7”. The complex, built in 1959, consists of eight buildings.
Applsci 15 07638 g008
Figure 9. Example of a complex sheet. The name of the building and the address have been modified for confidentiality reasons.
Applsci 15 07638 g009
Figure 10. (a) The capture head of the Heron® device; (b) Velodyne® VLP-16 rotative LiDAR sensor.
Applsci 15 07638 g010
Figure 11. Data processing workflow: (1) odometer: the LiDAR point clouds are sequentially aligned to compute the geometric SLAM trajectory; (2) local map: the trajectory is organized into segments, and the associated point clouds are aggregated into the so-called local maps; (3) global optimization: the local maps are interconnected through a bundle adjustment process to minimize residual drifts.
Applsci 15 07638 g011
Figure 12. The local map phase of the Heron Desktop® software generates local maps, which are presented in various colors.
Applsci 15 07638 g012
Figure 13. The centroids of the local maps, represented by colored dots, are automatically linked for the final bundle adjustment and optimization procedure.
Applsci 15 07638 g013
Figure 14. The Hesai® mid-range lidar PANDAR XT32 [95], as shown before being installed on the wearable mapping device. Currently, Heron® instruments no longer install Velodyne® sensors, as the company has been acquired by Ouster®, and Velodyne products are no longer in production or available on the market (Photo Giorgio Vassena).
Applsci 15 07638 g014
Figure 15. (a) The latest version (2024) of the Heron® Twin Color. (b) The University of Brescia team during some field tests at one of the Milan locations.
Applsci 15 07638 g015
Figure 16. An example of a 3D point cloud model of a complex of buildings in Milan.
Applsci 15 07638 g016
Figure 17. Mobile mapping system trajectories for surveying three levels of the University of Brescia, Italy. Total length = 2680 m; acquisition time = 1 h and 11 min. Trajectory crossing helps reduce trajectory drifts.
Applsci 15 07638 g017
Figure 18. Virtual tour inside a building of the Milan project, using the Reconstructor® software. The images are captured on-demand with a resolution of 5K.
Applsci 15 07638 g018
Figure 19. An example of an operational report is where a draft map details the positions of the technical rooms in the complex of buildings.
Applsci 15 07638 g019
Figure 20. An example of an operational report with the positions of the building staircases.
Applsci 15 07638 g020
Figure 21. Example of an operational report where the suggested best trajectories to be followed by the surveyor are detailed. The trajectories must have a minimum overlap so that they can be connected in post-processing.
Applsci 15 07638 g021
Figure 22. An example of a comparison between the survey route planned in the operational report (a) and the result of the trajectory realized in reality, as shown in the survey report (b).
Applsci 15 07638 g022
Figure 23. This graph represents the tree structure of how the areas of a typical building complex are organized in the database.
Applsci 15 07638 g023
Figure 24. Example of virtual tour navigation along the external part of a building, using the navigation tool available in the on premise Reconstructor® software. On the right-hand side is the plan view of the site. The blue dots represent the position where a high resolution image has been acquired. The image in the center can be rotated by 360 degrees.
Applsci 15 07638 g024
Figure 25. Example of a blueprint format. The GoBluePrint free app [96] can be used for easy measurement of the surveyed sites.
Applsci 15 07638 g025
Figure 26. An example of one of the orthophoto views of the facades of the buildings requested in the Milan project. The survey is carried out using a terrestrial laser scanner, without the use of control points, at the nominal scale of 1:200.
Applsci 15 07638 g026
Figure 27. Example of virtual tour in the Reconstructor® platform of a site of the Milan project.
Applsci 15 07638 g027
Figure 28. Example of how the data of the assets are managed in Cintoo®. In particular, the image shows how for every tagged object (in this case, an extinguisher), a data sheet with all the object characteristics is connected. (Example from tagging tests at the University of Brescia).
Applsci 15 07638 g028
Figure 29. Example of how the data of the assets are managed in Cintoo®. The image shows the tagging of an electric plug. On the bottom-right-hand side, a plan view of the room is displayed, and the center of the camera position is represented with a white dot (example from tagging tests at the University of Brescia).
Applsci 15 07638 g029
Figure 30. Navigation interface in the Benaco® [98] web platform. The example is taken from navigation tests in the “Modulo” building at the Faculty of Engineering of Brescia University.
Applsci 15 07638 g030
Figure 31. The figure visualizes how the navigation can be organized in a tree structure (see figure on the right-hand side). Every level represents an area of the building following the global structure (Table 2).
Applsci 15 07638 g031
Figure 32. The “Senigallia” complex in Milan (Courtesy of Google®).
Applsci 15 07638 g032
Figure 33. The “Senigallia” complex in Milan. The 3D point cloud model was obtained by the mobile mapping survey (tests of the University of Brescia).
Applsci 15 07638 g033
Figure 34. An example of a blurry image. This defect happens when the on-demand 5K resolution image is taken with the capture head in movement.
Applsci 15 07638 g034
Figure 35. If improper lighting is applied to the images, the results can be underexposed images.
Applsci 15 07638 g035
Figure 36. An example where an incorrect alignment between trajectories resulted in an appreciable discrepancy between the walls of a building.
Applsci 15 07638 g036
Figure 37. An operator moves with a helmet-mounted camera. The platform can determine the operator’s position and, consequently, its own trajectory within a building for which the 3D model is known. Example of the Sitewalk® Dalux® platform in use at the test site of the “Modulo” building at the University of Brescia—Faculty of Engineering.
Applsci 15 07638 g037
Figure 38. In figure (a), the image captured by the surveyor is observed. The image is compared with the three-dimensional model obtained through iMMS surveying (b). It is shown the instrumental test was conducted at a building of the University of Brescia. Once a similar process, as described, is implemented in the Milan project, maintenance personnel will be able to walk through the buildings, recognize objects, update the database, and manage building maintenance operations in real time.
Applsci 15 07638 g038
Table 1. The table shows the total area to be surveyed within the Milan project.
Technical Data
Floors above ground [n°]3182
Underground floors [n°]204
Total staircase [n°]1376
Total landings [n°]9415
Elevators [n°]768
Apartments [n°]22,172
Basements [n°]16,209
Lofts [n°]1509
Technical rooms [n°]321
Table 2. This table is an example of the DB structure by which the assets of the Milan project are managed.
ItemDescription
InterphoneModel/Typology
InterphoneNumber of intercoms connected to the external handset
InterphoneMaintenance status
Enlightening BodiesTypology
Enlightening BodiesNumber
Enlightening BodiesType of light arranged for exposure to the elements atmospheric
Enlightening BodiesMaintenance status
Disclaimer/Publisher’s Note: The statements, opinions and data contained in all publications are solely those of the individual author(s) and contributor(s) and not of MDPI and/or the editor(s). MDPI and/or the editor(s) disclaim responsibility for any injury to people or property resulting from any ideas, methods, instructions or products referred to in the content.

