Article

Data-Driven Simulation of Navigator Stress in Close-Quarter Ship Encounters: Insights for Maritime Risk Assessment and Intelligent Training Design

Division of Navigation Convergence Studies, National Korea Maritime and Ocean University, Busan 49112, Republic of Korea
*
Author to whom correspondence should be addressed.
Appl. Sci. 2025, 15(14), 7630; https://doi.org/10.3390/app15147630
Submission received: 20 May 2025 / Revised: 4 July 2025 / Accepted: 5 July 2025 / Published: 8 July 2025

Abstract

This study presents a data-driven analysis of navigator stress and workload levels in simulated ship encounters within restricted waters, leveraging real-world automatic identification system (AIS) data from Makassar Port, Indonesia. Six close-quarter scenarios were recreated to reflect critical encounter geometries, and 24 Indonesian seafarers were evaluated using heart rate variability (HRV), perceived stress scale (PSS), and task load index (NASA-TLX) workload assessments. The results indicate that crossing angles, particularly 135° port and starboard encounters, significantly influence physiological stress levels, with age being a moderating factor. Although no consistent relationship was found between workload and HRV metrics, the findings underscore key human factors that may impair navigational performance under cognitively demanding conditions. By integrating AIS-derived traffic data with simulation-based human performance monitoring, this study supports the development of intelligent maritime training frameworks and adaptive decision support systems. The research contributes to broader efforts toward enhancing navigational safety and situational awareness amid increasing automation and traffic densities at sea.

1. Introduction

As one of the world’s largest seafarer-producing nations, Indonesia plays a critical role in supplying qualified maritime personnel to the global shipping industry. With a maritime workforce spanning thousands of vessels worldwide, the country has made continued efforts to enhance the competence, adaptability, and safety awareness of its seafarers in line with international standards [1]. This commitment is particularly vital given the increasingly complex navigational environments and stricter global safety regulations. Among the most effective tools for maintaining and improving seafarer competence is simulation-based training, which enables navigators to experience high-risk scenarios (for example, a ship encounters in restricted waters) without real-world consequences. Simulator-based learning offers a controlled, repeatable, and measurable platform for developing technical skills, decision-making, and stress management under pressure. This approach is especially valuable in countries such as Indonesia, where preparing seafarers for international deployment requires both technological capability and contextual relevance [2]. Accordingly, this study leverages the experience of Indonesian navigators to investigate the physiological and psychological impacts of encounter scenarios derived from real automatic identification system (AIS) data, thereby contributing to the global research and advancing locally grounded maritime education and training.
Despite the growing body of international research on simulator-based training, few studies have specifically addressed how ship navigators operating in dense and complex traffic environments experience stress during close-quarter encounters. The existing studies have largely focused on generic simulation tasks or non-specific traffic patterns, leaving a gap in understanding how culturally and operationally distinct navigators manage stress in realistic, data-driven scenarios. This study builds upon our previous research on maritime traffic risk assessment, where we integrated the functional resonance analysis method (FRAM), an AIS trajectory analysis, and risk mapping to identify high-risk encounter zones and sociotechnical variability in vessel traffic services (VTS) operations [3]. While the prior study focused on mapping systemic risks and predicting accident-prone areas from an operational perspective, the present study extends this inquiry by examining how such risk-laden navigational situations impact individual navigator stress responses. By situating the stress analysis within empirically identified high-risk encounter zones, this research bridges systemic risk assessments and human-centered performance analyses.
Understanding the effects of ship encounters on navigator stress levels is crucial for improving maritime safety. These situations, characterized by high cognitive demands, require navigators to make rapid decisions under pressure. According to cognitive load theory, the human brain has a finite capacity to process information, and when overloaded, this capacity can impair performance, leading to errors and accidents [4]. Ship encounters can cause a rapidly increased cognitive load, which in high-stress environments may delay response times and elevate the risk of human error [4]. By examining how Indonesian seafarers respond to close-quarter ship encounters within a controlled simulator environment, this study aimed to uncover the dynamic relationships between perceived stress, cognitive workload, and physiological stress responses across varying encounter geometries. Each simulated scenario reflects realistic navigational conditions commonly experienced in dense traffic areas, thereby preserving the ecological validity. The encounter designs were derived from our prior marine traffic risk assessment study [3], ensuring alignment with empirically identified high-risk patterns. This data-driven approach not only supports a nuanced understanding of navigator stress in operational contexts but also informs the development of intelligent, risk-aware maritime training programs.
The introduction of high-fidelity simulators has provided researchers with valuable tools to study stress and cognitive loading in controlled settings. A simulation allows for the replication of complex navigational scenarios where multiple ships interact, enabling detailed observations of navigators’ responses. High-fidelity simulators closely replicate real-world conditions, creating a realistic training environment that better prepares navigators for the cognitive and emotional challenges encountered in maritime operations [5]. This study aimed to understand how various factors contribute to or mitigate navigator stress during complex ship encounters. Stress was assessed using the Perceived Stress Scale (PSS), administered prior to the simulation, and the physiological responses were measured during the simulation using heart rate variability (HRV) data collected via a Polar® H10 chest strap. After completing the simulation, the participants evaluated their perceived workload using the NASA Task Load Index (NASA-TLX). The findings are expected to offer insights into how simulator-based training can be optimized for enhanced effectiveness and safety. Specifically, this study examined how simulated ship encounters impact navigator stress levels and the extent to which simulator environments influence the cognitive load and stress management during high-risk scenarios comparable to those encountered in real life.

2. Literature Review

In confined waters or when approaching a port, the bridge team typically includes the captain, officer, and helmsman, with additional watchmen as needed, and a pilot in compulsory pilotage areas. This team is responsible for complex and high-stakes navigation tasks, which place considerable demands on decision-making and teamwork. Research indicates that the intricate decision-making required during port approaches generates significant stress for ship navigators. When faced with critical navigation tasks, such as maneuvering through tight spaces while entering or exiting ports, these stress-inducing demands can impair navigators’ ability to operate the ship safely and effectively [6].
When navigators faced this so-called “crisis routine navigation”, they were aware of the impending accident, yet their actions were influenced by uncertainty and time pressure. This situation elevates cognitive stress, which may inadvertently lead to degraded supervisory control behavior. In such contexts, operators may increasingly rely on automation and reduce active system engagement, a condition referred to as “out-of-the-loop” (OOTL) performance [7,8]. Stress does not directly cause OOTL states but may act as a catalyst that exacerbates vulnerabilities, including diminished situational awareness, overreliance on automated outputs, and reduced manual control readiness. In high-stakes maritime navigation, stress may either enhance alertness or conversely lead to cognitive disengagement, depending on the task demands, crew experience, and system design [9]. This dynamic is supported by evidence indicating that while human operators excel at interpreting complex navigational information, prolonged passive monitoring tasks are often more effectively managed using automation, with human intervention occurring only in response to significant anomalies [10].
The subsequent research delves into the execution and outcomes of decision support systems intended to assist navigators during these crucial stages. By giving prompt and accurate navigational judgments based on complex algorithmic calculations and as an addition to an automatic radar plotting aid, advanced intelligent maneuvering systems assist the decision-maker, which is the navigator to help prevent collisions. The goal of these technologies is to improve situational awareness while lessening the operational burden on navigators but integrating such technologies also presents new difficulties, such as altering work procedures and possibly causing the navigators to become overly dependent on technology, which in some situations ironically makes people more stressed [11]. This degradation of timely decision-making and the stress induced by altered operational routines can increase the likelihood of near misses, accidents, and ultimately casualties or environmental pollution. These factors are strongly associated with human error, which remains a predominant cause of maritime incidents, with numerous studies consistently showing that over 80% of marine accidents involve human-related errors [12].
In Indonesia, human error is a major contributing factor in maritime accidents [13,14]. The specific contributing elements include inadequate knowledge of collision regulations and lack of familiarity with ship equipment [15]. Regarding navigational familiarization, several recommendations issued in Indonesian maritime accident reports from 2007 to 2023 remain unresolved [16]. Physical stressors have also been identified as key factors influencing seafarers’ stress, including heat exposure, noise, ship motion, seasickness, physically demanding work, lack of exercise, and climatic variability during voyages [17]. Among these, the most significant stressor was high work demands, particularly among crew in the deck department [18].
Recent research on Indonesian seafarers’ stresses also revealed that performance among seafarers was directly impacted by job satisfaction and work stress. Seafarer performance directly affected shipping safety, while job satisfaction and work stress indirectly affected shipping safety through seafarer performance. This indicated that seafarer performance was most directly impacted by work stress rather than job satisfaction and that seafarer performance was most directly correlated with shipping safety [19].
Maritime navigators, despite reporting generally low levels of perceived stress, experience stress primarily shaped by self-doubt in their coping abilities, which highlights the importance of self-efficacy in safeguarding against burnout and maintaining occupational resilience [20]. Additionally, perceived stress is significantly moderated by individual resilience and prior seafaring experience, although the time spent at sea does not appear to be a determining factor [21]. Dispositional resilience has been found to be the strongest predictor of perceived stress, although a just and supportive work environment remains essential for mitigating its impact [22]. Positive spillovers from personal life, particularly marital satisfaction, also play a key role in buffering the effects of stress and reducing anxiety [23].
While these personal and occupational factors contribute to baseline stress, navigational situations, particularly ship encounters, introduce acute stressors that cause an elevated mental workload (MW) and complicate decision-making processes. According to several studies, these factors are key contributors to human errors, often leading to accidents. When the MW exceeds manageable thresholds, performance declines [24], impairing decision-making and increasing the likelihood of errors [25], thereby compromising safety [26]. An excessive workload, often associated with high levels of stress [27], also contributes to fatigue, which severely affects ship safety. Fatigue results from various factors, including inadequate and poor-quality sleep and rest [28]. This effect is particularly significant for officers responsible for the vessel’s safety and security. In the era of automation, operators’ MWs are similarly impacted [29]. Therefore, managing the MW is critical for ensuring safety, especially during ship encounters in port approaches or confined waters.
In this study, we assessed these stress and workload dynamics using two complementary approaches. First, the PSS [30], a widely used self-report scale for measuring perceived stress [31], captured the subjective stress experiences of ship navigators. Second, the physiological responses were evaluated through HRV, which measures the variation in time intervals between heartbeats and reflects autonomic nervous system (ANS) activity. HRV was selected as a physiological indicator due to its established role in reflecting stress-related autonomic regulation [32]. Typically, an individual’s HRV is higher during restful states, indicating parasympathetic (vagal) dominance, and it decreases during periods of physical or psychological stress, reflecting heightened sympathetic tone. The HRV levels also vary with individual factors, generally being higher in younger, physically fit, and healthy populations [33,34].
The ANS regulates an individual’s heart rate (HR) through a balance of sympathetic and parasympathetic inputs. Sympathetic activation increases an individual’s HR and reduces their HRV, while parasympathetic activity lowers an individual’s HR and increases their HRV [35]. This balance is modulated by the central autonomic network, with rapid HR fluctuations mediated by mechanisms such as the baroreceptor reflex and respiratory sinus arrhythmia. HRV is most accurately captured through electrocardiography (ECG), although calibrated non-ECG methods such as photoplethysmography can also be used.
Previous research has consistently demonstrated an inverse relationship between perceived stress (as measured by the PSS) and HRV, reflecting a physiological link between psychological stress and autonomic dysregulation [36]. For example, studies among nurses exposed to chronic occupational stress observed significant reductions in HRV, particularly in parasympathetic-associated frequency-domain measures [37]. Similarly, simulator-based research involving ship officers found that high-stress navigational tasks triggered transient increases in low-frequency (LF) power indicating sympathetic arousal alongside overall reductions in HRV. In contrast, low-demand scenarios were associated with greater high-frequency (HF) power and elevated HRV, reflecting parasympathetic dominance [38].
For the MW, the NASA-TLX questionnaire is widely used for assessing cognitive workload [39], and is particularly valuable in ship navigation simulators to understand the navigators’ workload during complex tasks. This multidimensional assessment tool was used to evaluate MWs across six dimensions—mental demand (MD), physical demand (PD), temporal demand (TD), performance (OP), effort (EF), and frustration level (FR)—allowing for a detailed understanding of cognitive challenges, especially in high-stress scenarios such as ship encounters [40]. Research shows that the perceived workload measured by NASA-TLX rises significantly with task complexity, as seen in scenarios involving multiple vessels, and correlates with physiological stress indicators, such as heart rate [41]. Integrating NASA-TLX into training can help identify workload thresholds, or “redlines”, beyond which navigator performance declines due to excessive cognitive load, highlighting the need for targeted training interventions [42,43]. Thus, by integrating PSS and HRV analyses in ship encounter scenarios, a comprehensive understanding of the psychological stress levels and physiological responses of individuals may be achieved. This approach has the potential to enhance performance, well-being, and decision-making in navigation tasks. Additionally, it aligns with proposed future research in the field of human error within maritime transport accidents, which advocates for the incorporation of diverse theoretical perspectives and the application of research methodologies from the social and human sciences [44]. Furthermore, by also using NASA-TLX assessments with objective physiological measures, this strengthens the understanding of workload effects, offering a holistic approach to improving navigator performance and ensuring safety under stress [45].

3. Methodology

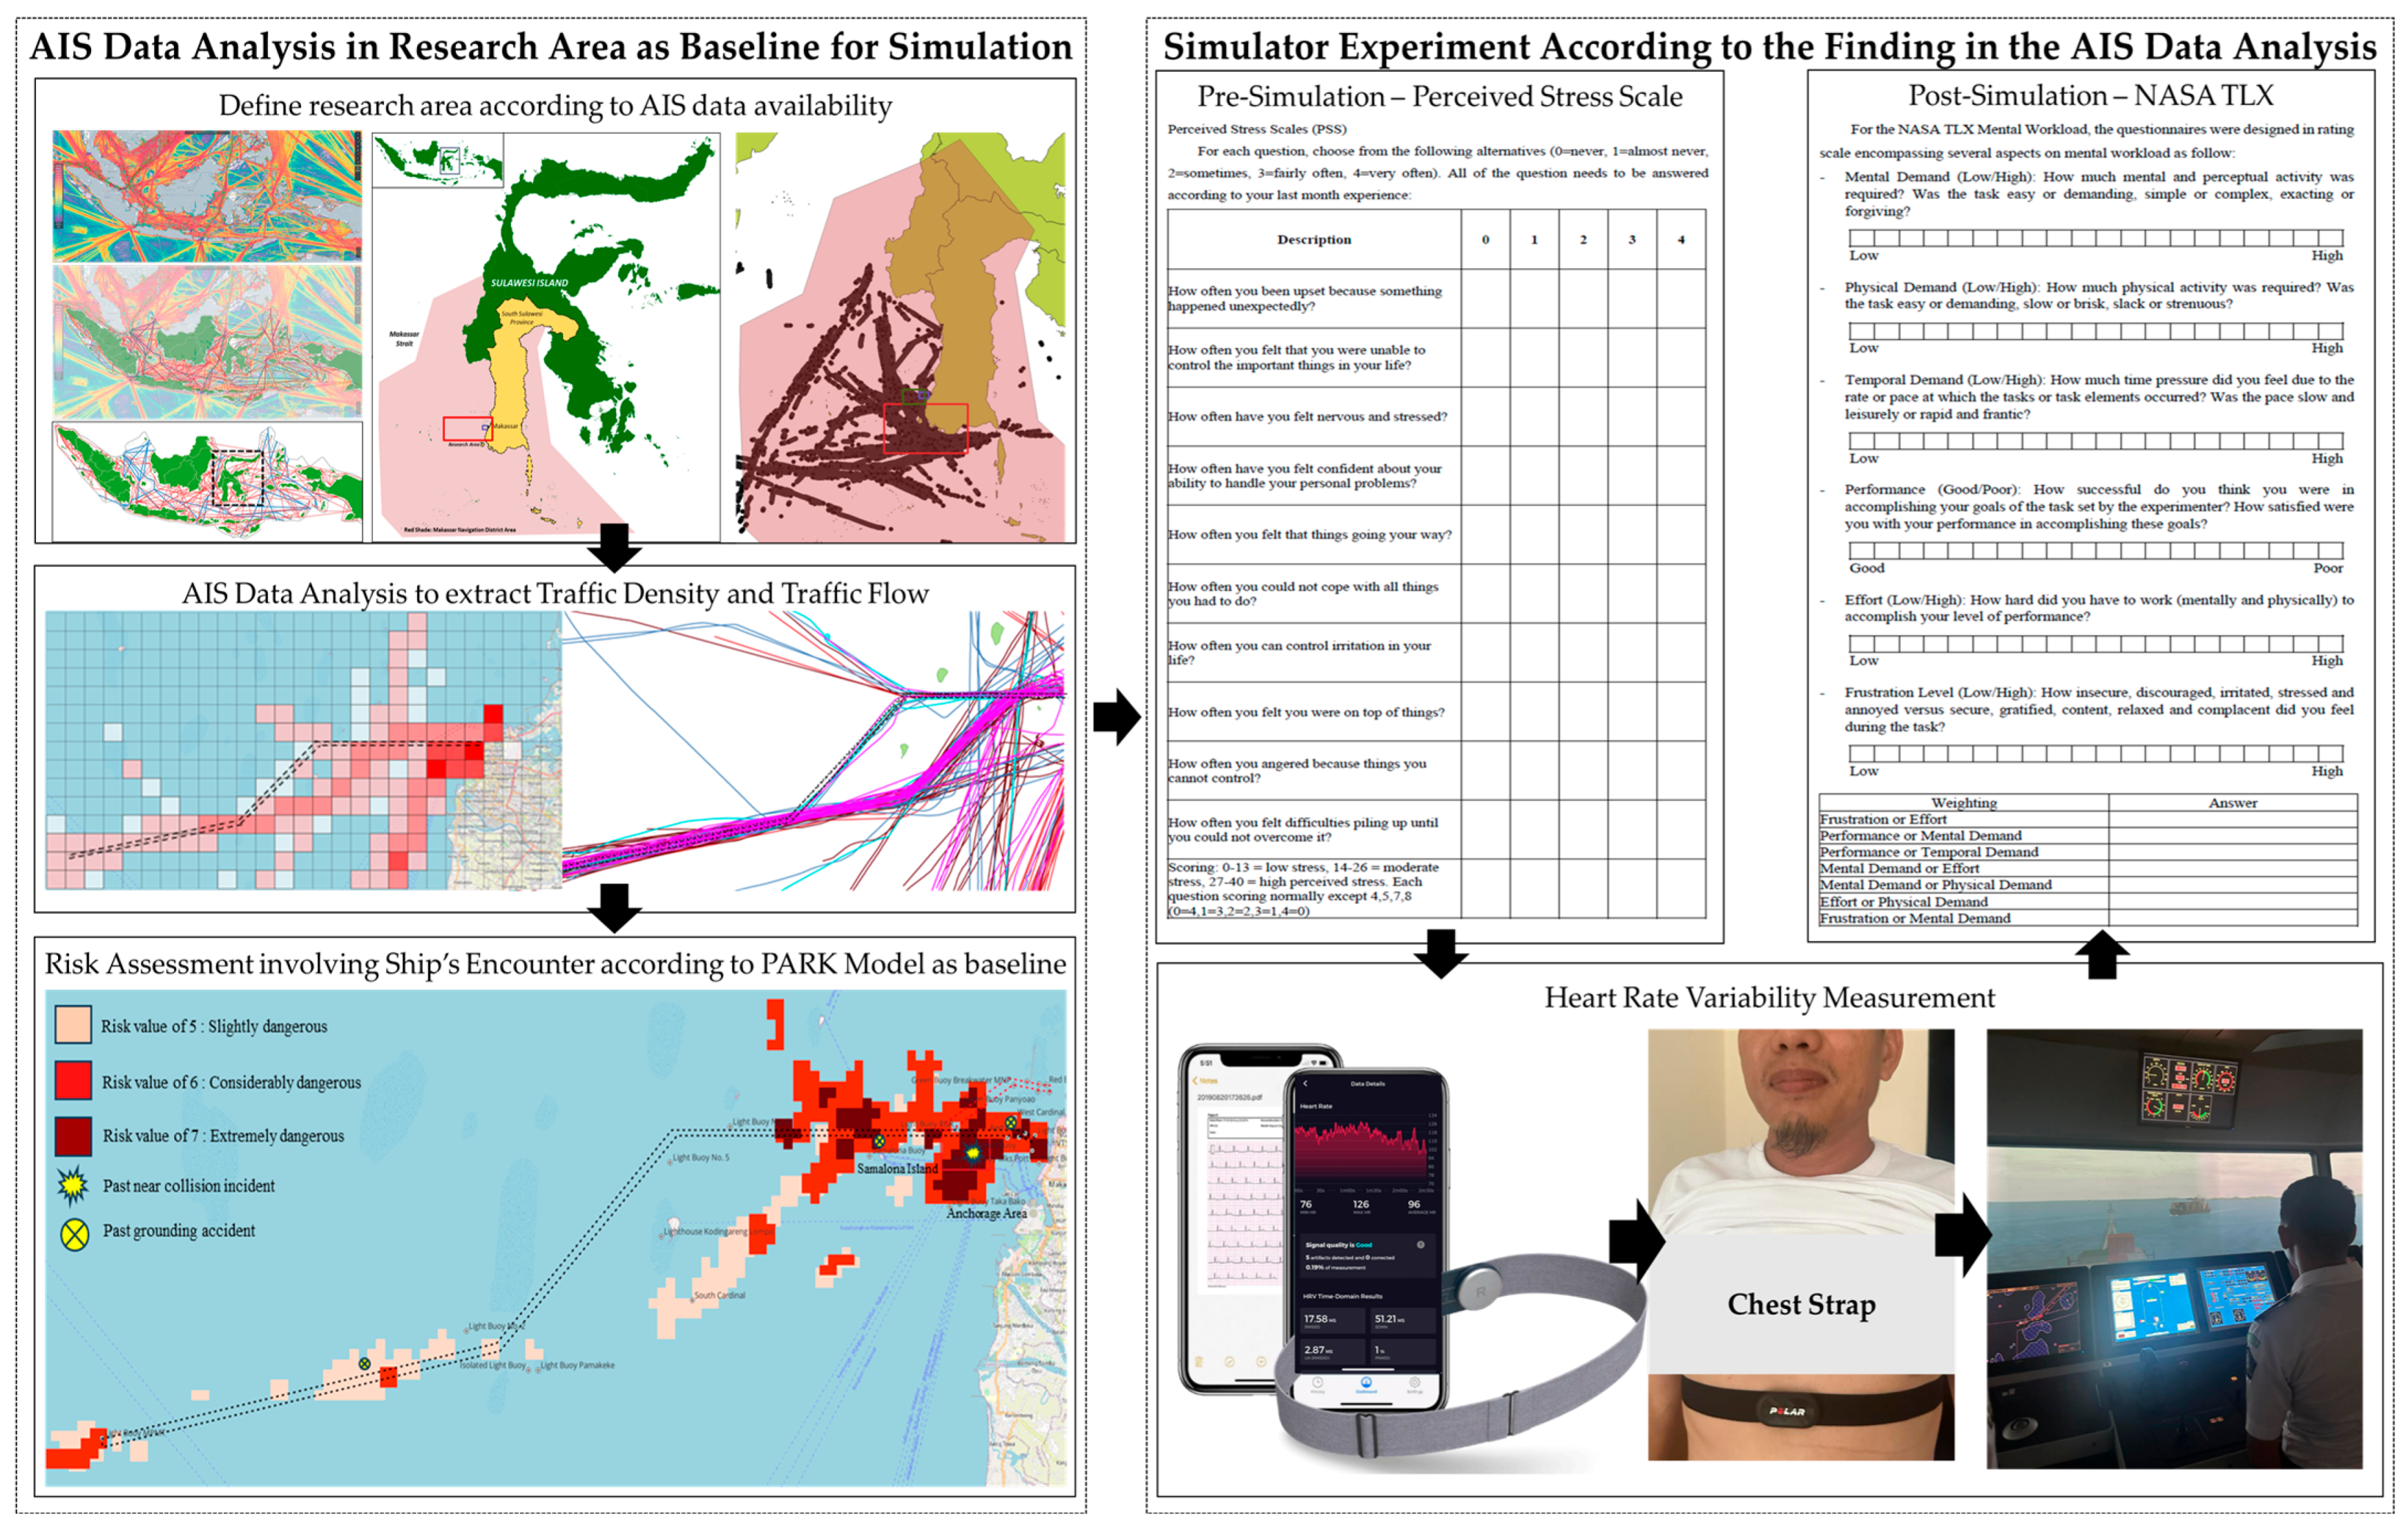
This study used the results of a risk assessment on Makassar Port, Indonesia from a previous study using AIS data to reveal ship behavior, or in this case the navigator’s reactions when navigating the waters and encounters with another ship during port approach [3]. From the analysis of the AIS data, the potential risk of a ship’s encounters was then assessed using a perception-based model of risk, developed for Korean seafarers [46]. The general framework of this research is shown in Figure 1.

3.1. Previous Work in Risk Assessment in the Study Area

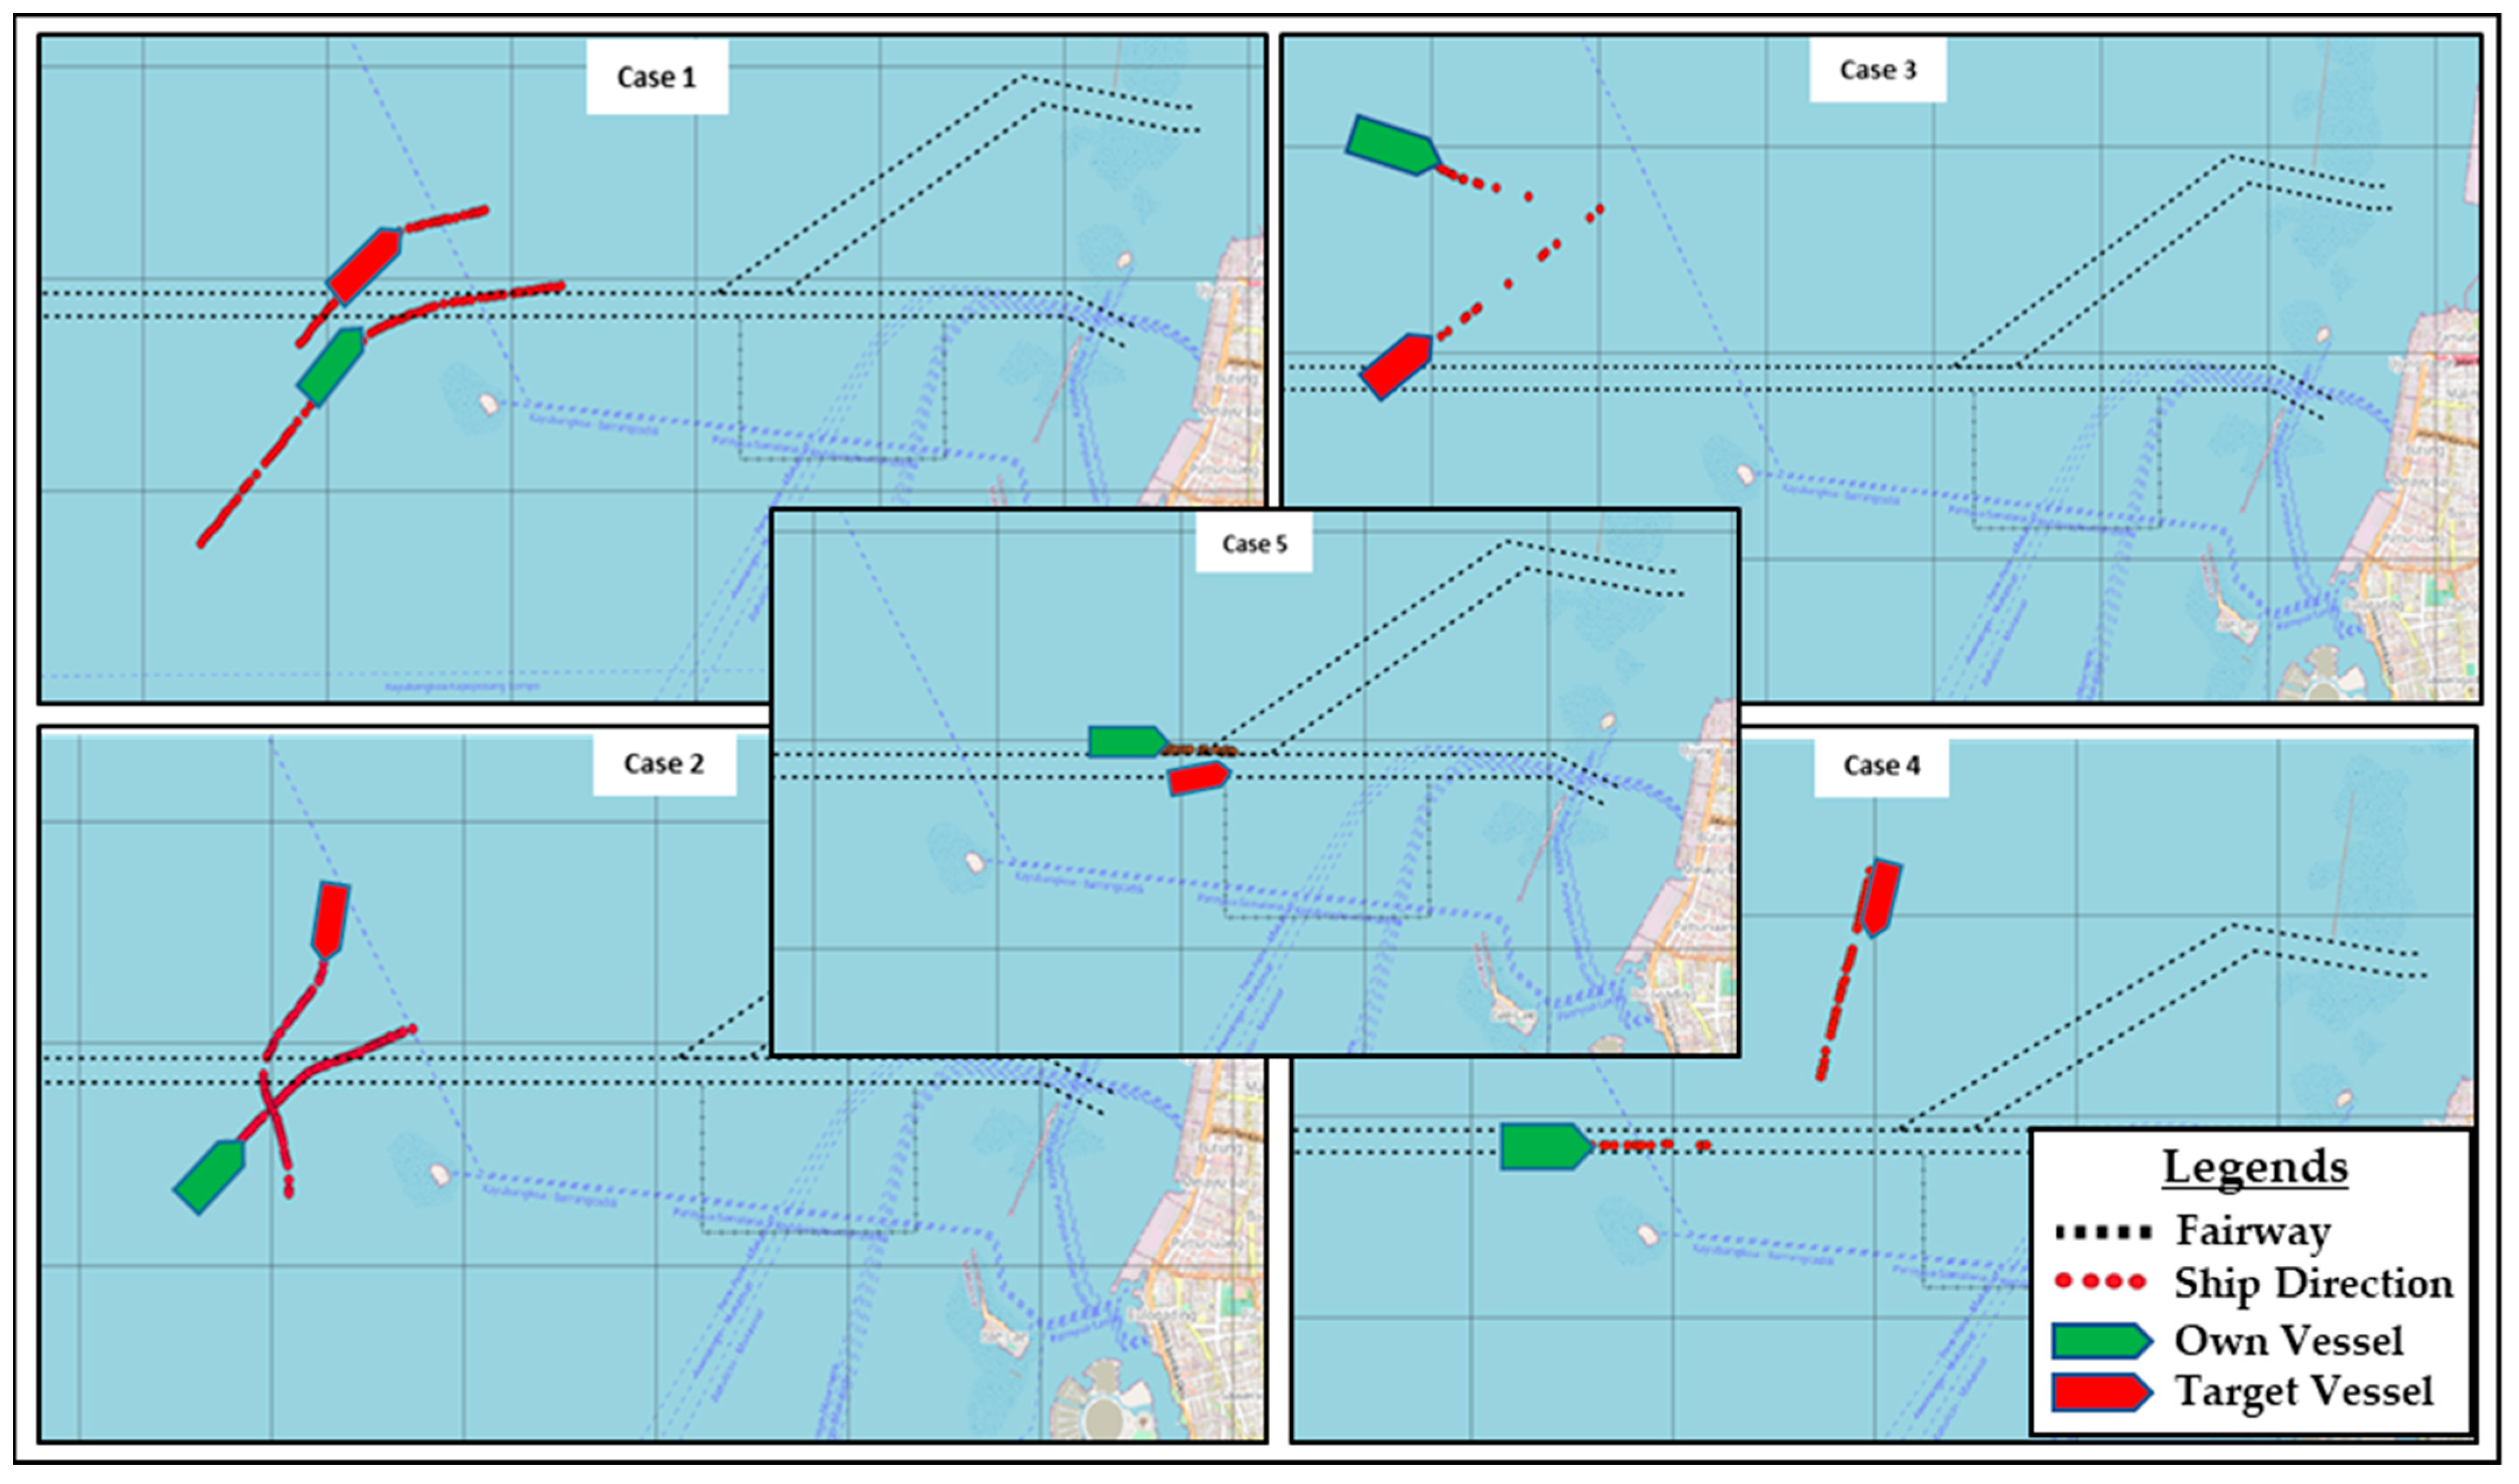
The traffic analysis studies were conducted in previous research utilizing 7 days of AIS data in the study area, which was the entry to Makassar Port, Indonesia [3]. As one of major the ports in Indonesia, the encounter situations found throughout the aforementioned analysis were then recreated as scenarios in the simulator. In this study, individual ship encounter cases were selected and labeled using the PARK (Potential Assessment of Risk) model [46], which assigns a risk value from 1 (extremely safe) to 7 (extremely dangerous) based on the vessel type, size, geometry, speed, and proximity factors (CPA, TCPA). Cases with a model-generated risk value of 7, classified as “extremely dangerous”, were selected for a further analysis, as illustrated in Figure 2.
The details of the selected cases in Figure 2 were then recreated into ten specific encounter cases with six different segments as follows.
The selected cases in Table 1 represent a ship’s encounters over 360 degrees, related to the individual’s own ship within a one hour simulation time, while case number 10 was not considered as an encounter situation. Furthermore, the results of the analysis in the study area found that feeder-sized container ships represent the majority of the ships in the area; thus, the simulation also used a similar ship as the individual’s own ship, with the target ship varied between a handy size tanker ship and similar feeder container ship. The details of the model ships used in this experiment are presented in Table 2.

3.2. Experimental Design and Procedures

In this study, the K-Sim® Navigation—Ships Bridge Simulator with 360° view made by Kongsberg Digital AS (Lysaker, Norway) was used. This simulator was installed in Barombong Maritime Polytechnic (Makassar, Indonesia). The simulated encounter scenarios were not arbitrarily designed but were derived from real-world AIS data captured in high-density maritime zones with a known history of collision risks. This data-driven foundation ensured ecological validity by replicating actual vessel movements, encounter geometries, and navigational stressors typical of daily operations.
Risk assessment criteria such as the proximity thresholds (CPA, TCPA), encounter types (crossing, overtaking, head-on), and collision probability were used to systematically select realistic, high-risk situations likely to induce navigator stress. Although this study was centered on Indonesian seafarers, references to Korean seafarers were incorporated where relevant due to their comparable training regimes, vessel operations, and regulatory standards, such as the Standard of Training, Certification, and Watchkeeping (STCW).
The study involved 24 male participants acting as ship captains, supported by officers and helmsmen to handle the ship’s steering commands, as depicted in the Figure 3. All of them were active male seafarers with normal hearing and good eyesight, who were not taking ongoing medication and were healthy and fit to perform the simulation. They were also familiarized with the simulator equipment and had performed in several scenarios during their studies. The participant demographics can be seen in the Table 3. Before the simulation commenced, all of them received a briefing one day prior and were instructed to have adequate rest at night (more than 7 h of sleep), without consuming any alcohol or caffeine. They were also told to avoid any activities involving high stress or resulting in physical fatigue. All of the relevant ethical matters were discussed earlier with the university’s research committee and approved.
Table 3 shows that the demographics of the participants are equally spread, with each age bracket making up 50.0%. The experience groups showed a dominance of highly experience navigators. The participants had a mean age of 39.88 years (SD = 5.68). While the gender composition was not the focus of this study, the age distribution was relatively consistent across the sample. We acknowledge that non-balanced sample characteristics may introduce interpretive bias; therefore, we have reported key demographic metrics for transparency.
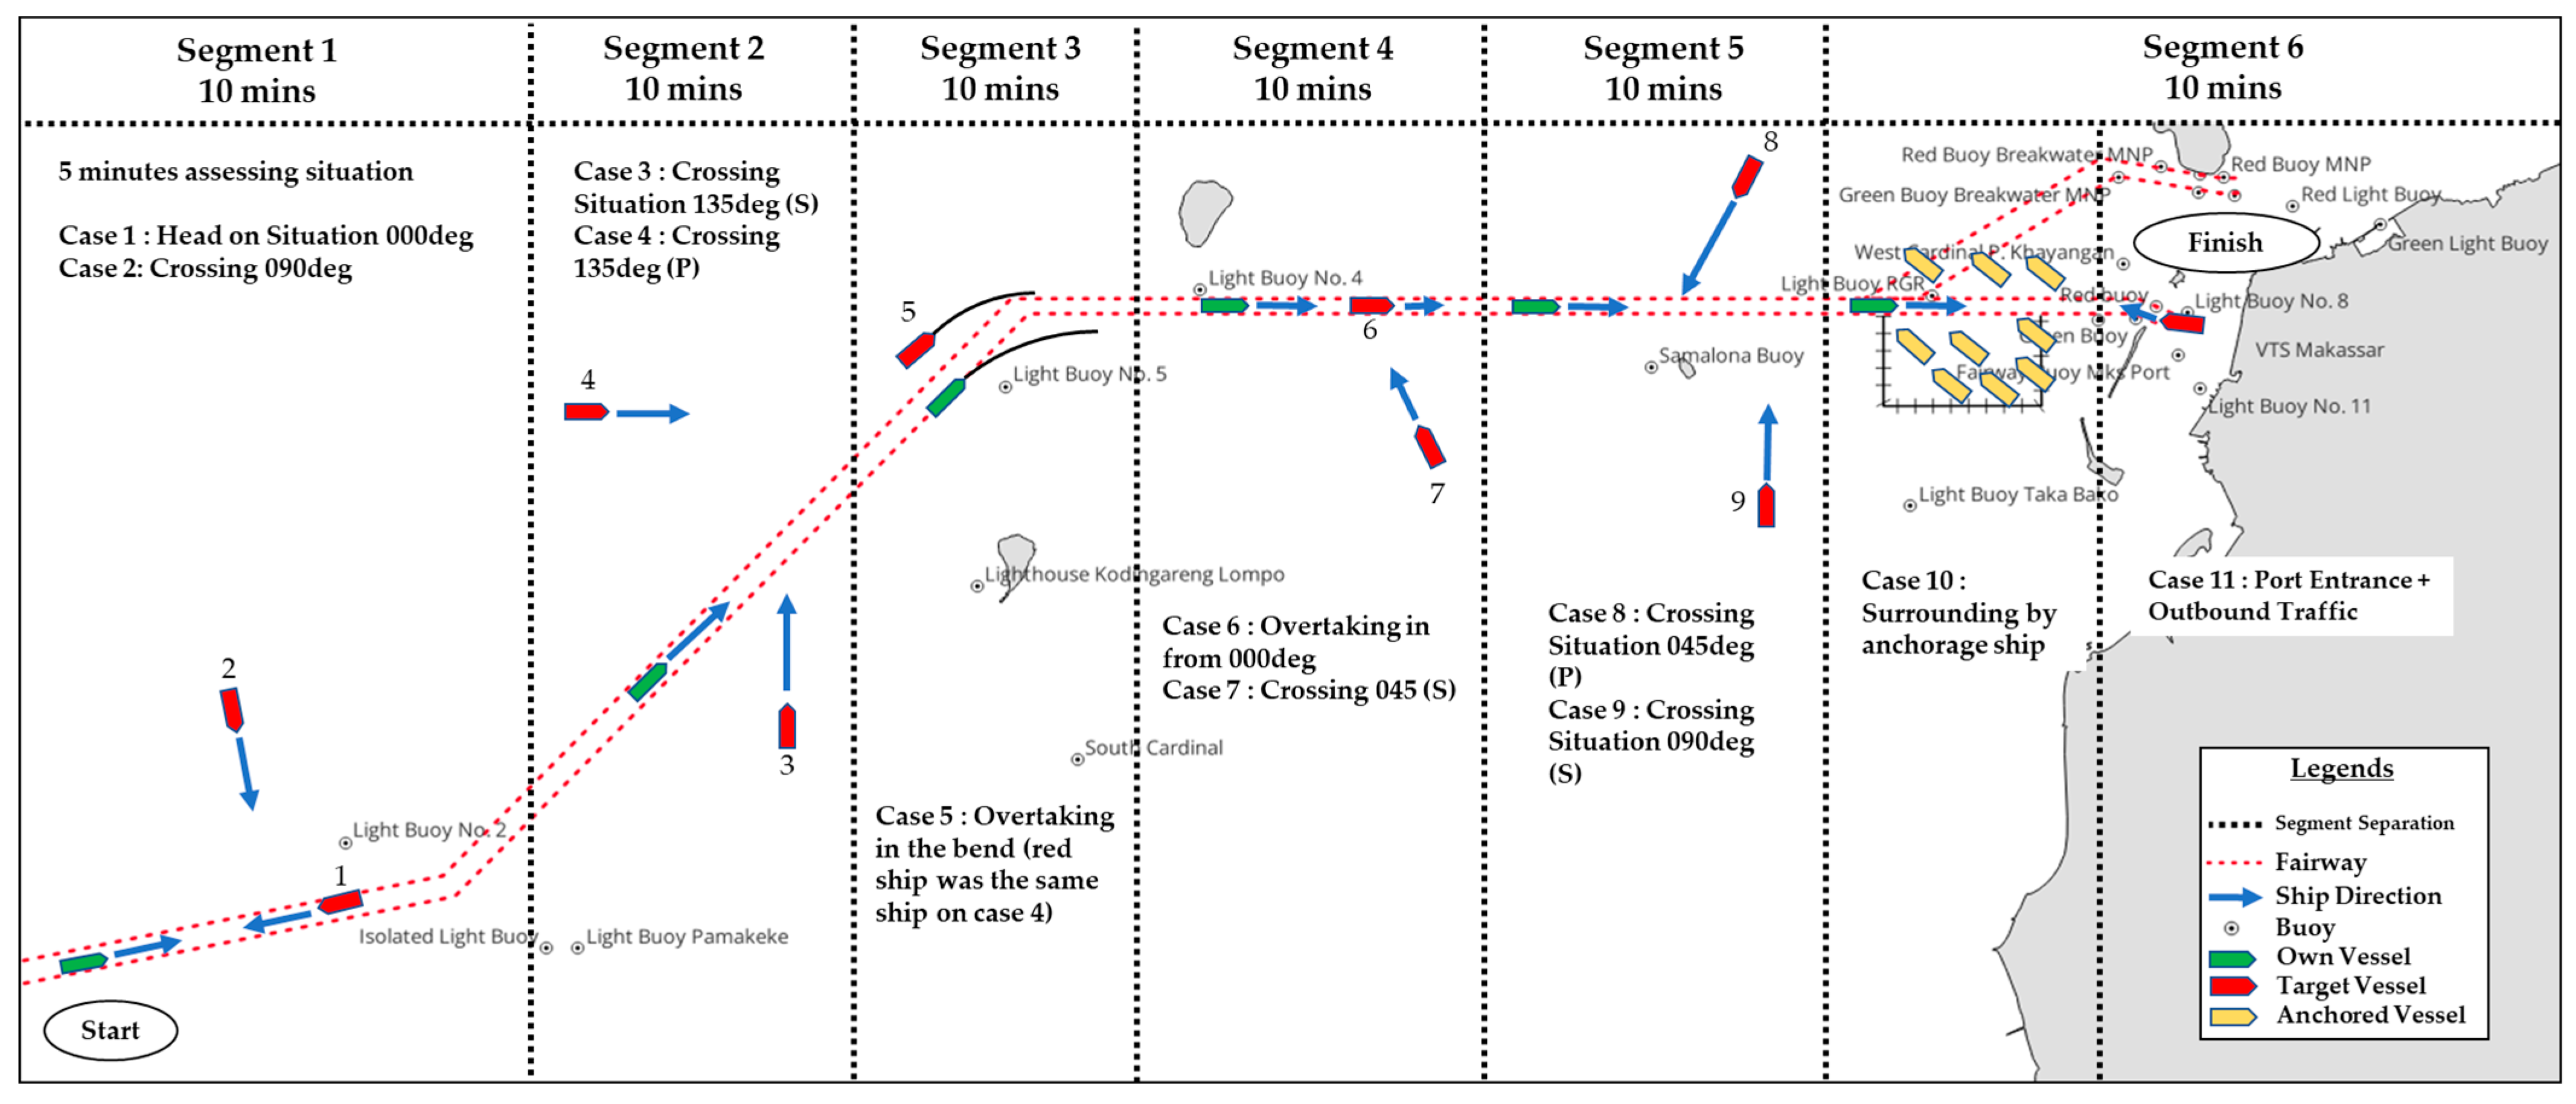
Prior to the commencement of the simulation, all participants completed the PSS questionnaire. They then wore a Polar H10 chest strap to collect HRV data via the Elite HRV application installed on a smartphone. As a backup to the chest strap and for quick visual monitoring of their heart rate data, the participants also wore a Polar Vantage V wristwatch. Both the chest strap and the wristwatch were connected via Bluetooth. Once everything was set up, the scenario then commenced according to the scenarios given in Figure 4 and the selected cases shown in Table 1. The overall scenarios were depicted as follows.
The simulation scenarios were constructed based on AIS-derived encounter data and risk assessments to reflect realistic and high-risk navigational situations commonly faced by seafarers. Each simulation segment was designed to reflect distinct encounter geometries and was completed at the vessel’s simulated desired speed set by each participant independently. On average, each segment lasted approximately 8 to 10 min, which served as the effective time window for calculating physiological metrics such as the RR interval, SDNN, RMSSD, and LF/HF ratio. This duration complies with accepted standards for short-term HRV analyses.
The simulation environment was set to daylight conditions, with the sea state set to a light breeze (Beaufort scale 2) and the north-easterly wind set to 4–6 knots, with minimal currents. To meet the required time, the distances were limited to 14 nautical miles from the start point to the finish point, and also to exacerbate the simulation, each participant was asked to arrive at the finish point at the exact estimated time of arrival that was set and agreed upon once the simulation began. After completing the simulation, the result of the HRV recording was then processed in Kubios computer software version 4.1.0, and once again all participants were required to fill in the NASA-TLX questionnaire.

3.3. PSS, HRV, and NASA TLX Data Collection and Processing

In this experiment, the PSS-10 scale was used to assess the subjective stress levels of the navigators. The total scores were categorized into three stress levels, low stress (0–13), moderate stress (14–26), and high stress (27–40), following the classification guidelines of [30,47]. This categorical approach has been applied in several maritime studies on seafarer stress [20,21,22,23]. The 10 item version was selected for its superior psychometric properties compared to other PSS variants, ensuring both reliability and validity in measuring perceived stress [48].
In the HRV analysis, the R wave represents the peak change in the ECG, and the RR interval (RRI) in milliseconds is defined as the time between two consecutive R waves. The HRV data characteristics obtained from the measurements include both time-domain and frequency-domain indices. Time-domain indices include the MRR (mean RR interval), SDNN (standard deviation of normal RR intervals), and RMSSD (root mean square of successive RR interval differences). Frequency-domain indices are derived from the power spectrum density of the resampled RRI data, which include low-frequency (LF; power spectrum in the frequency range of 0.04–0.15 Hz) results, high-frequency (HF; power spectrum in the frequency range of 0.15–0.4 Hz) results, and the LF/HF ratio (the ratio of low- to high-frequency results). The HRV indices relate to stress; thus, the indices selected to be utilized in this research were the MRR, SDNN, RMSSD, and LF/HF ratio [32,49,50]. The sample RR intervals are depicted in Figure 5.
For NASA-TLX, there were two types of information for each dimension—weights and scores. The weights reflect the perceived importance of each dimension as a contributor to MW in the specific task, while the scores represent the subjectively experienced magnitude of MW for each dimension. To determine the weights, subjects perform pairwise comparisons for each dimension pair, assigning a score of one to the dimension that contributes more to MW and zero to the other. After completing all 15 pairwise comparisons, the total score for each dimension ranges from zero to five. During task engagement, subjects rate each workload dimension based on their experienced MW. The performance dimension is rated on a scale ranging from 0 (good) to 100 (poor), while all other dimensions use a scale ranging from 0 (low) to 100 (high). This research focused specifically on the original version of NASA-TLX, as introduced [39] with the weighted scale.

3.4. Design, Variables, and Statistical Analysis

The analysis investigated how both subjective and physiological measures reflect navigator stress and workloads during simulated ship encounters. The dependent variables included the perceived stress (from the result of the PSS), workload (from the weighted scale of the NASA-TLX), and physiological responses (HRV metrics, including the time-domain MRR, SDNN, and RMSSD and frequency-domain LF/HF ratio). These were modeled against independent variables such as age, experience, the encounter segment, and the navigational context. Table 4 presents an overview of the hypothesized variable relationships and the initial modeling framework.
It is important to note that while the PSS and NASA-TLX were administered once per participant at the global level (before and after the simulation), the HRV indicators were collected separately for each segment. Consequently, each segment was included as an independent variable to capture physiological differences across encounter contexts and their contribution to global stress outcomes. This modeling choice acknowledges that while subjective reports are global and not tied to individual segments, localized physiological changes may still relate to overall stress. This assumption is well aligned with the human factors literature, which links localized physiological arousal with global perceptions of cognitive and emotional demand in simulation-based settings.
To explore the dynamics between subjective and physiological responses, the analysis was structured into two exploratory phases:
  • Step 1—Subjective Stress Analysis:
    • The first part assessed how demographic and encounter-related variables, specifically age and experience, influenced the subjective stress levels measured using the PSS. Since the PSS scores did not meet the normality assumption (as assessed via the Shapiro–Wilk test and residual plots), non-parametric statistical methods were used. These included:
      -
      Kruskal–Wallis H test for non-parametric comparisons across experience groups.
      -
      Mann–Whitney U test for pairwise comparisons (e.g., young vs. old participants).
      -
      NASA-TLX scores were collected but not used in the primary statistical tests in this step.
  • Step 2—Physiological Response Analysis (HRV):
    • This step consisted of two complementary analyses:
      -
      Step 2a—Subjective Stress/Workload → Physiological Responses:
      -
      The first part of the analysis examined how subjective stress and an individual’s workload relate to physiological responses, measured through HRV features:
      • Time-domain features: SDNN, RMSSD;
      • Frequency-domain feature: LF/HF ratio;
      • Mean RR interval.
      -
      Where appropriate, a one-way ANOVA was used to test for HRV differences across PSS categories. Spearman’s correlation was also used to explore monotonic relationships between subjective, workload, and physiological indicators.
      -
      Step 2b—Physiological Responses → Subjective Workload (NASA-TLX):
    • To further explore the predictive relationship, multiple linear regression models were constructed using NASA-TLX subscales (e.g., frustration, effort, mental demand) as dependent variables. The predictors included HRV-based physiological responses (e.g., RMSSD, MRR, LF/HF ratio) derived from key encounter segments. This modeling approach assessed whether localized physiological stress responses could explain the variance in the participants’ global workload perceptions.
Additionally, to model global stress outcomes using localized physiological inputs, an exploratory regression strategy was adopted with the PSS as the dependent variable and segment-based HRV values (e.g., MRR2, LF/HF2) as predictors. This approach reflects the assumption that critical segments disproportionately affect global stress perceptions. The statistical models were refined using backward stepwise selection informed by the significance (p < 0.05), practical effect size, and model fit (e.g., adjusted R2 for linear models). Variables with minimal contribution or multicollinearity were excluded to improve the parsimony and interpretability. This multi-layered framework enabled us to investigate bidirectional pathways of how stress affects physiological responses and conversely how physiological arousal predicts workload and stress perceptions. Together, these layers provide a comprehensive understanding of navigator stress during complex maritime scenarios.

4. Result

4.1. Subjective Stress and Workload Analysis

4.1.1. Perceived Stress

The subjective perceived stress results obtained from the participants did not meet the normal distribution due to the low sample numbers; thus, the non-parametric test method through Mann–Whitney U test was used for the age demography and Kruskal–Wallis H test for the participants’ experiences. This was conducted to explore whether there were significant differences in demographic characteristics in the groups, with the perceived stress levels divided into low stress, moderate stress, and high stress.
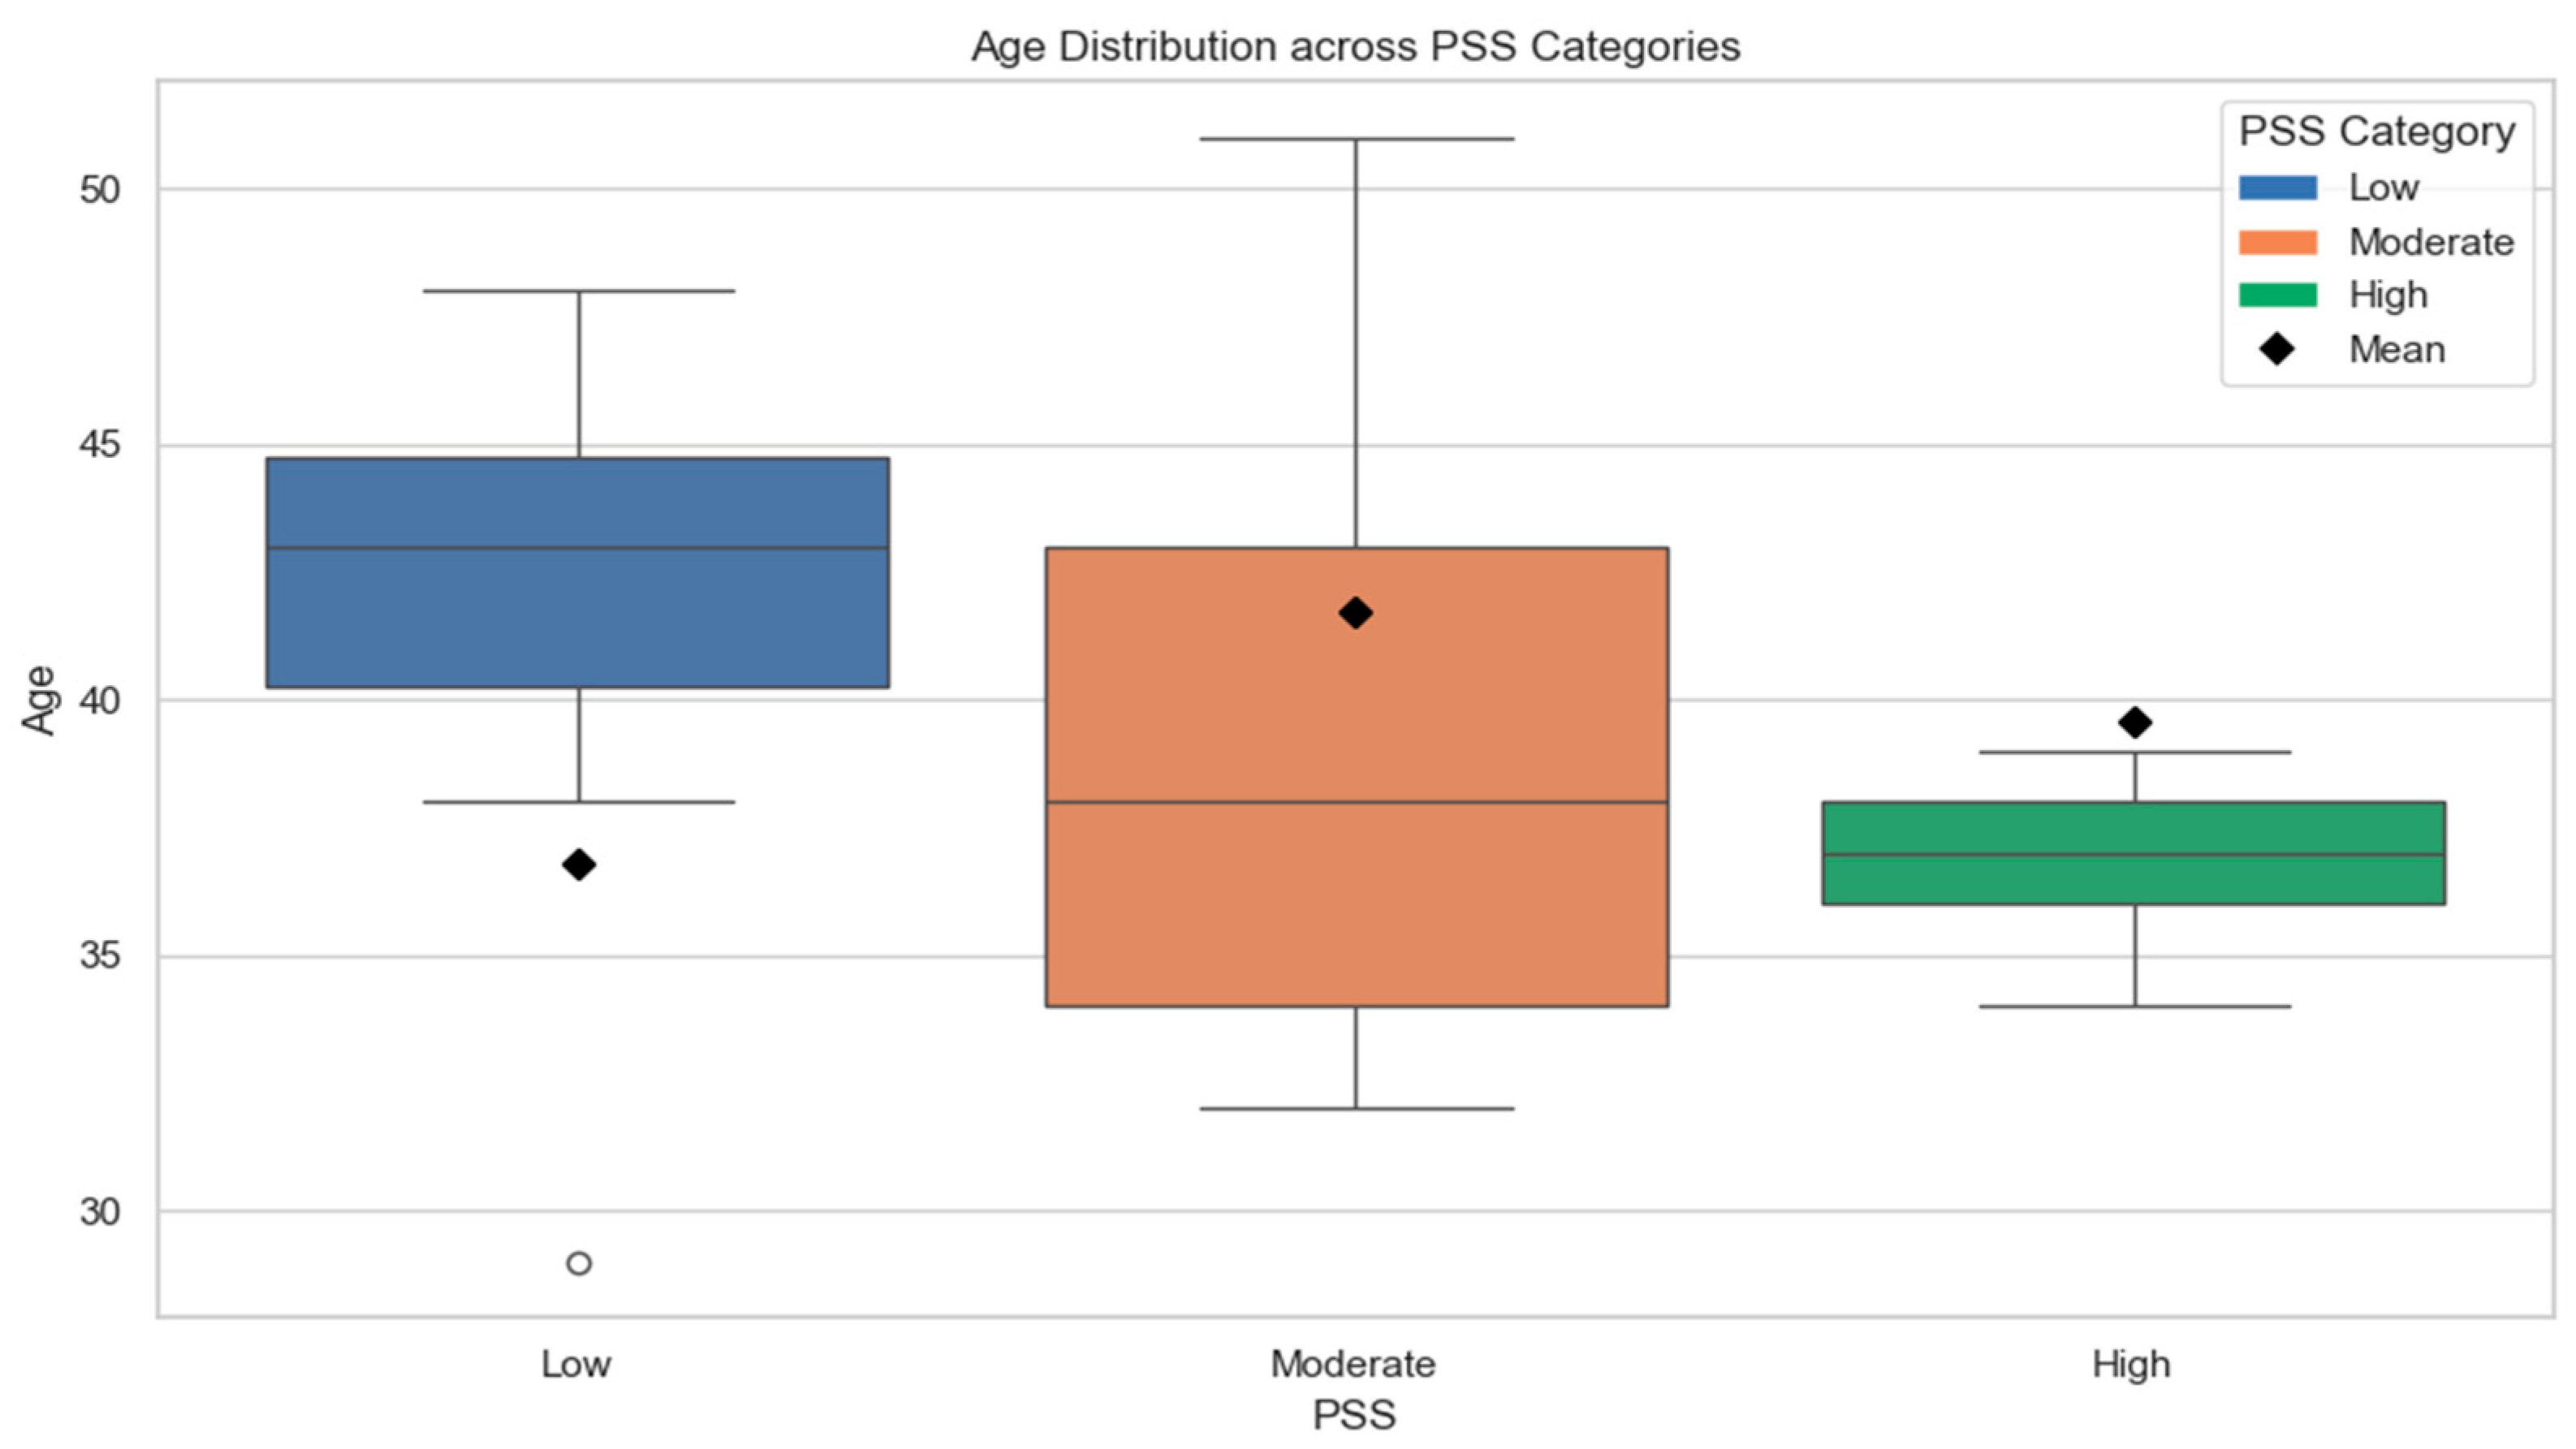
To examine whether there was a significant difference in perceived stress levels between young and old participants, a Mann–Whitney U test was conducted. The groups were classified based on age into young participants (n = 12) and old participants (n = 12). The results of the Mann–Whitney U test indicated that there was a statistically significant difference in the perceived stress levels between the two age groups (U = 35.50, Z = −2.142, p = 0.032). Specifically, the young participants had a higher mean rank (15.54) compared to the old participants (mean rank = 9.46), suggesting that the young participants generally reported higher levels of perceived stress, as represented in Figure 6.
Similarly, for the experience demographic, a Kruskal–Wallis H test was performed, with the groups categorized as low experience (n = 3), moderate experience (n = 7), and high experience (n = 14). The test compared perceived stress levels across these three groups and yielded a Chi-square statistic of 5.129 with 2 degrees of freedom and a p-value of 0.077. Since this p-value was greater than the conventional significance level of 0.05, we could not conclude a statistically significant difference in perceived stress across the groups. Therefore, no formal post hoc pairwise comparisons were conducted. However, the exploratory pairwise results are presented in Table 5 for descriptive insight only.

4.1.2. Workload

A Spearman correlation analysis was conducted to examine the relationship between the overall NASA-TLX score and demographic variables (age, experience), as well as all HRV measures. The results indicated very weak relationships and no statistically significant correlations between the NASA-TLX score and any of the examined variables. Therefore, the correlation results for individual HRV metrics and demographic variables are not presented in tabular form, as none reached statistical significance (all p-values > 0.05), indicating a lack of association between the subjective workload and physiological or demographic indicators in this study.
To further explore this, we performed a one-way ANOVA to assess whether the navigators’ level of experience had an effect on their perceived workload, and a t-test was performed to evaluate the influence of the age group on the NASA-TLX score. The results of the ANOVA are shown in Table 6.
Prior to conducting the ANOVA, assumption checks were carried out. The Shapiro–Wilk test confirmed a normal distribution across experience groups (all p > 0.05), and Levene’s test confirmed the homogeneity of variances (p = 0.626). As seen in Table 5, the resulting p-value of 0.991 indicates no significant difference in NASA-TLX scores across different experience levels. In addition, an independent samples t-test was conducted to examine whether the age group influenced the NASA-TLX scores. The results are presented in Table 7.
The normality of each age group was again verified using the Shapiro–Wilk test (all p > 0.05), and the variance equality was confirmed via Levene’s test (p = 0.566). The test result (p = 0.931) indicates no statistically significant difference in NASA-TLX scores between younger and older participants.
To further investigate potential predictors of subjective workload, a series of linear regression analyses were conducted using age, experience, and HRV features as independent variables, with each NASA-TLX subdimension (MD, PD, TD, OP, EF, and FR) as the dependent variable. The regression models below were selected after we satisfied all assumptions of linearity, residual normality, multicollinearity, and homoscedasticity. The results showed that age and the LF/HF ratio in segment 2 significantly influenced the NASA-TLX TD scores (F = 2.784, p = 0.041), while the LF/HF ratio in segment 6 was positively associated with the NASA-TLX OP scores (F = 2.648, p = 0.049). Segment 2 corresponds to crossing encounters at 135° and segment 6 corresponds to outbound traffic in head-on situations with anchorage ships in the surrounding area. The full regression results on the significance are shown in Table 8 and Table 9.

4.2. Physiological Stress Responses

4.2.1. Correlation Analysis

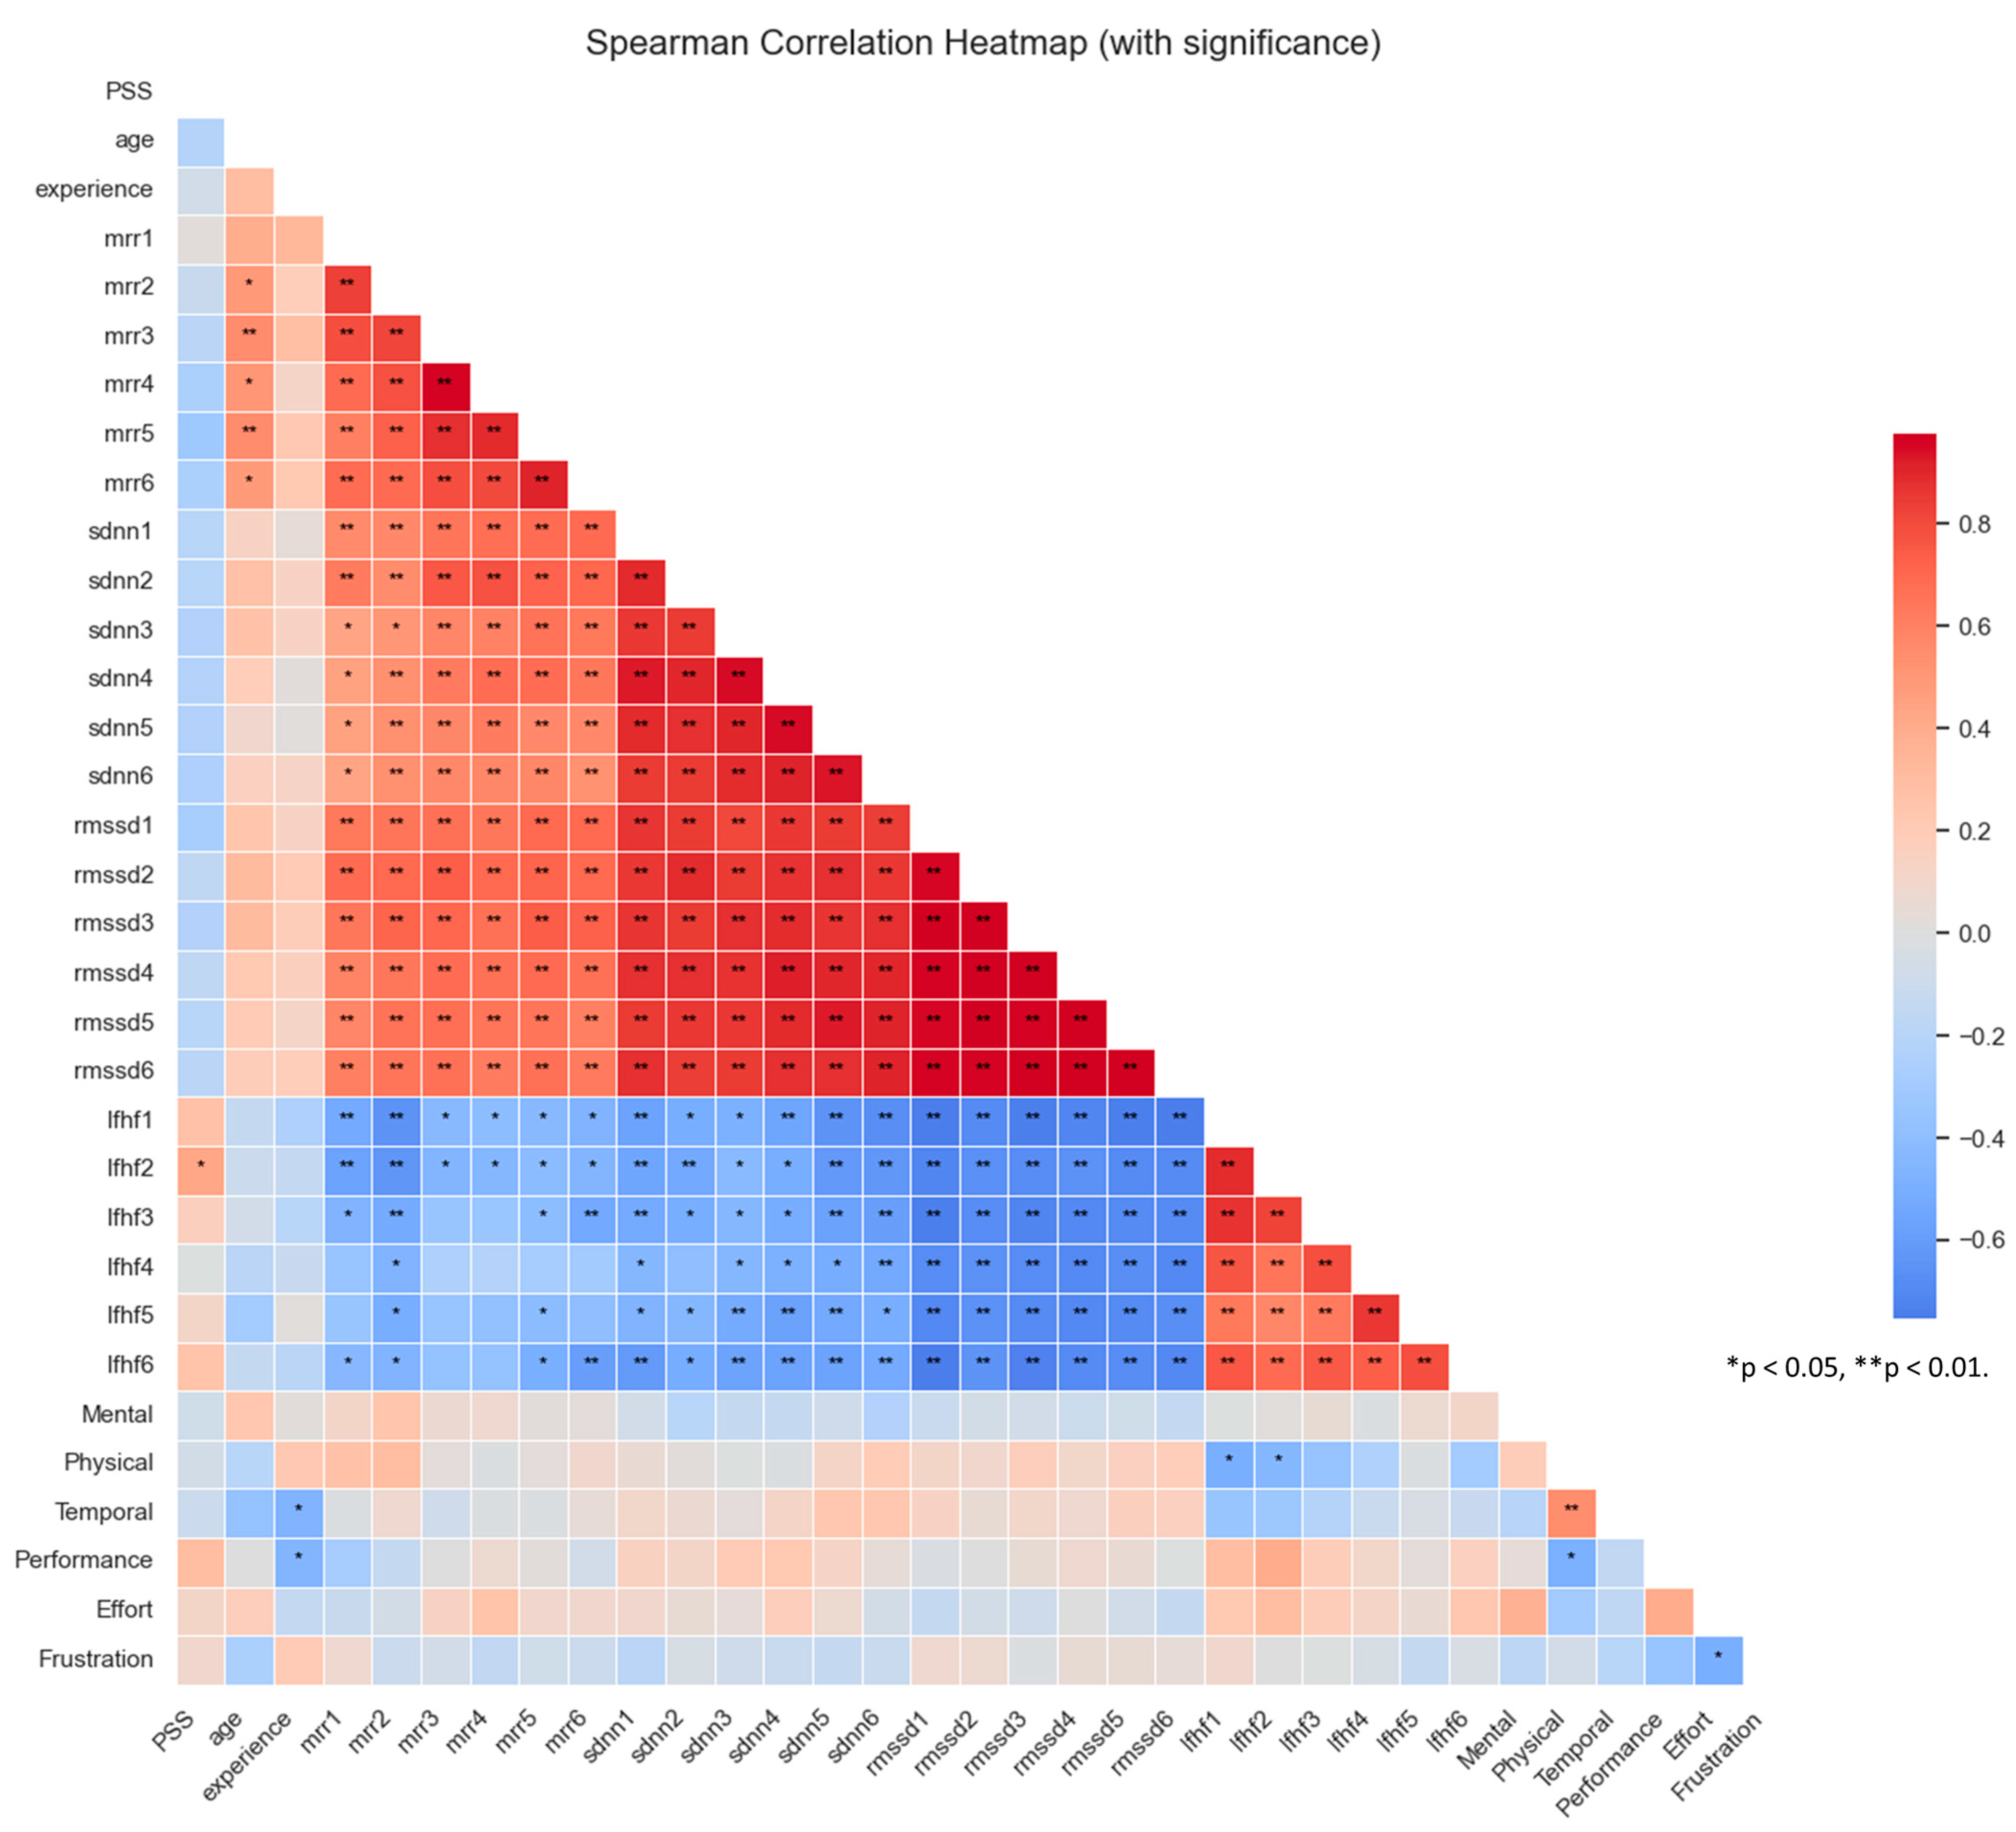
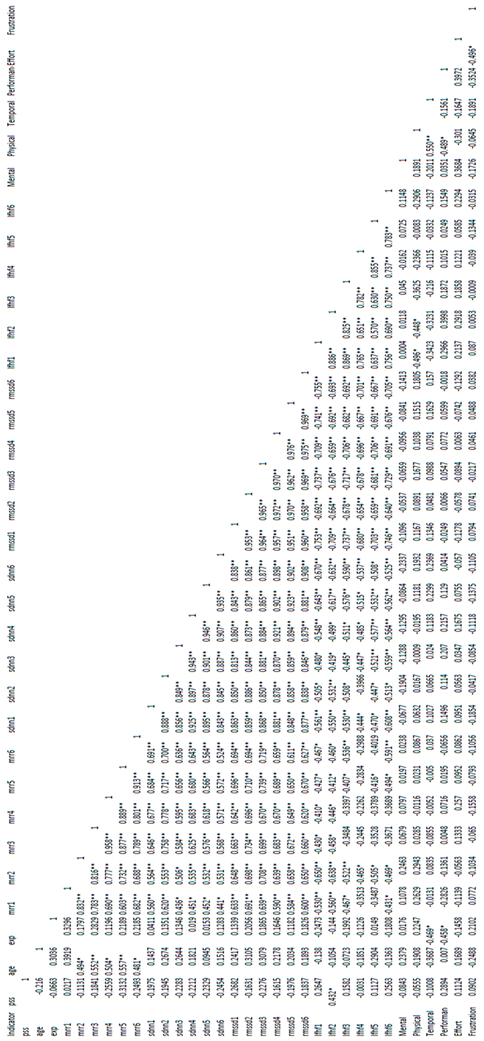
Since the subjective perceived stress of the navigators did not meet the normal distribution, a non-parametric Spearman correlation analysis was selected to find the correlation of each feature, with the results shown in the Table 10 and Figure 7 depicting the heatmap.
Figure 7 and Table 6 showing that age and HRV time-domain features (e.g., SDNN, RMSSD) show significant negative correlations with the PSS. LF/HF ratio segment 2 (LFHF2) shows the strongest positive correlation with perceived stress (r = 0.432, p < 0.05). The NASA-TLX subscales show weaker and mostly non-significant associations with the PSS. These correlations support the premise that specific HRV metrics reflect physiological activation under perceived stress conditions, particularly sympathetic dominance (LF/HF).

4.2.2. Between-Group Differences

Psychological stress was significantly linked to a decrease in the RR interval and an increase in the LF/HF ratio, suggesting a stronger dominance of sympathetic nervous system activity during stressful periods of the day [38,51]. We analyzed whether varying levels of perceived stress were associated with changes in physiological responses. These features were selected to measure the perceived stress on the navigators, under the condition that if they met normal distribution, then the one-way ANOVA could be explored. Across six segments, we first determined the mean value of each segment and found that the mean MRR has a significant effect on the perceived stress (p = 0.030), as shown in the Table 11.
Through our exploration of each segment, the perceived stress showed significant differences in MRR on segment 2 (p = 0.032). We also found that the mean LF/HF ratio had a significant association with perceived stress (p = 0.015), as in Table 12. Figure 8 complements the ANOVA results by providing visual evidence of these physiological differences. The boxplot of the MRR values for segment 2 shows a notable reduction in RR intervals across increasing stress levels. Similarly, the LF/HF ratios increase across the PSS levels in segments 1, 2, and 5, supporting the role of sympathetic dominance in high-stress conditions. Segment 1 corresponds to crossing encounters at 090° port side and in head-on situations, while segment 5 corresponds to crossing encounters at 090° starboard side and 045° port side.
Furthermore, the relationship between the perceived stress and mental workload (MW) was also explored using both TLX dimensions. However, no statistically significant differences were found in LF/HF ratios across workload levels. This contrasts with previous findings (e.g., [52]), suggesting that the workload, as measured in our study, may not have elicited sufficient variance to affect autonomic responses.
To further interpret the statistical findings, boxplots were generated to visualize the distribution of physiological stress markers. The boxplot of the mean MRR revealed a downward trend from the low- to high-stress groups, supporting the idea that higher perceived stress is associated with reduced RR intervals. Segment 2 reached statistical significance (p = 0.032), suggesting elevated stress.
For the LF/HF ratios, segments 1, 2, and 5 showed clear increases in sympathetic dominance (higher LF/HF values) across the rising PSS categories. The aggregated boxplot of the mean LF/HF values further affirmed this pattern, whereby individuals reporting high perceived stress levels consistently exhibited elevated LF/HF ratios.

4.3. Predictive Modelling of HRV and Stress

4.3.1. Linear Regression for HRV

Boxplot visualizations (Figure 8) confirmed the upward trends in LF/HF values across PSS groups, with significant results observed in segment 1 (p = 0.009), segment 2 (p = 0.008), and segment 5 (p = 0.032), although these were uncorrected for multiple comparisons.
The results of the linear regression model predicting the LF/HF ratio for segment 1 (Table 13) showed that only the PSS had a statistically significant effect (p = 0.036, β = 0.378), indicating that higher perceived stress levels are linked to increased sympathetic nervous system activity. Age and experience were not significant predictors.
Similarly, for segment 2 (Table 14), the PSS remained a significant predictor (p = 0.0009, β = 0.375), with a higher adjusted R2 (0.357), reinforcing the consistency of the relationship between perceived stress and the LF/HF ratio. In contrast, the regression model predicting the MRR in segment 2 (Table 15) revealed that age was a significant predictor (p = 0.0255, β = 7.426), while the PSS was not statistically significant.

4.3.2. Ordinal Logistic Regression for the PSS

To investigate the influence of HRV features across all segments, ages, and experience levels of the MW related to physical and performance demands on the navigators’ perceived stress, an ordinal logistic regression model was established. Combined with the results of the correlation analysis, the age group and experience group, although presenting weak negative correlations, remain essential demographic factors that may influence perceived stress. The MRR, LF/HF, and NASA-TLX results for the MW (MD, MD, and OP) were selected as explanatory variables. The dependent variable was each of the navigator’s perceived stress level, labelled 1 to 3, indicating perceived stress levels ranging from low to high. Independent variables were entered into the model individually to assess their individual contributions. MRR2 and LF/HF2 exhibited the strongest positive correlations with perceived stress (ρ = 0.006, p < 0.05 and ρ = 0.035, p < 0.05), indicating a significant relationship between higher HRV feature values in segment 2 and increased stress levels. The results are shown in Table 16.
The regression coefficient of the ‘low perceived stress state’ indicates the model intercept of the low perceived stress state relative to the moderate perceived stress state and high perceived stress state. The regression coefficient of the ‘moderate perceived stress state’ indicates the model intercept of the low perceived stress state and moderate perceived stress state relative to the high perceived stress state. With other conditions unchanged, the odds ratios (OR) is a measurement of change of a variable due to the increase in another variable by one unit. The OR represents the change in the dependent variable resulting from a one-unit increase in an independent variable, while holding all other factors constant. In ordinal logistic regression, it is essential to conduct a parallel line test to assess whether the coefficients of the independent variables are equal. This hypothesis is evaluated using Chi-square statistics and their associated p-values, which assist in confirming the model’s validity [53,54].
To verify the ordinal logistic regression model’s suitability, the proportional odds (parallel lines) assumption was tested. The likelihood ratio test was performed to assess whether the partial regression coefficients of all independent variables in the model were equal to zero. The result of the parallelism test indicated that the regression equations were parallel to each other (χ2 = 0, p = 1 > 0.05), meaning that the parallelism assumption held. The overall model fit was evaluated by comparing the two log-likelihoods, with the result showing χ2 = 25.284 and p = 0.0309 < 0.05, indicating that the model fits well. The model’s predicted log-odds for low and moderate stress states based on all predictors are shown in Equations (1) and (2), respectively.
L n p y 1 = 2.2372 0.3518 X 1 + 0.0211 X 2 + 0.0280 X 3 + 0.6762 X 4 + 1.1370 X 5 0.4257 X 6 0.6041 X 7 0.4143 X 8 + 0.6836 X 9 0.0088 X 10 + 0.0051 X 11 0.0023 X 12
L n p y 2 = 3.9664 0.3518 X 1 + 0.0211 X 2 + 0.0280 X 3 + 0.6762 X 4 + 1.1370 X 5 0.4257 X 6 0.6041 X 7 0.4143 X 8 + 0.6836 X 9 0.0088 X 10 + 0.0051 X 11 0.0023 X 12
Here, p(y ≤ 1) presents the probability value that the perceived stress is low; p(y ≤ 2) presents the probability value that the perceived stress is low and high. In Equations (1) and (2), Ln[p(y ≤ 1)] and Ln[p(y ≤ 2)] represent the logarithms of probability. X1, X2, X3, … X12, denote age, experience, the MRR on segment 2, and the LF/HF ratios on each segments, respectively, along with mental, physical, and performance demands; Y denotes the PSS level. The model was statistically significant based on the likelihood ratio test (p = 0.0135) and the parallelism test (p = 1), confirming that the independent variables used in the model significantly explain variations in PSS results.
The ordinal logistic regression model assesses the relationship between physiological, cognitive, and demographic factors in predicting perceived stress levels. Age (β = −0.3518, p = 0.027, OR = 0.7034) is a statistically significant predictor, indicating that as age increases, the likelihood of experiencing higher stress decreases. MRR2 (β = 0.0280, p = 0.006, OR = 1.0284) also shows a significant positive association with stress, suggesting that individuals with higher MRR2 values have an increased probability of experiencing higher stress. Furthermore, LFHF2 (β = 1.1370, p = 0.035, OR = 3.1173) is a significant predictor, implying that increased LFHF2 values, which indicate greater sympathetic nervous system activity, are associated with a higher likelihood of perceived stress.
Conversely, LFFH3 (p = 0.192), LFFH4 (p = 0.143), LFFH5 (p = 0.451), and LFFH6 (p = 0.889) were not statistically significant, indicating that these specific HRV-related parameters do not meaningfully contribute to stress perception in this model. Additionally, experiences (p = 0.870), LFFH1 (p = 0.244), MD (p = 0.111), PD (p = 0.597), and OP (p = 0.679) were also not significant, suggesting that cognitive- and workload-related factors may not be primary determinants of perceived stress.

4.4. Exploration of Effects of Mariner’s License and Last Ship Experience on Subjective Stress, WL, and Physiological Stress Responses

We further explored the relationships between subjective and physiological stress indicators with three key variables: (1) CoC; (2) last position on board; (3) type of last ship experience. Using the Kruskal–Wallis H test for non-parametric group comparisons, we analyzed whether these categorical background variables were associated with significant differences in perceived stress, workload ratings (NASA-TLX subscales), and HRV-based physiological responses (SDNN, RMSSD, MRR, LF/HF ratio) across six simulation segments.
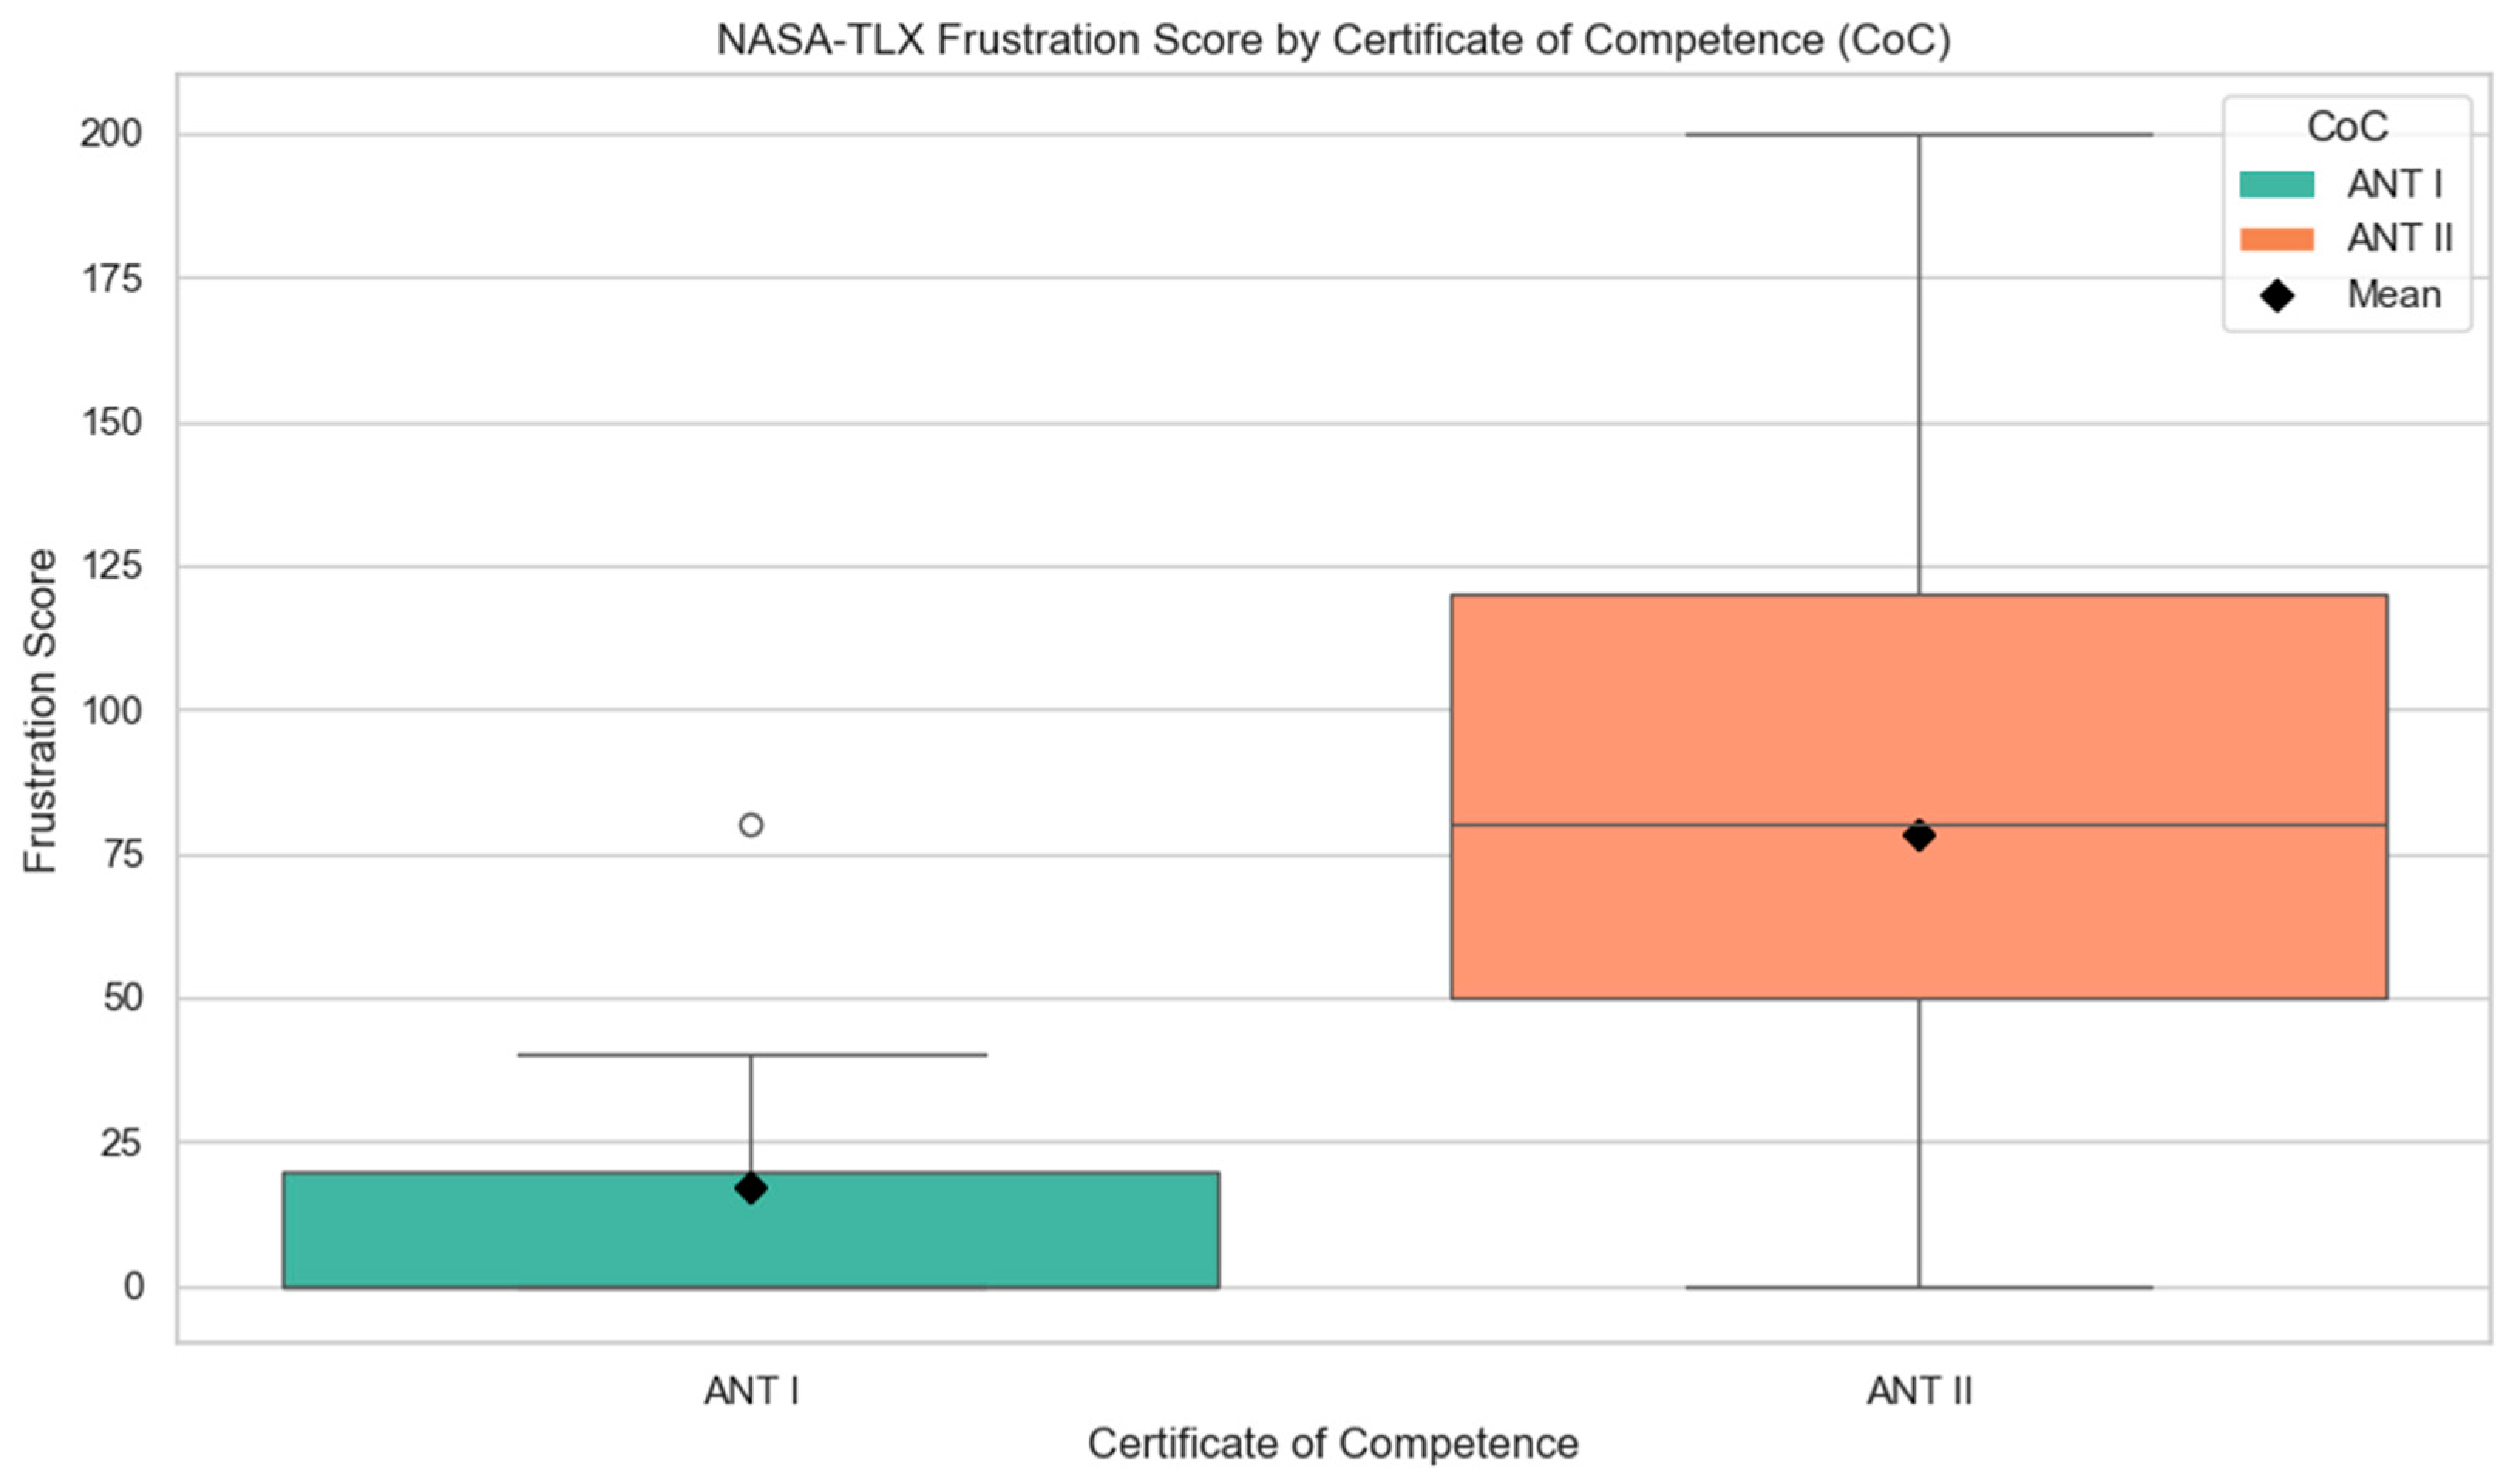
The analysis found no significant differences in PSS scores or HRV-based physiological indicators across groups stratified by last rank or last ship type. However, the CoC level showed a statistically significant effect on the NASA-TLX frustration subscale (H = 6.2421, p = 0.0125), as shown in Figure 9, while the ANT II participants exhibited higher frustration levels than ANT I.
Furthermore, a multiple linear regression was conducted to evaluate whether the CoC, last position onboard, or last ship type experience could significantly predict the subjective stress (PSS), perceived workload (NASA-TLX subscales), or physiological stress responses (HRV metrics). The regression revealed that the CoC level (ANT II) was a marginally significant predictor of frustration. The model explained 15.8% of the variance (adjusted R2 = 0.158, F (4, 19) = 2.079, p = 0.124). Among all predictors, only the Certificate of Competence (CoC, ANT II) was statistically significant (β = 77.45, p = 0.043), indicating higher frustration levels among ANT II holders. No other predictors (age, experience, last rank, last ship type) reached significance (p > 0.05).

5. Discussion

This study began with an analysis of AIS data, which were used to reconstruct specific multi-ship encounter scenarios identified during the risk assessment phase, as illustrated in Figure 4. Stress was evaluated through three instruments—the PSS, HRV, and NASA-TLX. The participant pool consisted entirely of male officers due to availability constraints at the training facility, while we ensured a sample balance across age and experience. Specifically, 50% of the participants were below 40 years of age and 50% above, while their experience levels were distributed among the low, moderate, and high categories. Although this demographic composition reflects realistic crew compositions in Indonesian merchant marine training institutions, we acknowledge that the gender imbalance may limit the generalizability. This limitation will be addressed as part of our future research recommendations, as well as with added imaginary scenarios that put seafarers in no-way-out situations (for example, an inevitable grounding or collision, where we then add a man overboard situation to see how different groups of seafarers would cope).
The significant difference in PSS scores between the younger and older participants suggests that age may influence how stress is perceived. Younger individuals may be more sensitive to stress or experience it more intensely, potentially due to psychosocial or environmental factors such as work demands, educational pressures, or life transitions. Further research is warranted to investigate the underlying mechanisms driving these age-related differences in perceived stress.
Similarly, an individual’s experience level also appears to play a nuanced role in their perceived stress. The observation that stress perceptions differ significantly between low and moderate experience groups but not between moderate and high experience groups indicates that perceived stress may decrease as individuals gain familiarity with tasks and responsibilities. Specifically, the significant difference observed between the low-experience (group 1) and moderate-experience (Group 2) participants may imply that individuals with little experience are more prone to stress due to their unfamiliarity with operational contexts, a finding that aligns with [55]. Conversely, those in the moderate-experience group may have adapted to their roles, leading to more manageable stress levels. The absence of significant differences between the moderate- and high-experience groups suggests that perceived stress levels may plateau after a certain threshold of experience is reached. These patterns are further supported by exploratory results from non-parametric pairwise comparisons, which provide additional descriptive insights. Although the Kruskal–Wallis test did not reveal overall statistical significance, the comparison between group 1 and group 2 yielded a test statistic of −9.846 and a p-value of 0.027 (uncorrected), suggesting a potential difference worth further investigation. However, due to the elevated risk of type I errors in this exploratory setting, these findings should be interpreted cautiously and are not considered confirmatory statistical evidence.
This study supports the role of sympathetic dominance in high-stress conditions, as reflected in elevated LF/HF values across segments 1, 2, and 5 (Figure 8). These findings reinforce the physiological plausibility of subjective stress assessments in simulator environments. Building on this, regression analyses were conducted to explore how physiological variables predict subjective workload dimensions. The results highlight the protective role of age and the strong influence of ANS markers, such as LFHF2 and MRR2, in stress perception. The results suggest that physiological indicators may play a more dominant role in stress modulation than subjective cognitive demands. Future research should explore potential interaction effects, non-linear relationships, and larger sample sizes to enhance the predictive accuracy of physiological stress models.
In addition to the ANOVA and t-test analyses, we conducted multiple linear regression analyses to investigate potential predictors of subjective workloads across different NASA-TLX subdimensions. The results showed that age and the LF/HF ratio in segment 2 significantly predicted the TD scores (p = 0.0327 and p = 0.0123, respectively), indicating that age-related physiological shifts and sympathetic arousal during high-alert crossings may contribute to an increased temporal workload. Moreover, the LF/HF ratio in segment 6 was significantly associated with the OP (p = 0.0285), indicating that elevated sympathetic activity in this segment may contribute to increased performance-related workload. While the model fit was modest (adjusted R2 scores of 0.169 for temporal and 0.143 for performance results), these findings offer additional insight into how physiological signals during specific navigational encounters contribute to subjective workload experiences.
The ordinal regression model yielded interpretable coefficients and passed the proportional odds assumption test. However, due to the limited sample size, uncorrected multiple comparisons, and reliance on segment-level HRV inputs, the robustness of the model’s labeling may be constrained. As such, the model should be considered preliminary, with future validation recommended using larger datasets and external cohorts to ensure its generalizability.
The experience-related variability in stress perceptions further highlights the interplay between personal resilience, stress management strategies, and job demands. While low-experience individuals may struggle more with stress due to a lack of familiarity, those in moderate- or high-experience groups may have already developed the necessary skills and coping mechanisms to handle stressors, making their stress levels more stable over time. Thus, the variability in stress perceptions based on experience highlights the evolving nature of stress responses as individuals gain exposure and mastery within their roles.
Although this study primarily categorized experience by age and years of service, we acknowledge that an individual’s operational competence and stress-coping ability are also shaped by factors such as their rank, vessel type, and propulsion system familiarity. For instance, extensive experience aboard smaller platform supply vessels (PSVs) may not directly translate to effective command performance on large commercial carriers, particularly those transporting passengers or hazardous cargo such as gas. These vessels differ markedly in their maneuverability, propulsion systems, and risk exposure. Although all participants in this study held valid certifications and possessed diverse sea service backgrounds, we did not stratify their experience by vessel class or propulsion system. Future research studies would benefit from incorporating more granular metrics such as the vessel type, engine configuration, and training specialization to better understand how domain-specific experience affects an individual’s cognitive load and physiological stress responses in simulation-based scenarios.
The regression analysis showed no significant prediction of perceived stress based on an individual’s (CoC) status, last rank, last ship type, age, or total seafaring experience. This suggests that within simulated environments, an individual’s hierarchical status and formal qualifications may not meaningfully differentiate their stress perception results. However, the non-parametric analysis using the Kruskal–Wallis test identified a significant difference in NASA-TLX frustration scores between the CoC groups (p = 0.0125). Specifically, the participants holding ANT II licenses exhibited higher frustration levels than those with ANT I, implying that their licensing level may influence their cognitive appraisal of their workload, especially under conditions of task ambiguity or time pressure. No significant differences were observed across the last duty rank or last ship type in any of the subjective workload or physiological stress indicators, indicating that an individual’s prior operational context alone may not account for variability in stress responses during simulation-based tasks.
The MW, which we initially thought would be crucial in the experiment, did not turn out to not have any effect at all on subjective stress, which may have been due to the short time of the experiment. Similarly, the experience of the subject also did not affect their stress, since all of the participants were aware that the closed-environment experiment was not real. The only factor that effected stress across all segments was age, whereby the younger participants had a higher mean RR interval (which translates to higher stress) than the older participants. This suggests that as an individual’s age increases, there is a notable impact on their HR and HRV. This aligns with the idea that older individuals typically exhibit lower heart rates and less variability, which may explain the significant differences in mean RR intervals across age groups. However, the SDNN and RMSSD results did not show significant differences, possibly due to other factors such as individual health conditions or fitness levels, which can affect these measures.
Although most of the research on marine traffic engineering is focused on artificial intelligence (AI), the results of this research could be of benefit to those developing collision avoidance assistance systems for use by navigators on ships. The simulator used in this study closely reflects real-life navigational conditions but its full potential should be further explored in future research. Several studies that also utilized simulator approaches with the MW and HRV being used in different navigation conditions indicated that varying levels of navigation tasks led to significantly different MW and HRV values. Both the MW and HRV increased as the task difficulty heightened [52]. A model was also developed to recognized the navigator’s workload using a support vector machine. This approach showed that the changes in various eye movement features varied across different workload levels, and it proved to be a high-accuracy model; the same tasks were also conducted in a simulator [56]. Biosignals were also utilized to assess maritime students’ stress levels, suggesting that training scenarios can be categorized based on stress levels, which were associated with factors such as reduced visibility, equipment malfunctions, and extreme weather conditions. Furthermore, the study showed that elevated stress levels can impair performance in maritime navigation and affect the reliability of sailing routes. These findings offer actionable insights to improve the quality and effectiveness of maritime training programs, ultimately enhancing the navigational safety at sea [57]. While this study did not employ AI directly, its findings on the encounter geometry and stress responses can inform future AI-based navigator support systems, particularly in adaptive risk-aware training protocols and collision avoidance tools.
Although the spatial distance to nearby ships in close-quarter encounters was not directly analyzed, segment 2 emerged as the most stress-inducing scenario based on statistical findings for both the PSS scores and LF/HF ratio. This segment typically involved the individual’s own ship facing incoming vessels from both the 135° port and starboard bearings, creating a perceptual burden due to increased peripheral awareness demands. Observationally, many of the 24 participants frequently noted simultaneous ship movements on both sides while also maintaining attention toward the fairway ahead. This aligns with the PARK model of navigational risk, which incorporates both internal and external elements. One of the external risk indicators is the crossing factor, including angles of 45°, 90°, and 135°. Notably, the highest coefficient in the model corresponds to the 135° crossing angle, supporting our empirical findings. This is further corroborated by Kim (2020) [58], who reported that the perceived collision risk was significantly higher in 90° crossing situations, reinforcing the importance of the encounter geometry in risk perception.
The alignment between the subjective (PSS, NASA-TLX) and physiological (HRV) metrics supports the validity of using simulator-based scenarios to assess navigator stress under varied encounter geometries. While AI-based risk assessment remains the future research direction, this study offers foundational insights into the human factors that should inform such development.
6. Conclusions

This research study provides valuable insights into how physiological responses interact with psychological factors during encounter situations among ships whenever approaching into a harbor. The results show that maintaining low perceived stress for the navigator is important when considering the consequences of the task at hand and also their well-being and performance under stress. The main findings can be summarized as follows.
  • The findings of this study for MRR2 and LF/HF2 (segment 2) show a strong positive relationship with the perceived stress of the navigator, which also justifies the use of the PARK model approach for the crossing factor coefficients in the external elements of the model, where the target vessel comes across from the 135 degree direction of the individual’s ship heading as the highest coefficient.
  • In this experiment, the navigators’ ages were grouped as young (below 34 years old) and old (above 34 years old), where the younger age group influenced MRR values in all segments but did not have a significant impact on the SDNN and RMSSD across all segments.
  • None of the MW dimensions according to the NASA-TLX had any significance relation with perceived stress across all given segments and scenarios.
Based on the findings, we recommend that intelligent simulator-based training programs incorporate stress-triggering encounter scenarios, particularly those involving 135° crossing angles, to better prepare navigators for high-stress conditions. The use of physiological monitoring tools, such as HRV sensors, should be integrated to provide real-time biofeedback that supports personalized stress awareness and coping skill development. Training efforts should also be differentiated by age and experience, offering targeted support for younger or less experienced navigators. Furthermore, the simulator environments should embed dynamic tasks with complexity and ambiguity, as stress perception is influenced more by cognitive uncertainty than by formal rank or certification.

Author Contributions

Conceptualization, J.R.K.B., Y.P. and D.K.; methodology, J.R.K.B. and D.K.; validation, Y.P. and D.K.; writing—original draft preparation, J.R.K.B.; writing—review and editing, D.K., Y.P. and J.R.K.B.; visualization, J.R.K.B. and D.K.; supervision, D.K. All authors have read and agreed to the published version of the manuscript.

Funding

This research was part of a project titled “Development of Smart Port-Autonomous Ships Linkage Technology”, funded by the Ministry of Oceans and Fisheries, Korea. (Grant no.:1525014323).

Institutional Review Board Statement

All subjects gave their informed consent for inclusion before they participated in the study. The study was conducted in accordance with the Declaration of Helsinki, and the protocol was approved by the Ethics Committee of Barombong Maritime Polytechnic on 2 January 2024, under Project Number 6 of SK POLTEKPEL.B 31 TAHUN 2024.

Informed Consent Statement

Informed consent was obtained from all subjects involved in the study.

Data Availability Statement

The data presented in this study are available on request from the corresponding author. The data are not publicly available due to privacy concerns.

Acknowledgments

This work was conducted as part of the project titled Development of Smart Ports—Autonomous Ships Linkage Technology, supported by the Ministry of Oceans and Fisheries, Korea. This article also forms part of the author’s doctoral dissertation submitted to Korea Maritime and Ocean University, and has been further developed to advance research on maritime safety and risk analyses. The authors would like to thank all participants, colleagues, and supporting staff who contributed to the data collection, simulation sessions, and technical assistance in this study. Their valuable time and expertise made this research possible.

Conflicts of Interest

The authors declare no conflicts of interest.

References

  1. Ministry of Transport, Republic of Indonesia. 2024. Available online: https://www.dephub.go.id/post/read/upaya-kemenhub-penuhi-standarisasi-sdm-kepelautan-untuk-berkiprah-secara-global (accessed on 22 January 2025).
  2. Sumarta, R.P.; Widarbowo, D.; Haryanto, D.; Kendek, M.; Adiputra, I.K.H.P. Meningkatkan pengetahuan navigasi kapal dengan bridge simulator. J. Inov. Hasil Peng. Masy. 2024, 7, 271–282. [Google Scholar] [CrossRef]
  3. Bokau, J.R.K.; Samad, R.; Park, Y.; Kim, D. From managing risk to reality: A case of maritime safety in Makassar Port, Indonesia using FRAM and AIS data analysis. Ocean Eng. 2025, 339, 122012. [Google Scholar] [CrossRef]
  4. Žagar, D.; Svetina, M.; Košir, A.; Dimc, F. Human factor in navigation: Overview of cognitive load measurement during simulated navigational tasks. J. Mar. Sci. Eng. 2020, 8, 775. [Google Scholar] [CrossRef]
  5. Hontvedt, M.; Øvergård, K. Simulations at work—A framework for configuring simulation fidelity with training objectives. Comput. Support. Coop. Work 2019, 29, 85–113. [Google Scholar] [CrossRef]
  6. Murai, K.; Hayashi, Y.; Okazaki, T.; Stone, L.C.; Mitomo, N.N. Evaluation of ship navigator’s mental workload using nasal temperature and heart rate variability. In Proceedings of the 2008 IEEE International Conference on Systems, Man and Cybernetics, Singapore, 12–15 October 2008; pp. 1528–1533. [Google Scholar] [CrossRef]
  7. Sheridan, T.B. Risk, human error, and system resilience: Fundamental ideas. J. Hum. Fac. Ergon. Soc. 2008, 50, 418–426. [Google Scholar] [CrossRef]
  8. Kaber, D.B.; Endsley, M.R. Out-of-the-Loop performance problems and the use of intermediate levels of automation for improved control system functioning and safety. Process Saf. Prog. 1997, 16, 126–131. [Google Scholar] [CrossRef]
  9. Sharpe, B.T.; Tyndall, I. The sustained attention paradox: A critical commentary on the theoretical impossibility of perfect vigilance. Cogn. Sci. 2025, 49, e70061. [Google Scholar] [CrossRef]
  10. Hetherington, C.; Flin, R.; Mearns, K. Safety in shipping: The human element. J. Saf. Res. 2006, 37, 401–411. [Google Scholar] [CrossRef]
  11. Aylward, K.; Weber, R.; Lundh, M.; MacKinnon, S.N.; Dahlman, J. Navigators’ views of a collision avoidance decision support system for maritime navigation. J. Navig. 2022, 75, 1035–1048. [Google Scholar] [CrossRef]
  12. Coraddu, A.; Oneto, L.; De Maya, B.N.; Kurt, R. Determining the most influential human factors in maritime accidents: A data-driven approach. Ocean Eng. 2020, 211, 107588. [Google Scholar] [CrossRef]
  13. Komite Nasional Keselamatan Transportasi (KNKT). Buku Statistik Investigasi Kecelakaan Transportasi. 2022. Available online: https://knkt.go.id/news/read/buku-statistik-investigasi-kecelakaan-transportasi-tahun-2022 (accessed on 24 October 2023).
  14. Komite Nasional Keselamatan Transportasi (KNKT). Laporan Stat Investigasi Kecelakaan Transportasi Tahun. 2023. Available online: https://knkt.go.id/news/read/laporan-statistik-investigasi-kecelakaan-transportasi-2023-semester-i (accessed on 24 October 2023).
  15. Saputra, A.D. Studi Kecelakaan Kapal di Indonesia Dari Tahun 2003–2019 Berdasarkan Data Investigasi Komite Nasional Keselamatan Transportasi. War. Penelit. Perhub. 2021, 33, 87–94. [Google Scholar] [CrossRef]
  16. Nathanael, I. Optimasi Penentuan Pengawakan Kapal Niaga Berdasarkan Konsep Maritime Labour Convention (Mlc) 2006 Untuk Menunjang Pertumbuhan Ekonomi Indonesia Pada Poros Maritim Menghadapi Era Asean Economic Community (Aec) 2015. Bachelor’s Thesis, Institut Teknologi Sepuluh Nopember, Surabaya, Indonesia, 2016. Available online: https://repository.its.ac.id/48771/1/4211100102-Undergraduate%20Thesis.pdf (accessed on 24 October 2024).
  17. Yulius, I.T.; Lubis, S.R.H. Faktor-Faktor Determinan Stres Kerja Pada Pekerja (ABK) Kapal Pengangkut LNG di PT. X. Environ. Occup. Health Saf. J. 2021, 1, 169–190. [Google Scholar] [CrossRef]
  18. Rengamani, J.; Murugan, M.S. A Study on the Factors Influencing the Seafarers’ Stress. ResearchGate. 2021. Available online: https://www.researchgate.net/publication/356786682_A_STUDY_ON_THE_FACTORS_INFLUENCING_THE_SEAFARERS’_STRESS (accessed on 24 October 2024).
  19. Farisyi, S.; Ricardianto, P.; Purnaningratri, I.; Setyawati, A.; Negara, G.; Weda, I.; Widyaningrum, N.; Sudewo, G.; Saputra, C.; Endri, E. Seafarer work stress and performance: Empirical evidence of shipping safety of Indonesia national shipping companies. Uncert. Supply Chain Manag. 2024, 12, 1297–1306. [Google Scholar] [CrossRef]
  20. Makara-Studzińska, M.; Załuski, M.; Jagielski, P.; Wójcik-Małek, D.; Szelepajło, M. An exploration of perceived stress, burnout syndrome, and self-efficacy in a group of Polish Air Traffic Controllers and maritime navigators: Similarities and differences. Int. J. Environ. Res. Public Health 2021, 18, 53. [Google Scholar] [CrossRef] [PubMed]
  21. Doyle, N.; MacLachlan, M.; Fraser, A.; Stilz, R.; Lismont, K.; Cox, H.; McVeigh, J. Resilience and well-being amongst seafarers: Cross-sectional study of crew across 51 ships. Int. Arch. Occup. Environ. Health 2015, 89, 199–209. [Google Scholar] [CrossRef]
  22. McVeigh, J.; MacLachlan, M.; Vallières, F.; Hyland, P.; Stilz, R.; Cox, H.; Fraser, A. Identifying predictors of stress and job satisfaction in a sample of merchant seafarers using structural equation modeling. Front. Psychol. 2019, 10, 70. [Google Scholar] [CrossRef]
  23. Peplińska, A.; Jeżewska, M.; Leszczyńska, I.; Połomski, P. Stress and the level of perceived anxiety among mariners: The mediating role of marital satisfaction. Int. Marit. Health 2013, 64, 221–225. [Google Scholar] [CrossRef]
  24. Hogg, T.; Ghosh, S. Autonomous merchant vessels: Examination of factors that impact the effective implementation of unmanned ships. Aus. J. Mar. Ocean Aff. 2016, 8, 206–222. [Google Scholar] [CrossRef]
  25. Arenius, M.; Athanassiou, G.; Sträter, O. Systemic assessment of the effect of mental stress and strain on performance in a maritime ship-handling simulator. IFAC Proc. 2010, 43, 43–46. [Google Scholar] [CrossRef]
  26. Wong, J.T.; Huang, S. Modeling Driver Mental Workload for Accident Causation and Prevention. J. Eastern Asia Soc. Trans. St. 2010, 8, 1918–1933. [Google Scholar]
  27. Johannsen, G. Workload and Workload Measurement. In Mental Workload: Its Theory and Measurement; Moray, N., Ed.; NATO Conference Series; Springer: Boston, MA, USA, 1979; pp. 3–11. ISBN 978-1-4757-0884-4. [Google Scholar]
  28. International Maritime Organization (IMO). MSC.1/Circ.1598. 2019. Available online: https://www.imo.org/en/OurWork/HumanElement/Pages/Fatigue.aspx (accessed on 24 October 2024).
  29. Yoshida, M.; Shimizu, E.; Sugomori, M.; Umeda, A. Identification of the Relationship between Maritime Autonomous Surface Ships and the Operator’s Mental Workload. Appl. Sci. 2021, 11, 2331. [Google Scholar] [CrossRef]
  30. Cohen, S.; Kamarck, T.; Mermelstein, R. A global measure of perceived stress. J. Health Soc. Behav. 1983, 24, 385. [Google Scholar] [CrossRef] [PubMed]
  31. Klein, E.M.; Brähler, E.; Dreier, M.; Reinecke, L.; Müller, K.W.; Schmutzer, G.; Wölfling, K.; Beutel, M.E. The German version of the Perceived Stress Scale—Psychometric characteristics in a representative German community sample. BMC Psychiatry 2016, 16, 159. [Google Scholar] [CrossRef]
  32. Kim, H.G.; Cheon, E.J.; Bai, D.S.; Lee, Y.H.; Koo, B.H. Stress and Heart Rate Variability: A Meta-Analysis and Review of the Literature. Psychiatry Investig. 2018, 15, 235–245. [Google Scholar] [CrossRef]
  33. Koskinen, T.; Kähönen, M.; Jula, A.; Laitinen, T.; Keltikangas-Järvinen, L.; Viikari, J.; Välimäki, I.; Raitakari, O.T. Short-term heart rate variability in healthy young adults: The Cardiovascular Risk in Young Finns Study. Auton. Neurosci. Basic Clin. 2009, 145, 81–88. [Google Scholar] [CrossRef]
  34. Nunan, D.; Sandercock, G.R.; Brodie, D.A. A Quantitative Systematic Review of Normal Values for Short-Term Heart Rate Variability in Healthy Adults. Pacing Clin. Electrophys. PACE 2010, 33, 1407–1417. [Google Scholar] [CrossRef] [PubMed]
  35. Berntson, G.G.; Bigger, J.T.; Eckberg, D.L., Jr.; Grossman, P.; Kaufmann, P.G.; Malik, M.; Nagaraja, H.N.; Porges, S.W.; Saul, J.P.; Stone, P.H.; et al. Heart rate variability: Origins, methods, and interpretive caveats. Psychophysiology 1997, 34, 623–648. [Google Scholar] [CrossRef]
  36. da Silva, A.G.C.B.; Araujo, D.N.; Costa, A.C.M.; Dias Ba, L.; De Freitas Fregonezi, G.A.; Dias Fa, L. Increase in perceived stress is correlated to lower heart rate variability in healthy young subjects. Acta Sci. Health Sci. 2015, 37, 7. [Google Scholar] [CrossRef]
  37. Borchini, R.; Veronesi, G.; Bonzini, M.; Gianfagna, F.; Dashi, O.; Ferrario, M. Heart Rate Variability Frequency Domain Alterations among Healthy Nurses Exposed to Prolonged Work Stress. Int. J. Environ. Res. Public Health 2018, 15, 113. [Google Scholar] [CrossRef]
  38. Ngodang, T.; Murai, K.; Hayashi, Y.; Mitomo, N.; Yoshimura, K.; Hikida, K. A Study on Navigator’s Performance in Ship Bridge Simulator Using Heart Rate Variability. In Proceedings of the 2012 IEEE International Conference on Systems, Man and Cybernetics, Seoul, Republic of Korea, 14–17 October 2012; pp. 1520–1524. [Google Scholar] [CrossRef]
  39. Hart, S.G.; Staveland, L.E. Development of NASA-TLX (Task Load Index): Results of empirical and theoretical research. Adv. Psychol. 1988, 52, 139–183. [Google Scholar] [CrossRef]
  40. Wilson, M.; Poolton, J.; Malhotra, N.; Ngo, K.; Bright, E.; Masters, R. Development and validation of a surgical workload measure: The surgery task load index (Surg-TLX). World J. Surg. 2011, 35, 1961–1969. [Google Scholar] [CrossRef] [PubMed]
  41. Favre-Félix, J.; Dziadzko, M.; Bauer, C. High-Fidelity Simulation to Assess Task Load Index and Performance: A Prospective Observational Study. Turk. J. Anaesthesiol. Reanim. 2022, 50, 282–287. [Google Scholar] [CrossRef] [PubMed]
  42. Mohamed, R.; Raman, M.; Anderson, J.; McLaughlin, K.; Rostom, A.; Coderre, S. Validation of the national aeronautics and space administration task load index as a tool to evaluate-the learning curve for endoscopy training. Can. J. Gastroenterol. Hepatol. 2014, 28, 155–160. [Google Scholar] [CrossRef]
  43. Sun, J.; Cheng, S.; Ma, J.; Xiong, K.; Su, M.; Hu, W. Assessment of the static upright balance index and brain blood oxygen levels as parameters to evaluate pilot workload. PLoS ONE 2019, 14, e0214277. [Google Scholar] [CrossRef]
  44. Dominguez-Péry, C.; Vuddaraju, L.N.R.; Corbett-Etchevers, I.; Tassabehji, R. Reducing maritime accidents in ships by tackling human error: A bibliometric review and research agenda. J. Shipp. Trade 2021, 6, 20. [Google Scholar] [CrossRef]
  45. Ayres, P.; Lee, J.Y.; Paas, F.; van Merriënboer, J.J.G. The validity of physiological measures to identify differences in intrinsic cognitive load. Front. Psychol. 2021, 12, 702538. [Google Scholar] [CrossRef]
  46. Park, Y.S.; Park, J.; Shin, D.; Lee, M.; Park, S. Application of Potential Assessment of Risk (PARK) Model in Korea Waterways. J. Int. Marit. Saf. Environ. Aff. Shipp. 2017, 1, 1–10. [Google Scholar] [CrossRef]
  47. Cohen, S. Perceived stress in a probability sample of the United States. In The Social Psychology of Health; Sage Publications, Inc.: Thousand Oaks, CA, USA, 1988; pp. 31–67. [Google Scholar]
  48. Lee, E. Review of the psychometric evidence of the perceived stress scale. Asian Nur. Res. 2012, 6, 121–127. [Google Scholar] [CrossRef] [PubMed]
  49. Heart Rate Variability: Standards of measurement, physiological interpretation, and clinical use. Task Force of the European Society of Cardiology and the North American Society of Pacing and Electrophysiology. Eur. Heart J. 1996, 17, 354–381. [CrossRef]
  50. Peabody, J.E.; Ryznar, R.; Ziesmann, M.T.; Gillman, L. A systematic review of heart rate variability as a measure of stress in medical professionals. Cureus 2023, 15, e34345. [Google Scholar] [CrossRef]
  51. Sloan, R.; Shapiro, P.; Bagiella, E.; Boni, S.; Paik, M.; Bigger, J.; Steinman, R.; Gorman, J. Effect of mental stress throughout the day on cardiac autonomic control. Biol. Psycol. 1994, 37, 89–99. [Google Scholar] [CrossRef] [PubMed]
  52. Özsever, B.; Tavacioğlu, L. Measuring mental workload and heart rate variability of officers during different navigation conditions. Marine Sci. Technol. Bull. 2021, 10, 306–312. [Google Scholar] [CrossRef]
  53. Wang, X.; Liu, Z.; Zhao, Z.; Wang, J.; Loughney, S.; Wang, H. Passengers’ likely behaviour based on demographic difference during an emergency evacuation in a Ro-Ro passenger ship. Saf. Sci. 2020, 129, 104803. [Google Scholar] [CrossRef]
  54. Yang, L.; Li, L.; Liu, Q.; Ma, Y.; Liao, J. Influence of physiological, psychological and environmental factors on passenger ship seafarer fatigue in real navigation environment. Saf. Sci. 2023, 168, 106293. [Google Scholar] [CrossRef]
  55. Zadworna, M.; Michalska, P.; Kobylarczyk, M. Stress and coping strategies among participants of stress management interventions at the Science, Technology and Art Festival. Przegląd Badań Eduk. 2020, 1, 129. [Google Scholar] [CrossRef]
  56. Ma, Y.; Liu, Q.; Yang, L.; He, M. Recognition of marine navigators’ workload based on eye movement features using bridge simulation. Saf. Sci. 2024, 178, 106607. [Google Scholar] [CrossRef]
  57. Xue, H.; Haugseggen, Ø.; Røds, J.; Batalden, B.; Prasad, D.K. Assessment of stress levels based on biosignal during the simulator-based maritime navigation training and its impact on sailing route reliability. Transp. Res. Interdisc. Persp. 2024, 24, 101047. [Google Scholar] [CrossRef]
  58. Kim, D. Human factors influencing the ship operator’s perceived risk in the last moment of collision encounter. Reliab. Eng. Syst. Saf. 2020, 203, 107078. [Google Scholar] [CrossRef]
Figure 1. Flowchart of the proposed methodology.
Applsci 15 07630 g001
Figure 2. Example of a ship’s encounters in the study area, labelled as extremely dangerous according to PARK model. Green indicates the individual’s own ship and red indicates the target ship.
Applsci 15 07630 g002
Figure 3. Bridge simulator with the captain in the center, one officer, and one helmsman.
Applsci 15 07630 g003
Figure 4. Design of the scenarios divided into segments, with each participant given the required time in the simulation.
Applsci 15 07630 g004
Figure 5. The sample RR intervals, along with activity windows recorded from a participant during the task, are displayed with each example of activities between segments.
Applsci 15 07630 g005
Figure 6. Boxplots visualizing the relationship between PSS categories and age.
Applsci 15 07630 g006
Figure 7. Spearman correlation heatmap.
Applsci 15 07630 g007
Figure 8. Boxplots visualizing the relationship between PSS categories and physiological responses during simulated navigation scenarios. (Top Left) Mean RR interval for segment 2, where significant ANOVA differences were observed. (Top Center) Overall average of mean RR intervals across all segments. (Top Right) Overall average of LF/HF ratios across all segments. (Bottom) LF/HF ratios for segments 1, 2, and 5, which exhibited significant group differences.
Applsci 15 07630 g008
Figure 9. Boxplot of NASA-TLX frustration scores by CoC group.
Applsci 15 07630 g009
Table 1. Monthly ship traffic in Makassar Port and adjacent waters.
CaseDescriptionSegmentTime Given
1Head-On Situation 000deg110 min
2Crossing 090deg (OS give way)
3Crossing Situation 135deg (S)210 min
4Crossing 135deg (P)
5Overtaking in the bend (red ship was the same ship on case 4)310 min
6Overtaking from 000deg410 min
7Crossing 045 (S)
8Crossing Situation 045deg (P)510 min
9Crossing Situation 090deg (S)
10Surrounding by anchorage ship610 min
11Outbound traffic in the port entrance
Table 2. Ship model and parameters used in the experiment.
No.GroupsDescription
1.Model NameCNTNR27X—container, KMSS UNI-Pacific
2.Length Overall182 m
3.Breadth28 m
4.Draft9 m (loaded condition)
5.Displacement27,670 tonnes
6.Type and Max. Engine Power1 × diesel engine with 14,840 horsepower
7.Rudder Type and Max. AngleBalanced rudder and 35 degrees
8.Crash stop time6 min and 11 s
9.PerformanceShallow water starboard turning,
tactical diameter: 699.5 m; advance: 556.9 m; transfer: 336.3 m
Shallow water portside turning,
tactical diameter: 527.7 m; advance: 555.1 m; transfer: 242.6 m
Table 3. Participant demographics.
No.GroupsDescriptionNPercentage
1.AgeBelow 40 years old1250.0
2.Above 40 years old1250.0
3.ExperienceBelow 5 years312.5
4.5 to 10 years729.2
5.Above 10 years1458.3
6.Mariner’s License or Certificate of Competence (CoC)Master Below 3000 Gross Tonnage (ANT-II) *1458.3
Master—Unlimited (ANT-I)729.2
7.Last Position OnboardMaster1729.2
Chief Officer770.8
8.Ship Type ExperienceContainer312.5
General Cargo729.2
Coastal Tanker520.8
Tanker 520.8
Supply28.3
Tugboat14.2
Passenger Ship14.2
* ANT is a term used in the Indonesian Certification on Seafarers in Nautical Studies, where ANT-I is the highest.
Table 4. Overview of hypothesized relationships between dependent and independent variables used in initial model construction prior to selection. The final model specifications were refined based on statistical significance and fit indices.
No.Dependent VariableTypeIndependent Variable
1.PSSSubjective (self-report)Age, Experience
2.NASA-TLX
3.HRV-SDNNPhysiologicalPSS, Age, Experience
4.HRV-RMSSDPSS, Age, Experience
5.HRV-LF/HF RatioPSS, NASA-TLX, Segment
6.HRV—MRRPSS, Segment
Table 5. Pairwise comparison of the navigators’ experiences and perceived stress levels.
GroupsTest StatisticStd. ErrorStd. Text StatisticSig.Adj. Sig
Low–High−6.5004.711−1.3800.1680.503
Low–Moderate−9.8464.457−2.2090.0270.081
High–Moderate3.3463.1271.0700.2850.854
Each row tests the null hypothesis that the distributions of sample 1 and sample 2 are the same. Asymptotic significance (2-sided tests) is displayed. Presented for descriptive purposes only; significance level is 0.010 but overall the Kruskal–Wallis test was not significant.
Table 6. Statistical results of a one-way ANOVA on mean NASA-TLX scores with each experience group.
GroupsSum of SquaresdfMean SquareFSig.
Between groups37.455218.7270.0090.991
Within groups44,832.655212134.888
Total44,870.1123
Table 7. Statistical results of the t-test on the mean NASA-TLX score with each age group.
VariableMean Group 1Mean Group 2tp-Value
NASA-TLX170.277171.875−0.0860.931
Table 8. Multiple linear regression results predicting NASA-TLX TD scores.
VariableCoefficient (β)Std. Errort-Valuep-Value
Intercept111.681205.7580.5430.5953
Age10.2424.3542.3520.0327 *
Experience2.6153.9960.6540.5228
MRR 2−0.5930.338−1.7560.0994
LFHF 2−28.54410.042−2.8430.0123 *
LFHF 313.0147.3911.7610.0987
LFHF 4−4.10810.532−0.390.702
LFHF 54.5738.0150.5710.5767
LFHF 6−3.6307.701−0.4710.6441
R2 = 0.458, adjusted R2 = 0.169, F (8, 15) = 1.59, p = 0.211, Durbin–Watson = 2.267, * p < 0.05.
Table 9. Multiple linear regression results predicting NASA-TLX OP scores.
VariableCoefficient (β)Std. Errort-Valuep-Value
Intercept275.962307.8290.8960.3842
Age−0.2036.514−0.0310.9755
Experience3.0675.9780.5130.6154
MRR 2−0.1500.505−0.2970.7702
LFHF 225.99115.0231.730.1041
LFHF 3−17.45311.058−1.5780.1354
LFHF 43.86615.7560.2450.8095
LFHF 5−25.01111.992−2.0860.0545
LFHF 627.92211.5212.4240.0285 *
R2 = 0.441, adjusted R2 = 0.143, F (8, 15) = 1.48, p = 0.244, Durbin–Watson = 2.420, * p < 0.05.
Table 10. Spearman correlation coefficients between various factors and perceived stress.
IndicatorPSS Score
Applsci 15 07630 i001PSS1
age−0.2160
exp−0.0663
mrr10.0217
mrr2−0.1131
mrr3−0.1841
mrr4−0.2559
mrr5−0.3132
mrr6−0.2493
sdnn1−0.1975
sdnn2−0.1945
sdnn3−0.2283
sdnn4−0.2212
sdnn5−0.2329
sdnn6−0.2454
rmssd1−0.2682
rmssd2−0.1631
rmssd3−0.2276
rmssd4−0.1615
rmssd5−0.1976
rmssd6−0.1837
lfhf10.2647
lfhf20.432 *
lfhf30.1582
lfhf4−0.0031
lfhf50.1127
lfhf60.2563
Mental−0.0843
Physical−0.0555
Temporal−0.1008
Perf.0.2894
Effort0.1124
Frustration0.0902
* p < 0.05, ** p < 0.01.
Table 11. One-way ANOVA results. Effect of perceived stress on mean RR interval for all segments.
GroupsSum of SquaresdfMean SquareFSig.
Between groups18,973.13629486.5684.1570.030
Within groups47,919.822212281.896
Total66,892.95823
The significance level is 0.05.
Table 12. One-way ANOVA results. Effect of perceived stress on the LF/HF ratio for all segments.
GroupsSum of SquaresdfMean SquareFSig.
Between groups92.080246.0405.1530.015
Within groups187.614218.934
Total279.69423
The significance level is 0.05.
Table 13. Multiple linear regression results predicting the LF/HF ratio for segment 1.
VariableCoefficient (β)Std. Errort-Valuep-Value
Intercept1.1416.0430.1890.85211
Age0.0120.1390.0840.93418
Experience−0.1420.140−1.0140.32285
PSS0.3780.1263.0070.0069 **
R2 = 0.340, adjusted R2 = 0.241, F (3, 20) = 3.43, p = 0.036, Durbin–Watson = 2.551, ** p < 0.01.
Table 14. Multiple linear regression results predicting the LF/HF ratio for segment 2.
VariableCoefficient (β)Std. Errort-Valuep-Value
Intercept−1.4664.630−0.3170.754849
Age0.0370.1060.3510.729462
Experience−0.0870.108−0.8080.428483
PSS0.3750.0963.8940.0009 **
R2 = 0.441, adjusted R2 = 0.357, F (3, 20) = 5.26, p = 0.007, Durbin–Watson = 2.614, ** p < 0.01.
Table 15. Multiple linear regression results predicting the MRR in segment 2.
VariableCoefficient (β)Std. Errort-Valuep-Value
Intercept340.362133.7692.5440.0193 *
Age7.4263.0762.4140.0255 *
Experience1.9563.1070.630.5361
PSS−2.4642.781−0.8860.3861
R2 = 0.334, adjusted R2 = 0.234, F (3, 20) = 3.34, p = 0.077, Durbin–Watson = 2.373, * p < 0.05.
Table 16. Results of the ordinal logistic regression.
VarFactorsCoef.Std. Errorp-ValueOR
YLow Perceived Stress State2.23720.0140.0009.366
Moderate Perceived Stress State3.96641.5600.01152.795
X1Age−0.35180.1590.0270.7034
X2Experiences0.02110.1290.8701.0213
X3MRR20.02800.0100.0061.0284
X4LFHF10.67620.5810.2441.9663
X5LFHF21.13700.5410.0353.1173
X6LFHF3−0.42570.3260.1920.6533
X7LFHF4−0.60410.4120.1430.5466
X8LFHF5−0.41430.5500.4510.6608
X9LFHF60.68360.4010.8891.9811
X10MD−0.00880.0050.1110.9913
X11PD0.00510.0090.5971.0051
X12OP−0.00230.0050.6790.9977
Disclaimer/Publisher’s Note: The statements, opinions and data contained in all publications are solely those of the individual author(s) and contributor(s) and not of MDPI and/or the editor(s). MDPI and/or the editor(s) disclaim responsibility for any injury to people or property resulting from any ideas, methods, instructions or products referred to in the content.