Article

Risk Assessment Model for Railway Track Maintenance Operations Based on Combined Weights and Nonlinear FCE

1
State Key Lab of Advanced Rail Autonomous Operation, Beijing Jiaotong University, Beijing 100044, China
2
School of Traffic and Transportation, Beijing Jiaotong University, Beijing 100044, China
*
Author to whom correspondence should be addressed.
Appl. Sci. 2025, 15(13), 7614; https://doi.org/10.3390/app15137614
Submission received: 27 May 2025 / Revised: 28 June 2025 / Accepted: 30 June 2025 / Published: 7 July 2025

Abstract

Current risk assessment in railway track maintenance operations faces challenges (low spatiotemporal accuracy, limited adaptability to various scenarios, and tendency of linear fuzzy comprehensive evaluation (FCE) methods to underestimate high-risk factors). To address these, this study proposes a novel risk assessment model that integrates subjective–objective weighting techniques with a nonlinear FCE approach. By incorporating spatiotemporal information, the model enables precise localization of risk occurrence in individual maintenance operations. A comprehensive risk index system is constructed across four dimensions: human, equipment, environment, and management. The game theory combined weighting method, integrating the G1 method and entropy weight method, is employed; it balances expert judgment with data-driven analysis. A cloud model is introduced to generate risk membership matrices, accounting for the fuzziness and randomness of risk data. The nonlinear FCE framework enhances the influence of high-risk factors. Risk levels are determined using the combined weights, membership matrices, and the maximum membership principle. A case study on the Lanzhou–Xinjiang Railway demonstrates that the proposed model achieves higher consistency with actual risk conditions than conventional methods, improving assessment accuracy and reliability. This model offers a practical and effective tool for risk prevention and control in railway maintenance operations.

1. Introduction

Railway infrastructure is subject to inevitable natural wear and structural deterioration owing to long-term exposure to train loads. This degradation in performance, along with the frequent occurrence of defects, poses a direct threat to transportation safety. Timely detection and remediation of such defects are critical to ensuring the smooth and safe operation of trains. Track maintenance operations are inherently multidisciplinary, often requiring close coordination among various departments, including mechanical and electrical systems. These operations are highly susceptible to multiple external factors, including meteorological conditions and geological environments [1] which significantly complicate safety risk management. Moreover, characteristics such as technical complexity, limited construction windows, and high-intensity workloads further elevate the likelihood of rule violations and safety incidents [2]. Given these challenges, systematically identifying and analyzing the risk factors associated with track maintenance operations is essential. Developing a comprehensive risk assessment model, one that incorporates spatiotemporal information to accurately determine the time and location of potential risks during individual maintenance activities, is important for improving the safety management capabilities of the industry.
In the field of risk assessment for railway track maintenance and construction, most mainstream studies primarily utilize the analytic hierarchy process (AHP) and the fuzzy comprehensive evaluation (FCE) methods. Representative works include the following: Li [3] systematically identified the risk factors involved in turnout replacement operations and developed a risk assessment model based on the fuzzy AHP. However, this study did not account for the specific spatiotemporal occurrence of risks, resulting in limited accuracy in risk localization. Jiang [4] established a construction safety risk evaluation system for railway engineering mechanical sections, focusing on the operational characteristics of large-scale track maintenance machinery and applying AHP to assess the state of construction safety management. Nevertheless, this study also lacked refinement in the spatiotemporal positioning of risks. Zhang [5] identified risk factors associated with construction and signal coordination maintenance operations on conventional-speed railways using an expert survey method and applied FCE to assess operational risks. However, this study did not clarify the specific timing or spatial coordinates of risk occurrences. Song [6] developed a risk assessment system for large-scale railway marshaling station construction projects and validated it through a case study on a project along the Shanghai–Kunming Line. Nonetheless, the spatial analysis was limited to the overall project level, lacking precise localization of risk occurrence, and the temporal dimension was not addressed. Han [7] identified influencing factors for operations involving large-scale railway track maintenance machinery through a questionnaire survey. The study evaluated a 20 d intensive maintenance period from Chawu to Pinggu on the Datong–Qinhuangdao Line, covering various operations such as turnout replacement, track tamping, and track grinding. However, the study’s consideration of the spatiotemporal dimension was relatively rough, failing to accurately identify the specific line mileage and time of risk occurrences. As a result, it could not clearly distinguish the risk characteristics of different operation types, limiting its effectiveness in supporting a refined evaluation of individual maintenance activities.
From a methodological perspective, researchers in other fields commonly adopt various weighting methods, such as the fuzzy AHP [8], G1 method [9], and entropy weight method (EWM) [10], to achieve an optimized integration of subjective and objective weights. For example, Peng and Zhang [10] used AHP and EWM to calculate the subjective and objective weights of risk indices. They then applied a game theory-based combined weighting approach and used index-weight weighting to assess urban disaster risks. Sun et al. [11] used FAHP and EWM to calculate subjective and objective weights, adopted the minimum standard deviation method to determine optimal combination coefficients, and performed an urban flood risk assessment using the resulting integrated weights. Liu et al. [12] proposed a comprehensive weighting algorithm that integrates AHP, the maximum absolute weighted residual method, and the maximum entropy method to evaluate risks associated with three typical signaling devices in railway systems. Song et al. [13] used AHP to calculate subjective weights without incorporating objective weighting. Guo et al. [14] used AHP, EWM, and the game theory combined weighting method (GTCWM) to calculate subjective, objective, and combined weights. Both studies [13,14] recognized the importance of accounting for the prominent influence of high-risk indices. However, when using AHP for subjective weighting, a consistency test is required, which adds complexity to the calculation process. Despite these limitations, the methodological innovations in these studies, particularly in weight optimization and the treatment of high-risk factors, offer valuable references for developing risk assessment models tailored to railway track maintenance operations.
Current research on risk assessment for railway track maintenance operations faces three major challenges: (1) insufficient spatiotemporal precision, which makes it difficult to accurately identify the spatial location and temporal point of risk occurrences, thereby reducing the effectiveness and timeliness of early warning systems; (2) limited scenario coverage in evaluation frameworks—most existing studies focus on a single type of maintenance operation—result in poor generalizability across diverse operational contexts; and (3) inadequate assessment methodologies: conventional AHP approaches rely heavily on subjective judgment and require complex consistency checks, while FCE methods using linear weighting often underestimate the influence of high-risk factors.
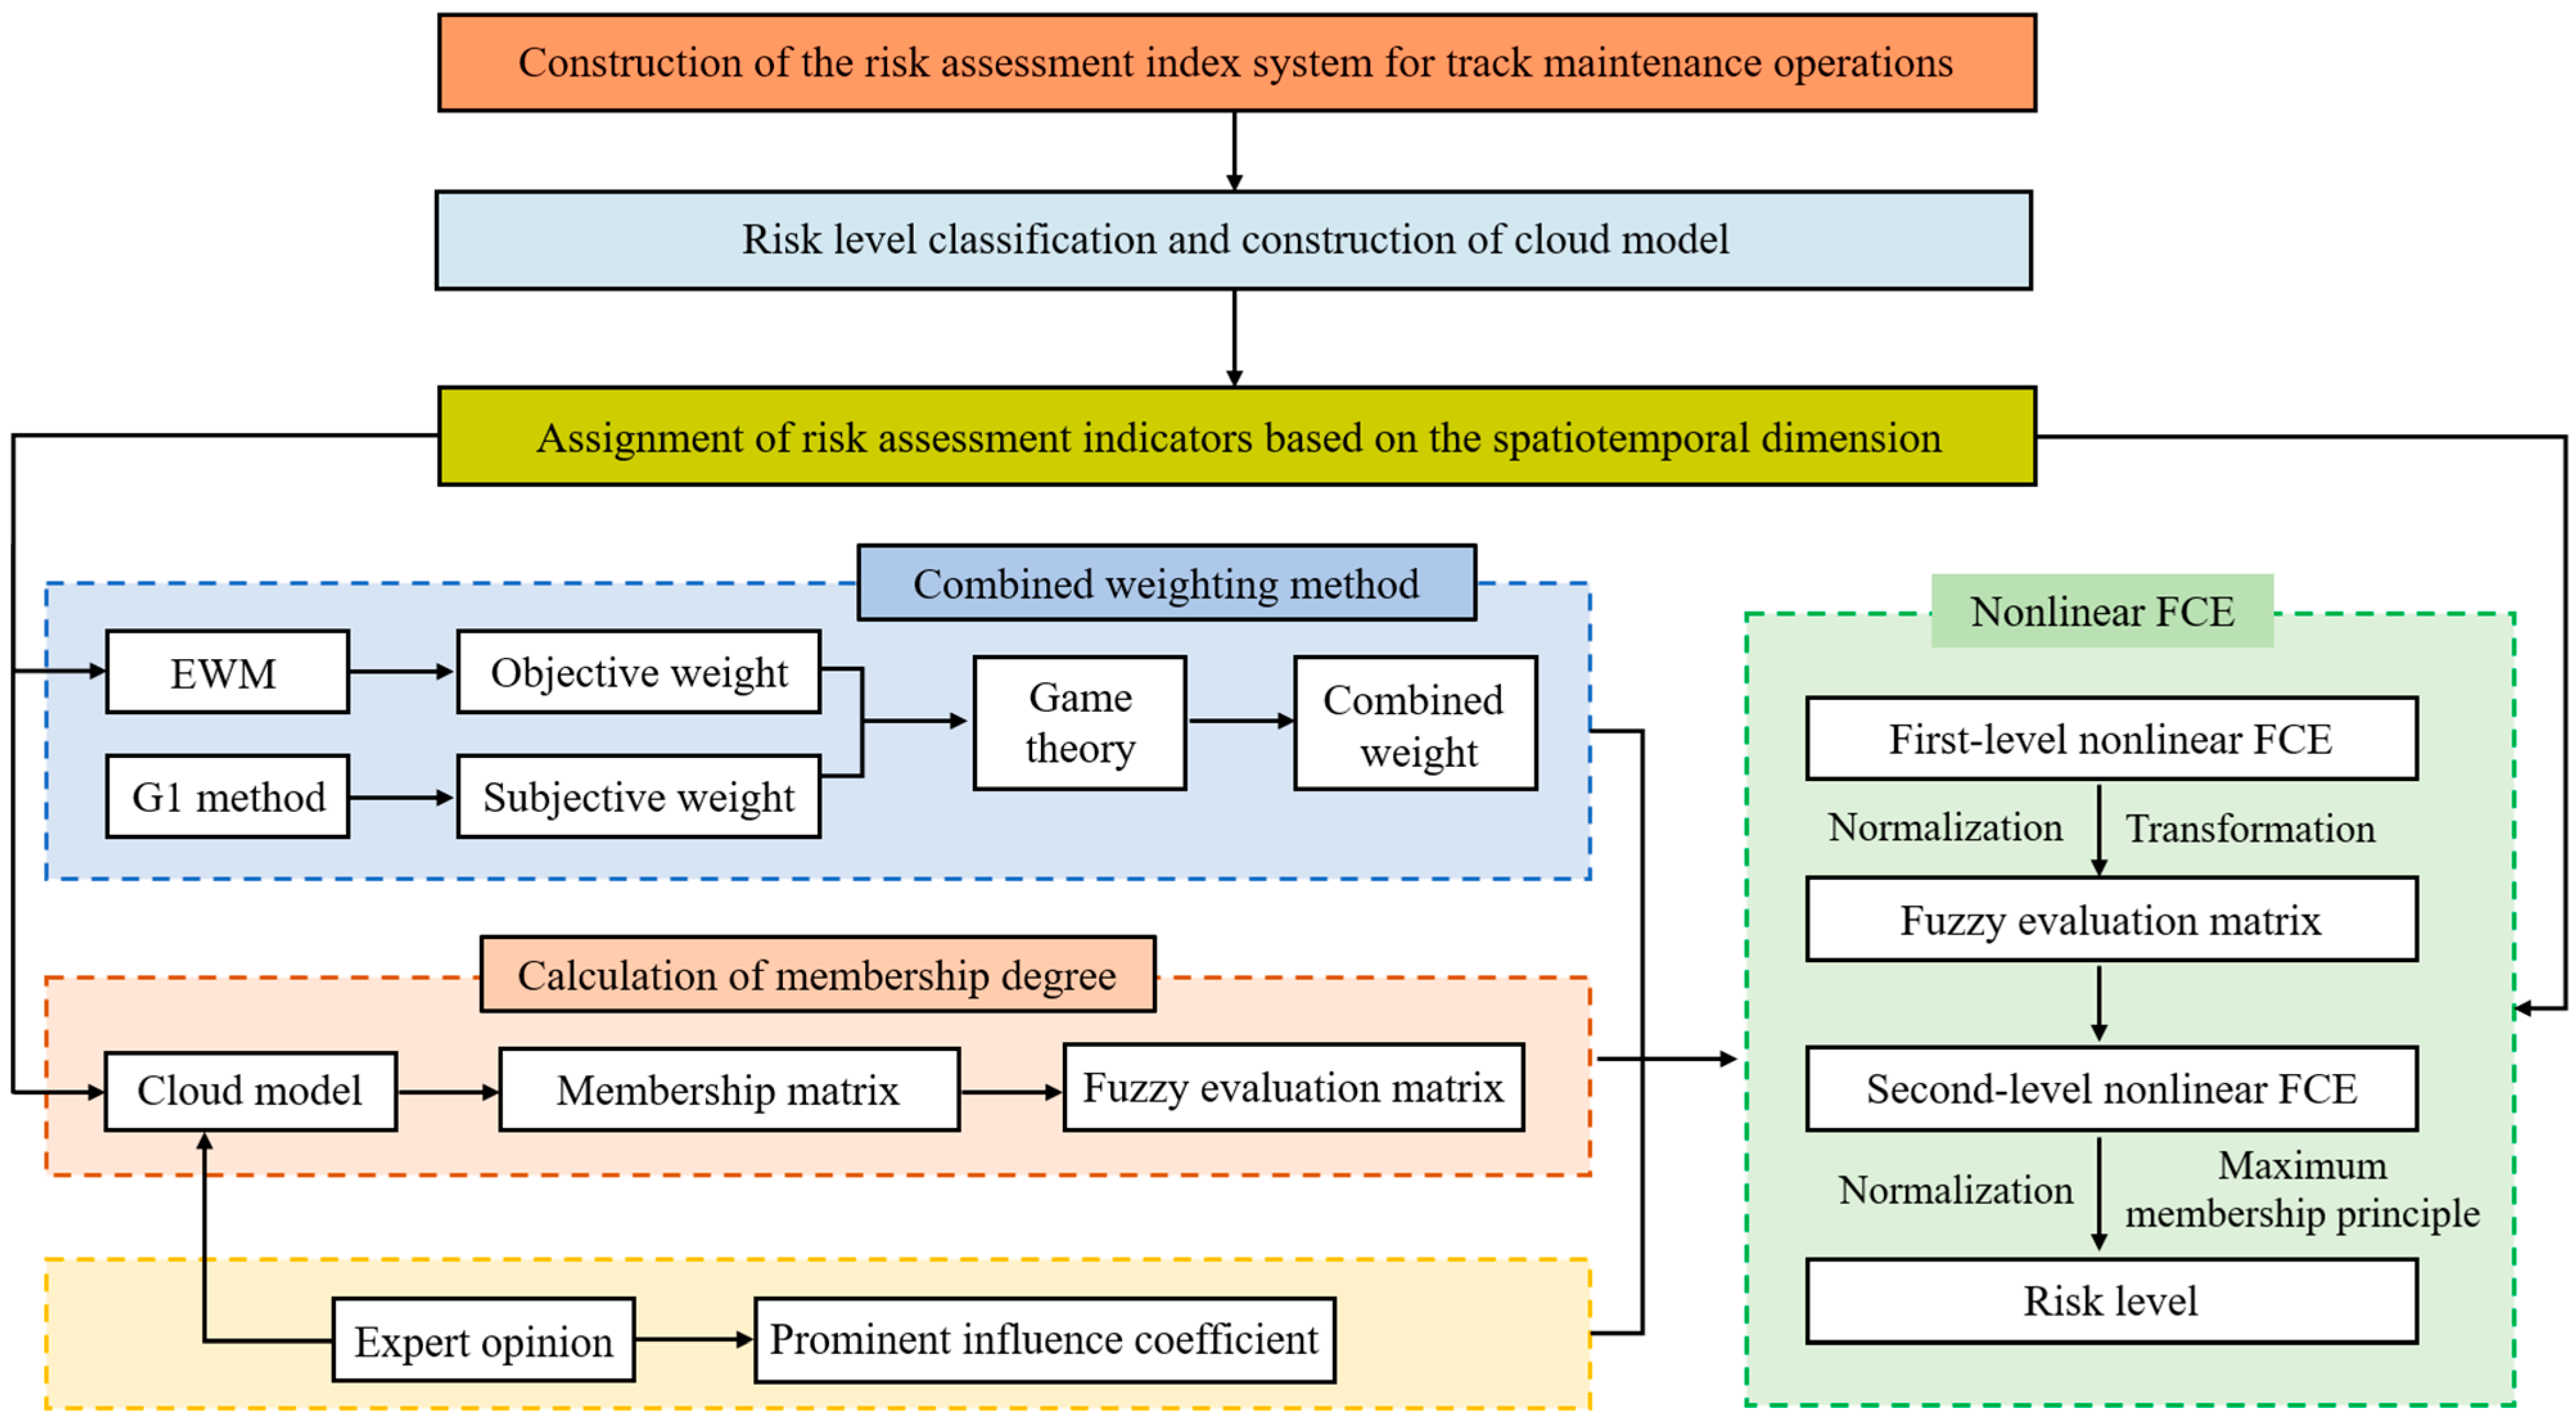
To address these challenges, this study proposes improvements in three key areas: (1) integration of spatiotemporal information—by embedding spatiotemporal data into the assessment process, a refined risk assessment model is developed that enables precise identification of both the location and timing of risk occurrences; (2) development of a cross-scenario risk index system—a comprehensive index system is constructed to enhance the model’s applicability across various maintenance scenarios, improving its versatility; and (3) implementation of a nonlinear FCE model with integrated weighting—a nonlinear FCE approach is proposed that combines subjective and objective weighting methods. Specifically, the G1 method and EWM are used in conjunction with a nonlinear weighting operator to enhance the model’s sensitivity and accuracy in evaluating high-risk factors.
The structure of the remainder of this paper is as follows: Section 2 presents the core methodologies and theoretical foundations underlying the research. Section 3 details the construction process of the proposed risk assessment model for track maintenance operations. Section 4 applies the model to a case study involving track maintenance operations on the Lanzhou–Xinjiang Railway to verify its practical effectiveness. Section 5 discusses the model’s accuracy, advantages, and limitations and proposes corresponding countermeasures. Section 6 provides a comprehensive summary of the research findings.

2. Methodology

2.1. G1 Method

The G1 method [9,15] is a subjective weighting technique that serves as an improvement over the AHP. Unlike AHP, it does not require the construction of a judgment matrix, which simplifies the computation and allows for consistency testing. The G1 method involves experts ranking evaluation indices based on their subjective judgment and quantifying the relative importance between adjacent indices to derive the weights.
The process begins by determining the order of importance among the evaluation indices. Experts select the most important index from the entire set { E 1 , E 2 , , E n } according to the evaluation criteria and denote it as E 1 . Next, the most important index among the remaining n 1 indices are selected and denoted as E 2 , and the process continues until all indices are ordered. This results in an importance sequence of evaluation indices E 1 , E 2 , , E n with respect to the evaluation objective, which is formed as E 1 > E 2 > > E n . Subsequently, the importance between each pair of adjacent indices in the sequence is quantified. This step forms the basis for calculating the subjective weights.
Second, the relative importance of adjacent indices must be quantified. Suppose the expert-assigned importance ratio of evaluation index E i 1 to E i is denoted as γ i , where the value of γ i can be selected based on standard reference scales [15,16]. The weights of the evaluation indices can then be calculated using the following equations:
w n = ( 1 + i = 2 n j = i n γ j ) 1 ,
w i 1 = γ i w i i = n , n 1 , , 2 .

2.2. Entropy Weight Method

EWM [10,11] is an objective weighting technique that measures the amount of information contained in each evaluation index by calculating its information entropy. It adjusts the weights based on the variability among data points, thereby minimizing the influence of subjective human judgment and improving the objectivity of the evaluation. The steps for calculating the EWM are as follows:
(1)
Original matrix construction: Suppose there are m data samples and n evaluation indices. The original data matrix X = ( x i j ) m × n is constructed, where X = ( x i j ) m × n represents the value of the j t h index for the i t h sample.
(2)
The original matrix is normalized to eliminate the effects of differing units and scales. For details on the normalization process, refer to Ref. [17]. The resulting normalized decision matrix is denoted as P = ( p i j ) m × n , and is computed using Equation (3):
p i j = x i j / i = 1 m x i j .
(3)
Calculate the information entropy e j and entropy weight w j of the j -th evaluation index, as shown in Equations (4) and (5), respectively:
e j = 1 ln m i = 1 m ( p i j ln p i j ) ,
w j = 1 e j j = 1 m ( 1 e j ) .

2.3. Game Theory Combined Weighting Method

GTCWM aims to determine the optimal combination of weights derived from multiple methods by minimizing the deviation between the combined weight and each individual weight vector [18]. By integrating the advantages of both subjective and objective weighting approaches, GTCWM effectively mitigates the bias that may arise from relying on a single method, thereby enhancing the objectivity and scientific rigor of the final weight allocation [10]. The specific steps of the GTCWM are as follows:
(1)
Linear combination of weights:
Linearly combine the weight vectors η = ( η 1 , η 2 , , η n ) and θ = ( θ 1 , θ 2 , , θ n ) obtained from the G1 method and EWM, respectively. Let the resulting combined weight vector be δ , as shown in Equation (6), where β 1 and β 2 represent the weighting coefficients for the subjective and objective methods, respectively.
δ = β 1 η + β 2 θ .
(2)
Construct the objective function:
The goal is to minimize the deviation among δ , η , and θ . Using the linear combination coefficients β 1 and β 2 from Equation (6), the optimal weight δ is obtained. The objective function is formulated as follows:
min δ η 2 min δ θ 2 .
(3)
Solve the subjective and objective weight coefficients β 1 and β 2 . According to the differential properties of matrices and the first-order optimality conditions derived from the objective function in Equation (7), the problem can be transformed into the following system of linear equations:
η η T η θ T θ η T θ θ T β 1 β 2 = η η T θ θ T .
By solving Equation (8), β 1 and β 2 are obtained. ξ 1 and ξ 2 are the normalized values of β 1 and β 2 . Finally, the combined weight is shown in Equation (9):
δ = ξ 1 η + ξ 2 θ .

2.4. Cloud Model

The cloud model [19] is a mathematical tool that captures the uncertainties inherent in natural language by accounting for both the fuzziness and randomness of qualitative concepts. It facilitates the bidirectional transformation between qualitative concepts and quantitative data. The model is defined by three numerical characteristics: expected value E x , entropy E n , and hyper-entropy H e . E x represents the central value of the qualitative concept; E n reflects the degree of fuzziness and randomness, indicating the concept’s coverage range and uncertainty; and H e denotes the uncertainty of the entropy. In this study, a double-constraint interval [ x min , x max ] is used to define the risk-level boundaries for each evaluation index. The numerical characteristics are calculated using the formulas provided in Equation (10). The value of H e typically maintains a linear relationship with E n (i.e., H e = k × E n , for more details, see Ref. [20]). In this study, k = 0.1 and the value of k is adjusted according to the evaluation object [14,21]. The membership degree of the value x to a given cloud model ( E x , E n , H e ) is calculated using Equation (11), where E n is treated as a random number with an expected value of E n and standard deviation of H e :
E x = ( x max + x min ) / 2 E n = ( x max x min ) / 6 H e = E n / 10 ,
μ ( x ) = e ( x E x ) 2 2 ( E n ) 2 .

2.5. Nonlinear FCE

When using a linear FCE method, simply increasing the weight of an index may not adequately reflect its true influence on the overall evaluation result. For example, when a certain index value of the evaluation object is very high while other index values are relatively low, in the actual situation, it can be considered excellent or poor. However, after applying the weighted average method, due to the insufficient influence of the weight, the prominent influence of this index cannot be reflected, which may lead to the overall evaluation result being inconsistent with the actual situation [22,23]. By contrast, a nonlinear FCE approach can address this limitation. It treats the linear weighted operator as a special case within a broader nonlinear framework. The nonlinear fuzzy matrix synthesis operator is presented in Equation (12):
f ( α 1 , α 2 , , α n ; s 1 , s 2 , , s n ; Γ ) = ( α 1 s 1 λ 1 + α 2 s 2 λ 2 + + α n s n λ n ) 1 λ ,
where α i is the weight of the i -th evaluation index; s i is the value of the i -th column in the fuzzy evaluation matrix; λ i is the prominent influence coefficient, which reflects the significance degree of the index on the result; and λ i 1 . The larger the value of λ i , the greater the prominent influence degree of the evaluation index on the result. Γ = [ λ 1 , λ 2 , , λ n ] is the prominent influence coefficient vector of the evaluation index, λ = max ( λ 1 , λ 2 , , λ n ) , and Table 1 presents the value standard of the prominent influence coefficient [23].

3. Risk Assessment Model for Track Maintenance Operations

3.1. Risk Assessment Process

In this study, a risk assessment model for railway track maintenance operations is developed based on a combined weighting method and nonlinear FCE, incorporating spatiotemporal information related to the operations. The specific workflow is illustrated in Figure 1.
First, based on a systematic review of industry standards, academic literature, and practical railway maintenance requirements, a risk assessment index system is constructed from four dimensions: human, equipment, environment, and management. Next, a cloud model is established using standard risk classification levels to represent the fuzziness and randomness of risk indices. In the weighting phase, the G1 method is used to calculate the subjective weights, while the EWM determines objective weights. These are then integrated using the GTCWM to generate a more scientific and balanced combined weight. Finally, the nonlinear FCE method is applied. A two-level hierarchical evaluation is performed from the bottom layer to the top, and the principle of maximum membership is used to determine the overall risk level of the track maintenance operation.

3.2. Construction of the Risk Assessment Index System

In this study, the risk factors associated with railway track maintenance operations were systematically identified based on the “Detailed implementation rules for construction management on operational railway lines of Lanzhou Bureau Group Co., Ltd.” (Lan Tie Construction (2024) No. 70, hereinafter referred to as “Document No. 70”), the “Classification and code for the hazardous and harmful factors in process” (GB/T 13861-2022) [24], the “Implementation opinions on safety risk management in the railway maintenance system” [25], as well as relevant national standards and expert experience. The influencing factors were categorized into four dimensions: human, equipment, environment, and management. These were further structured into a two-level index system: the first-level index, denoted as B = { B 1 , B 2 , B 3 , B 4 } , corresponds to the four main categories. Each first-level index is further divided into n i second-level indices, denoted as B i j ( i = 1 , 2 , 3 , 4 , j = 1 , 2 , , n i ), collectively forming the complete second-level index system B = { B i 1 , B i 2 , , B i n i } . The development of this index system was informed by previous studies [3,4,5,6,7,24]. The final risk assessment index system for railway track maintenance operations is shown in Figure 2.
(1)
Human Factors B 1
Personnel involved in track maintenance operations occupy critical roles, including operating staff, and protective personnel [3]. The degree to which the operating personnel adhere to standardized procedures directly influences the quality of the maintenance work performed [5]. Failure to meet the required construction standards can lead to severe consequences, such as train derailments, when trains pass through the affected sections. Protective personnel are responsible for monitoring train movements and issuing early warnings. Their response speed and warning accuracy are vital to ensuring that operators can evacuate the work site in time to avoid collisions. Similarly, transport drivers, who are responsible for moving personnel and equipment, play a key role in operational safety [26,27]. Moreover, new employees or outsourced personnel often lack sufficient practical experience and a thorough understanding of standard railway maintenance procedures. Their inadequate training and poor execution of key tasks, such as equipment handling and process compliance, can lead to substandard maintenance work and significantly increase the risk of accidents.
(2)
Equipment Factors B 2
According to the “Technical Management Regulations for Railway” [28], tools and protective equipment must undergo regular inspection and maintenance to ensure proper functioning. The use of unqualified or defective equipment is strictly prohibited. For example, damage to the insulating layer of tools may lead to the “red light band” phenomenon, which poses a significant safety risk. Additionally, if communication equipment malfunctions, it becomes difficult to ensure the accurate transmission and timely execution of operational instructions, increasing the likelihood of information errors or omissions. Such failures can result in serious safety hazards during maintenance operations [5].
(3)
Environmental Factors B 3
The operational environment plays a crucial role in influencing safety risks during railway track maintenance [3]. In areas with poor communication infrastructure, the transmission of protective instructions and dispatching information is often delayed or disrupted, directly endangering the safety of train operations [29]. Limited visibility conditions such as darkness, severe weather (e.g., fog, heavy rain, snow, and sandstorms), and insufficient lighting reduce operators’ line of sight and environmental awareness, weaken protective personnel’s ability to detect oncoming trains in a timely manner, increase the likelihood of operational errors, and significantly escalate collision risks. These environmental challenges not only compromise the quality of maintenance work but may also result in serious accidents [30,31]. Furthermore, during the transportation of personnel and equipment, complex or hazardous road conditions, including mountain curves, intersections, and active construction zones [5,32], greatly elevate the risk of traffic accidents.
(4)
Management Factors B 4
The “Technical Management Regulations for Railway” [28] clearly stipulate that for construction and maintenance activities affecting train operation safety, protective measures must be strictly enforced, and construction is prohibited if safety standards are not met. Document No. 70 further emphasizes the need to strengthen safety education for operators and to develop construction plans based on scientific and risk-informed principles. Inadequate implementation of the safety protection system, absence of emergency management plans, or insufficient emergency drills can result in a failure to respond effectively during critical situations. Such shortcomings pose a direct threat to operational safety, endangering both human life and property [3,25].

3.3. Risk Level Classification and Construction of Cloud Model

According to the safety management specifications of the track system [25], the risk levels associated with track maintenance operations are classified into four categories: major risk (Level I), relatively large risk (Level II), general risk (Level III), and minor risk (Level IV). In the corresponding risk management strategy, Level I (major risk) is deemed unacceptable, requiring immediate implementation of mandatory control measures. Level II (relatively large risk) is considered undesirable, necessitating timely mitigation actions. Level III (general risk) is within an acceptable range, but should still be addressed at an appropriate time. Level IV (minor risk) is negligible and typically does not require active risk control measures [25,33]. To construct a comprehensive risk assessment index system for track maintenance operations, this study classified the indices into two categories: objective indices and subjective indices. Objective data were sourced from operational documents such as maintenance work order records, equipment ledgers, and other practical data sources. Subjective indices were evaluated by inviting domain experts and scholars to assign scores based on their professional judgment and experience. Based on industry standards, expert experience, and engineering practices, the study has determined the evaluation criteria and corresponding risk level thresholds for each index [13,14]. These are detailed in Table 2.
Based on the risk-level thresholds defined for each risk assessment index in Table 2, the numerical characteristics of the cloud model were derived by calculating the threshold intervals for each risk level using Equation (10). The resulting values are presented in Table 3. The forward cloud generator [34] was implemented using Python (v3.9.13) programming language. By combining Equation (11) with the numerical characteristics in Table 3, a total of 5000 random simulations were conducted for each risk level, thus constructing a visualized cloud model as shown in Figure 3. In the figure, the horizontal axis (abscissa) represents the value of the risk assessment index, while the vertical axis (ordinate) indicates the membership degree of the index value within the corresponding cloud model. Since the subjective indices were assigned identical, numerical characteristics, their respective cloud model visualizations exhibit uniform graphical patterns.

3.4. Determination of Index Weight and Risk Levels

After establishing the risk assessment index system and corresponding cloud model for railway track maintenance operations, the risk level can be determined through the following steps:
(1)
Weight calculation of risk assessment indices: As described in Section 2.1, Section 2.2 and Section 2.3, calculate the subjective weights, objective weights, and then integrate them using GTCWM to obtain the final combined weights of each index.
(2)
Construction of the membership matrix using the cloud model: Based on the actual measured values of each index, the membership degrees to the corresponding cloud models are calculated using Equation (11). These values form the membership matrix Q = [ q i j ] n × m , where q i j ( 0 q i j 1 ) is the membership degree of the index i to the cloud model j .
(3)
Risk level determination using nonlinear FCE: The membership degrees computed using Equation (11) fall within the interval [0, 1]. However, for use in the nonlinear fuzzy matrix synthesis operator, all values must be greater than one. Therefore, the membership matrix must be transformed into an Q [14]. To meet this consistency of the proportional relationship between the transformed and original matrices, the membership matrix must be transformed into a fuzzy evaluation matrix S = [ s i j ] n × m , where q i j is the value in the membership matrix Q , and s i j is the corresponding value after being transformed into S , that is,
s i j = e q i j .
Equation (12) and the principle of the maximum membership degree are used to determine the risk level of railway track maintenance operations.

4. Case Study

In this section, an empirical analysis is conducted using track maintenance operations on the Lanzhou–Xinjiang Railway as the research object to evaluate the effectiveness of the proposed risk assessment model. The model integrates spatiotemporal dimensional information to enable precise risk assessment at the level of individual operations. Specifically, it can not only determine the exact timing of risk occurrence but also accurately identify the specific line mileage where the risk is located. This capability significantly enhances the granularity and precision of risk assessment and provides practical technical support for field applications, particularly in the formulation of targeted risk prevention and control strategies.

4.1. Case Description

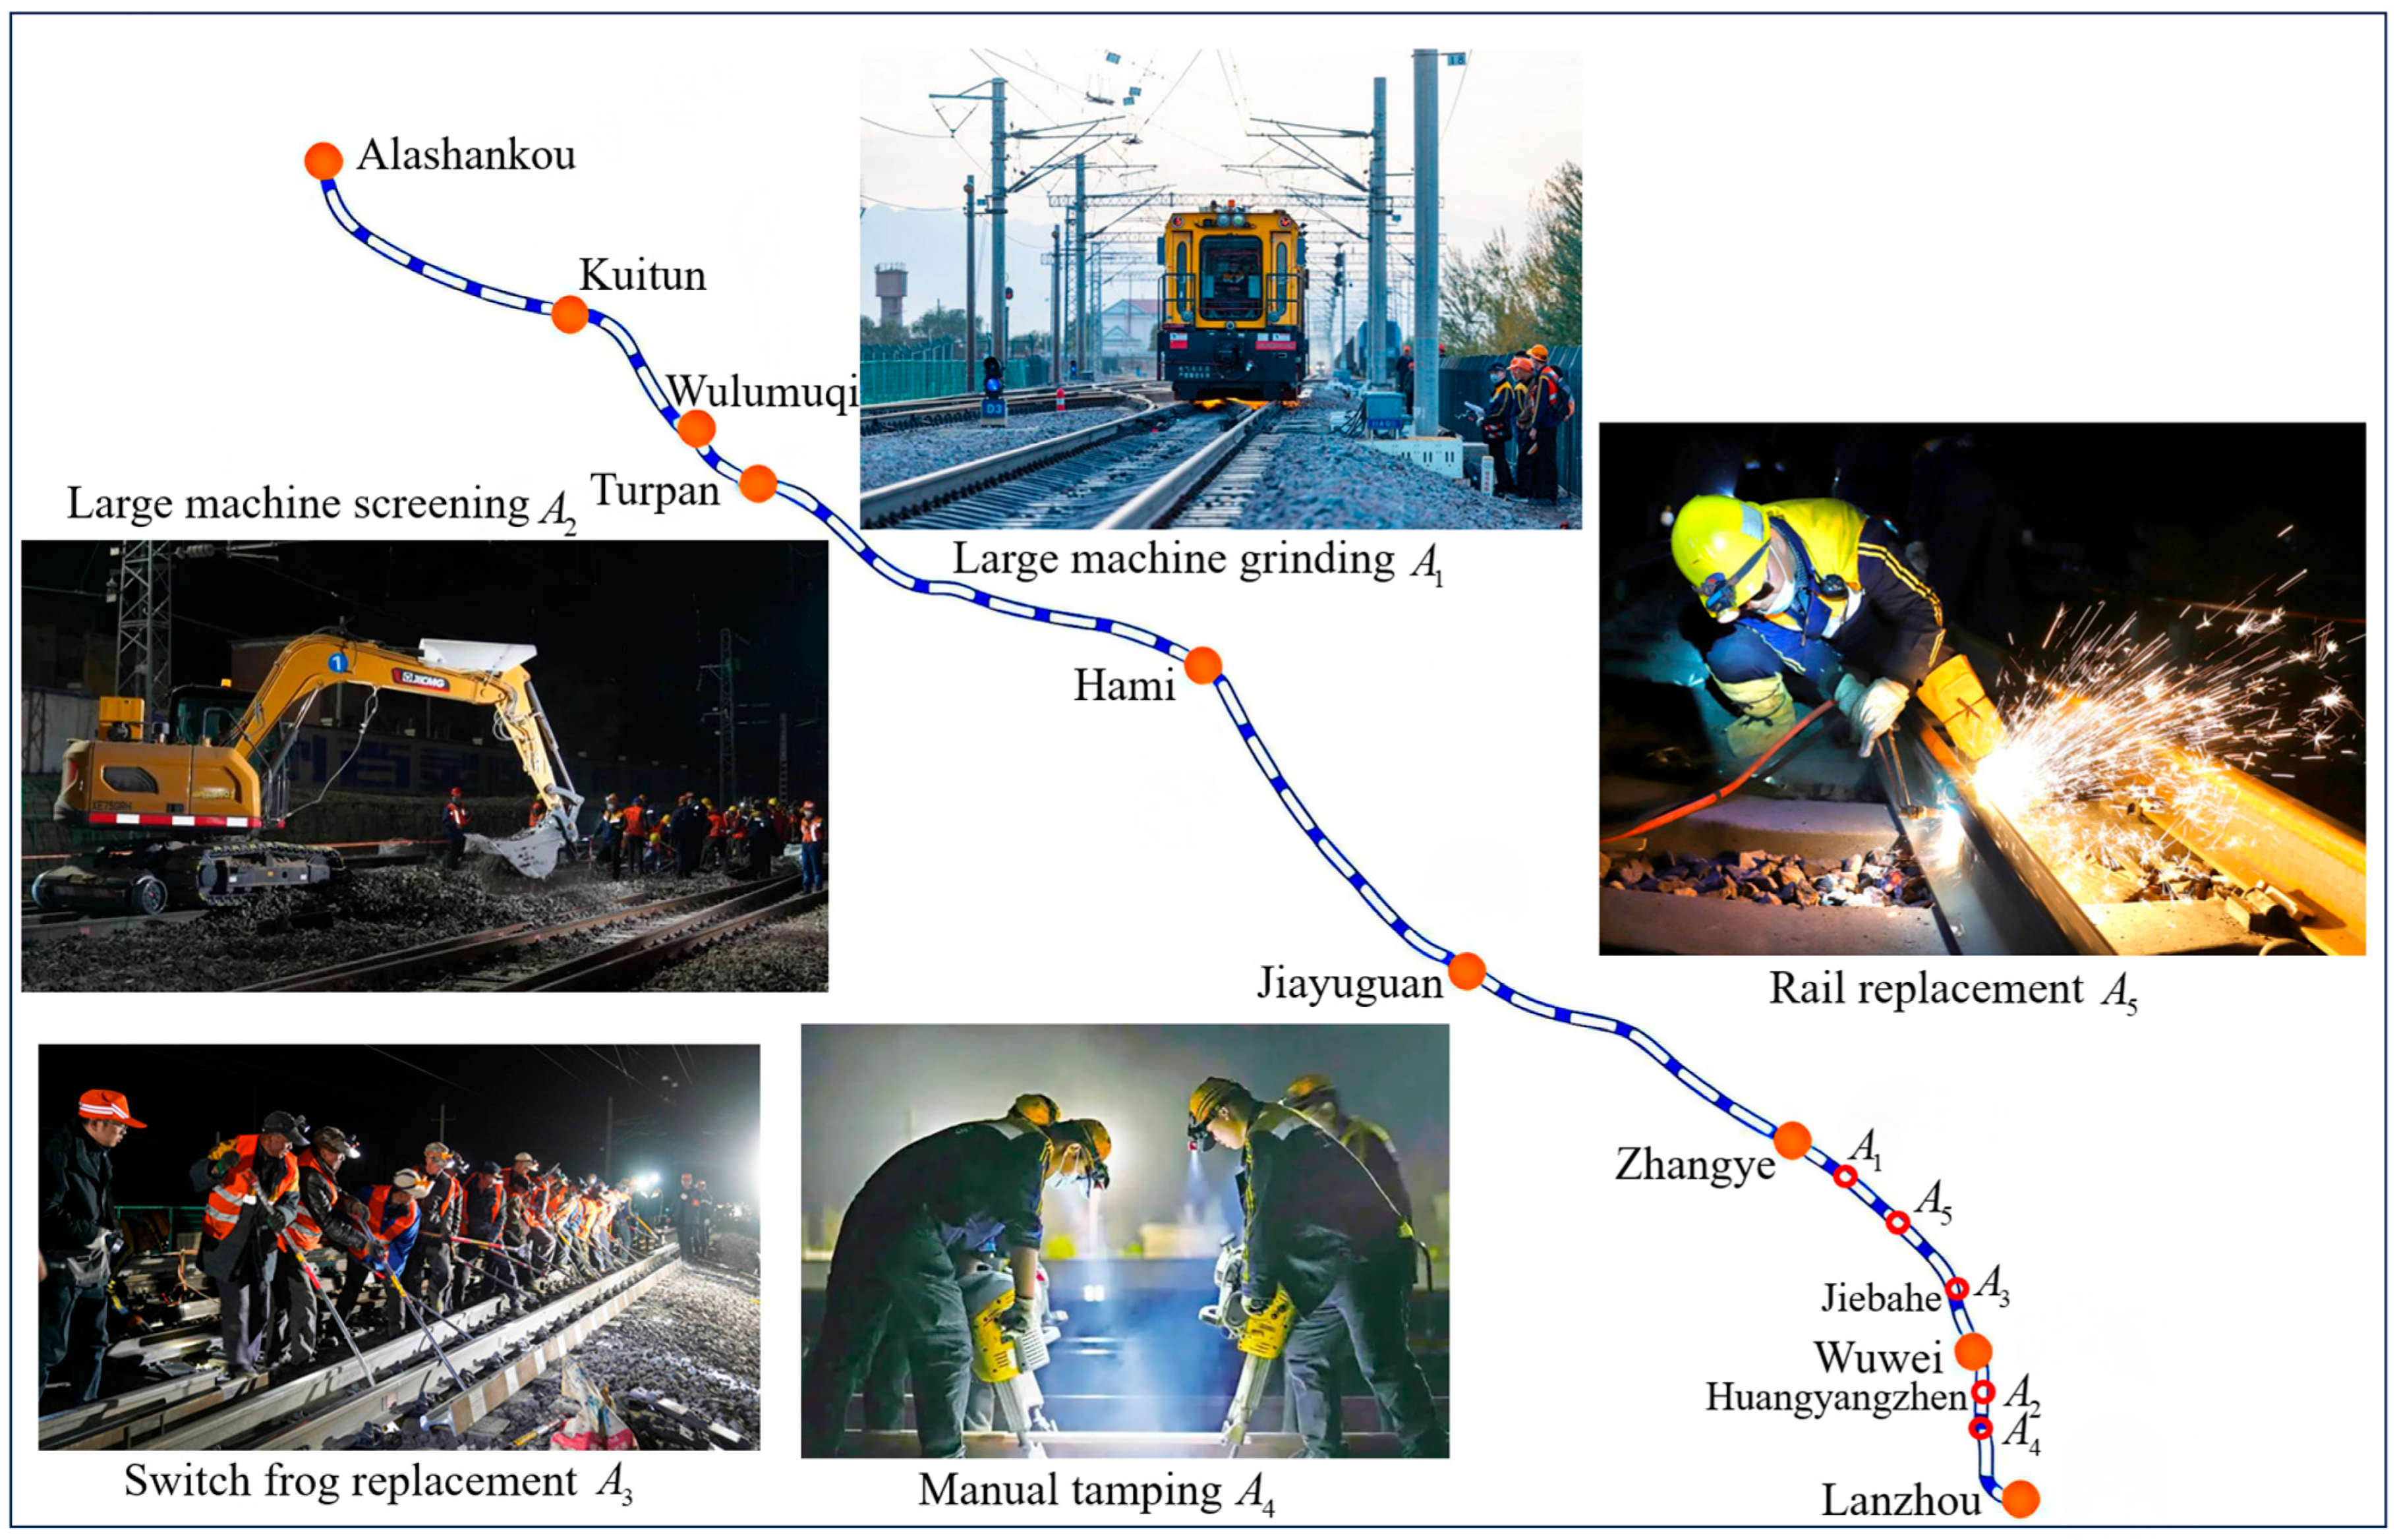
The Lanzhou–Xinjiang Railway, with a total length of 2423 km, traverses complex and diverse terrains, including the Gobi Desert and alpine valleys. The line is subject to harsh climatic conditions year-round, such as extreme temperature fluctuations and frequent sandstorms. In addition, it plays a critical role in supporting heavy passenger and freight transportation in the region. The combination of long-term, high-frequency train operations and challenging environmental conditions significantly accelerates the wear and tear of track infrastructure. As a result, track maintenance operations along this corridor face exceptionally high safety risks, making it a representative and suitable case study for conducting research on risk assessment in railway track maintenance.
In railway track systems, rails are subjected to both vertical loads from train wheels and lateral horizontal forces. Under high-intensity cyclic loading, internal structural defects can develop, such as nuclear flaws, bolt hole cracks, transverse cracks at the rail base [35], and rail weld defects [36]. As these internal defects progress into deep cracks or fractures, they significantly increase the risk of train derailments. Turnouts represent particularly complex structures within the track system. Components such as the point rails and wing rails, especially near the frog gap, endure substantial impact forces from passing trains. These areas are highly prone to wear, deformation, and other structural defects [37], making them common locations for rail failures. Additionally, under repeated train loading, ballast beds may exhibit various forms of abnormal deformation, including bed deformation, ballast contamination, ballast pulverization, ballast collapse, mud pumping, and ballast hardening [38]. To address these issues, maintenance activities such as rail grinding, rail replacement, frog replacement, large machine cleaning, and manual tamping are commonly performed. Accordingly, this study selected these types of maintenance operations as the focus of analysis. Based on the track maintenance records from the Lanzhou–Xinjiang Railway, five maintenance operations were randomly selected as evaluation samples. Detailed information regarding these samples is shown in Figure 4 and Table 4.
Operation A 1 is large machine grinding, primarily aimed at eliminating defects such as rail corrugation, fish-scale cracks, and rail head flow, thereby reducing vibration and noise during train operations. Operation A 2 is large machine cleaning, which focuses on addressing track bed defects such as hardening and mud pumping, replenishing clean ballast, and restoring the elasticity of the track structure. Operation A 3 involves frog replacement. Due to the presence of cracks in the switch rail, the damaged frog components must be replaced promptly to ensure the safe and normal operation of the turnout area. Operation A 4 is manual tamping, intended to eliminate longitudinal level irregularities in the track. By tamping the track, smooth and stable train operation is maintained. Operation A 5 is rail replacement, necessitated by serious rail defects such as contact fatigue fractures and shelling. The damaged rail must be replaced in a timely manner to eliminate potential safety hazards. The operation times and locations are detailed in Table 4.

4.2. Weight Calculation

To ensure the professionalism and reliability of the evaluation results when determining subjective weights using the G1 method and scoring subjective risk factors, experts were invited from multiple channels, including universities, research institutions, and field operations. Ultimately, an evaluation team of nine experienced individuals was assembled, comprising scholars, technical specialists, and on-site experts. The team included two experts with senior professional titles from leading universities in the field of railway engineering, both of whom have extensive experience in track safety research. Additionally, three experts held deputy senior professional titles, specializing in the R&D of railway track maintenance technologies. The team also included four on-site technical experts with senior engineer titles, each with over 10 years of experience in track maintenance management and all of whom had actively participated in maintenance operations on the Lanzhou–Xinjiang Railway.
Using the five track maintenance operations listed in Table 4 as examples, the expert team assessed the subjective risk factors by combining first-hand operational knowledge, professional experience, and relevant industry standards. The resulting expert scores and assigned values are listed in Table 5.
Subjective weight determination: The subjective weights of the indices were calculated following the G1 method steps outlined in Section 2.1. For example, to calculate the subjective weights of B 1 B 4 , they were ranked based on their relative importance in influencing the risk of track maintenance operations, resulting in the following order B 1 > B 4 > B 2 > B 3 , i.e., E 1 ( B 1 ) > E 2 ( B 4 ) > E 3 ( B 2 ) > E 4 ( B 3 ) . The quantified values of the relative importance between adjacent indices, obtained through expert assessment, were 1.3, 1.4, and 1.2, respectively. Based on these values, the weights were computed using Equations (1) and (2). Table 6 presents the ranking and quantified degree of importance for the first-level indices of track maintenance operations as provided by the expert panel. Following the same procedure, the subjective weights of the second-level indices were also calculated using the G1 method, with the results shown in Table 7.
(1)
Determination of objective weight: Following the calculation steps of the EWM, the index values from Table 5 were first normalized and converted into a judgment matrix using Equations (3)–(5). Based on this matrix, the objective weights of the second-level indices were calculated. The objective weights of the first-level indices were then derived accordingly. The results are summarized in Table 7.
(2)
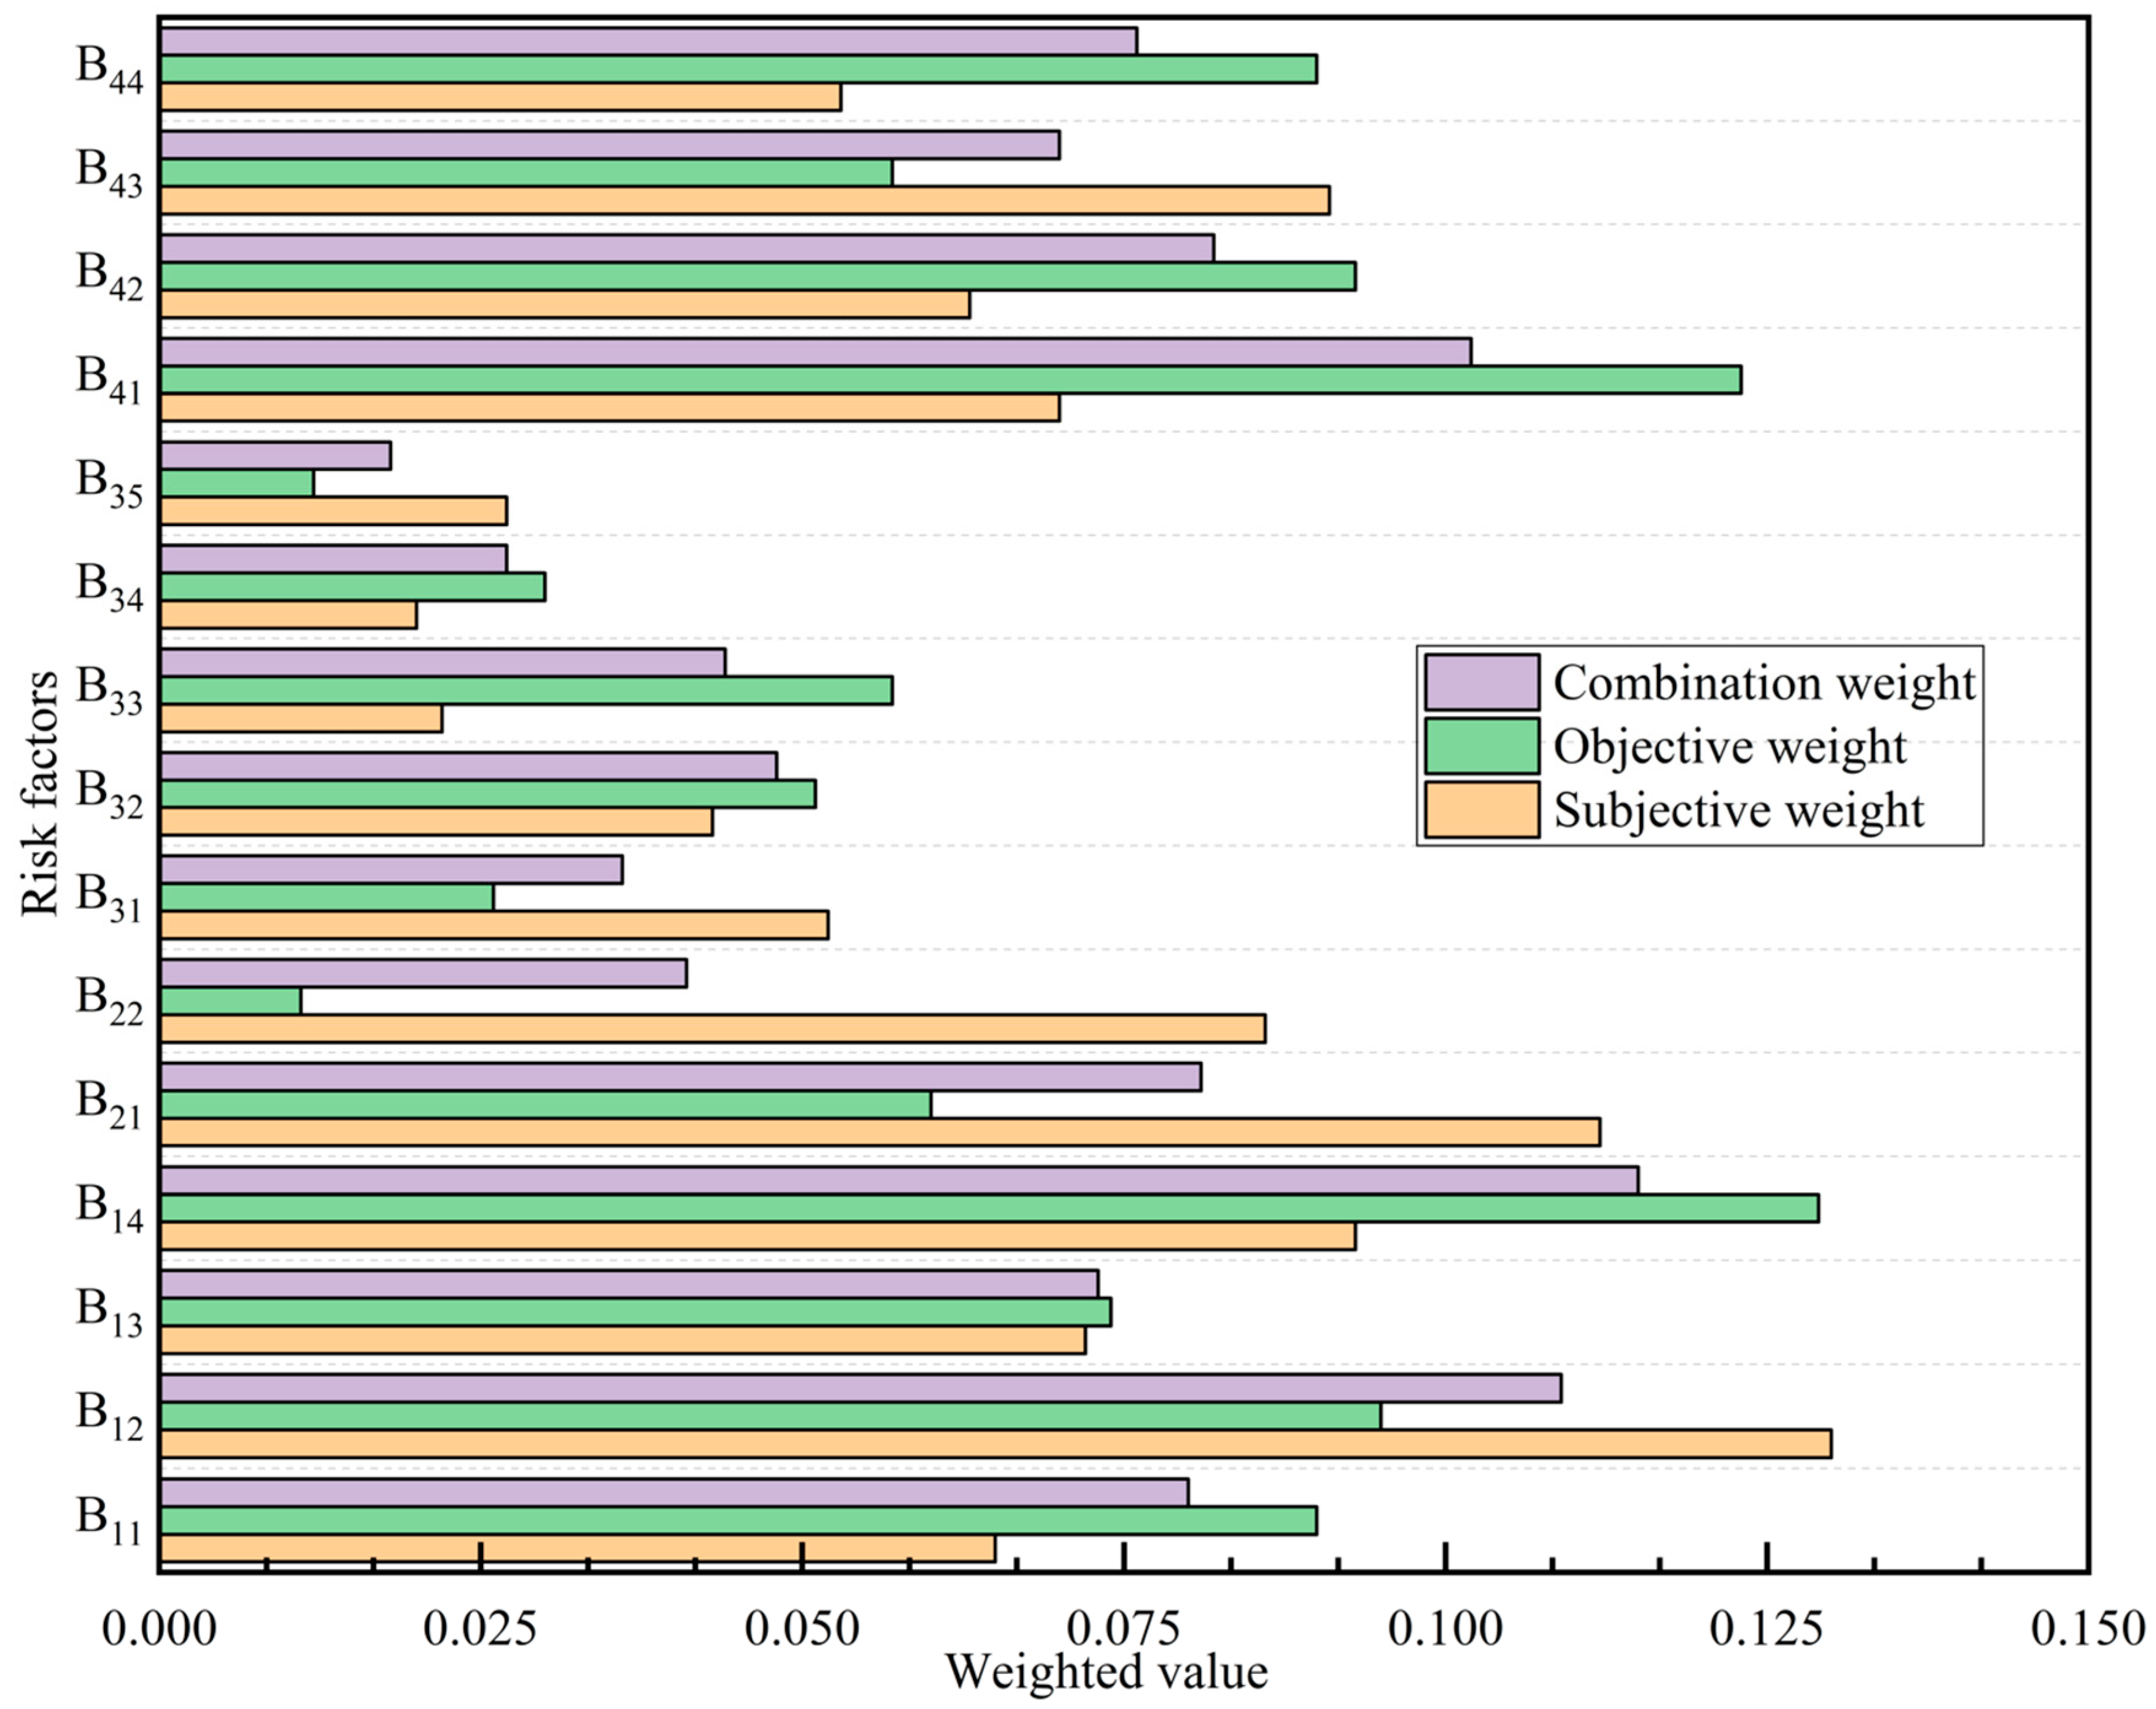
Determination of combined weights: Using the steps outlined in the GTCWM, the combined weights were obtained using Equations (6)–(9), as listed in Table 7. These combined weight values are also included in Table 7. To visually compare the subjective, objective, and combined weights, a comparative chart is presented in Figure 5.

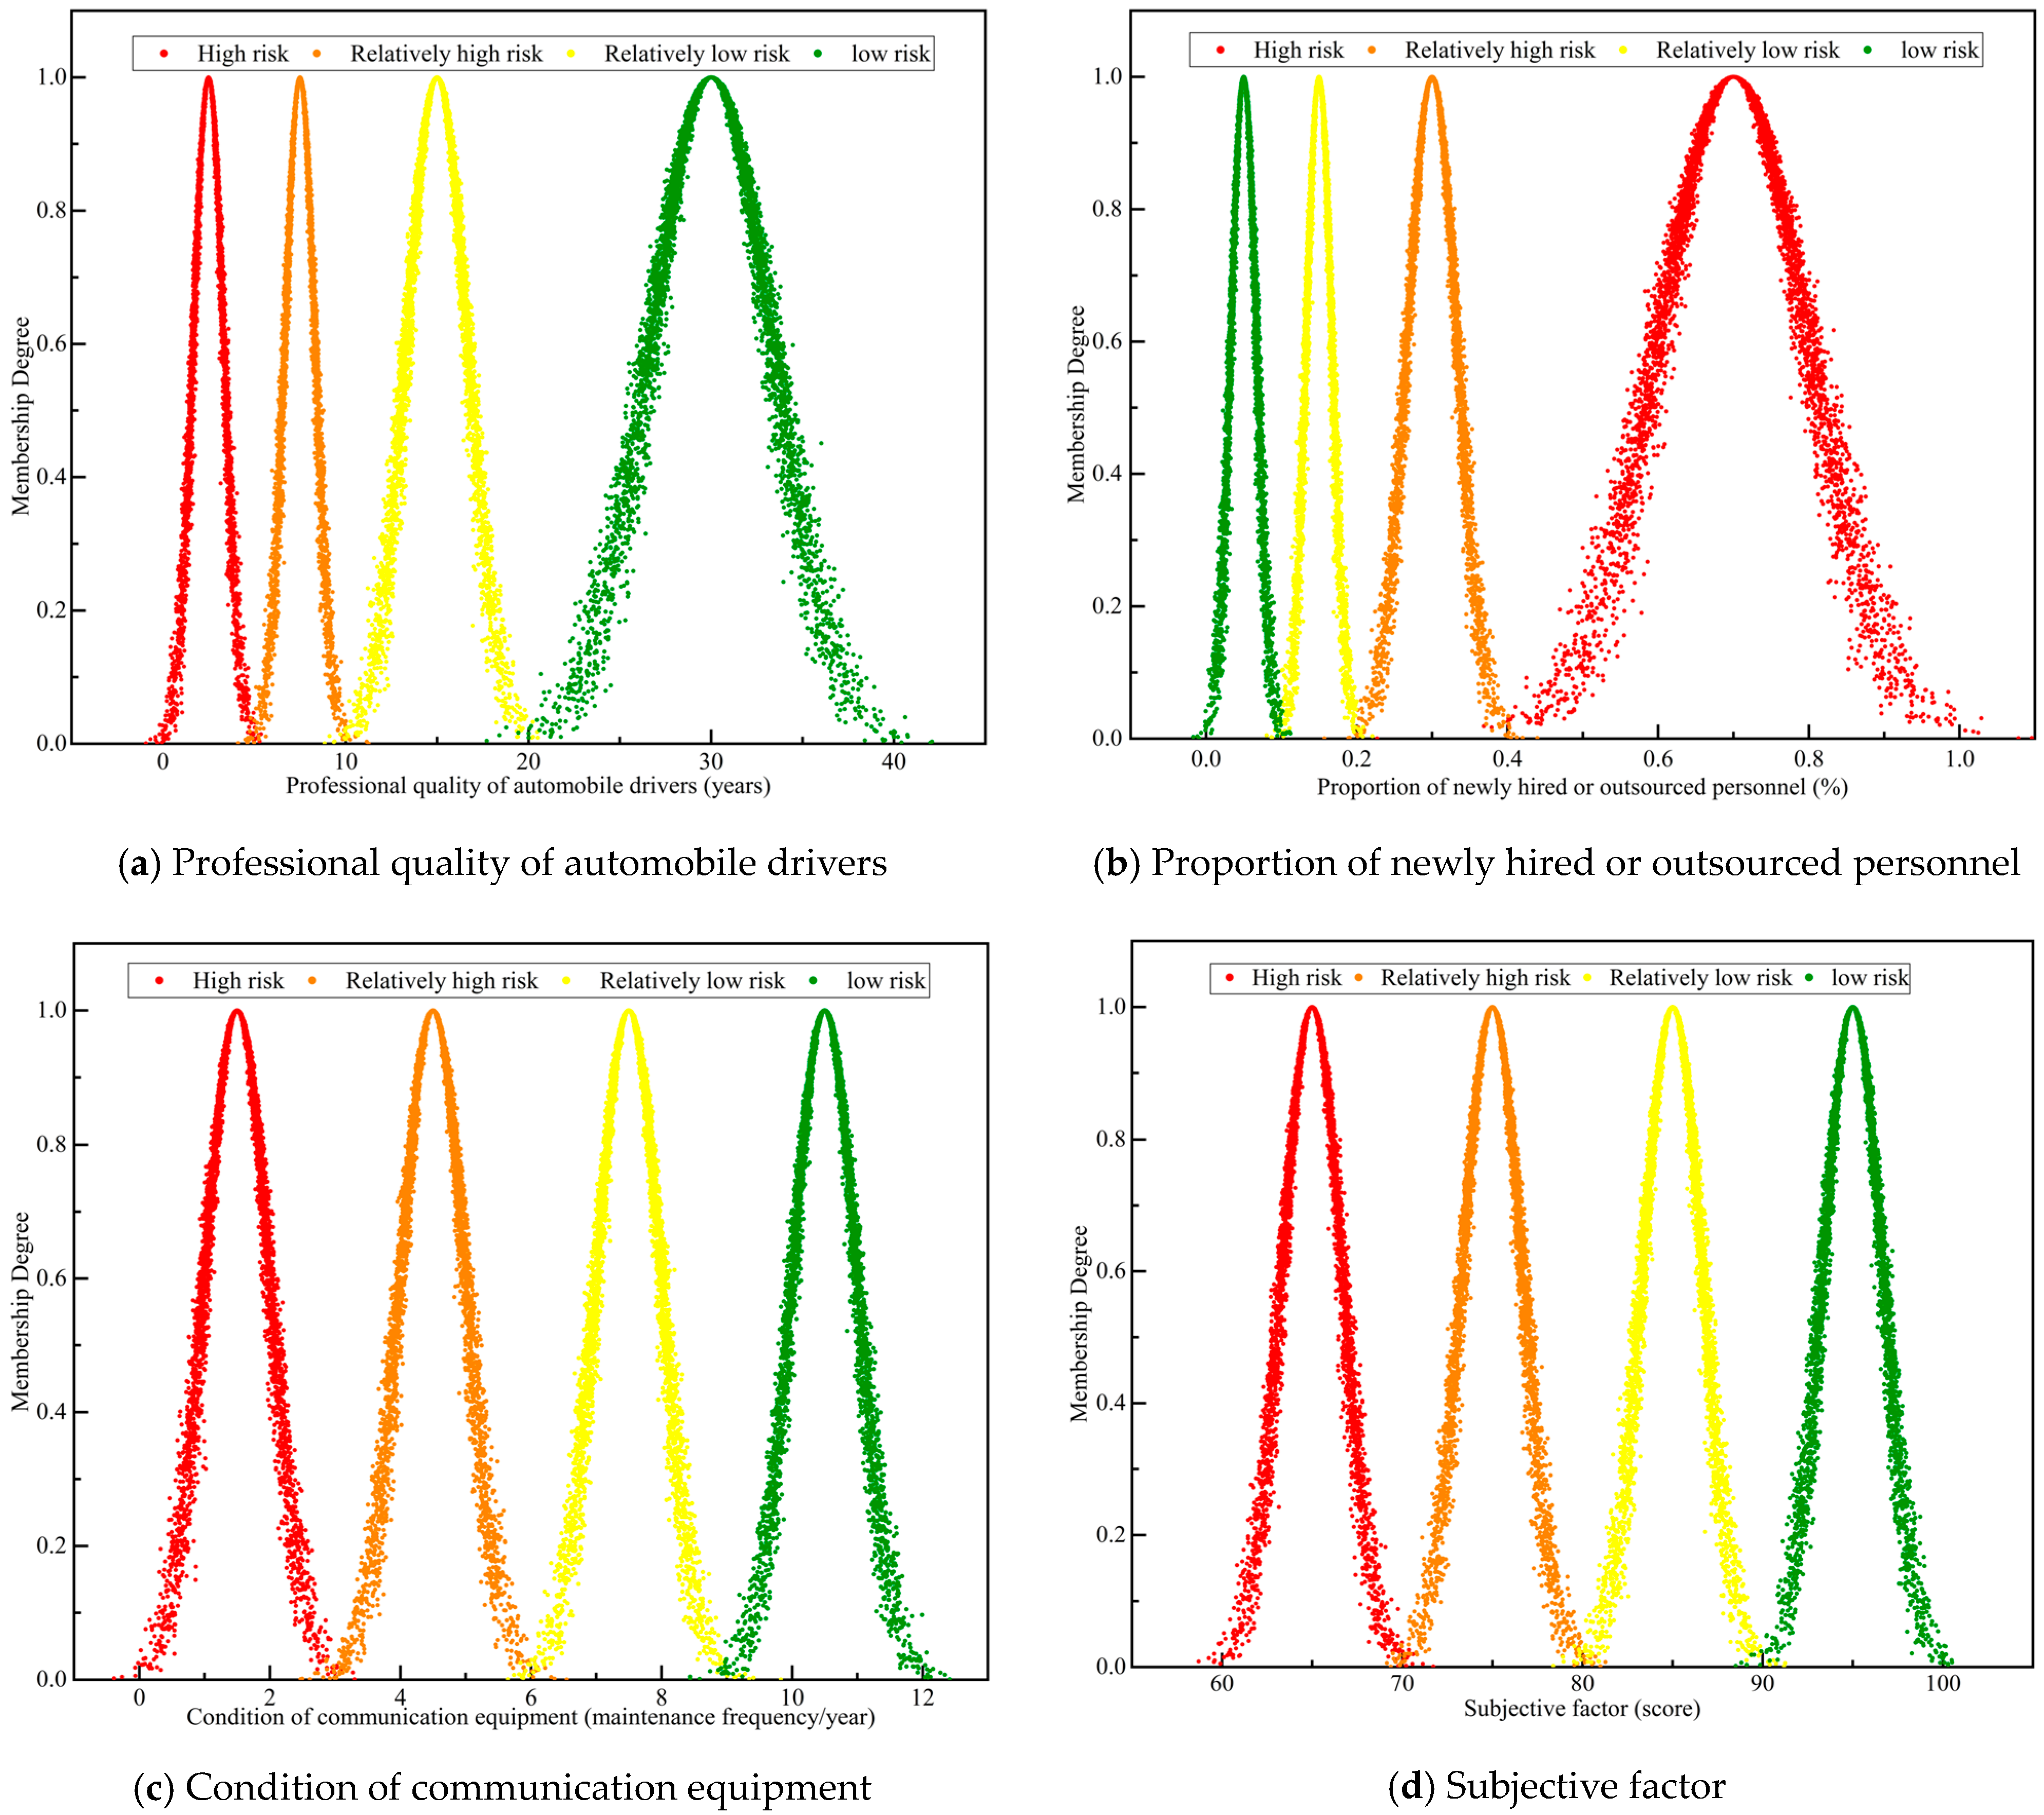
4.3. Membership Degree Calculation

To eliminate the influence of randomness in the final risk assessment values during the calculation of membership degrees using the cloud model, this study repeated the calculations 2000 times using Equation (11), based on the index values given in Table 5. The average value of these iterations was then used to determine the membership degrees of each index within the cloud model, forming the membership degree matrix. Taking maintenance operation A 1 as an example, Table 8 shows the membership degree values for the 15 risk indices in relation to the cloud model. These values were subsequently converted into a fuzzy evaluation matrix using Equation (13), and the results are shown in Table 9.

4.4. Nonlinear FCE

First, the prominent influence coefficients of the risk indices must be determined. According to the literature [13,14,22], these coefficients are typically established based on expert judgment. In this study, the coefficients were derived from a combination of expert experience, the value standards outlined in Table 2, and practical insights gained from track maintenance operations. Based on these inputs, the prominent influence coefficients for both first-level and second-level indices were determined, as shown in Equation (14).
Γ = [ 5.5 , 4 , 3 , 5.5 ] ,      Γ 1 = [ 4.5 , 5 , 3 , 5 ] ,      Γ 2 = [ 4.5 , 3 ] , Γ 3 = [ 4 , 5.5 , 2.5 , 3 , 2 ] ,      Γ 4 = [ 5.5 , 5 , 3.5 , 4 ] .
Secondly, a first-level nonlinear FCE is conducted. Based on Table 7, the combined weight vectors of the risk indices are Ψ 1 Ψ 4 . The corresponding fuzzy evaluation matrices Γ 1 Γ 4 are shown in Table 9, and the prominent influence coefficient vectors Γ 1 Γ 4 are as shown in Equation (14). Use Equation (12) to conduct a first-level nonlinear FCE. Taking maintenance operation A 1 as an example, the first-level nonlinear FCE is applied to the second-level indexes B 11 , B 12 , B 13 , and B 14 . The calculation process is as shown in Equation (15). After obtaining Ι 1 , normalization processing is required, and the risk evaluation result vector Ι 1 of the human factor ( B 1 ) in the maintenance operation A 1 is obtained. Following the same procedure, the risk evaluation result vectors for the equipment factor ( B 2 ), environmental factor ( B 3 ), and management factor ( B 4 ) are as shown in Equation (16).
Ι 1 = f ( Ψ 1 , S 1 , Γ 1 ) = 0.080 0.109 0.073 0.115 T 1 4.5 1 4.5 1 4.5 2.713 4.5 1 5 2.718 5 1 5 1.002 5 2.718 3 1 3 2.718 3 1 3 1 5 1 5 1 5 1 5 1 5           = ( 0.574 ,   0.564 , 0.554 ,   0.377 ) ,
Ι 1 = ( 0.277 ,   0.273 ,   0.268 ,   0.182 ) ,    Ι 2 = ( 0.185 ,   0.383 ,   0.248 ,   0.185 ) Ι 3 = ( 0.200 ,   0.296 ,   0.305 ,   0.200 ) ,    Ι 4 = ( 0.283 ,   0.259 ,   0.188 ,   0.270 ) .
Finally, a second-level nonlinear FCE is performed. Based on the previously obtained risk evaluation result vectors I i ( i = 1 , 2 , 3 , 4 ) for the first-level indexes B 1 , B 2 , B 3 , and B 4 , these vectors are assembled into a matrix Q = [ Ι 1 T Ι 2 T Ι 3 T Ι 4 T ] T , and the matrix Q is transformed into a fuzzy evaluation matrix S by using Equation (13). According to Table 7 and Equation (14), the combined weight vector Ψ = ( 0.377 ,   0.121 ,   0.172 ,   0.330 ) and the corresponding prominent influence coefficient vector Γ for the first-level indices are identified. The second-level nonlinear FCE is conducted using Equation (12), with the detailed calculation process shown in Equation (17):
I = f ( Ψ , S , Γ ) = 0.377 0.121 0.172 0.330 T 1.32 5.5 1.313 5.5 1.307 5.5 1.2 5.5 1.203 4 1.466 4 1.281 4 1.203 4 1.221 3 1.344 3 1.357 3 1.221 3 1.327 5.5 1.296 5.5 1.207 5.5 1.31 5.5 1 5.5                          = ( 1.257 ,   1.282 ,   1.238 ,   1.207 ) .
Normalize I to obtain I = ( 0.252 ,   0.257 ,   0.248 ,   0.242 ) , and this vector is the risk evaluation result vector of maintenance operation A 1 . According to the principle of maximum membership degree, the risk level of maintenance operation A 1 is relatively large risk (Level II). Similarly, the risk evaluation result vectors and risk levels of operations A 2 A 5 are presented in Table 10.

5. Discussion

5.1. Comparative Analysis

To verify the effectiveness of the proposed risk assessment model for track maintenance operations, both linear and nonlinear FCE were used to assess the risks of the operations A 1 A 5 . A comparative analysis of the risk assessment results was then conducted. In the linear FCE method, all influence coefficients for the risk indices were uniformly set to 1. From the resulting risk levels, as presented in Table 10, the risk levels of operations A 1 A 4 are “General risk (III)”, and operation A 5 is “Minor risk (IV)”. However, when the nonlinear FCE method was applied for risk assessment, the results for A 1 , A 2 , and A 5 showed significant differences. This variation is attributed to the nonlinear FCE method’s consideration of the dominant influence of certain risk factors in determining overall risk. As a result, the risk levels of operations A 1 , A 2 , and A 5 were higher than those assessed using the linear FCE method. Specifically, operations A 1 and A 2 were classified as “Relatively large risk (II)”, while operation A 5 is “General Risk (III)”.
Operations A 1 and A 2 involve multi-department collaboration, complex pre-operation preparations, high technical difficulty, and intricate work procedures. However, in practice, challenges such as high proportion of outsourced personnel, insufficient safety education, and inadequate protective measures are commonly observed. The nonlinear FCE method accounts for the substantial influence of key risk indices, including the proportion of newly hired or outsourced personnel ( B 14 ), safety education and training ( B 41 ), and safety protection measures ( B 42 ). To enhance the accuracy of risk assessment, we revised the model by assigning higher prominent influence coefficients to these key indices. For example, the status values of risk factors B 41 B 44 for operation A 1 are at levels I, II, IV, and IV, respectively. When using linear FCE, the final status value for B 4 is Level IV, which significantly underestimates the risks stemming from inadequate safety education and protective measures. By contrast, by applying nonlinear FCE and incorporating the dominant effects of risk factors B 41 and B 42 , the status value of B 4 is adjusted to Level I. This adjustment allows the model to more accurately reflect the risk level of the operation.
For operation A 5 , although the overall status of most risk factors is favorable, there remains room for improvement in the proportion of newly hired or outsourced personnel ( B 14 ) and in safety education and training ( B 41 ). Owing to the current situation, characterized by a high proportion of temporary workers and insufficient safety education prior to the operation, the nonlinear FCE method enhances the influence of these specific indices by introducing prominent influence coefficients. As a result, the risk level is adjusted from “minor risk (IV)” to “general risk (III)”, effectively addressing the tendency of the linear FCE to underestimate the impact of these critical factors owing to uniform weighting.
A comparison of the above risk assessment results shows that the nonlinear FCE method significantly improves the accuracy and reliability of risk assessments by accounting for the prominent impacts of key risk factors. Conventional FCE tend to dilute critical risk factors’ influence. In contrast, nonlinear FCE effectively captures their dominance in risk determination. This reduces potential safety hazard oversight and better aligns with practical risk management needs. Consequently, it provides a more robust and scientific basis for decision-making in track maintenance risk control.
Based on the risk assessment results and the actual conditions of each maintenance operation, targeted management measures were formulated as follows:
  • Management of new employees or outsourced personnel: Prior to operations, specialized job adaptation training is conducted, focusing on the equipment, operation types, processes, and environmental characteristics involved. Safety education is strengthened to ensure that outsourced personnel are fully aware of operational risks and safety requirements. Outsourced personnel are strictly prohibited from working alone or operating independently of the designated team. Designated supervisors are assigned to monitor the operation process in real time, ensuring compliance with safety protocols and maintaining overall operational safety.
  • Management of large-scale track maintenance machinery operations: Clear guidelines are established regarding train formations, designated sections for disassembly and coupling, and the assignment of responsible personnel. Prohibited operation zones are clearly marked, and both operational process and communication mechanism are standardized. When large-scale track maintenance machinery enters or exits a blocked section, enhanced lookout measures are required, and speed must be strictly controlled. Onboard personnel must promptly report train movements to enable on-site workers to avoid danger in a timely manner. During operations, safety regulations must be strictly enforced, including maintaining a minimum distance of 10 m between vehicles to prevent mechanical collisions and ensure operational safety.

5.2. Advantages and Limitations

In this study, spatiotemporal dimensional information is innovatively introduced into the risk assessment of track maintenance operations, enabling precise identification of the location and time of risk occurrences within individual maintenance activities. This facilitates the development of differentiated risk response strategies, thereby significantly enhancing the relevance and effectiveness of risk prevention and control measures. The constructed risk assessment index system transcends limitations related to specific operation types and is adaptable to a variety of track maintenance scenarios, including line maintenance and turnout inspections. To optimize the weighting of risk factors, the GTCWM was employed. This approach effectively integrates expert experience with objective data, addressing the limitations of purely subjective or objective weighting methods. To overcome the limitations of conventional linear weighted average methods, particularly their tendency to dilute the influence of high-risk factors, a nonlinear FCE method was introduced. By incorporating prominent influence coefficients, the evaluation process preserves the impact of critical risk factors, ensuring that the final risk assessment more accurately reflects actual risk levels. This enhances both the precision and reliability of the overall risk assessment.
To further improve the accuracy and reliability of the risk assessment results, future research can be optimized in the following three areas.
(1)
Correlation analysis of risk factors: Develop a correlation analysis model to explore the coupling mechanism among various risk factors in greater depth. At the same time, expand the identification scope and continuously improve the evaluation index system.
(2)
Intelligent data collection and quantification: Address the subjective limitations of expert scoring by developing an intelligent data acquisition system capable of dynamically and automatically capturing risk factor values. A scientific risk factor quantification model can be established by combining multi-source data such as industry standards, historical data, and real-time monitoring information.
(3)
Expansion of sample data for objective weighting: Collect a larger volume of sample data through multiple channels to enhance the accuracy of calculating objective weights by the EWM.
The risk assessment method proposed in this study has been integrated with real-world track maintenance scenarios, forming a practical solution that directly supports the optimization of maintenance operation processes.

6. Conclusions

This study comprehensively employed the G1 method, EWM, GTCWM, and nonlinear FCE to develop a risk assessment model for railway track maintenance operations. The proposed model enables precise prediction of the occurrence time, spatial location, and risk level in individual maintenance operations. Its effectiveness and practical applicability were validated through empirical analysis of maintenance activities on the Lanzhou–Xinjiang Railway. The main conclusions are as follows:
(1)
Based on literature review and expert consultation, the risk factors of track maintenance operations are systematically classified into four dimensions: human, equipment, environment, and management, and a risk assessment index system suitable for various types of track maintenance operations is developed.
(2)
The G1 method, EWM, and GTCWM are employed to derive subjective weights, objective weights, and combined weights, respectively. A cloud model is used to construct the membership matrix. In the nonlinear FCE method, prominent influence coefficients are introduced to correct the defects of the linear weighted averaging method and enhance the impact of high-risk factors in the evaluation.
(3)
When the risk assessment model is applied to track maintenance operations on the Lanzhou–Xinjiang Railway, it allows for the precise risk assessment of each maintenance operation based on its type, while simultaneously determining the spatial location and time of risk occurrence. This supports managers in formulating targeted prevention and control measures in a “one strategy for one location and one time” manner. Based on spatiotemporal characteristics, operation types, risk levels, and distribution of high-risk indicators in different operation scenarios, differentiated risk control strategies are constructed from four dimensions: human, equipment, environment, and management. This mechanism enables railway departments to precisely allocate resources according to the dynamic combination of operational elements, prioritize resource investment in high-risk operations, carry out focused intervention on core risk factors, and effectively reduce risks.

Author Contributions

Software, R.L. (Rui Luan); validation, R.L. (Rengkui Liu); data curation, R.L. (Rengkui Liu); writing—original draft preparation, R.L. (Rui Luan); writing—review and editing, R.L. (Rui Luan), R.L. (Rengkui Liu). All authors have read and agreed to the published version of the manuscript.

Funding

This research was funded by Natural Science Horizontal Project (T24L02130).

Data Availability Statement

The data used to support the findings of this study are included within the article.

Acknowledgments

The authors express thanks to the people who helped with this work and acknowledge the valuable suggestions from the peer reviewers. In particular, special thanks go to Yunfeng Chen for his help with this article.

Conflicts of Interest

The authors declare no conflicts of interest.

References

  1. Xiu, Z.L. The Design and Implementation of a Safety Supervision System for Railway Lines in Operation. Master’s Thesis, Beijing Jiaotong University, Beijing, China, 2019. [Google Scholar]
  2. He, N.S. Prevention and restraining control for the construction safety accident of railway business lines. J. Railw. Eng. Soc. 2016, 33, 32–36. [Google Scholar]
  3. Li, Y. Application Research of BIM 4D Technology in Turnout Replacement Construction of Existing Lines. Master’s Thesis, Lanzhou Jiaotong University, Lanzhou, China, 2023. [Google Scholar]
  4. Jiang, C. Research on Construction Safety Risk Management by the Machinery Section of Bureau A. Master’s Thesis, Southwest Jiaotong University, Chengdu, China, 2022. [Google Scholar]
  5. Zhang, Y.R. Research on Safety Risk Management of Construction and Signal Cooperation with Operation in Ordinary Speed Railway. Master’s Thesis, Lanzhou Jiaotong University, Lanzhou, China, 2021. [Google Scholar]
  6. Song, Z.Q. Research on Safety Risk Assessment and Preventive Measures of Track Maintenance Operation in Large-Scale Railway Marshalling Station Construction Project. Master’s Thesis, East China Jiaotong University, Nanchang, China, 2023. [Google Scholar]
  7. Han, M. Research on Safety Management Evaluation of Large-Scale Railway Road Maintenance Machinery. Master’s Thesis, Beijing Jiaotong University, Beijing, China, 2023. [Google Scholar]
  8. Chai, N.; Zhou, W. Evaluating operational risk for train control system using a revised risk matrix and FD-FAHP-Cloud model: A case in China. Eng. Fail. Anal. 2022, 137, 106268. [Google Scholar] [CrossRef]
  9. Liang, H.B.; Xie, X.G.; Chen, X.X.; Li, Q.; He, W.; Yang, Z.; Ren, M. Study on risk assessment of tunnel construction across mined-out region based on combined weight-two-dimensional cloud model. Sci. Rep. 2025, 15, 7233. [Google Scholar] [CrossRef] [PubMed]
  10. Peng, J.Q.; Zhang, J.M. Urban flooding risk assessment based on GIS- game theory combination weight: A case study of Zhengzhou City. Int. J. Disaster Risk Reduct. 2022, 77, 103080. [Google Scholar] [CrossRef]
  11. Sun, N.; Li, C.L.; Guo, B.Y.; Sun, X.; Yao, Y.; Wang, Y. Urban Flood Risk Assessment Based on FAHP-EWM Combination Weighting: A Case Study in Beijing. Geomat. Nat. Hazards Risk 2023, 14, 2240943. [Google Scholar]
  12. Liu, C.; Yang, S.W.; Cui, Y.; Yang, Y. The Improved Risk Assessment Method Is Based on a Comprehensive Weighting Algorithm for Railway Signalling Safety Analysis. Saf. Sci. 2020, 128, 104768. [Google Scholar] [CrossRef]
  13. Song, Z.P.; Guo, D.S.; Lu, Z. Risk Assessment Model for TBM Construction Based on Nonlinear Fuzzy Analytic Hierarchy Process. Rock Soil Mech. 2021, 42, 1424–1433. [Google Scholar]
  14. Guo, D.S.; Meng, F.Y.; Wu, H.A.; Yang, X.X. Risk Assessment of Shield Construction Adjacent to the Existing Shield Tunnels Based on Improved Nonlinear FAHP. Tunn. Undergr. Space Technol. 2025, 155, 106154. [Google Scholar] [CrossRef]
  15. Ma, S.Q.; Lyu, S.R.; Zhang, Y.D. Weighted Clustering-Based Risk Assessment of Urban Rainstorms and Flood Disasters. Urban Clim. 2021, 39, 100974. [Google Scholar] [CrossRef]
  16. Guo, F.; Lv, X.N.; Gu, J.L.; Wu, Y.L. Use of Weighted Euclidean Distance to Assist in the Selection of Safety Risk Prevention and Control Strategies for Major Railway Projects. Buildings 2024, 14, 1270. [Google Scholar] [CrossRef]
  17. Chen, F.D.; Wang, Y.Y.; Wu, X.G.; Xiao, D.G.; Zhang, L.M. Risk of Face Stability in Slurry Shield Tunnelling Based on the Hybrid Cloud-BN Model. J. Civ. Eng. Manag. 2017, 34, 73–79. [Google Scholar]
  18. Lai, C.; Chen, X.; Chen, X.; Wang, Z. A Fuzzy Comprehensive Evaluation Model for Flood Risk Was Based on the Combined Weights of Game Theory. Nat. Hazards 2015, 77, 1243–1259. [Google Scholar] [CrossRef]
  19. Li, D.; Liu, C.; Gan, W. New Cognitive Model: Cloud Model. Int. J. Intell. Syst. 2009, 24, 357–375. [Google Scholar] [CrossRef]
  20. Yao, J.P.; Wang, G.Q.; Wang, L.B.; Zhang, X.J.; Wang, P. Assessing the Spatiotemporal Variability of Lake Water Quality Using a Novel Multidimensional Shape–Position Similarity Cloud Model. J. Hydrol. 2021, 599, 126379. [Google Scholar] [CrossRef]
  21. Li, D.Y.; Du, Y. Artificial Intelligence with Uncertainty, 2nd ed.; National Defense Industry Press: Beijing, China, 2014. [Google Scholar]
  22. Zhang, X.H.; Feng, Y.J.; Bai, M. Evaluation Model for the Reflection of Dominant Influencing Factors. J. Harbin Inst. Technol. 2003, 10, 1168–1170. [Google Scholar]
  23. Yan, K.Z.; Zhou, Z.X. Cement Pavement Performance Evaluation Based on Nonlinear Fuzzy Method. J. Zhejiang Univ. Eng. Sci. 2013, 47, 1379–1383. [Google Scholar]
  24. GB/T 13861-2022; Classification and Code for Hazardous and Harmful Factors in Process. China Standard Press: Beijing, China, 2022.
  25. Safety Supervision Department of Ministry of Railways. Implementation Guidelines for Safety Risk Management in Railway Engineering Systems: Document No. Yun-Gong-Gao-Xian [2012] 124; China Railway Publishing House: Beijing, China, 2012. [Google Scholar]
  26. Cai, J.J.; Song, R.; He, S.W.; Zhao, R.X.; Jiang, J.P. Construction Safety Risk Analysis of Business Lines Based on Improved FP-Growth Algorithm and Bayesian Method. J. Railw. Sci. Eng. 2024, 21, 3370–3381. [Google Scholar]
  27. Liu, X. Study the Relevance of Drivers’ Experiences and Traffic Accidents. Master’s Thesis, Chang’an University, Xi’an, China, 2016. [Google Scholar]
  28. China State Railway Group Co., Ltd. Technical Management Regulations for Railways: General-Speed Railway Section; China Railway Publishing House: Beijing, China, 2014. [Google Scholar]
  29. Heijer, T.; Hale, A.R.; Koornneef, F. Systematic Derivation of Safety Rules for Railway Operations. In Proceedings of the 14th European Safety and Reliability Conference (ESREL 2003), Maastricht, The Netherlands, 15–18 June 2003; pp. 783–789. [Google Scholar]
  30. Kasraei, A.; Garmabaki, A.; Odelius, J.; Famurewa, S.M.; Chamkhorami, K.S.; Strandberg, G. Climate Change Affects Assessment of Railway Infrastructure in Urban Environments. Sustain. Cities Soc. 2024, 101, 105084. [Google Scholar] [CrossRef]
  31. Kim, J.M.; Adhikari, M.D.; Yum, S.G. Development of a Deep Neural Network-Based Life Accident Evaluation Model for Weather-Related Railway Accidents. KSCE J. Civ. Eng. 2024, 28, 4624–4638. [Google Scholar] [CrossRef]
  32. Yang, S.; Gao, L.; Zhao, Y.; Li, X. Quantitative Evaluation of the Traffic Environment Complexity for Unmanned Vehicles in Urban Roads. IEEE Access 2021, 9, 23139–23152. [Google Scholar] [CrossRef]
  33. Sun, B.; Zhou, H.K.; Dong, F.H.; Ruan, W.D.; Zhang, X.J. Risk Assessment of Bridge Construction Safety Considering Multi-information Fusion. ASCE-ASME J. Risk Uncertain. Eng. Syst. A Civ. Eng. 2022, 8, 0001267. [Google Scholar] [CrossRef]
  34. Chen, C.; Zhang, L.M.; Tiong, R.L.K. A Novel Learning Cloud Bayesian Network for Risk Measurement. Appl. Soft Comput. 2020, 87, 105947. [Google Scholar] [CrossRef]
  35. Saldan, O.; Nichoha, V.; Storozh, V.; Stefanyshyn, I. Experimental Research of Signals of Defects Such as the Transverse Cracks on the Rail Imitator. In Proceedings of the 13th International Conference on Modern Problems of Radio Engineering, Telecommunications and Computer Science (TCSET), Lviv, Ukraine, 23–26 February 2016; pp. 222–225. [Google Scholar]
  36. Fry, G.T. Fatigue Model of Thermite Rail Welds. Ph.D. Thesis, University of Illinois, Urbana, IL, USA, 1995. [Google Scholar]
  37. Yu, C.H.; Lu, Z.L. YOLO-VSI: An Improved YOLOv8 Model for Detecting Railway Turnout Defects in Complex Environments. CMC Comput. Mater. Continua 2024, 81, 3261–3280. [Google Scholar] [CrossRef]
  38. Teng, J.; Long, X.J.; Yang, Q.; Jing, G.; Liu, H. Semi-Conv-DETR: Railway Ballast Bed Defect Detection Model Integrating Convolutional Augmentation and Semi-supervised DETR. Transp. Geotech. 2024, 48, 101334. [Google Scholar] [CrossRef]
Figure 1. Risk assessment flow chart of track maintenance operations.
Applsci 15 07614 g001
Figure 2. Risk assessment index system for track maintenance operations.
Applsci 15 07614 g002
Figure 3. Cloud model diagram of risk assessment indices for track maintenance operations.
Applsci 15 07614 g003
Figure 4. Schematic of Lanzhou–Xinjiang railway line and maintenance operation locations.
Applsci 15 07614 g004
Figure 5. Comparison of subjective, objective, and combined weights.
Applsci 15 07614 g005
Table 1. Criteria for the values of prominent influence coefficients.
λ i ValueMeaning
1.5Indicates that the evaluation index has no prominent influence
2.5Indicates that the evaluation index has a slightly prominent influence
3.5Indicates that the evaluation index has an obviously prominent influence
4.5Indicates that the evaluation index has a strongly prominent influence
5.5Indicates that the evaluation index has an extremely prominent influence
2.0, 3.0, 4.0, 5.0The median values of adjacent values, indicating a prominent influence between two adjacent values influence.
Table 2. Risk level classification of the risk assessment indices for railway track maintenance operations.
First-Level IndexSecond-Level IndexRisk Level
IIIIIIIV
Human Factors B 1 Professional quality of operating personnel (score) B 11 [60,70)[70,80)[80,90)[90,100]
Professional quality of protective personnel (score) B 12 [60,70)[70,80)[80,90)[90,100]
Professional quality of automobile drivers (years) B 13 [0,5)[5,10)[10,20)[20,40]
Proportion of newly hired or outsourced personnel (%) B 14 [0.4,1][0.2,0.4)[0.1,0.2)[0,0.1)
Equipment Factors B 2 Condition of tools and equipment (score) B 21 [60,70)[70,80)[80,90)[90,100]
Condition of communication equipment (maintenance frequency/year) B 22 [0,3)[3,6)[6,9)[9,12]
Environment factors B 3 Sections with poor communication (score)  B 31 [60,70)[70,80)[80,90)[90,100]
Visibility conditions (score) B 32 [60,70)[70,80)[80,90)[90,100]
Weather conditions (score) B 33 [60,70)[70,80)[80,90)[90,100]
Operating lighting conditions (score) B 34 [60,70)[70,80)[80,90)[90,100]
Road environment (score) B 35 [60,70)[70,80)[80,90)[90,100]
Management factors B 4 Safety education and training (score) B 41 [60,70)[70,80)[80,90)[90,100]
Safety protection measures (score) B 42 [60,70)[70,80)[80,90)[90,100]
Construction organization plan (score) B 43 [60,70)[70,80)[80,90)[90,100]
Emergency management measures (score) B 44 [60,70)[70,80)[80,90)[90,100]
Table 3. Numerical characteristics of cloud model for risk assessment index of track maintenance operations.
First-Level IndexSecond-Level IndexRisk Level
IIIIIIIV
B 1 B 11 (65, 1.667, 0.167)(75, 1.667, 0.167)(85, 1.667, 0.167)(95, 1.667, 0.167)
B 12 (65, 1.667, 0.167)(75, 1.667, 0.167)(85, 1.667, 0.167)(95, 1.667, 0.167)
B 13 (2.5, 0.833, 0.083)(7.5, 0.833, 0.083)(15, 1.667, 0.167)(30, 3.333, 0.333)
B 14 (0.7, 0.1, 0.01)(0.3, 0.033, 0.003)(0.15, 0.017, 0.002)(0.05, 0.017, 0.002)
B 2 B 21 (65, 1.667, 0.167)(75, 1.667, 0.167)(85, 1.667, 0.167)(95, 1.667, 0.167)
B 22 (1.5, 0.5, 0.05)(4.5, 0.5, 0.05)(7.5, 0.5, 0.05)(10.5, 0.5, 0.05)
B 3 B 31 (65, 1.667, 0.167)(75, 1.667, 0.167)(85, 1.667, 0.167)(95, 1.667, 0.167)
B 32 (65, 1.667, 0.167)(75, 1.667, 0.167)(85, 1.667, 0.167)(95, 1.667, 0.167)
B 33 (65, 1.667, 0.167)(75, 1.667, 0.167)(85, 1.667, 0.167)(95, 1.667, 0.167)
B 34 (65, 1.667, 0.167)(75, 1.667, 0.167)(85, 1.667, 0.167)(95, 1.667, 0.167)
B 35 (65, 1.667, 0.167)(75, 1.667, 0.167)(85, 1.667, 0.167)(95, 1.667, 0.167)
B 4 B 41 (65, 1.667, 0.167)(75, 1.667, 0.167)(85, 1.667, 0.167)(95, 1.667, 0.167)
B 42 (65, 1.667, 0.167)(75, 1.667, 0.167)(85, 1.667, 0.167)(95, 1.667, 0.167)
B 43 (65, 1.667, 0.167)(75, 1.667, 0.167)(85, 1.667, 0.167)(95, 1.667, 0.167)
B 44 (65, 1.667, 0.167)(75, 1.667, 0.167)(85, 1.667, 0.167)(95, 1.667, 0.167)
Table 4. Risk assessment samples for track maintenance operations.
Operation No.Operation TimeOperation PositionsOperation Types
A 1 From 18:20 to 21:20 on 16 October 2024Upward direction, K514+500-K513+950, K512+850-K503+600Large machine grinding
A 2 From 1:10 to 4:40 on 16 May 2024Huangyangzhen Railway StationLarge machine screening
A 3 From 21:30 on 13 March 2025
to 0:30 on 14 March 2025
No. 3 turnout at Jieheba Railway StationFrog replacement
A 4 From 0:30 to 4:30 on 4 July 2024Upward direction, K238+400-K238+470Manual tamping
A 5 From 2:55 to 6:25 on 15 December 2024Downward direction, K455+650-K456+450Rail replacement
Table 5. Risk index values for track maintenance operations.
Operation No.B11B12B13B14B21B22B31B32B33B34B35B41B42B43B44
A 1 8577.5130.6796.68477.584888269759592
A 2 8978240.466778.57.2818689838575778387
A 3 76.587100.4167877.5858385808670798580
A 4 9088260.2897.8898796898781859288
A 5 9392220.18888.4899094858884909398
Table 6. Quantification of the sequence and degree of importance of risk assessment indices.
First-Level Index SequenceQuantification of the Importance Degree of First-Level IndexesSecond-Level Index SequenceQuantification of the Importance Degree of Second-Level Indexes
B 1 > B 4 > B 2 > B 3 1.3 ,   1.4 ,   1.2 B 12 > B 14 > B 13 > B 11 1.4 ,   1.3 ,   1.1
B 21 > B 22 1.3
B 31 > B 32 > B 35 > B 33 > B 34 1.2 ,   1.6 ,   1.2 ,   1.1
B 13 > B 11 > B 12 > B 14 1.3 ,   1.1 ,   1.2
Table 7. Weights of the risk assessment indices for railway maintenance operations.
First-Level IndexSubjective WeightObjective WeightCombined WeightSecond-Level IndexSubjective WeightObjective WeightCombined Weight
B 1 0.3600.3880.377 B 11 0.0650.0900.080
B 12 0.1300.0950.109
B 13 0.0720.0740.073
B 14 0.0930.1290.115
B 2 0.1980.0710.121 B 21 0.1120.0600.081
B 22 0.0860.0110.041
B 3 0.1640.1760.172 B 31 0.0520.0260.036
B 32 0.0430.0510.048
B 33 0.0220.0570.044
B 34 0.0200.0300.027
B 35 0.0270.0120.018
B 4 0.2770.3630.330 B 41 0.0700.1230.102
B 42 0.0630.0930.082
B 43 0.0910.0570.070
B 44 0.0530.0900.076
Table 8. Values of membership degree matrices Q 1 Q 4 for maintenance operations A 1 .
Risk LevelB11B12B13B14B21B22B31B32B33B34B35B41B42B43B44
I0000.99800000000.962000
II0100.0020.9610.00201000.0020.038100
III10100.0390.9981010.9980.9980000.002
IV0000000000.00200010.998
Table 9. Values of fuzzy evaluation matrices S 1 S 4 for maintenance operation A 1 .
Risk LevelB11B12B13B14B21B22B31B32B33B34B35B41B42B43B44
I1112.71311111112.617111
II12.71811.0022.6141.00212.718111.0021.0392.71811
III2.71812.71811.042.7132.71812.7182.7132.7131111.002
IV1111111111.0021112.7182.713
Table 10. Comparison of the risk evaluation results of nonlinear and linear FCE.
Operation No.Nonlinear FCELinear FCE
Risk Evaluation Result VectorRisk LevelRisk Evaluation Result VectorRisk Level
A 1 (0.252, 0.257, 0.248, 0.242)Relatively large risk (II)(0.213, 0.32, 0.321, 0.146)General risk (III)
A 2 (0.244, 0.263, 0.254, 0.239)Relatively large risk (II)(0.103, 0.386, 0.433, 0.078)General risk (III)
A 3 (0.245, 0.256, 0.263, 0.237)General risk (III)(0.124, 0.338, 0.538, 0)General risk (III)
A 4 (0.237, 0.240, 0.277, 0.245)General risk (III)(0, 0.06, 0.707, 0.233)General risk (III)
A 5 (0.236, 0.236, 0.264, 0.263)General risk (III)(0, 0, 0.484, 0.515)Minor risk (IV)
Disclaimer/Publisher’s Note: The statements, opinions and data contained in all publications are solely those of the individual author(s) and contributor(s) and not of MDPI and/or the editor(s). MDPI and/or the editor(s) disclaim responsibility for any injury to people or property resulting from any ideas, methods, instructions or products referred to in the content.

