
AutoStageMix: Fully Automated Stage Cross-Editing System Utilizing Facial Features

Abstract
1. Introduction
2. Related Works
2.1. Cross-Editing Video Generation
2.2. Feature Extraction Techniques
2.3. Video Editing Techniques
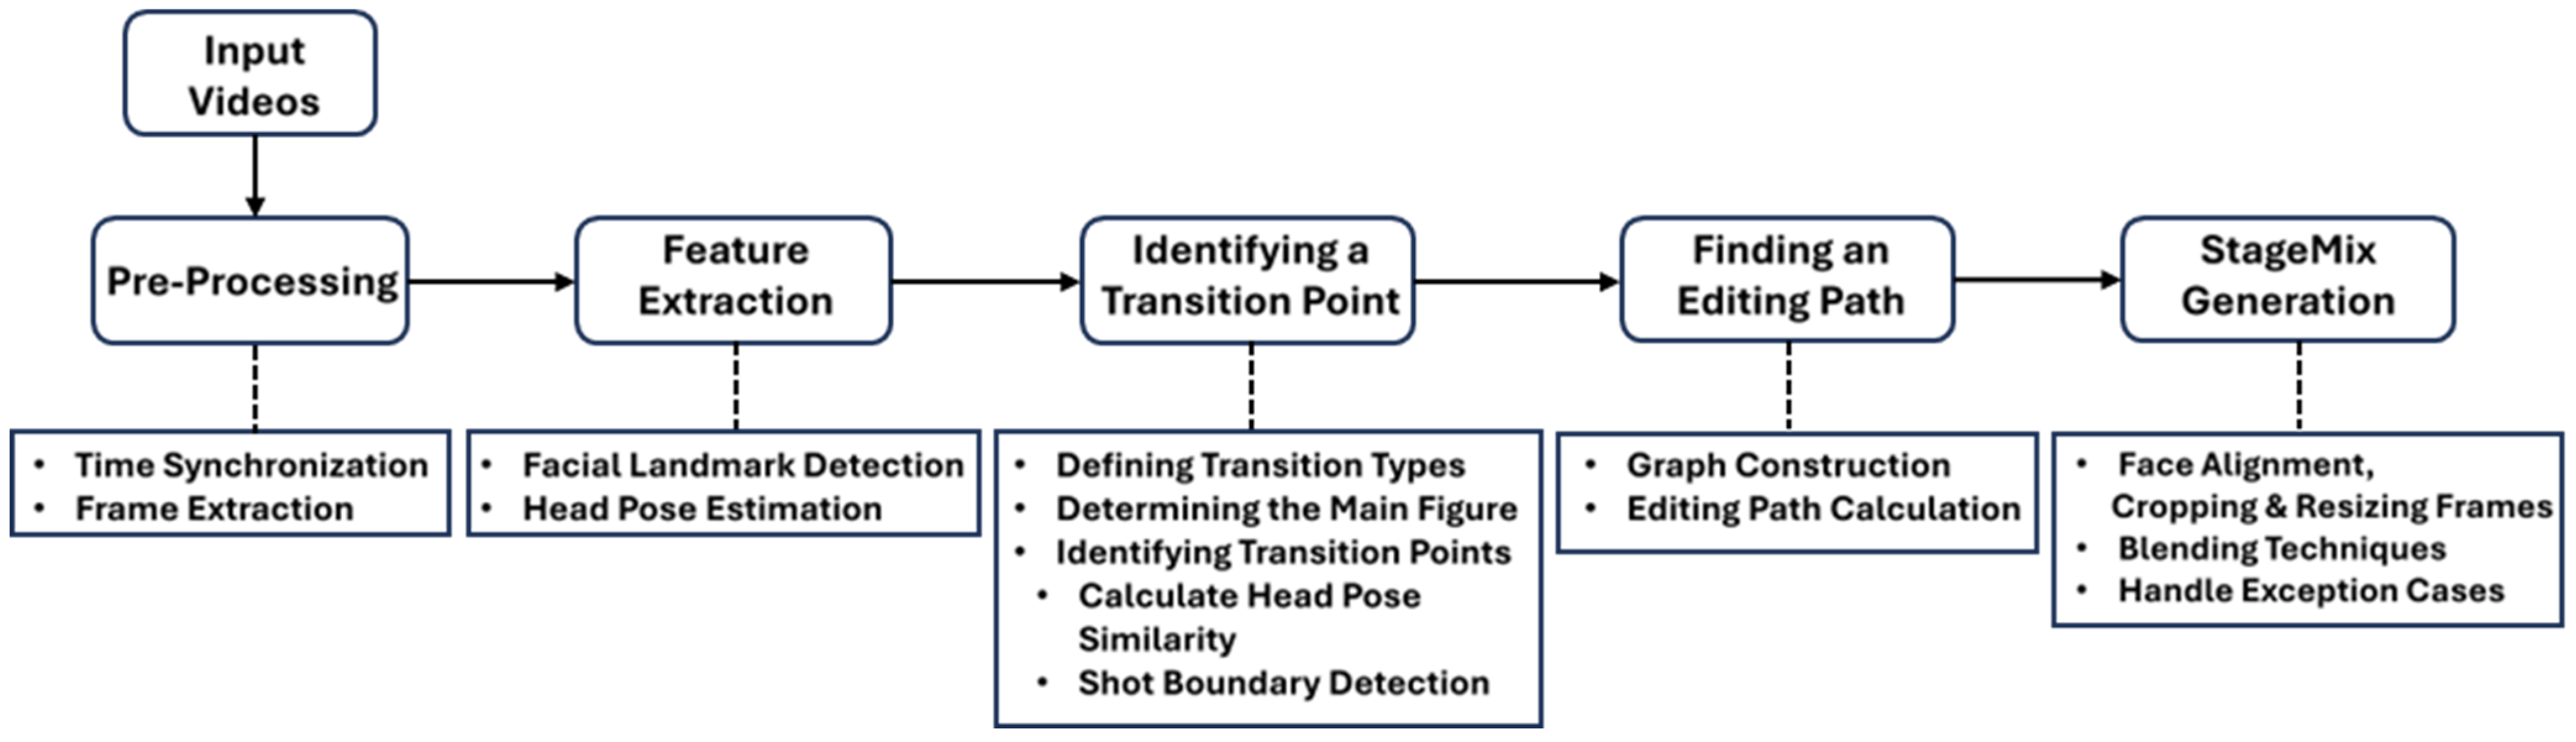
3. AutoStageMix
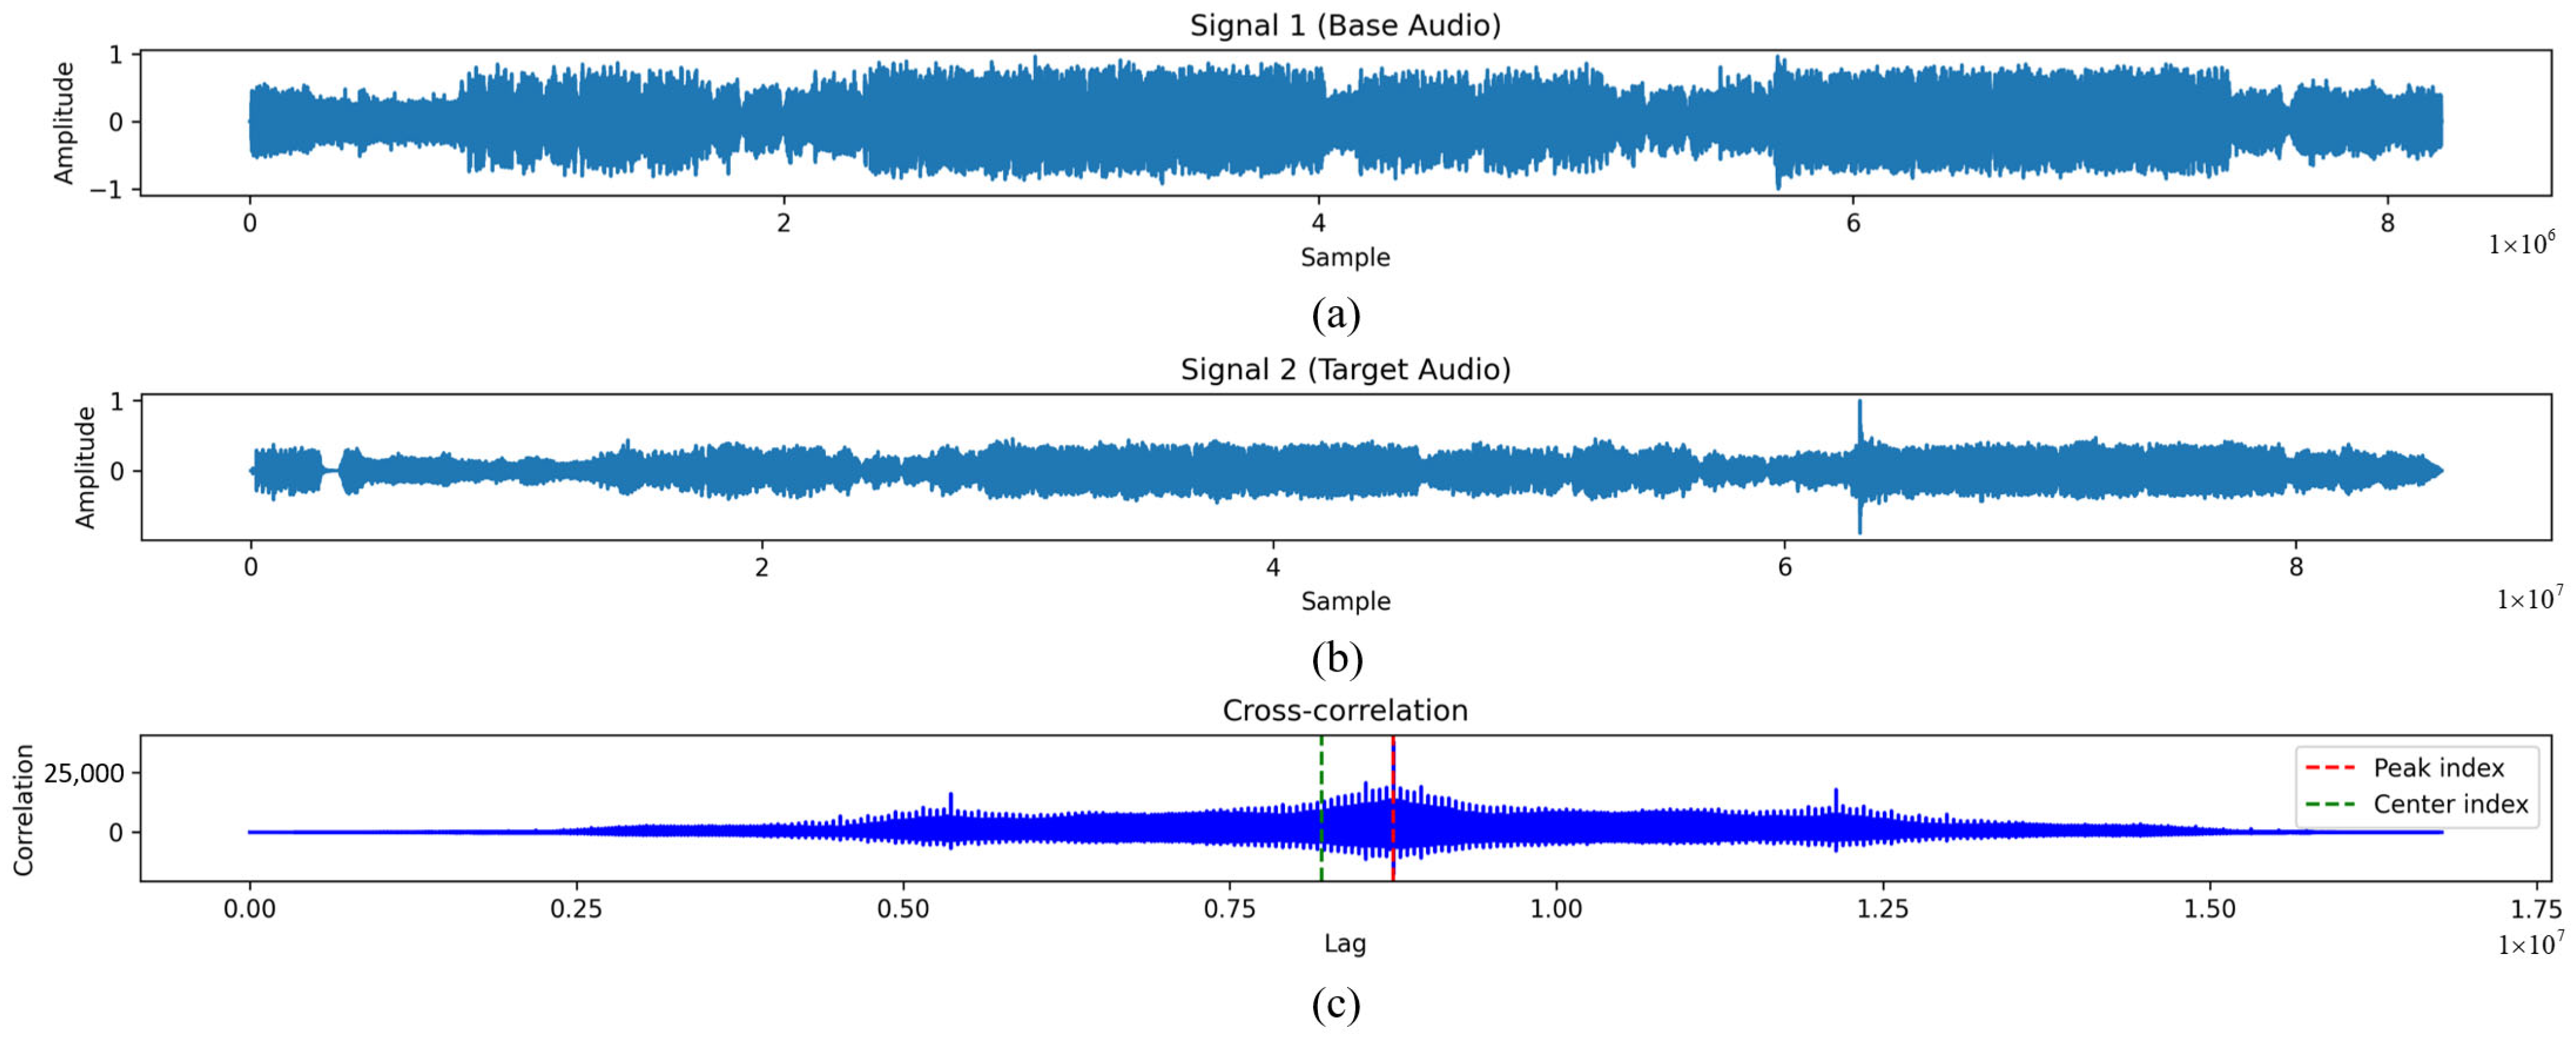
3.1. Preprocessing
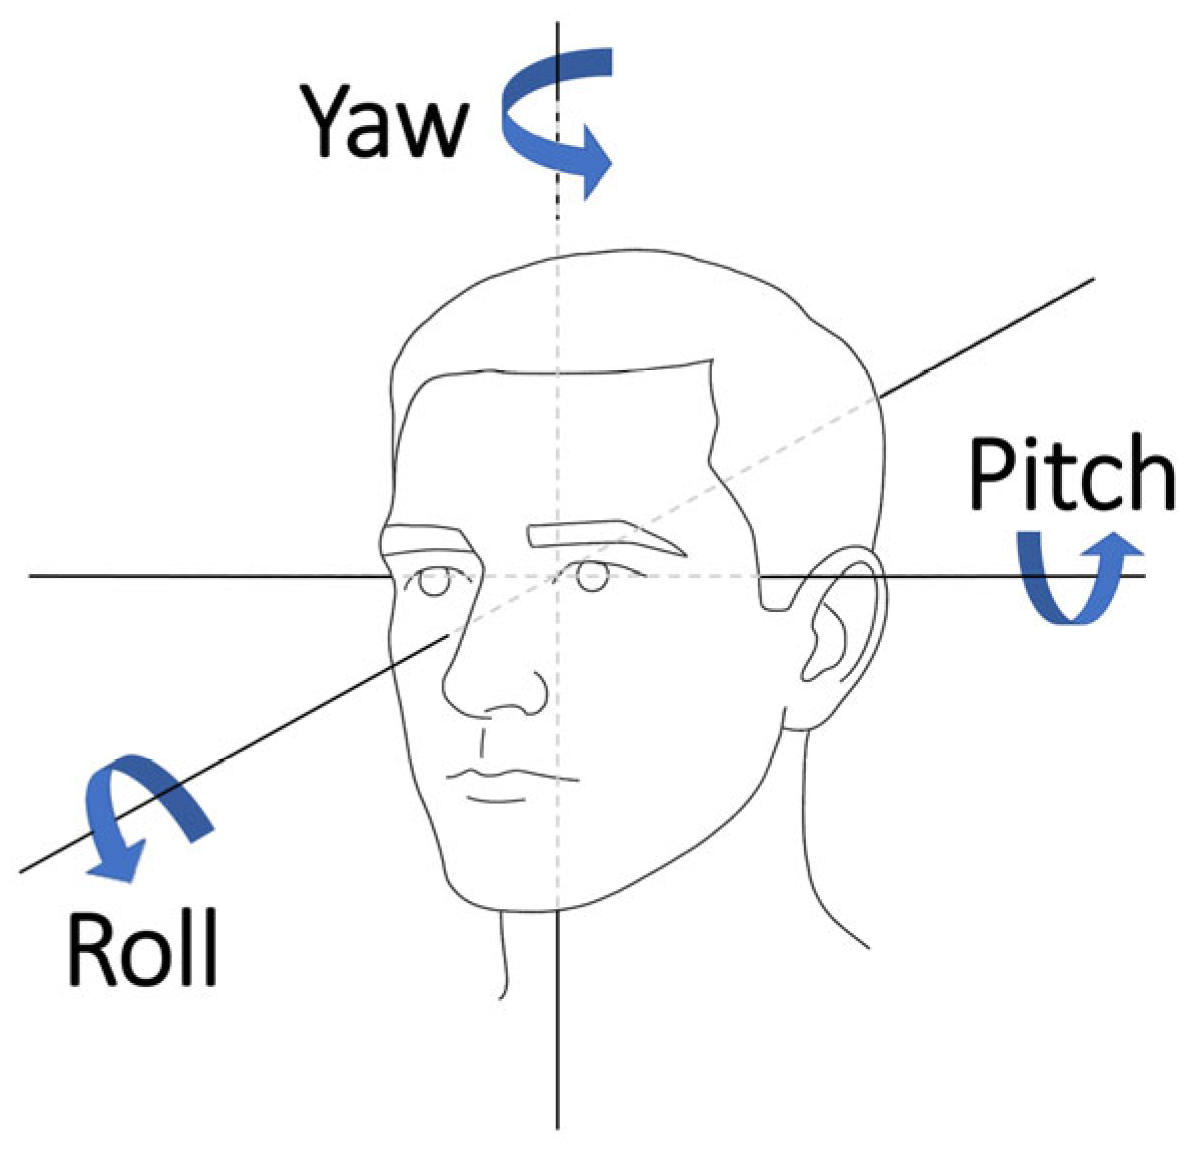
3.2. Feature Extraction
3.3. Identifying a Transition Point
3.3.1. Defining Transition Types
3.3.2. Determining the Main Figure in the Frame
3.3.3. FBT
3.3.4. INTER-C
3.3.5. INTRA-C and None
3.4. Editing Path Determination
3.4.1. Representing Frames and Transitions as a Graph Structure
3.4.2. Calculating the Editing Path
3.5. StageMix Generation
3.5.1. Extracting Landmarks and Aligning Faces
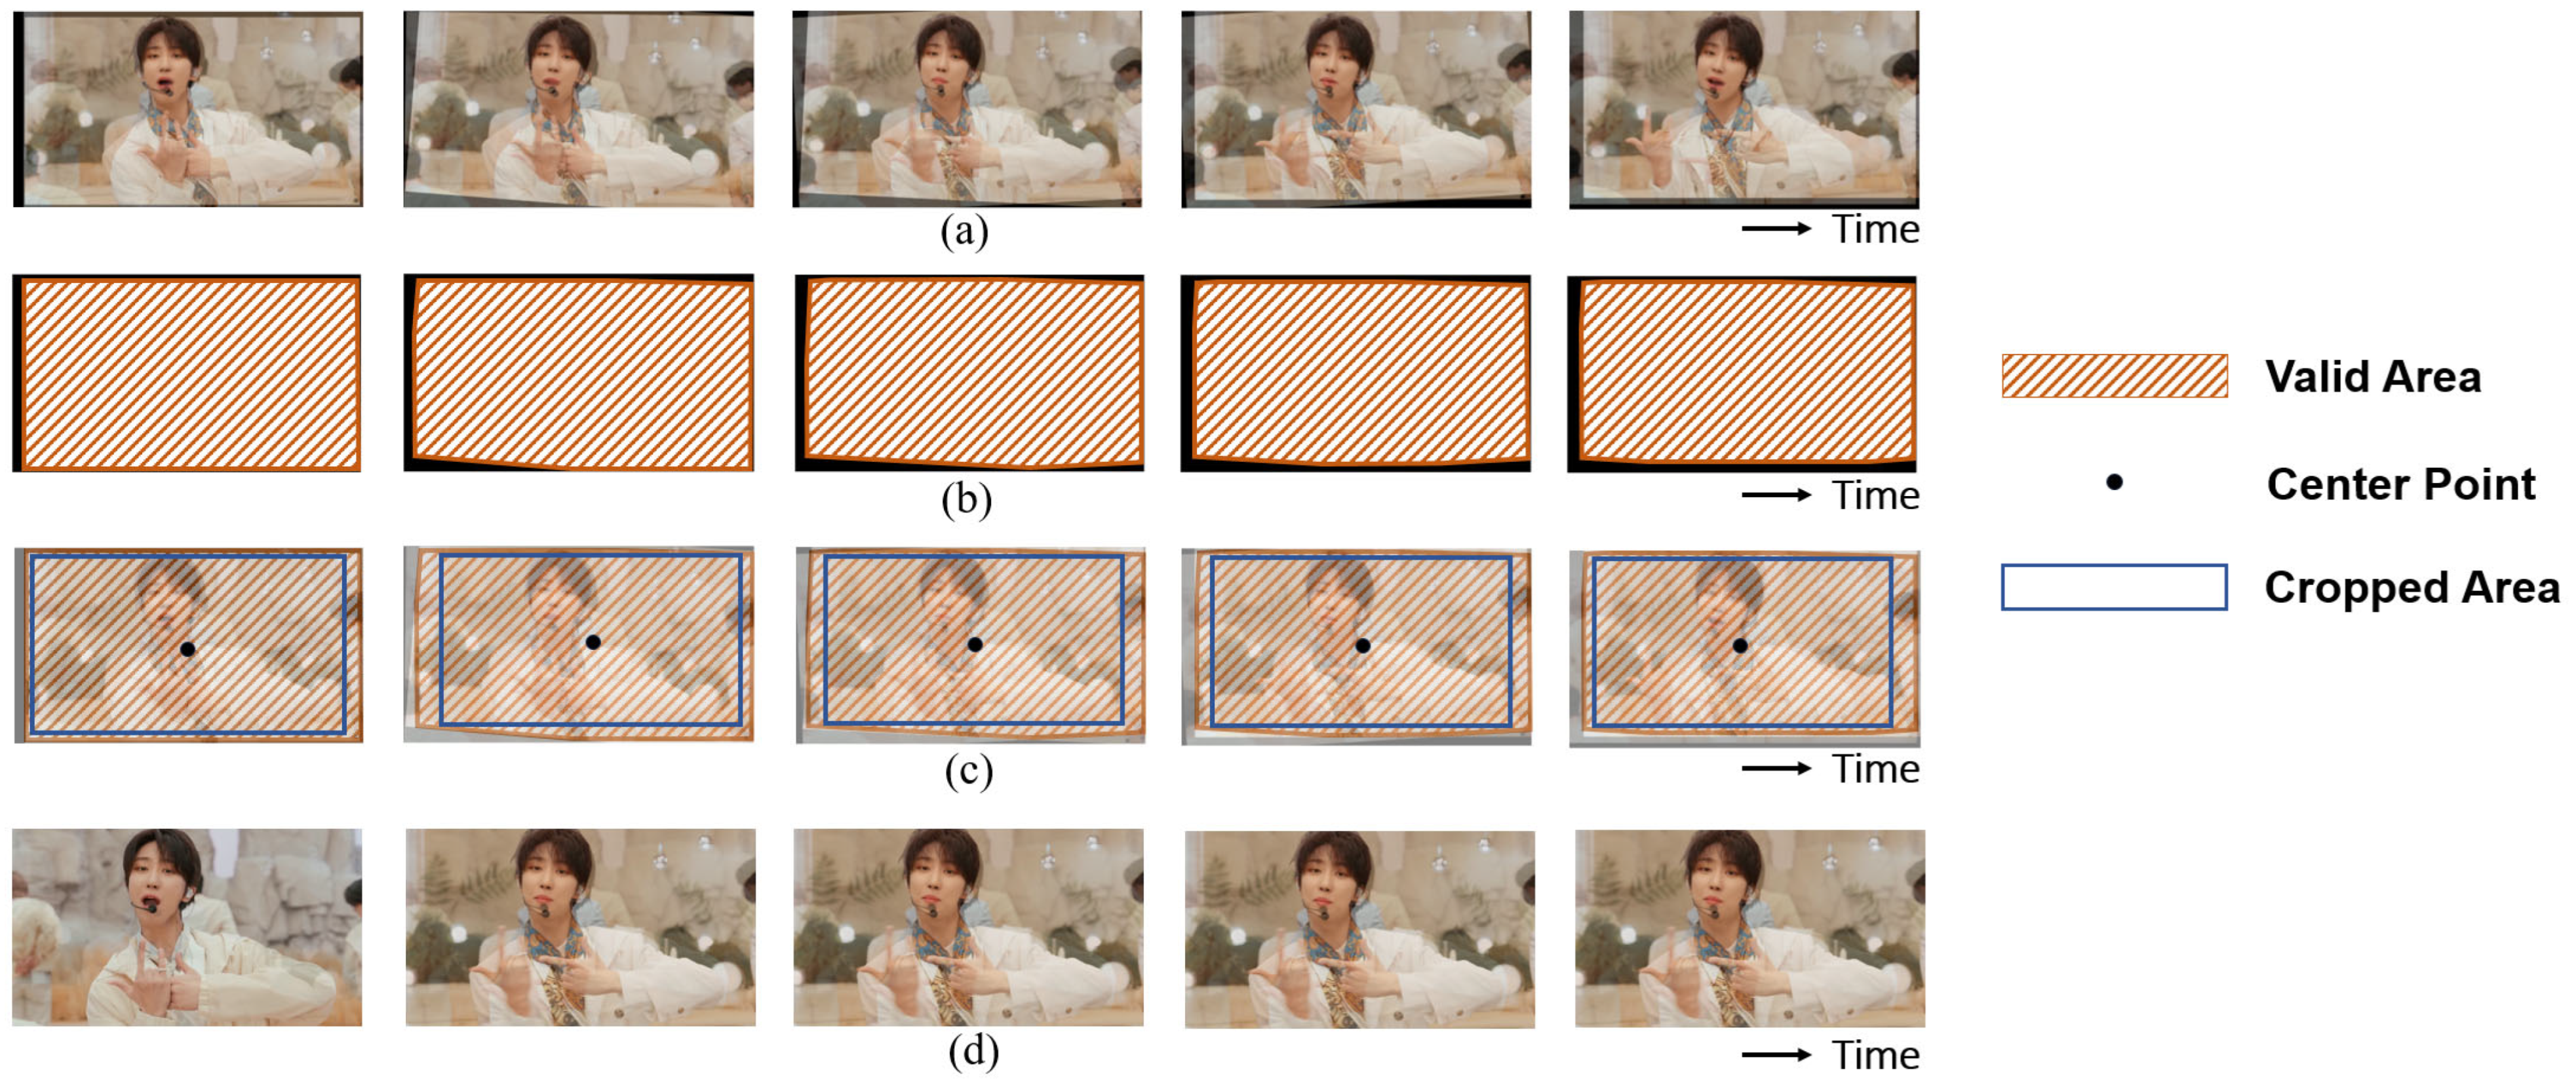
3.5.2. Cropping and Resizing Without Black Pixels
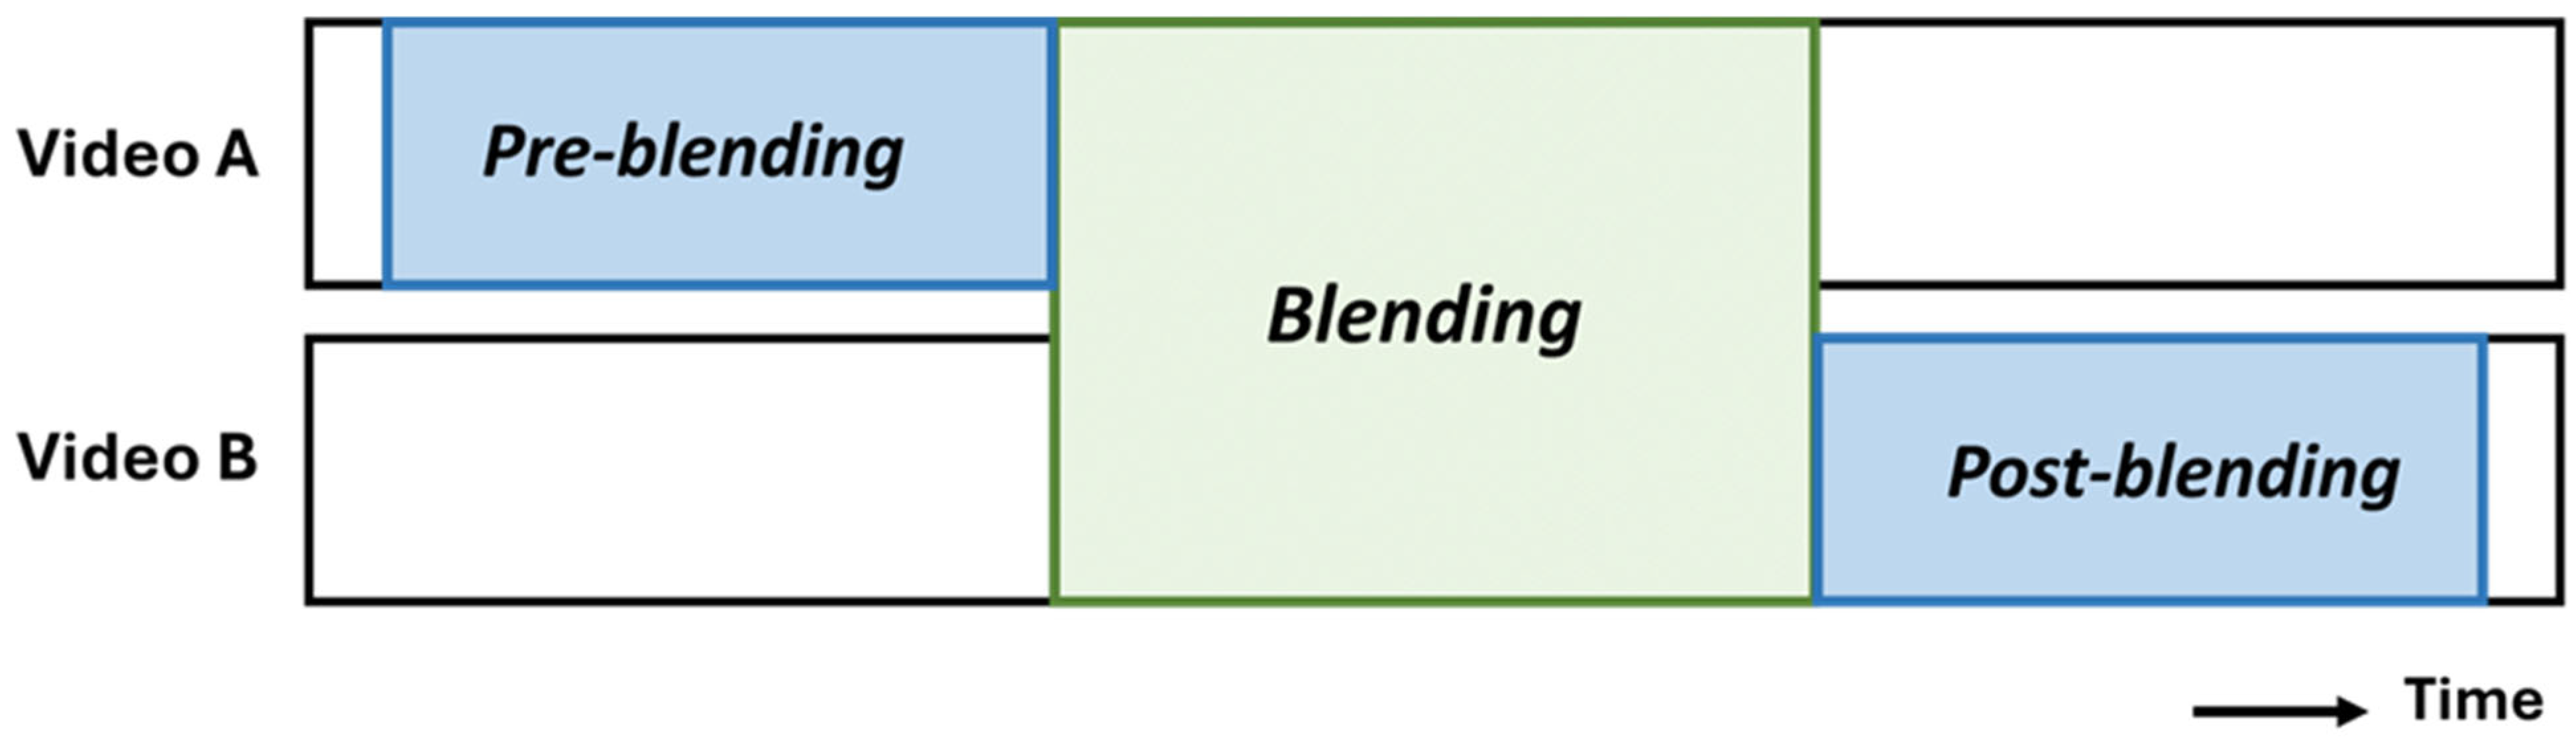
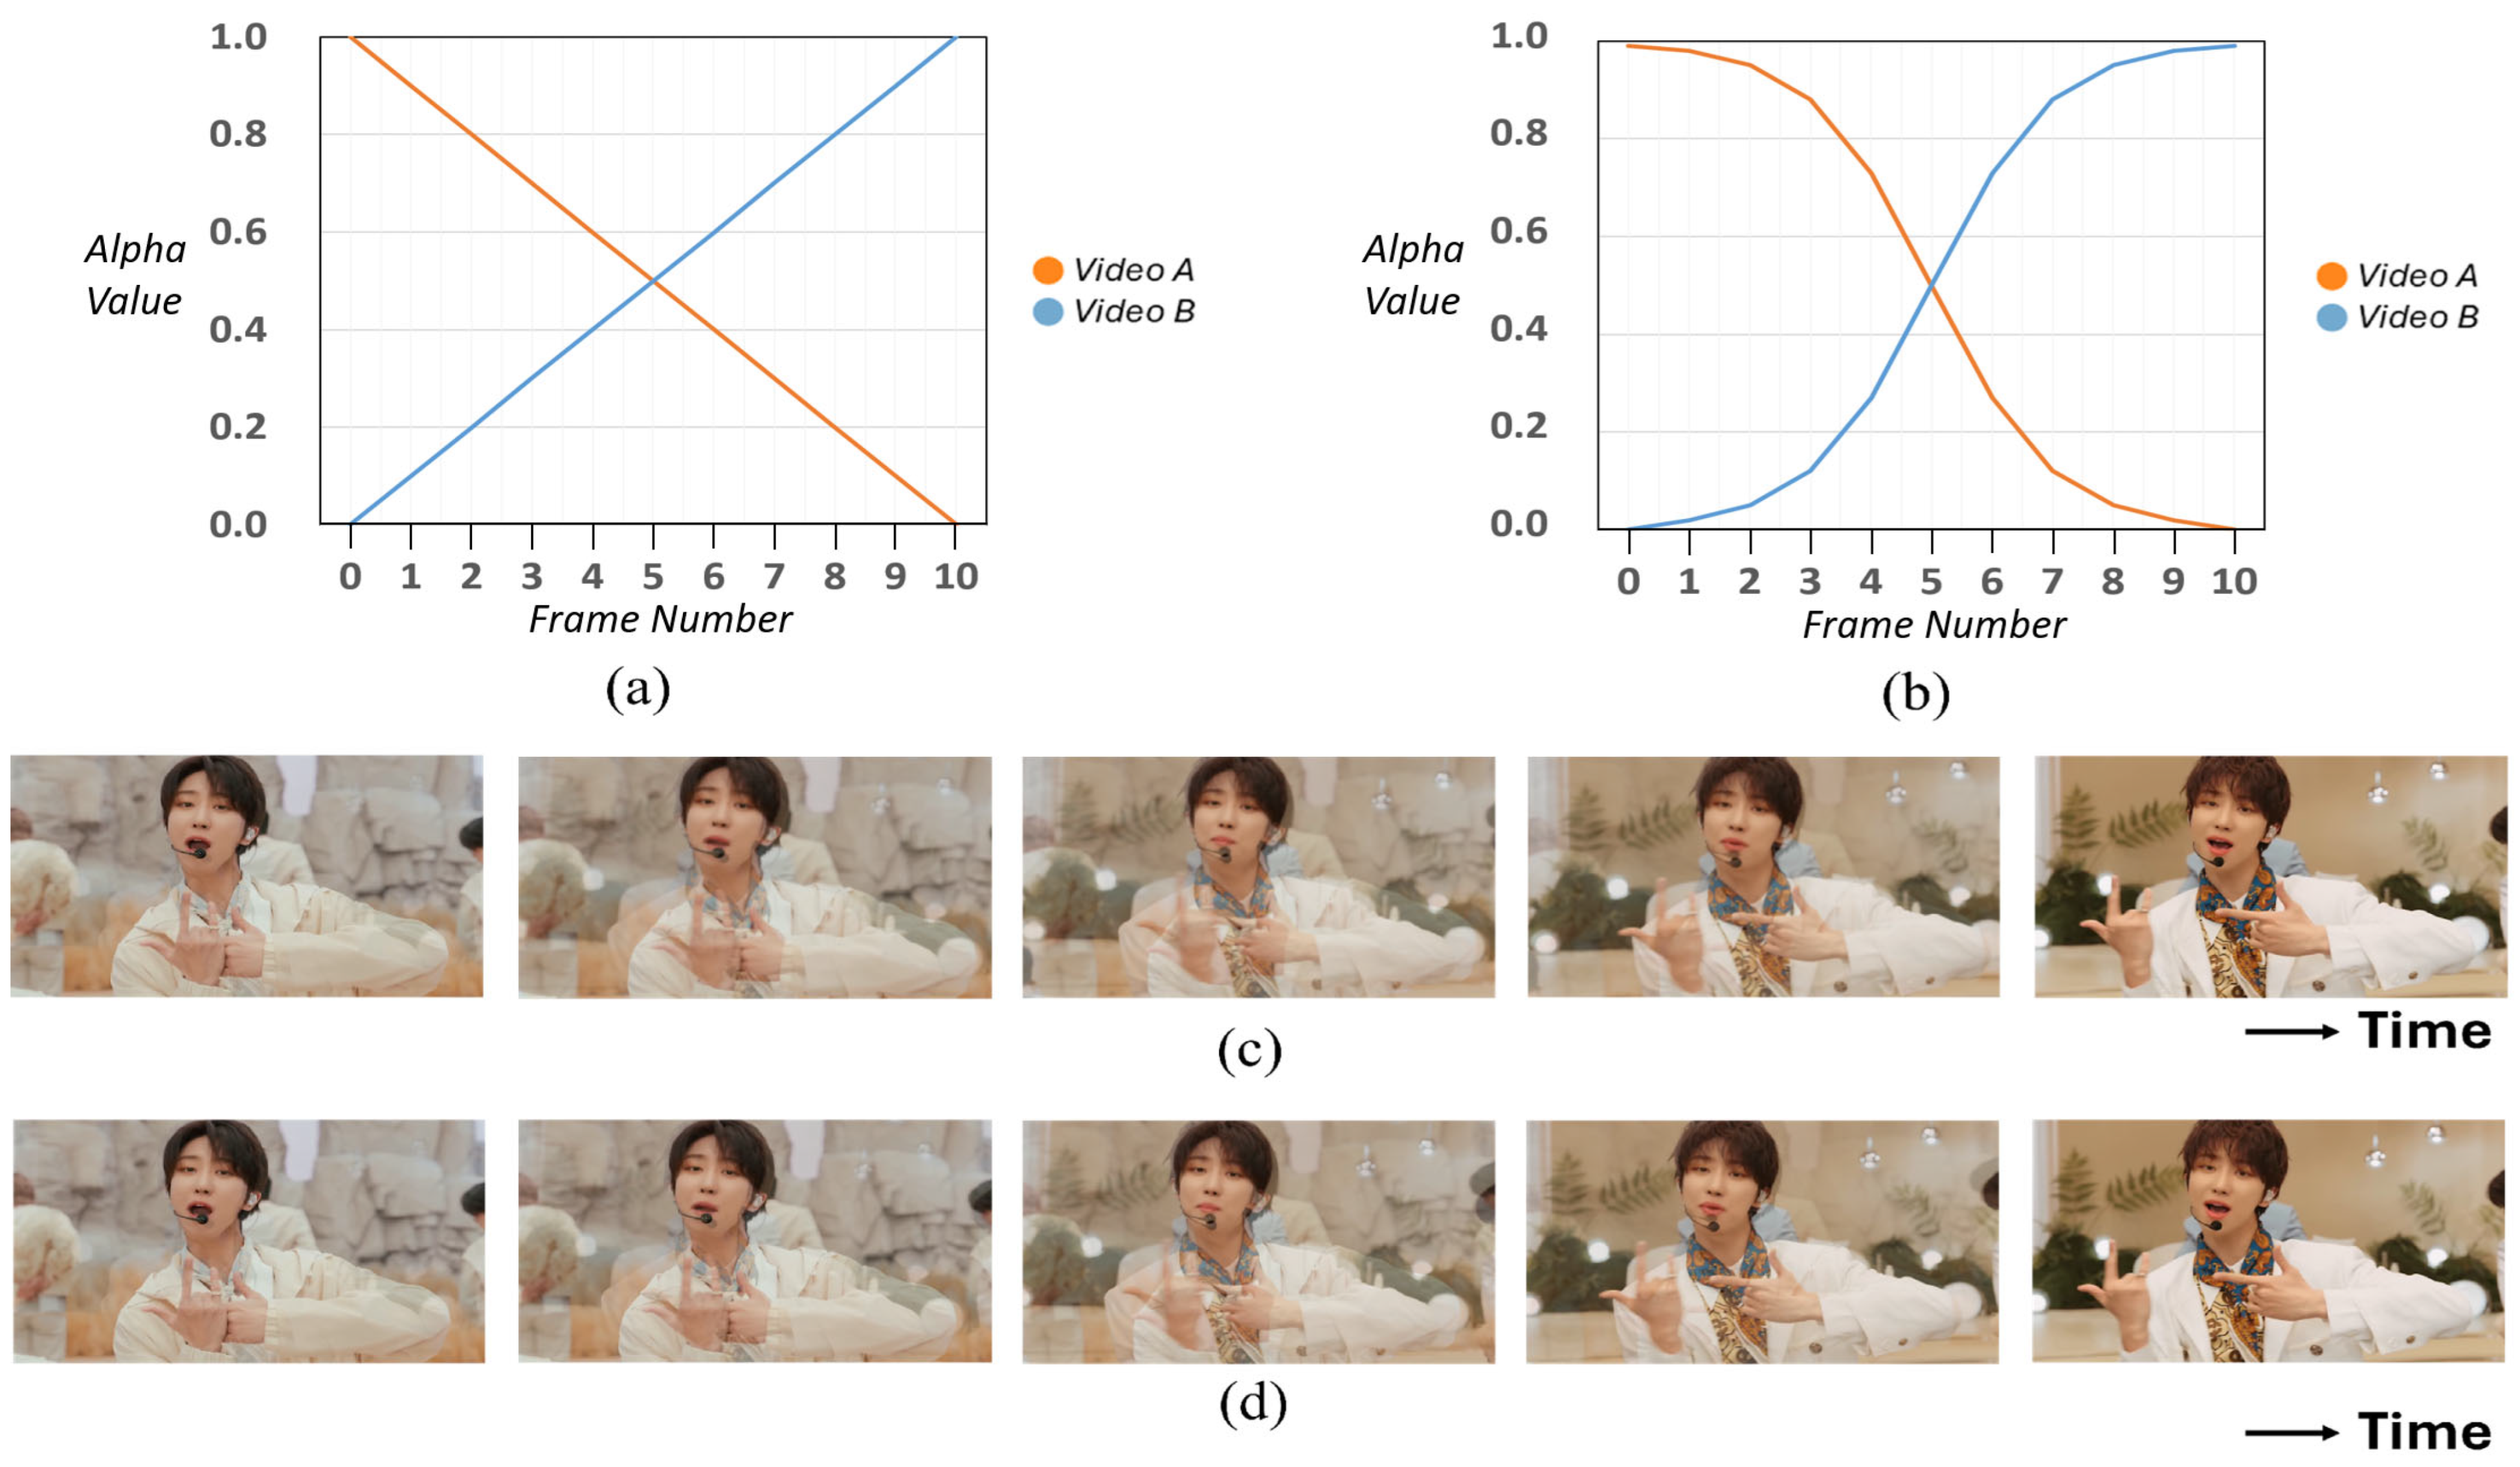
3.5.3. Alpha Blending
3.5.4. Pre-Blending and Post-Blending
3.5.5. Cases of Restricting FBT
4. Experimental Results
4.1. Quantitative Evaluations
4.1.1. Shot Detection Results
4.1.2. Normalized Mean Error (NME)
4.1.3. Influence of User Parameters on the Number of Transitions
4.1.4. Computational Efficiency
4.2. User Study
5. Conclusions and Discussion
Author Contributions
Funding
Institutional Review Board Statement
Informed Consent Statement
Data Availability Statement
Conflicts of Interest
References
- Jung, M.; Lee, S.; Sim, E.S.; Jo, M.H.; Lee, Y.J.; Choi, H.B.; Kwon, J. Stagemix video generation using face and body keypoints detection. Multimed. Tools Appl. 2022, 81, 38531–38542. [Google Scholar] [CrossRef]
- Lee, D.; Yoo, J.E.; Cho, K.; Kim, B.; Im, G.; Noh, J. PopStage: The Generation of Stage Cross-Editing Video Based on Spatio-Temporal Matching. ACM Trans. Graph. 2022, 41, 1–13. [Google Scholar] [CrossRef]
- Shrestha, P.; de With, P.H.; Weda, H.; Barbieri, M.; Aarts, E.H. Automatic mashup generation from multiple-camera concert recordings. In Proceedings of the 18th ACM International Conference on Multimedia, Firenze, Italy, 25–29 October 2010. [Google Scholar] [CrossRef]
- Achary, S.; Girmaji, R.; Deshmukh, A.A.; Gandhi, V. Real Time GAZED: Online Shot Selection and Editing of Virtual Cameras from Wide-Angle Monocular Video Recordings. In Proceedings of the IEEE/CVF Winter Conference on Applications of Computer Vision, Waikoloa, HI, USA, 4–8 January 2024. [Google Scholar] [CrossRef]
- Girmaji, R.; Beri, B.; Subramanian, R.; Gandhi, V. EditIQ: Automated Cinematic Editing of Static Wide-Angle Videos via Dialogue Interpretation and Saliency Cues. In Proceedings of the 30th International Conference on Intelligent User Interfaces, Cagliari, Italy, 24–27 March 2025. [Google Scholar] [CrossRef]
- Kazemi, V.; Sullivan, J. One Millisecond Face Alignment with an Ensemble of Regression Trees. In Proceedings of the IEEE Conference on Computer Vision and Pattern Recognition, Columbus, OH, USA, 23–28 June 2014. [Google Scholar] [CrossRef]
- Taigman, Y.; Yang, M.; Ranzato, M.A.; Wolf, L. Deepface: Closing the Gap to Human-Level Performance in Face Verification. In Proceedings of the IEEE Conference on Computer Vision and Pattern Recognition, Columbus, OH, USA, 23–28 June 2014. [Google Scholar] [CrossRef]
- Zhang, K.; Zhang, Z.; Li, Z.; Qiao, Y. Joint Face Detection and Alignment Using Multitask Cascaded Convolutional Networks. IEEE Signal Process. Lett. 2016, 23, 1499–1503. [Google Scholar] [CrossRef]
- Deng, J.; Guo, J.; Zhou, Y.; Yu, J.; Kotsia, I.; Zafeiriou, S. Retinaface: Single-stage Dense Face Localisation in the Wild. arXiv 2019, arXiv:1905.00641. [Google Scholar]
- Ruiz, N.; Chong, E.; Rehg, J.M. Fine-Grained Head Pose Estimation without Keypoints. In Proceedings of the IEEE Conference on Computer Vision and Pattern Recognition Workshops, Salt Lake City, UT, USA, 18–23 June 2018. [Google Scholar] [CrossRef]
- Li, X.; Zhang, D.; Li, M.; Lee, D.-J. Accurate Head Pose Estimation Using Image Rectification and a Lightweight Convolutional Neural Network. IEEE Trans. Multimed. 2023, 25, 2239–2251. [Google Scholar] [CrossRef]
- Prados-Torreblanca, A.; Buenaposada, J.M.; Baumela, L. Shape preserving facial landmarks with graph attention networks. arXiv 2022, arXiv:2210.07233. [Google Scholar]
- Zhu, X.; Lei, Z.; Liu, X.; Shi, H.; Li, S.Z. Face Alignment Across Large Poses: A 3D Solution. In Proceedings of the IEEE Conference on Computer Vision and Pattern Recognition, Las Vegas, NV, USA, 27–30 June 2016. [Google Scholar] [CrossRef]
- Parkhi, O.; Vedaldi, A.; Zisserman, A. Deep Face Recognition. In Proceedings of the British Machine Vision Conference (BMVC), Swansea, UK, 7–10 September 2015. [Google Scholar] [CrossRef]
- Schroff, F.; Kalenichenko, D.; Philbin, J. Facenet: A Unified Embedding for Face Recognition and Clustering. In Proceedings of the IEEE Conference on Computer Vision and Pattern Recognition, Boston, MA, USA, 7–12 June 2015. [Google Scholar] [CrossRef]
- Smith, T.J. An Attentional Theory of Continuity Editing. Ph.D. Thesis, University of Edinburgh, Edinburgh, UK, 2006. [Google Scholar]
- Magliano, J.P.; Zacks, J.M. The Impact of Continuity Editing in Narrative Film on Event Segmentation. Cogn. Sci. 2011, 35, 1489–1517. [Google Scholar] [CrossRef] [PubMed]
- Ardizzone, E.; Gallea, R.; La Cascia, M.; Morana, M. Automatic Generation of Subject-Based Image Transitions. In Image Analysis and Processing—ICIAP 2011; Maino, G., Foresti, G.L., Eds.; Lecture Notes in Computer Science; Springer: Berlin/Heidelberg, Germany, 2011; Volume 6978, pp. 237–246. [Google Scholar] [CrossRef]
- Bendraou, Y.; Essannouni, F.; Aboutajdine, D.; Salam, A. Video shot boundary detection method using histogram differences and local image descriptor. In Proceedings of the 2014 Second World Conference on Complex Systems (WCCS), Agadir, Morocco, 10–12 November 2014. [Google Scholar] [CrossRef]
- Radwan, N.I.; Salem, N.M.; El Adawy, M.I. Histogram Correlation for Video Scene Change Detection. In Advances in Computer Science, Engineering & Applications; Wyld, D., Zizka, J., Nagamalai, D., Eds.; Advances in Intelligent and Soft Computing; Springer: Berlin/Heidelberg, Germany, 2012; Volume 166, pp. 765–773. [Google Scholar] [CrossRef]
- Gygli, M. Ridiculously Fast Shot Boundary Detection with Fully Convolutional Neural Networks. In Proceedings of the 2018 International Conference on Content-Based Multimedia Indexing (CBMI), La Rochelle, France, 4–6 September 2018. [Google Scholar] [CrossRef]
- Thakar, N.; Panchal, P.I.; Patel, U.; Chaudhari, K.; Sangada, S. Analysis and Verification of Shot Boundary Detection in Video using Block Based χ2 Histogram Method. In Proceedings of the International Conference on Advanced Computing, Communication and Networks, Chandigarh, India, 3 June 2011. [Google Scholar] [CrossRef]
- Dijkstra, E. A note on two problems in connexion with graphs. Num. Math. 1959, 1, 269–271. [Google Scholar] [CrossRef]
- Knapp, C.; Carter, G. The Generalized Correlation Method for Estimation of Time Delay. IEEE Trans. Acoust. Speech Signal Process. 1976, 24, 320–327. [Google Scholar] [CrossRef]
- Bay, H.; Tuytelaars, T.; Van Gool, L. SURF: Speeded Up Robust Features. In Computer Vision—ECCV 2006; Leonardis, A., Bischof, H., Pinz, A., Eds.; Lecture Notes in Computer Science; Springer: Berlin/Heidelberg, Germany, 2006; Volume 3951, pp. 404–417. [Google Scholar] [CrossRef]
- Arev, I.; Park, H.S.; Sheikh, Y.; Hodgins, J.; Shamir, A. Automatic Editing of Footage from Multiple Social Cameras. ACM Trans. Graph. 2014, 33, 81. [Google Scholar] [CrossRef]
- Mittal, A.; Moorthy, A.K.; Bovik, A.C. No-Reference Image Quality Assessment in the Spatial Domain. IEEE Trans. Image Process. 2012, 21, 4695–4708. [Google Scholar] [CrossRef] [PubMed]
- SEVENTEEN. “Darl+ing”. Face the Sun; Pledis Entertainment: Seoul, Republic of Korea, 2022. [Google Scholar]
- SEVENTEEN. “Ready to Love”. Your Choice; Pledis Entertainment: Seoul, Republic of Korea, 2021. [Google Scholar]
- Zhu, X.; Ramanan, D. Face Detection, Pose Estimation, and Landmark Localization in the Wild. In Proceedings of the 2012 IEEE Conference on Computer Vision and Pattern Recognition, Providence, RI, USA, 16–21 June 2012. [Google Scholar] [CrossRef]
- Sagonas, C.; Tzimiropoulos, G.; Zafeiriou, S.; Pantic, M. 300 Faces in-the-Wild Challenge: The First facial landmark localization Challenge. In Proceedings of the IEEE International Conference on Computer Vision Workshops, Sydney, NSW, Australia, 2–8 December 2013. [Google Scholar] [CrossRef]
- Gower, J.C. Generalized procrustes analysis. Psychometrika 1975, 40, 33–51. [Google Scholar] [CrossRef]
- SEVENTEEN. “God of Music”. Seventeenth Heaven; Pledis Entertainment: Seoul, Republic of Korea, 2023. [Google Scholar]
- Kruskal, W.H.; Wallis, W.A. Use of ranks in one-criterion variance analysis. J. Am. Stat. Assoc. 1952, 47, 583–621. [Google Scholar] [CrossRef]
- Wald, A.; Wolfowitz, J. On a test whether two samples are from the same population. Ann. Math. Stat. 1940, 11, 147–162. [Google Scholar] [CrossRef]
- Bonferroni, C. Teoria statistica delle classi e calcolo delle probabilita. Pubbl. R Ist. Super. Sci Econ. Commer. Firenze 1936, 8, 3–62. [Google Scholar]
- IVE. “HEYA”. IVE Switch; Starship Entertainment: Seoul, Republic of Korea, 2024. [Google Scholar]
- NewJeans. “Hype Boy”. New Jeans; ADOR: Seoul, Republic of Korea, 2022. [Google Scholar]
- AESPA. “Supernova”. Armageddon; SM Entertainment: Seoul, Republic of Korea, 2024. [Google Scholar]


| Video #1 | Video #2 | Video #3 | Video #4 | Video #5 | Mean | |
|---|---|---|---|---|---|---|
| Precision | 1 | 1 | 0.828 | 0.624 | 1 | 0.890 |
| Recall | 0.857 | 0.935 | 0.828 | 0.869 | 0.679 | 0.834 |
| F1-Score | 0.923 | 0.967 | 0.828 | 0.726 | 0.808 | 0.850 |
| Video | Jung et al. [1] | Lee et al. [2] | Our Method |
|---|---|---|---|
| Darl+ing [28] | 90 | 1730 | 454 |
| Ready to love [29] | 28 | 53 | 17 |
| God of Music [33] | 23 | 697 | 156 |
| Song | Method | Mean NME |
|---|---|---|
| Darl+ing [28] | Jung et al. [1] | 0.1272 |
| Lee et al. [2] | 0.1214 | |
| Our method | 0.0542 | |
| Ready to love [29] | Jung et al. [1] | 0.2038 |
| Lee et al. [2] | 0.1256 | |
| Our method | 0.1087 | |
| God of Music [33] | Jung et al. [1] | 0.3086 |
| Lee et al. [2] | 0.1441 | |
| Our method | 0.0880 |
| Song | Kruskal–Wallis p-Value | Jung et al. [1] vs. Lee et al. [2] (p-Value) | Jung et al. [1] vs. Our Method (p-Value) | Lee et al. [2] vs. Our Method (p-Value) |
|---|---|---|---|---|
| Darl+ing [28] | <0.001 | 0.1720 | <0.001 | <0.001 |
| Ready to love [29] | 0.0136 | 0.0165 | 0.0118 | 0.2762 |
| God of Music [33] | <0.001 | 0.0066 | <0.001 | <0.001 |
| (Frame) | FBT | INTER-C | INTRA-C | Total Number of Transitions | Average Time Interval Between Transitions (s) |
|---|---|---|---|---|---|
| 45 | 16 | 24 | 13 | 53 | 2.19 |
| 90 | 17 | 12 | 7 | 36 | 3.23 |
| 150 | 20 | 9 | 4 | 33 | 3.52 |
| 240 | 21 | 5 | 1 | 27 | 4.31 |
| Song | Pre- Processing | Feature Extraction | Identifying a Transition Point | Editing Path Determination | StageMix Generation | Total Time (s) | |
|---|---|---|---|---|---|---|---|
| RetinaFace [9] | SPIGA [12] | ||||||
| Darl+ing [28] | 258.71 | 1350.37 | 960.08 | 260.25 | 73.35 | 379.15 | 3281.91 |
| Ready to love [29] | 326.22 | 1268.96 | 571.15 | 218.72 | 6.13 | 417.47 | 2808.65 |
| God of Music [33] | 438.65 | 2769.19 | 1013.43 | 378.02 | 30.29 | 502.31 | 5131.89 |
| Group 1 (AutoStageMix) | Group 2 (Professional Editors) | |
|---|---|---|
| Mean | 4.349 | 4.143 |
| Standard Deviation | 0.716 | 0.774 |
Disclaimer/Publisher’s Note: The statements, opinions and data contained in all publications are solely those of the individual author(s) and contributor(s) and not of MDPI and/or the editor(s). MDPI and/or the editor(s) disclaim responsibility for any injury to people or property resulting from any ideas, methods, instructions or products referred to in the content. |
© 2025 by the authors. Licensee MDPI, Basel, Switzerland. This article is an open access article distributed under the terms and conditions of the Creative Commons Attribution (CC BY) license (https://creativecommons.org/licenses/by/4.0/).
Share and Cite
Oh, M.; Jang, H.; Lee, D. AutoStageMix: Fully Automated Stage Cross-Editing System Utilizing Facial Features. Appl. Sci. 2025, 15, 7613. https://doi.org/10.3390/app15137613
Oh M, Jang H, Lee D. AutoStageMix: Fully Automated Stage Cross-Editing System Utilizing Facial Features. Applied Sciences. 2025; 15(13):7613. https://doi.org/10.3390/app15137613
Chicago/Turabian StyleOh, Minjun, Howon Jang, and Daeho Lee. 2025. "AutoStageMix: Fully Automated Stage Cross-Editing System Utilizing Facial Features" Applied Sciences 15, no. 13: 7613. https://doi.org/10.3390/app15137613
APA StyleOh, M., Jang, H., & Lee, D. (2025). AutoStageMix: Fully Automated Stage Cross-Editing System Utilizing Facial Features. Applied Sciences, 15(13), 7613. https://doi.org/10.3390/app15137613