Article

Multi-Material Topology Optimization Taking into Account the Position of Material Interfaces in 3D

IPEK—Institute of Product Engineering at Karlsruhe Institute of Technology (KIT), Kaiserstr. 10, 76131 Karlsruhe, Germany
*
Author to whom correspondence should be addressed.
Appl. Sci. 2025, 15(13), 7612; https://doi.org/10.3390/app15137612
Submission received: 30 May 2025 / Revised: 28 June 2025 / Accepted: 29 June 2025 / Published: 7 July 2025

Abstract

Multi-material design as a method of lightweight construction enables the targeted use of materials in a component by utilizing the individual material properties. However, this advantage comes with additional challenges for the product developer, such as the increased effort involved in identifying the design. Multi-material topology optimization is a method that can support the product developer in creating initial weight-optimized component designs in multi-material design in early phases. In addition, several state-of-the-art studies show that the position of the interfaces between the materials has an influence on the strength of the optimization result. These investigations took place in 2D and developed optimization methods which largely use non-linear building blocks, such as cohesive behavior. The non-linear components lead to an increase in computational effort and a reduction in the robustness of the optimization. In this article, a method for the consideration of adhesive-bonded interfaces in multi-material topology optimization in 3D by means of an objective function is developed. For this purpose, requirements are derived based on an analysis of the different load cases of a bond and these are used to create the method. The method is then successfully validated by means of two numerical experiments. In addition, the influence of a newly introduced parameter on the optimization results is investigated by means of a parameter study.

1. Introduction

To achieve the goals of the Paris Climate Agreement, the CO2 footprint of future products must be reduced. Lightweight construction is a key technology for this [1], as it enables the full potential of materials to be utilized and thus the weight of components and systems to be reduced. Particularly in the case of components that are installed in vehicles or aircraft, the weight reduction goes hand in hand with a reduction in CO2. One approach to lightweight construction is multi-material design, which specifically combines several materials in order to utilize the different properties of the materials to achieve an objective. However, this advantage is linked to additional effort during product development.
The structural optimization methods, such as topology optimization, support the product developer in creating weight optimized initial designs. The density-based approach to topology optimization was first introduced in the two publications by Bendsøe and Kikuchi [2] and Bendsøe [3]. Sethian and Wiegmann [4], Wang et al. [5] and Allaire et al. [6] later developed the level set methods as an alternative approach for topology optimization. In this method, the geometry is represented by a level set function during optimization and the geometry is developed using Hamilton–Jacobi equation [6]. The Velocity Field Level Set Method (VFLSM) [7] is a level set topology optimization method that uses the Method of Moving Asymptotes (MMA) [8] for the straightforward integration of several constraints into level set-based topology optimization [7]. Further level set-based topology optimization methods are presented in [9].
For the optimization of multi-material systems, Wang and Wang [10] introduced the Color Level Set Method, which can represent 2 n materials using n level set functions. An alternative method for multi-material topology optimization is the Reconciled Level Set Method (RCLSM) [11]. In the RCLSM, each material is described by one level set function. Chen et al. [12] optimized smart energy harvesters employing the RCLSM, Vogiatzis et al. [13] applied the RCLSM to optimize multi-material negative Poisson’s ratio metamaterials and Tian et al. [14] used the RCLSM to design ferromagnetic soft active structures. In [15], a new multi-material topology optimization method was developed based on RCLSM and VFLSM. Current publications on multi-material topology optimization focus on, e.g., additive manufacturing [16,17] and the integration of fiber-reinforced composites into multi-material topology optimization [18]. In contrast to the articles on multi-material topology optimization listed above, the method developed in [15] remeshes the current design in each iteration during the optimization and thus enables the accurate evaluation of quantities on the material interfaces between two materials.
Recently, various studies on the influence of interfaces on the optimization result in multi-material topology optimization have been carried out and published. Vermaak et al. [19] were the first to investigate interface effects on multi-material optimization results in the context of level set topology optimization. Liu et al. [20] used non-parametric shape optimization to optimize bimaterial interfaces in multi-material structures. For this purpose, they developed an objective function based on the quadratic strength criterion of Brewer and Lagace [21]. Liu et al. [22] integrated Brewer and Lagace’s strength criterion into a 2D multi-material topology optimization method as a stress boundary condition and used it for the optimization of bimaterial interfaces. To do this, they remesh the 2D geometry in each iteration. Behrou et al. [23,24] optimized bimaterial structures, taking into account the contact and cohesion between the two materials. They used an Extended Finite Element Method (XFEM) to determine the system response. In [25], they use XFEM and cohesive behavior in 2D multi-material topology optimization to model the separation behavior of the interface. The aim is to obtain designs in which the position of the interface is optimal in terms of resistance to separation. Liu et al. [26] used a very similar method to optimize embedded components in a 2D host structure. Kim et al. [27] developed an objective function called Interfacial Tension Energy Density (ITED), which is based on the observation that bonded bimaterial interfaces in 2D primarily fail under tensile stress. The objective function ensures that the interfaces are shifted into the compression areas. It is used to optimize bonded bimaterial interfaces. The advantage of the method is that it does not require specialized Finite Element (FE) methods or computationally intensive non-linear behavior in the FE. In summary, it can be stated that all approaches for the optimization of interfaces in multi-material topology optimization have so far considered the 2D case. It is pointed out in [22,27], for example, that further research is required for the 3D case.
The following is a summary of the challenges for the development of methods for the consideration of interfaces in 3D. Numerous methods (see, e.g., [23,25]) use non-linear components in the FEM. On the one hand, the non-linear components greatly increase the computational effort, as additional inner iterations are required to solve each optimization iteration. Furthermore, the non-linear components make the optimization methods more sensitive to parameter settings, as they are generally less robust than purely linear methods. Furthermore, the methods (e.g., [25]) also use immersed FEM, which is still relatively uncommon in practical use. If standard FEM is to be used in the optimization methods, this is only possible by means of remeshing. However, the approach developed in 2D (e.g., [22]) cannot be transferred directly to 3D. In general, the optimization methods developed in 2D do not yet take into account the shear stress components on the interface.
In this article, the approach first presented in [28] for the consideration of adhesive surfaces in the three-dimensional case in multi-material topology optimization is further developed. In the first step, a system analysis of an adhesive surface between two materials is carried out. In this analysis, the common load cases are analyzed and requirements for the approach are derived. The most essential components of the optimization method developed in [15] are then discussed. The requirements developed in the previous step are then used to motivate and describe the objective function. In Section 3.7, the sensitivities are then derived for the developed objective function. Two numerical examples are used to validate the developed approach. In addition, a parameter study is carried out to investigate the influence of a newly introduced parameter in the developed objective function on the optimization results.

2. Analysis of the Adhesive Bond

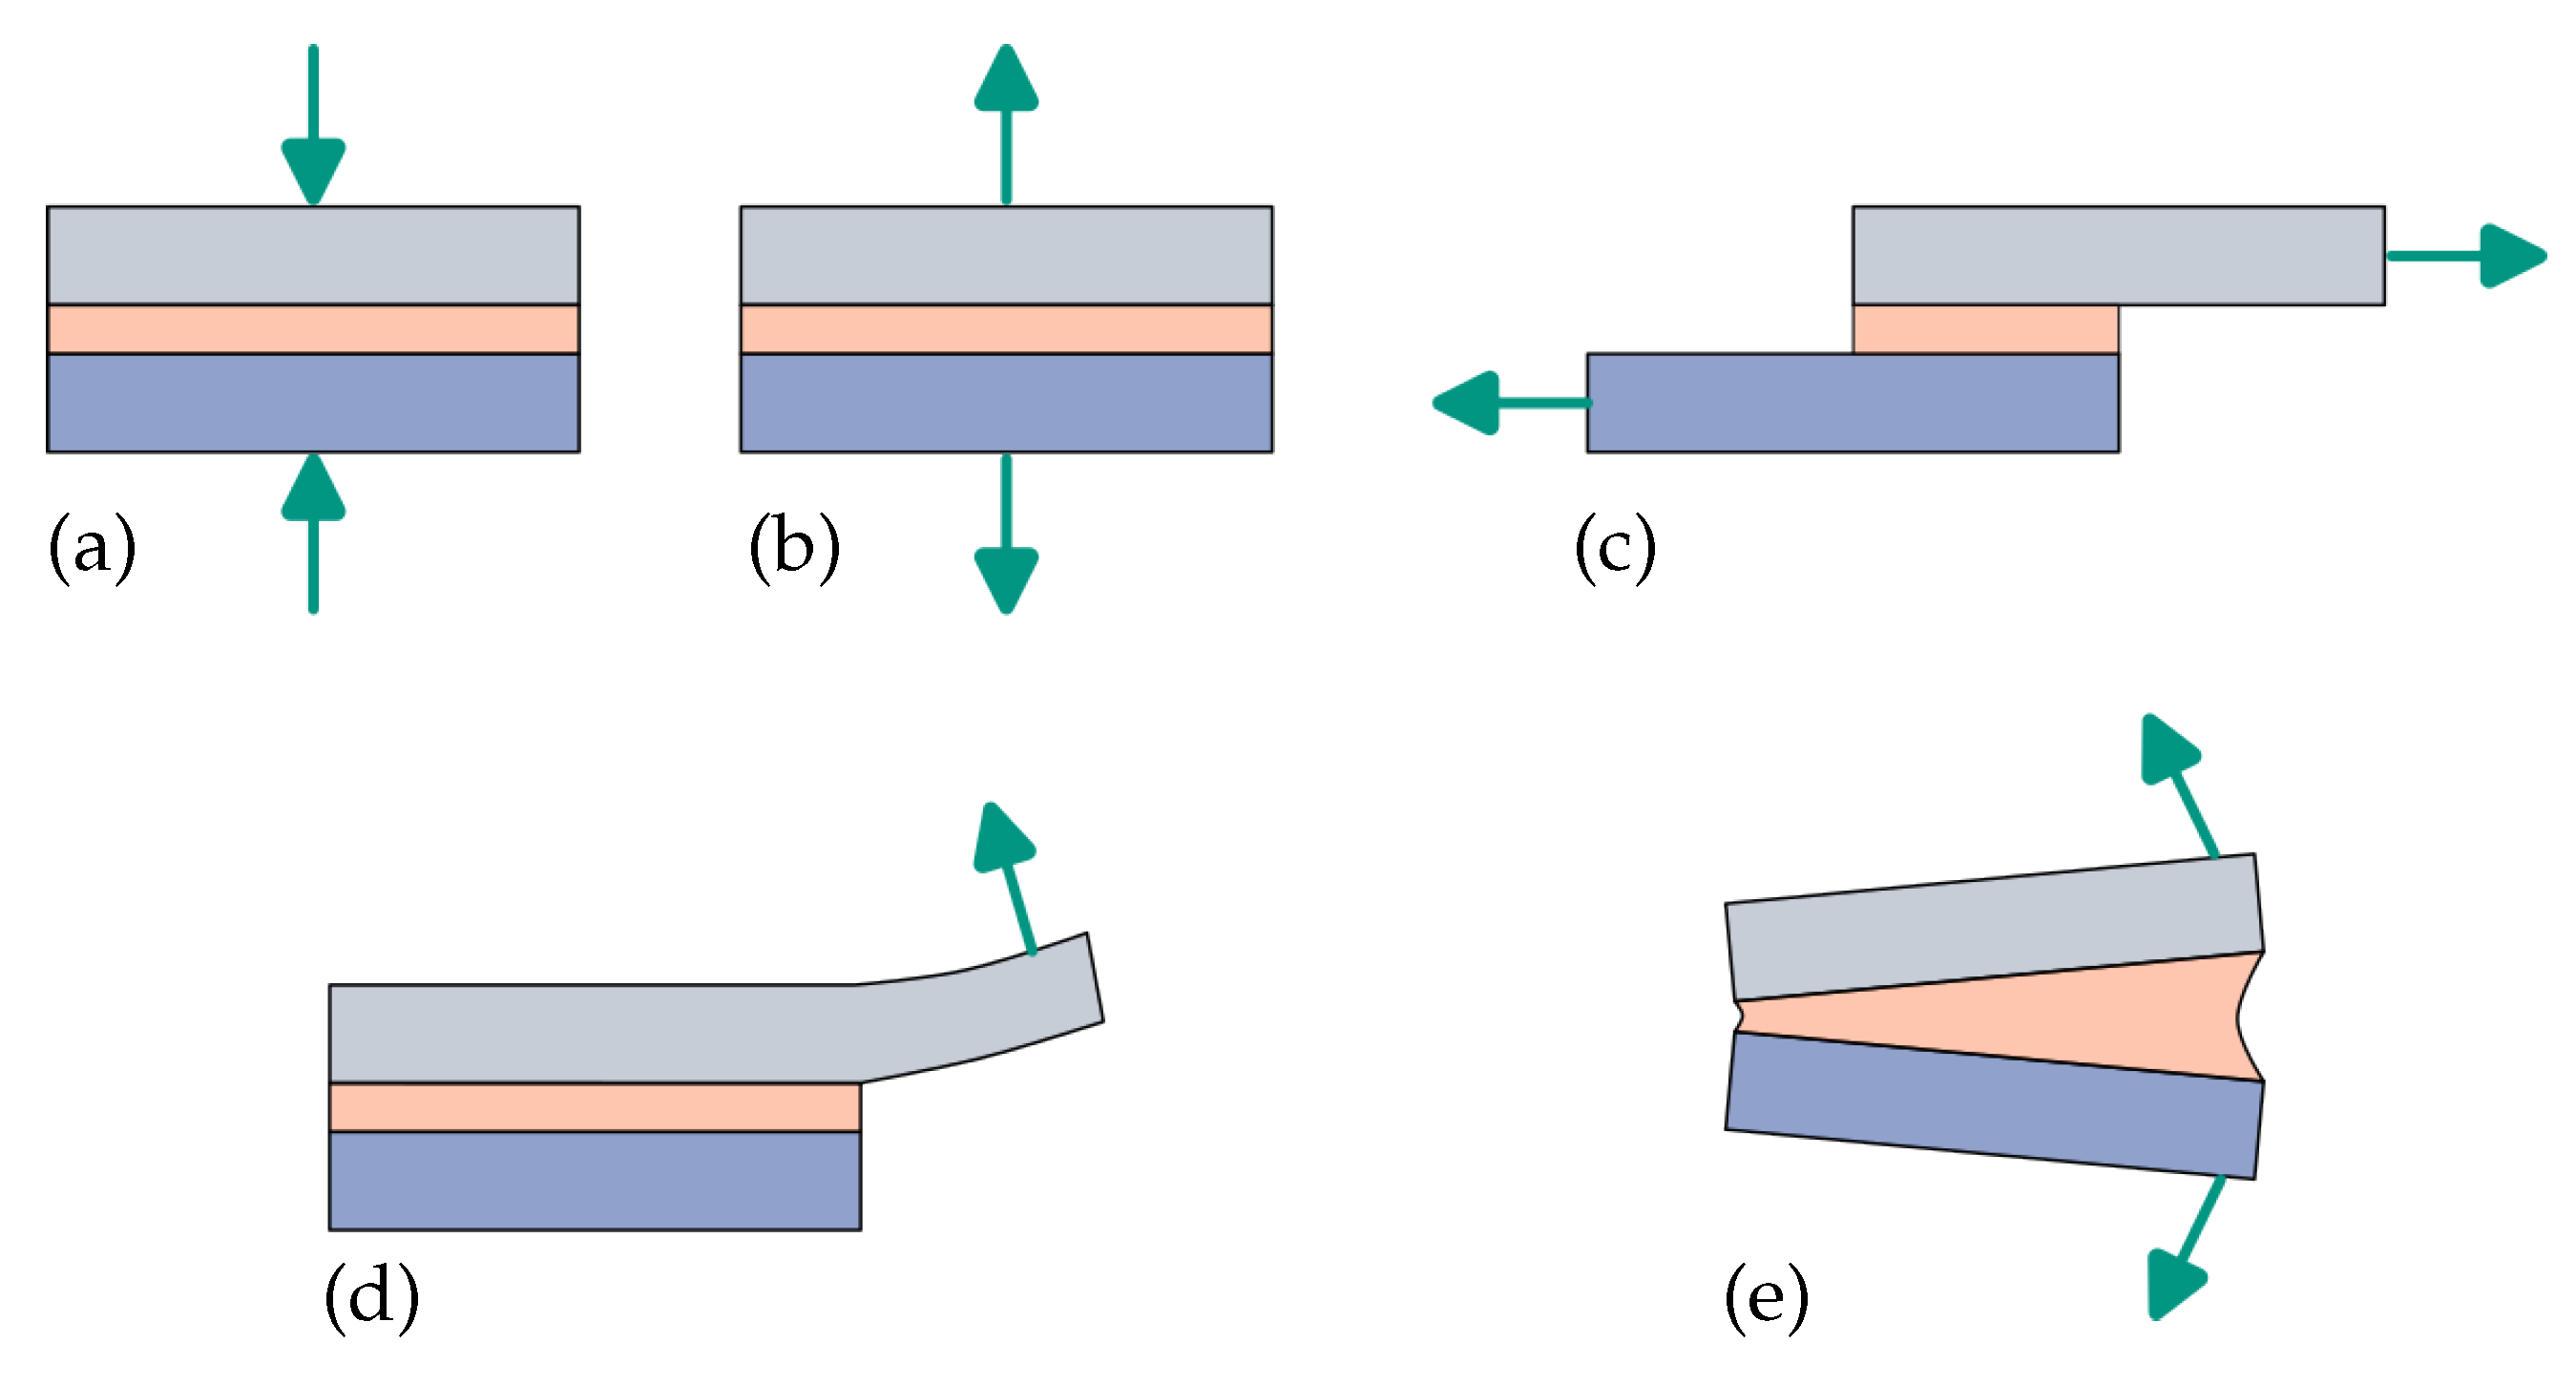
Figure 1 shows the five typical load cases of bonded joints [29]. In particular, the two load cases of splitting (d) and peeling (e) are critical in terms of component strength and should be avoided as far as possible by suitable positioning of the material interface in the design. These two load cases involve inhomogeneous tensile stresses, which also have very high amounts at the opening end [29]. It should also be noted that these two load cases occur exclusively under tension.
The developed failure criterion of [21] used for modeling the failure of material interfaces (see [20,22]) also makes use of this fact. This uses stress limits for the tensile and shear stresses, but not for the compression stresses. The reason for this is that many of the adhesives used in industrial applications have a significantly higher compressive strength compared to the tensile and shear strength (see [20]).
The above-mentioned facts motivate the two requirements listed below, which are used in this article to develop an objective function for 3D multi-material topology optimization, which should favor a bondable position of the interface:
1.
Minimization of the material interface area subject to tensile stress.
2.
Minimization of the material interface area subject to shear stress.

3. Methods

In this section, the multi-material topology optimization method with consideration of interfaces is presented. Since the article is based on the optimization method developed in [15], the main components of this method are outlined in the beginning. The mathematical parameterization of the interface used in the article is then introduced. This is then applied in the development of the approach for the consideration of the interface behavior in the multi-material topology optimization. For this purpose, a suitable objective function is designed first, then the optimization problem is formulated and finally the sensitivity analysis is carried out.

3.1. Boundary Value Problem of Elastostatics

The focus of this article is the two-material quasi-static boundary value problem of elastostatics (see Equation (1)). However, the following restrictions apply: the displacements u D on the Dirichlet boundary ξ D and the volume forces f b are both set to zero.
div σ f b = 0 in Ω , u = u D on ξ D , σ n = f t on ξ N .
Ω is the domain, u the displacement field, ξ N is the Neumann boundary and n its normal. The force f t is applied on ξ N .
Hook’s linear-elastic law is used as the constitutive law, which establishes a relationship between the stress tensor σ and the strain tensor ε ( u ) = 1 2 ( u + ( u ) T ) :
σ = C ˜ [ ε ( u ) ] .
The elasticity tensor C ˜ for the case with two materials is C ˜ = χ 1 ( x ) C 1 + χ 2 ( x ) C 2 . χ i ( x ) denotes the indicator function of the i-th material. These take the value 1 if the corresponding material is present at a point, otherwise they are 0.
To summarize, the weak form of the boundary value problem can be written as
a ( u , ψ ) = l ( ψ ) ψ U a d ,
where a ( u , ψ ) and l ( ψ ) are defined as follows:
a ( u , ψ ) = Ω ε ( u ) · C ˜ [ ε ( ψ ) ] d Ω , l ( ψ ) = ξ N f t · ψ d ξ .
The space of kinematically admissible displacement fields is represented by U a d .

3.2. Velocity Field Level Set Method

The geometry of a material during optimization is described using the level set function (LSF) φ : R 3 R . The following relationship applies to the LSF φ ( x ) :
φ ( x ) > 0 , x Ω ( part ) φ ( x ) = 0 , x Ω ( part surface ) φ ( x ) < 0 , x D Ω
In the article, the so-called signed distance function (SDF) is used as LSF for the purpose of stabilizing the optimization. A SDF is defined as follows:
φ ( x ) = d ( x , Ω )
whereby the function d computes the distance between a point x and the surface Ω . Hence, the property φ ( x ) = 1 holds for a SDF.
The evolution of the LSF in a normal velocity field v n is carried out using the Hamilton–Jacobi equation [30]:
φ t + v n φ = 0 .
The optimization method used in this article employs the VFLSM, which uses the following relationship between design variables η and normal velocity field v n [7]:
v n ( x ) = i = 1 n d b i ( x ) η i .
In this equation, b i ( x ) denotes the linear global basis function (FEM) related to node i.

3.3. Reconciled Level Set Method

In the present article, the RCLSM [11] is used for the parameterization of a geometry consisting of two materials. Each material is represented by an independent LSF. The value ranges of the LSFs can be found in Figure 2. The two LSFs are developed independently of each other using the Hamilton–Jacobi Equation (7). Any arising overlaps are corrected by applying the Merriman–Bence–Osher (MBO) operator [11]. This operator has the following form:
φ i = 1 2 ( φ ^ i max i j φ ^ j ) .
Here, φ ^ 1 and φ ^ 2 are the LSF before the application of the MBO operator.

3.4. Optimization Method

The optimization loop begins with remeshing the current geometry, which is parameterized with the RCLSM [11] and thus by two level set functions on the level set mesh (LS-mesh). The remeshing method uses a copy of the LS-mesh as a starting point. The tetrahedra of the copied mesh are split based on the cases of the marching tetrahedra method and the respective material IDs are assigned using the two level set functions. The resulting mesh is then improved using the following four iterative phases [31]:
  • split all edges with l e > l e m a x
  • collapse edges l e < l e m i n
  • swap edges of elements with q < q m i n
  • smooth all vertices
First, all edges with a length l e greater than the maximum length l e m a x are split and all edges with a length l e less than the minimum length l e m i n are collapsed. Then edge swaps are performed for all tetrahedra with an element quality q less than the minimum element quality q m i n followed by a hierarchical smoothing of the vertices [31].
To complete the remeshing method, the last remaining tetrahedra with low quality are eliminated.
The resulting mesh (FE mesh) is then used to determine the system response and calculate the sensitivities using linear FE. The design variables (normal velocities) are updated by the MMA optimization algorithm [8,32] using the computed sensitivities.
In the next step, the normal velocities are extrapolated into the entire design domain using a two-stage explicit velocity extension method [15]. In the first step of the velocity extension method, the surface ( φ ( x ) = 0 ) is sampled and the normal velocities at the sample points are evaluated using linear interpolation. The second step is the actual extrapolation. For this purpose, the projection on the surface mesh sampled in the first step is identified for each point on the LS mesh. The normal velocity value is determined at the identified point using linear interpolation and assigned to the original node of the LS-mesh.
Following the extrapolation of the normal velocities, these are smoothed using the Helmholtz Equation (10). The filter step stabilizes the optimization process. The Helmholtz equation used is solved using FEM and is [33]:
r f 2 2 v ˇ n + v ˇ n = v n .
v ˇ n is the filtered normal velocity field and r f a filter parameter that describes the size of the filter mask [33].
The two level set functions are then developed in the filtered normal velocity fields using (7) and possible overlaps are eliminated using the mbo operator (9).
Finally, the SDF property of the level set functions is restored using an explicit redistancing method. The redistancing method begins with the discretization of the level set function using the marching tetrahedra method. The closest point on the discretized surface is then identified for each node of the LS-mesh and thereafter the distance between the two points is determined. This distance is assigned to the original point as the SDF value. In addition, the sign is identified using fast-winding-number [34].

3.5. Interface Orthonormal Basis

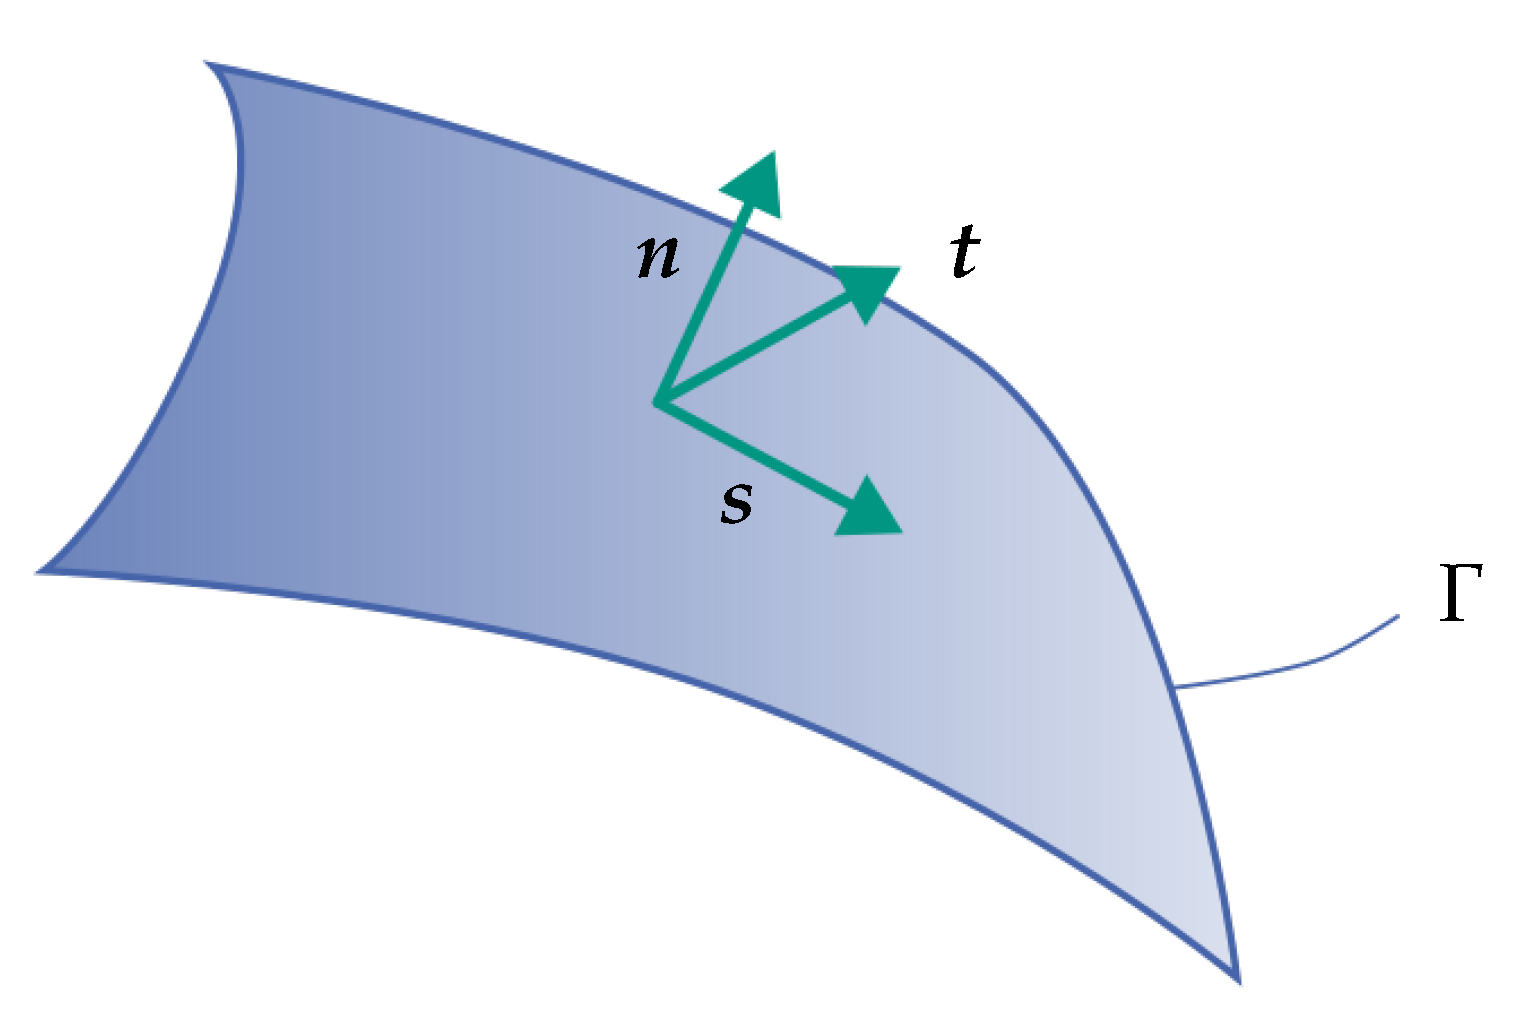
To evaluate the interface energy introduced in the following section, an orthonormal basis is required at the interface Γ . This is illustrated in Figure 3. The normal vector n of the interface Γ is calculated from the respective LSF φ according to the following equation:
n = φ φ .
The corresponding tangent vectors s and t are calculated from the normal vector n = [ n x n y n z ] T according to [35] using the Householder transformation:
s = n y 1 n y 2 n x + 1 n y n z n x + 1 T , n x 0 n y 1 + n y 2 n x 1 n y n z n x 1 T , n x < 0
t = n z n y n z n x + 1 1 n z 2 n x + 1 T , n x 0 n z n y n z n x 1 1 + n z 2 n x 1 T , n x < 0
The three vectors { n , s , t } thus form an orthonormal basis.

3.6. Extended ITED

3.6.1. Approach

The subsequent interface energy density (Extended ITED) is used to consider the material interfaces in the topology optimization in 3D:
W i t e d = 1 2 σ n n t ε n n t + β 1 2 | σ n s ε n s | + 1 2 | σ n t ε n t | .
Here, σ n n t is the positive tensile normal stress on the interface:
σ n n t = σ n n , σ n n > 0 0 , σ n n 0
and σ n n = n · C ˜ [ ε ( u ) ] n .
σ n s = n · C ˜ [ ε ( u ) ] s , ε n s = n · ε ( u ) s
Similarly, σ n t and ε n t are to be calculated.
The first term of Equation (14) is identical to [27] and penalizes material interfaces whose position is in the tensile region. The penalization occurs because material interfaces whose position is in the tensile region lead to high energy values. The minimization of this term should lead to a shift of the material interfaces into the compression regions. This fulfills requirement 1 (see Section 2) and avoids splitting and peeling stresses in the optimization results.
The second and third terms of Equation (14) are for the consideration of the shear components of the interface stress. The shear components are evaluated in the same way as Brewer’s strength criterion. The ratio between the first term and the two shear components is set via the factor β . The absolute values are required as the aim is to reduce the shear stresses symmetrically (both negative and positive). After the first term has been reduced, the shear components ensure that the shear stresses in the interface are minimized. For this purpose, the surfaces are adjusted so that surfaces loaded in shear are converted into surfaces loaded in compression, as compressive loads do not increase the extended ITED (hereinafter ITED). This fulfills requirement 2 (see Section 2).

3.6.2. Optimization Problem

The interface energy listed in Equation (14) is transformed into the following objective function by integration over the interface Γ analogously to [22] using the smooth interface integral:
J i t e d = Ω H ( φ 1 ) δ ˇ ( φ 2 ) W i t e d d Ω ,
where H ( φ 1 ) is the Heaviside function, δ ˇ ( φ 2 ) the smooth delta function and is defined as follows:
δ ˇ ( φ 2 ) = 3 4 Δ l 1 φ 2 Δ l 2 , | φ 2 | Δ l 0 , | φ 2 | > Δ l .
The complete optimization problem is as follows:
min η w c J c + w i t e d J i t e d + w r i Γ d Γ + w r s Ω d ξ s . t . a ( u , ψ ) l ( ψ ) = 0 , ψ U a d f V 1 f ¯ V 1 f V 2 f ¯ V 2 v m i n η i v m a x , i = 1 , , n d
where J c = Ω 1 2 ε ( u ) · C ˜ [ ε ( u ) ] d Ω is the compliance. The third and fourth terms are two regularization components that can be set independently of each other. The third term regularizes the interface Γ between the two materials and thus ensures the solvability of the optimization problem. The fourth regularizes the entire part surface Ω and thus ensures strut-like structures [15]. w c , w i t e d , w r i and w r s are the scaling factors of the individual terms.
The weak form of the boundary value problem of elastostatics and the two volume boundary conditions act as constraints in the optimization problem. Here, f ¯ V 1 and f ¯ V 2 are the target volume fraction of the first and second material, respectively.
The design variable vector η = [ η 1 1 , , η n d 1 , η 1 2 , , η n d 2 ] T contains the normal velocities of both LSF at each node in the LS-mesh. The components of η are bounded by the minimum v m i n and maximum v m a x normal velocity.

3.7. Sensitivity Analysis

This section describes the sensitivities for the optimization problem (19). The sensitivities for the compliance, the regularization components and the volume constraints known in the state of research are listed again at the beginning of the section. The sensitivity of the ITED is then derived using the Lagrange method [36]. For this purpose, the Lagrange functional is set up in the first step. The adjoint equation is derived by forming the first variation of the Lagrange functional with respect to u . Finally, the sensitivity J I T E D η i 2 is derived by forming the first variation of the Lagrange functional with respect to φ 2 . The sensitivity of the compliance component J c for φ 1 is (see e.g., [15]):
J c η i = Ω ε ( u ) · C 1 [ ε ( u ) ] b i d ξ , i = 1 , , n d .
The sensitivity of the compliance component J c for φ 2 is obtained by replacing C 1 with C 2 in the RCLSM. This applies to all subsequent sensitivities and is therefore not mentioned further.
The sensitivity of the volume constraint is (see, e.g., [15]):
f V 1 η i = 1 V D Ω b i d ξ , i = 1 , , n d .
The sensitivity of the two regularization components with the corresponding surfaces is as follows:
J r η i = Ω κ b i d ξ , i = 1 , , n d
Here, κ is the mean curvature of the corresponding surface and is defined as κ = div n [6].
To determine the last missing sensitivity of the ITED, the Lagrange functional is set up in the first step:
L i t e d = Ω H ( φ 1 ) δ ˇ ( φ 2 ) W i t e d d Ω Ω ε ( q ) · C ˜ [ ε ( u ) ] d Ω + ξ N q · f t d ξ .
where q is the adjoint field that originates from the admissible linear vector space Q a d = H 0 1 ( Ω ) .
By forming the first variation L i t e d u · δ u = 0 the strong form of the adjoint equation is obtained:
div C ˜ [ ε ( q ) ] = div H ( φ 1 ) δ ˇ ( φ 2 ) W I T E D u in Ω , q = 0 on ξ D , C ˜ [ ε ( q ) ] n = H ( φ 1 ) δ ˇ ( φ 2 ) W I T E D u n on ξ N .
To solve the adjoint Equation (24), the partial derivative of the interfacial energy according to the displacement gradient W I T E D u is still missing, which is derived below using the chain rule:
W I T E D u = 1 2 σ n n t σ n n σ n n u ε n n t + σ n n t ε n n t ε n n ε n n u + 1 2 β sgn σ n s ε n s σ n s u ε n s + σ n s ε n s u + 1 2 β sgn σ n t ε n t σ n t u ε n t + σ n t ε n t u .
Using the following quickly verifiable relationships
σ n n u = C ˜ [ n n ] , ε n n u = n n , σ n s u = C ˜ [ n s ] , ε n s u = 1 2 ( n s + s n ) σ n t u = C ˜ [ n t ] , ε n t u = 1 2 ( n t + t n ) ,
results in the partial derivative W I T E D >u :
W I T E D u = 1 2 ε n n t σ n n t σ n n C ˜ [ n n ] + σ n n t ε n n t ε n n n n + 1 2 β sgn σ n s ε n s ε n s C ˜ [ n s ] + σ n s 1 2 ( n s + s n ) + 1 2 β sgn σ n t ε n t ε n t C ˜ [ n t ] + σ n t 1 2 ( n t + t n ) .
The final two partial derivatives are calculated as follows:
σ n n t σ n n = 1 , σ n n > 0 1 2 , σ n n = 0 0 , σ n n < 0 ε n n t ε n n = 1 , ε n n > 0 1 2 , ε n n = 0 0 , ε n n < 0 .
Here, we set the derivative at the discontinuous points σ n n = 0 or ε n n = 0 to 1 2 , analogous to [22]. As a result, all components for solving the adjoint Equation (24) using FEM are available.
By forming the first variation L i t e d φ 2 · δ φ 2 and using C ˜ = H ( φ 1 ) C 1 + H ( φ 2 ) C 2 results:
L i t e d φ 2 · δ φ 2 = Ω H ( φ 1 ) δ ˇ ( φ 2 ) φ 2 W i t e d v n 2 + δ ˇ ( φ 2 ) W i t e d n · n φ 2 v n 2 | φ 2 | d Ω + φ 2 = 0 ε ( q ) · C 2 [ ε ( u ) ] v n 2 d ξ
In Equation (29) the three partial derivatives δ ˇ ( φ 2 ) φ 2 , W i t e d n and n φ 2 still have to be determined. The first results directly from Equation (18):
δ ˇ ( φ 2 ) φ 2 = 3 2 Δ l 3 φ 2 , | φ 2 | Δ l 0 , | φ 2 | > Δ l .
The derivative of the normal vector n occurring in Equation (29) is for the 3D case according to [37] and using the variation approach typical for the VFLSM δ φ 2 = v n 2 | φ 2 | [7]:
n φ 2 v n 2 | φ 2 | = n φ 2 · δ φ 2 = s v n 2 t v n 2 = ( v n 2 · s ) s ( v n 2 · t ) t .
It only has components in the two tangential directions.
The third missing partial derivative W i t e d n is calculated using the chain rule:
W i t e d n = 1 2 σ n n t σ n n σ n n n ε n n t + σ n n t ε n n t ε n n ε n n n + 1 2 β sgn σ n s ε n s σ n s n ε n s + σ n s ε n s n + 1 2 β sgn σ n t ε n t σ n t n ε n t + σ n t ε n t n .
If the following relationships are inserted in Equation (32)
σ n n n = 2 σ n , ε n n n = 2 ε n σ n s n = σ s + s n T σ n , ε n s n = ε s + s n T ε n
and analogous for σ n t n and ε n t n , the result is:
W i t e d n = 1 2 ε n n t σ n n t σ n n σ n + σ n n t ε n n t ε n n ε n + 1 2 β sgn σ n s ε n s ε n s σ s + s n T σ n + σ n s ε s + s n T ε n + 1 2 β sgn σ n t ε n t ε n t σ t + t n T σ n + σ n t ε t + t n T ε n
As shown above, the tangent vectors s and t are calculated using the Householder transformation (see Equations (12) and (13)). Consequently, the two partial derivatives s n and t n are calculated as follows:
s n = 0 1 0 n y 2 ( n x + 1 ) 2 2 n y n x + 1 0 n y n z ( n x + 1 ) 2 n z n x + 1 n y n x + 1 , n x 0 , 0 1 0 n y 2 ( n x 1 ) 2 2 n y n x 1 0 n y n z ( n x 1 ) 2 n z n x 1 n y n x 1 , n x < 0 ,
t n = 0 0 1 n y n z ( n x + 1 ) 2 n z n x + 1 n y n x + 1 n z 2 ( n x + 1 ) 2 0 2 n z n x + 1 , n x 0 , 0 0 1 n y n z ( n x 1 ) 2 n z n x 1 n y n x 1 n z 2 ( n x 1 ) 2 0 2 n z n x 1 , n x < 0 .
Finally, this results in the sensitivities:
J i t e d η i 2 = Ω H ( φ 1 ) δ ˇ ( φ 2 ) φ 2 W i t e d b i + δ ˇ ( φ 2 ) W i t e d n · ( b i · s ) s + ( b i · t ) t d Ω + φ 2 = 0 ε ( q ) · C 2 [ ε ( u ) ] b i d ξ
Similarly, J i t e d η i 1 can be derived, by approximating the interface integral with Γ f ( x ) d Γ Ω H ( φ 2 ) δ ˇ ( φ 1 ) f ( x ) d Ω and subsequently calculating the first variation L i t e d δ φ 1 · δ φ 1 . However, the adjoint equation only needs to be solved once.

4. Numerical Experiments

In this section, the effectiveness of the developed method is examined and validated using two numerical examples and a parameter study. The cases used are a cantilever clamped on one side and a bracket.
Parameters are listed in Table 1 that are used in all the following numerical examples. The modulus of elasticity E 1 , E 2 and the Poisson’s ratio ν 1 , ν 2 of the materials used. The minimum and maximum normal velocity v m i n and v m a x already introduced above. Furthermore, a normal velocity v n d s is defined in the non-design space, which guarantees that material is always present at the support surfaces.
The last parameter α describes the maximum volume reduction in one iteration analogous to [38]. Numerical experiments have shown that an α = 1 % leads to good convergence behavior of the optimization. This value results in a uniform reduction of the volumes, as the optimization is primarily controlled by the sensitivities of the objective function and not by the volume reduction. If the value of α is too high, the two materials separate and the optimization is aborted. The influence of the remaining parameters (e.g., filter radius) on the convergence behavior was investigated in [15].
For the selection of β , we recommend using the ratio between the two material parameters interface shear strength and normal tensile strength in analogy to the failure criterion of Brewer and Lagace. The two parameters are the only material parameters that are also used in this failure criterion and can also be determined experimentally. It should be noted that this is a recommendation based on an analogy that has led to good results in our numerical experiments, and not a theoretical derivation.
For the selection of w i t e d , we recommend values of 0.05 to 0.3 and starting with a low value at the beginning. Values that are too high cause the optimization to be completely controlled by the ITED and lead to a separation of the two materials. Observing the first 10–20 iterations also provides relatively quick information as to whether the ITED alone is controlling the optimization.
The interface regularization term is activated in all experiments starting from iteration 110, which guarantees that it does not drive the optimization at the beginning. To determine convergence, a criterion is used which first forms the moving average of the objective function values of the previous five iterations. The percentage change in the moving average of two iterations is then calculated. If this change is less than 0.0001 and the two target volumes are met, the result is considered to be converged.

4.1. Cantilever

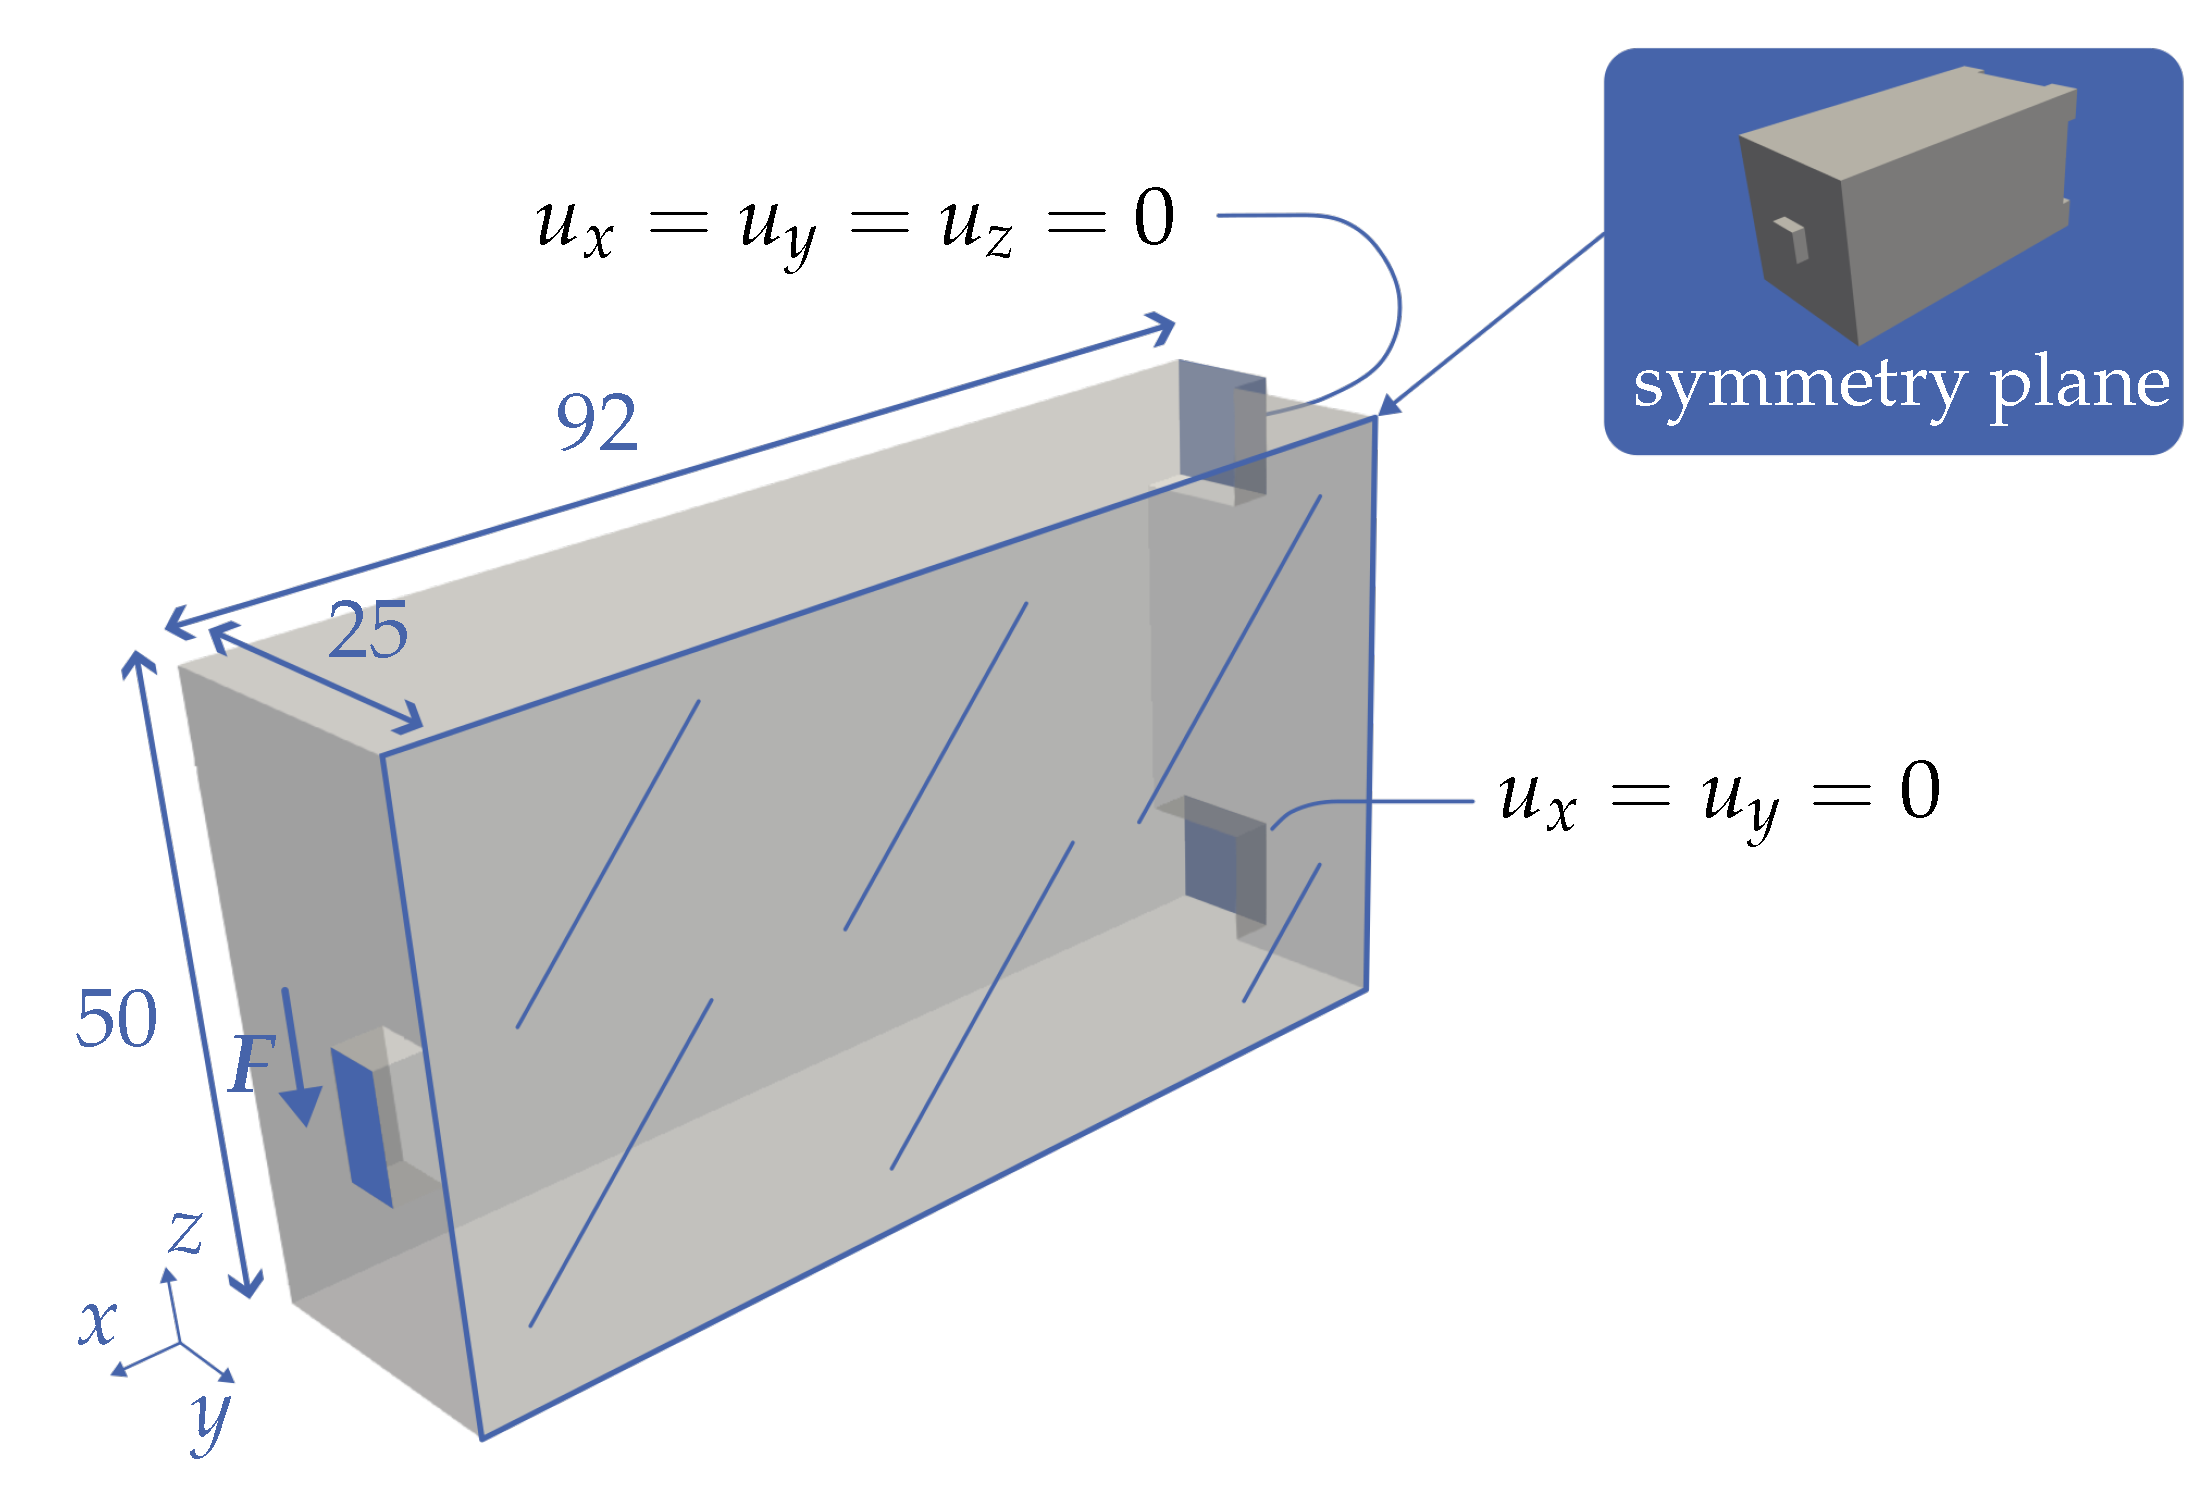
As a first case, we consider the cantilever shown in Figure 4. This is loaded on the front surface with a load F in negative z-direction and is supported on the rear surface. The load application and the support surfaces are square and protrude slightly. They are defined as non-design space for the optimization. For the nodes of the upper support surface, u x = u y = u z = 0 and for the nodes of the lower support surfaces, u x = u y = 0 . As the aim is to obtain symmetrical designs, only half of the design space is simulated and a symmetry boundary condition is defined on the symmetry plane (see Figure 4).
Two different optimizations are carried out below. One multi-material topology optimization without taking the ITED into account and one with it. The parameters for the two optimizations can be found in Table 2.
Figure 5a shows the optimization result of the pure multi-material topology optimization and in Figure 5b the optimization result with consideration of the ITED. It is clearly visible that the pure multi-material topology optimization result (see Figure 5a) distributes the second material (lower modulus of elasticity) over the entire cross-section (along the z-direction). The second material is present both in the tensile and compressive areas. The same applies to the first material. Consequently, the interfaces are also present both in the compression area and, in particular, in the tensile area (upper interfaces). As described above, the latter has a negative effect on the component strength.
The optimization result with consideration of the ITED (see Figure 5b) shifts the second material into the compressive area of the beam, whereby all three existing interfaces are primarily subjected to pressure, which corresponds to the intended behavior.
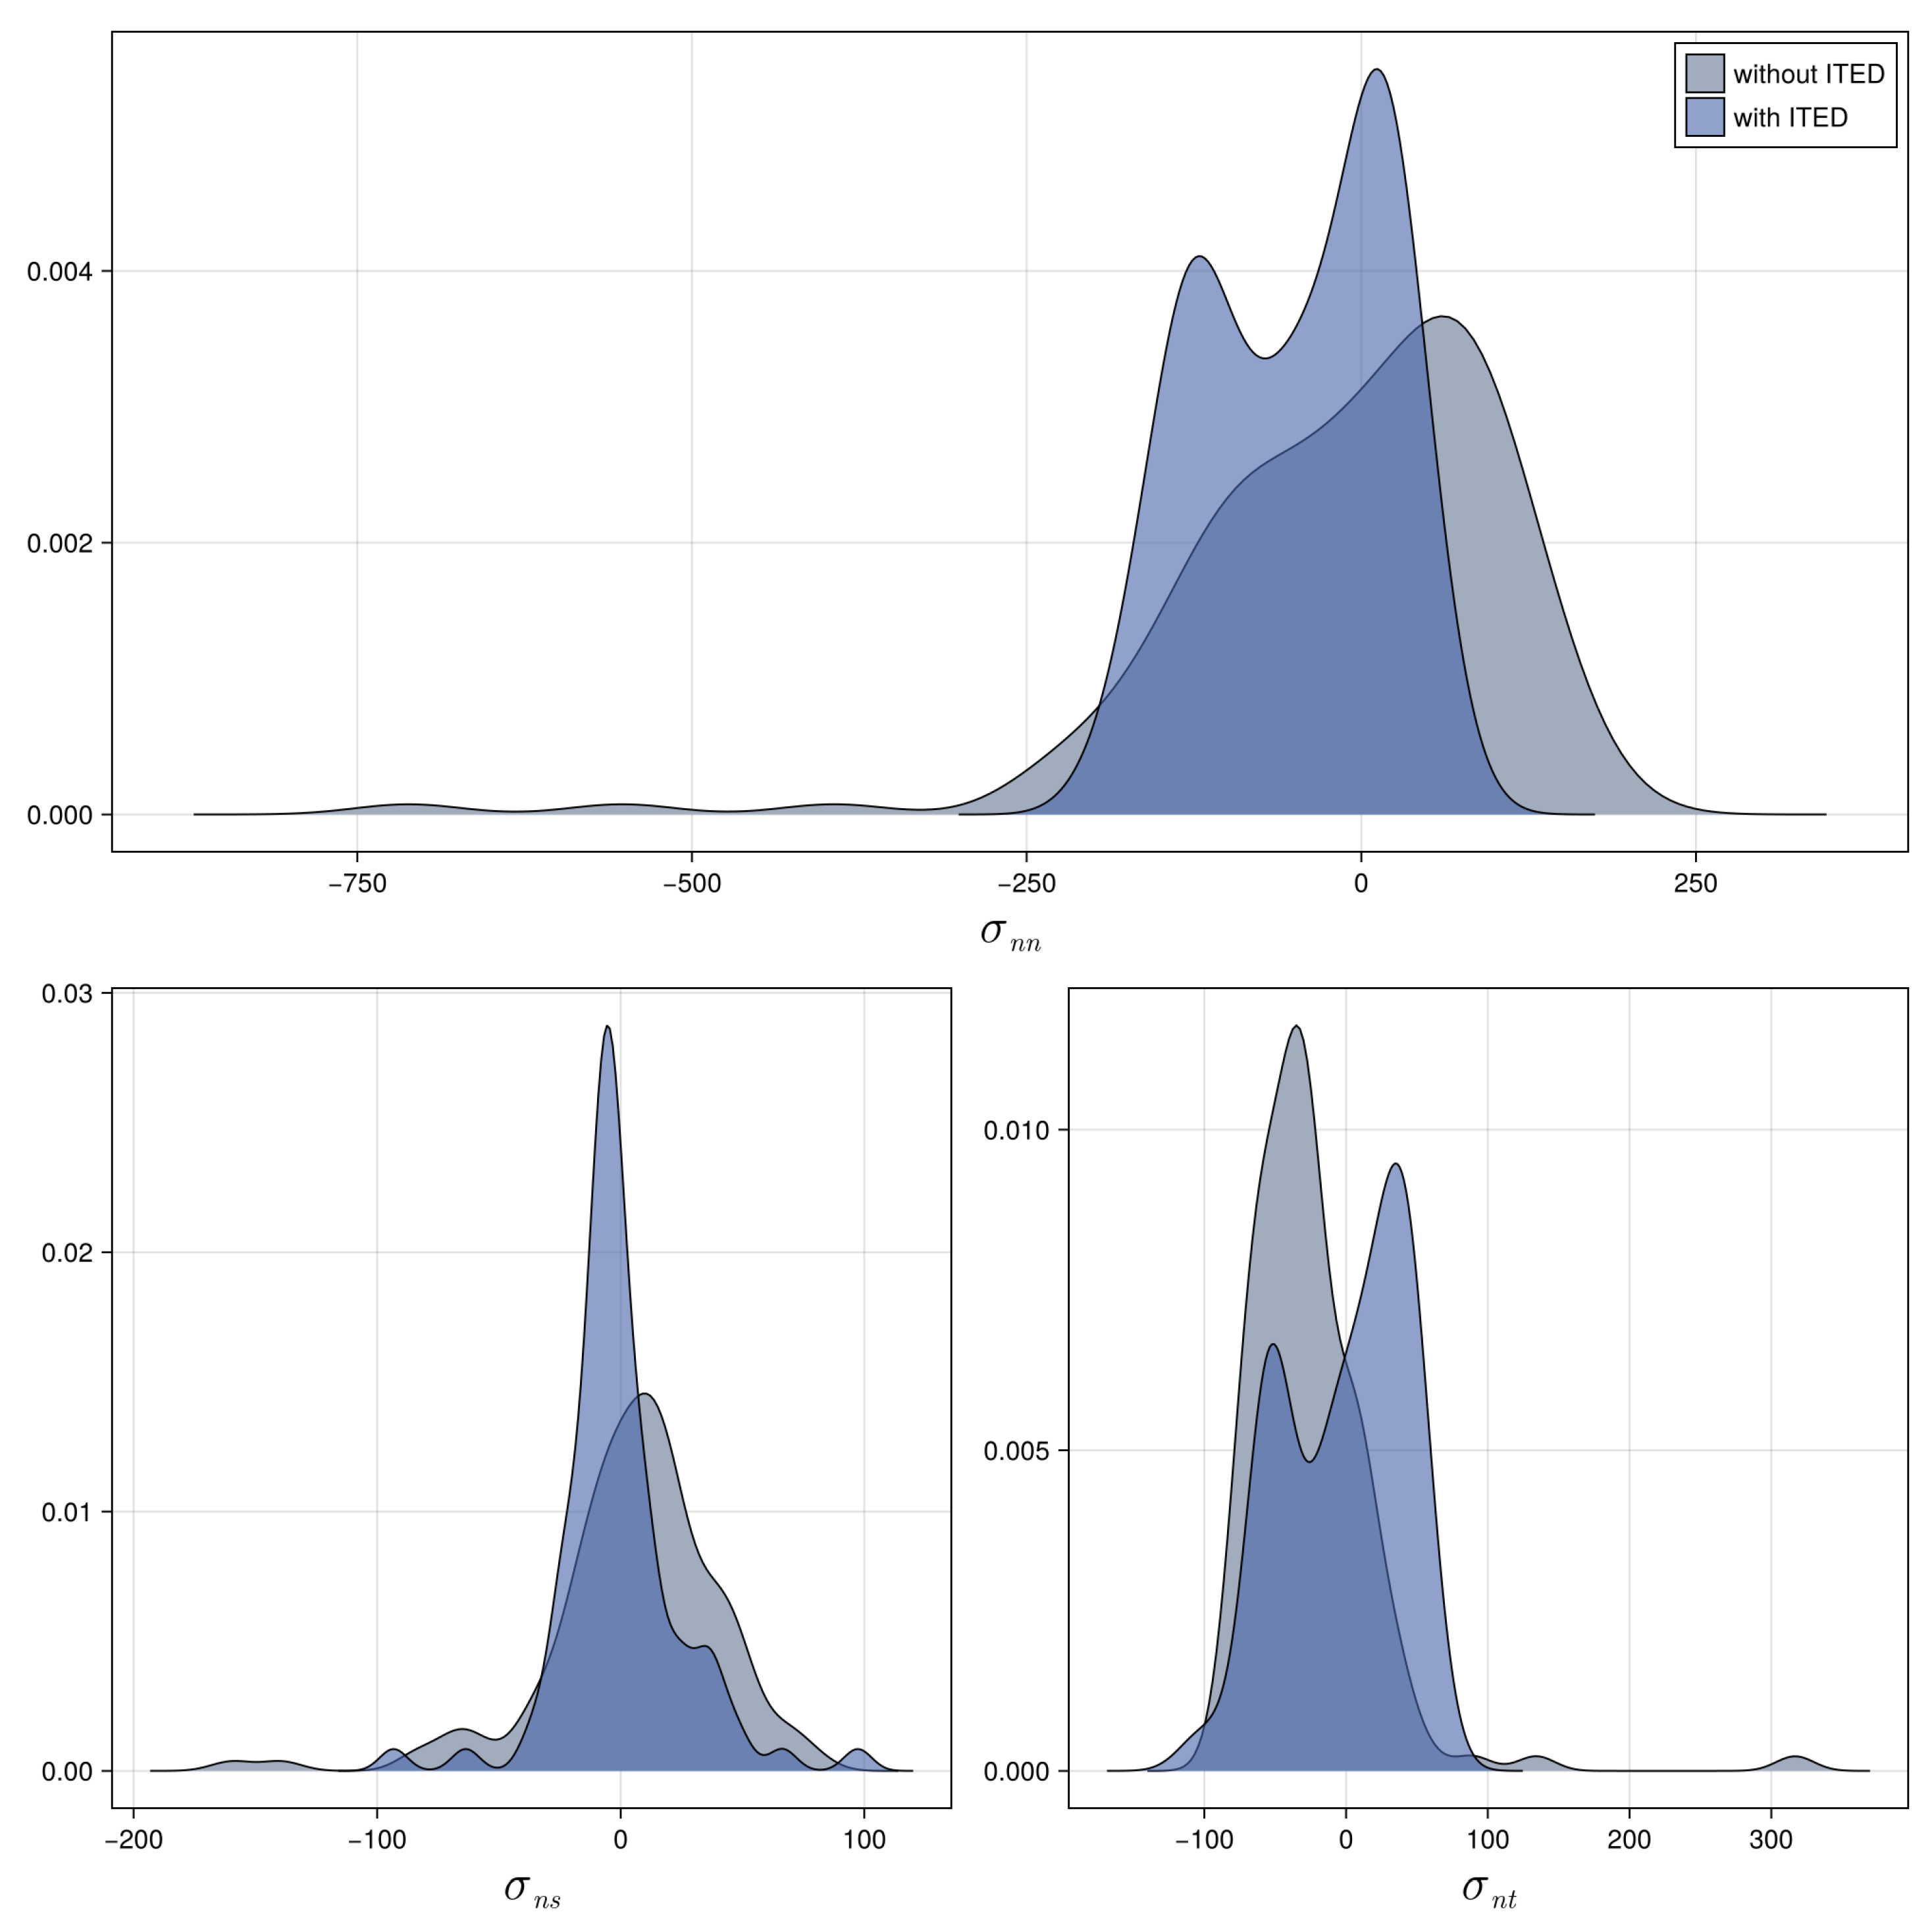
The latter is also illustrated by Figure 6. This shows the density distribution of the normal and shear stresses on the interfaces for the two optimizations. In the first step, the interface surfaces of the tetrahedrons were derived, the three stresses were determined on them and the diagrams were created from this. In each of these, the stress values are plotted on the x-axis and the respective occurrences on the y-axis.
The diagram of the normal stress σ n n clearly shows that the interfaces are subjected to greater compressive stress when the ITED is taken into account (density distribution shifts from the positive area to the negative area). In addition, the maximum tensile stress (maximum value in the positive range) is reduced compared to pure multi-material topology optimization. Consequently, in the case of the cantilever, the developed method fulfills requirement 1.
The two shear stress diagrams ( σ n s and σ n t ) show that the maximum shear stress (maximum value in the negative or positive range) is also reduced for both when the ITED is taken into account. The variance of the density distribution is lower when the ITED is taken into account. It can also be seen that the majority of the density accumulates around the value 0 (corresponds to low shear stresses on the surfaces of the interface). Consequently, the developed method also fulfills requirement 2 in the case of the cantilever.
At this point we would also like to provide some information about the computation effort. The numerical experiments were carried out on an AMD 6 Core Processor with 5.4 GHz. The computational effort can be easily estimated from the first iteration. The FE mesh consists of 26,573 nodes and 146,614 tetrahedra. Remeshing takes the longest at 21 s, followed by solving the FE problem and the adjoint problem, each of which takes 1.4 s. The remaining points require less than 2 s combined. It should also be noted that the individual iterations become smaller as the optimization progresses. Since the volume decreases and thus, due to the constant edge length, the number of tetrahedra. As a result, the number of degrees of freedom in both the FE and the adjoint problem decreases. Further studies on the influence of the mesh can be found in [15].

4.2. Bracket

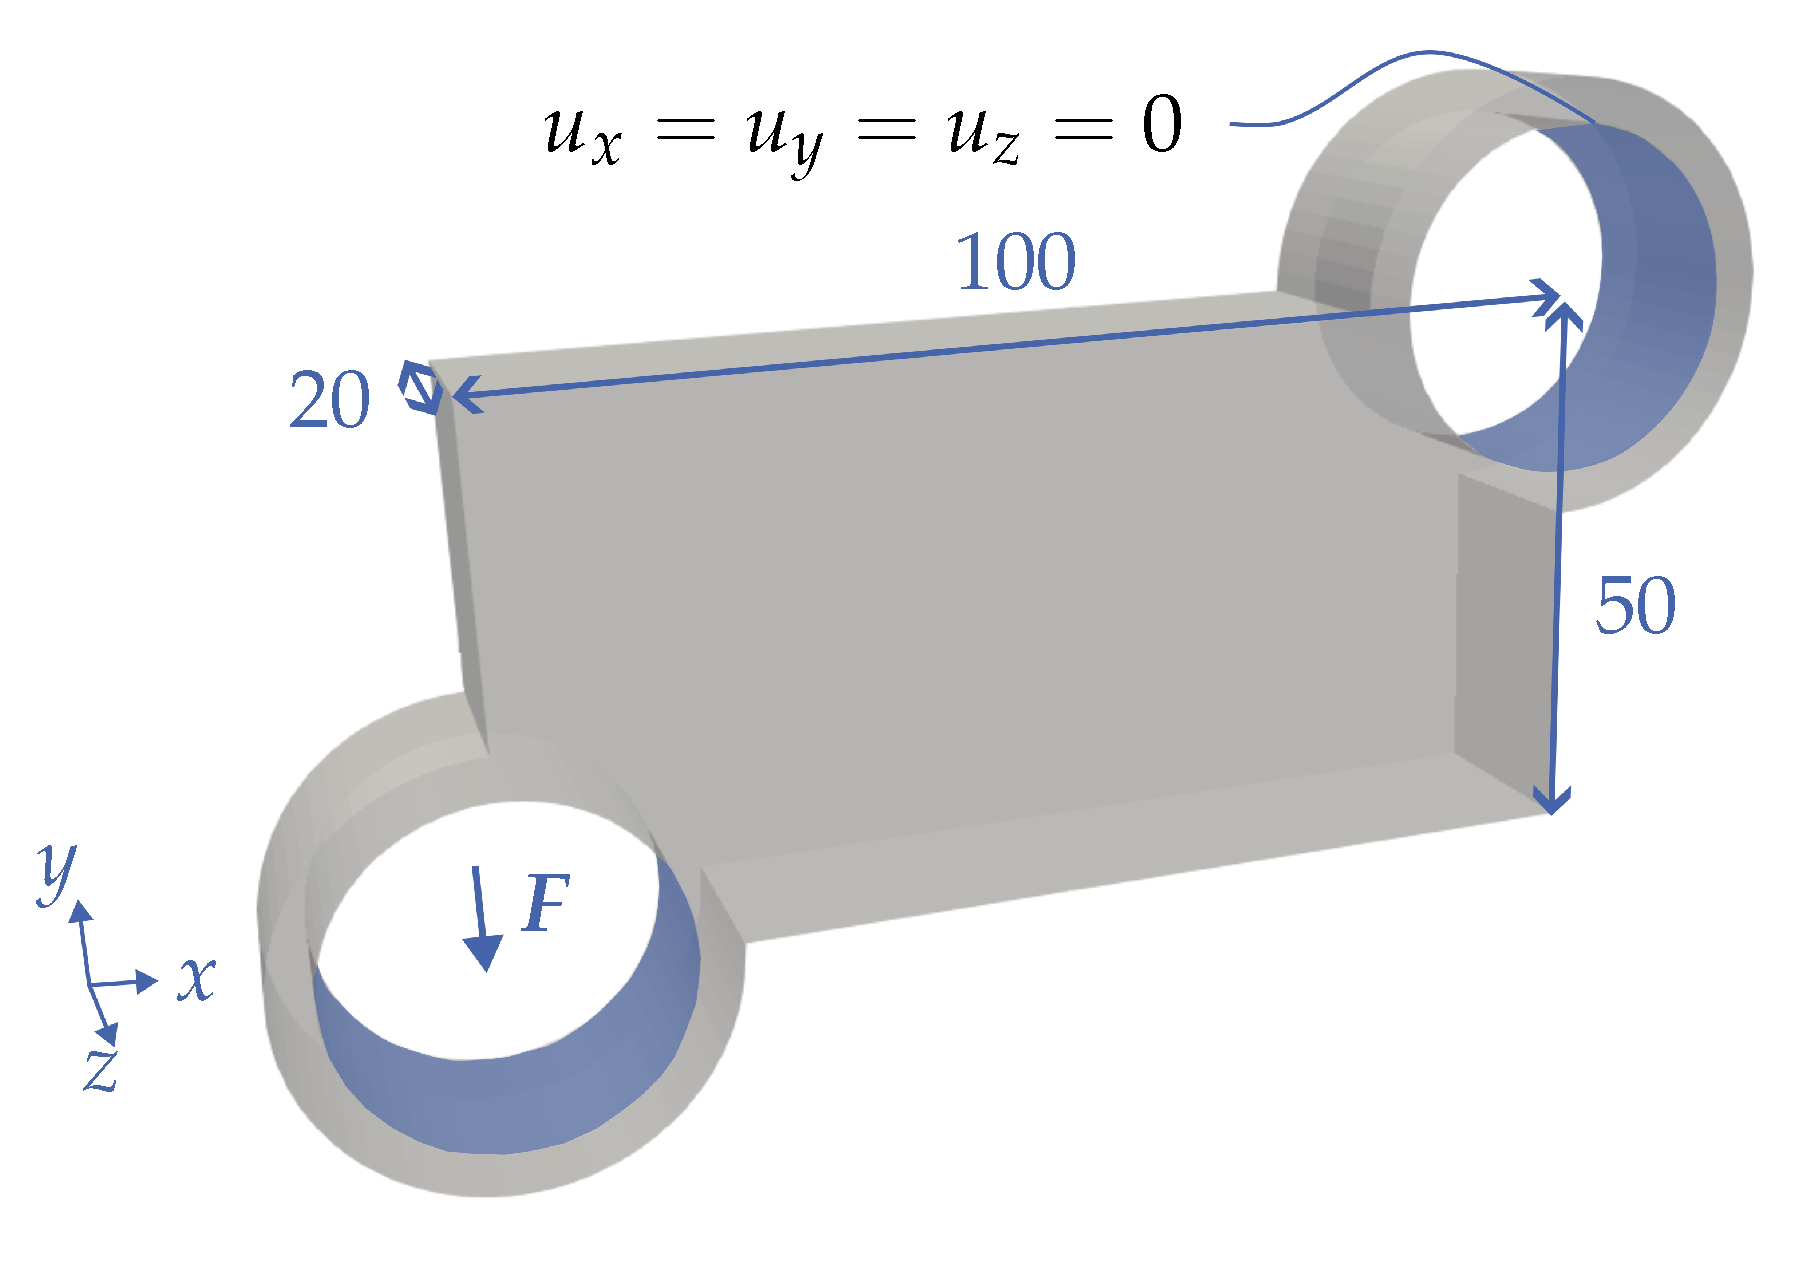
The second case is the bracket shown in Figure 7, which is often used in the topology optimization literature (see [39]). As a load, a force acting in the negative y-direction is applied via the inner surface of the lower left perforated cylinder. The inner surface of the upper right cylinder serves as the support. The following applies to the nodes of the inner surface: u x = u y = u z = 0 . The drilled-through cylinders on the inner surfaces of which the load is applied and the support is provided are considered as non-design space in the context of the optimization. The dimensions can be taken from Figure 7.
Analogous to the cantilever, the comparison between pure multi-material topology optimization and multi-material topology optimization with consideration of the ITED is shown below. The parameters of the two optimizations can be found in Table 3.
Figure 8a shows the result of the pure multi-material topology optimization and in Figure 8b that with consideration of the ITED. Analogous to the cantilever, it can again be seen that the second material is distributed over the cross-section (y-direction) in the pure multi-material topology optimization and that the second material is primarily located in the upper area when the ITED is taken into account. It is also noticeable that the second material consists of two components in the optimization with consideration of the ITED compared to one in the pure multi-material topology optimization.
Figure 9 again shows the normal and shear stress density distributions on the interfaces of the two optimization results. Analogous to the cantilever, it can again be seen that the tensile stress on the interfaces decreases when the ITED is taken into account. On the one hand, the maximum normal stress decreases (maximum positive value) and the majority of the density distribution is shifted to the left. Consequently, in the case of the bracket, the developed method also fulfills requirement 1.
The shear stress diagrams also show that the maximum shear stress is also minimized. The density distribution of shear stress σ n s must be considered in particular, as its values are higher than σ n t . The maximum value of the density distribution of σ n s decreases when ITED is taken into account compared to pure multi-material topology optimization. In addition, a reduction in the variance can be observed when considering the ITED compared to the pure multi-material topology optimization. Consequently, the developed method also fulfills requirement 2 in the case of the bracket.

4.3. Parameter Study

In this section, the influence of the parameter β on the optimization result is determined using a parameter study. For this purpose, the bracket is used as an optimization case and the parameter β is varied in the three levels 0, 0.25 and 0.5 . The remaining optimization parameters are identical to the previous section.
Figure 10 shows the optimization results for the three values of beta. It is noticeable that the optimization with β = 0 (partial mapping a) differs greatly from the other two optimizations (partial mapping b and c). Material 2 in the optimization with β = 0 consists of one component, whereas it consists of two components in the other two optimizations. In the optimization with β = 0 , the interface between the materials is such that it is primarily subjected to shear. This is logical, as this optimization with β = 0 does not take into account the shear components in the objective function. The two optimization results with consideration of the shear components ( β = 0.25 and β = 0.5 ) differ only in the shape of the left interface. When increasing β (partial figure c), two additional struts develop and the area of the interface is also reduced.
Figure 11 illustrates the normal and shear stress density distributions on the interfaces of the three optimization results. When examining the shear stresses, it is noticeable that, analogous to the previous section, the shear stress σ n s is higher and is therefore focused on by the optimization method. It is evident that the maximum shear stress decreases with an increase in β . Furthermore, it can be seen that the variance of the density distribution also decreases with an increase in β .
When considering the normal stress, it can be seen that although the majority of the density distribution is lower for the lowest β value than for the other two density distributions, there are individual surfaces with higher normal stress. This is probably due to the fact that the interface behavior is considered as an objective function and not as a hard boundary condition.
In summary, it can be stated that the parameter β enables qualitative control of the ratio between normal and shear stress in the interface of the optimization result.

5. Conclusions

In this article, a topology optimization method was developed for the optimization of multi-material structures in which the individual materials are adhesively bonded. For this purpose, two requirements for the optimization method were established based on the analysis of the known load cases of a bonded joint. Based on, the ITED introduced in [27] for 2D problems was further developed for the 3D case by integrating shear stresses, for example. Subsequently, the optimization problem was set up and the sensitivities were derived for it using the Lagrange method. The effectiveness of the optimization method was then demonstrated by applying the method and comparing the optimization results of the multi-material optimization with and without ITED. In addition, a parameter study was used to show that the behavior of different adhesives (different ratios between tensile and shear strengths) can be qualitatively adjusted by varying a newly introduced parameter.
The optimization method developed in [15] can be extended to integrate explicit interface stress constraints based on the Brewer and Lagace failure criterion in 3D. Further research regarding the comparison of the two methods as well as regarding their combined use. Here, for example, strategies are conceivable that initially the interfaces are displaced from the tensile regions (based on the ITED) and subsequently explicit stress constraints ensure that maximum interfacial stresses are maintained. In addition, further research is required on the method to take heterogeneous adhesive properties into account. Moreover, further research is required regarding the validation of the approach. Here, for example, the comparison of the optimization results with and without consideration of the interfaces after previous redesign is beneficial.
The optimization method developed in this article should be extendable to the optimization of more than two materials. Both the RCLSM and the remeshing method can individually handle more than two materials through adaptations already shown in the state-of-the-art. An extension of the ITED for more than two materials can be realized by setting up a density for each pair of materials analogous to Equation (14). However, further research is required in this case as well.
In summary, the developed method was able to solve the challenges of taking into account the interfaces in 3D as described in the introduction.
Author Contributions

Conceptualization, R.R. and A.A.; methodology, R.R. and N.F.; software, R.R. and N.F.; validation, R.R. and A.A.; formal analysis, R.R.; investigation, R.R. and N.F.; data curation, R.R. and N.F.; writing—original draft preparation, R.R.; writing—review and editing, R.R. and N.F.; visualization, R.R.; supervision, A.A.; funding acquisition, A.A. All authors have read and agreed to the published version of the manuscript.

Funding

This research received no external funding.

Institutional Review Board Statement

Not applicable.

Informed Consent Statement

Not applicable.

Data Availability Statement

The data that support the findings of this manuscript are available from the corresponding author upon reasonable request.

Conflicts of Interest

The authors declare no conflicts of interest.

Abbreviations

The following abbreviations are used in this manuscript:
FEFinite Element
FEMFinite Element Method
ITEDInterfacial Tension Energy Density
LSLevel Set
MDPIMultidisciplinary Digital Publishing Institute
MBOMerriman–Bence–Osher
MMAMethod of Moving Asymptotes
RCLSMReconciled Level Set Method
VFLSMVelocity Field Level Set Method
XFEMExtended Finite Element Method

References

  1. Li, D.; Kim, I.Y. Multi-material topology optimization for practical lightweight design. Struct. Multidiscip. Optim. 2018, 58, 1081–1094. [Google Scholar] [CrossRef]
  2. Bendsøe, M.P.; Kikuchi, N. Generating optimal topologies in structural design using a homogenization method. Comput. Methods Appl. Mech. Eng. 1988, 71, 197–224. [Google Scholar] [CrossRef]
  3. Bendsøe, M.P. Optimal shape design as a material distribution problem. Struct. Optim. 1989, 1, 193–202. [Google Scholar] [CrossRef]
  4. Sethian, J.; Wiegmann, A. Structural boundary design via level set and immersed interface methods. J. Comput. Phys. 2000, 163, 489–528. [Google Scholar] [CrossRef]
  5. Wang, M.Y.; Wang, X.; Guo, D. A level set method for structural topology optimization. Comput. Methods Appl. Mech. Eng. 2003, 192, 227–246. [Google Scholar] [CrossRef]
  6. Allaire, G.; Jouve, F.; Toader, A.M. Structural optimization using sensitivity analysis and a level-set method. J. Comput. Phys. 2004, 194, 363–393. [Google Scholar] [CrossRef]
  7. Wang, Y.; Kang, Z. A velocity field level set method for shape and topology optimization. Int. J. Numer. Methods Eng. 2018, 115, 1315–1336. [Google Scholar] [CrossRef]
  8. Svanberg, K. The method of moving asymptotes—A new method for structural optimization. Int. J. Numer. Methods Eng. 1987, 24, 359–373. [Google Scholar] [CrossRef]
  9. Van Dijk, N.P.; Maute, K.; Langelaar, M.; Van Keulen, F. Level-set methods for structural topology optimization: A review. Struct. Multidiscip. Optim. 2013, 48, 437–472. [Google Scholar] [CrossRef]
  10. Wang, M.Y.; Wang, X. “Color” level sets: A multi-phase method for structural topology optimization with multiple materials. Comput. Methods Appl. Mech. Eng. 2004, 193, 469–496. [Google Scholar] [CrossRef]
  11. Merriman, B.; Bence, J.K.; Osher, S.J. Motion of multiple junctions: A level set approach. J. Comput. Phys. 1994, 112, 334–363. [Google Scholar] [CrossRef]
  12. Chen, S.; Gonella, S.; Chen, W.; Liu, W.K. A level set approach for optimal design of smart energy harvesters. Comput. Methods Appl. Mech. Eng. 2010, 199, 2532–2543. [Google Scholar] [CrossRef]
  13. Vogiatzis, P.; Chen, S.; Wang, X.; Li, T.; Wang, L. Topology optimization of multi-material negative Poisson’s ratio metamaterials using a reconciled level set method. Comput.-Aided Des. 2017, 83, 15–32. [Google Scholar] [CrossRef]
  14. Tian, J.; Li, M.; Han, Z.; Chen, Y.; Gu, X.D.; Ge, Q.; Chen, S. Conformal topology optimization of multi-material ferromagnetic soft active structures using an extended level set method. Comput. Methods Appl. Mech. Eng. 2022, 389, 114394. [Google Scholar] [CrossRef]
  15. Renz, R.; Albers, A. Multi-Material Topology Optimization on Separate Tetrahedral Meshes with Explicit Design Resolution by Means of Remeshing. Algorithms 2024, 17, 460. [Google Scholar] [CrossRef]
  16. Feng, Y.; Noda, M.; Noguchi, Y.; Matsushima, K.; Yamada, T. Multi-material topology optimization for additive manufacturing considering dimensional constraints. Comput. Methods Appl. Mech. Eng. 2023, 410, 116027. [Google Scholar] [CrossRef]
  17. Feng, Y.; Yamada, T. Multi-material topology optimization for additive manufacturing considering maximum build volume and assembly process. Eng. Anal. Bound. Elem. 2024, 163, 616–640. [Google Scholar] [CrossRef]
  18. Noda, M.; Matsushima, K.; Yamada, T. Orientation optimization via topological derivatives in combination with multi-material topology optimization based on extended level set method. Comput. Methods Appl. Mech. Eng. 2024, 418, 116585. [Google Scholar] [CrossRef]
  19. Vermaak, N.; Michailidis, G.; Parry, G.; Estevez, R.; Allaire, G.; Brechet, Y. Material interface effects on the topology optimization of multi-phase structures using a level set method. Struct. Multidiscip. Optim. 2014, 50, 623–644. [Google Scholar] [CrossRef]
  20. Liu, Y.; Matsunaka, D.; Shimoda, M.; Shibutani, Y. Interface shape design of multi-material structures for delamination strength. Mech. Eng. J. 2016, 3, 15–00360. [Google Scholar] [CrossRef]
  21. Brewer, J.C.; Lagace, P.A. Quadratic Stress Criterion for Initiation of Delamination. J. Compos. Mater. 1988, 22, 1141–1155. [Google Scholar] [CrossRef]
  22. Liu, P.; Shi, L.; Kang, Z. Multi-material structural topology optimization considering material interfacial stress constraints. Comput. Methods Appl. Mech. Eng. 2020, 363, 112887. [Google Scholar] [CrossRef]
  23. Behrou, R.; Lawry, M.; Maute, K. Level set topology optimization of structural problems with interface cohesion. Int. J. Numer. Methods Eng. 2017, 112, 990–1016. [Google Scholar] [CrossRef]
  24. Lawry, M.; Maute, K. Level set shape and topology optimization of finite strain bilateral contact problems. arXiv 2017, arXiv:1701.06092. [Google Scholar] [CrossRef]
  25. Liu, P.; Luo, Y.; Kang, Z. Multi-material topology optimization considering interface behavior via XFEM and level set method. Comput. Methods Appl. Mech. Eng. 2016, 308, 113–133. [Google Scholar] [CrossRef]
  26. Liu, P.; Kang, Z. Integrated topology optimization of multi-component structures considering connecting interface behavior. Comput. Methods Appl. Mech. Eng. 2018, 341, 851–887. [Google Scholar] [CrossRef]
  27. Kim, C.; Seong, H.K.; Kim, I.Y.; Yoo, J. Single variable-based multi-material structural optimization considering interface behavior. Comput. Methods Appl. Mech. Eng. 2020, 367, 113114. [Google Scholar] [CrossRef]
  28. Renz, R.; Frank, N.; Albers, A. Three-dimensional multi-material topology optimization considering interface behavior. In Proceedings of the 15th World Congress of Structural and Multidisciplinary Optimization (WCSMO 2023), Cork, Ireland, 5–9 June 2023. [Google Scholar]
  29. Rasche, M. Handbuch Klebtechnik; Hanser eLibrary, Hanser Verlag: München, Germany, 2012. [Google Scholar] [CrossRef]
  30. Osher, S.; Fedkiw, R. Level Set Methods and Dynamic Implicit Surfaces; Number 153 in Applied Mathematical Sciences; Springer: New York, NY, USA; Berlin/Heidelberg, Germany, 2003. [Google Scholar]
  31. Faraj, N.; Thiery, J.M.; Boubekeur, T. Multi-material adaptive volume remesher. Comput. Graph. 2016, 58, 150–160. [Google Scholar] [CrossRef]
  32. Aage, N.; Lazarov, B.S. Parallel framework for topology optimization using the method of moving asymptotes. Struct. Multidiscip. Optim. 2013, 47, 493–505. [Google Scholar] [CrossRef]
  33. Lazarov, B.S.; Sigmund, O. Filters in topology optimization based on Helmholtz-type differential equations. Int. J. Numer. Methods Eng. 2011, 86, 765–781. [Google Scholar] [CrossRef]
  34. Barill, G.; Dickson, N.G.; Schmidt, R.; Levin, D.I.W.; Jacobson, A. Fast winding numbers for soups and clouds. ACM Trans. Graph. 2018, 37, 1–12. [Google Scholar] [CrossRef]
  35. Lopes, D.S.; Silva, M.T.; Ambrósio, J.A. Tangent vectors to a 3-D surface normal: A geometric tool to find orthogonal vectors based on the Householder transformation. Comput.-Aided Des. 2013, 45, 683–694. [Google Scholar] [CrossRef]
  36. De Los Reyes, J.C. Numerical PDE-Constrained Optimization; SpringerBriefs in Optimization; Springer International Publishing: Cham, Switzerland, 2015. [Google Scholar] [CrossRef]
  37. Schmidt, S. Efficient Large Scale Aerodynamic Design Based on Shape Calculus. Ph.D. Thesis, University of Trier, Trier, Germany, 2010. [Google Scholar]
  38. Wu, J.; Dick, C.; Westermann, R. A System for High-Resolution Topology Optimization. IEEE Trans. Vis. Comput. Graph. 2016, 22, 1195–1208. [Google Scholar] [CrossRef]
  39. Li, H.; Yamada, T.; Jolivet, P.; Furuta, K.; Kondoh, T.; Izui, K.; Nishiwaki, S. Full-scale 3D structural topology optimization using adaptive mesh refinement based on the level-set method. Finite Elem. Anal. Des. 2021, 194, 103561. [Google Scholar] [CrossRef]
Figure 1. Five different load cases of adhesive bonds, whereby a bond is made up of the two bonding partners (gray and blue) and the adhesive (orange). (a) Compressive loading. (b) Tensile loading. (c) Shear loading. (d) Peel loading. (e) Split loading.
Applsci 15 07612 g001
Figure 2. The combination of the values of the two level set functions φ 1 ( x ) (gray) and φ 2 ( x ) (blue) represents the multi-material system in the design domain D. The interface of the two materials is referred to as Γ [15].
Applsci 15 07612 g002
Figure 3. Orthonormal basis { n , s , t } at a point on the interface Γ . The normal vector n is calculated from the corresponding LSF φ and the two tangent vectors s and t using the Householder transformation.
Applsci 15 07612 g003
Figure 4. Design space of the cantilever beam with a symmetry plane. It is fixed ( u x = u y = u z = 0 ) at the top on the back and is floating ( u x = u y = 0 ) at the bottom on the back. The force F in the negative z-direction is applied on the front surface [15].
Applsci 15 07612 g004
Figure 5. Optimization results of the cantilever case. (a) Multi-material optimization (iteration 777). (b) Multi-material optimization with the ITED and β = 0.25 (iteration 959). The optimization with consideration of the ITED (b) shifts interfaces out of high-tension and high-shear regions.
Applsci 15 07612 g005
Figure 6. Density plots of the normal σ n n and shear stresses σ n s as well as σ n t of the interface for the cantilever case. When taking the ITED into account, both the tensile stress and the maximum shear stresses on the interface are reduced.
Applsci 15 07612 g006
Figure 7. Design space of the bracket with a fixed support ( u x = u y = u z = 0 ) at the top right and a load application at the lower left in the negative y-direction with the amount of F. The inner radius of the two cylinders is 16 and the outer radius is 20.
Applsci 15 07612 g007
Figure 8. Optimization results of the bracket case. (a) Multi-material optimization (iteration 162). (b) Multi-material optimization with the ITED and β = 0.25 (iteration 217). Material 2 (blue) in the optimization with consideration of the ITED consists of two components, whereas it consists of one in the other case.
Applsci 15 07612 g008
Figure 9. Density plots of the normal σ n n and shear stresses σ n s as well as σ n t of the interface for the bracket case. When taking the ITED into account, both the tensile stress and the maximum shear stresses on the interface are reduced.
Applsci 15 07612 g009
Figure 10. Optimization results of the bracket case for different values of the parameter β (a) β = 0 (iteration 245). (b) β = 0.25 (iteration 217). (c) β = 0.5 (iteration 198). Material 2 (blue) in the optimization with β = 0 consists of one component, whereas it consists of two components in the other two optimizations.
Applsci 15 07612 g010
Figure 11. Density plots of the normal σ n n and shear stresses σ n s as well as σ n t of the interface for three different values of the parameter β . The σ n s diagram illustrates that the maximum shear stresses decrease as the value of β increases.
Applsci 15 07612 g011
Table 1. General parameters for all cases.
E 1 E 2 ν 1 ν 2 v m i n v m a x v n d s α
70,00035,0000.30.3−0.30.3−0.20.01
Table 2. Parameters for the cantilever. Pure multi-material topology optimization (top). With consideration of ITED (bottom).
f ¯ V 1 f ¯ V 2 β w c w i t e d w r i w r s c ( M M A ) l t a r
0.075 0.075 0.8 0.15 0.05 450.0 2.0
0.25 0.65 0.15 0.15 0.05
Table 3. Parameters for the bracket. Pure multi-material topology optimization (top). With consideration of ITED (bottom).
f ¯ V 1 f ¯ V 2 β w c w i t e d w r i w r s c ( M M A ) l t a r
0.25 0.2 0.88 0.02 0.1 50.0 1.5
0.25 0.78 0.1 0.02 0.1
Disclaimer/Publisher’s Note: The statements, opinions and data contained in all publications are solely those of the individual author(s) and contributor(s) and not of MDPI and/or the editor(s). MDPI and/or the editor(s) disclaim responsibility for any injury to people or property resulting from any ideas, methods, instructions or products referred to in the content.