Article

Dynamic Interaction Analysis of Long-Span Bridges Under Stochastic Traffic and Wind Loads

1
International College of Engineering, Changsha University of Science and Technology, Changsha 410114, China
2
School of Civil and Environmental Engineering, Changsha University of Science and Technology, Changsha 410114, China
3
College of Civil Engineering, Xiangtan University, Xiangtan 411105, China
4
School of Civil Engineering, Central South University, Changsha 410075, China
*
Author to whom correspondence should be addressed.
Appl. Sci. 2025, 15(13), 7577; https://doi.org/10.3390/app15137577
Submission received: 20 May 2025 / Revised: 2 July 2025 / Accepted: 4 July 2025 / Published: 6 July 2025
(This article belongs to the Section Civil Engineering)

Abstract

An innovative method is proposed to analyze the coupled vibration between random traffic and large-span bridges under the combined action of wind loads. The dynamic behavior of bridges subjected to these multifactorial influences is investigated through a comprehensive bridge dynamics model. Specifically, a refined full-bridge finite element model is developed to simulate the traffic–bridge coupled vibration, with wind forces applied as external dynamic loads. The effects of wind speed and vehicle speed on the coupled system are systematically evaluated using the finite element software ABAQUS 2023. To ensure computational accuracy and efficiency, the large-span nonlinear dynamic solution method is employed, integrating the Newmark-β time integration method with the Newton–Raphson iterative technique. The proposed method is validated through experimental measurements, demonstrating its effectiveness in capturing the synergistic impacts of wind and traffic on bridge dynamics. By incorporating the stochastic nature of traffic flow and combined wind forces, this approach provides a detailed analysis of bridge responses under complex loading conditions. The study establishes a theoretical foundation and practical reference for the safety assessment of large-span bridges.

1. Introduction

With the rapid expansion of global transportation networks, large-span bridges have emerged as a critical infrastructure for connecting key regions [1,2,3]. However, the structural response of these bridges in complex geographic environments has become increasingly intricate [4,5,6]. This complexity is primarily due to the combined effects of multiple dynamic factors, including wind and vehicular loads, including wind and vehicular loads, which interact with the bridge to induce complex coupled vibration behaviors [7,8,9,10]. These interactions amplify the nonlinearity and uncertainty of the bridge’s dynamic response, posing substantial risks to its safety and stability [11,12,13,14,15]. Therefore, a comprehensive analysis of the dynamic response of large-span bridges under the combined action of wind and stochastic traffic is essential for ensuring the safety of both the bridge structure and the vehicles operating on it.
The effects of wind loads or vehicle loads have been widely explored in existing bridge vibration studies. Wu et al. [16] developed an analytical framework for ice–wind–vehicle–bridge interaction, focusing primarily on the effects of ice loading with less emphasis on the coupling effects of wind loading. Wang et al. [17] investigated the dynamic response of bridges under varying wind velocities but did not consider the stochastic nature of traffic flow and its impact on bridge vibrations. Zhang et al. [18] developed a coupled wind–vehicle–bridge interaction analysis method incorporating triangular wind barrier shielding effects, demonstrating that optimized barrier geometry significantly mitigates train accelerations with minimal impact on bridge dynamics and vehicle safety indices. This research is crucial for advancing bridge design and safety assessment under challenging conditions.
Meanwhile, the impact of stochastic traffic flow on bridges has increasingly attracted attention. Traditional vehicle–bridge coupling models typically assume that traffic flow is a constant load, thereby neglecting its randomness and dynamic nature [19,20,21,22,23]. In reality, the speed, flow, and distribution of traffic are highly randomized, which can significantly influence the dynamic response of bridges [24,25,26]. In practice, the combined effects of variations in traffic flow and wind loads may lead to significant nonlinear vibrations in bridges [27,28,29]. Therefore, analyzing the dynamic response of large-span bridges by integrating the randomness of traffic flow with the combined effects of wind loads is crucial for enhancing bridge safety.
Recent studies have highlighted the importance of considering the stochastic nature of traffic loads, as well as the directional and nonlinear characteristics of wind forces. For example, a directional wind–vehicle–bridge model has been developed to provide a comprehensive framework for evaluating the dynamic responses of bridges and vehicles under multi-directional and nonlinear wind loads. Zinno et al. [30] provided an overview of the role of AI in data-driven structural health monitoring (SHM) systems for bridges, examining recent advancements, conceptual frameworks, advantages, challenges, and potential future research directions. Jonathan et al. [31] used a U-Net neural network to identify acoustic emission signal onset times as a 1D segmentation task, validated on PLB data for potential real-time monitoring. Zhou et al. [32] developed an integrated simulation platform for analyzing bridge–traffic system dynamics under multi-hazard conditions (wind, seismic, road roughness), enabling a concurrent evaluation of structural integrity and vehicle safety. Yin et al. [33] investigated the effects of stochastic traffic flow on long-span suspension bridges but did not consider the coupling effects of the wind loads. Wei et al. [34] analyzed the dynamic response of floating bridges under stochastic traffic flow but did not delve into the combined influence of wind and traffic loads. This approach emphasizes the necessity for developing more accurate and site-specific models to capture the complex interactions among traffic and wind loads, thereby enhancing the reliability and safety of large-span bridges [35,36,37].
To address this challenge, this paper proposes an innovative method for analyzing the coupled vibration of stochastic traffic flow and bridge dynamics under wind action, as illustrated in Figure 1. The method aims to comprehensively consider the combined effects of wind and stochastic traffic on large-span bridges. This model accurately describes the effects of stochastic traffic and wind interaction on the bridge vibration response and addresses the limitations of previous simplified assumptions of single-load analysis. The validity of the proposed method is verified using measured data, and the dynamic response of the bridge under varying wind speeds and traffic densities is analyzed through numerical simulations. The time-domain and frequency-domain diagrams of the bridge vibration under the traffic–bridge coupled action are also investigated in detail. The results provide a theoretical foundation and practical reference for the safety assessment of large-span bridges under complex loading conditions.

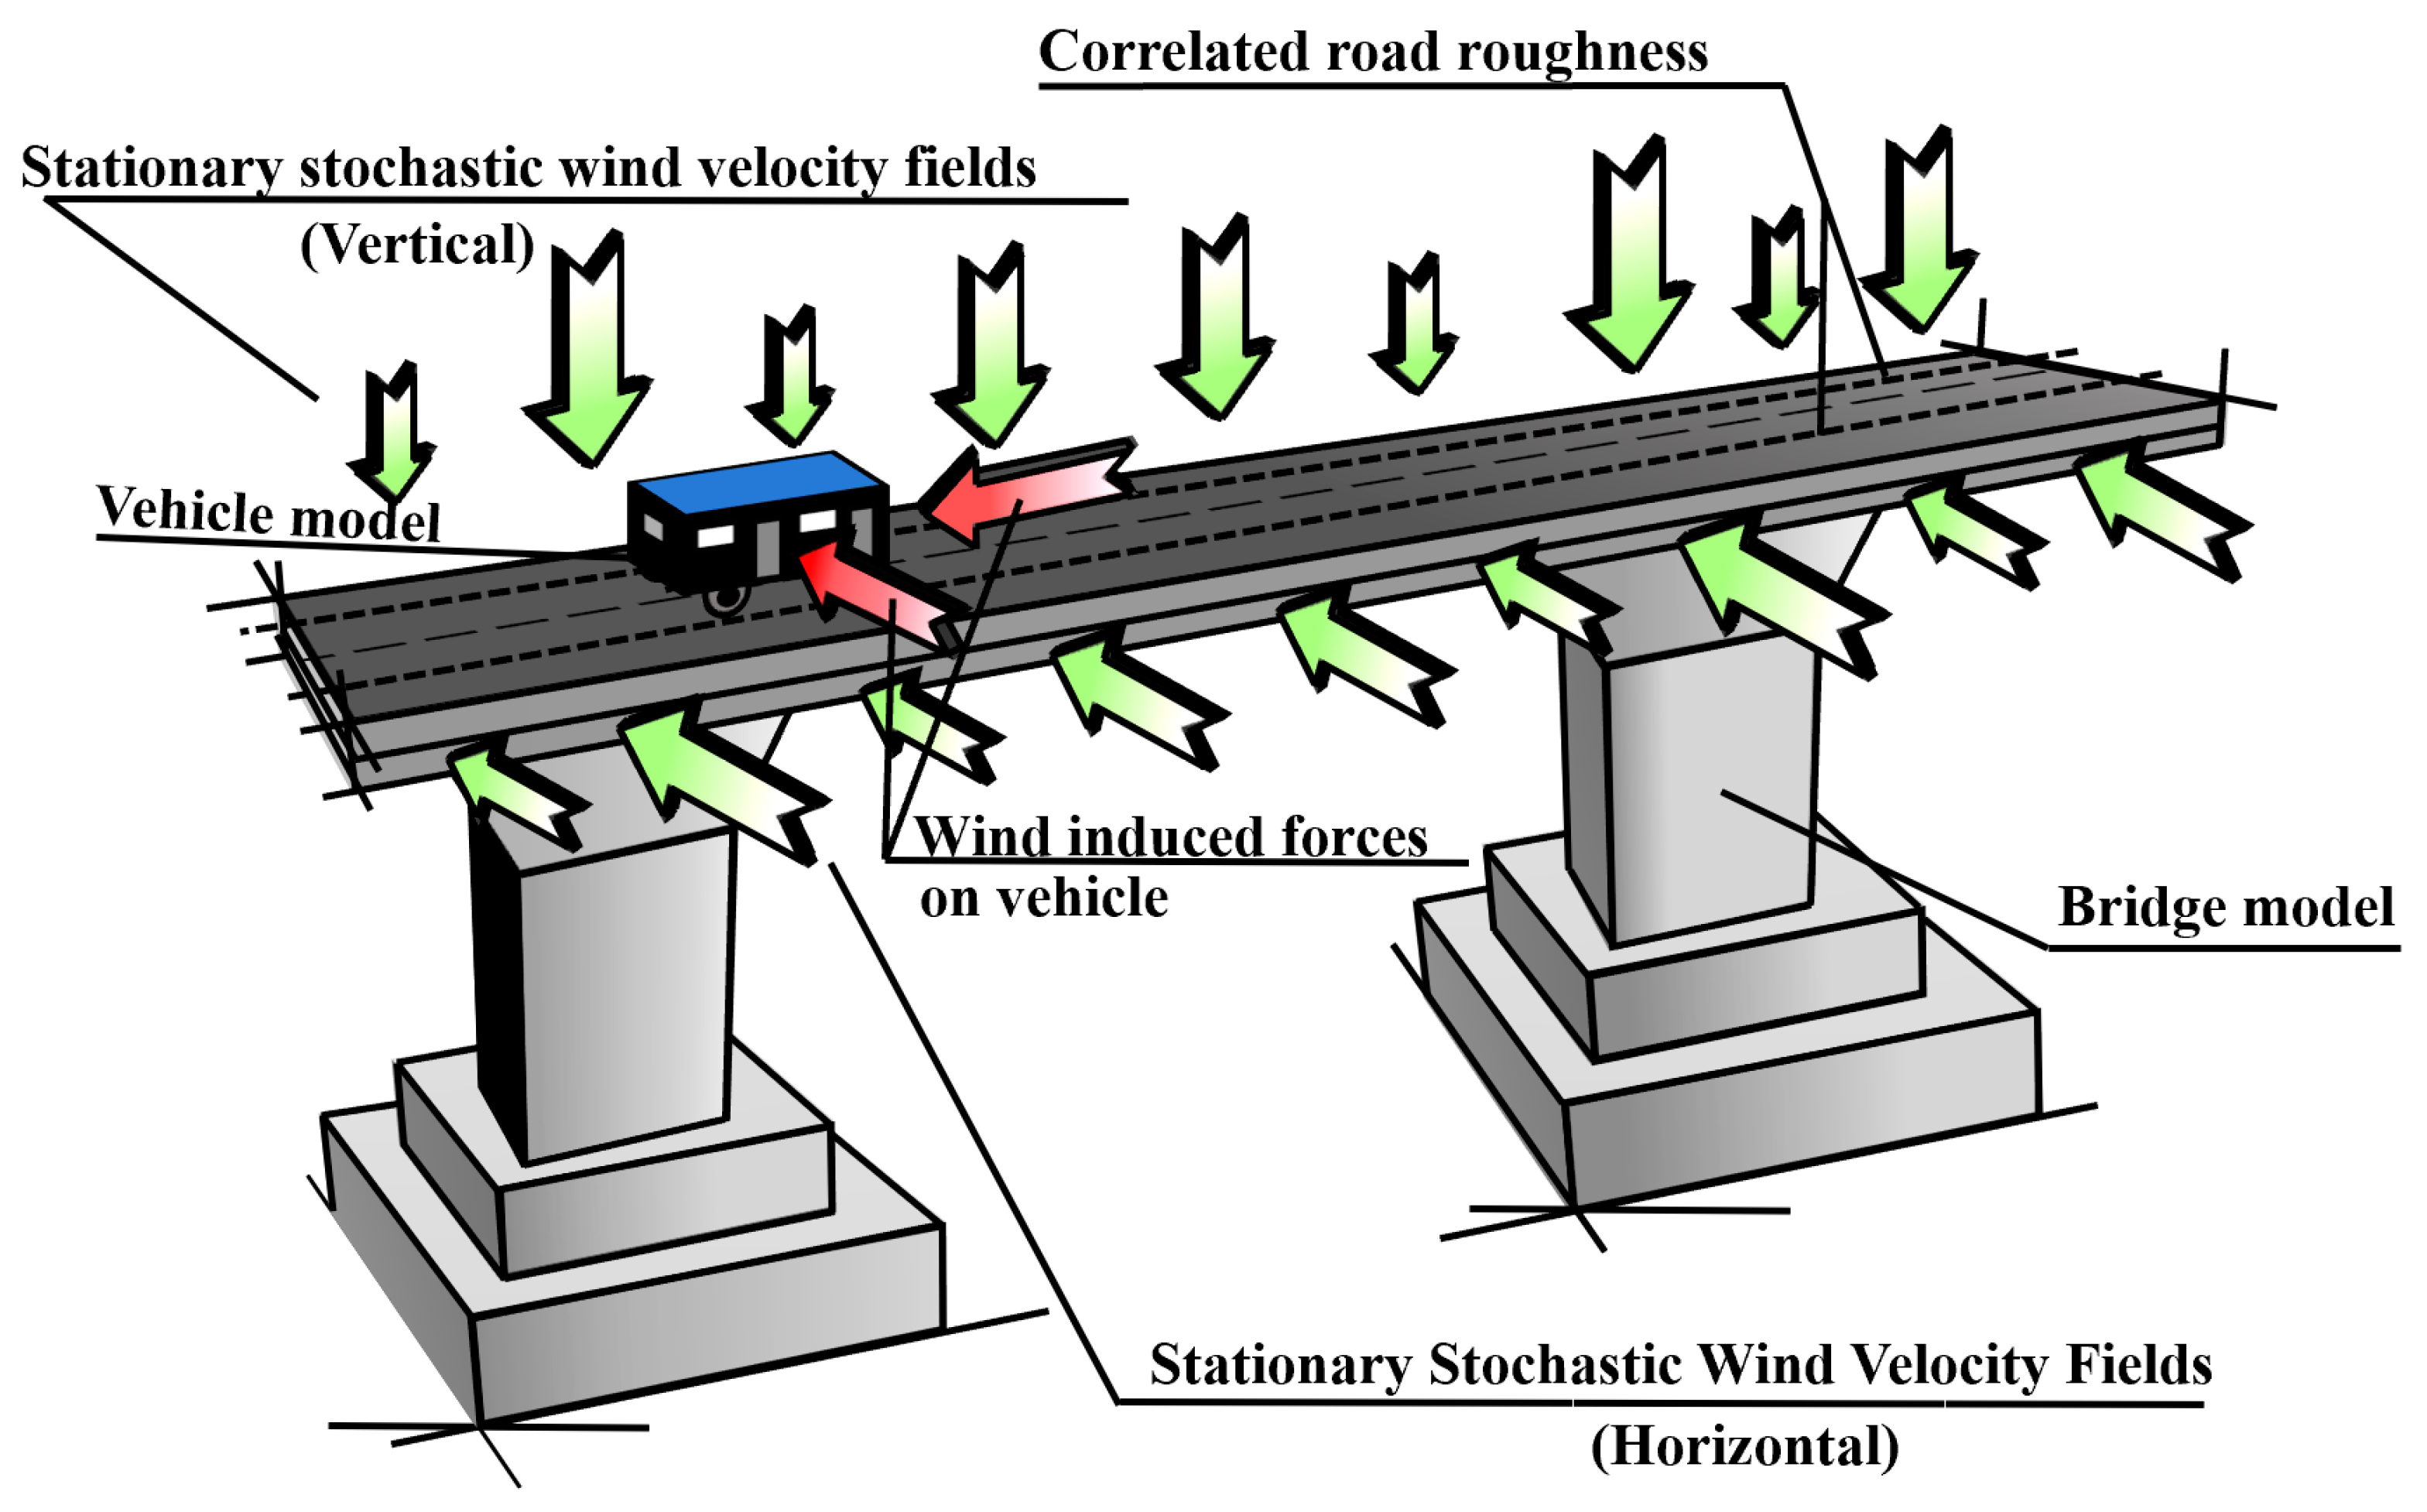
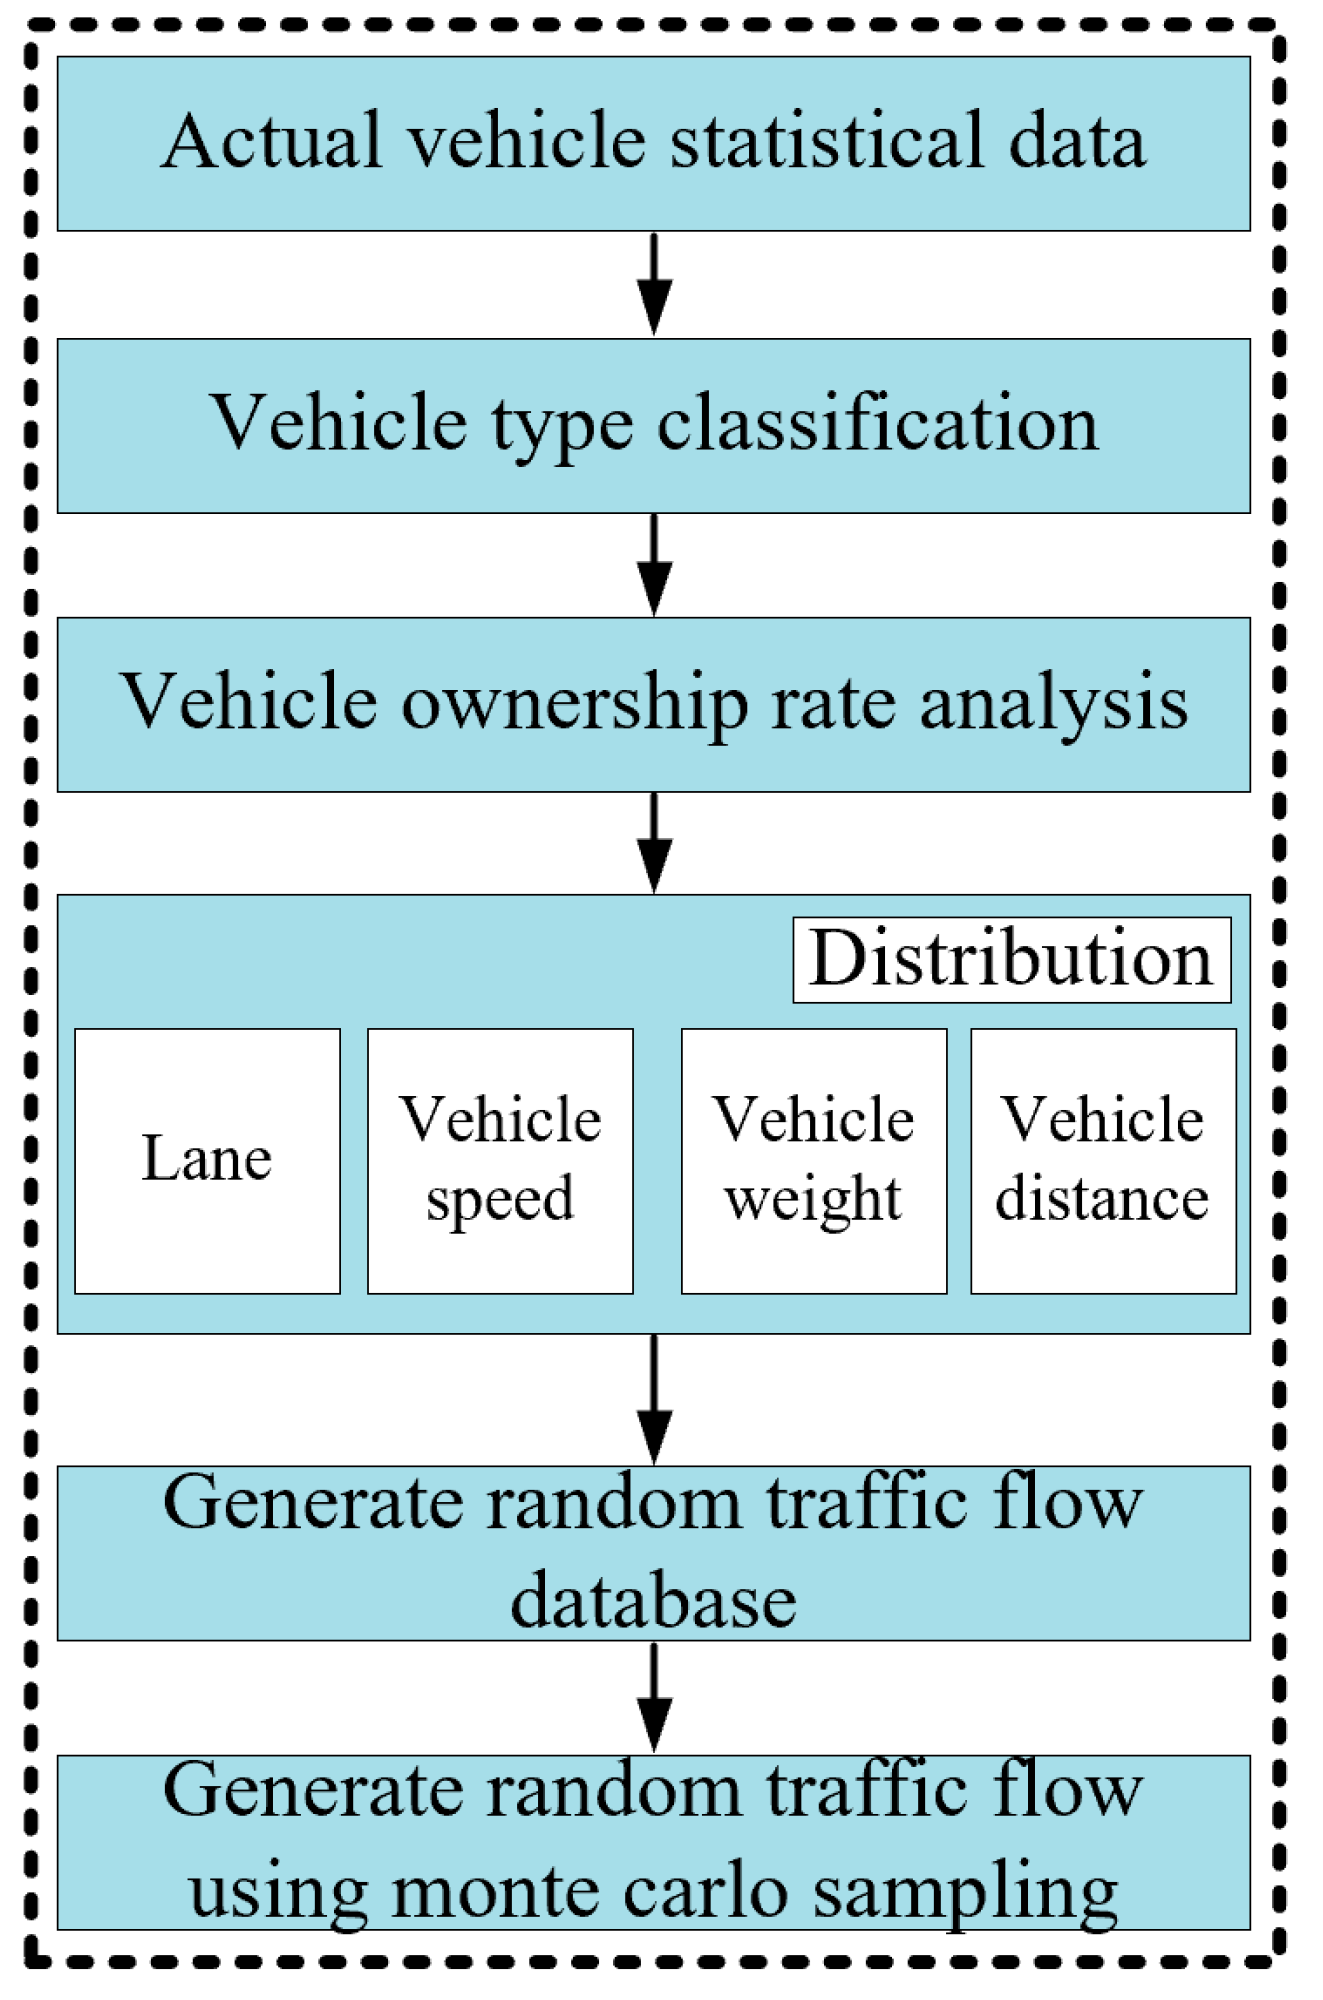
2. Framework for Stochastic Traffic–Bridge Coupled Vibration Under Combined Wind Action

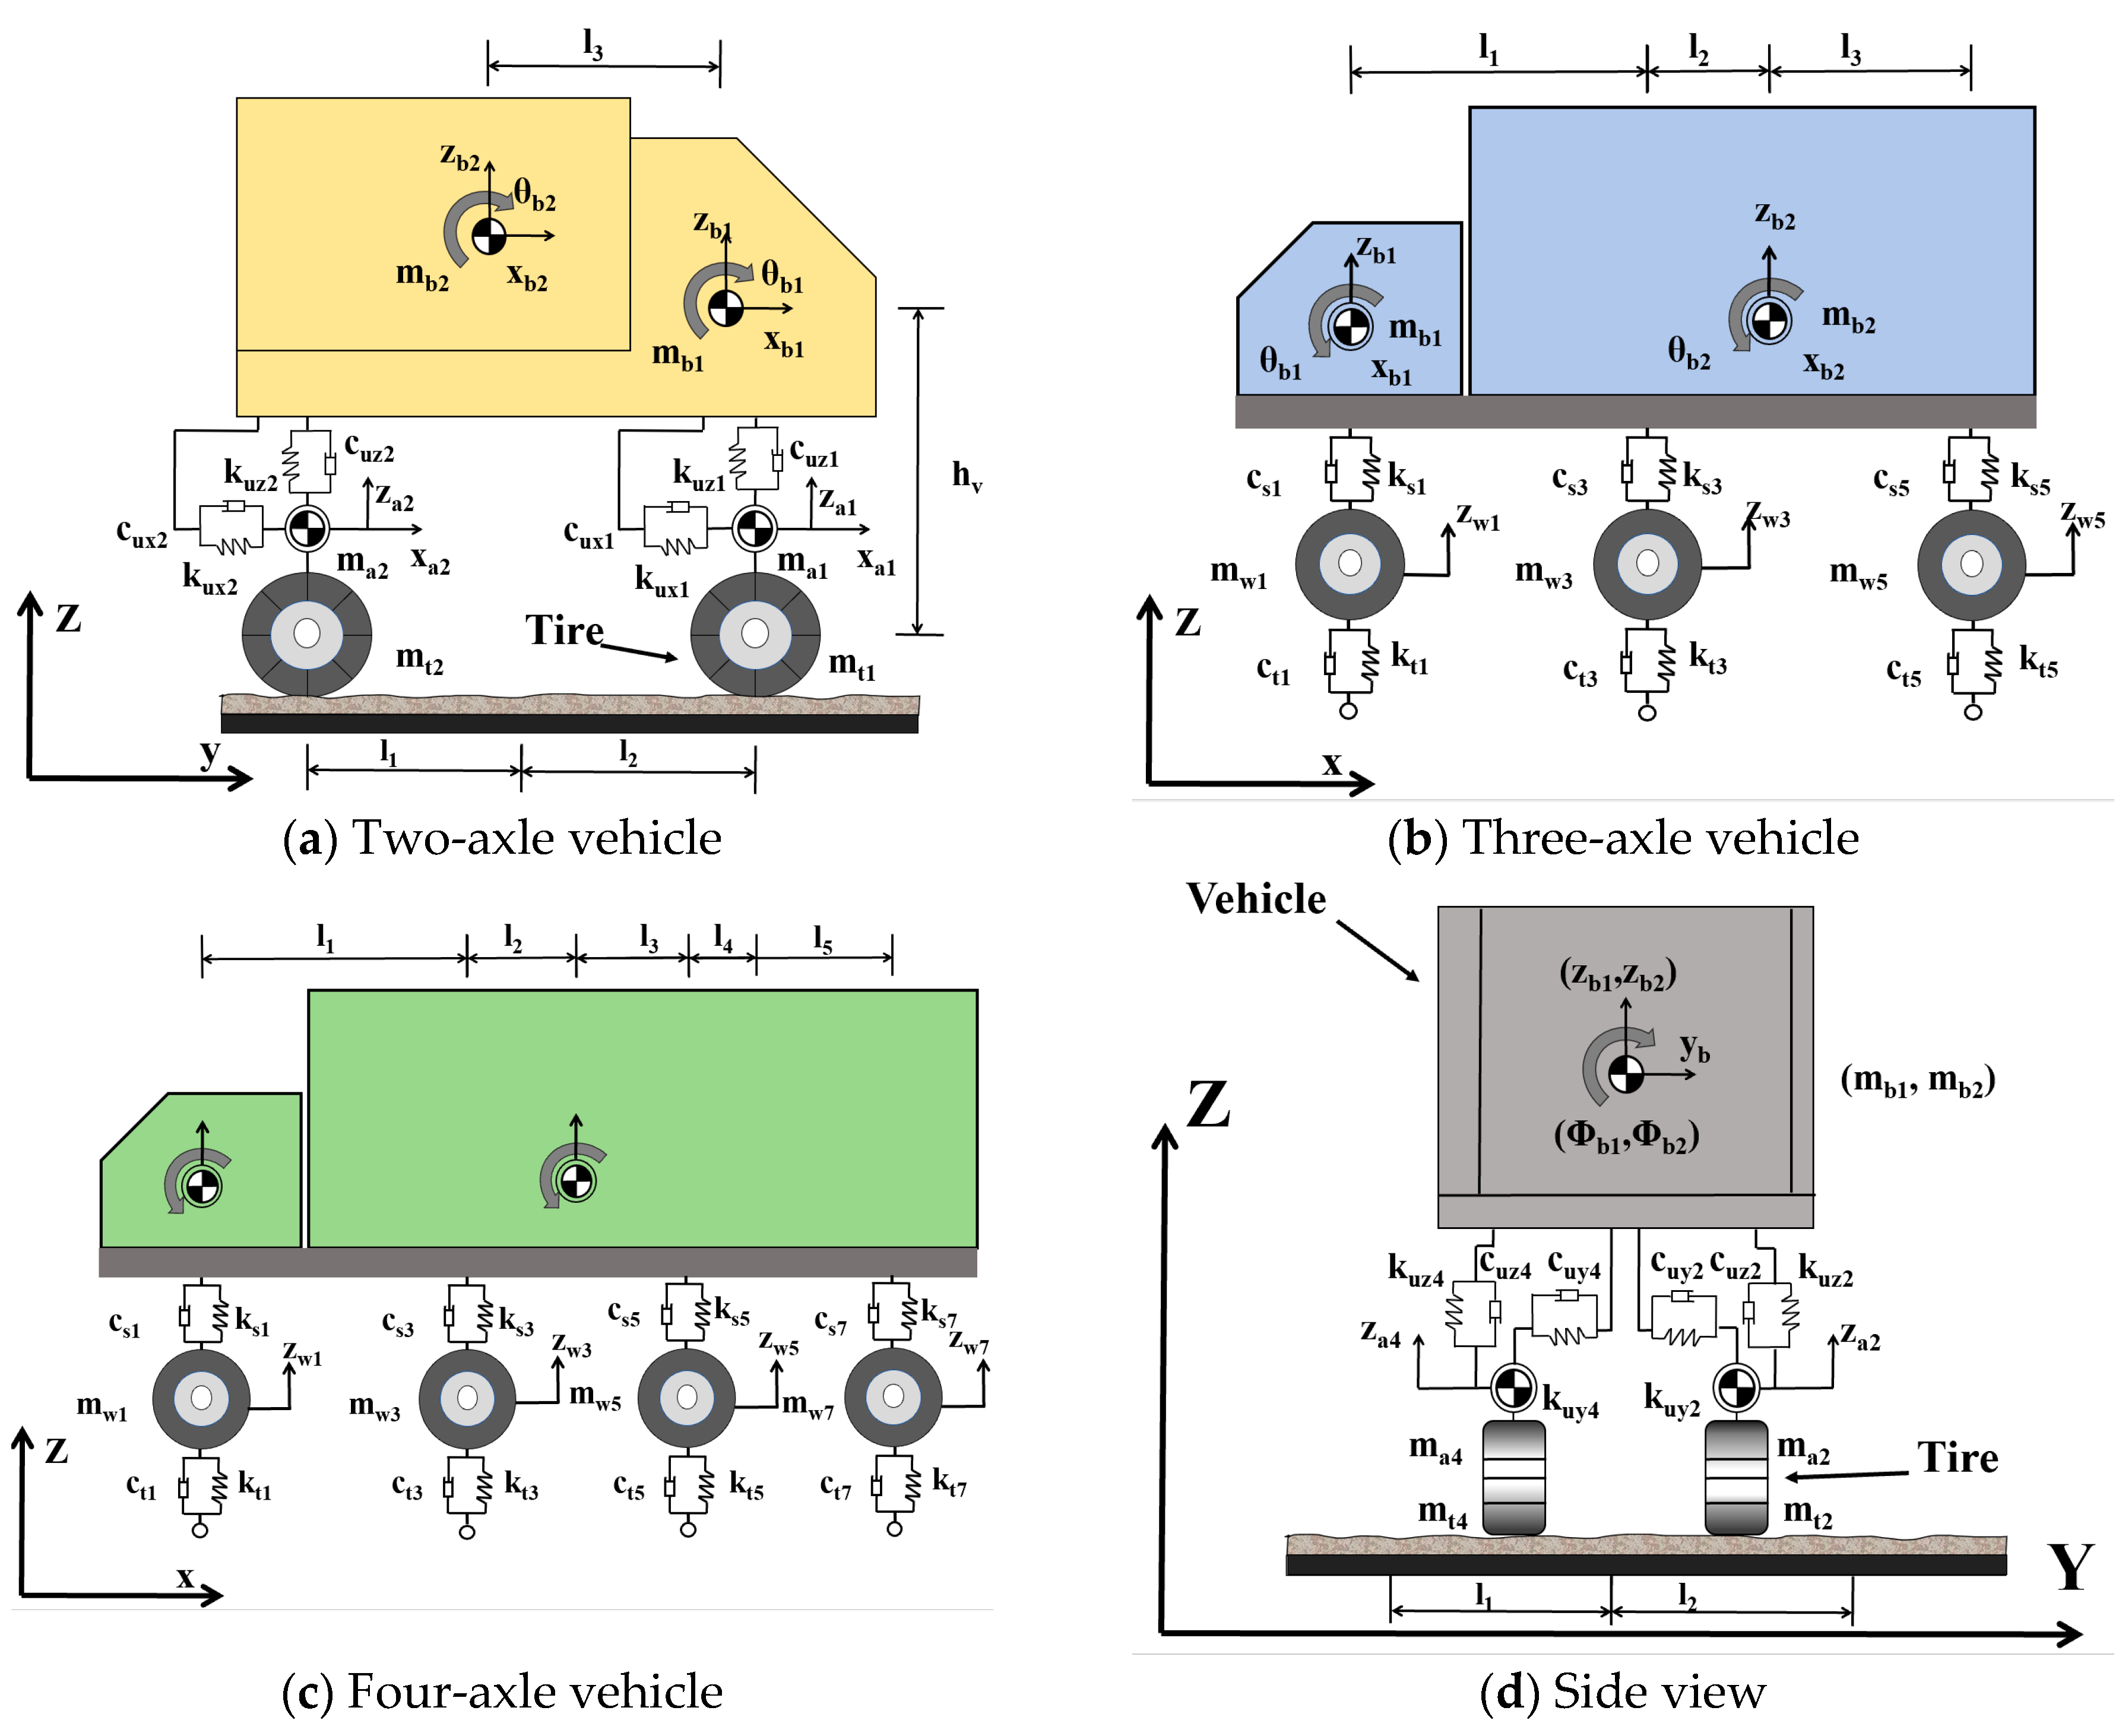
2.1. Vehicle–Bridge Coupling Dynamics Equation

In the vehicle–bridge coupled vibration analysis of large-span bridges, the bridge is typically modeled as a multi-degree-of-freedom system, and the vehicle is coupled to the bridge through a mass model. The displacement vector of the bridge is denoted as Xb(t) = [x1(t), x2(t), x3(t), …, xn(t)]T, the mass of the vehicle is m, its velocity is v(t), and its position is s(t). The bridge dynamic equation is
M b X ¨ b ( t ) + C b X ˙ b ( t ) + K b X b ( t ) = F v ( t )
where M b , C b , and K b are the mass, damping, and stiffness matrices of the bridge, respectively, and F v ( t ) is the load applied to the bridge by the vehicle.
The dynamics of a vehicle are usually simplified by means of a mass–spring–damper model, as shown in Figure 2. The mass, velocity, and displacement of the vehicle are m v , v ( t ) , and x v ( t ) . The vehicle power equation is
m v x ¨ v + C v x ˙ v ( t ) + K v x v ( t ) = F v ( t )
where C v is the damping of the vehicle and K v is the stiffness of the vehicle.
Pavement roughness significantly influences the dynamic interaction between vehicles and bridges, particularly by inducing vibrations in bridges as vehicles traverse them. This roughness is typically modeled using the power spectral density (PSD) function of the pavement’s surface unevenness. It is assumed that the pavement roughness is described by a stochastic process that can be expressed by the following equation:
r ( x ) = r 0 + ε ( x )
where r ( x ) is the pavement height at location x , r 0 is the average pavement height, ε ( x )  is a random perturbation of the pavement unevenness, and ε ( x ) is usually assumed to be a Gaussian white noise process.
The interaction force between the vehicle and the road surface can be expressed as
F r o a d ( t ) = k r o a d r ( x ) = k r o a d ( r 0 + ε ( x ) )
where F r o a d ( t ) is the load due to road roughness and k r o a d is the pavement stiffness coefficient.
By integrating the vehicle dynamics equation, the bridge dynamics equation, and accounting for the impact of pavement roughness, the dynamic equation for the vehicle–bridge coupling system can be formulated as follows:
M b X ¨ b ( t ) + C b X ˙ b ( t ) + K b X b ( t ) = i = 1 n m v i v i ( t ) δ ( x x i ( t ) ) + F r o a d ( t )
where m v i is the mass of vehicle i , v i ( t ) is the velocity of vehicle i , and x i ( t ) is the position of vehicle i on the bridge.
Pavement roughness affects the dynamic coupling between the vehicle and the bridge through the perturbation of its stochastic process ε ( x ) . The coupling effect between the vehicle and the bridge due to pavement roughness transmits additional vibrations caused by the road surface unevenness to the bridge. This transmission, in turn, significantly affects the dynamic response of the bridge. Differentiated vehicle types, densities, and speed arrangements were used for the traffic characteristics of the different lanes, and the pavement roughness [38] was assumed to be in good condition. Accurately modeling this coupling is essential for predicting the bridge’s vibration behavior under traffic loads. The vehicle–bridge coupling vibration model is shown in Figure 3.

2.2. Derivation of Wind Loads

Wind load is a primary external force acting on bridges and is typically calculated based on wind speed, air density, and the bridge’s windward area. Assuming that the wind speed is U ( t ) , the air density (kg/m3) is ρ a , the wind resistance coefficient is C D , and the windward area of the bridge is A , the wind load force can be expressed as
F w i n d ( t ) = 1 2 ρ a A C D U ( t ) 2 e
where e is a unit vector indicating the direction of action of the wind load. Wind loads usually act on the transverse degrees of freedom of a bridge, so this force has an important effect on the transverse vibration of the bridge. The wind speed U ( t ) can be modeled using a wind speed spectrum, and the fluctuating part of the wind speed is usually described by a Gaussian process:
U ( t ) = U 0 + Δ U ( t )
where U 0 is the average wind speed and Δ U ( t ) is the fluctuating part of the wind speed. The pulsation characteristics of wind load, described by the wind speed spectrum, significantly influence the dynamic response of structures.

3. Nonlinear Dynamic Solution Methods for Large-Span Structures

In examining the dynamic behavior of a long-span bridge under the influence of wind and stochastic traffic loads, the resulting dynamic equations often display pronounced nonlinear features. To tackle this nonlinear coupled vibration issue, this research adopts the Newmark-β method for time-domain integration, coupled with the Newton–Raphson method for iteratively resolving the nonlinear equations. Specifically, the Newmark-β method is employed to discretize the second-order differential equations, enabling the calculation of the system’s dynamic response. In parallel, the Newton–Raphson method is used to handle the system’s nonlinear characteristics by iteratively approximating the solutions of the nonlinear equations in a step-by-step manner. This combined approach effectively addresses the nonlinear dynamics challenges in vehicle–bridge interaction systems. ABAQUS is adopted to solve the structural dynamic response. In ABAQUS, contact nonlinearity is considered by defining contact pairs and specifying the contact behavior between different parts of the structure. Material nonlinearity is taken into account by selecting appropriate material models that capture the nonlinear stress–strain relationship. Geometric nonlinearity is considered by enabling large deformation analysis, which allows for the accurate simulation of the structure’s behavior under significant displacements and rotations.

3.1. Newmark-β Method

The Newmark-β method is a numerical integration technique used to solve second-order differential equations, which are commonly encountered in dynamic system analysis. This method is particularly useful for its stability and accuracy in handling structural dynamics problems. The basic method is as follows:
X b ( t + Δ t ) = X b ( t ) + Δ t X ˙ b ( t ) + Δ t 2 2 [ ( 1 2 β ) X ¨ b ( t ) + 2 β X ¨ b ( t + Δ t ) ]
X ˙ b ( t + Δ t ) = X ˙ b ( t ) + Δ t [ ( 1 γ ) X ¨ b ( t ) + γ X ¨ b ( t + Δ t ) ]
where β and γ are the Newmark parameters, and the method is usually unconditionally stable when β = 1 / 4 and γ = 1 / 2 are taken. Δ t is the time step.

3.2. Newton–Raphson Methodology

To address the dynamic equations containing nonlinear terms—such as those characterizing significant nonlinear responses in the coupled vehicle–bridge system—the Newton–Raphson method is employed for obtaining iterative solutions. This method essentially linearizes the nonlinear equations and progressively approximates the solution through iterative steps until convergence is achieved.
The dynamic equations are
M b X ¨ b ( t ) + C b X ˙ b ( t ) + K b X b ( t ) + F n o n l i n e a r ( X b ) = F t o t a l ( t )
where F n o n l i n e a r ( X b ) denotes the nonlinear term in the system.
In order to apply the Newton–Raphson method, the above equations are linearized to obtain the iterative formula:
R ( X b ( k ) ) = M b X ¨ b ( k ) + C b X ˙ b ( k ) + K b X b ( k ) + F n o n l i n e a r ( X b ( k ) ) F t o t a l ( t + Δ t ) = 0
The residuals R ( X B ( k ) ) are linearized by the Taylor expansion to obtain the update formula:
X b ( k + 1 ) = X b ( k ) R X b 1 R ( X b ( k ) )
where R X b is the Jacobi matrix of residuals over displacements (i.e., the modified form of the stiffness matrix).

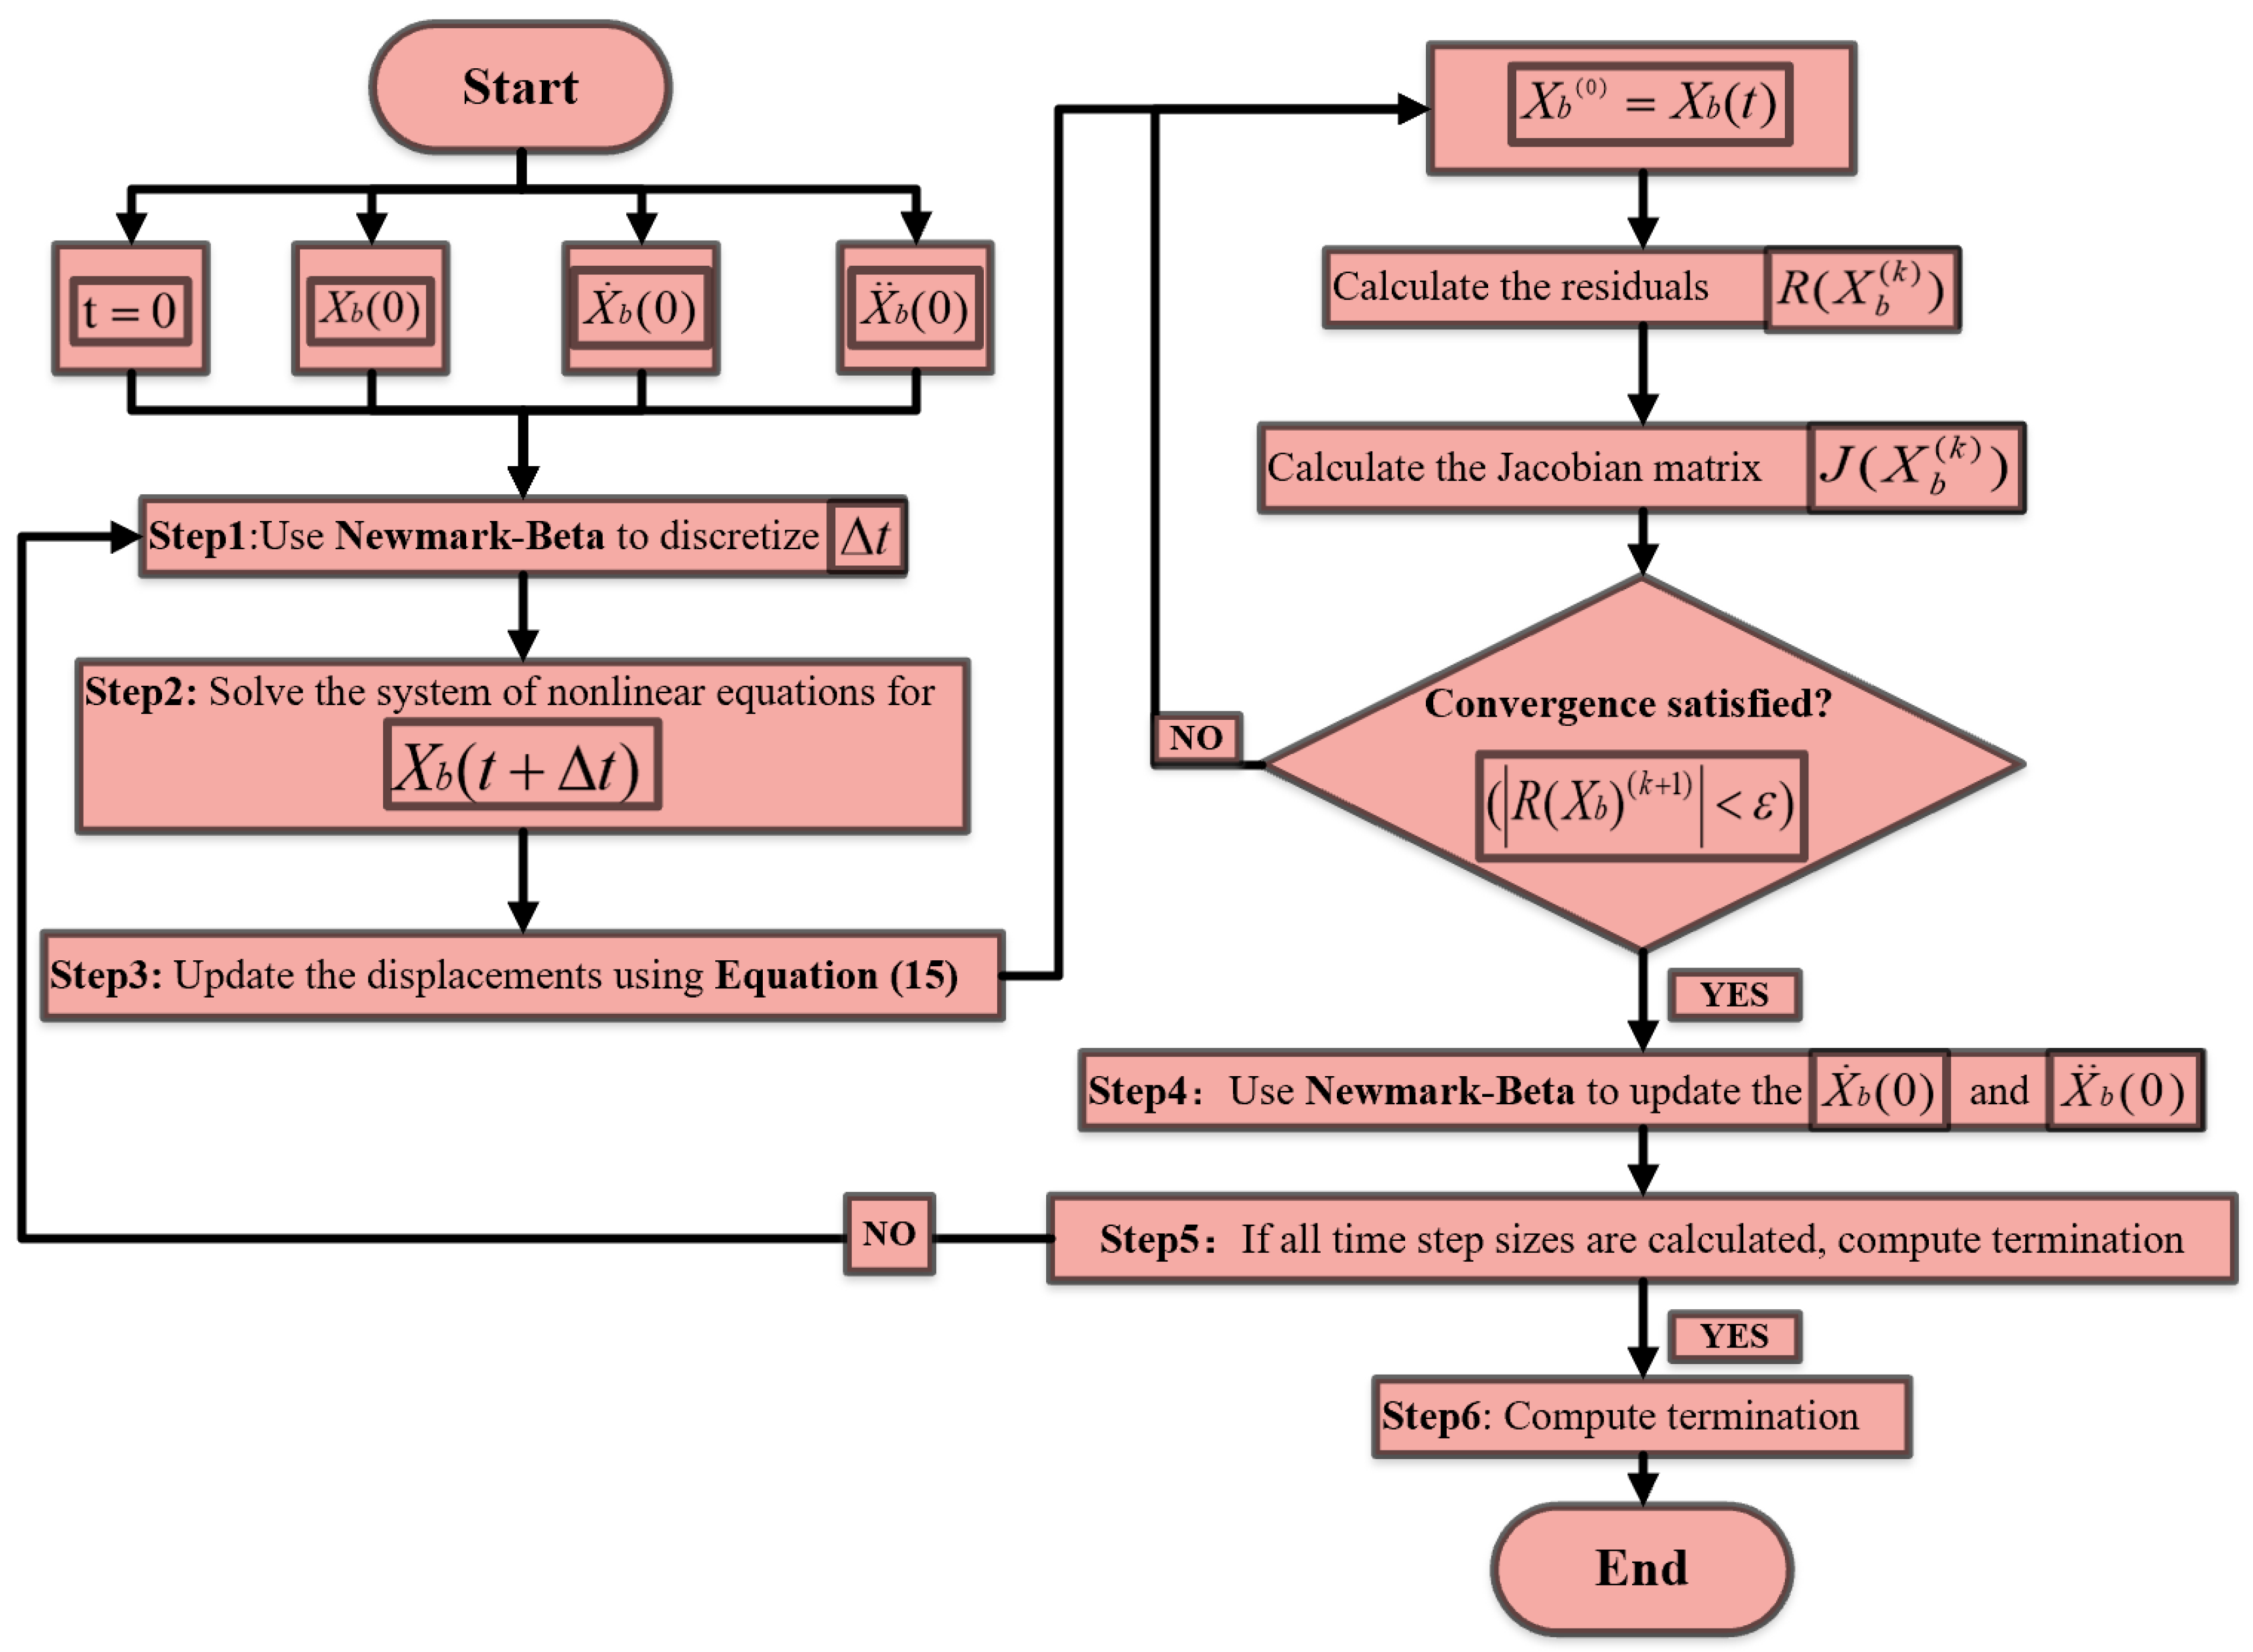
3.3. Large-Span Nonlinear Dynamics Solution

This section outlines the steps involved in solving joint dynamics using numerical methods. We employed the Newmark-β method for time-step discretization and the Newton–Raphson method for an iterative solution of the resulting nonlinear equations. The steps are as follows:
(1)
Initial conditions: The initial displacement X b ( 0 ) , initial velocity X ˙ b ( 0 ) , and initial acceleration X ¨ b ( 0 ) are given at the initial moment t = 0.
(2)
Time-step discretization (Newmark-β method): The kinetic equations are discretized within time step Δ t using the Newmark-β method to obtain a system of nonlinear equations with respect to X b ( t + Δ t ) . This method was chosen for its balance between computational efficiency and accuracy in handling dynamic systems.
(3)
Iterative solution (Newton–Raphson method): For each time step t + Δ t , the system of nonlinear equations is solved iteratively using the Newton–Raphson method:
① Initial Value Setup: Set the initial value X b ( 0 ) = X b ( t ) .
② Residual Calculation: Calculate the residual R ( X b ( k ) ) , which measures the difference between the system’s current state and the desired state.
③ Jacobian Matrix Calculation: Calculate the Jacobi matrix R X b and update the displacement.
The iterative update formula for the displacement is given in Equation (12). This formula is utilized to update the displacement at each iteration step.
The Jacobian matrix is crucial for linearizing the nonlinear system and guiding the iterative process towards a solution.
④ Convergence Check: Continue iterating until the convergence condition is satisfied, i.e., R ( X b ( k + 1 ) ) < ε , where ε is the preset convergence accuracy.
(4)
Update acceleration and velocity: After obtaining the converged displacement X b ( t Δ t ) , the acceleration and velocity are updated using the formulas of the Newmark-β method:
X ¨ b ( t + Δ t ) = 1 β Δ t 2 X b ( t + Δ t ) X b ( t ) Δ t X ˙ b ( t ) Δ t 2 2 ( 1 2 β ) X ¨ b ( t )
X ˙ b ( t + Δ t ) = X ˙ b ( t ) + Δ t [ ( 1 γ ) X ¨ b ( t ) + γ X ¨ b ( t + Δ t ) ]
(5)
Repeat steps 2 to 4 iteratively until all time steps have been calculated.
These equations ensure that the dynamic behavior of the system is accurately captured by updating the system’s state variables.
By following these steps, we effectively solve the dynamics equations and obtain the system’s displacement, velocity, and acceleration. These results are essential for understanding the dynamic behavior of the structure, as shown in Figure 4.

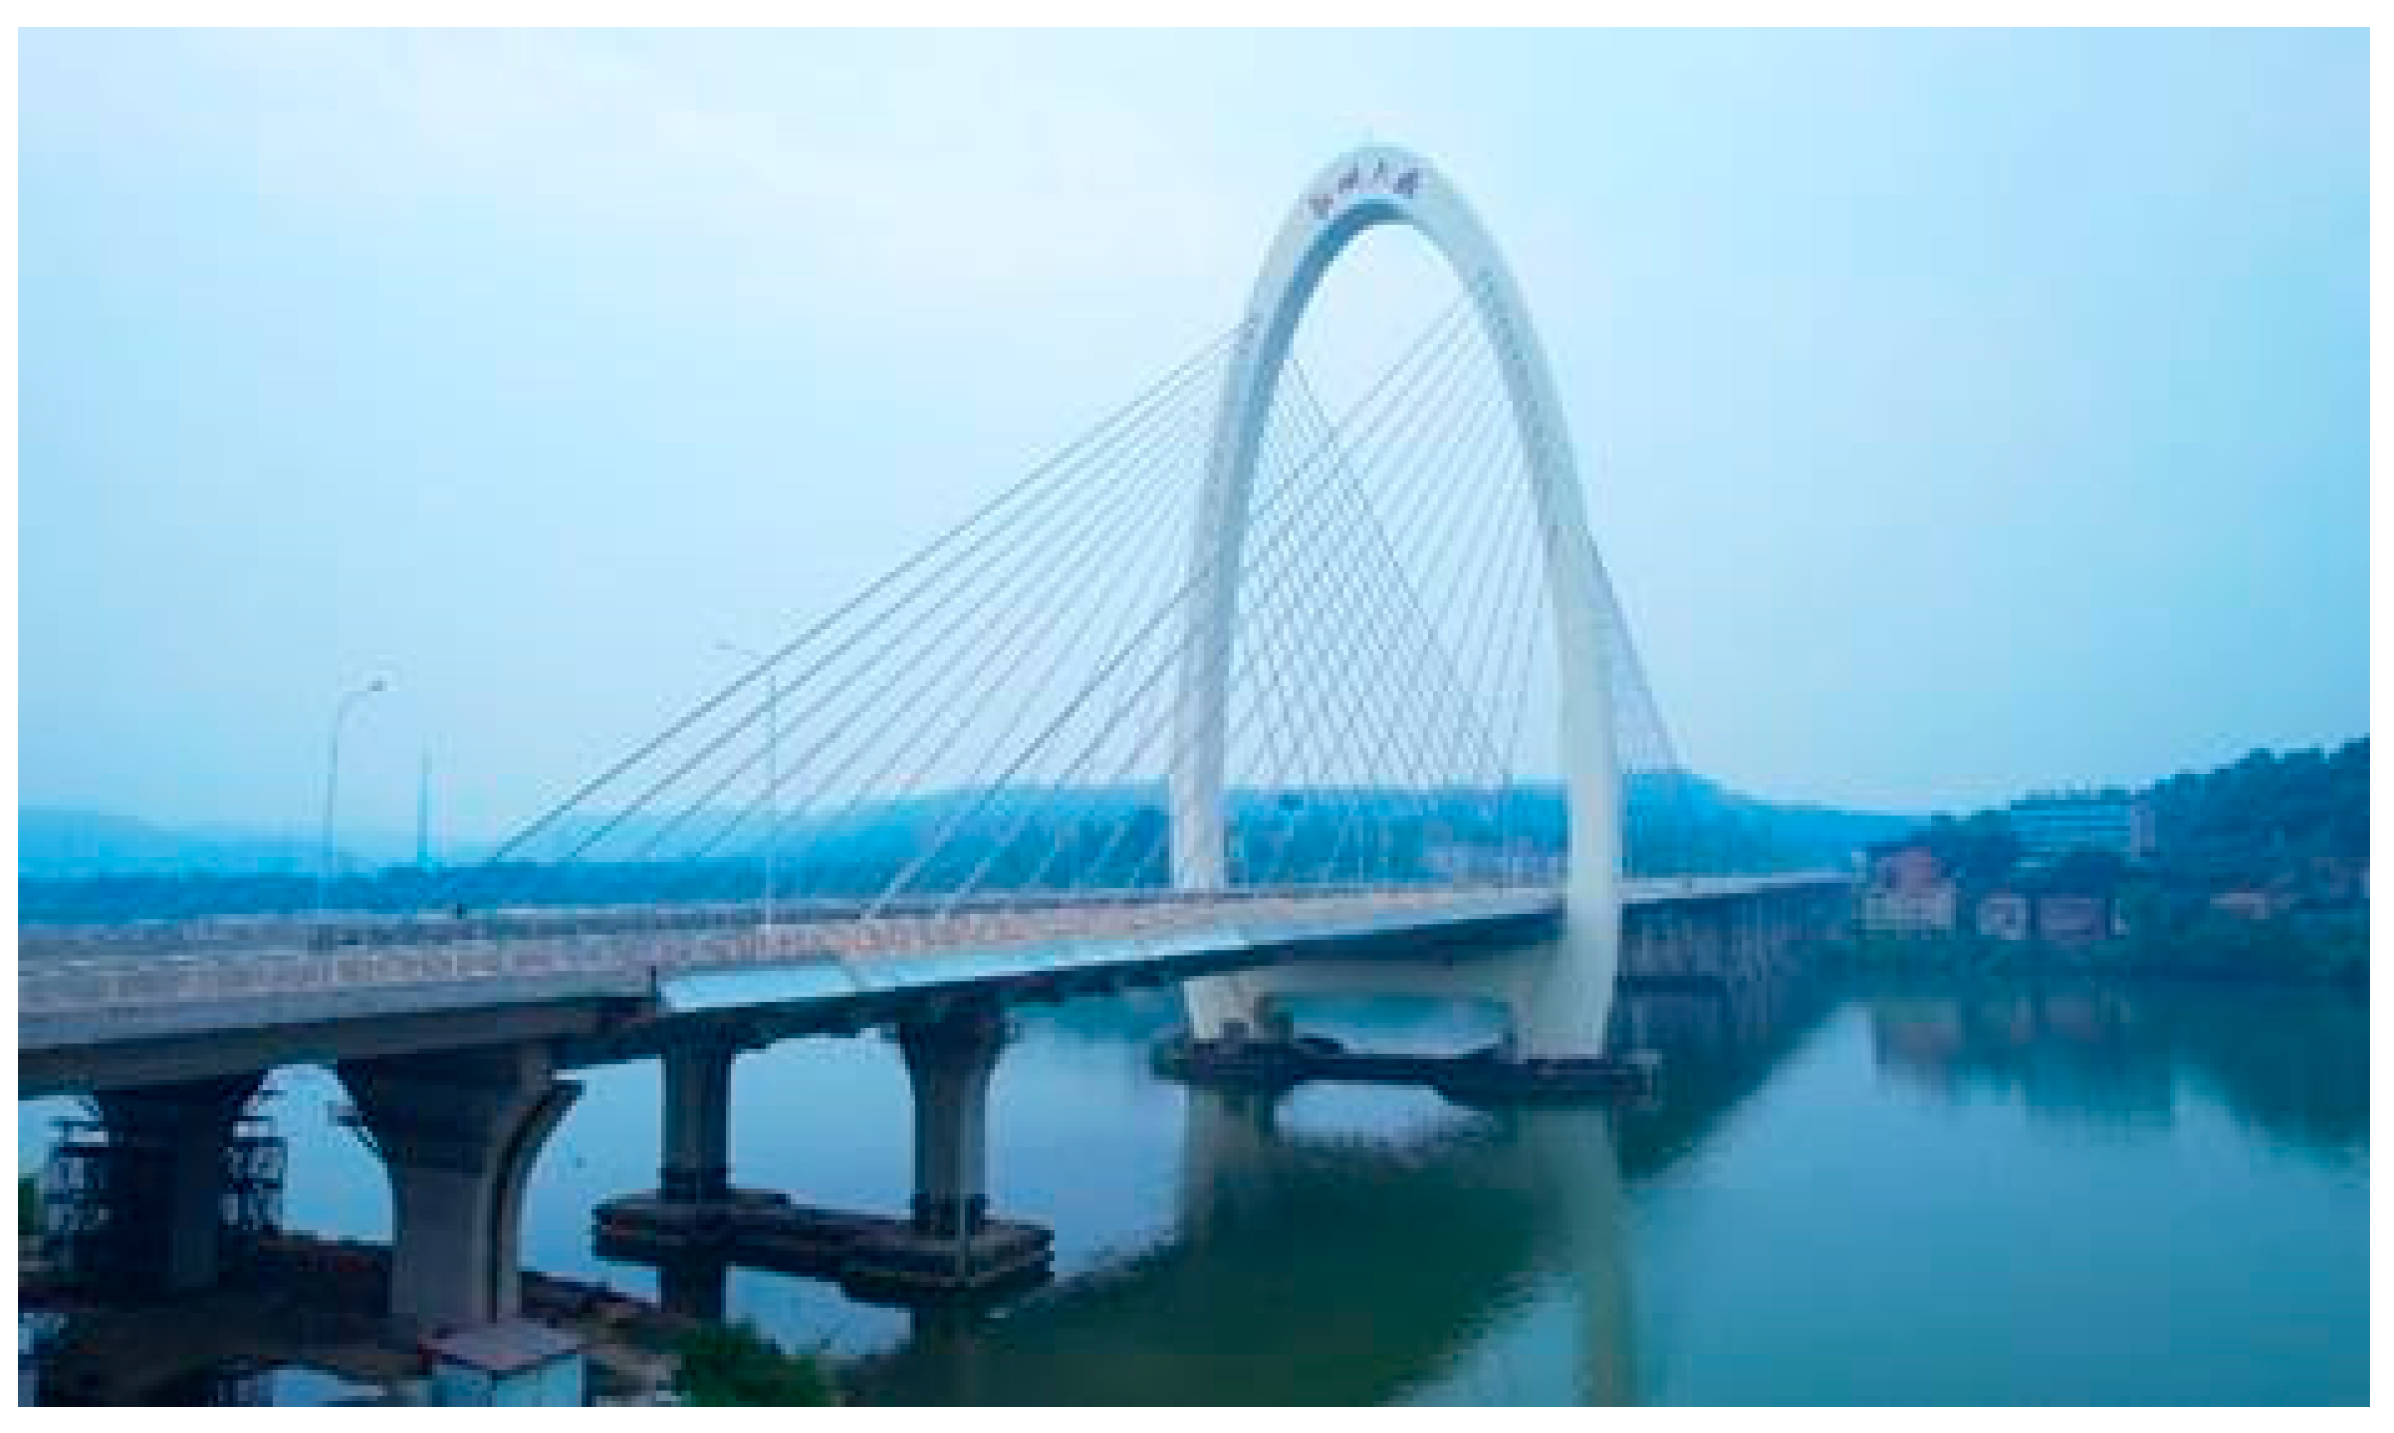
4. Application Examples

In this study, a large-span bridge located in China was selected as the research object. A numerical analysis framework that combines the Newmark-β method and the Newton–Raphson method was employed to solve the coupled dynamic equations of the bridge under the combined effects of wind load and random traffic load. The proposed method effectively addresses the nonlinear problem and accurately characterizes the bridge dynamics under complex loading conditions. The results demonstrate that the dynamic response of bridges under various loading scenarios can be precisely evaluated using this approach, providing reliable theoretical support for bridge design and safety assessment.

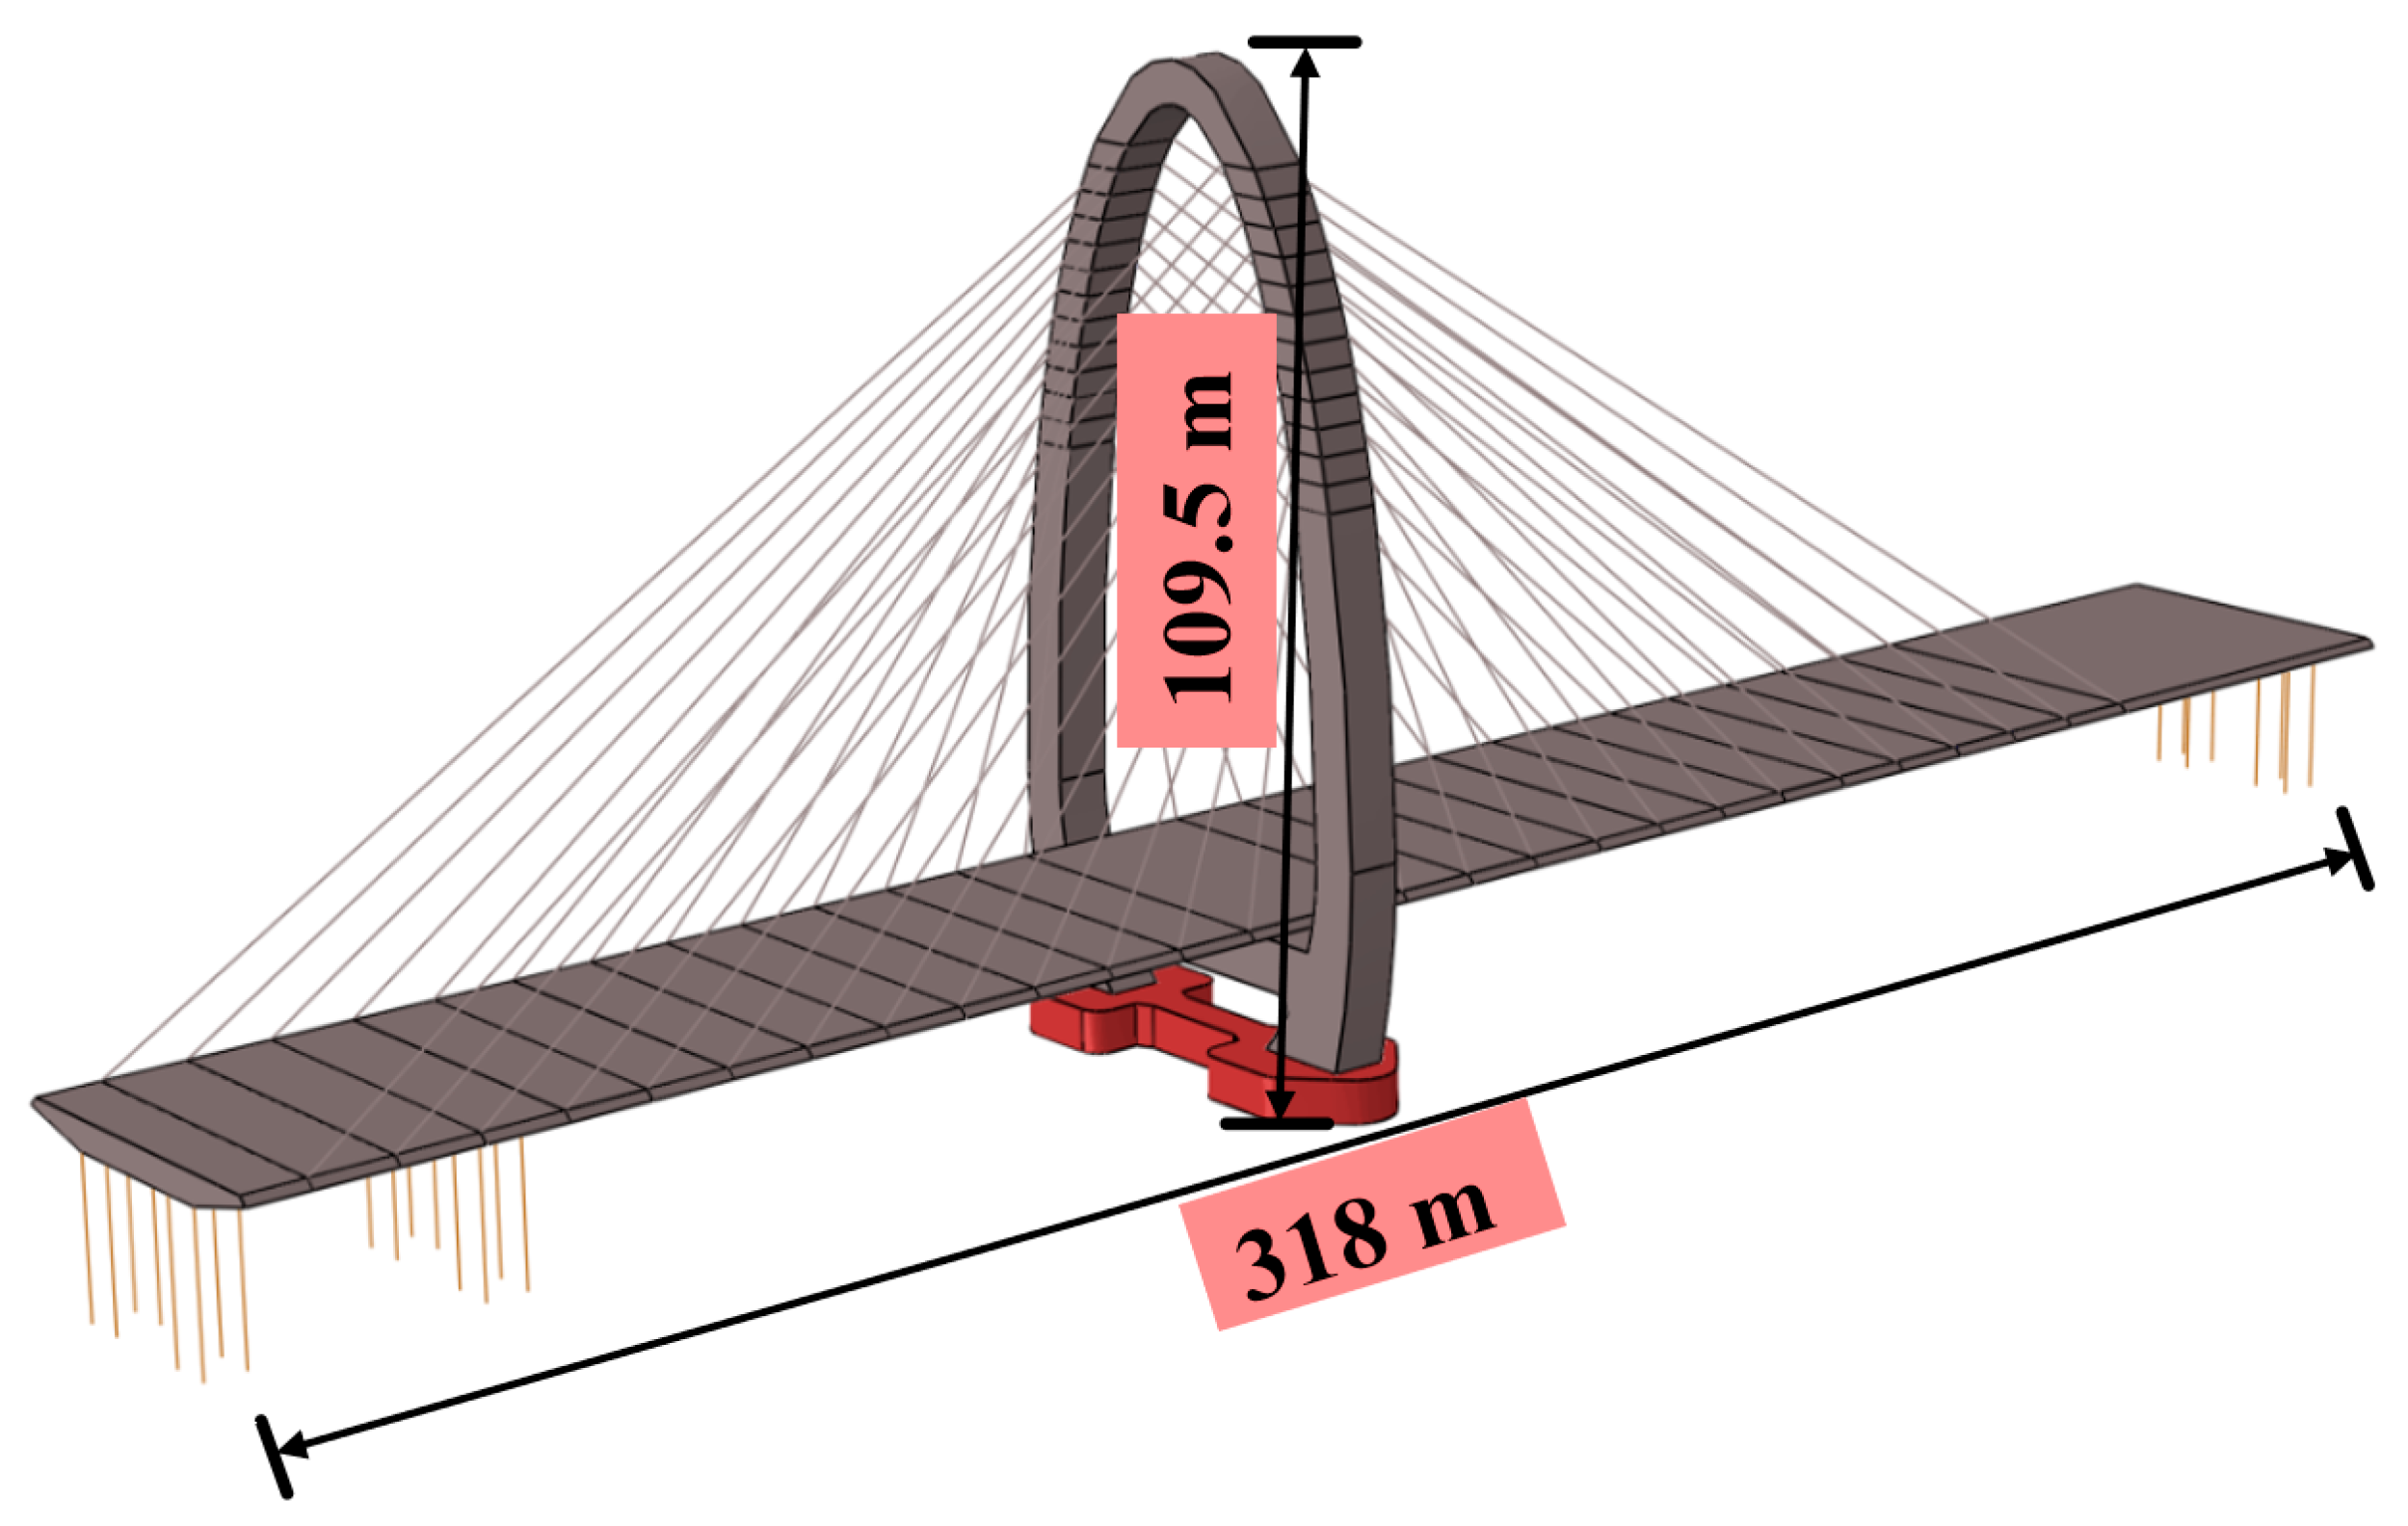
4.1. Overview of Project

The bridge is a single-tower, double-cable-stayed structure with spans of 33 m, 102 m, and 183 m. The main tower is a multi-curved domed tower with a height of 109.5 m. The main girder features a hybrid box girder design. The substructure of the main span portion of the bridge consists of five sets of combined piers. The auxiliary and main piers are primarily composed of three components, namely the pier body, the bearing platform, and the pile foundation, as shown in Figure 5. The auxiliary pier employs a longitudinal (double) directional movable seismic spherical steel bearing. The pier body is constructed using C50 concrete. The bearing platform features a round-end dumbbell shape with a thickness of 5.0 m. The pile foundation consists of bored piles with a diameter of 2.5 m. The bridge model and wind sensors are shown in Figure 6 and Figure 7, while the member parameters are listed in Table 1. Taking a single-tower cable-stayed bridge as an example, fiber optic-like wind sensors were installed at the top of the bridge’s pylon [39]. These sensors incorporate wind speed measurement points, all positioned 100 m above the ground and evenly distributed at the top of the tower column to monitor wind speed around the bridge tower. The wind speed is effectively measured by three evenly spaced wind cups on each sensor. Wind speed data is recorded in real time by the sensors using a data acquisition system at a sampling rate of 1 Hz. The data is then transmitted to on-site monitoring equipment via a wireless module and simultaneously uploaded to a cloud server for further analysis.

4.2. Characteristics of Bridge Dynamics Under Different Traffic Densities

The probability distribution functions for vehicle type, weight, speed, and distance, which are derived from the statistical analysis of traffic flow data, are utilized to develop a Monte Carlo random sampling program using the MATLAB platform. The specific procedures for generating stochastic traffic flow are illustrated in Figure 8. The implementation steps of this method for generating stochastic traffic flow are as follows: (1) Construct probability distribution models for vehicle type, lane, weight, speed, and distance based on empirical data. (2) Use MATLAB’s random number generation functions to perform independent sampling from each probability distribution, ensuring that the parameters of the generated stochastic traffic flow conform to statistical characteristics. (3) Generate a sequence of stochastic traffic flow samples through continuous sampling, thus creating a stochastic traffic flow that is consistent with actual traffic patterns.
All results presented in Figure 9, Figure 10, Figure 11, Figure 12 and Figure 13 are derived from numerical analyses conducted by the authors using the proposed method. These analyses comprehensively evaluate the dynamic response of the bridge under various traffic densities and wind load conditions, thereby providing a detailed understanding of the structural behavior under complex loading scenarios.
Traffic density influences bridge vibration through both the vehicle load effect and inter-vehicle coupling vibration effect. In sparse traffic conditions, vehicle spacing is larger, leading to load dispersion and a smaller vibration response. Conversely, in dense traffic, vehicle interactions are enhanced, resulting in a significant increase in both vibration amplitude and frequency. The Monte Carlo method is employed for stochastic traffic flow simulation, with the annual average daily traffic volume serving as the simulation sample capacity based on the vehicle movement parameters [33]. As shown in Table 2, the number of vehicles in the eight two-way lanes is derived from the 24 h traffic load survey data of the bridge.

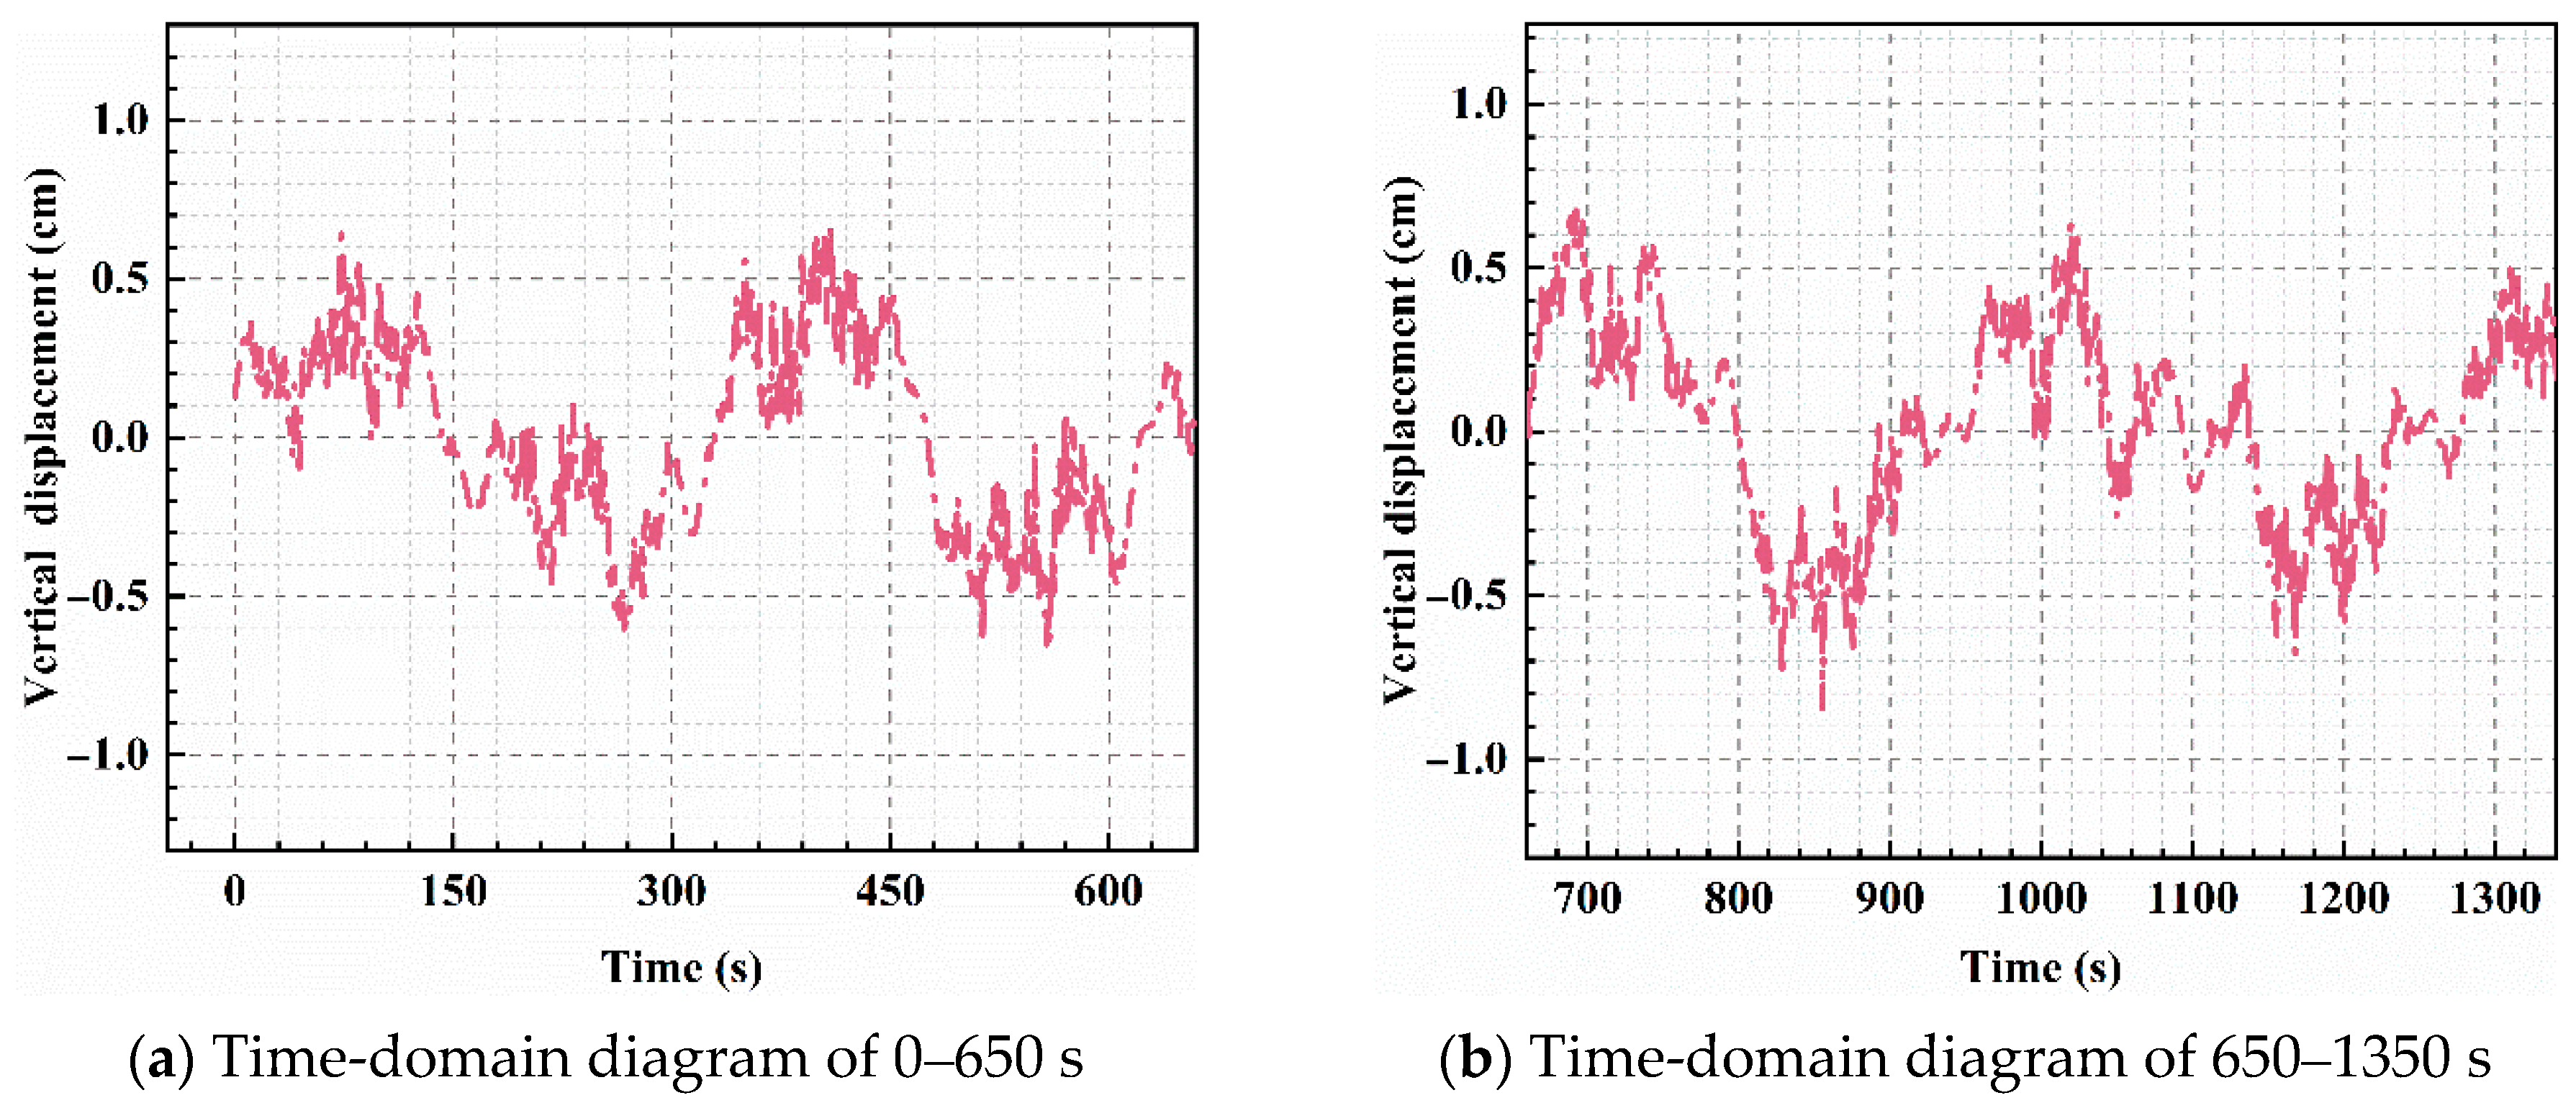
4.2.1. Bridge Vibration Response Under Sparse Traffic Flow

In this study, the dynamic response of the bridge under different traffic conditions (sparse and dense) and wind loads is analyzed separately to isolate the individual effects of each factor. This approach enables a clearer understanding of how each factor influences the bridge’s vibration response. The combined effects of traffic and wind loads are discussed in Section 4.2.3, where the interactions between these factors are examined in detail.
To further analyze the vibration response characteristics of the bridge under extended periods of sparse traffic, the vertical vibration displacements were closely monitored and recorded over three distinct time intervals, as shown in Figure 9a–c. A comparative analysis of the bridge’s vibration responses across these intervals reveals a consistent pattern, with a cycle duration of approximately 300–350 s. It is important to note that during the second time period, the bridge experienced a peak displacement of 0.78 cm, which is slightly higher than the general displacement range observed.
Long-term monitoring data indicate that the vertical vibration amplitude typically ranges from 0.1 cm to 0.7 cm, with the noted peak of 0.78 cm being an exception rather than the norm. These vibrations are characterized by smooth fluctuations and lack high-frequency components. Under sparse traffic conditions, the substantial intervals between vehicles result in significant vibration attenuation. The vertical displacement and acceleration are less prone to accumulation, leading to an overall controllable response that tends to decrease over time and eventually levels off.
When the bridge is affected by the external force of the traffic flow, its vibration frequency may align with the frequency of the external force, potentially causing resonance of the axle, and thus, several peaks are generated in the monitoring process, as shown in Figure 9d. The amplitude peaked at frequencies near 0.003 Hz, both around 0.35. Additionally, small peaks were observed near 0.01 Hz, 0.02 Hz, and 0.04 Hz. Above 0.04 Hz, the amplitude becomes nearly flat and no longer fluctuates substantially.
The impact of sparse traffic on the bridge is characterized by isolated impact responses occurring over a period of approximately 100 s, as shown in Figure 10. When a single vehicle crosses the bridge, the vertical vibration amplitude may peak at 0.68 cm. However, because of the extended intervals between vehicles, the vibration diminishes quickly without leading to substantial resonance or superposition effects. The transverse vibration amplitude remains low and shows little variation. As a result, the influence of sparse traffic on the bridge is localized and short-lived without any significant build-up of vibration.

4.2.2. Bridge Vibration Response Under Dense Traffic Flow

To further investigate the vibration response characteristics of the bridge under the influence of long-term intensive traffic flow, the vertical vibration displacement changes in the bridge were monitored over three distinct time periods, as shown in Figure 11a–c. It is evident that the bridge’s vibration response remains consistent across these periods, with a vibration period ranging from 250 to 400 s. The maximum displacement recorded was 1.5 cm during the first time period, which significantly exceeds the maximum displacement observed under long-term sparse traffic conditions.
Under dense traffic conditions, the interaction between vehicles and the superposition of loads are significantly enhanced, leading to a more complex vibration response and increased amplitude due to the continuous action of vehicles. Monitoring data indicate that under dense traffic conditions, the vertical vibration amplitude of the bridge ranges from 0.3 to 1.5 cm, which is 50% to 114.28% higher than that observed under sparse traffic conditions. This increase is attributed to the cumulative effect of continuous vehicle loads, especially during peak periods when vibration exhibits strong periodicity and a longer duration, making it less likely to decay.
From the perspective of the frequency domain, the influence trend of frequency on bridge amplitude across the three time periods is roughly the same, as shown in Figure 11d. As the frequency increases, the amplitude continuously decreases and eventually levels off. The amplitude peaked at frequencies near 0.003 Hz, with both peaks near 0.50. Smaller peaks were observed near 0.075 Hz, 0.015 Hz, and 0.032 Hz. Above 0.04 Hz, the amplitude becomes nearly flat and no longer fluctuates substantially. Under the influence of dense traffic flow, the probability of bridge resonance is higher than that of sparse traffic flow and the superposition effect is stronger. Consequently, the peak is less steep, and the peak amplitude is about 42.86% higher than that observed under sparse traffic flow conditions.
Dense traffic conditions significantly affect the vertical vibration of bridges within a 100 s observation period, as illustrated in Figure 12. The high traffic density results in vehicles passing over the bridge in close succession, leading to a pronounced superposition effect. Consequently, the vertical vibration amplitude can reach up to 0.92 cm, which is 35.29% higher than that observed under sparse traffic conditions. This increased vibration amplitude is due to the cumulative effect of continuous vehicle loads, which results in stronger and more persistent vibrations that are less likely to dissipate quickly. The combined effects of continuous vehicle loading, high vehicle speeds, and dense traffic flow contribute to increased vibration amplitudes. These factors cause the bridge to experience significant changes in displacement and acceleration over a short period.
In summary, the dynamic increase in bridge vibration observed under dense traffic conditions is largely attributed to the cumulative impact of vehicle loads and their persistent action, which results in a significant buildup of vibration. The interactions among vehicles, along with the possibility of resonance effects, can further intensify these vibrations, particularly at higher vehicle speeds where resonance is more likely to occur, thereby augmenting vertical vibration. Consequently, it is imperative that bridge design, monitoring practices, and safety assessments consider the influence of fluctuating traffic densities on vibrational behavior. This consideration is essential to guarantee the safety and stability of bridges under diverse traffic scenarios.

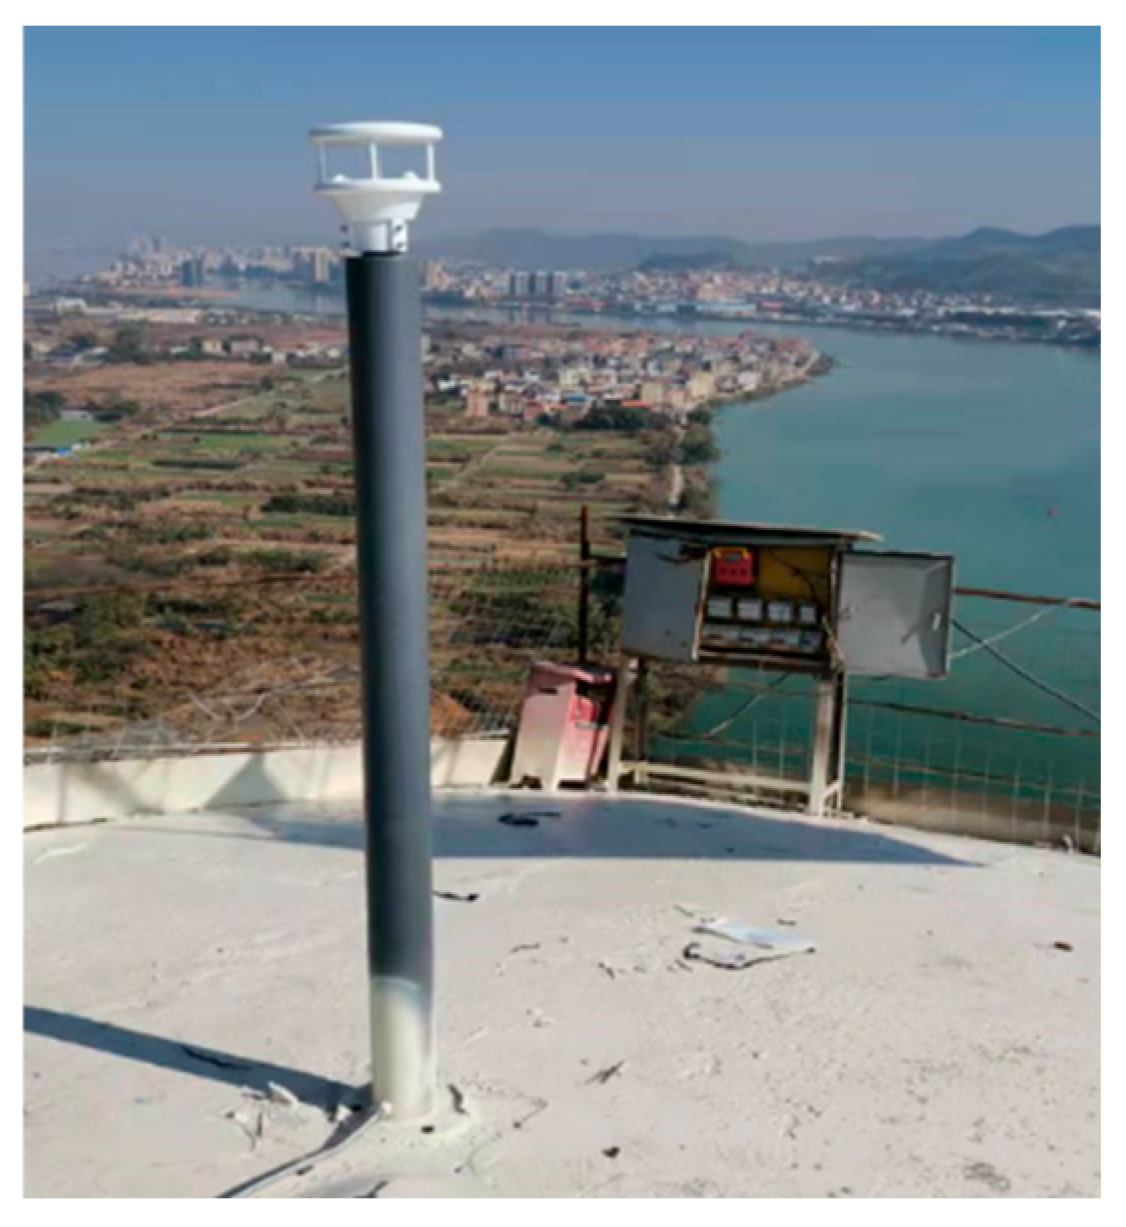
4.2.3. Wind Load Effects

The wind loads have a negligible impact on vertical displacements of bridges but significantly influence horizontal displacements. As illustrated in Figure 13, the maximum lateral displacements induced by wind loads are 2.00 cm. When wind loads are factored in, they contribute an additional force that affects the bridge’s horizontal vibration. This increase is a result of the extra excitation provided by wind loads, which can notably affect the dynamic response of sea-crossing bridges. When these environmental loads are combined with dense traffic, the superposition of vehicle and environmental loads further intensifies the vibration response.
The interaction between wind and traffic loads substantially elevates the bridge’s horizontal vibration volatility, especially under conditions of dense traffic and high wind speed action. Under such complex scenarios, the vibration response exhibits stronger nonlinear characteristics and a heightened amplitude. The combined effects of these loads accentuate the vibration intensity, underscoring the necessity of considering these interactions in the design and safety assessment of large-span bridges.
While the horizontal vibration amplitude of the bridge increases moderately when wind loads are considered, it becomes more pronounced under conditions of high wind speeds (12 m/s). The complexity and fluctuation of the response are significantly amplified. Therefore, the design and safety assessment of large-span bridges must incorporate the combined effects of the vehicle and wind loads to ensure the bridges’ safety and stability under complex operational conditions.

5. Conclusions

This paper presents a method for a wind–vehicle flow coupled vibration analysis of large-span bridges. The proposed method comprehensively considers the joint effects of wind and vehicle flow loads. It systematically analyzes the dynamic response of bridges under the influence of multiple factors using coupled dynamic models, finite element methods, and nonlinear solution techniques. The key conclusions are as follows:
(1)
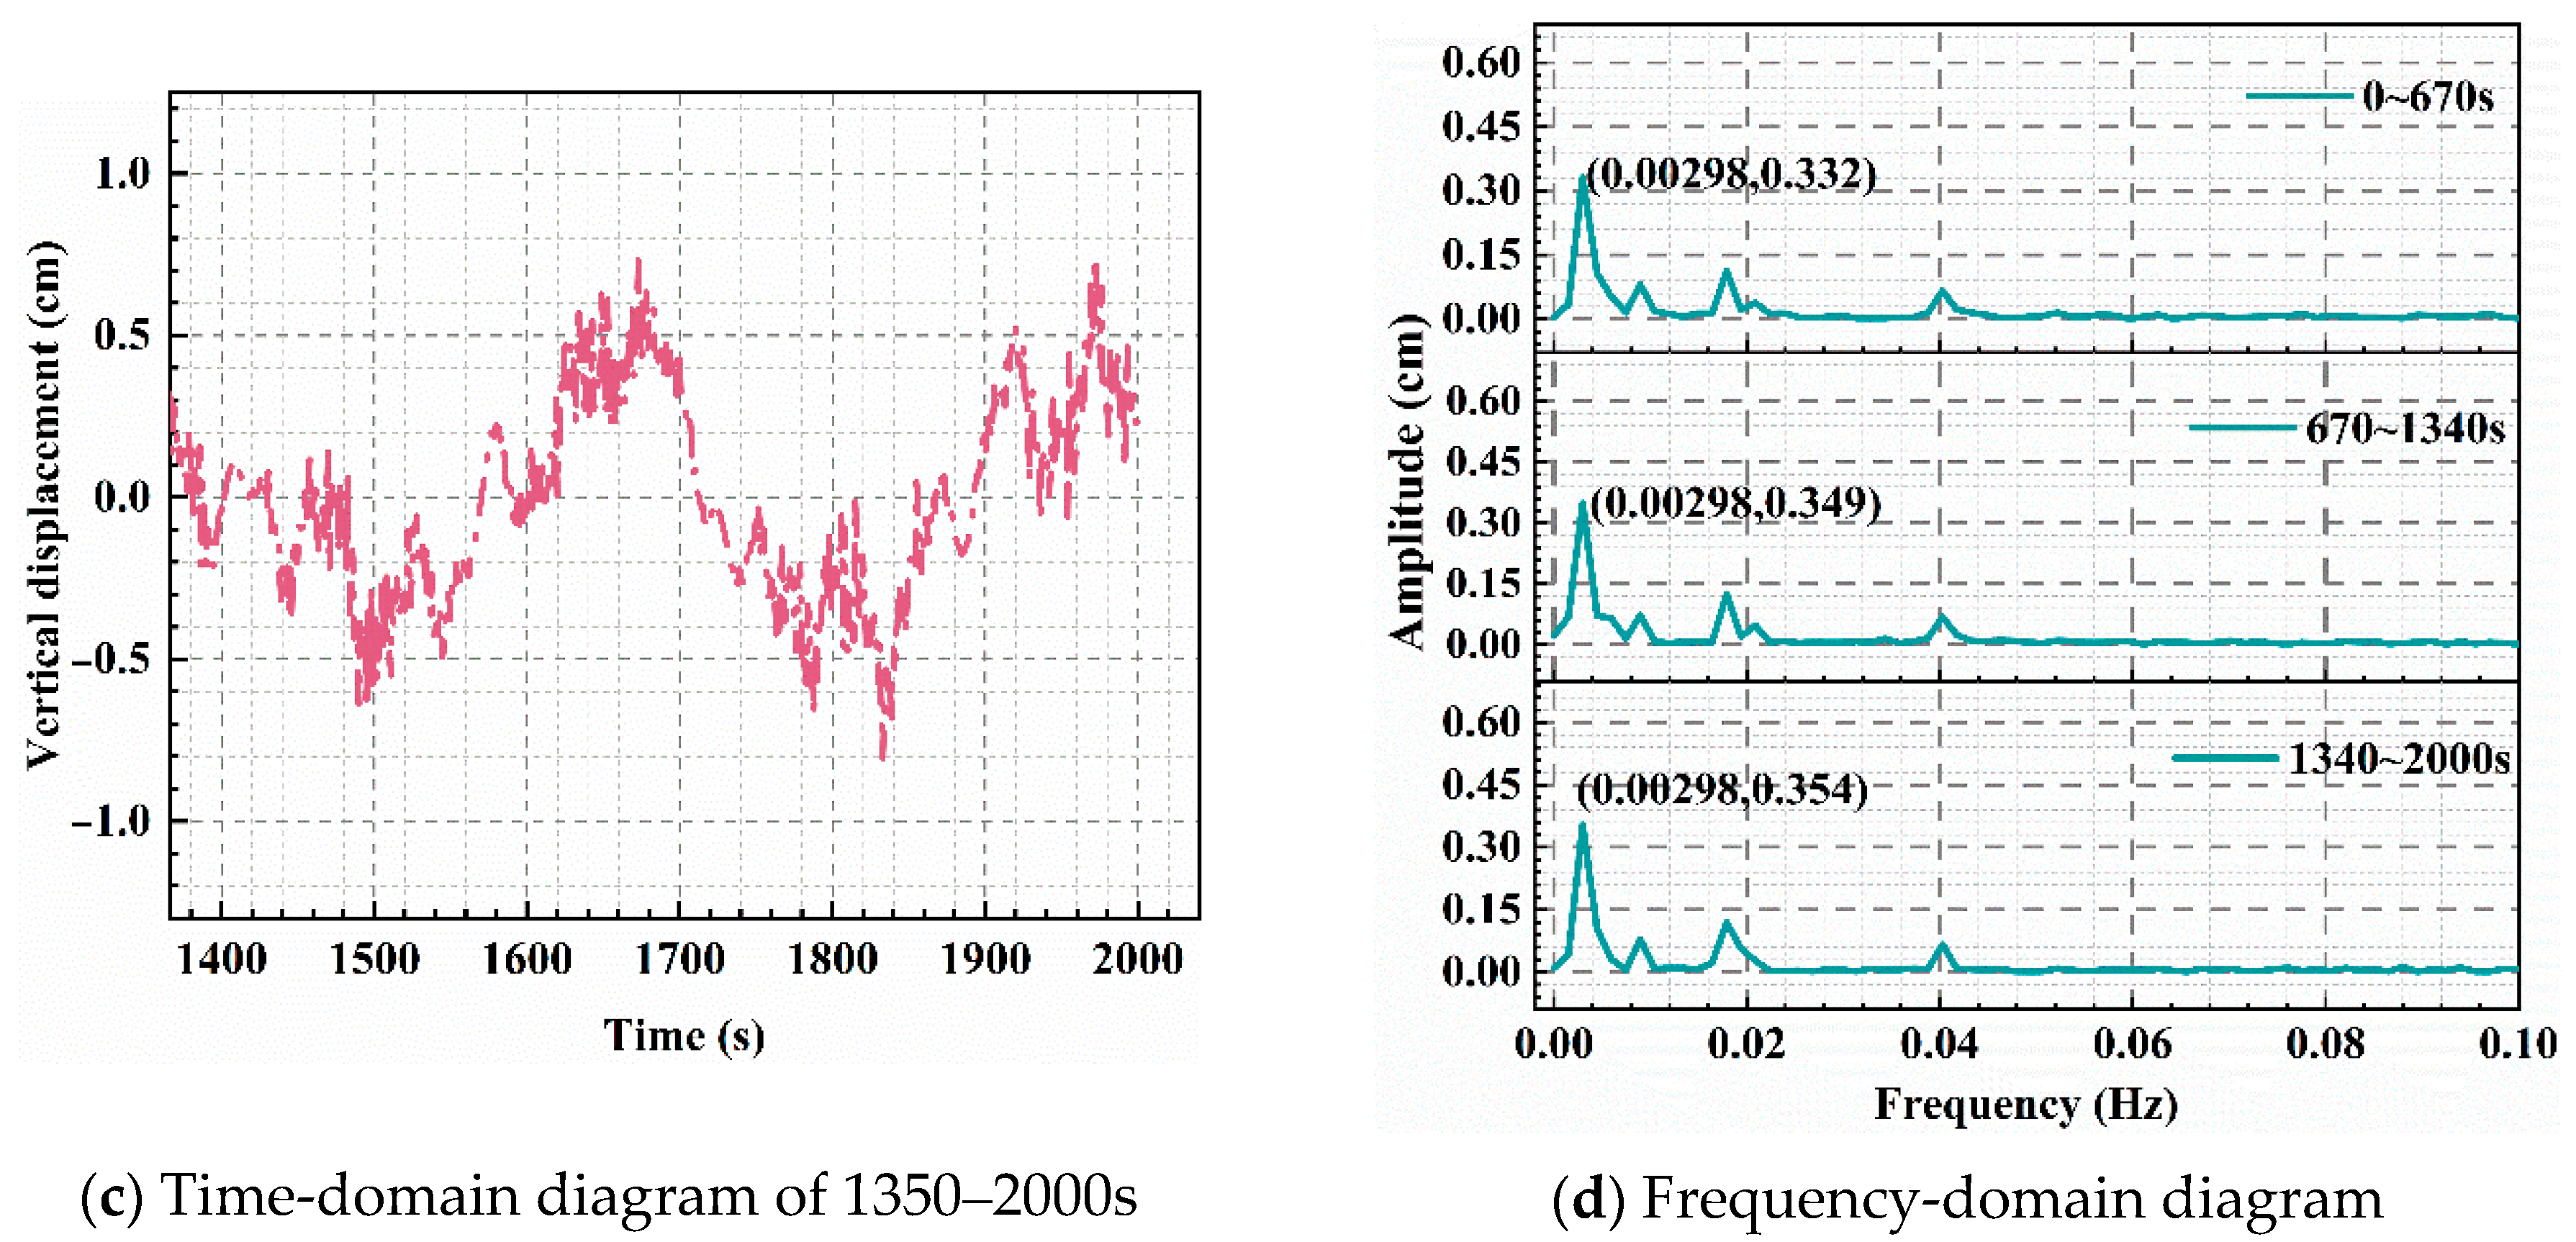
The study reveals that under sparse traffic conditions, the vertical vibration amplitude of the bridge typically ranges from approximately 0.1 to 0.7 cm, with a peak displacement of 0.78 cm observed during specific time intervals. This indicates that sparse traffic results in lower vibration amplitudes due to the extended intervals between vehicles, leading to reduced vibration accumulation.
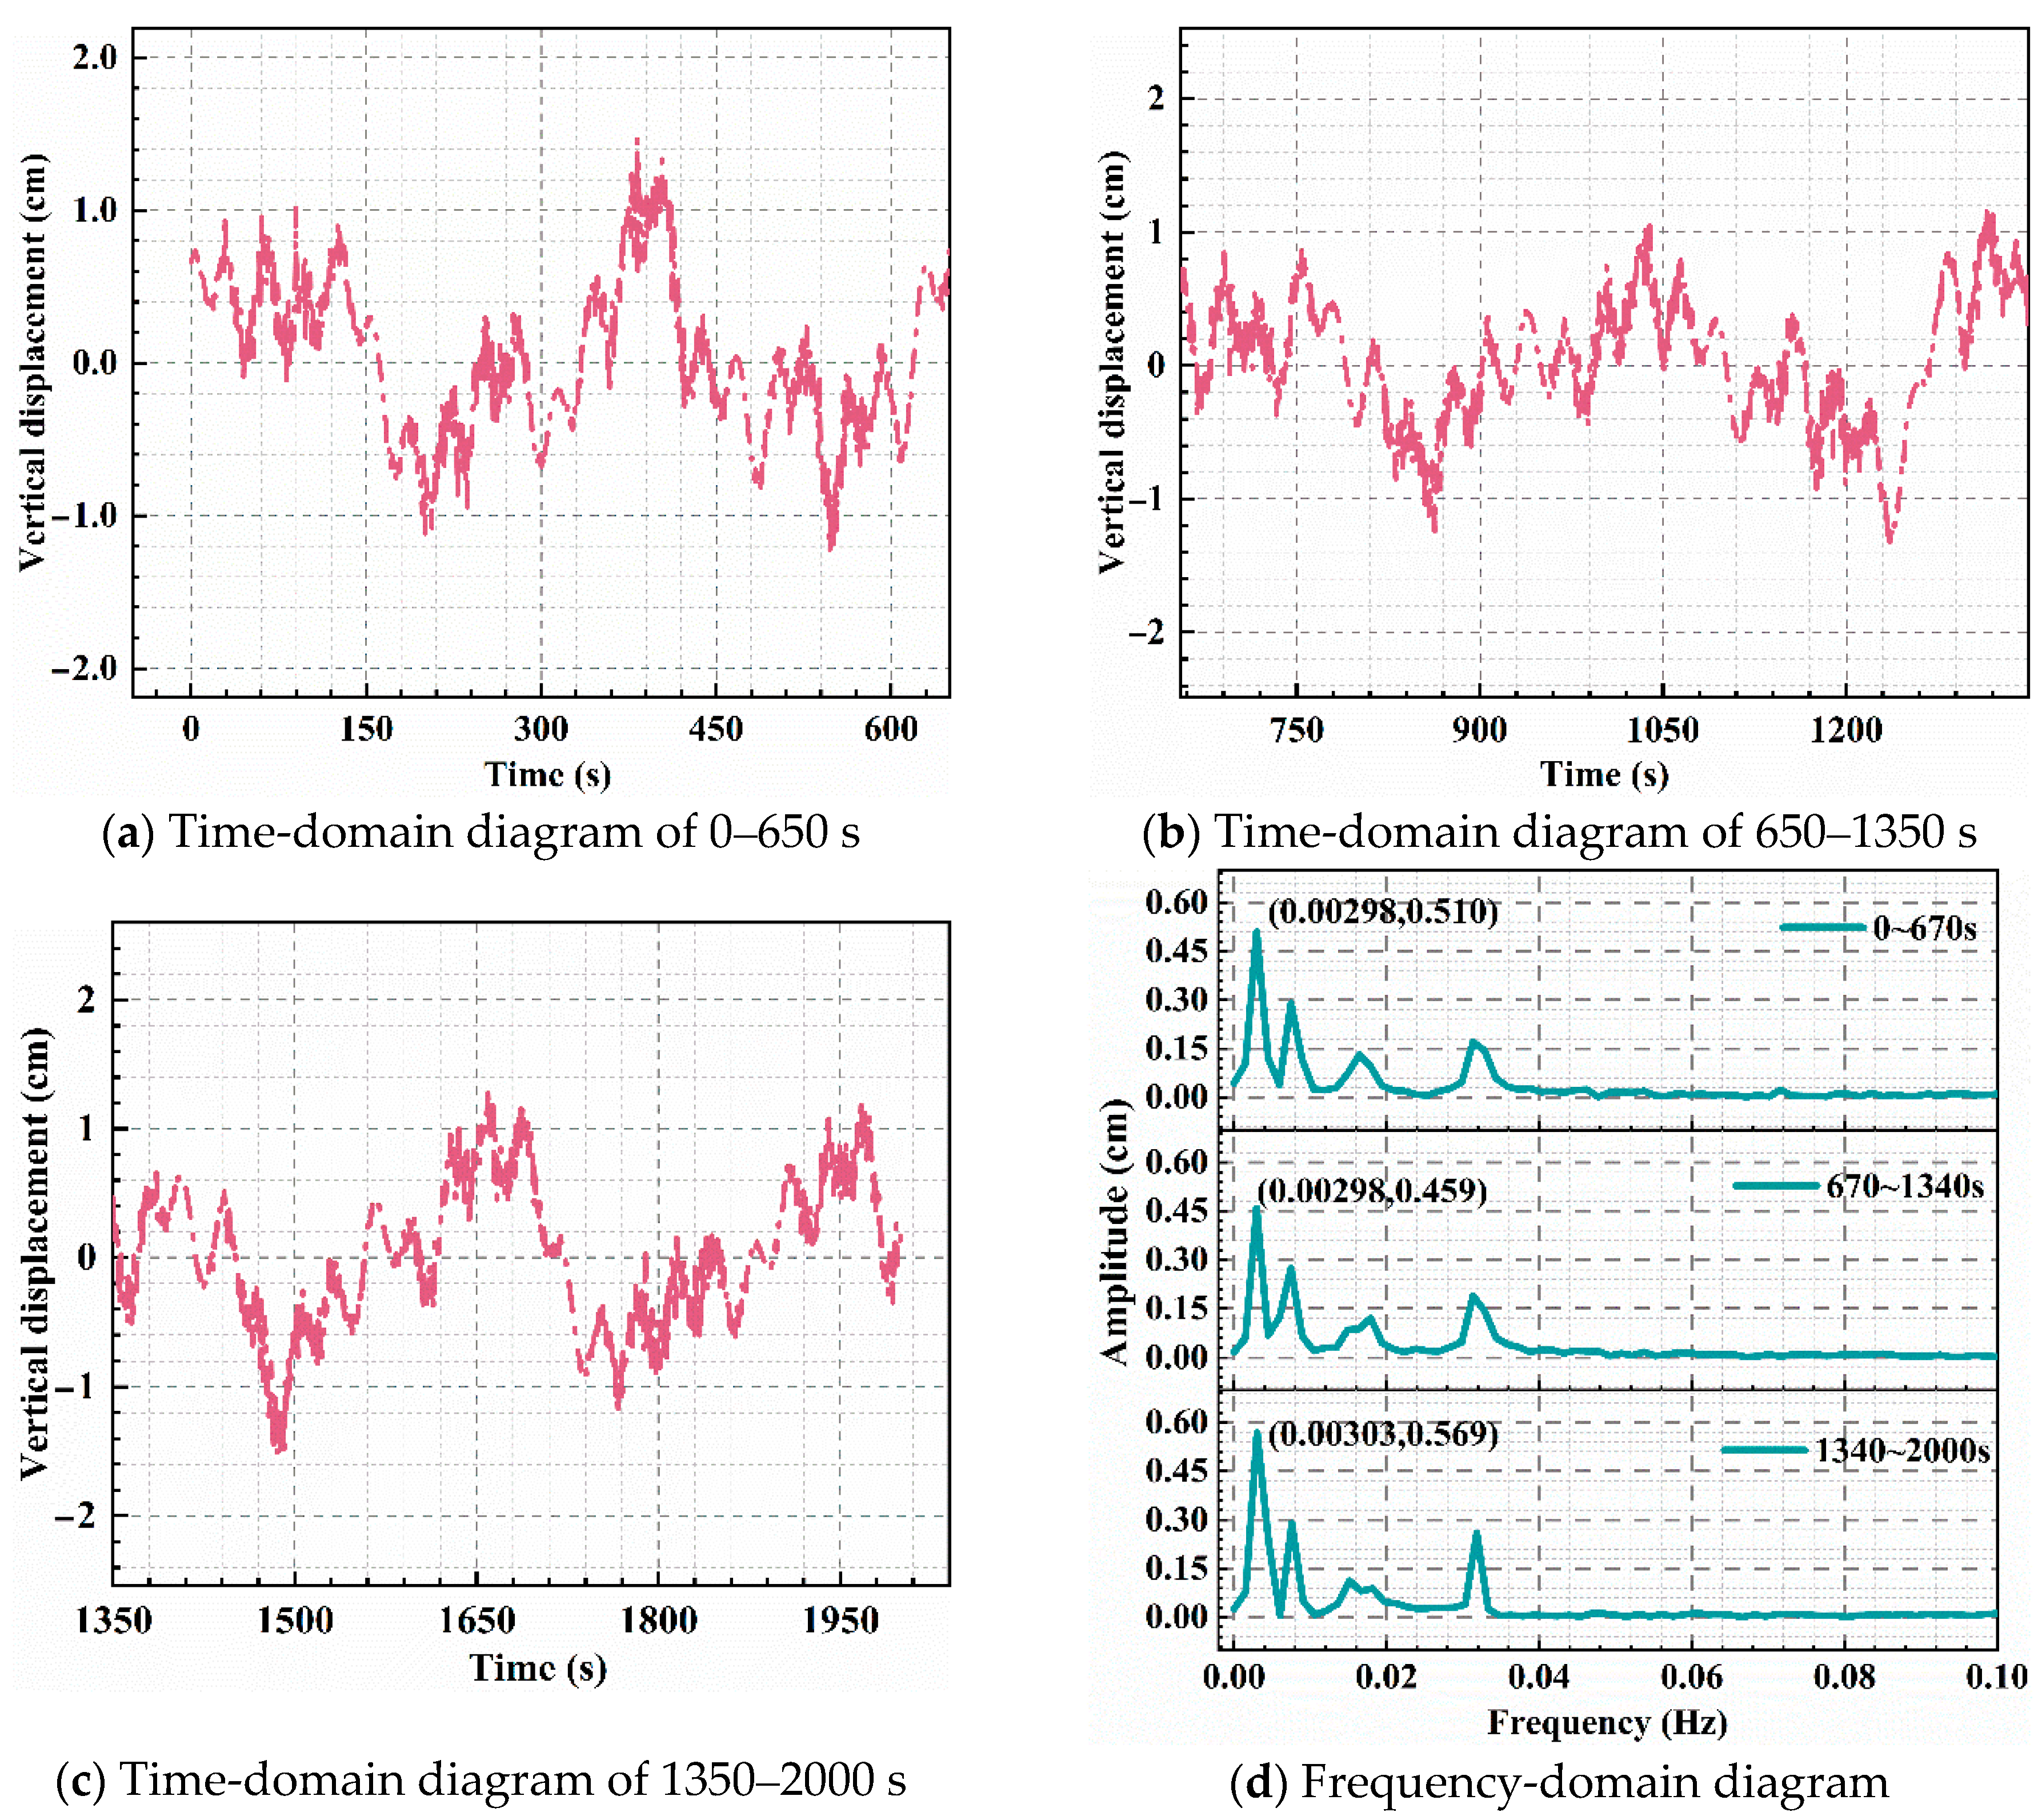
(2)
Under dense traffic conditions, the vertical vibration amplitude increases to a range of 0.3 to 1.5 cm with a maximum recorded displacement of 1.5 cm. Dense traffic conditions amplify the bridge’s vibration response by up to 114.28%, highlighting the significant impact of continuous vehicle loads on bridge dynamics.
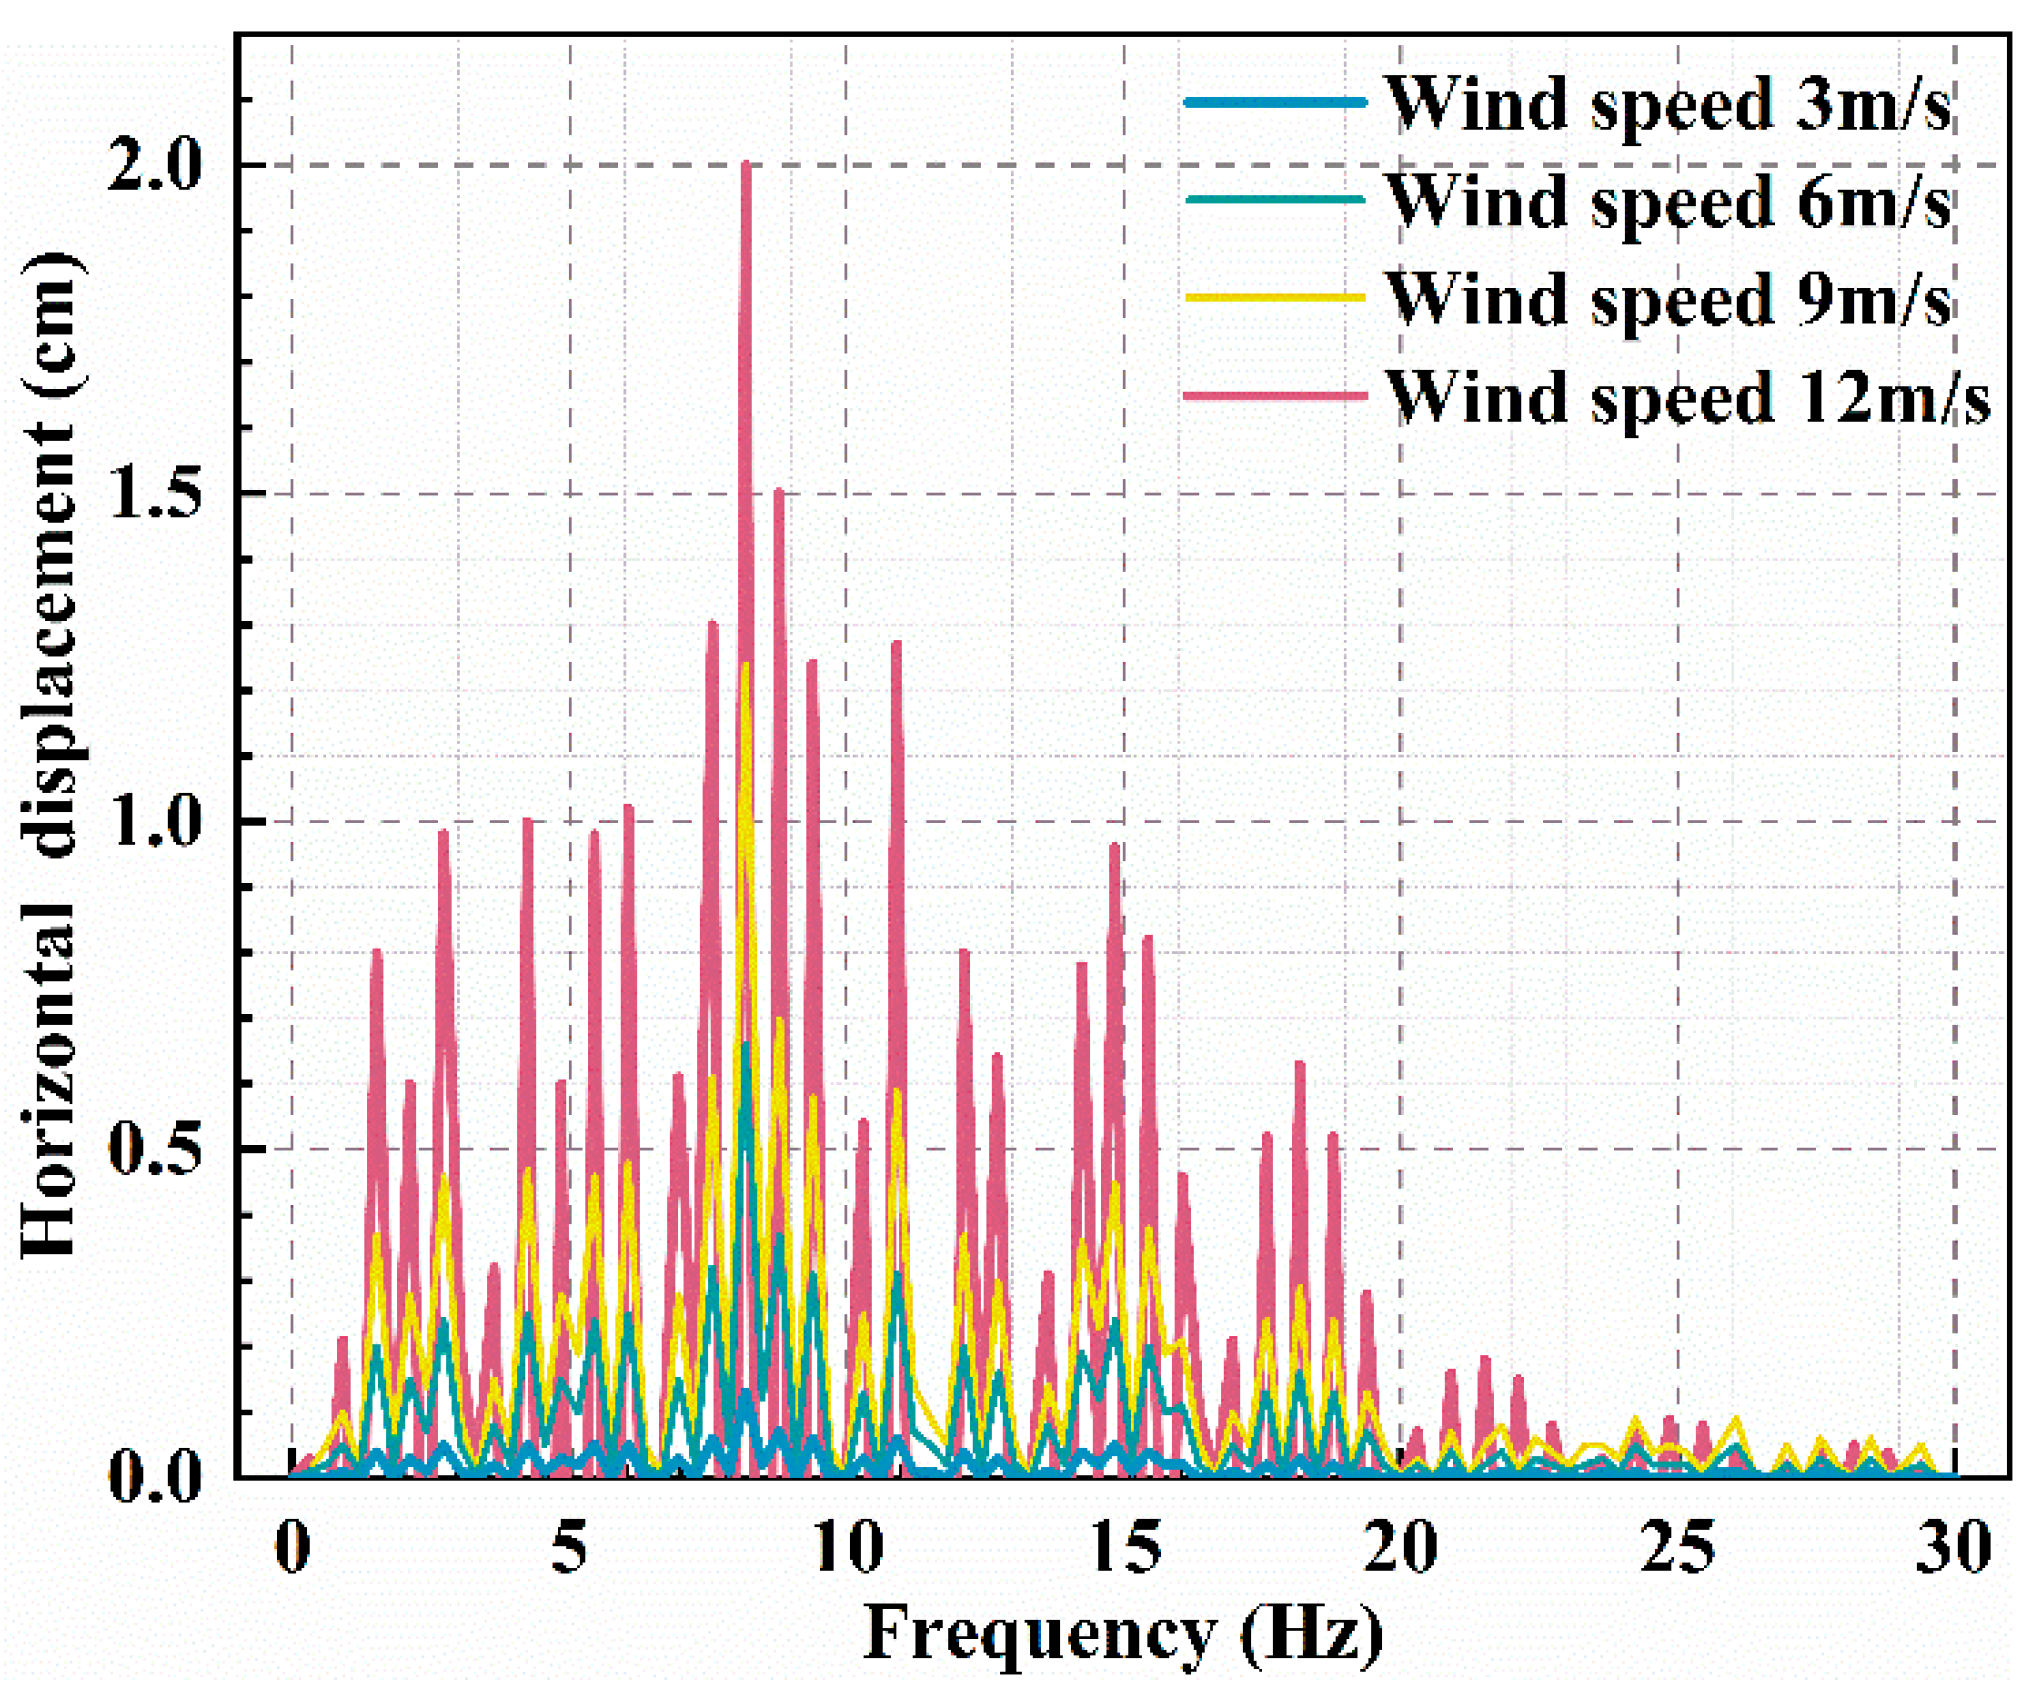
(3)
The analysis indicates that wind loads exert a negligible effect on the vertical displacements of the bridge while significantly influencing its lateral displacements. Wind loads introduce an additional force that affects the bridge’s horizontal vibration, especially under conditions of dense traffic and high wind speeds. Under such conditions, the maximum lateral displacement of the bridge induced by wind loads can reach up to 2 cm.
In future work, several limitations identified in the current study will be addressed. Plans are to refine the linear vehicle model to better capture real-world vehicle dynamics, incorporate additional environmental factors such as temperature and seismic loads, and consider heterogeneous pavement properties to more accurately represent vehicle–bridge structure interaction. Aeroelastic nonlinearity will also be incorporated through coupled aeroelastic analysis and nonlinear aerodynamic models to account for complex wind–bridge structure interactions. Furthermore, a detailed modal analysis will be conducted to determine the bridge’s natural frequencies and modal shapes, which are crucial for a comprehensive understanding of its dynamic response. These improvements will enhance analysis accuracy and reliability, providing a more comprehensive basis for bridge safety assessment and maintenance.

Author Contributions

Software, D.G.; Validation, L.L.; Formal analysis, J.W.; Investigation, Y.H.; Writing—original draft, R.W.; Writing—review & editing, Y.Q.; Supervision, S.G.; Funding acquisition, R.W. & P.X. All authors have read and agreed to the published version of the manuscript.

Funding

The funding is supported by the National College Students Innovation Training Program. (project no. S202410536059) and the Hunan Provincial “100-Talent Plan” Research Fund and Central South University Pre-research Fund (project no. 820180914).

Informed Consent Statement

Informed consent was obtained from all subjects involved in the study.

Data Availability Statement

Some or all data, models, or codes that support the findings of this study are available from the corresponding author upon reasonable request.

Conflicts of Interest

The authors declare that the research was conducted in the absence of any commercial or financial relationships that could be construed as a potential conflict of interest.

References

  1. Wang, C.S.; Zhang, W.T.; Yang, M.Y. Shear lag effect of composite girders in cable-stayed bridges under dead loads. Eng. Struct. 2023, 281, 115752. [Google Scholar] [CrossRef]
  2. Wang, C.Y.; Chen, B.; Li, Y.L.; Wang, H.R.; Tan, L.G.; Zhang, Y.N.; Zhang, H. YOLOv8-CDD: An improved concrete defect detection method combined CNN with transformer. Meas. Sci. Technol. 2025, 36, 015409. [Google Scholar] [CrossRef]
  3. Hashlamon, I.; Nikbakht, E.; Topa, A.; Elhattab, A. Numerical Parametric Study on the Effectiveness of the Contact-Point Response of a Stationary Vehicle for Bridge Health Monitoring. Appl. Sci. 2021, 11, 7028. [Google Scholar] [CrossRef]
  4. Ge, S.W.; Zeng, J.; Jin, B.W.; Zhou, W.; Qin, X.L. Design wave calculation of a passenger catamaran under multiple load control parameters. Pol. Marit. Res. 2022, 29, 3–11. [Google Scholar] [CrossRef]
  5. Dong, S.H.; Liu, W.; Li, H.Y. Study on the Mechanical Properties and Durability of Tunnel Lining Concrete in Coastal Areas. Buildings 2024, 14, 2606. [Google Scholar] [CrossRef]
  6. Liu, Y.; Xu, H.D.; Xia, W.; Cai, W.F.; Zheng, S.L. Research on a Vibration Model of a Superstructure under the Vibration Load of Metro Trains. Buildings 2024, 14, 2342. [Google Scholar] [CrossRef]
  7. Song, J.; Fang, X.J.; Bi, K.M.; Ding, H.; Qin, H.L. Tuned inerter damper for adjacent bridges vibration control considering nonlinearities. Eng. Struct. 2025, 325, 119504. [Google Scholar] [CrossRef]
  8. Fang, C.; Li, Y.L.; Xu, Y.L. Nonlinear dynamic response of sea-crossing bridges to 3D correlated wind and wave loads. Adv. Struct. Eng. 2022, 25, 3268–3283. [Google Scholar] [CrossRef]
  9. Yang, X.Z.; Dong, Y.D.; Liu, X.; Qiu, T.; Zhou, J. Seismic Behavior of Concrete Beam-Column Joints Reinforced with Steel-Jacketed Grouting. Buildings 2024, 14, 3239. [Google Scholar] [CrossRef]
  10. Wu, Q.; Han, B.; Yu, J.P.; Yan, W.T.; Zhang, J.Q.; Xie, H.B. A Theoretical Model to Identify the Fundamental Frequency of Simply Supported Girders from a Passing Heavy Vehicle. Appl. Sci. 2022, 12, 2422. [Google Scholar] [CrossRef]
  11. Xu, C.Y.; Luo, H.; Gan, X.B.; Liu, M.G.; Guo, H. Train-Bridge Coupled Vibration of a Long-Span Steel Truss Suspension Bridge Under Complex Driving Conditions. Int. J. Struct. Stab. Dyn. 2025, 25, 2550006. [Google Scholar] [CrossRef]
  12. Chen, X.; Geng, X.; Fu, W.W.; Tan, L.H.; Guan, J.C.; Liu, T. Vibration serviceability assessment of ribbon-shaped large-span footbridge at high altitudes under wind-pedestrians coupling effects. Structures 2024, 66, 106885. [Google Scholar] [CrossRef]
  13. Zhao, J.; Wang, K.; Wu, D.; Huang, Q.; Yu, M. Optimization Strategy for Modal Test Measurement Points of Large-Span Steel Beams Based on Improved Particle Swarm Optimization Algorithm with Random Weights. Appl. Sci. 2022, 12, 12082. [Google Scholar] [CrossRef]
  14. Gao, J.; Yang, T.S.; Zhang, X. Life Prediction and Reliability Evaluation of Reinforced Concrete Frame Structures Considering the Collision Response under Earthquake Conditions. Buildings 2024, 14, 3357. [Google Scholar] [CrossRef]
  15. Yan, X.Y.; Zhao, Z.; He, H.X. Coupled Vibration of a Vehicle Group-Bridge System and Its Application in the Optimal Strategy for Bridge Health Monitoring. Appl. Sci. 2024, 14, 5236. [Google Scholar] [CrossRef]
  16. Wu, T.Y.; Qiu, W.L.; Wu, H.; Yao, G.W.; Guo, Z.W. Coupled Vibration Analysis of Ice-Wind-Vehicle-Bridge Interaction System. J. Mar. Sci. Eng. 2023, 11, 535. [Google Scholar] [CrossRef]
  17. Wang, S.Q.; Wan, X.; Guo, M.H.; Qiao, H. Dynamic response of long-span arch bridge and riding comfort under wind load. Ksce J. Civ. Eng. 2025, 29, 100021. [Google Scholar] [CrossRef]
  18. Zhang, N.; Ge, G.H.; Xia, H.; Li, X.Z. Dynamic analysis of coupled wind-train-bridge system considering tower shielding and triangular wind barriers. Wind Struct. 2015, 21, 311–329. [Google Scholar] [CrossRef]
  19. Li, D.S.; Hu, X.; Zhou, X.X.; Luo, W.; Zhu, A.X.; Yu, Z.Y. Modeling Random Exit Selection in Intercity Expressway Traffic with Quantum Walk. Appl. Sci. 2022, 12, 2139. [Google Scholar] [CrossRef]
  20. Wang, B.; Xia, C.P.; Min, Q.; Zhu, S.Y.; Li, Y.L. Dynamic Amplification Factors of an Arch Bridge Under Random Traffic Flows. Int. J. Struct. Stab. Dyn. 2024, 24, 2450064. [Google Scholar] [CrossRef]
  21. Yu, Y.X.; Guo, L.; Chen, Z.G.; Gao, H.L.; Shi, Z.F.; Zhang, G.L. Dynamics modelling and vibration characteristics of urban rail vehicle axle-box bearings with the cage crack. Mech. Syst. Signal Process. 2023, 205, 110870. [Google Scholar] [CrossRef]
  22. Li, Y.; Ren, W.Y.; Jin, D.P.; Hui, P.; Zeng, L.G.; Wu, D.P. Potential Predictability of Vehicular Staying Time for Large-Scale Urban Environment. IEEE Trans. Veh. Technol. 2014, 63, 322–343. [Google Scholar] [CrossRef]
  23. Wu, G.X.; Shi, F.Y.; Kirby, J.T.; Liang, B.C.; Shi, J. Modeling wave effects on storm surge and coastal inundation. Coast. Eng. 2018, 140, 371–382. [Google Scholar] [CrossRef]
  24. Ahmad, I.; Noor, R.M.; Ali, I.; Imran, M.; Vasilakos, A. Characterizing the role of vehicular cloud computing in road traffic management. Int. J. Distrib. Sens. Netw. 2017, 13, 155014771770872. [Google Scholar] [CrossRef]
  25. Sitton, J.D.; Zeinali, Y.; Rajan, D.; Story, B.A. Frequency Estimation on Two-Span Continuous Bridges Using Dynamic Responses of Passing Vehicles. J. Eng. Mech. 2020, 146, 04019115. [Google Scholar] [CrossRef]
  26. Khattra, S.K.; Rai, H.S.; Singh, J. Towards Automated Structural Stability Design of Buildings—A BIM-Based Solution. Buildings 2022, 12, 451. [Google Scholar] [CrossRef]
  27. Zhou, S.H.; Song, G.Q.; Wang, R.P.; Ren, Z.H.; Wen, B.C. Nonlinear dynamic analysis for coupled vehicle-bridge vibration system on nonlinear foundation. Mech. Syst. Signal Process. 2017, 87, 259–278. [Google Scholar] [CrossRef]
  28. Vahidi-Moghaddam, A.; Rajaei, A.; Yazdi, E.A.; Eghtesad, M.; Necsulescu, D.S. Nonlinear forced vibrations of nonlocal strain gradient microbeams. Mech. Based Des. Struct. Mach. 2023, 51, 1035–1053. [Google Scholar] [CrossRef]
  29. Yin, X.; Xiao, S.; Feng, K.; Huang, Z.; Zuo, L.; Quan, Y. Three-Dimensional Stochastic Traffic-Bridge Coupled Vibration Analysis Considering Combined Wind-Wave Action. Int. J. Struct. Stab. Dyn. 2025. [Google Scholar] [CrossRef]
  30. Zinno, R.; Haghshenas, S.S.; Guido, G.; VItale, A. Artificial Intelligence and Structural Health Monitoring of Bridges: A Review of the State-of-the-Art. IEEE Access. 2022, 10, 88058–88078. [Google Scholar] [CrossRef]
  31. Melchiorre, J.; D’Amato, L.; Agostini, F.; Rizzo, A.M. Acoustic emission onset time detection for structural monitoring with U-Net neural network architecture. Dev. Built Environ. 2024, 18, 100449. [Google Scholar] [CrossRef]
  32. Zhou, Y.F.; Chen, S.R. Dynamic Simulation of a Long-Span Bridge-Traffic System Subjected to Combined Service and Extreme Loads. J. Struct. Eng. 2015, 141, 04014215. [Google Scholar] [CrossRef]
  33. Yin, X.F.; Huang, Z.; Liu, Y. Framework of vehicle-bridge coupled analysis for suspension bridges under refined vehicle modeling considering realistic traffic behavior. Structures 2023, 47, 1991–2005. [Google Scholar] [CrossRef]
  34. Wei, K.; Bai, Z.Y.; Zhang, J.T.; Yang, Q.S. Numerical investigation into the dynamic response of a long-span floating suspension bridge under random traffic flow loads. Ocean Eng. 2025, 326, 120888. [Google Scholar] [CrossRef]
  35. Huang, Z.; Yin, X.F.; Quan, Y.; Liu, Y.; Xiang, P. Stochastic vibration prediction of long-span bridges under traffic load based on deep neural network of multi-mode information fusion. Adv. Eng. Softw. 2025, 207, 103953. [Google Scholar] [CrossRef]
  36. Shen, Y.B.; Lin, Z.Y.; Wang, Z.F. Single-Side Accumulative Jacking Construction Method for Large-Span Arched Latticed Shells. J. Constr. Eng. Manag. 2022, 148, 06022001. [Google Scholar] [CrossRef]
  37. Chen, Y.M.; Liao, Y.; Zhu, L.M.; Chen, L.K.; Chen, Y.L. Robustness of a Steel Truss Bridge Subjected to Sudden Member Breakage during the Continuous-to-Simply-Supported Transition. Buildings 2024, 14, 3035. [Google Scholar] [CrossRef]
  38. Zhang, W.; Cai, C.S. Fatigue Reliability Assessment for Existing Bridges Considering Vehicle Speed and Road Surface Conditions. J. Bridge Eng. 2012, 17, 443–453. [Google Scholar] [CrossRef]
  39. Zhang, X.B.; Wang, J.; Chen, Z.Z.; Quan, Y.; Zheng, Z.Z.; Zhang, T.Y.; Cao, J.; Xie, X.N.; Liu, X.C.; Xiang, P. A distributed fiber optic sensor-based approach for crack asphalt structure under freeze-thaw cycling tests. Constr. Build. Mater. 2025, 476, 141262. [Google Scholar] [CrossRef]
Figure 1. The wind–vehicle–bridge coupling vibration analysis model.
Applsci 15 07577 g001
Figure 2. Numerical models of vehicles.
Applsci 15 07577 g002
Figure 3. The vehicle numerical dynamic model.
Applsci 15 07577 g003
Figure 4. The flowchart of a large-span nonlinear dynamics solution.
Applsci 15 07577 g004
Figure 5. Bridge model.
Applsci 15 07577 g005
Figure 6. The entirety of the bridge.
Applsci 15 07577 g006
Figure 7. The wind sensor.
Applsci 15 07577 g007
Figure 8. Stochastic traffic flow simulation flowchart.
Applsci 15 07577 g008
Figure 9. The long-term test result of the vertical dynamic response of sparse traffic.
Applsci 15 07577 g009aApplsci 15 07577 g009b
Figure 10. The short-term test result of the vertical dynamic response of sparse traffic.
Applsci 15 07577 g010
Figure 11. The long-term test result of the vertical dynamic response of dense traffic.
Applsci 15 07577 g011
Figure 12. The short-term test result of the vertical dynamic response of dense traffic.
Applsci 15 07577 g012
Figure 13. The horizontal vibration under wind effects.
Applsci 15 07577 g013
Table 1. The material parameters of the bridge components.
ComponentElastic Modulus (GPA)Poisson RatioDensity (kg· m−3)
Main girder2060.307850
Cables2010.307800
Pier31.00.202400
Pylon34.50.232500
Table 2. The number of vehicles in the eight two-way lanes.
LanesClass 1 Car (veh)Class 2 Car (veh)Class 3 Car (veh)Class 4 Car (veh)Class 5 Car (veh)Class 6 Car (veh)
1–4 lanes51122903141285644348
5–8 lanes48332823132572131333
Disclaimer/Publisher’s Note: The statements, opinions and data contained in all publications are solely those of the individual author(s) and contributor(s) and not of MDPI and/or the editor(s). MDPI and/or the editor(s) disclaim responsibility for any injury to people or property resulting from any ideas, methods, instructions or products referred to in the content.

