Eight benchmark functions (including both conventional and highly complex ones, as shown in
Table 1) were selected from the CEC2013 competition dataset—which is commonly used for two-dimensional multimodal optimization research—in order to test the performance of the TCDE algorithm. For further comparison, 15 of the latest high-performance multimodal optimization algorithms were used as baseline methods. Finally, we explored how to apply TCDE to the next generation of wireless communication networks in engineering applications to address the multimodal optimization problems that exist within them.
4.1. Evaluation Metrics
Given the maximum () and accuracy , the peak ratio () and success rate () were utilized to evaluate the performance of the multimodal optimization algorithms.
reflects the average percentage of all global optima found over multiple runs, with the following formula:
where
denotes the global optimum found at the end of the
ith run,
represents the already known optimal value,
denotes the number of runs, and
stands for the number of successful runs.
is the percentage of successful runs (those in which all global optima are found). Its formula can be expressed as
Five precision classes are often used in the literature: = 1.0 × 10⁻¹, = 1.0 × 10⁻², = 1.0 × 10⁻³, = 1.0 × 10⁻⁴, and = 1.0 × 10⁻⁵. However, since the precision levels = 1.0 × 10⁻¹ and = 1.0 × 10⁻² are not sufficiently high, only the last three precision levels = 1.0 × 10⁻³, = 1.0 × 10⁻⁴, and = 1.0 × 10⁻⁵ were used here.
4.2. Baseline Methodology
The TCDE algorithm was compared with the following 15 multimodal optimization algorithms, mainly from highly cited works and authoritative journals (e.g., IEEE Transactions on Evolutionary Computation and IEEE Transactions on Cybernetics).
Firstly, since this method uses terrain contours to guide multimodal optimization, it is compared with other contour-based approaches.
ANDE (2019) [
10]: This method is characterized by utilizing the individual distribution information in each niche to generate contour lines, thereby predicting the approximate positions of potential peaks to accelerate the convergence speed.
Secondly, we selected multimodal optimization algorithms using subpopulation strategies as the baseline method to measure the performance of TCDE.
CDE (2004) [
22]: This method is characterized by fast convergence and the ability to finely tune the found results. It extends subpopulations via a crowding mechanism, enabling it to track and maintain multiple optimal solutions.
SDE (2005) [
23]: In each iteration, the algorithm adaptively forms multiple species (or subpopulations) within its DE population. Each species then operates as an independent DE algorithm, performing successive local improvements to eventually obtain multiple global optima.
PNPCDE (2014) [
40]: This method restricts member randomness without compromising exploration, using a parent-centric normalized neighborhood (PCNN) mutation operator combined with a synchronous crowding replacement strategy. This approach effectively prevents niche loss, reduces genetic drift, and maintains optimal solutions, enabling stable and efficient niching behavior.
Self-CSDE (2014) [
24]: This method divides the population into subpopulations using clustering and then uses adaptive parameter control to enhance the search capability of the species-based differential evolution (SDE) algorithm, and the method has achieved good results.
NMMSO (2014) [
41]: The subpopulations of the algorithm are each responsible for optimizing independent local modes. If individuals within a subpopulation are identified as being near other peaks, they are allowed to migrate from the original subpopulation; if different subpopulations are determined to target the same peak, they are merged. The algorithm achieves optimization by dynamically managing multiple particle swarms in this way.
NCD-DE (2021) [
32]: This method designs a fitness–entropy measurement objective function, applies an internal genetic algorithm (GA) to optimize multiple promising niche centers, and globally cooperates with subpopulation niching using these centers to generate new individuals. Differential evolution (DE) is then employed iteratively to refine the results.
RS-CMSA-ESII (2022) [
19]: This method proposes a covariance matrix adaptation evolution strategy with repulsive subpopulations. It optimizes the subpopulation initialization process and designs more precise key forbidden regions.
Finally, a group of multimodal optimization algorithms using local information was selected as the comparison methods.
R3PSO (2010) [
42]: The main feature of this method is the adoption of a simple and effective parameter-free niching algorithm—namely, using a ring neighborhood topology to induce the formation of stable niches. It preserves the current best position through the local memory of individual particles, while using the particle swarm optimization (PSO) algorithm as a local optimizer to obtain the final results.
LIPS (2013) [
43]: The Locally Informed Particle Swarm (LIPS) algorithm forms niches by calculating Euclidean distance neighborhoods, using local information to enhance the local search capabilities. It employs multiple local best particles to guide each particle’s search, thus identifying multiple optimal solutions via the fine-tuning ability of particle swarm optimization (PSO).
LoISDE (2014) [
44]: This method first employs a local information matrix to enhance the mutation phase of DE. Then, it integrates this refined mutation phase with an information-sharing mechanism to elevate the algorithm’s search efficiency. Subsequently, it implements a niche-aware population synchronization strategy to minimize niche loss. Together, these sequential strategies empower LoINDE to outperform existing DE-based niching algorithms.
LMCEDA and LMSEDA (2017) [
45]: A novel local search scheme based on Gaussian distribution was proposed to refine the obtained solutions, thereby constructing the Local Search Clustering-Enhanced Distribution Estimation Algorithm (LMCEDA) and the Local Search Speciation Distribution Estimation Algorithm (LMSEDA).
FDLS-ADE (2023) [
13]: This method proposes a novel fitness- and distance-based individual local search technique, FDLS, which can avoid ineffective local searching in local optimal solutions and similar regions. After applying FDLS to DE with an adaptive parameter scheme, the effectiveness of the algorithm has been significantly improved.
SA-DQN-DE (2024) [
9]: This method assigns mutation operations to each individual based on the effectiveness of different mutation operators in historical evolution. Then, deep reinforcement learning is introduced to select multiple local search operators to improve the accuracy of potential optimal solutions.
4.4. Analysis of Experimental Results
To facilitate an intuitive understanding of TCDE,
Figure 8 presents the ultimate outcomes achieved with TCDE for eight distinct functions. From
Figure 8, it becomes evident that the TCDE algorithm effectively identifies all peak points within these eight functions. These functions encompass not only simpler ones, such as F4(a) and F5(b), but also more intricate functions like F6(c), F7(d), and F10(e), which possess numerous peak points. Furthermore, even in the case of highly complex functions such as F12(g) and F13(h), which contain many local optima, the TCDE algorithm consistently and accurately pinpoints all peaks with the guidance provided by the topographical contours.
To further analyze the performance of the TCDE algorithm, it was compared with the baseline methods using different precision levels:
= 1.0 × 10
−3,
= 1.0 × 10
−4, and
= 1.0 × 10
−5. As shown in
Table 3,
Table 4 and
Table 5, the TCDE algorithm outperformed the other algorithms in all eight test functions evaluated with the
and
.
Both the TCDE and AnDE algorithms perform well, but the former outperforms the latter (which uses contour methods) on F7 and F13. As shown in
Figure 8, these two test functions involve complex scenarios with coexisting rough and fine peaks, as well as steep connections between peaks. This indicates that, compared with the AnDE algorithm’s local application of contour optimization, the TCDE algorithm’s strategy of globally optimizing topographical contours while distinguishing between rough and fine peaks is effective, enabling it to handle multimodal optimization problems in complex situations.
As shown in
Table 3,
Table 4 and
Table 5, all baseline methods in the subpopulation group perform worse than TCDE. Among them, Self-CSDE shows extremely poor performance: its PR and SR values are only 1.000 for the F5 function in
Table 3, and it fails to achieve perfect results for any other test functions. This indicates that its niche strategy of adaptively generating subpopulations fails in complex scenarios with steep connections between multimodal peaks and coexisting rough–fine peaks. CDE, SDE, and PNPCDE can effectively handle scenarios with gentle or steep connections between multimodal peaks, but their strategies perform poorly in complex cases with rough–fine peaks. Although RS-CMSA-ESII demonstrates improved performance, it still has a probability of failure in dealing with steep connections between multimodal peaks and complex situations with coexisting rough–fine peaks.
Similarly, it is evident that TCDE outperforms the baseline methods relying on local information. Here, methods such as LIPS, R3PSO, and LolSDE, which primarily depend on local information strategies, struggle to locate all peaks in both scenarios with gentle connections between multimodal peaks and more complex ones. When local information is combined with strategies such as Gaussian distribution and fitness–distance enhancement, the multimodal optimization capabilities of the algorithms are enhanced. For instance, LMCEDA, LMSEDA, and FDLS-ADE can not only handle gentle connections between multimodal peaks but also demonstrate significantly improved performance in scenarios with steep connections. In particular, SA-DQN-DE, after integrating deep learning, exhibits enhanced capabilities in addressing complex scenarios with coexisting rough and fine peaks.
From the above analysis, it can be seen that the TCDE algorithm can be applied to simple and complex multimodal optimization problems, including those with gentle and steep connections between multiple peaks and coexisting rough–fine peaks. To further highlight this characteristic of the TCDE algorithm, F7 (2D Vincent) and F13 (2D Composition Function 3), as two test functions with complex characteristics, were selected for detailed analysis.
4.4.1. F7 (2D Vincent)
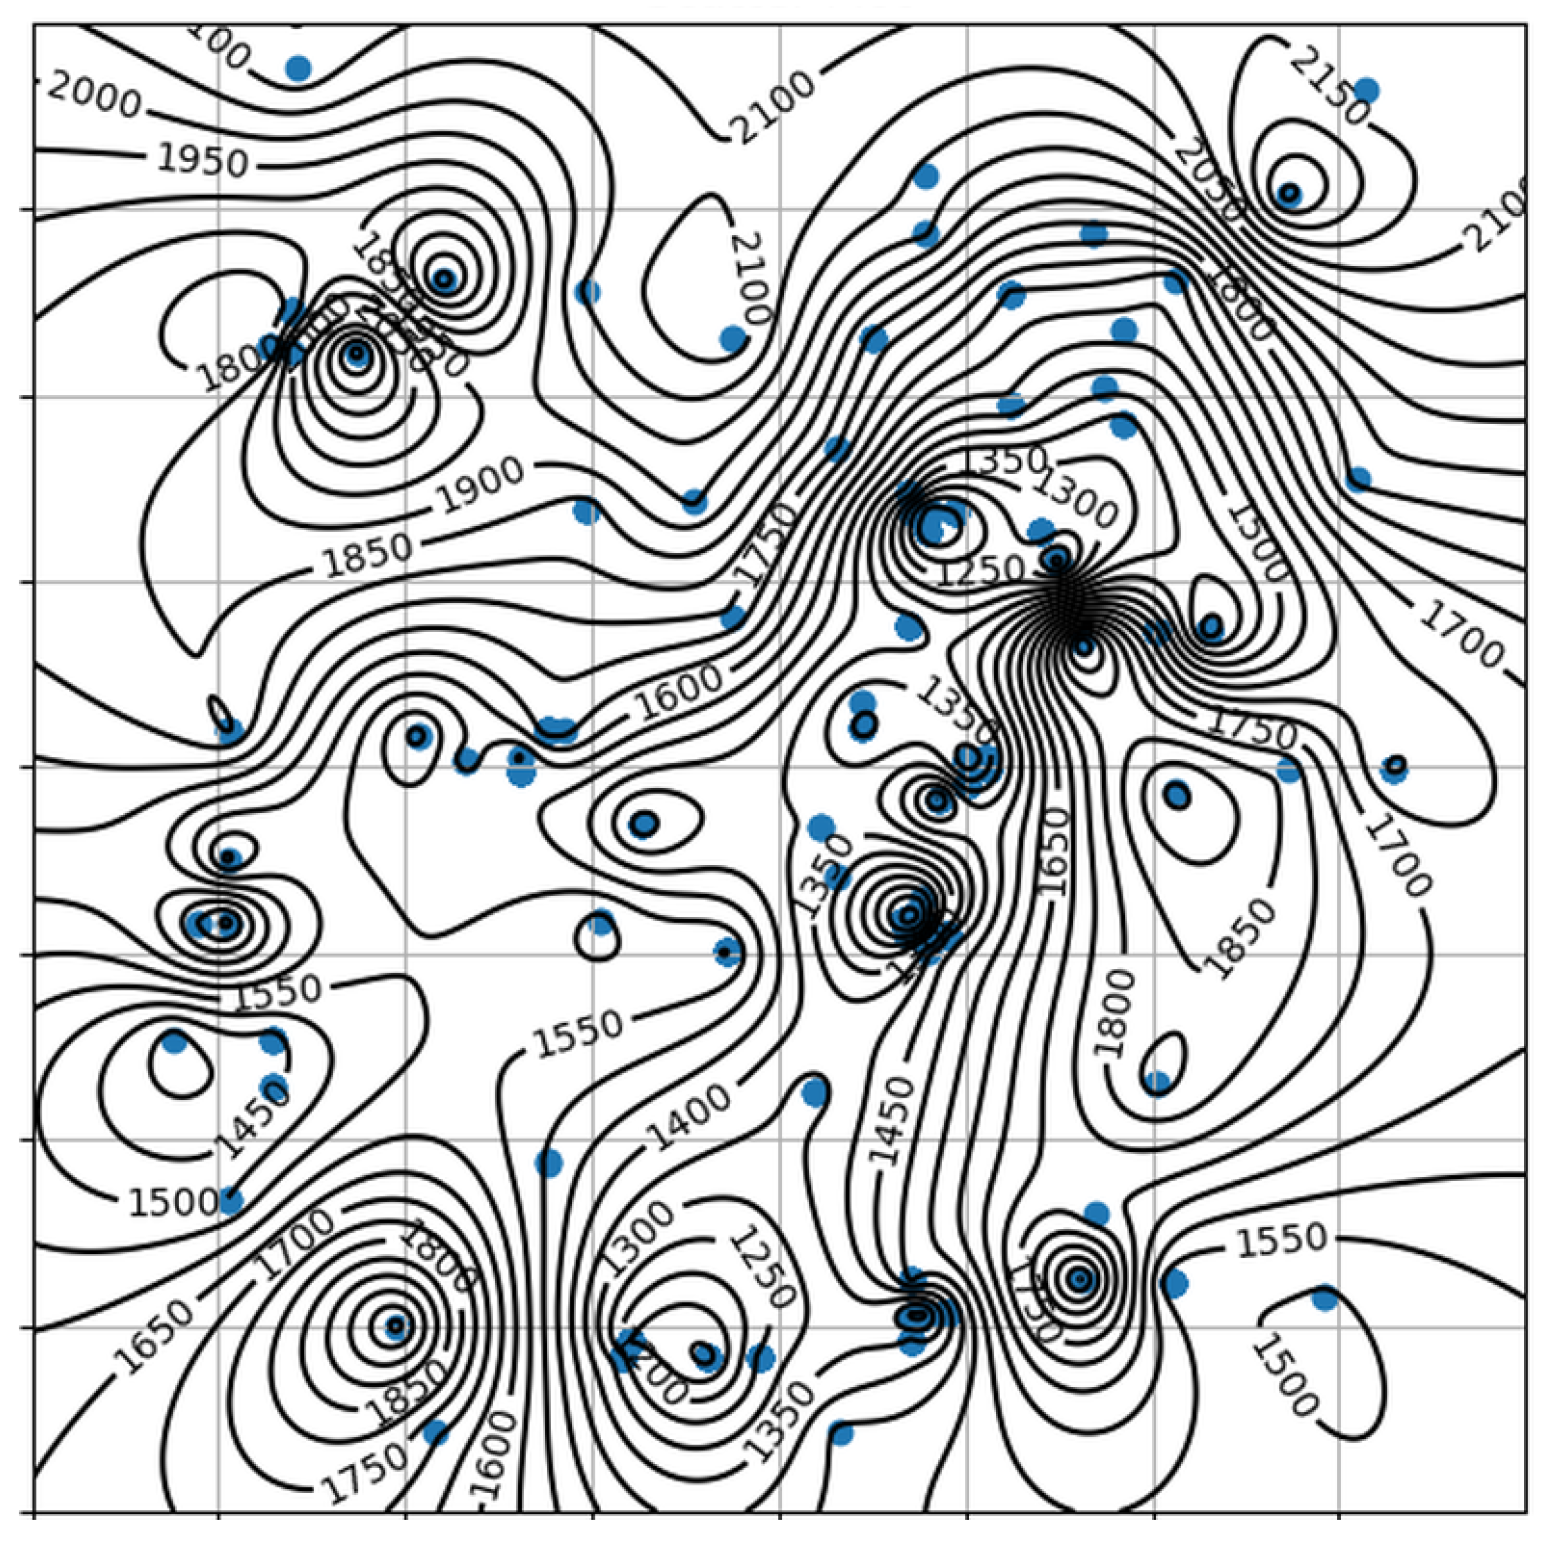
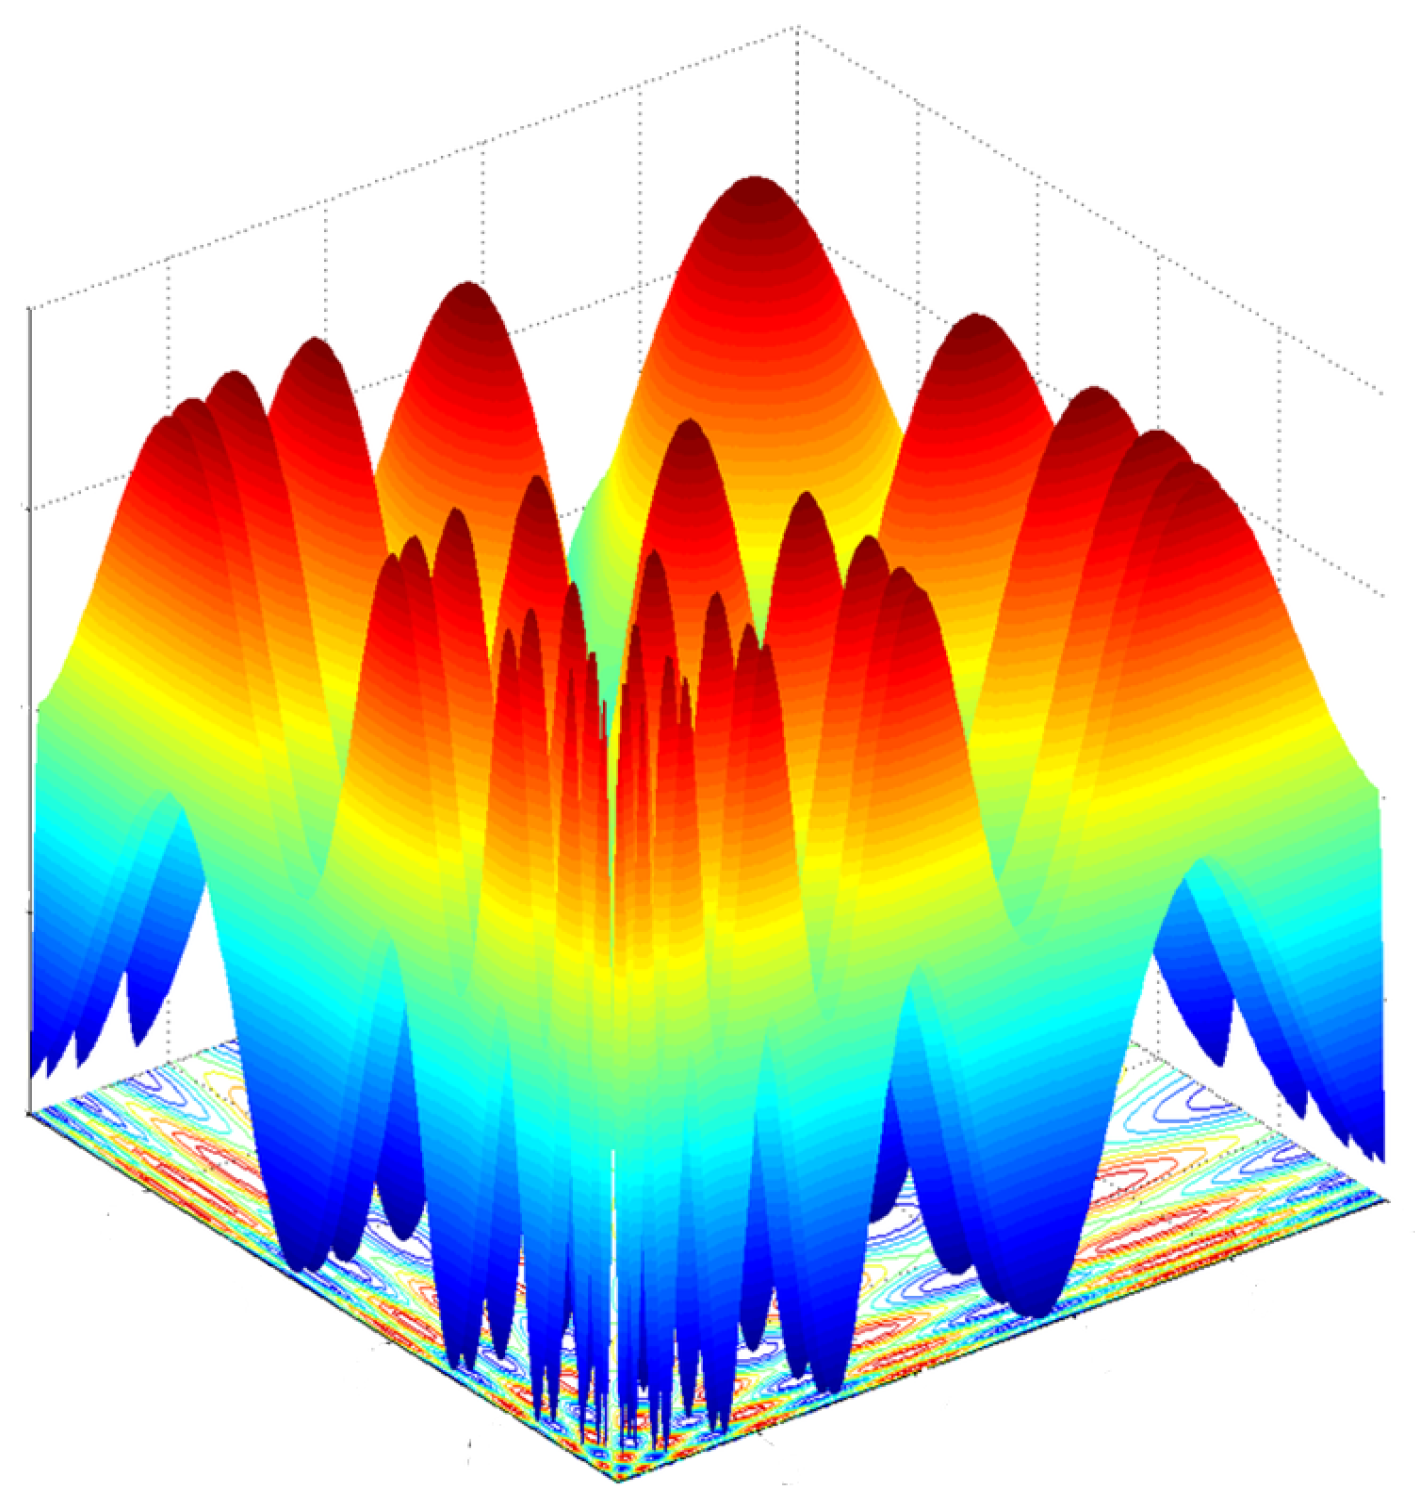
The F7 function is shown in
Figure 9. It has 36 peaks with different sizes and contains multiple different coarse and fine peaks, with complex terrain and landforms. This function challenges the capabilities of the multimodal optimization algorithm.
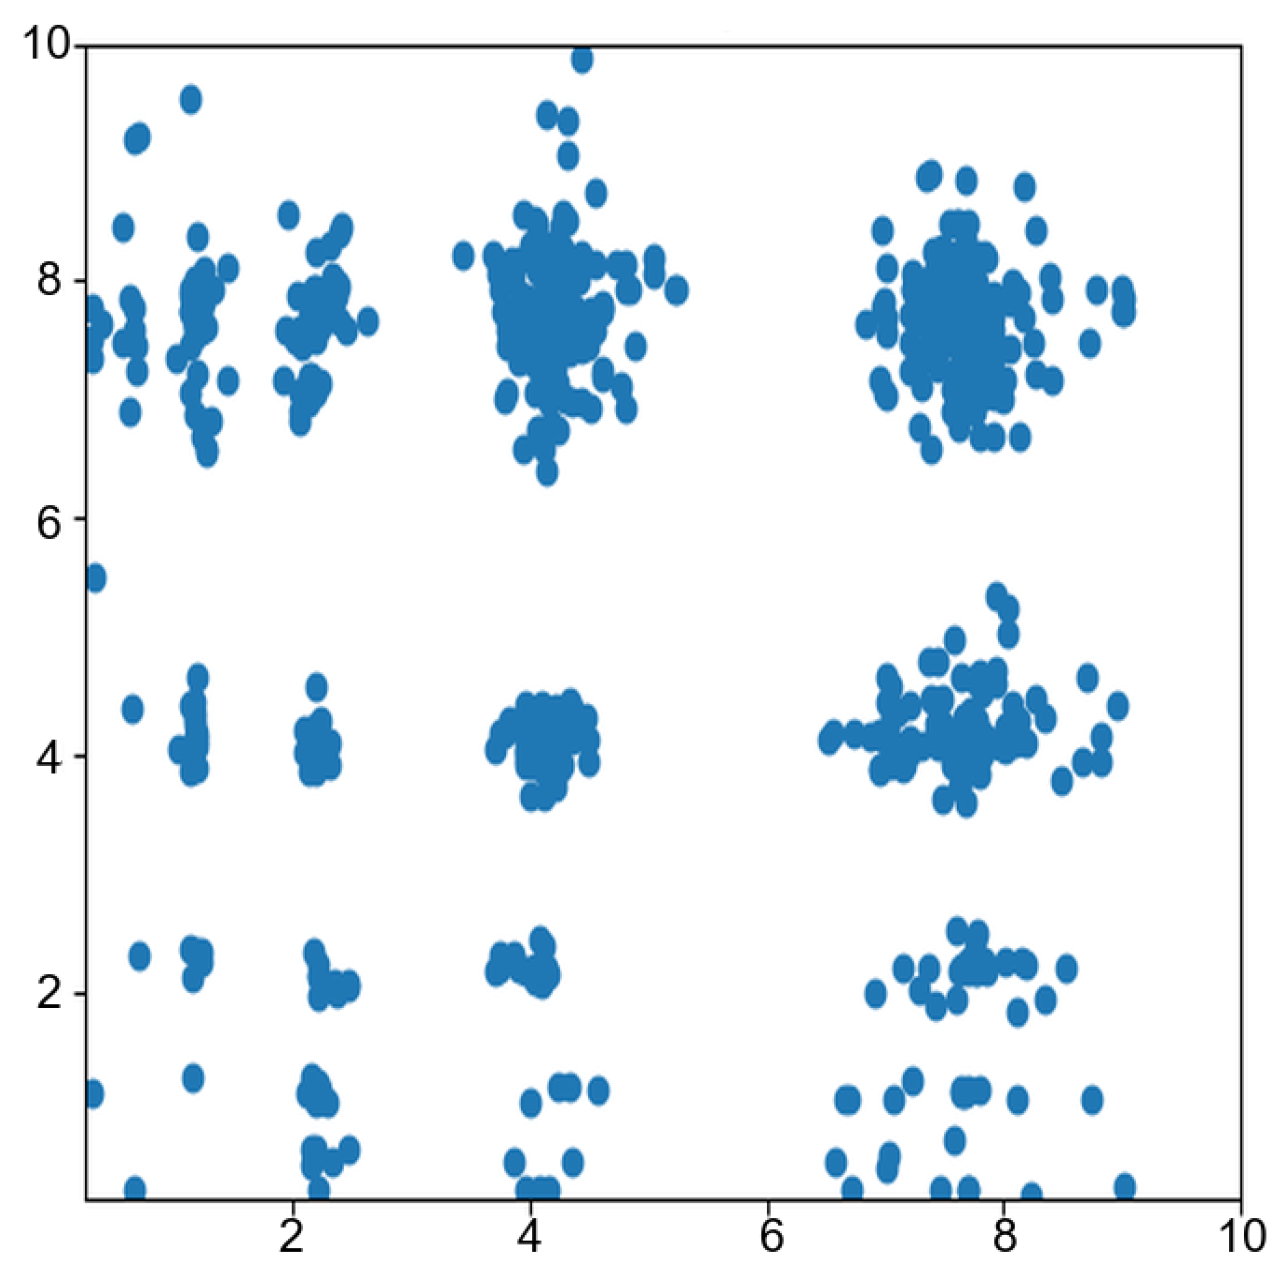
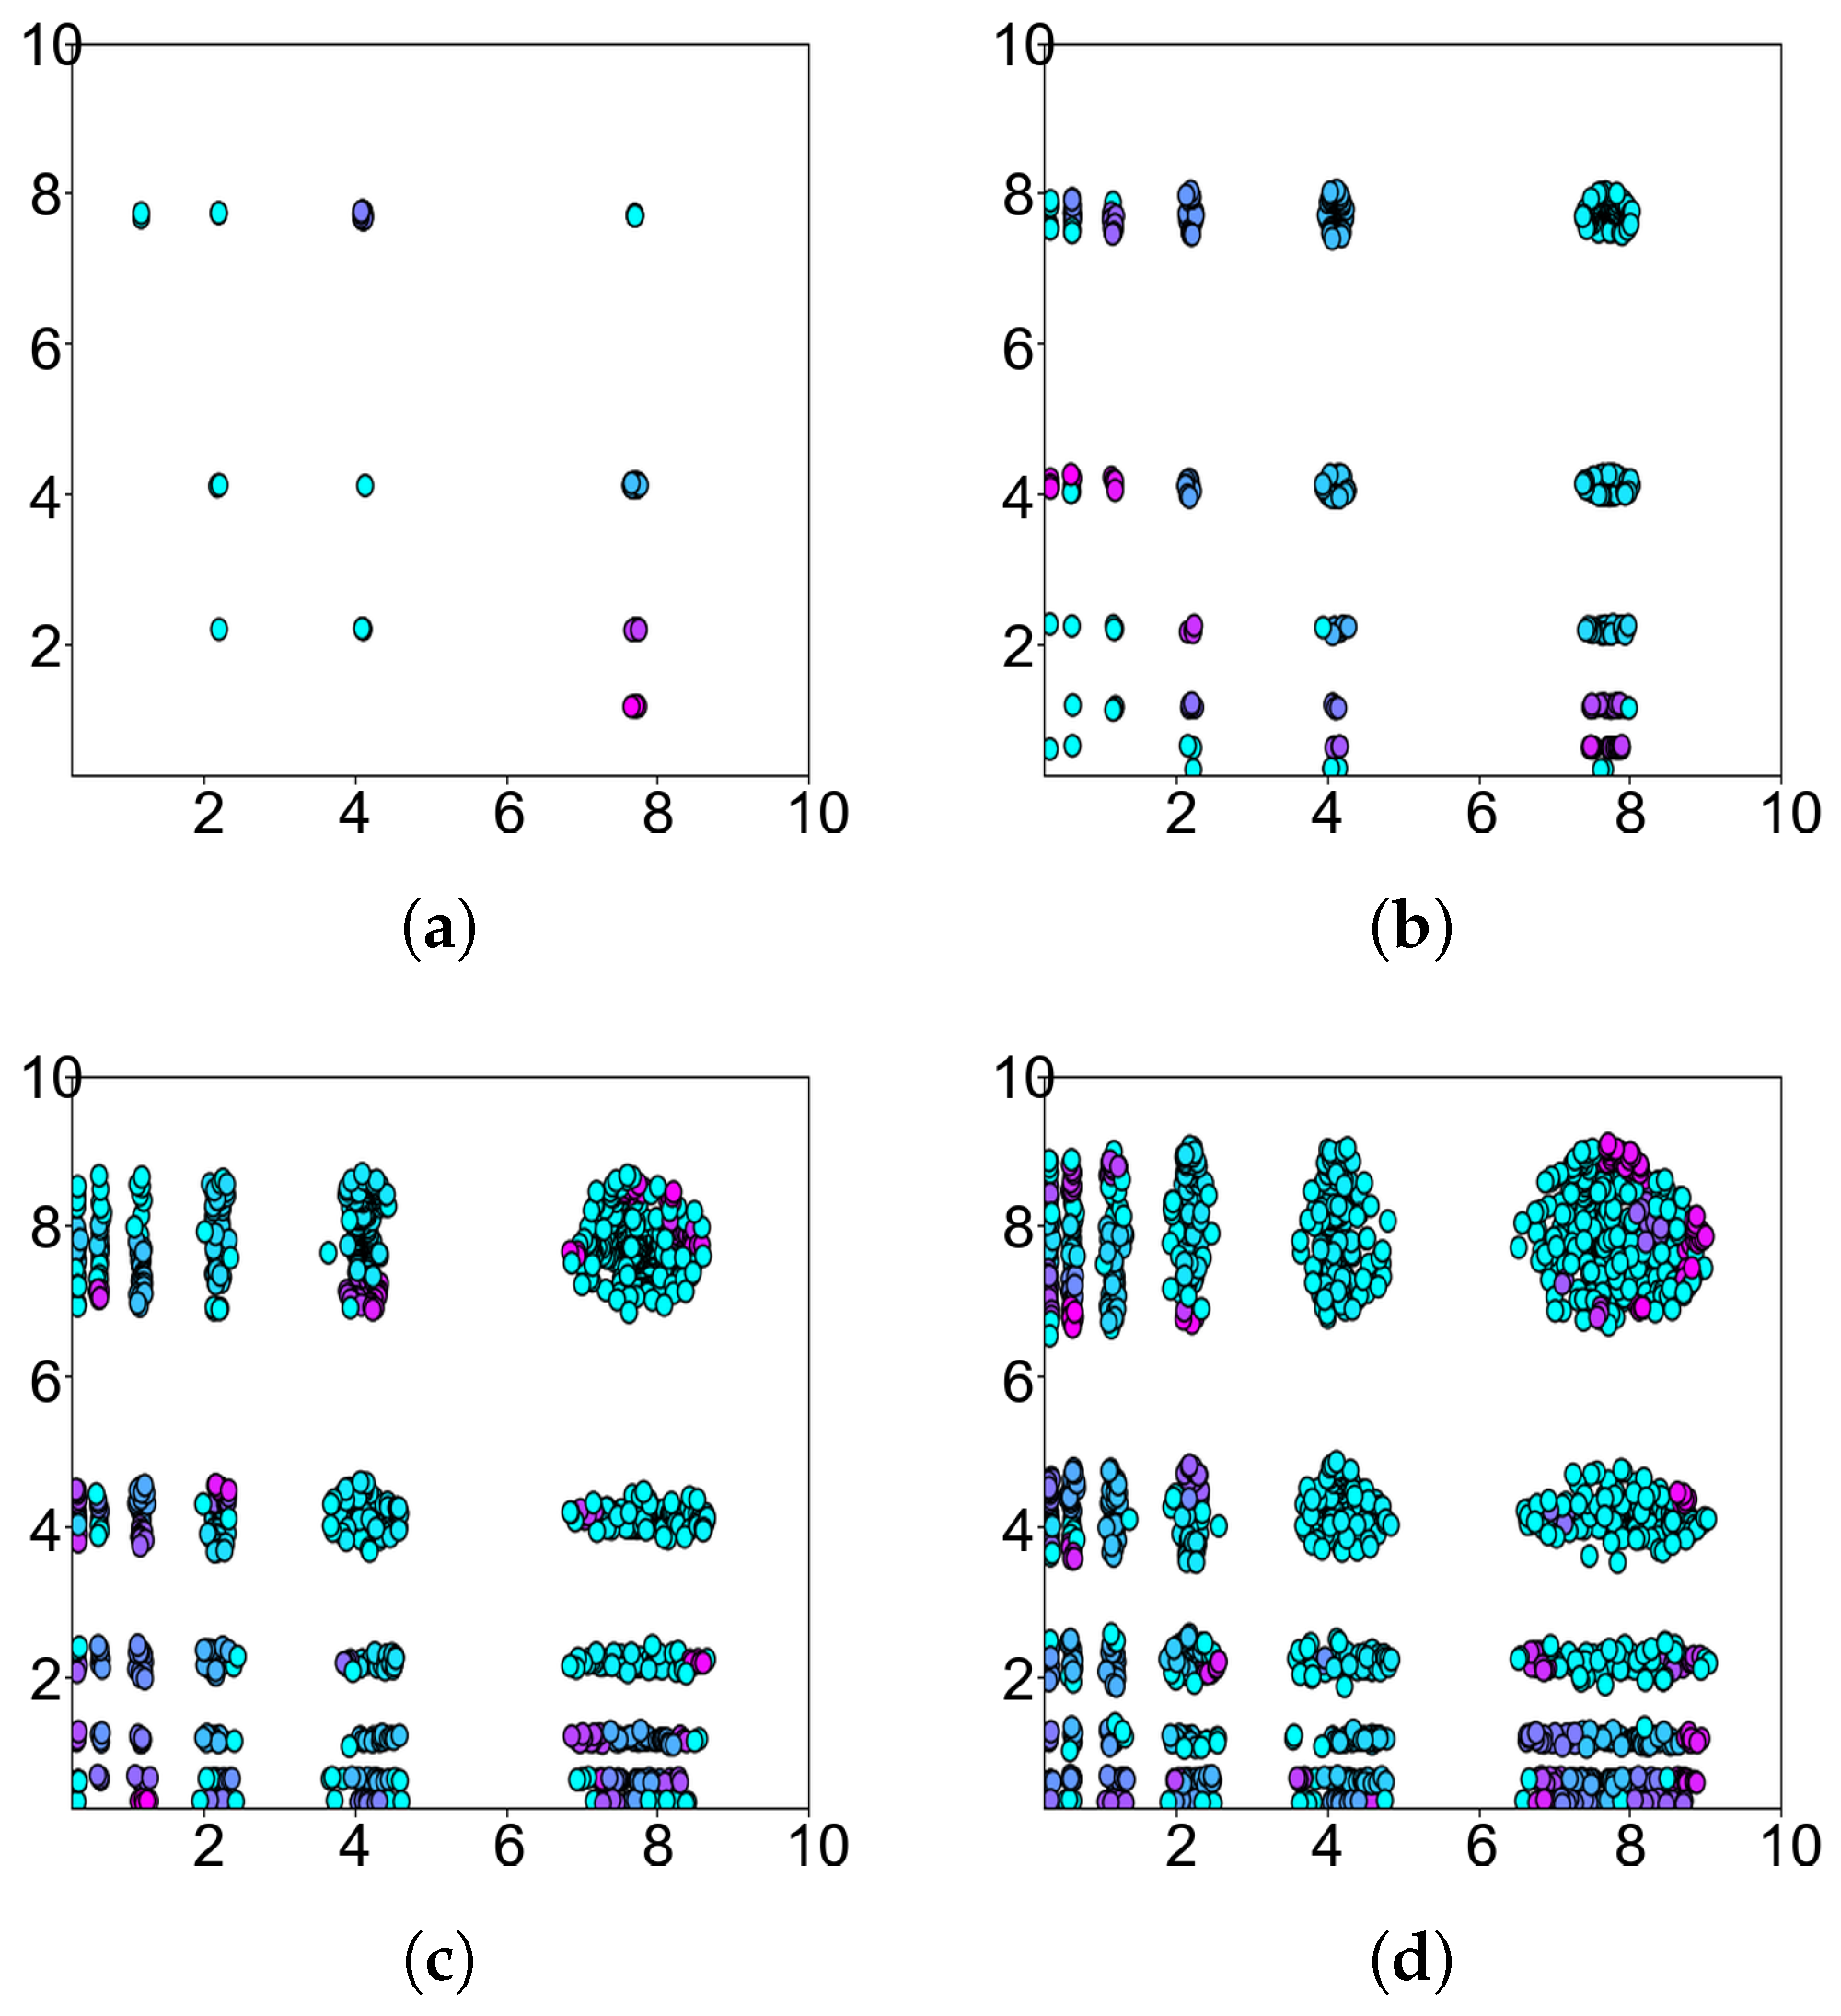
Figure 10 shows the range of potential peaks predicted by the TCDE algorithm in rounds 1, 10, 20, and 30 of the optimization of the 2D Vincent function by means of terrain contours. From
Figure 10, it is evident that the TCDE algorithm identifies some of the peaks in the first round, and, as the algorithm iterates, more potential peaks are discovered. In other words, the number of individuals in the potential peak area also increases. This means that peaks are located more accurately.
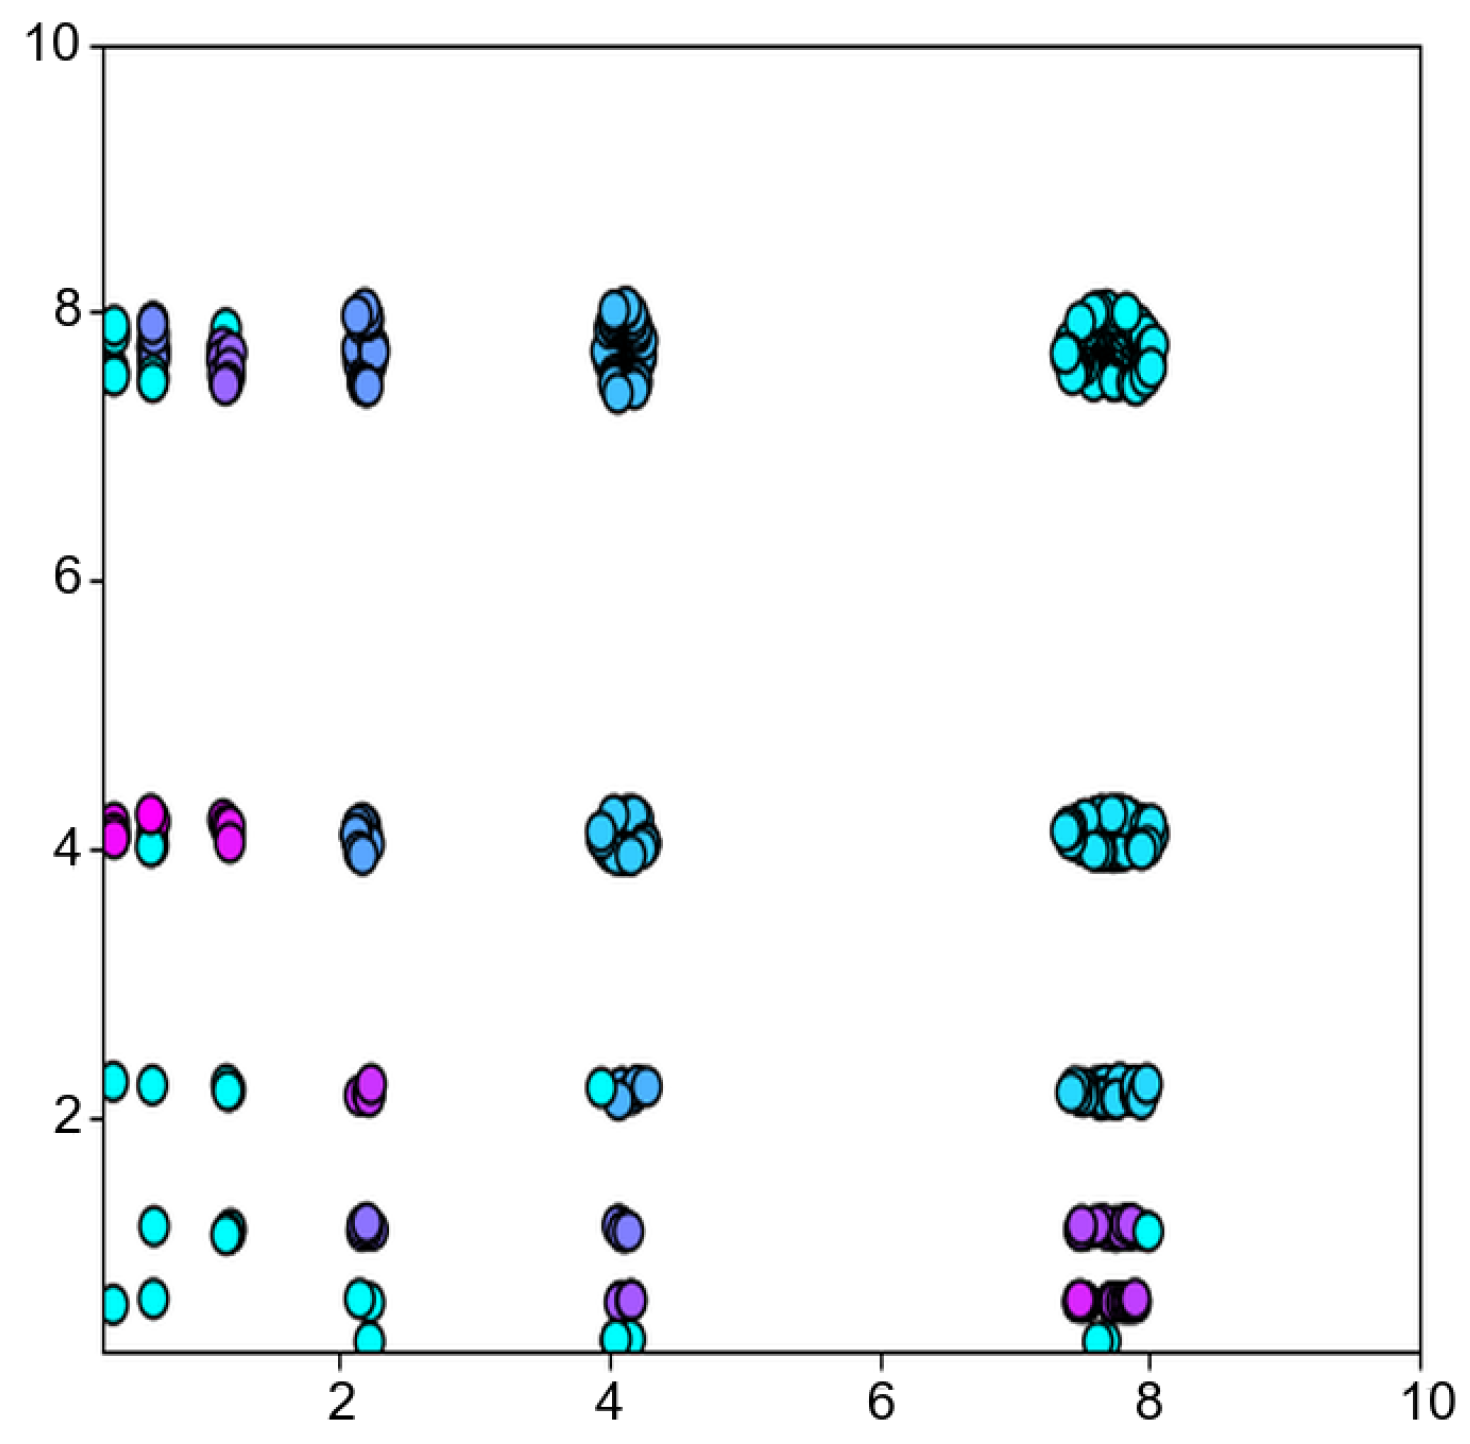
The distribution of individuals in the TCDE algorithm’s topographical exploration after setting taboo areas is shown in
Figure 11. It can be seen that, as the algorithm iterates, the taboo regions also constantly change. This causes the population to constantly move away from the positions where the peaks have been explored during the evolution of the algorithm. In this way, the TCDE algorithm can explore areas that were previously underexplored more carefully.
Through the above two techniques, the TCDE algorithm can effectively address the problem of coarse and fine peaks in the 2D Vincent function. Thus, all peaks are identified.
4.4.2. F13 (2D Composition Function 3)
Figure 8h shows F13, which is a more complex multimodal optimization function than F7, consisting of six basic functions, including the Weierstrass function and Griewank’s function. The peaks in 2D Composition Function 3 include both coarse and fine peaks. The fine peaks display a remarkable level of irregularity, justifying this function’s classification as a classic complex multimodal problem. Similar to the procedure used for the 2D Vincent function, the ranges of potential peaks accurately predicted in rounds 1, 10, 20, and 30 were selected. As shown in
Figure 12, the TCDE algorithm finds all coarse peaks, as well as some of the fine peaks at the beginning. As the algorithm iterates, the taboo areas of the coarse peaks gradually expand, forcing the population to stay away from the peaks that have been found. This is shown in
Figure 13. Finally, as the TCDE algorithm iterates, the topographic contours of 2D Composition Function 3 become increasingly obvious. Very small peaks that were previously difficult to explore are also successfully discovered, which clearly illustrates the superiority of the TCDE algorithm.
4.5. Engineering Applications
There are numerous multimodal optimization problems in engineering applications, such as the multi-template matching problem in image recognition. These problems have wide-ranging applications in fields such as medicine, transportation, and industrial automation and thus hold considerable research value. For instance, in the realm of electronics manufacturing, the PCB multi-template matching problem involves employing template matching technology to precisely locate various components on the PCB, including resistors, capacitors, and integrated circuits, ensuring that they are correctly placed. Moreover, PCB multi-template matching can be utilized to detect defects on the PCB, such as soldering issues, open circuits, or short circuits, facilitating early identification and repair and thereby ensuring product quality. While traditional template matching can only be used to identify a single matching position, in practical engineering applications, there are typically multiple matching positions. Additionally, traditional template matching algorithms often necessitate the traversal of every pixel, which can lead to substantial costs and time consumption. Therefore, the ability to identify multiple peaks simultaneously using fewer pixels could significantly reduce the costs and enhance the efficiency of businesses.
Evolutionary algorithms can effectively address this issue of traditional template matching. Evolutionary algorithms seek the optimal solution through randomized populations, employing operations such as crossover and mutation, thus circumventing the need to inspect every pixel. This approach offers a significant advantage in terms of efficiency. When multiple regions within the target image match the template, the relationship between the template’s pixel positions and the matching degree forms a multimodal optimization problem. Consequently, the TCDE algorithm can be employed to effectively solve this problem.
A similarity evaluation function must be employed to transform PCB multi-template matching into a multi-peak optimization problem. Normalized cross-correlation (NCC) is a technique that involves quantifying the similarity between each pixel of a target image and a template. The NCC matching method involves calculating the cross-correlation between the target image and the template, normalizing the result, and then assessing the similarity between each pixel in the target image and the template. This process mitigates the effects of varying brightness and contrast levels, enhancing the accuracy of the similarity measurement. Consequently, NCC has long been recognized as a standard method for similarity measurement in feature matching and target recognition. This indicates that the TCDE algorithm is effective in the PCB multi-template matching problem.
Template matching can be transformed into a multimodal optimization problem through the use of normalized cross-correlation (NCC) matching. The normalized cross-correlation matching between a target image
F of size
and a template
T of size
at position
is defined by Equation (
19), where
and
represent the grayscale values at position
in the target image and the template image, respectively.
F and
T denote the average grayscale values of overlapping regions between the target image and the template image and the grayscale average value of the template image, respectively. The template moves within the range of the target image, and the matching degree between corresponding pixels of
T and
F is calculated using the NCC method.
is a normalized value within the range
. A higher matching degree between
T and
F corresponds to a larger value of
. The matching degree of the template image at various positions within the target image can be determined by comparing the similarity between two images and identifying their correlation. Subsequently, the TCDE algorithm can be employed to search for multiple peaks, thereby identifying multiple optimal solutions.
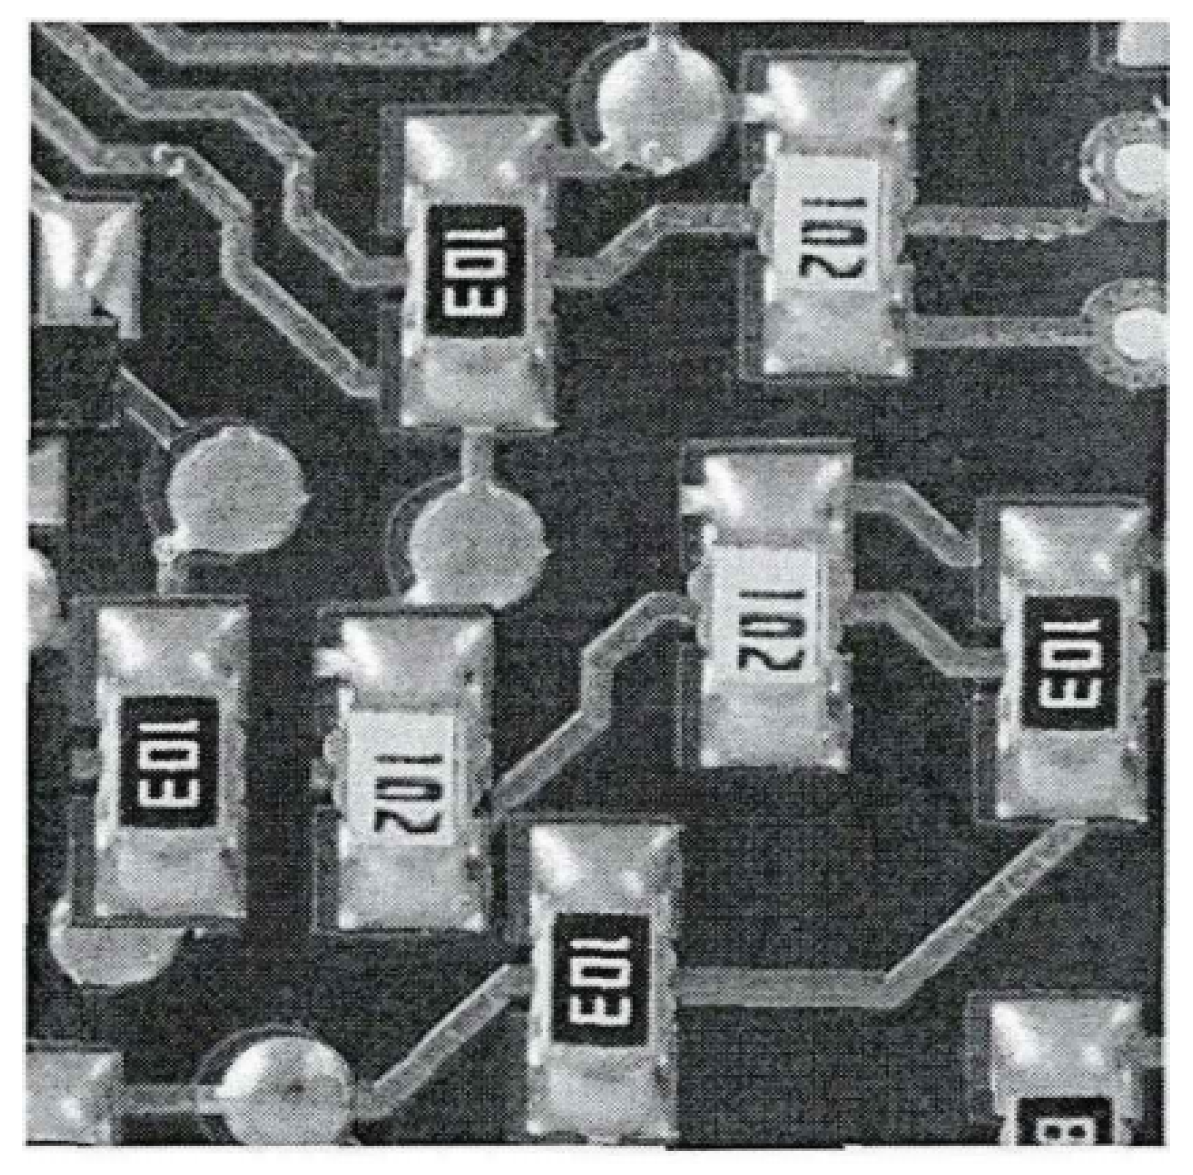
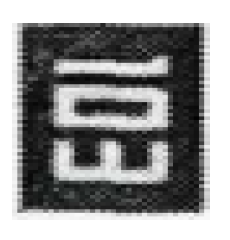
Figure 14 depicts the target PCB image with dimensions of 393 pixels × 422 pixels, while
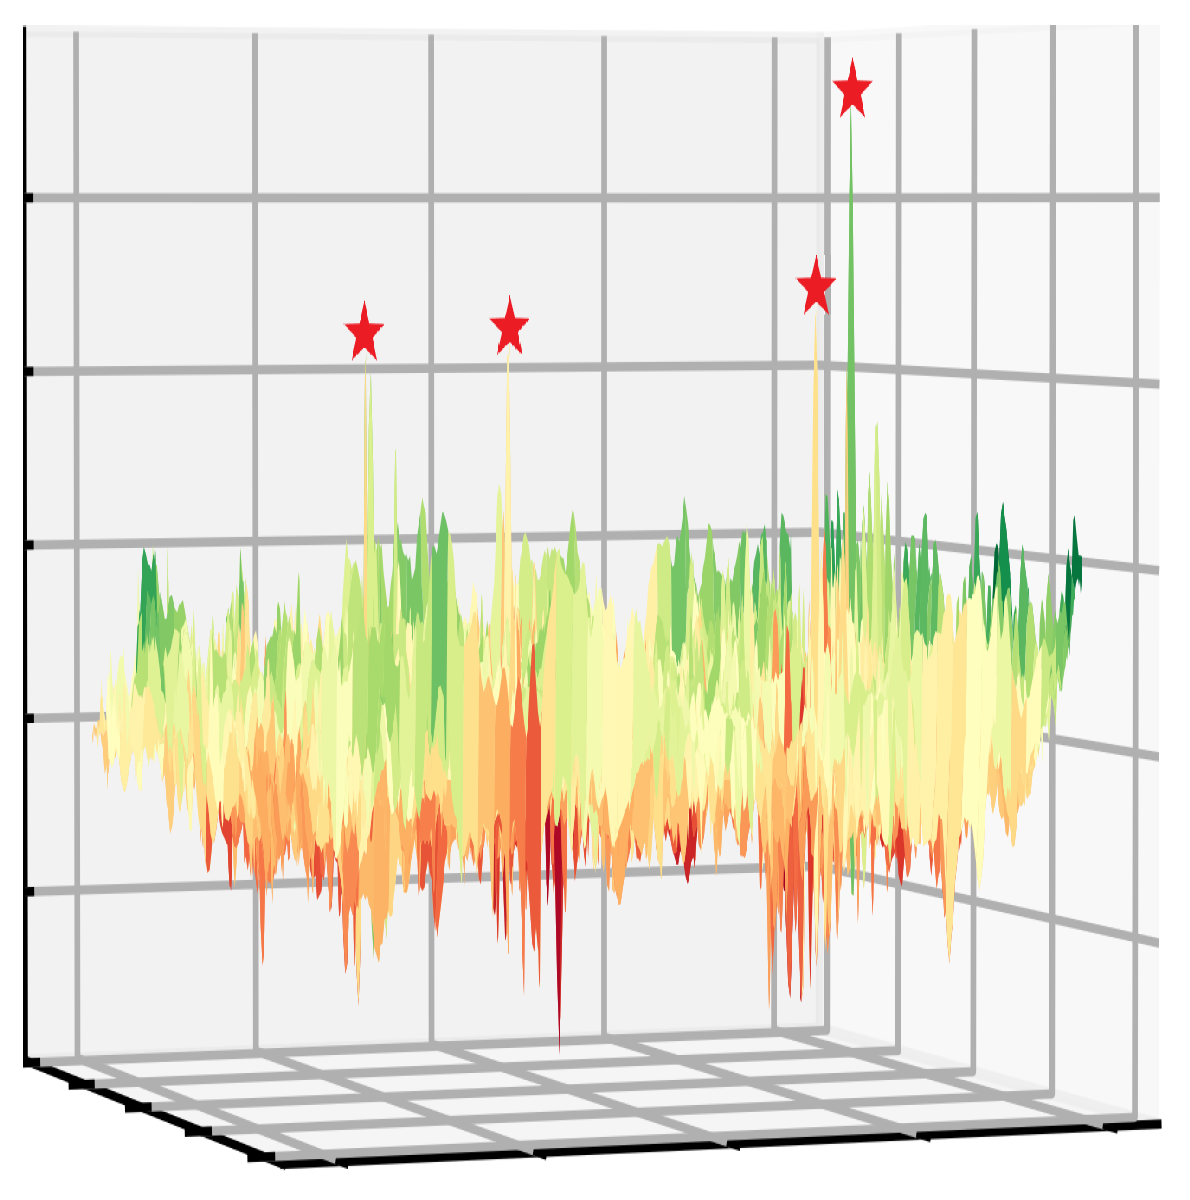
Figure 15 illustrates a template resistor image that is 34 pixels × 51 pixels in size. Within the target PCB image, there are four regions that resemble the pattern in the template resistor image, indicating the presence of four peaks. The matching process transforms into a multi-peak optimization function after the application of NCC, as depicted in
Figure 16. From the graph, it can be observed that this is a standard multi-peak optimization problem, with four peaks in the search space, representing the four optimal matching positions. Additionally, there are many irregular local peaks in the search space, which are significant sources of interference. The objective is to avoid all local peaks while accurately identifying all global ones. However, due to the abundance of local peaks, the algorithm can easily become trapped, making it difficult to locate the global peaks, which are narrow and hard to detect. As a result, the problem poses significant challenges.
Table 6 below summarizes the performance of the improved TCDE algorithm for different population sizes (30, 50, 100, 150) and compares it with the experimental results of various multi-peak optimization algorithms. Unlike the previously used evaluation metrics, which were suitable for continuous solution spaces of multi-peak optimization functions, the current image multi-target recognition involves a finite search space. Specifically, the pixel size of target image 3 is 393 × 422 = 165,846. Therefore, the original metrics are no longer applicable to the current algorithm. The number of detected pixels, which represents the consumed FEs during the optimization process, was used as a performance metric in this experiment to demonstrate the effectiveness of the algorithm. The use of fewer pixels used when finding all peaks indicates better algorithm performance.
Table 6 displays the comparison results of the TCDE algorithm with 15 advanced multi-peak optimization algorithms for different population sizes for the PCB multi-template recognition problem, with the similarity evaluation function being NCC. The experimental results indicate that the TCDE algorithm consistently uses the fewest pixels. This demonstrates the superiority of the TCDE algorithm and its effectiveness in solving image multi-target recognition problems.


