Abstract
The shear strength and bearing characteristics of lunar soil have a strong connection with its compactness. The compactness varies significantly with depth and has an important effect on engineering activities on the lunar surface. In this study, lunar soil simulant samples of four compactness levels were prepared to explore the relationship between compactness and cone tip resistance in static cone penetration tests (CPTs). The compactness values at different depths were measured layer by layer, and CPTs were carried out. The results indicate that the cone tip resistance continuously increases with the increase in the penetration depth until it reaches a peak, and then remains constant for a certain depth. The cone tip resistance after the normalization of the overburden stress gradually increases and then decreases after reaching the peak. Models of the relationship between cone tip resistance before and after normalization and compactness were constructed using a regression algorithm. The variation in lunar soil compactness with depth can be determined by measuring cone tip resistance with this model. The research findings can provide a theoretical basis for in situ testing, site selection for lunar bases, and other related aspects on the lunar surface.
1. Introduction
Lunar construction represents a bottleneck that urgently needs to be overcome for future exploration. Conducting construction on the lunar surface and establishing lunar bases are of great significance for enabling long-term human habitation on the Moon [1]. The heterogeneity of lunar soil at different depths presents formidable challenges to the construction of lunar bases. This characteristic is likely to cause the failure of the drilling process and pose instability-related risks to lunar bases. The static cone penetration test was first carried out during the Apollo and Luna landing programs, allowing the physical and mechanical properties of lunar soil to be deduced. Costes et al. [2] conducted static cone penetration tests on lunar soil samples retrieved by Apollo 11 under the loosest and densest conditions. The results showed that, at the same compactness level, the penetration resistance increases with an increase in penetration depth. Moreover, the greater the compactness, the higher the penetration resistance becomes. Mitchell et al. [3] conducted a comparative analysis of the results of static cone penetration tests at the Apollo 15 lunar landing site and the physical–mechanical properties of lunar soil, and determined cohesion and internal friction angle. The Luna 13 mission utilized a fuel-powered engine to insert a conical probe into the lunar soil to measure its mechanical property parameters. Subsequently, the physical and mechanical properties of the soil were calibrated using lunar soil simulants [4]. Jiang et al. [5] employed a centrifuge to simulate gravitational variations, aiming to investigate the changes in the cone tip resistance of lunar soil simulants. The experimental results demonstrated that, under diverse moderate-gravity conditions, the normalized cone tip resistance initially ascended to a peak value and subsequently declined to a constant value with the increase in penetration depth. Additionally, both the peak and the stable values of the normalized cone tip resistance exhibited a decreasing trend with the augmentation of gravitational acceleration. Li et al. [6] investigated the penetration resistance of the CUMT-1 lunar soil simulant under magnetically simulated lunar gravity conditions. They analyzed the impacts of the low lunar gravity and the special characteristics of lunar soil through a series of micro-penetration tests. The results indicated that an increase in gravity led to a non-linear increase in penetration resistance, which was more pronounced at low relative densities. Sun et al. [7] conducted research on the impacts of porosity and vertical stress on cone tip resistance and lateral frictional resistance in both the Earth and Moon environments. The results demonstrated that cone tip resistance and lateral frictional resistance increase with the increase in compactness in both environments. Moreover, as the vertical stress increases, the influence of compactness becomes more prominent. Jiang et al. [8,9,10] designed an experimental device for a static cone penetration model box. They conducted static cone penetration tests on the TJ-1 lunar soil simulant at three different penetration angles to explore its mechanical properties. The results showed penetration–shear failure in the lunar soil simulant in the surface layer of the foundation. The penetration resistance increased with an increase in penetration depth under the three penetration angles, and the penetration resistance increased with an increase in penetration angle at the same penetration depth. Through a comparative analysis of static cone penetration tests and static load tests, an empirical formula suitable for calculating the bearing capacity of lunar soil was explored, and the relationship between plate load tests and static cone penetration tests was established. Subsequently, this relationship was verified through large-scale outdoor tests. The above-mentioned experiments took the differences between the environments of the Earth and Moon into account and carried out penetration tests under various conditions considering factors such as gravity, depth, and penetration angle.
Numerical simulations have been widely applied to static cone penetration tests to simulate the lunar environment. Jiang et al. [11] utilized the discrete element software PFC2D 5.0 to conduct a comparative analysis of static cone penetration tests under the gravitational fields of the Earth and the Moon, aiming to investigate the differences in the results of static cone penetration tests under high- and low-gravity fields. Song et al. [12] analyzed the impacts of model size, relative density, confining pressure stress, and boundary conditions on cone tip resistance through the discrete element simulation of static cone penetration tests and established the relationship between cone tip resistance and critical state parameters. Zhao et al. [13] performed numerical simulations of triaxial shear tests and static cone penetration tests in the lunar environment using the three-dimensional discrete element method. They proposed a model for calculating the shear strength index of lunar soil based on normalized cone tip resistance, making use of the results of triaxial and cone penetration test simulations and referring to the empirical formula derived from ground cone penetration test data. Lin et al. [14] developed a model coupling finite and discrete element methods for static cone penetration and discussed the effects of penetration velocity, penetration depth, and cone tip angle on cone tip resistance. Kulchitsky et al. [15] explored the influence of different particle shapes and size distributions in the discrete element model on cone tip resistance and lateral frictional resistance in static cone penetration simulations. They compared the simulation results with those of static cone penetration tests on JSC-1A lunar soil simulant, concluding that particle size and shape distribution are the two most important factors affecting the strength of lunar soil.
However, the established studies lack consideration of the inhomogeneity of lunar soil compactness at different depths. Therefore, it is important to prepare lunar soil simulants with varying compactness states in the depth direction and conduct research via static cone penetration tests. In this way, a model of the relationship between the compactness of lunar soil and the cone tip resistance in static cone penetration tests can be established, which is crucial for determining the compactness profile of lunar soil in the depth direction. In this paper, layered compaction barrels are used to conduct static cone penetration tests of a lunar soil simulant under different compactness. Due to the effect of gravity, there will be a phenomenon during the vibration and compaction process where the compactness of the lunar soil simulant in the lower layer is high and that in the upper layer is low. However, the true compactness of the lunar soil simulant at different depths can be obtained through stratified measurement, accounting for the influence of variations in compactness. Then, the static cone penetration test results can be associated with the real compactness of the lunar soil simulant at different depths, allowing a model of the relationship between cone tip resistance and lunar soil simulant compactness to be obtained and thus providing a reference for in situ test results of construction on the lunar surface.
2. Experimental Design
2.1. Test Material
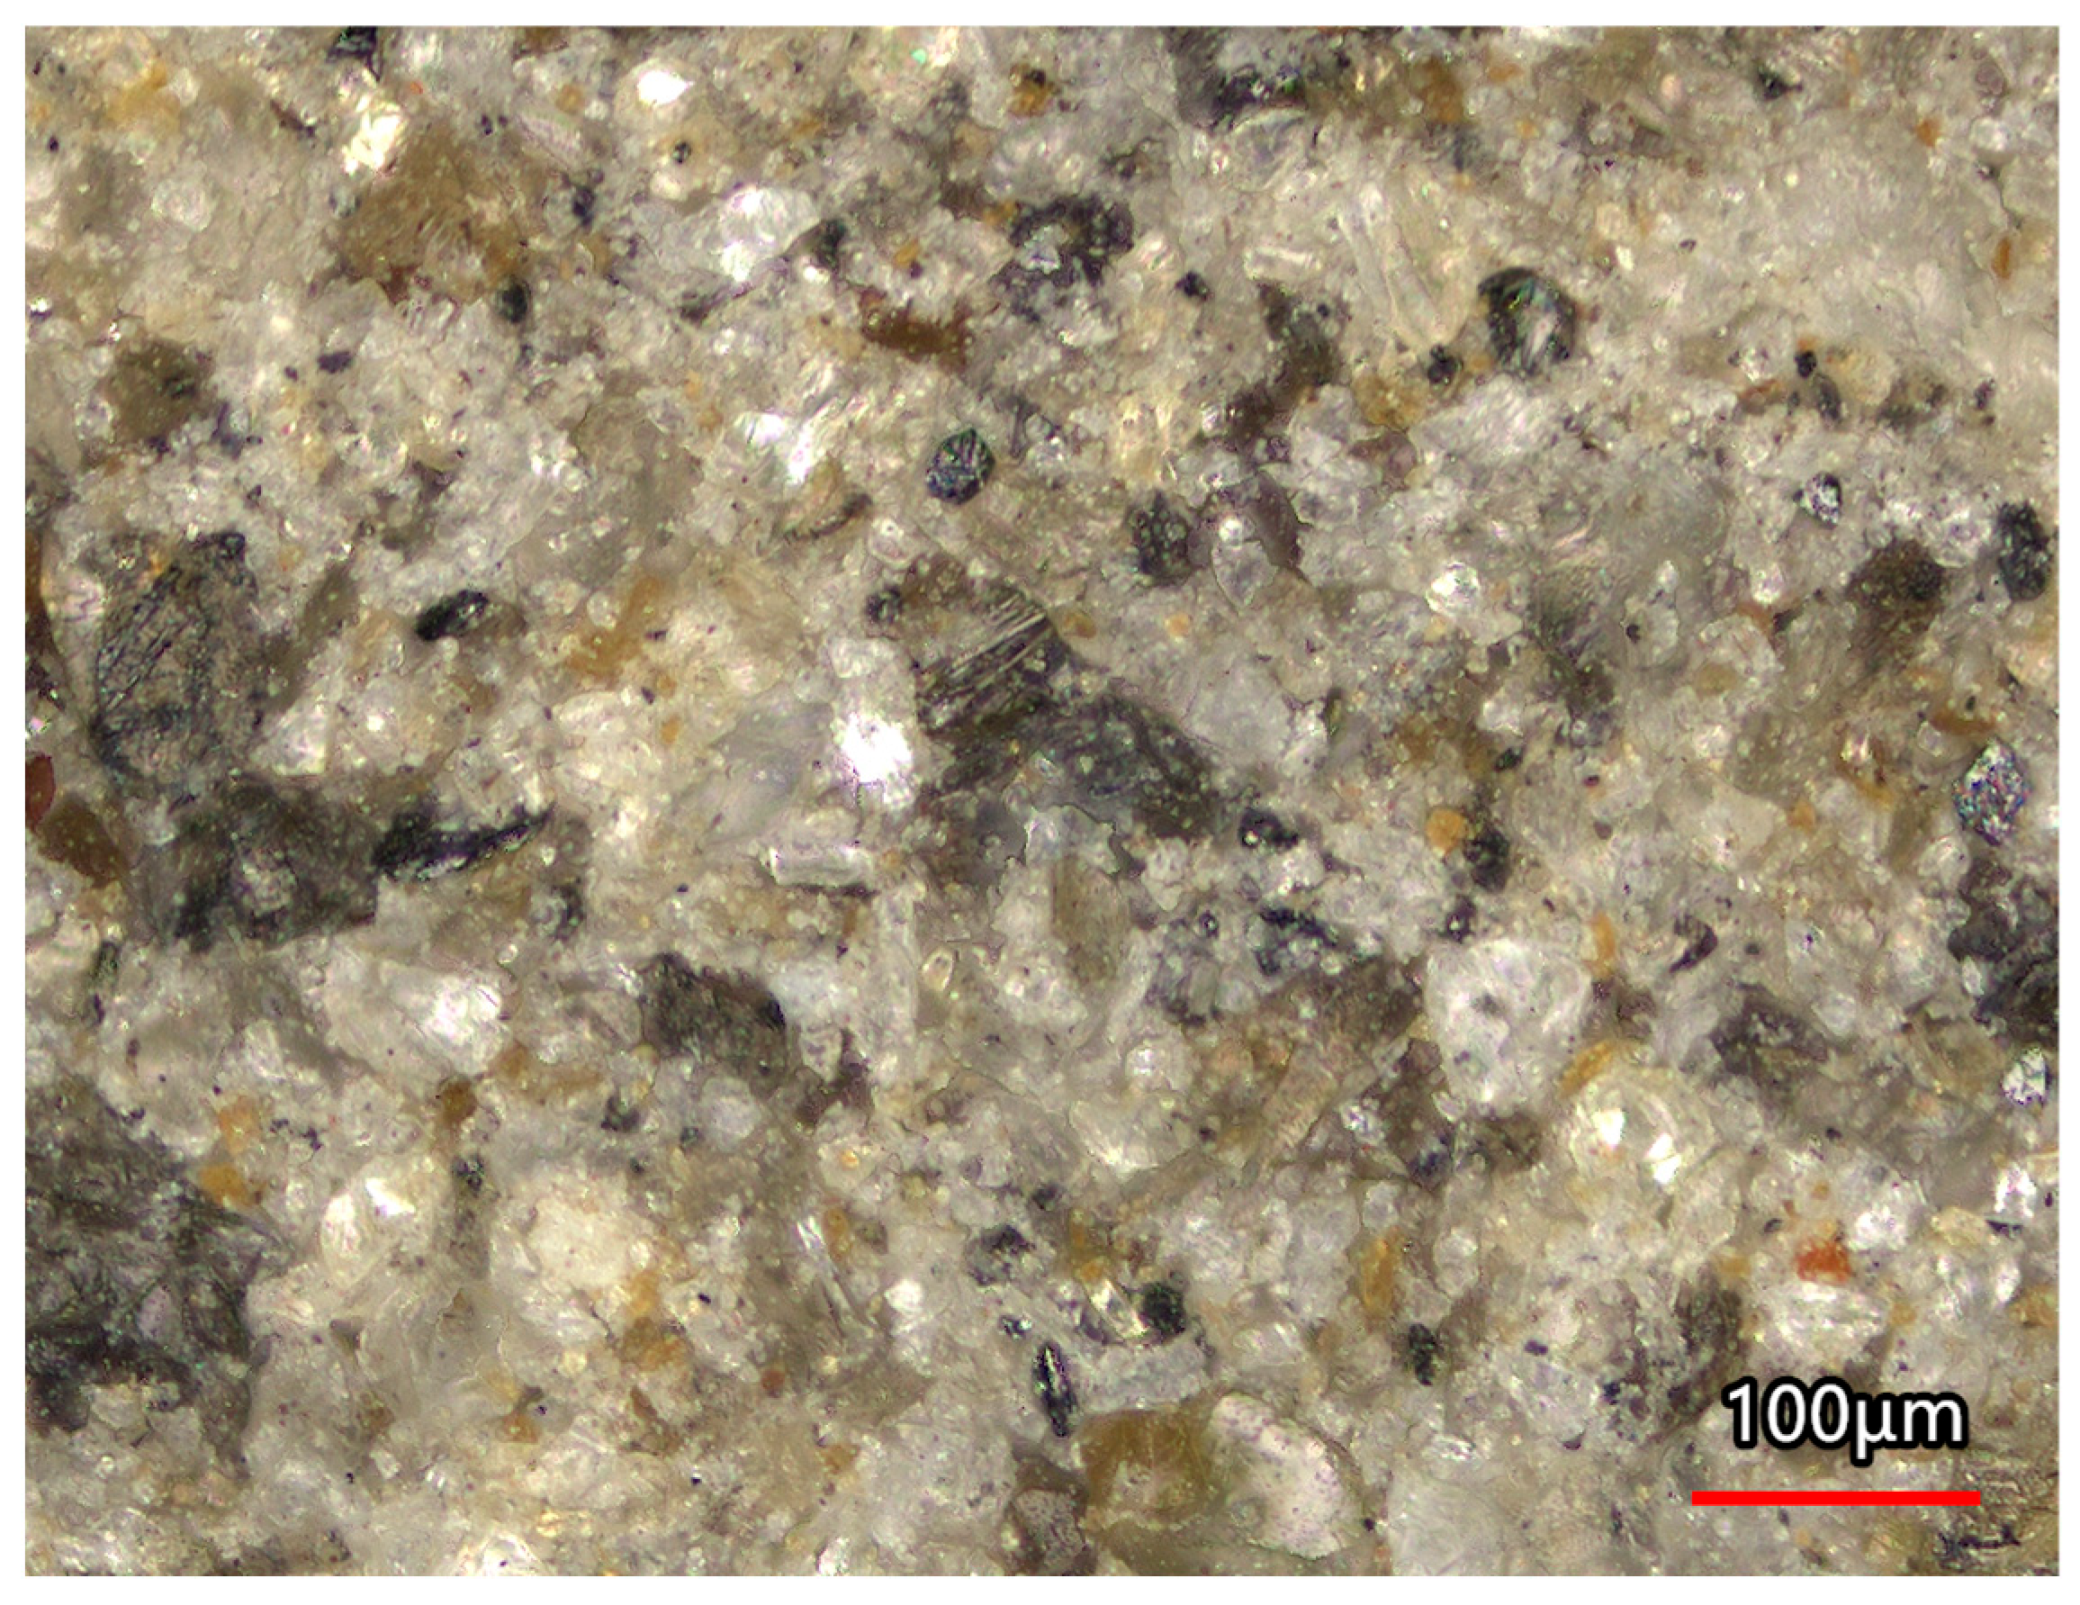
In this experiment, CUG-1A lunar soil simulant was used, which is mainly made of olivine basalt. Its primary mineral components are olivine, pyroxene, and plagioclase, with minor amounts of minerals such as magnetite and apatite also observable. It bears a relatively close resemblance to the real lunar soil in composition. After a series of crushing, screening, and drying processes, the lunar soil simulant met the required physical and mechanical properties. The mineral compositions of some real lunar soils and the CUG-1A lunar soil simulant are presented in Table 1. The particles of this lunar soil simulant are predominantly angular and sub-angular, with a small number of sub-rounded particles. The mineral composition of the CUG-1A lunar soil simulant is highly similar to that of real lunar soil. The microscopic diagram of CUG-1A lunar soil simulant is presented in Figure 1.

Table 1.
Mineral composition of some real lunar soils and CUG-1A lunar soil simulant [16].
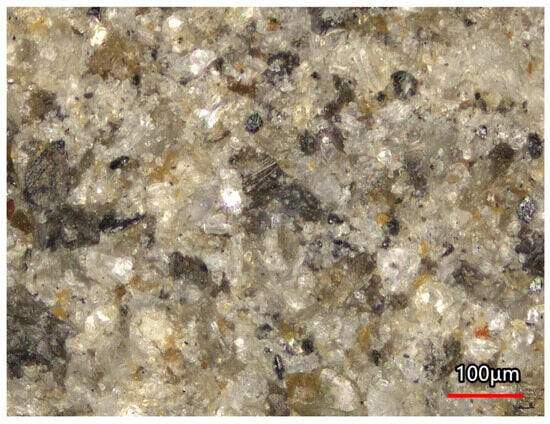
Figure 1.
Microscopic diagram of CUG-1A lunar soil simulant.
The key physical–mechanical parameters of the CUG-1A lunar soil simulant are as follows: the minimum dry density is 1.1 g/cm3, the maximum dry density is 2.0 g/cm3, the minimum porosity is 24.9%, the maximum porosity is 58.2%, the specific gravity of particles is 2.662, and the median particle diameter is 70 μm.
2.2. Test Device
2.2.1. Layered Compaction Barrel
In this experiment, a detachable layered compaction barrel was adopted to measure the compactness of the lunar soil simulant layer by layer. Based on Bolton’s [17] research on the boundary effects of model tests, the inner diameter of the designed circular layered compaction barrel was 40 cm. Each single-layer barrel had a height of 10 cm, and there were 6 layers in total, with a total height of 60 cm. Considering the bearing capacity of the layered compaction barrel, the body was fabricated by welding an 8 mm thick steel barrel and a 3 mm thick steel plate. Connection was achieved between every two layers of the barrel through the placement of metal flanges on the upper and lower edges, which were fixed with screws.
2.2.2. Static Cone Penetration Equipment
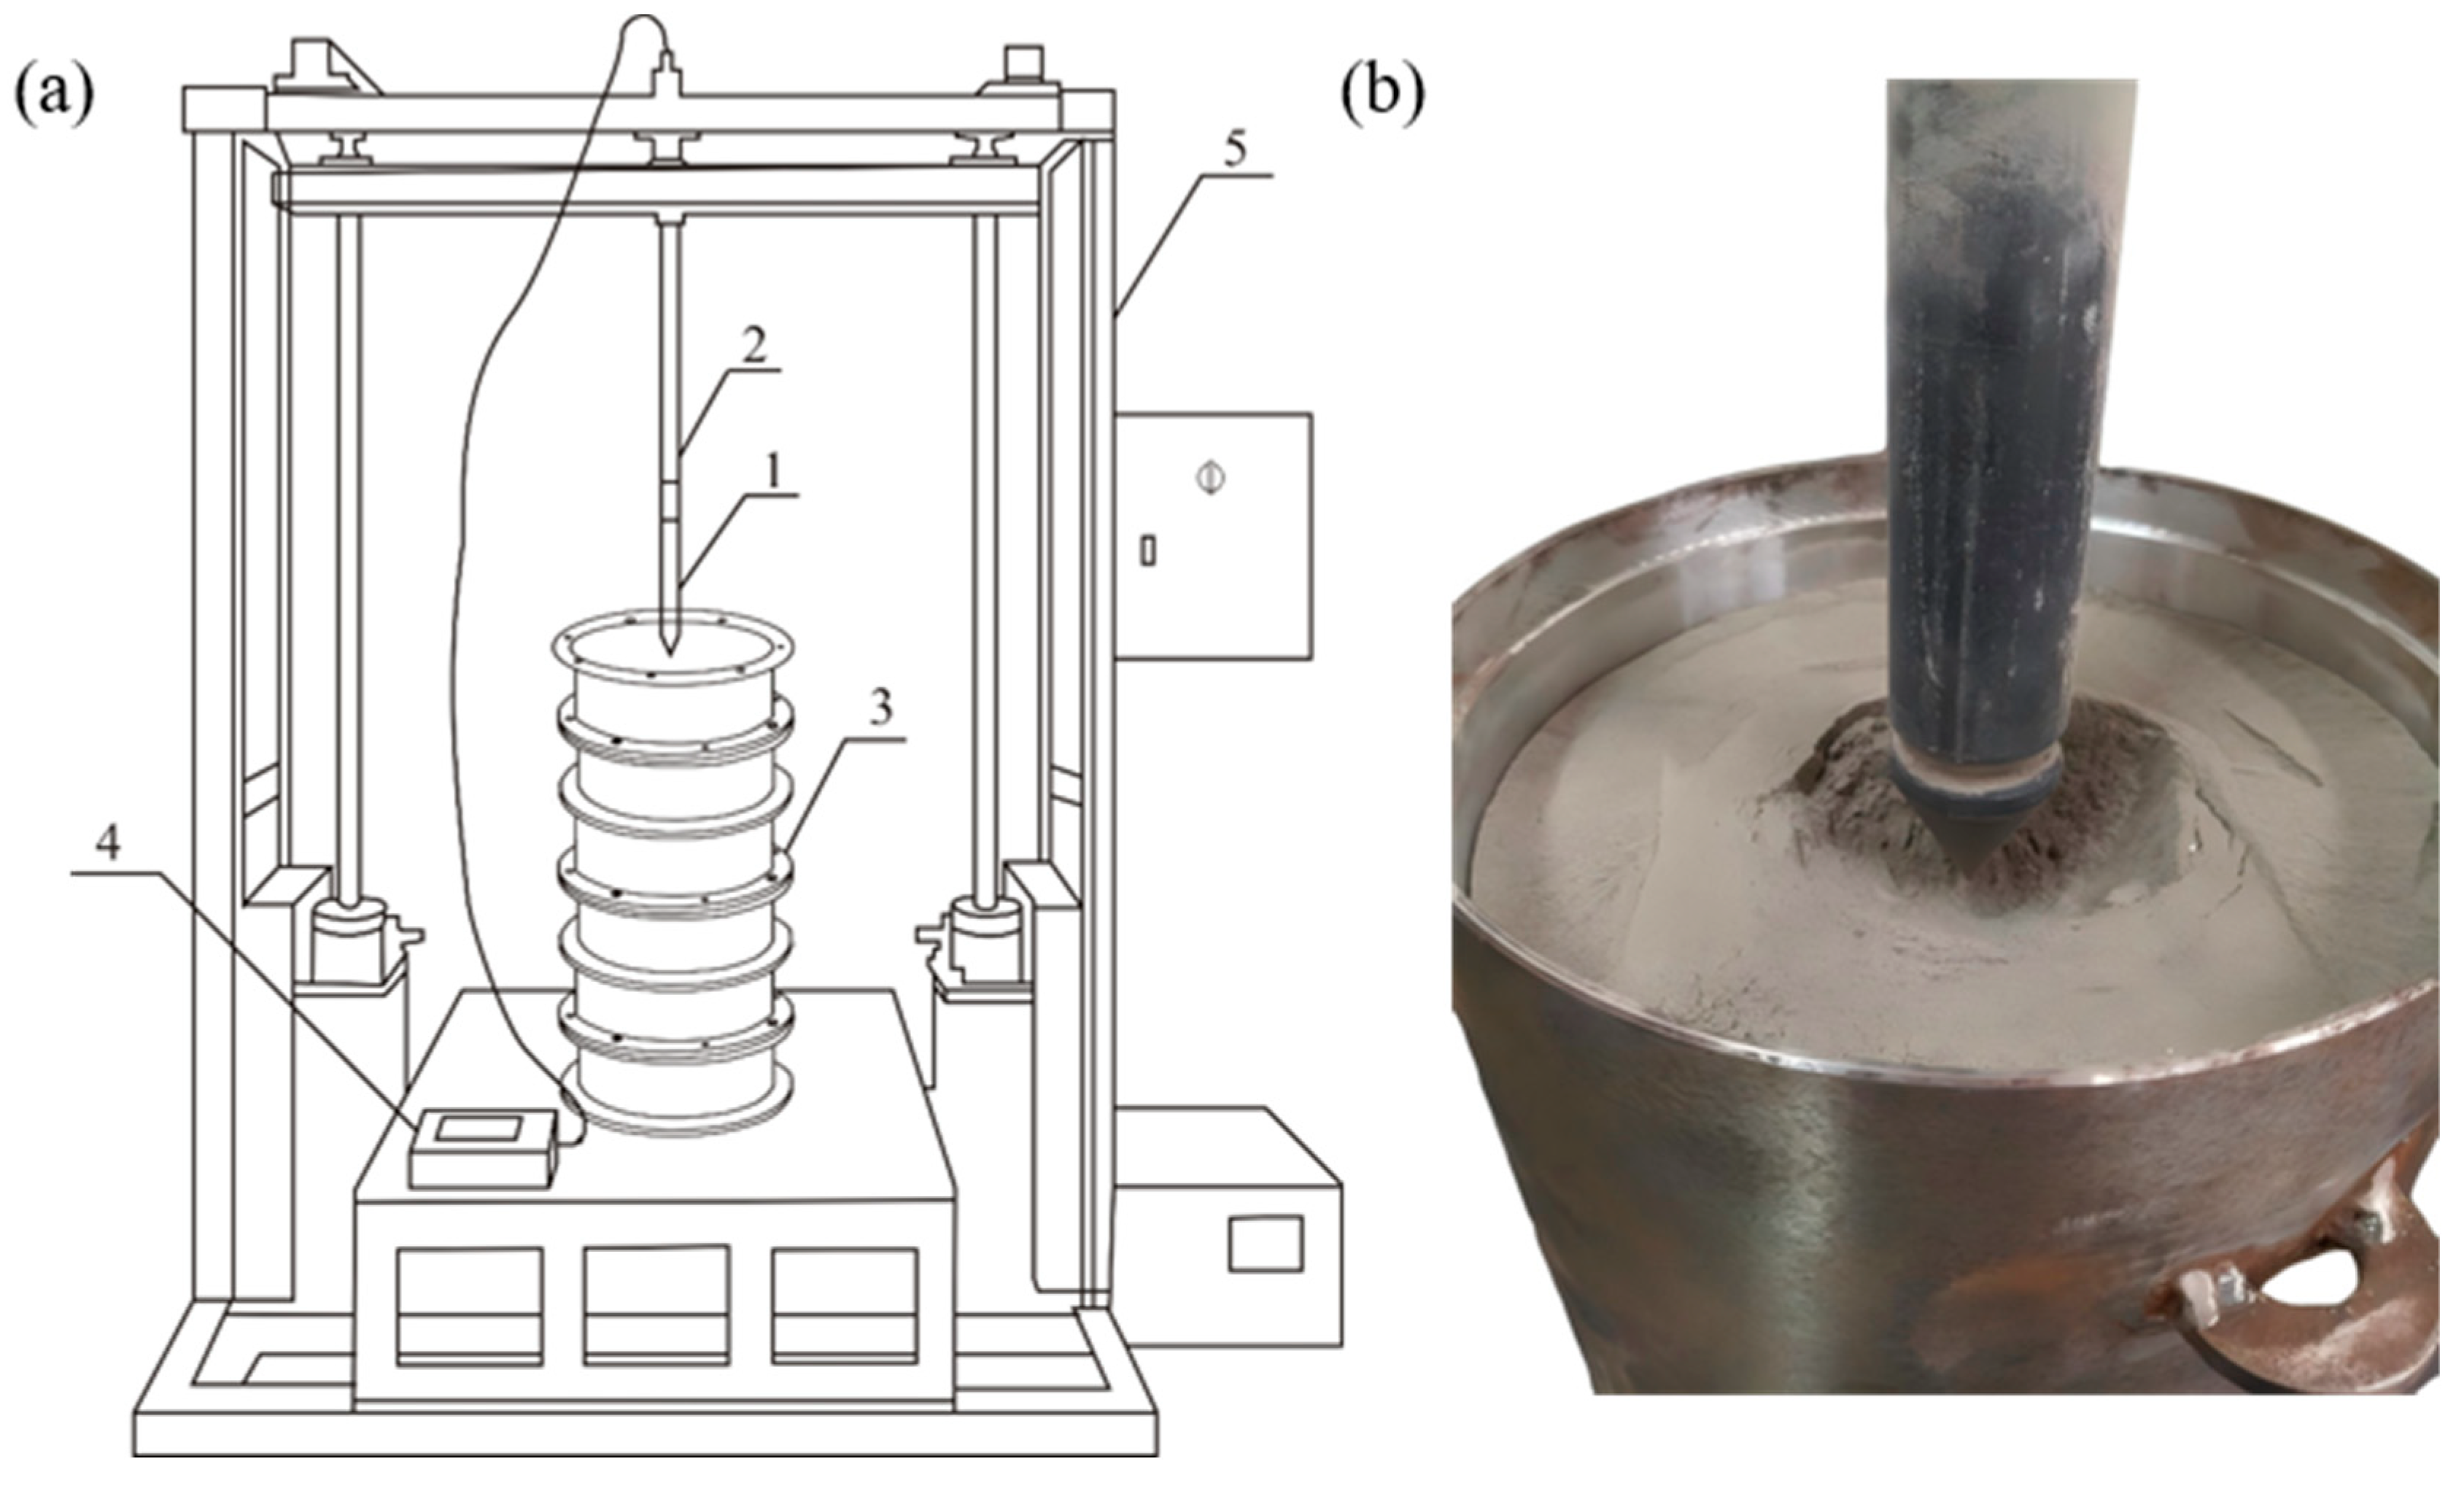
The static cone penetration equipment consists of a test bench, a loading control box, a penetration system, a measurement system, and other components. Taking into account the size effect of lunar soil simulant particles [18], a static cone penetration probe with a conical bottom cross-sectional area of 10 cm2 was selected. An electrical measurement method was adopted in the data acquisition system. Specifically, the sensors inside the static cone penetration probe convert the penetration resistance into electrical signals, which are transmitted via a cable to the computer. This computer then displays the penetration resistance values collected at different depths. A schematic diagram of the static cone penetration testing equipment and static cone penetration lunar soil simulant sample is shown in Figure 2.

Figure 2.
Schematic diagram of static cone penetration equipment: (a) equipment (1—probe; 2—rod; 3—layered compaction barrel; 4—data acquisition instrument; 5-equipment frame); (b) static cone penetration sample.
2.3. Test Scheme
The compacted lunar soil simulant in each barrel was measured layer by layer. The compaction and measurement methods were as follows: First, the layered compaction barrel was fixed with screws. Then, the mass of lunar soil simulant required for the experiment was weighed, and then it was slowly poured it into the barrel. The simulant was vibrated and compacted using vibration table until it filled the barrel completely. The vibration time and frequency were adjusted to obtain different levels of compactness for the simulant. The same vibration time and frequency were used to produce samples of the same compactness. Next, the screws were removed and the compactness of the lunar soil simulant in the barrel was measured layer by layer. Finally, lunar soil samples for the static cone penetration test were prepared again using the same method. The experiment was repeated many times, with the error of each two groups of experiments controlled to under 5%. The average value of the test results of the three groups was taken as the compactness of lunar soil simulant in the single-layered compaction barrel.
The minimum dry density of the CUG-1A lunar soil simulant was experimentally measured to be 1.1 g/cm3, and the maximum dry density was 2.0 g/cm3. The lower-density lunar soil simulant was relatively loose, and the static cone probe encountered lower resistance, which is not of practical significance. However, it is difficult to prepare lunar soil simulant samples with relatively high density. Therefore, four groups of lunar soil simulants with densities of 1.5 g/cm3, 1.6 g/cm3, 1.7 g/cm3, and 1.8 g/cm3 were selected for the experiment. The overall compactness levels of the corresponding lunar soil simulants were 58%, 68%, 78%, and 86%. The total volume of the layered compaction barrel was approximately 0.075 m3. Through calculation, the masses of lunar soil simulants required for the four groups of compacted barrels were determined to be approximately 113 kg, 121 kg, 128 kg, and 136 kg, respectively. The overall porosities corresponding to the four groups of compacted lunar soil simulant are shown in Table 2.
Table 2.
Average porosity of lunar soil simulant with different levels of compactness.
The prepared static cone penetration test barrels were moved directly beneath the probe to commence the experiment. The experimental procedure was as follows: First, the probe, rod, and computer were connected. Then, the probe was lowered until the cone tip just touched the lunar soil simulant, at which point the experiment began. During the experiment, data was collected once every 1 cm penetration of the probe. The experiment stopped when the total penetration depth reached 60 cm, and the experimental data was then saved. The test was repeated at least three times. The error of each two groups of tests was controlled to under 5%. The average value of the test results of the three groups was taken as the cone tip resistance value of the static cone penetration test.
3. Results and Analysis
3.1. The Compactness of Lunar Soil Simulant with Penetration Depth
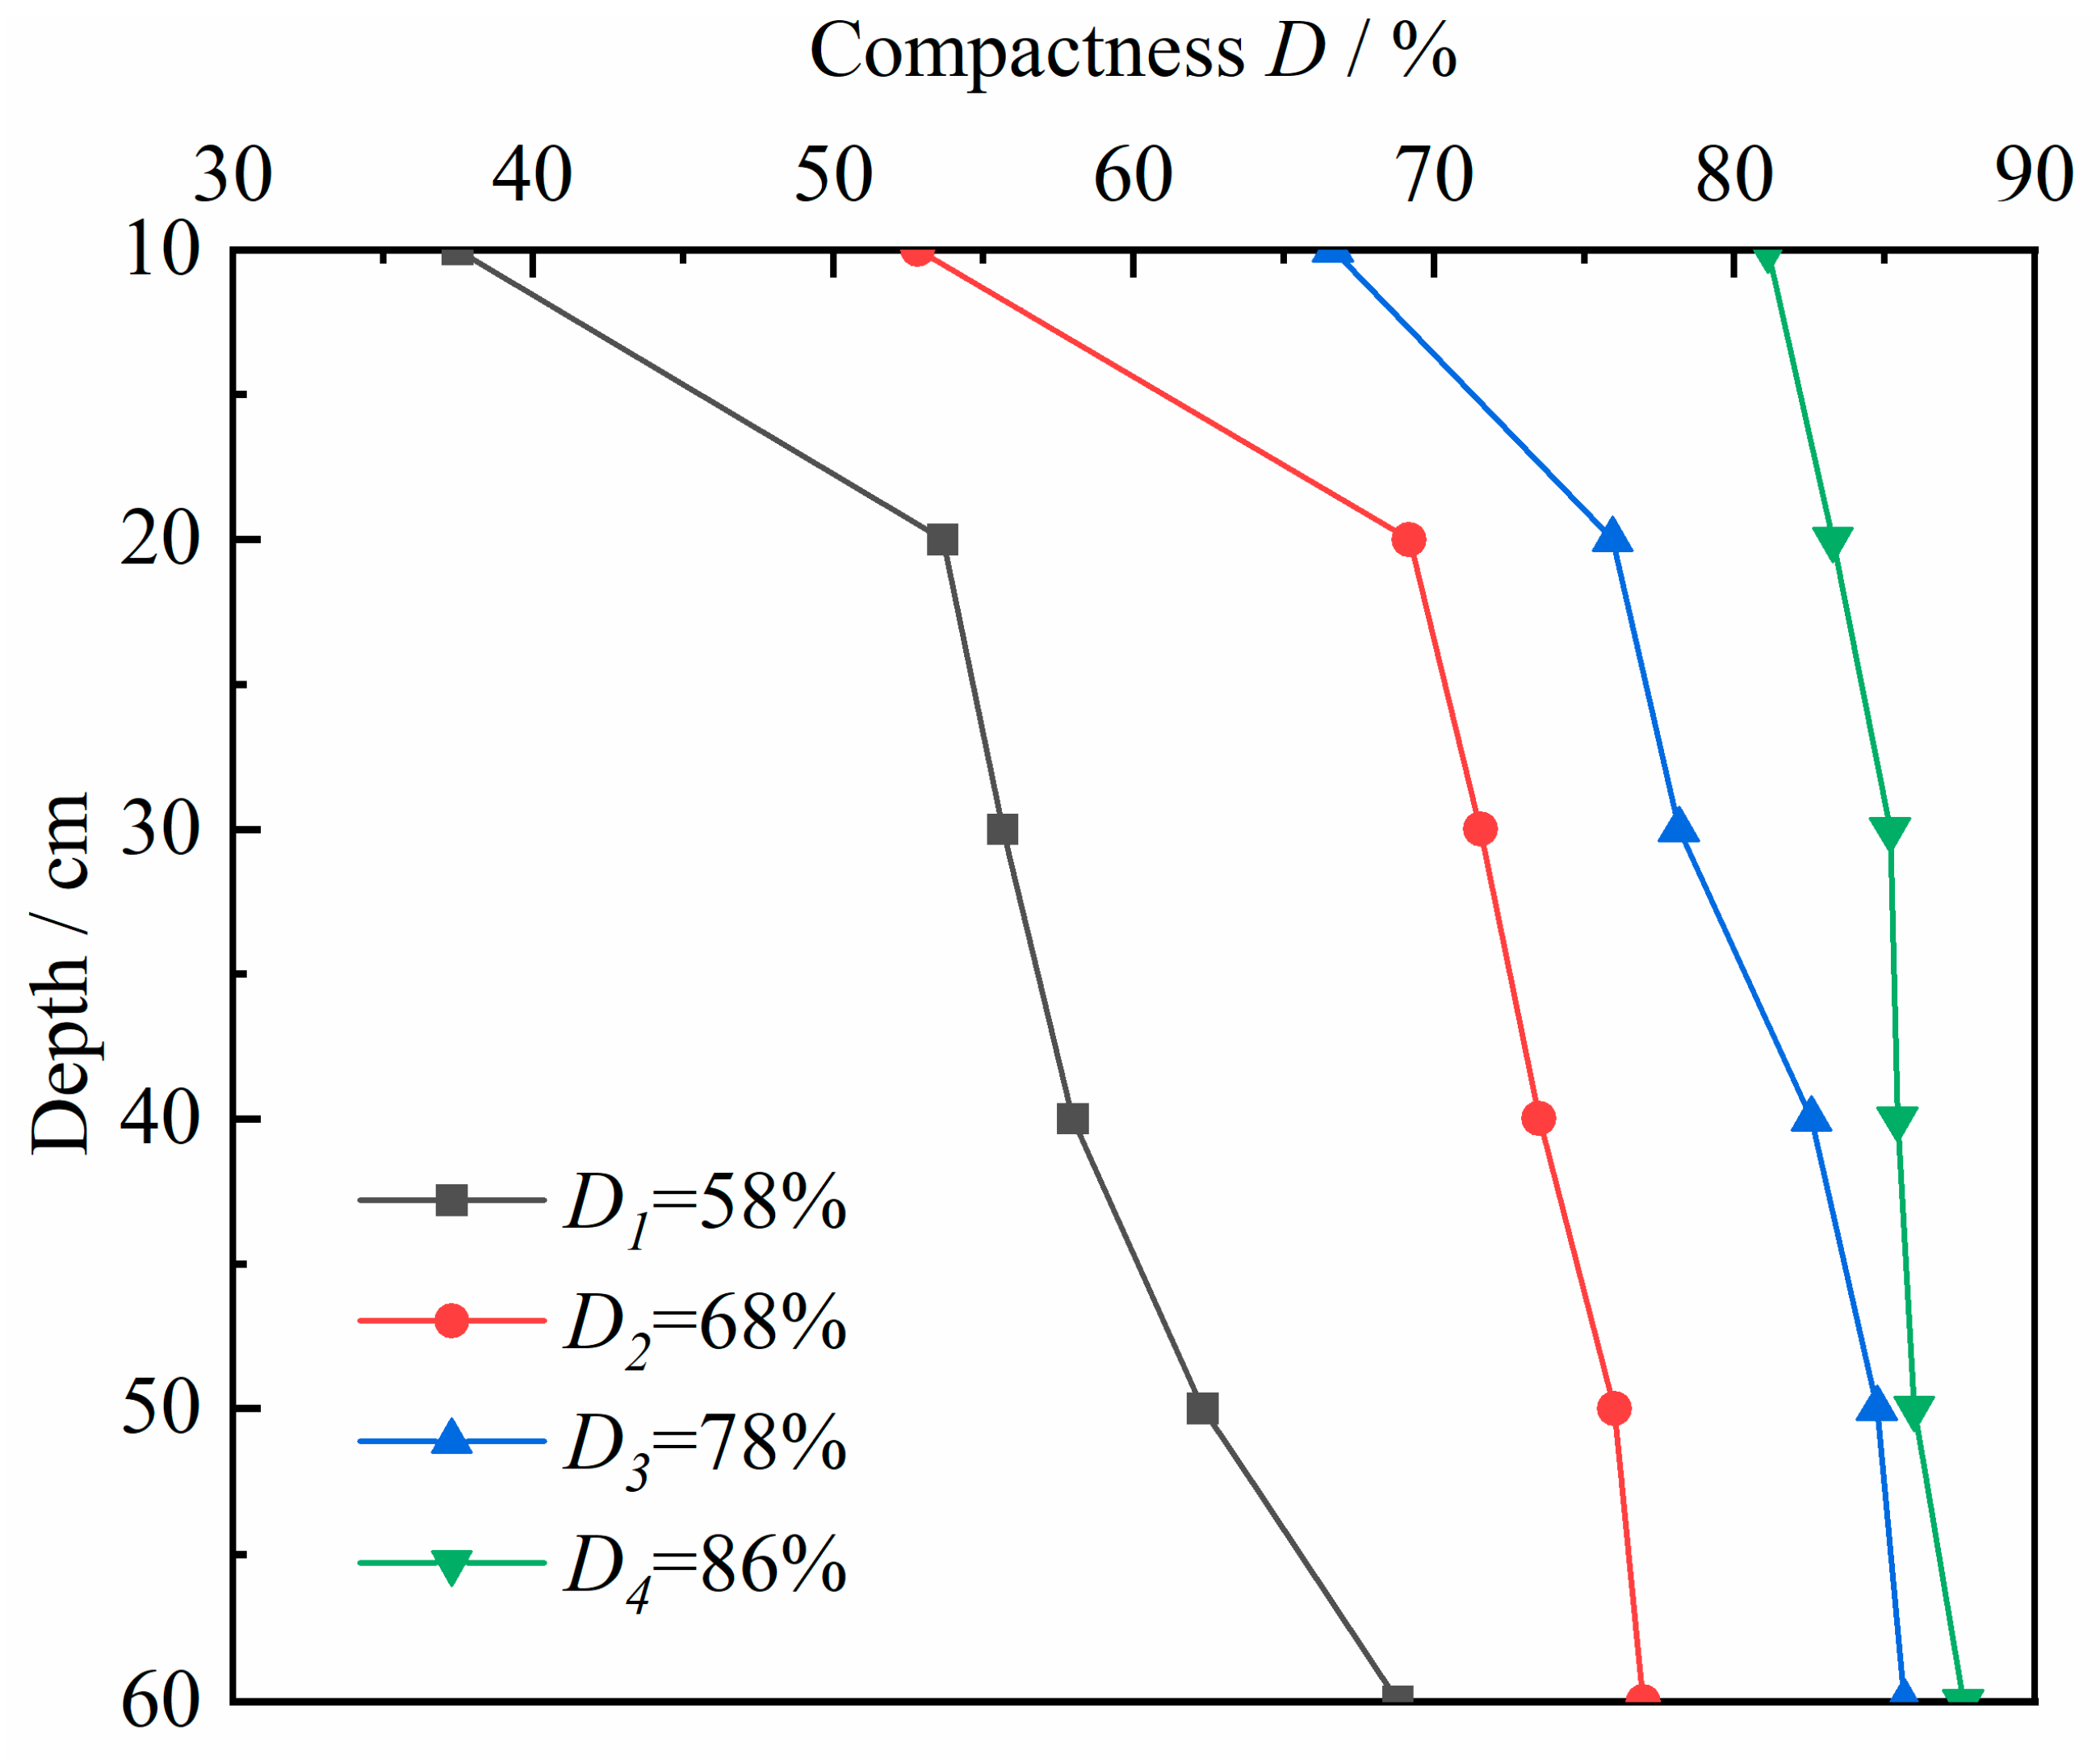
Figure 3 shows the variations in the single-layer lunar soil simulant under the four different overall compactness levels measured in the experiment. The four groups of lunar soil simulant were split into three categories: low, medium, and high compactness. The classification details are presented in Table 3.

Figure 3.
The variation curves of the compactness of the lunar soil simulant with depth under different overall compactness states.
Table 3.
Categories according to different compactness levels.
The lower the overall compactness, the greater the difference in compactness between the bottom and top barrels. That is to say, the looser the lunar soil simulant, the poorer the overall uniformity of the sample. Conversely, when the overall compactness is higher, there is a smaller difference in compactness between the bottom and top barrels. That is to say, the denser the lunar soil simulant, the better the overall uniformity of the sample.
The density of lunar soil is an important indicator that characterizes its physical and mechanical properties. Analyses of the Apollo lunar soil samples have shown that the density increases with the increase in sampling depth at the same sampling point. Based on the analyses of the existing lunar soil samples, two simplified functions, namely the hyperbolic function and the power function, are employed to describe the variation in the lunar soil density with depth [19].
Based on the analyses of the drilling samples from Apollo 11 and 12, the power function between the density of lunar soil and the depth is obtained as follows [19]:
where ρ represents the density of the lunar soil at a certain depth(g/cm3) and z represents the depth of the lunar soil at that point (cm).
When the depth is 0, its density is also 0, which is inconsistent with the actual density of the lunar soil at the surface layer. At depths exceeding 50 cm, the density increases infinitely, which does not conform to the actual situation where the density of the lunar soil tends to be stable. Therefore, the power function that describes the relationship between the density of the lunar soil and its depth is not applicable to either the surface layer or the deep layer. Instead, it is only suitable for quickly estimating the density of the shallow lunar soil.
Based on the analysis of the drilling samples from the Apollo 15, 16, and 17 missions, the hyperbolic relationship between the density of the lunar soil and its depth is obtained as follows [19]:
When the depth is 0, its density is 1.3 g/cm3, which falls within the density range of the real surface layer lunar soil. As the depth increases, its density approaches 1.92 g/cm3, consistent with the density of lunar soil at depths greater than 60 cm as studied by Mitchell et al. [20].
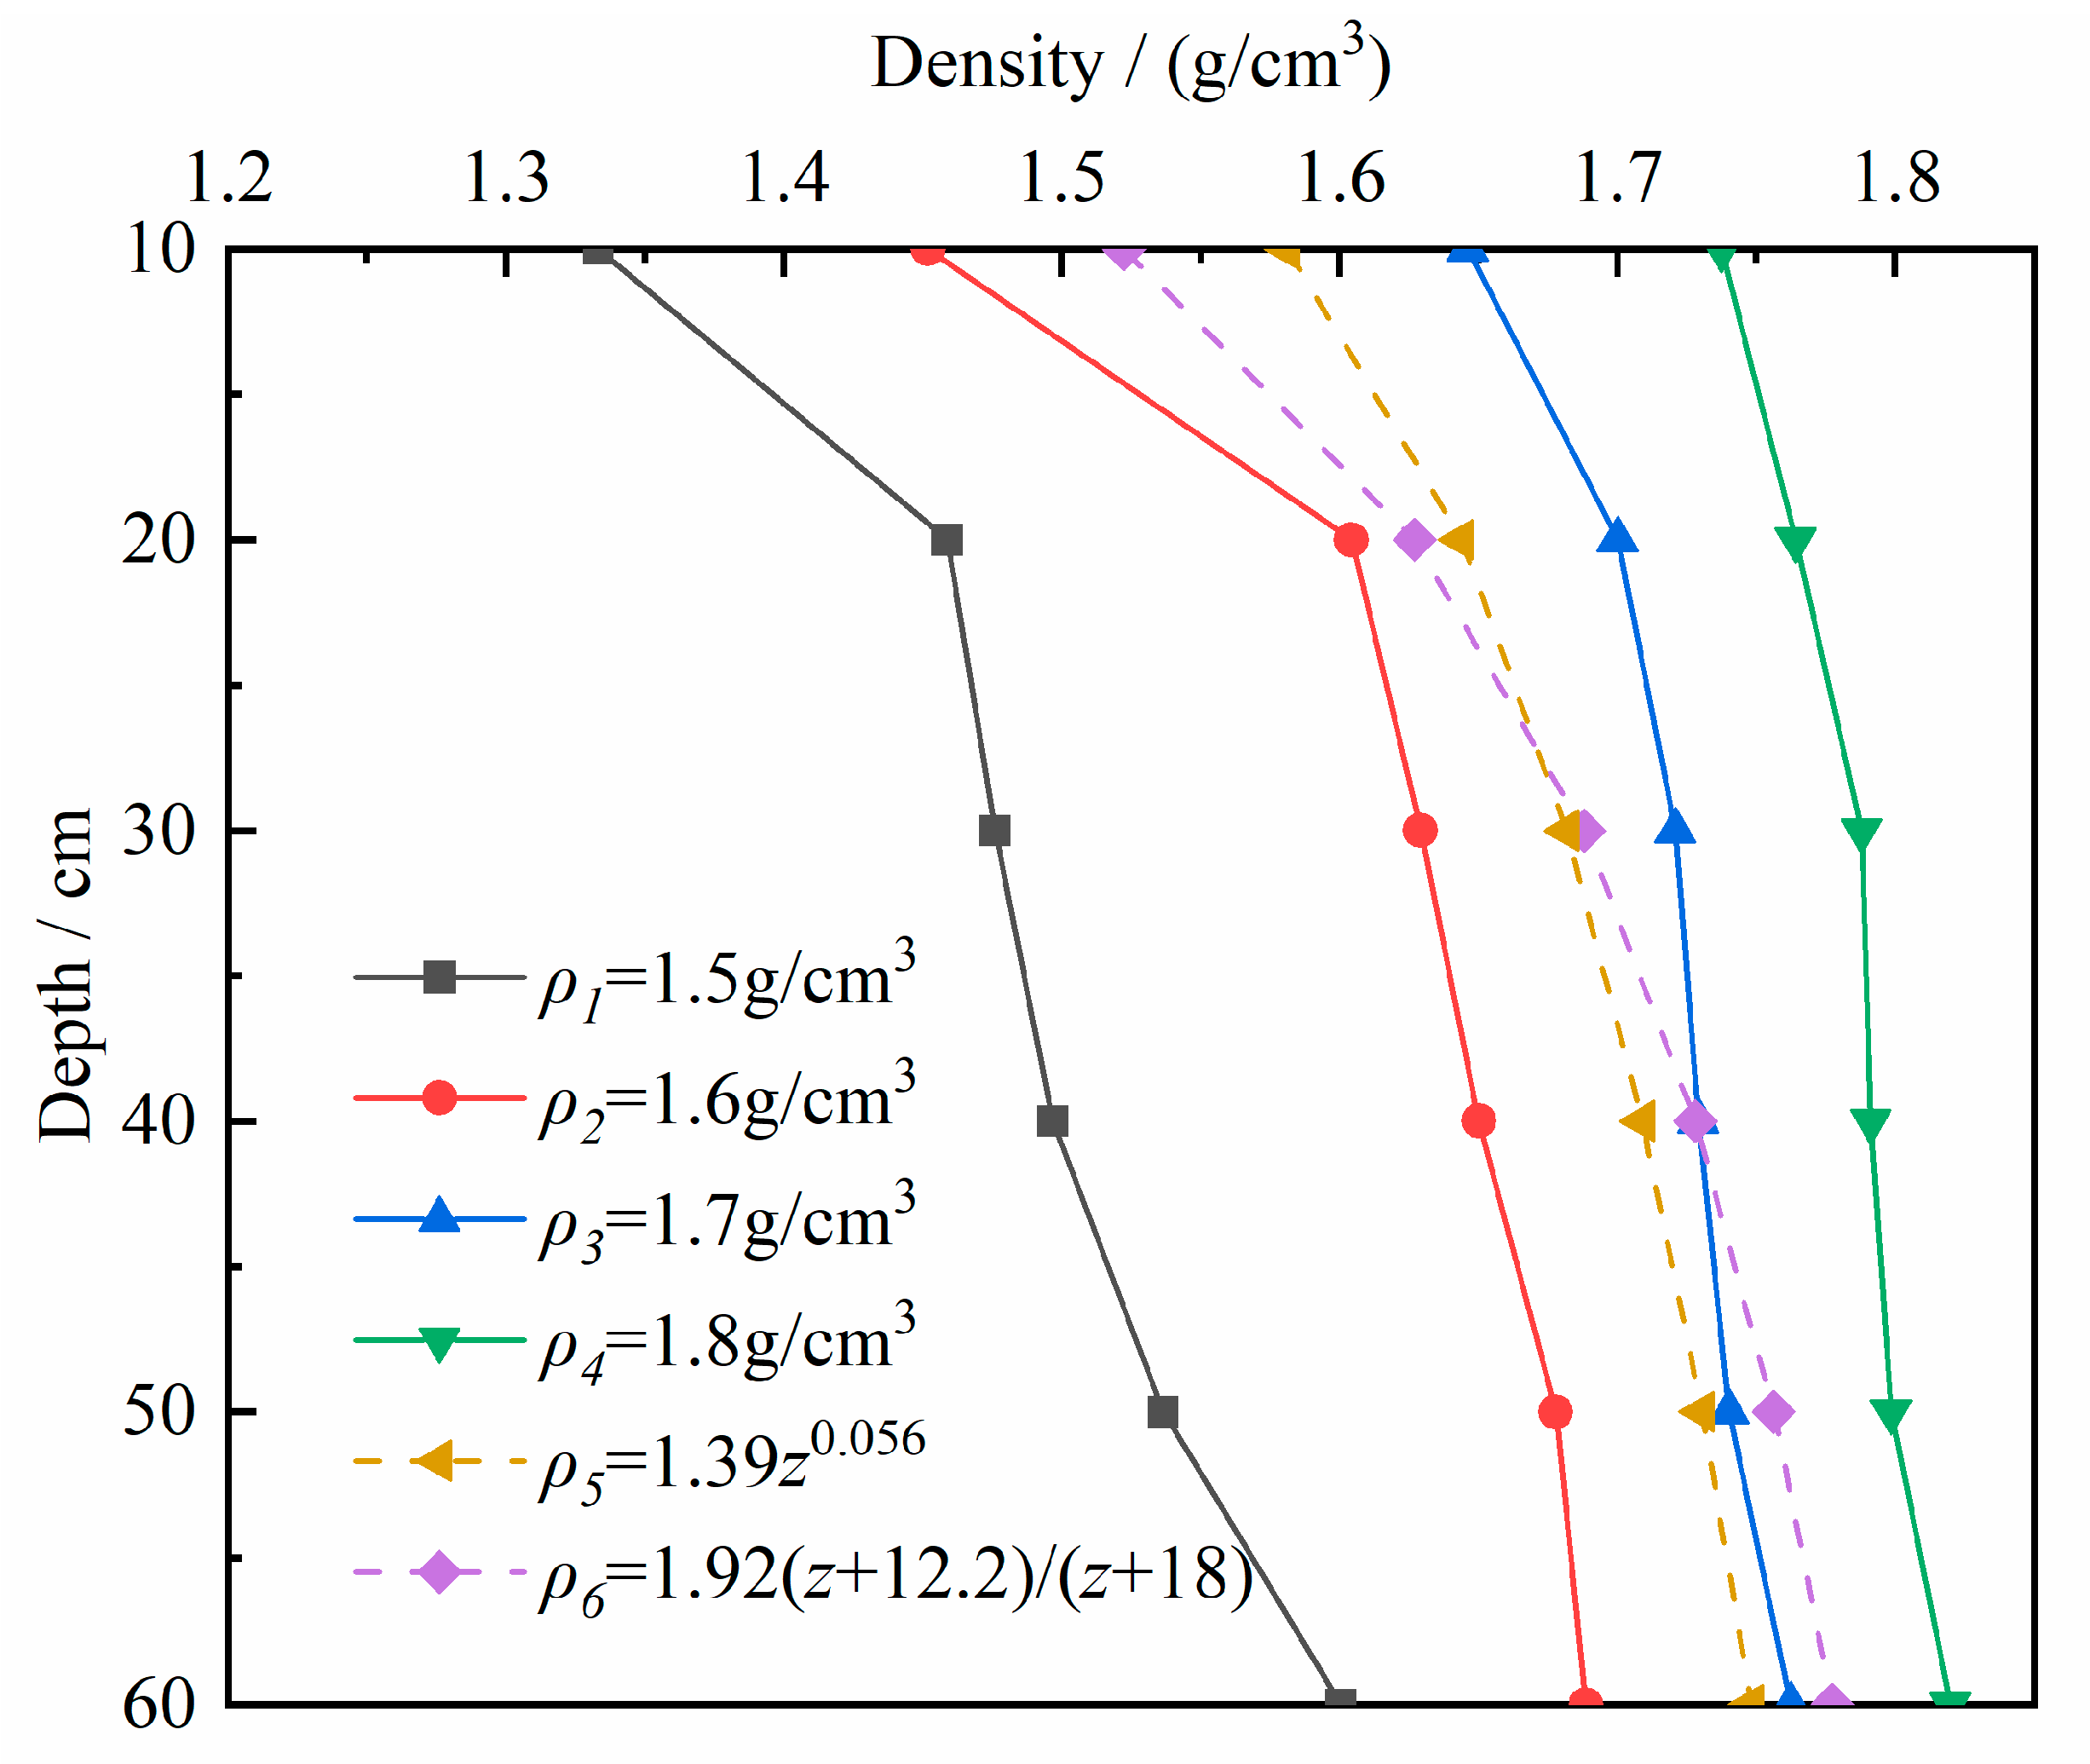
Compactness is also an important indicator in characterizing the physical and mechanical properties of lunar soil. Compactness can be evaluated based on porosity. For a lunar soil simulant with the same grading, there is a conversion relationship between porosity and density. Conversions between compactness and density can be implemented under this condition [21]. Curves showing the variation in the density of simulated and real lunar soil with depth based on the compactness values are shown in Figure 4. As the depth increases, the densities of both the lunar soil simulant and real lunar soil increase. The growth rate of the density following a hyperbolic relationship is greater than that following a power function, and the density span of the lunar soil described by the hyperbolic relationship is larger than that described by the power function.

Figure 4.
The variation curves of the density of the real lunar soil and the lunar soil simulant under different overall densities with the depth.
At a depth of less than 40 cm, the two curves representing the variation in real lunar soil density lie between those of the lunar soil simulant. They show an overall density ranging from 1.6 g/cm3 to 1.8 g/cm3, corresponding to an overall compactness from 68% to 86%. At depths exceeding 40 cm, the two curves of the real lunar soil density are on either side of that of the lunar soil simulant. They show an overall density of 1.7 g/cm3, corresponding to an overall compactness of 78%, which falls within the medium compactness range.
The density variation obtained using the hyperbolic relationship is close to the experimental results of the lunar soil simulant with an overall density of 1.6 g/cm3, and the density variation obtained using the power function is close to the experimental results of the lunar soil simulant with an overall density of 1.7 g/cm3. This demonstrates that both functions can be used to estimate the density of shallow lunar soil, and thus the compactness of shallow lunar soil can also be estimated through the relationship between density and compactness.
By comparing the density change rates of the four groups of lunar soil simulant, it is found that as the overall density increases, the rate of change in density with depth shows a gradually decreasing trend, and the difference between the maximum and minimum values of the density of each group of the lunar soil simulant gradually decreases. This indicates that there is less change in the density of the lunar soil simulant with a larger overall density, and the sample is more uniform.
The variation in the density of the lunar soil simulant with depth is highly consistent with that of real lunar soil, and the density values are also similar. The density of the lunar soil simulant at different depths can be preliminarily predicted. The variation curve of the real lunar soil density with depth verifies the selection of the CUG-1A lunar soil simulant and the validity of the experimental results.
3.2. Variation in Cone Tip Resistance with Penetration Depth
Figure 5 shows the variation in cone tip resistance with penetration depth under different overall compactness levels. For the four groups of lunar soil simulant with different compactness levels, the cone tip resistance generally shows an increasing trend as the penetration depth increases.
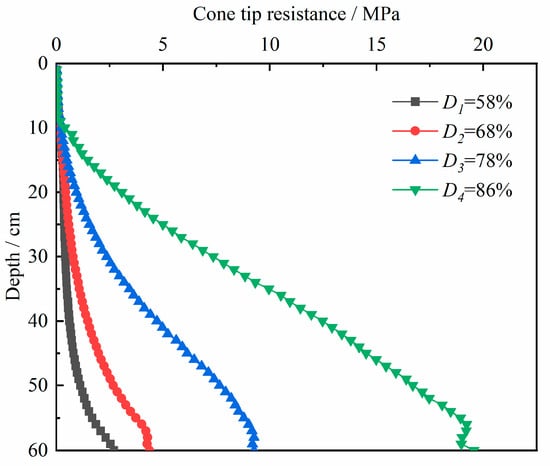
Figure 5.
The variation curves of the cone tip resistance with the penetration depth under different overall compactness.
For the two categories of low-compactness lunar soil simulant, the cone tip resistance increases slowly with the penetration depth at depths under 20 cm. At 20 cm, the cone tip resistance of the lunar soil simulant with an overall compactness of 58% is 0.34 MPa, and that of the lunar soil simulant with an overall compactness of 68% is 0.44 MPa. When the penetration depth is greater than 20 cm, the cone tip resistance of both categories of lunar soil simulant grows significantly, and the growth rate of the cone tip resistance gradually increases at an increasing penetration depth. At 60 cm, the cone tip resistance of the lunar soil simulant with an overall compactness of 58% is 2.70 MPa, and that of the lunar soil simulant with an overall compactness of 68% is 4.36 MPa.
For the medium-compactness lunar soil simulant, the cone tip resistance of the lunar soil simulant increases slowly with the penetration depth at depths under 10 cm. At 10 cm, the cone tip resistance is only 0.21 MPa. When the penetration depth is greater than 10 cm, the cone tip resistance of the lunar soil simulant grows significantly. At 60 cm, the cone tip resistance of the lunar soil simulant is 9.26 MPa.
For the high-compactness lunar soil simulant, the cone tip resistance of the lunar soil simulant increases slowly with the penetration depth at depths under 8 cm. At 8 cm, the cone tip resistance of the lunar soil simulant with an overall compactness of 86% is 0.06 MPa. When the penetration depth is greater than 8 cm, the cone tip resistance of the lunar soil simulant grows rapidly as the penetration depth increases. The cone tip resistance of the lunar soil simulant with an overall compactness of 86% first grows exponentially and then linearly, reaching a maximum value of 19.56 MPa at 60 cm.
As the penetration depth increases, the cone tip resistance of the lunar soil simulant continuously increases. At the same penetration depth, the cone tip resistance of the lunar soil simulant increases with the increase in compactness.
3.3. Variation in Normalized Cone Tip Resistance with Penetration Depth
The overlying pressure on the lunar soil simulant varies at different depths, which has a certain impact on the experimental results. Therefore, cone tip resistance is normalized to eliminate the influence of the overlying pressure and more accurately analyze the variation in cone tip resistance with penetration depth. Bolton et al. [22] proposed the following normalization formula for the cone tip resistance and penetration depth:
where represents the normalized cone tip resistance; denotes the cone tip resistance; is the unit weight of the lunar soil, varying according to the compactness; is the penetration depth of the probe; is the total overlying stress of the lunar soil at this depth; and is the effective stress. In this study, the water content of the lunar soil simulant is less than 1%, allowing the assumption that .
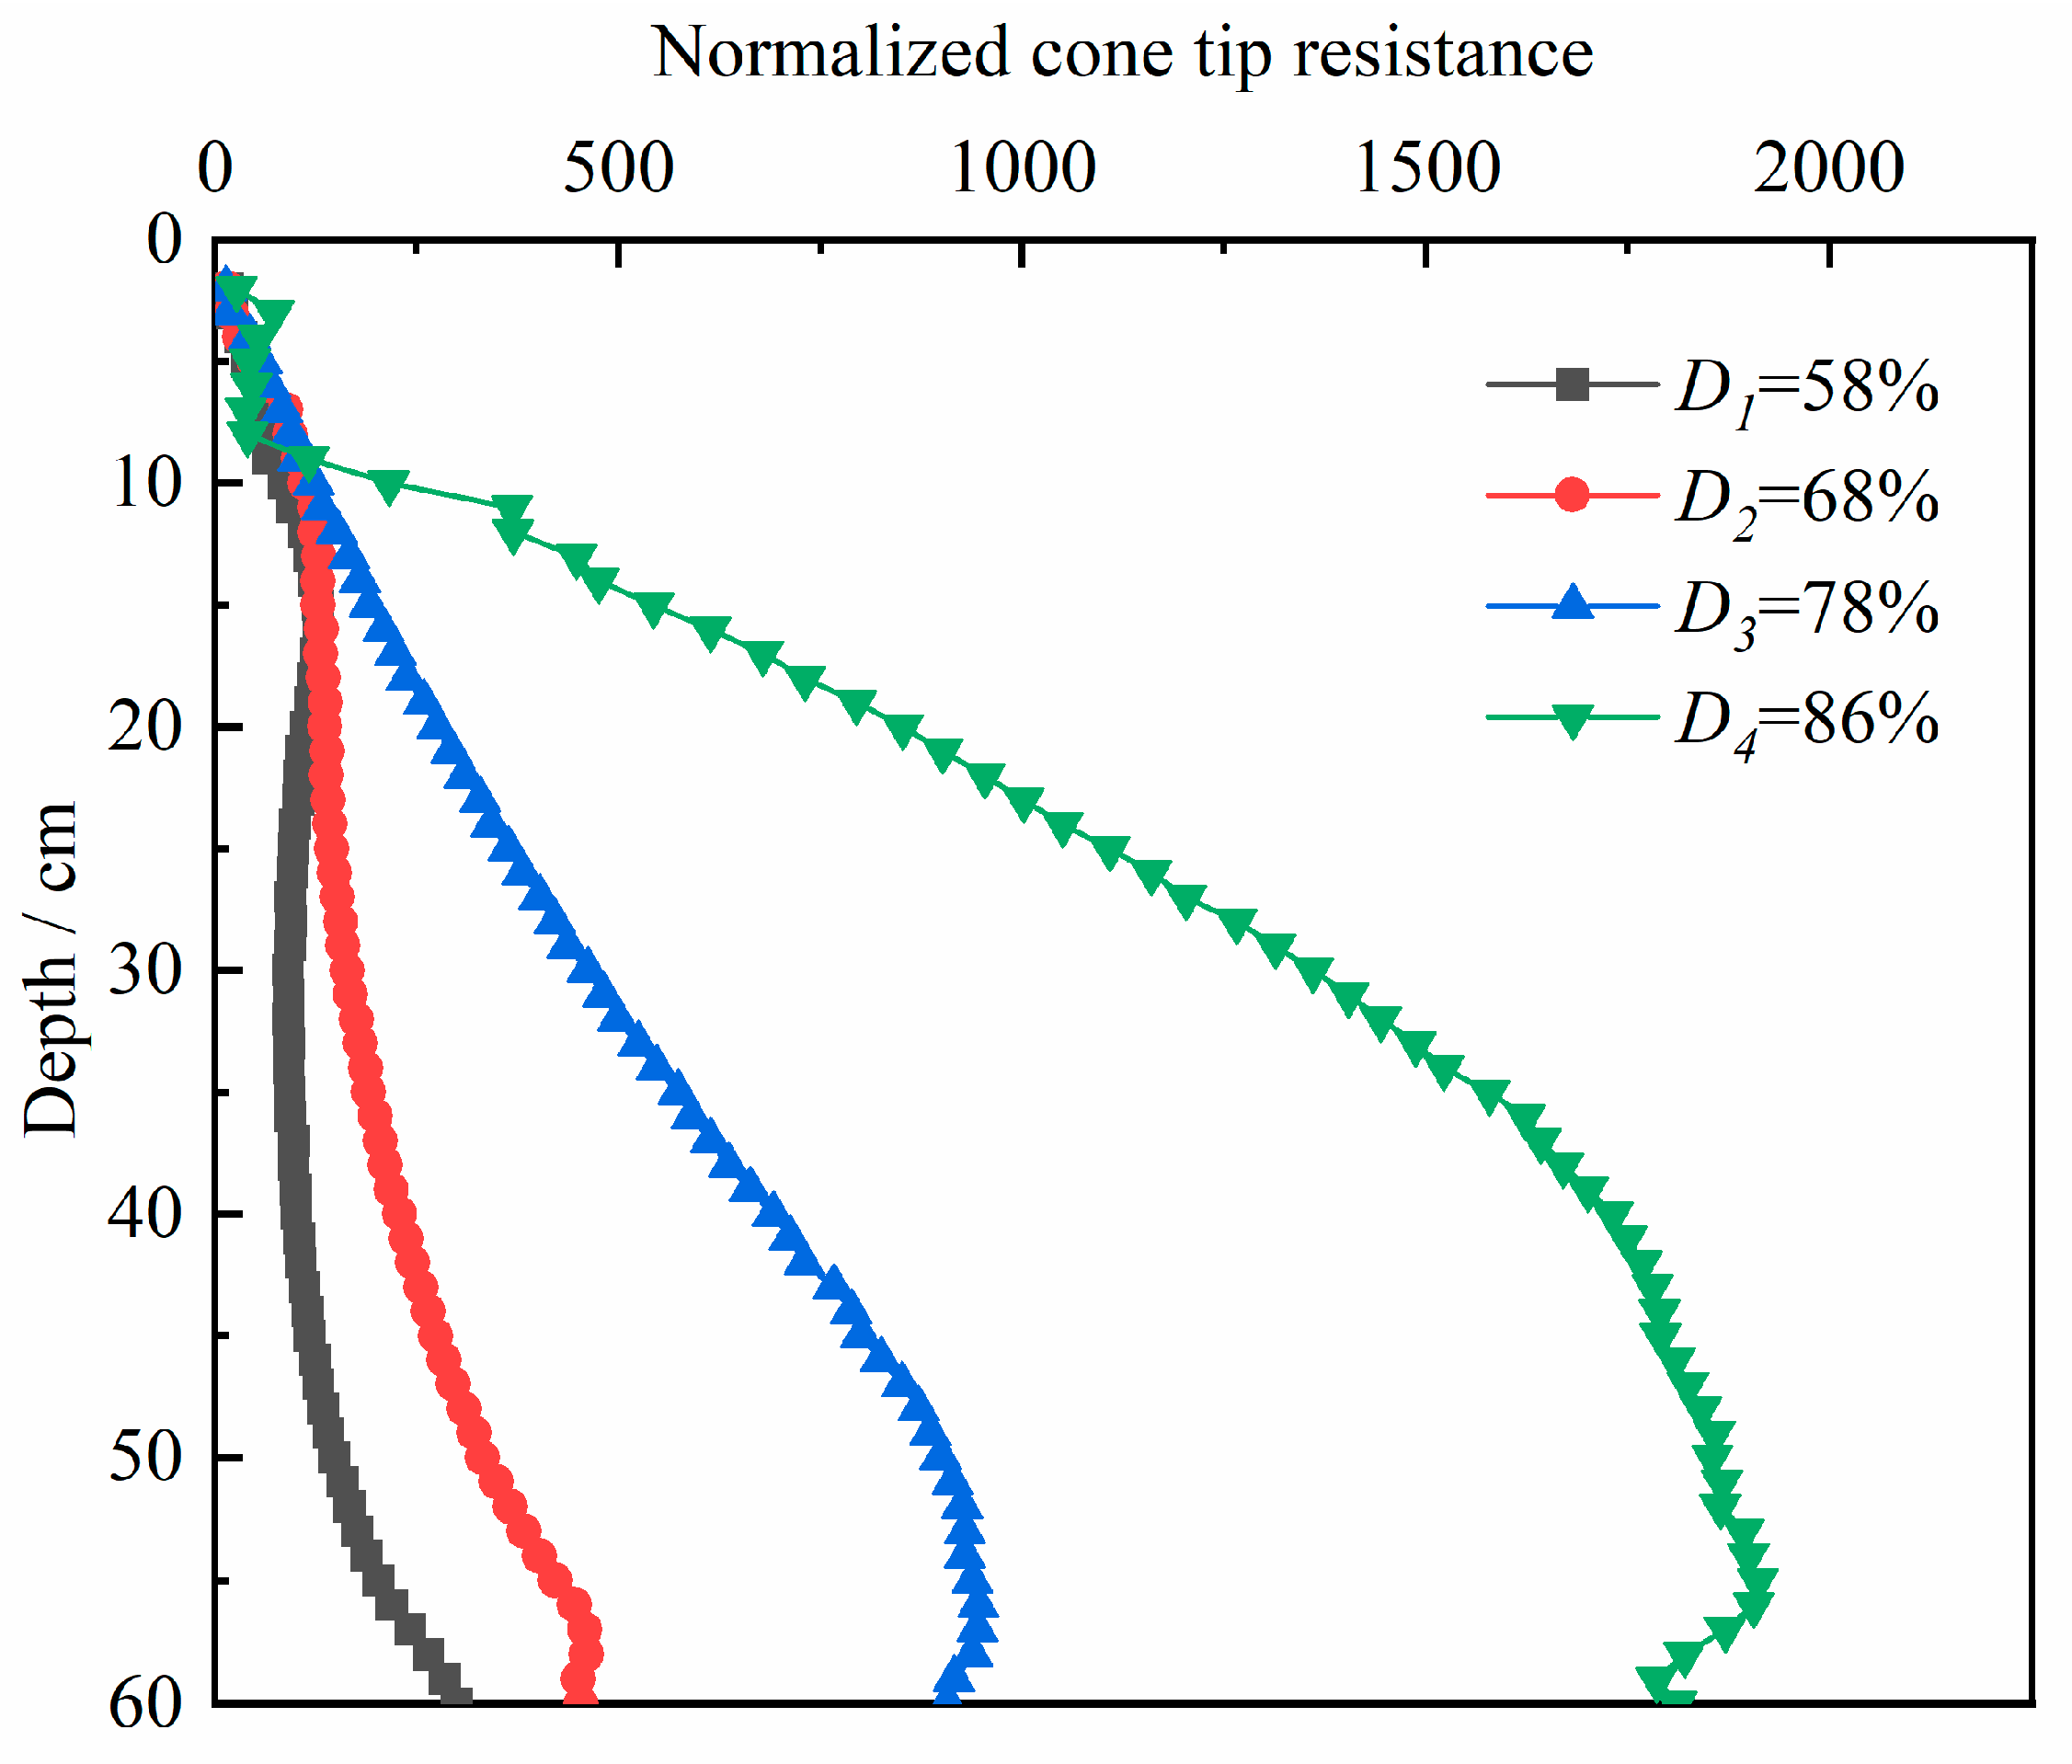
The curves of the normalized cone tip resistance with the penetration depth after normalization are shown in Figure 6. For the lunar soil simulant with an overall compactness of 58%, the normalized cone tip resistance first increases, then decreases, and then increases again as the penetration depth increases, showing an overall growth trend. For the other three groups, the normalized cone tip resistance first increases and then decreases as the penetration depth increases.
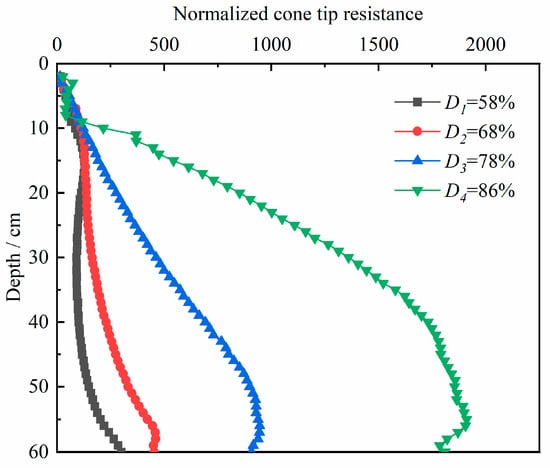
Figure 6.
The variation curve of the normalized cone tip resistance with the penetration depth.
As the overall compactness increases, the growth rate of the normalized cone tip resistance of the lunar soil simulant with the penetration depth also gradually increases. The normalized cone tip resistances of the four groups of the lunar soil simulant reach their maximum values at penetration depths of 60 cm, 58 cm, 56 cm, and 55 cm, in sequence. The penetration depth at which the normalized cone tip resistance of the lunar soil simulant reaches its maximum value becomes shallower as the overall compactness increases. Before the normalized cone tip resistances of the four groups of lunar soil simulant reach their maximum values, the value of the normalized cone tip resistance increases with compactness at the same penetration depth.
The maximum values of the cone tip resistance and the normalized cone tip resistance for the lunar soil simulant with different compactness levels are shown in Table 4. As the overall compactness increases, the maximum value of both the cone tip resistance and the normalized cone tip resistance gradually increases. By comparing the curves of cone tip resistance and normalized cone tip resistance under the same compactness condition (overall compactness levels of 68%, 78%, and 86%), it is found that the cone tip resistance reaches its maximum value when the penetration depth is 60 cm, but it is impossible to determine its change trend at depths greater than 60 cm. However, the curve of normalized cone tip resistance with penetration depth shows a clear peak at depths of less than 60 cm. Therefore, this peak value can be used as the characteristic value of the normalized cone tip resistance for this compactness.
Table 4.
Maximum values of the cone tip resistance and the normalized cone tip resistance of the lunar soil simulant under different compactness conditions.
3.4. Model of the Relationship Between Cone Tip Resistance and Compactness
The curve depicting the variation in the cone tip resistance with penetration depth is divided into segments with intervals of 10 cm, which is the height of the single-layer barrel. Thus, each segment corresponds to each layer. The average cone tip resistance of each layer for each group of lunar soil simulant is calculated and presented in Table 5. The average compactness of each layer was already measured for the single-layer barrel, and is presented in Table 5 and Figure 3. Curves showing the variation in the cone tip resistance with different compactness levels of the lunar soil simulant are obtained by correlating the compactness with the average resistance in all layers, as shown in Figure 7.
Table 5.
The average cone tip resistance and the compactness of the lunar soil simulants for each layer.

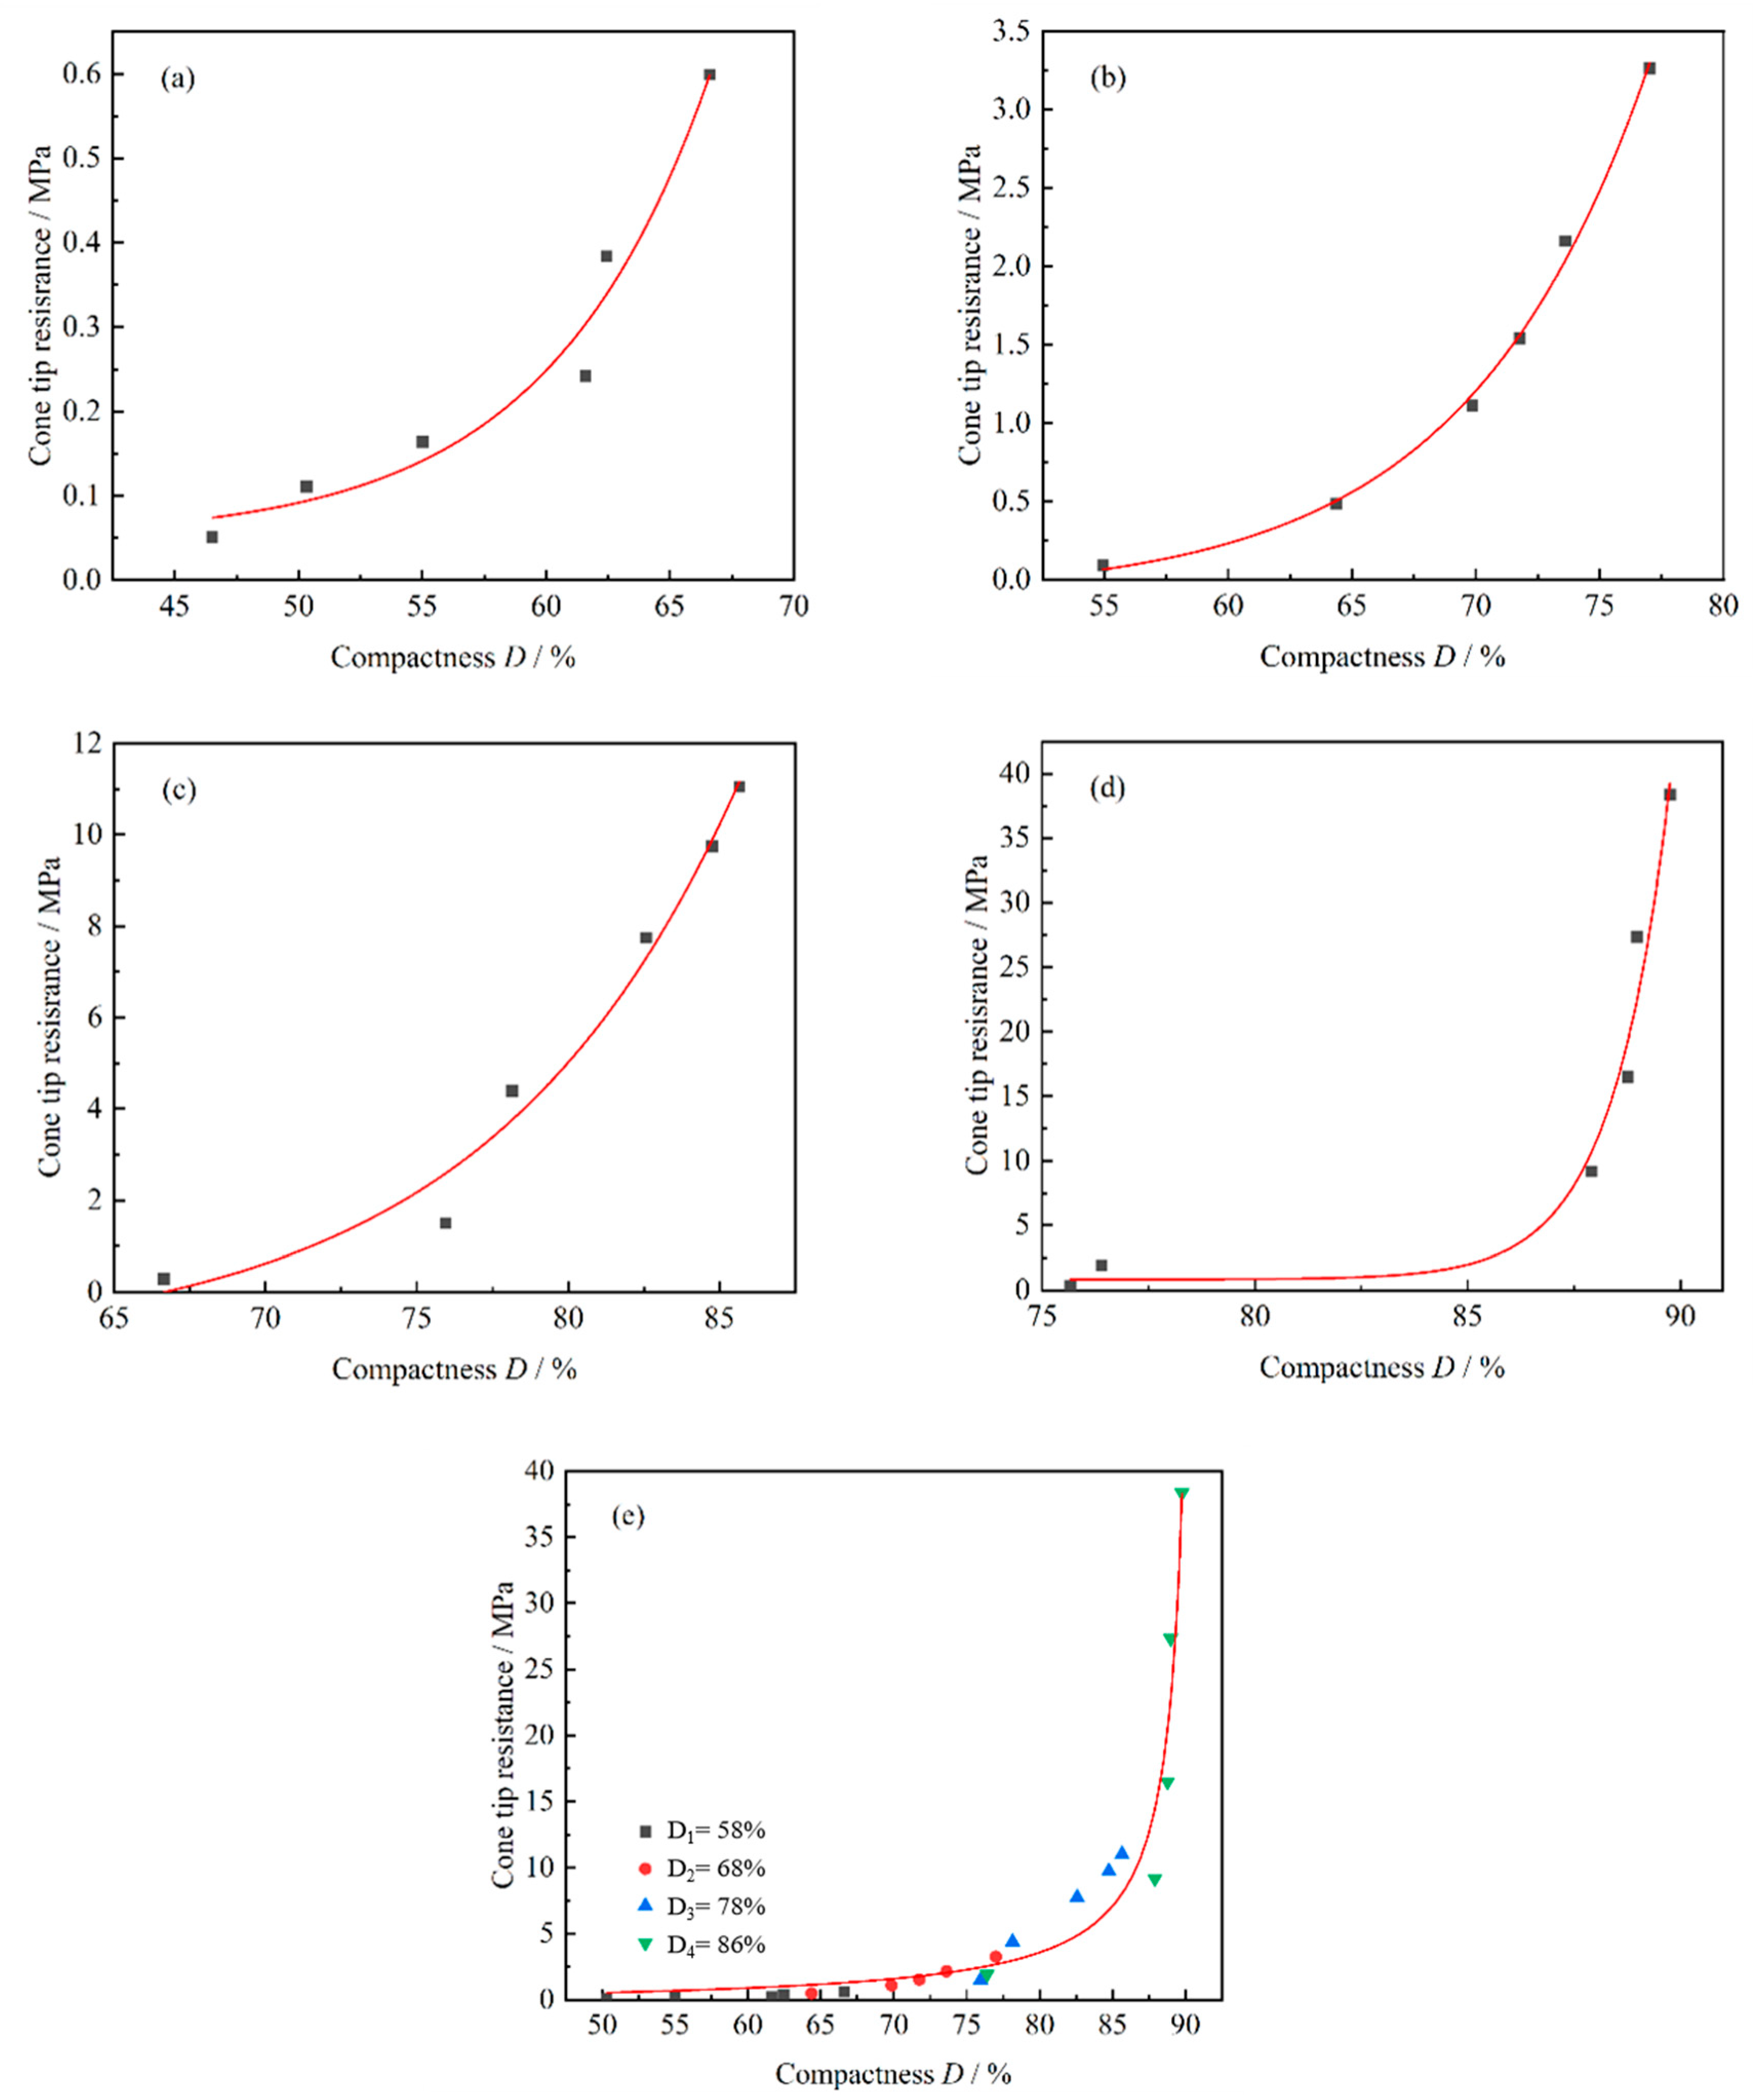
Figure 7.
The variation curves of the cone tip resistance of the lunar soil simulant with the compactness: (a) D1 = 58%; (b) D2 = 68%; (c) D3 = 78%; (d) D4 = 86%; (e) fitting of all points.
Figure 7a–d show the variations in the curves of the cone tip resistance of the lunar soil simulant with compactness for different overall compaction barrels. As can be seen in the figures, the cone tip resistances of the four groups of lunar soil simulant all gradually increase with the increase in compactness, showing an overall exponential growth. For the three lunar soil simulant groups with overall compactness levels of 58%, 68%, and 78%, the growth rate of the cone tip resistance gradually accelerates. When the overall compactness is 86%, the growth rate of the cone tip resistance in the upper barrel is extremely slow. While the single-layer compactness exceeds 87.9%, the growth rate rises sharply.
By comparing the variations in the curves of the cone tip resistance of the four groups of lunar soil simulant with compactness, it is found that as the overall compactness increases, the growth rate of the cone tip resistance also gradually increases. When the overall compactness is at a low or medium level, the growth rate of the cone tip resistance increases gradually with the increase in the single-layer compactness. When the overall compactness of the lunar soil simulant reaches a high level, a slight change in compactness can cause a rapid increase in the cone tip resistance. As shown in Figure 7d, the cone tip resistance starts to increase rapidly from the compactness of 87.9%. By comparing the average cone tip resistance data in Table 5, it can be found that in the layered lunar soil simulant compaction barrel with an overall compactness of 78%, the average cone tip resistance increases by approximately 2 MPa when the compactness increases by 1%. In the barrel with an overall compactness of 86%, when the compactness of the lunar soil simulant exceeds 87.9%, the average cone tip resistance increases by approximately 7 MP when the compactness increases by 1%. This shows that at overall compactness levels exceeding 86%, the growth in compactness has a significant impact on the cone tip resistance, verifying the rationality of the classification method mentioned earlier, which defines a lunar soil simulant with a compactness greater than 86% as high-compactness soil.
Taking all the data points from the curves of the cone tip resistance varying with compactness under the four overall compactness levels and fitting them into one single curve can represent the more general relationship between the cone tip resistance and compactness, as shown in Figure 7e. The fitting equation of the curve is as follows:
The correlation coefficient R2 of the fitted curve is 0.95. This fitted curve incorporates the cone tip resistance corresponding to the compactness of each single layer measured within the range from 46.5% to 89.8%. The cone tip resistance gradually increases as the compactness increases, and the curve shows exponential growth in the cone tip resistance. When the compactness is between 46.5% and 70%, the change in the cone tip resistance is relatively small, and the growth is rather gentle. When the compactness exceeds 70%, the cone tip resistance begins to increase significantly, and the curve shows a clear upward trend. When the compactness approaches 90%, the growth rate of the cone tip resistance accelerates. There is a positive correlation between compactness and cone tip resistance: the higher the compactness, the greater the cone tip resistance, as shown by the high-compactness lunar soil simulant.
When the overall compactness is at a low level, the cone tip resistance increases relatively slowly with the increase in compactness and in a relatively low range. When the overall compactness is at a medium level, the growth rate of the cone tip resistance starts to accelerate, and the value increases significantly. This indicates that within this compactness range, the contact between lunar soil particles gradually becomes closer, and the friction and interlocking forces between particles begin to have a greater impact on the cone tip resistance.
When the overall compactness is at a high level, the cone tip resistance shows a rapid growth trend with the increase in compactness. This indicates that the interaction between lunar soil particles is extremely strong and the structure of the lunar soil becomes very dense under high-compactness conditions. When the compactness increases from 68% to 78%, the cone tip resistance increases from 3.262 MPa to 11.044 MPa. When the compactness increases from 78% to 86%, the cone tip resistance increases from 11.044 MPa to 38.349 MPa. This shows that within the relatively high compactness range, a slight increase in compactness can lead to a substantial increase in the cone tip resistance.
3.5. Model of the Relationship Between Normalized Cone Tip Resistance and Compactness
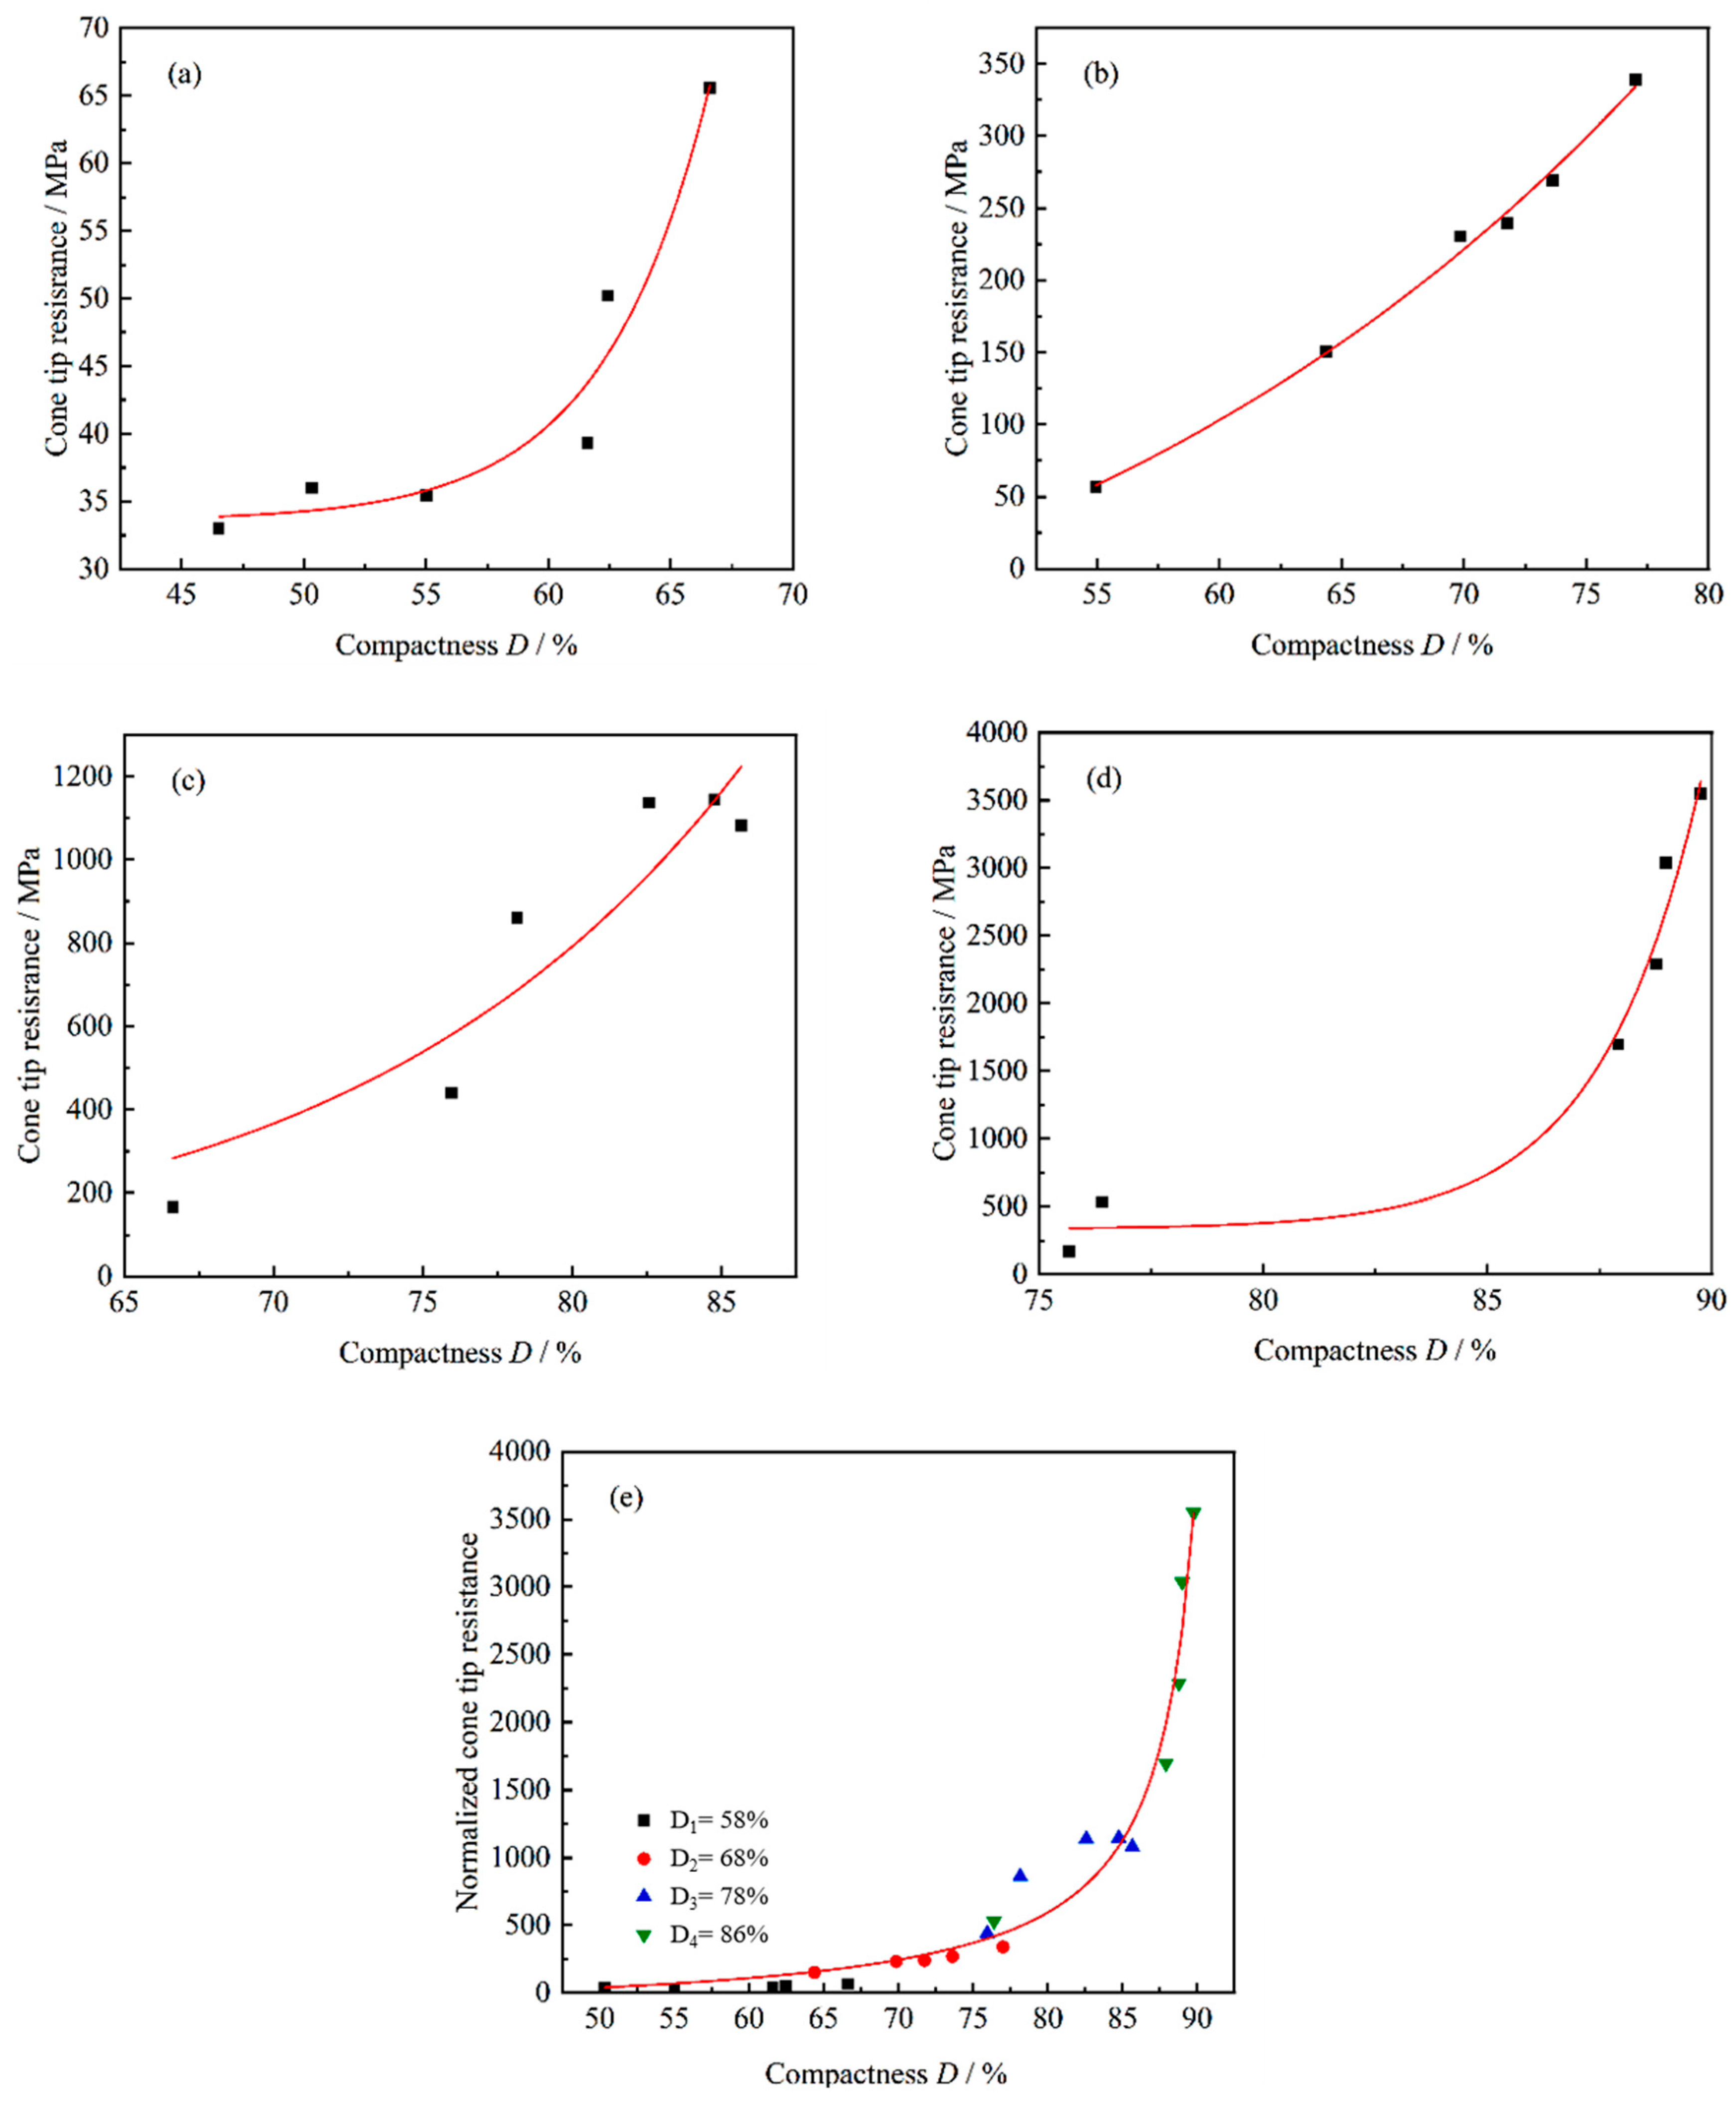
The curves of the normalized cone tip resistance of the lunar soil simulant varying with compactness under four overall compactness levels are shown in Figure 8a–d. The normalized cone tip resistance increases with the increase in compactness.

Figure 8.
The variation curves of the normalized cone tip resistance of the lunar soil simulant with compactness: (a) D1 = 58%; (b) D2 = 68%; (c) D3 = 78%; (d) D4 = 86%; (e) fitting of all points.
By comparing the variation trends of the four curves, it is found that the growth rates of the normalized cone tip resistance of the lunar soil simulant with overall compactness levels of 58% and 86% are greater than those with 68% and 78%. The uniformity is also higher at the medium compactness level than the low compactness level. The growth rate of the normalized cone tip resistance of the lunar soil simulant increases slowly with the increase in compactness.
All data points from the four curves in Figure 8a–d are fitted into one curve showing the variation in the normalized cone tip resistance of the lunar soil simulant with compactness, as depicted in Figure 8e. The following is the fitting equation of the curve:
The correlation coefficient R2 of the fitted curve is 0.97. As the compactness increases, the normalized cone tip resistance also gradually increases. When the compactness is less than 70%, the normalized cone tip resistance grows slowly with a relatively small growth rate. When it is greater than 70%, the growth rate of the normalized cone tip resistance gradually increases and continues to rise. When the compactness reaches 90%, both the growth rate and the normalized cone tip resistance reach their maximum. The higher the compactness, the greater the resistance when the cone tip penetrates the lunar soil simulant, and the faster the growth rate of the normalized cone tip resistance.
Table 6 presents the correlation coefficients of the fitted curves of the cone tip resistance of the lunar soil simulant varying with compactness. By comparing the correlation coefficients before and after the normalization of the cone tip resistance, it is found that the correlation coefficient of the fitted curve for a single overall compaction level before normalization is greater than or equal to that after normalization. When the data points for all overall compaction levels are used to fit the curve, the correlation coefficient after normalization is greater than that before normalization. This indicates that when there are sufficient experimental data, the influence of the overlying pressure on the cone tip resistance under different compactness levels can be eliminated, and the variation law of the cone tip resistance with compactness can be reflected more accurately.
Table 6.
The correlation coefficient of the fitted curve corresponding to the cone tip resistance of the lunar soil simulant with compactness.
4. Discussion
For actual lunar exploration, it is necessary to predict the compactness of lunar soil at certain depths based on the results of static cone penetration tests. Therefore, converting the curve of the normalized cone tip resistance varying with compactness in the above research into a curve of the compactness varying with the normalized cone tip resistance is more in line with the actual needs of lunar exploration.
The normalized cone tip resistance at 58%, 68%, 78%, and 86% compactness was calculated using Equations (7) and (8) to be 93.7, 209.6, 487.1, and 1338.5. The purpose of this article was to predict the compactness of lunar soil simulant based on its normalized cone tip resistance. Therefore, four calculated values were used to fit a new curve showing the variation in compactness with normalized cone tip resistance. The curve equation is
According to the mineral composition classification of the lunar soil, CUG-1A is a typical low-titanium basaltic lunar soil simulant. Among the numerous lunar soil simulants, CUMT-1 developed by China University of Mining and Technology [23], GRC-1 developed by the U.S. Army Engineer Waterways Experiment Station [24], the LSS-type developed by NASA’s Glenn Research Center [25], and JSC-1 developed by NASA [26] are all typical low-titanium basaltic lunar soil simulants.
Figure 9 shows the variation curves of the compactness with the normalized cone tip resistance of different types of lunar soil simulants. Among them, the cone tip angle of the static cone penetration test probe for the LSS lunar soil simulant is 30°, while those for the remaining lunar soil simulants are all 60°. It can be seen from the figure that the compactness of different lunar soil simulant is positively correlated with the normalized cone tip resistance. When the normalized cone tip resistance increases from 93.7 to 1338.5, the compactness of the CUG-1A lunar soil simulant increases from 58% to 86%.
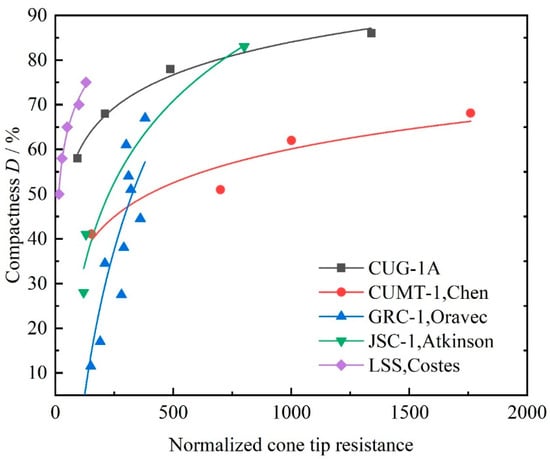
Figure 9.
The variation curves of the compactness of different lunar soil simulants with the normalized cone tip resistance [6,27,28,29].
Observing the fitting curves and their varying trends for CUG-1A, JSC-1, and GRC-1, it can be concluded that the compactness of all three lunar soil simulants is around 80% at a normalized cone tip resistance of around 750. When the normalized cone tip resistance is less than 750, the compactness is at a low to medium level. At this point, the compactness of CUG-1A is higher than that of JSC-1 and GRC-1. When the normalized cone tip resistance is greater than 750, the compactness of CUG-1A is medium to high. Here, the compactness of CUG-1A is lower than that of JSC-1 and GRC-1. As the normalized cone tip resistance increases, the compactness of the CUG-1A lunar soil simulant also gradually increases, showing a relatively low sensitivity to the normalized cone tip resistance, and eventually becomes lower than that of the majority of the remaining lunar soil simulants shown in the figure.
Since there are several types of low-titanium basaltic lunar soil simulants with little difference in their mineral composition, it can be stated that the differences in the normalized cone tip resistance are not caused by mineral composition. By comparing the variation in the compactness curve of different lunar soil simulants, the LSS simulant has the lowest normalized cone tip resistance due to the small cone tip angle of the probe. In the tests for the remaining simulants using the same cone tip angles, it is considered that the particle size has a certain impact on the test results. Table 7 shows the median particle sizes of five types of lunar soil simulant. Among them, the CUG-1A simulant has the smallest median particle size, and the GRC-1 simulant has the largest.
Table 7.
The median particle sizes of different types of lunar soil simulant [6,27,28,29].
When the normalized cone tip resistance is less than 750, the lunar soil simulant is relatively loose. Under the same normalized cone tip resistance, CUG-1A has the highest compactness, while GRC-1 has the lowest compactness. In this case, the particle size has a significant impact on the normalized cone tip resistance. The larger the particle size, the looser the lunar soil simulant is at the same normalized cone tip resistance. When the normalized cone tip resistance is greater than 750, it is more difficult to penetrate the particles of CUG-1A and CUMT-1 due to their smaller sizes compared to JSC-1 and GRC-1. That is, under the same normalized penetration resistance, the compactness of the smaller sized lunar soil is lower than that of the larger sized lunar soil. The uniformity also has a significant impact on the normalized cone tip resistance.
5. Conclusions
In this study, the variation curve of the compactness of the lunar soil simulant with depth was obtained through layered measurements. Static cone penetration tests were carried out on the lunar soil simulant under different overall compactness levels, and models of the relationship between the cone tip resistance, the normalized cone tip resistance, and the compactness were obtained. A formula for establishing the relationship between compactness and normalized cone tip resistance was established, making it possible to predict the variation in the compactness at different penetration depths. The main conclusions are as follows:
(1) The uniformity of the lunar soil simulant samples is affected by their overall compactness. The higher the overall compactness, the more uniform the simulant becomes. The difference in compactness between the top and bottom layers of the sample is smaller at higher compactness levels. The lunar soil simulant samples with lower overall compactness exhibit poorer uniformity.
(2) The cone tip resistance of lunar soil simulants increases with an increase in the penetration depth, and eventually reaches a stable state under different compactness levels. The normalized penetration resistance first increases and then decreases as the penetration depth increases. Each overall compactness level of the lunar soil simulant has a specific, stable value and a specific peak value of the normalized cone tip resistance.
(3) The compactness of lunar soil simulants increases with the increase in the normalized cone tip resistance. The correlation coefficient obtained between compactness and normalized cone tip resistance in functional model was 0.989. Thus, the compactness of real lunar soil can be predicted using this functional model. The relationship between compactness and the normalized cone tip of real lunar soil can provide strong support for relevant research and practices in in situ lunar surface testing.
(4) The cone tip resistance of the lunar soil continues to increase with the increase in penetration depth. Large-sized static cone penetration probes receive greater cone tip resistance, while small-sized probes are more likely to penetrate into highly dense lunar soil and are more suitable for use in the lunar surface environment. Therefore, future research directions include static penetration tests and mechanism studies of small-sized probes, static penetration tests of different types of lunar soil, and research on the prediction of the physical and mechanical parameters of lunar soil.
Author Contributions
Conceptualization, L.D. and X.F.; data curation, Y.Z. and S.X.; formal analysis, Y.Z. and S.X.; funding acquisition, H.G. and L.X.; investigation, H.G. and X.F.; methodology, H.G. and L.X.; supervision, H.G., X.F. and L.D.; writing—original draft, Y.Z.; writing—review and editing, H.G., X.F., S.X., L.X. and L.D. All authors have read and agreed to the published version of the manuscript.
Funding
Financial support was received from the Nation Key R & D Program of China (2023YFB3711300).
Institutional Review Board Statement
Not applicable.
Informed Consent Statement
Not applicable.
Data Availability Statement
The original contributions presented in the study are included in the article, further inquiries can be directed to the corresponding author.
Conflicts of Interest
The authors declare no conflicts of interest.
References
- Lin, Y.; Yang, W.; Zhang, H.; Hui, H.; Hu, S.; Xiao, L.; Liu, J.; Xiao, Z.; Yue, Z.; Zhang, J.; et al. Return to the Moon: New Perspectives on Lunar Exploration. Sci. Bull. 2024, 69, 2136–2148. [Google Scholar] [CrossRef] [PubMed]
- Costes, N.C.; Carrier, W.D.; Mitchell, J.K.; Scott, R.F. Apollo 11 Soil Mechanics Investigation. Science 1970, 167, 739–741. [Google Scholar] [CrossRef] [PubMed]
- Mitchell, J.K.; Houston, W.N.; Scott, R.F.; Costes, N.C.; Carrier, W.D., III; Bromwell, L.G. Mechanical Properties of Lunar Soil: Density, Porosity, Cohesion and Angle of Internal Friction. Proc. Lunar Sci. Conf. 1972, 3, 3235. [Google Scholar]
- Bao, C.; Feng, P.; Zhang, D.; Wang, Q.; Yang, S. Conceptual Design and Experimental Investigation of Regolith Bag Structures for Lunar in Situ Construction. J. Build. Eng. 2024, 95, 110245. [Google Scholar] [CrossRef]
- Jiang, M.; Xi, B.; Lei, H. Investigation of Gravity Effect on Penetration Resistance in Tongji-1 Lunar Regolith Simulant by Centrifuge Tests. Adv. Space Res. 2018, 62, 945–956. [Google Scholar] [CrossRef]
- Li, R.; Chen, J.; Zhang, J.; Chen, D.; Zhao, X.; Mo, P.-Q.; Zhou, G. Cone Penetration Resistance of CUMT-1 Lunar Regolith Simulant under Magnetic-Similitude Lunar Gravity Condition. Acta Geotech. 2023, 18, 6725–6744. [Google Scholar] [CrossRef]
- Sun, Q.; Wang, L.; Zhang, L.; Badal, J.; Chen, Q. Lunar Highlands Simulant—Geotechnical Characterization, 3D Discrete Element Modeling, and Cone Penetration Simulations. Acta Astronaut. 2024, 221, 283–295. [Google Scholar] [CrossRef]
- Jiang, M.; Zhang, N.; Shen, Z.; Wu, X. CPT-Based Estimation of Bearing and Deformation Indexes for TJ-1 Lunar Soil Simulant Ground. AIP Conf. Proc. 2013, 1542, 309–312. [Google Scholar] [CrossRef]
- Jiang, M.; Xi, B.; De Blasio, F.V.; Lei, H.; Sun, D. Physical Model Tests of the Bearing Behavior of Tongji-1 Lunar Soil Simulant. J. Aerosp. Eng. 2019, 32, 04018150. [Google Scholar] [CrossRef]
- Jiang, M.J.; Zhang, N.; Cui, L.; Xi, B.L.; Wang, X.X. Estimation of Mechanical Parameters of Tongji-1 Lunar Soil Simulant Based on Cone Penetration Test. Eur. J. Environ. Civ. Eng. 2019, 26, 393–408. [Google Scholar] [CrossRef]
- Jiang, M.; Zhao, T.; Wang, X. DEM Modelling of Cone Penetration Tests in Lunar Soil. Granul. Matter 2021, 24, 5. [Google Scholar] [CrossRef]
- Song, Y.; Gu, X.; Hu, J.; Zheng, X. DEM Simulation of Cone Penetration Tests in Sand in a Virtual Calibration Chamber. Comput. Geotech. 2025, 177, 106900. [Google Scholar] [CrossRef]
- Zhao, X.; Liu, Z.; Li, Y.; Wang, H.; Xu, Z. Numerical Study of Cone Penetration Tests in Lunar Regolith for Strength Index. Appl. Sci. 2024, 14, 10645. [Google Scholar] [CrossRef]
- Lin, C.; Tu, F.; Ling, D.; Hu, C. FEM-DEM Coupled Modeling of Cone Penetration Tests in Lunar Soil. J. Cent. South Univ. 2018, 25, 392–405. [Google Scholar] [CrossRef]
- Kulchitsky, A.; Johnson, J.; Wilkinson, A.; DeGennaro, A.J.; Duvoy, P. Discrete Element Method (DEM) Application to The Cone Penetration Test Using COUPi Model|Request PDF. Available online: https://www.researchgate.net/publication/258463671_Discrete_Element_Method_DEM_Application_to_The_Cone_Penetration_Test_Using_COUPi_Model (accessed on 2 April 2025).
- Sun, L.; Lucey, P.G.; Taylor, G.J. Correlating Apollo Soil Mineralogical Data With Kaguya Spectral Data for a Global Mineralogical Classification. J. Geophys. Res. Planets 2021, 126, e2020JE006445. [Google Scholar] [CrossRef]
- Basu, A.; Riegsecker, S.E. Reliability of Calculating Average Soil Composition of Apollo Landing Sites. In Proceedings of the New Views of the Moon: Integrated Remotely Sensed, Geophysical, and Sample Datasets, Houston, TX, USA, 18–20 September 1998. [Google Scholar]
- Liu, X.; Li, S.; Yao, T. Laboratory Investigation on the Single Particle Crushing Strength of Carbonate Gravel Incorporating Size and Shape Effects. Géotechnique 2025, 75, 94–110. [Google Scholar] [CrossRef]
- Lunar Sourcebook: A User’s Guide to the Moon. Available online: https://www.lpi.usra.edu/lunar_sourcebook/ (accessed on 20 March 2025).
- Apollo 15 Preliminary Science Report. Available online: https://www.nasa.gov/history/alsj/a15/a15psr.html (accessed on 2 April 2025).
- Naderi-Boldaji, M.; Keller, T. Degree of Soil Compactness Is Highly Correlated with the Soil Physical Quality Index S. Soil Tillage Res. 2016, 159, 41–46. [Google Scholar] [CrossRef]
- Bolton, M.D.; Gui, M.W.; Garnier, J. Centrifuge Cone Penetration Tests in Sand. Geotechnique 1999, 49, 543–552. [Google Scholar] [CrossRef]
- Li, R.; Zhou, G.; Yan, K.; Chen, J.; Chen, D.; Cai, S.; Mo, P.-Q. Preparation and Characterization of a Specialized Lunar Regolith Simulant for Use in Lunar Low Gravity Simulation. Int. J. Min. Sci. Technol. 2022, 32, 1–15. [Google Scholar] [CrossRef]
- Oravec, H.A.; Zeng, X.; Asnani, V.M. Design and Characterization of GRC-1: A Soil for Lunar Terramechanics Testing in Earth-Ambient Conditions. J. Terramech. 2010, 47, 361–377. [Google Scholar] [CrossRef]
- Melzer, K. Performance of the Boeing LRV Wheels in a Lunar Soil Simulant. Report 2: Effects of Speed, Wheel Load, and Soil; National Aeronautics and Space Administration: Washington, DC, USA, 1971.
- Hill, E.; Mellin, M.J.; Deane, B.; Liu, Y.; Taylor, L.A. Apollo Sample 70051 and High- and low-Ti Lunar Soil Simulants MLS-1A and JSC-1A: Implications for Future Lunar Exploration. J. Geophys. Res. Planets 2007, 112, E02006. [Google Scholar] [CrossRef]
- Cohron, G.T.; Costes, N.C.; Moss, D.C. Cone Penetration Resistance Test—An Approach to Evaluating in-Place Strength and Packing Characteristics of Lunar Soils. Proc. Lunar Sci. Conf. 1971, 2, 1973–1987. [Google Scholar]
- Atkinson, J.; Prasad, M.; Abbud-Madrid, A.; Dreyer, C.B. Penetration and Relaxation Behavior of Dry Lunar Regolith Simulants. Icarus 2019, 328, 82–92. [Google Scholar] [CrossRef]
- Oravec, H.A. Understanding Mechanical Behavior of Lunar Soils for the Study of Vehicle Mobility. Ph.D. Thesis, Case Western Reserve University, Cleveland, OH, USA, 2009. [Google Scholar]


Disclaimer/Publisher’s Note: The statements, opinions and data contained in all publications are solely those of the individual author(s) and contributor(s) and not of MDPI and/or the editor(s). MDPI and/or the editor(s) disclaim responsibility for any injury to people or property resulting from any ideas, methods, instructions or products referred to in the content. |
© 2025 by the authors. Licensee MDPI, Basel, Switzerland. This article is an open access article distributed under the terms and conditions of the Creative Commons Attribution (CC BY) license (https://creativecommons.org/licenses/by/4.0/).