Article

Waste as a Source of Fuel and Developments in Hydrogen Storage: Applied Cases in Spain and Their Future Potential

by
Juan Pous de la Flor
1,
María-Pilar Martínez-Hernando
1,2,
Roberto Paredes
1,
Enrique Garcia-Franco
1,2,
Juan Pous Cabello
1,2 and
Marcelo F. Ortega
1,2,*
1
Laboratorio de Ingeniería de Proyectos, Escuela Técnica Superior de Ingenieros de Minas y Energía, Universidad Politécnica de Madrid, 28003 Madrid, Spain
2
Tecminergy, Universidad Politécnica de Madrid, 28906 Getafe, Spain
*
Author to whom correspondence should be addressed.
Appl. Sci. 2025, 15(13), 7514; https://doi.org/10.3390/app15137514
Submission received: 3 April 2025 / Revised: 21 June 2025 / Accepted: 2 July 2025 / Published: 4 July 2025
(This article belongs to the Section Energy Science and Technology)

Abstract

The integration of renewable energy with circular economy strategies offers effective pathways to reduce greenhouse gas emissions while enhancing local energy independence. This study analyses three real-world projects implemented in Spain that exemplify this synergy. LIFE Smart Agromobility converts pig manure into biomethane to power farm vehicles, using anaerobic digestion and microalgae-based upgrading systems. Smart Met Value refines biogas from a wastewater treatment plant in Guadalajara to produce high-purity biomethane for the municipal fleet, demonstrating the viability of energy recovery from sewage sludge. The UNDERGY project addresses green hydrogen storage by repurposing a depleted natural gas reservoir, showing geochemical and geomechanical feasibility for seasonal underground hydrogen storage. Each project utilises regionally available resources to produce clean fuels—biomethane or hydrogen—while mitigating methane and CO2 emissions. Results show significant energy recovery potential: biomethane production can replace a substantial portion of fossil fuel use in rural and urban settings, while hydrogen storage provides a scalable solution for surplus renewable energy. These applied cases demonstrate not only the technical feasibility but also the socio-economic benefits of integrating waste valorisation and energy transition technologies. Together, they represent replicable models for sustainable development and energy resilience across Europe and beyond.

1. Introduction

The energy transition in Spain faces urgent challenges, marked by the need to reduce greenhouse gas emissions and to guarantee a reliable and sustainable energy supply. On this path, Spain has experienced a significant increase in electricity generation from renewable sources between 1999 and 2025 [1]. In line with its National Integrated Energy and Climate Plan (PNIEC) 2021–2030, the government has set an ambitious target of 74% of electricity generation from renewable sources by 2030 [2].
In this context, biomethane represents a key alternative to non-renewable sources of energy generation. It is estimated that the production of biomethane could replace more than 50% of the coal-based primary energy used in Spain in 2023 [3]. This potential replacement capacity offers the opportunity to provide an efficient and strategic energy solution that takes advantage of locally available resources to advance waste-to-energy research, innovation, and technologies, thereby promoting environmental sustainability and the principles of the circular economy.
This trend is also in line with the commitments set by the European Union on renewable energy. Directive (EU) 2023/2413 sets a binding target of 42.5% of energy consumption from renewable sources by 2030, with an indicative supplement of 2.5% to reach 45% [4]. This policy framework reinforces the need to adopt technologies that enable a realistic and effective transition to a cleaner, more resilient, and self-sufficient energy model.
Within this European roadmap, the recovery of organic waste represents an interesting strategy for integrating the principles of the circular economy into the energy sector [5]. By converting by-products such as slurry or sludge from wastewater treatment into renewable energy sources, the environmental impact of key sectors such as agriculture and water treatment can be significantly reduced [6], while at the same time generating new economic opportunities, optimising waste management, and promoting rural development [7].
In this context, anaerobic digestion represents an effective measure to avoid fugitive emissions of greenhouse gases through the controlled putrefaction of waste. It is a biochemical process that converts organic substrate into biogas—a mixture made of two major gases, methane (CH4) and carbon dioxide (CO2)—and a residual slurry called digestate [8]. It mimics natural anaerobic conditions where organic matter decomposes, although uncontrolled environments like neglected sewage systems can generate odours and health hazards [9]. Methane stores energy, while CO2 results from endothermic oxidation processes. The absence of oxygen leads to reducing conditions, forming by-products such as hydrogen sulphide [10].
Anaerobic digestion is optimal for wet waste, as removing and transporting diluting water are costly when aiming at the thermochemical route [11]. A wide range of organic materials, e.g., the organic fraction of municipal solid waste, faeces, and industrial sludge, can be used [12]. Wastewater treatment plants improve feasibility by centralising sludge [13], but agricultural systems can face economic limitations. Industrial streams may be suitable, although heavy metals may inhibit microbial activity or contaminate digestate [14]. The biodegradable fraction of organic waste, termed Volatile Solids (VS), is determined via heating tests [15], representing the portion of matter biodegradable by microbial action [16].
In parallel, green hydrogen has gained prominence as an energy source with great potential to decarbonise emission-intensive sectors [8]. However, efficient and safe storage remains one of the main challenges for large-scale adoption. Underground storage, especially in structures such as depleted reservoirs, aquifers, or salt caverns, offers promising solutions [17]. In contrast to above-ground tanks, it stands out for its significantly higher capacity, density, and storage pressure [18]. This stability and the possibility of integration with existing infrastructures could facilitate its deployment in countries such as Spain.
In order to respond to these challenges, this article presents three projects in which our research team has participated: LIFE Smart Agromobility, focused on the production and use of biomethane in livestock farms through a novel biological upgrading process [19]; Smart Met Value, which pioneers the transformation of conventional wastewater treatment plants (WWTP) into refuelling stations for vehicles powered by biomethane derived from sewage sludge [20]; and UNDERGY, which explores the feasibility of underground hydrogen storage in Spain through high-resolution simulations based on real geological reservoirs [21]. These projects not only apply advanced technologies with measurable results but also contribute to the development of replicable solutions in other regions of the country.
The aim of this paper is to present these three projects, explain the specific problems they address, present the results obtained during their implementation, and analyse their potential for replicability and scalability in other regions of Spain. The aim is to provide practical and transferable knowledge to accelerate an energy transition aligned with the principles of the circular economy and national and European climate objectives.

2. Materials and Methods

2.1. Potential for Replication

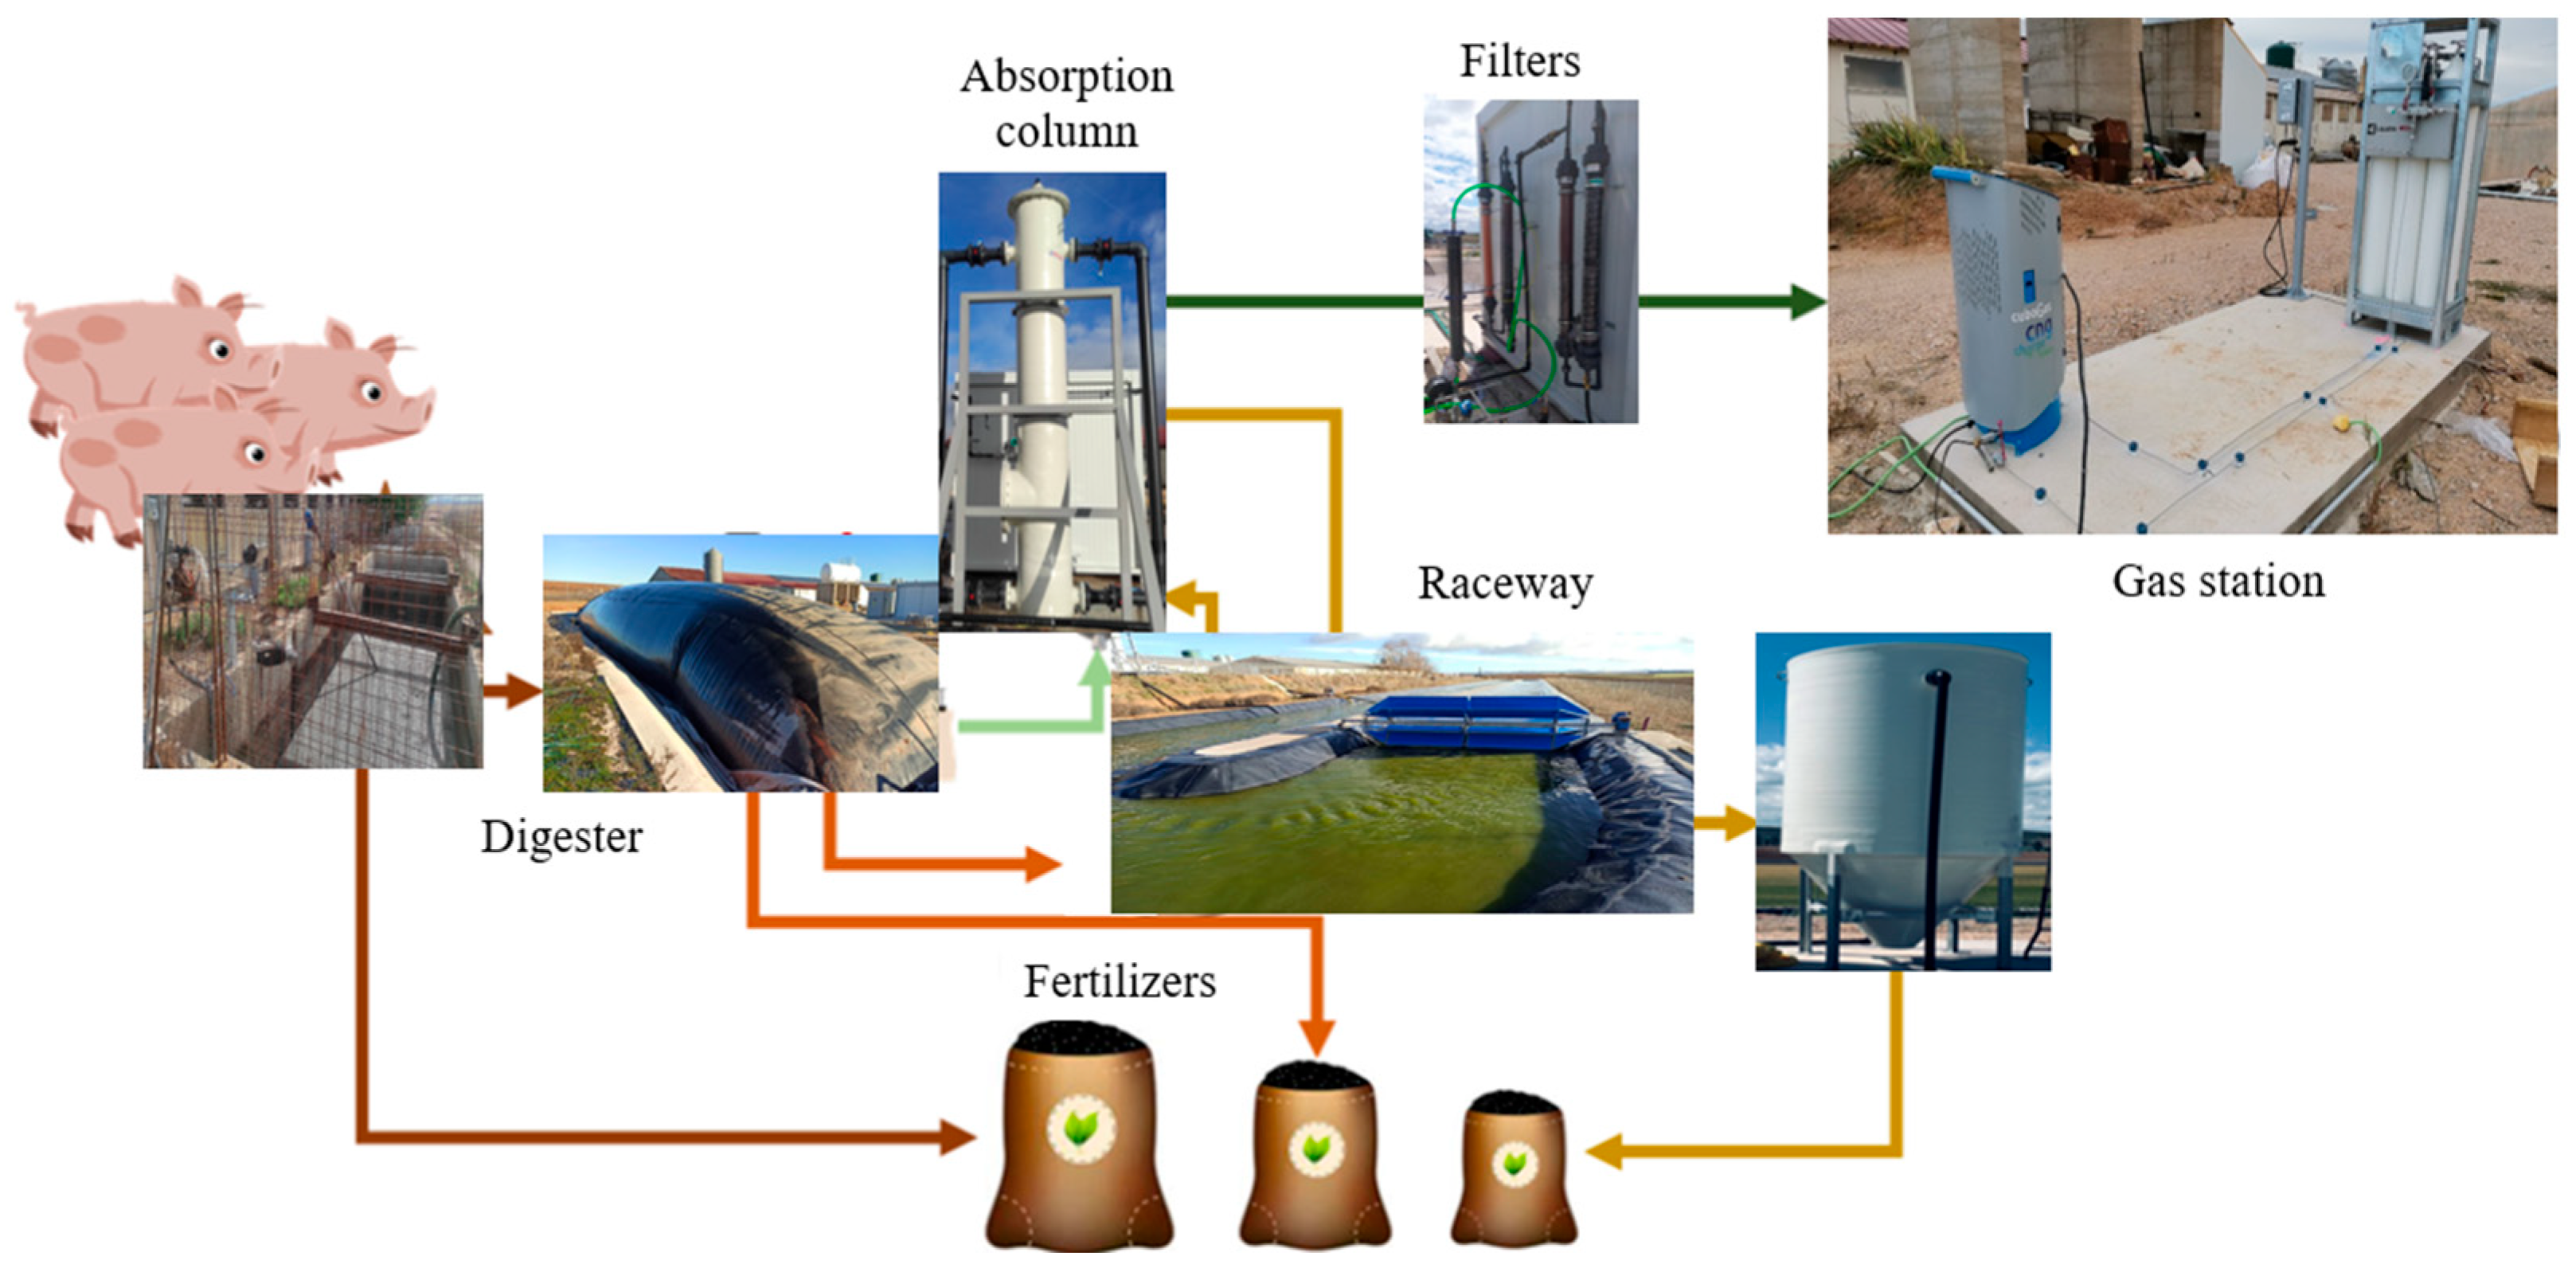
2.1.1. Biomethane Production from Pig Manure

Potential for replication was estimated using primary data under the Review and Records methodology from LIFE Smart Agromobility, a LIFE European project developed by a consortium formed by Universidad Politécnica de Madrid, Universidad de Valladolid, NTTDATA, COPISO, GASNAM, and Ente Público Regional de la Energía de Castilla y León [19]. This project, which is located in Sauquillo de Boñices (Soria, Spain), produced biogas using pig manure through an anaerobic digestion process, while an absorption column containing microalgae was applied to transform the biogas into biomethane.
The process begins with storing manure in a pond for 25 days; thereafter, the manure is subjected to anaerobic digestion inside a low-cost biodigester under psychrophilic conditions, resulting in the production of biogas (with approximately 70% CH4) and digestate. Only 3% of digestate is used for microalgae cultivation in the raceway section, and the rest is used as fertiliser. The grown microalgae are combined with biogas in an absorption column to upgrade the biogas to 90% CH4. This is facilitated through an absorption process whereby microalgae remove CO2 from biogas. The biogas is further refined to 95% CH4 using silica gel and activated carbon filters to meet vehicular biomethane standards. Finally, the biomethane is compressed to 250 bar and stored in a gas station to fuel light vehicles and agricultural machinery [22]. Figure 1 shows a diagram of the project’s process flow chart.
The potential of biomethane production depends on the amount of VS, which represents the portion of organic material that can be degraded. A typical value for biomethane production from pig manure (η) is 0.5 m3 CH4 per kg of VS [23], and for WWTP, it is also 0.5 kg CH4 per kg of VS [24]. The potential production for one swine head was estimated using primary data from LIFE Smart Agromobility, considering mesophilic conditions (i.e., 35 °C). This range has been considered because production in the psychrophilic range is strongly dependent on outdoor temperature, and it is not possible to extrapolate results between two places with different temperatures. To operate under mesophilic conditions, it is necessary to consume part of the biogas generated in the boiler to maintain the required temperature (35 °C). This amount is called %biogas_boiler. The amount of biogas consumed also depends inversely on the outdoor temperature.
Data from pig manure parameters is obtained in [25]. The energy content of biogas could be calculated with the Wobbe index of biomethane, correcting the value with the percentage of methane (%CH4) in biogas. Total production of biomethane per head could be calculated using Equation (1):
B i o m e t h a n e G W h p i g = η m 3 k g V S × V S k g V S k g m a n u r e × p i g m a n u r e k g p i g × % b i o g a s _ b o i l e r × % C H 4 × W o b b e I n d e x G W h m 3
The potential production of pig manure was estimated using primary data from LIFE Smart Agromobility and data from the Agricultural Census of the Spanish National Institute of Statistics [26]. In Appendix B.1, there is a table with the swine heads per province in Spain.
All maps presented in this study were created using Education Site ArcGIS Pro 3.2, using a template obtained from Instituto Geográfico Nacional (IGN) [27] and the ETRS 1989 as the coordinate system.

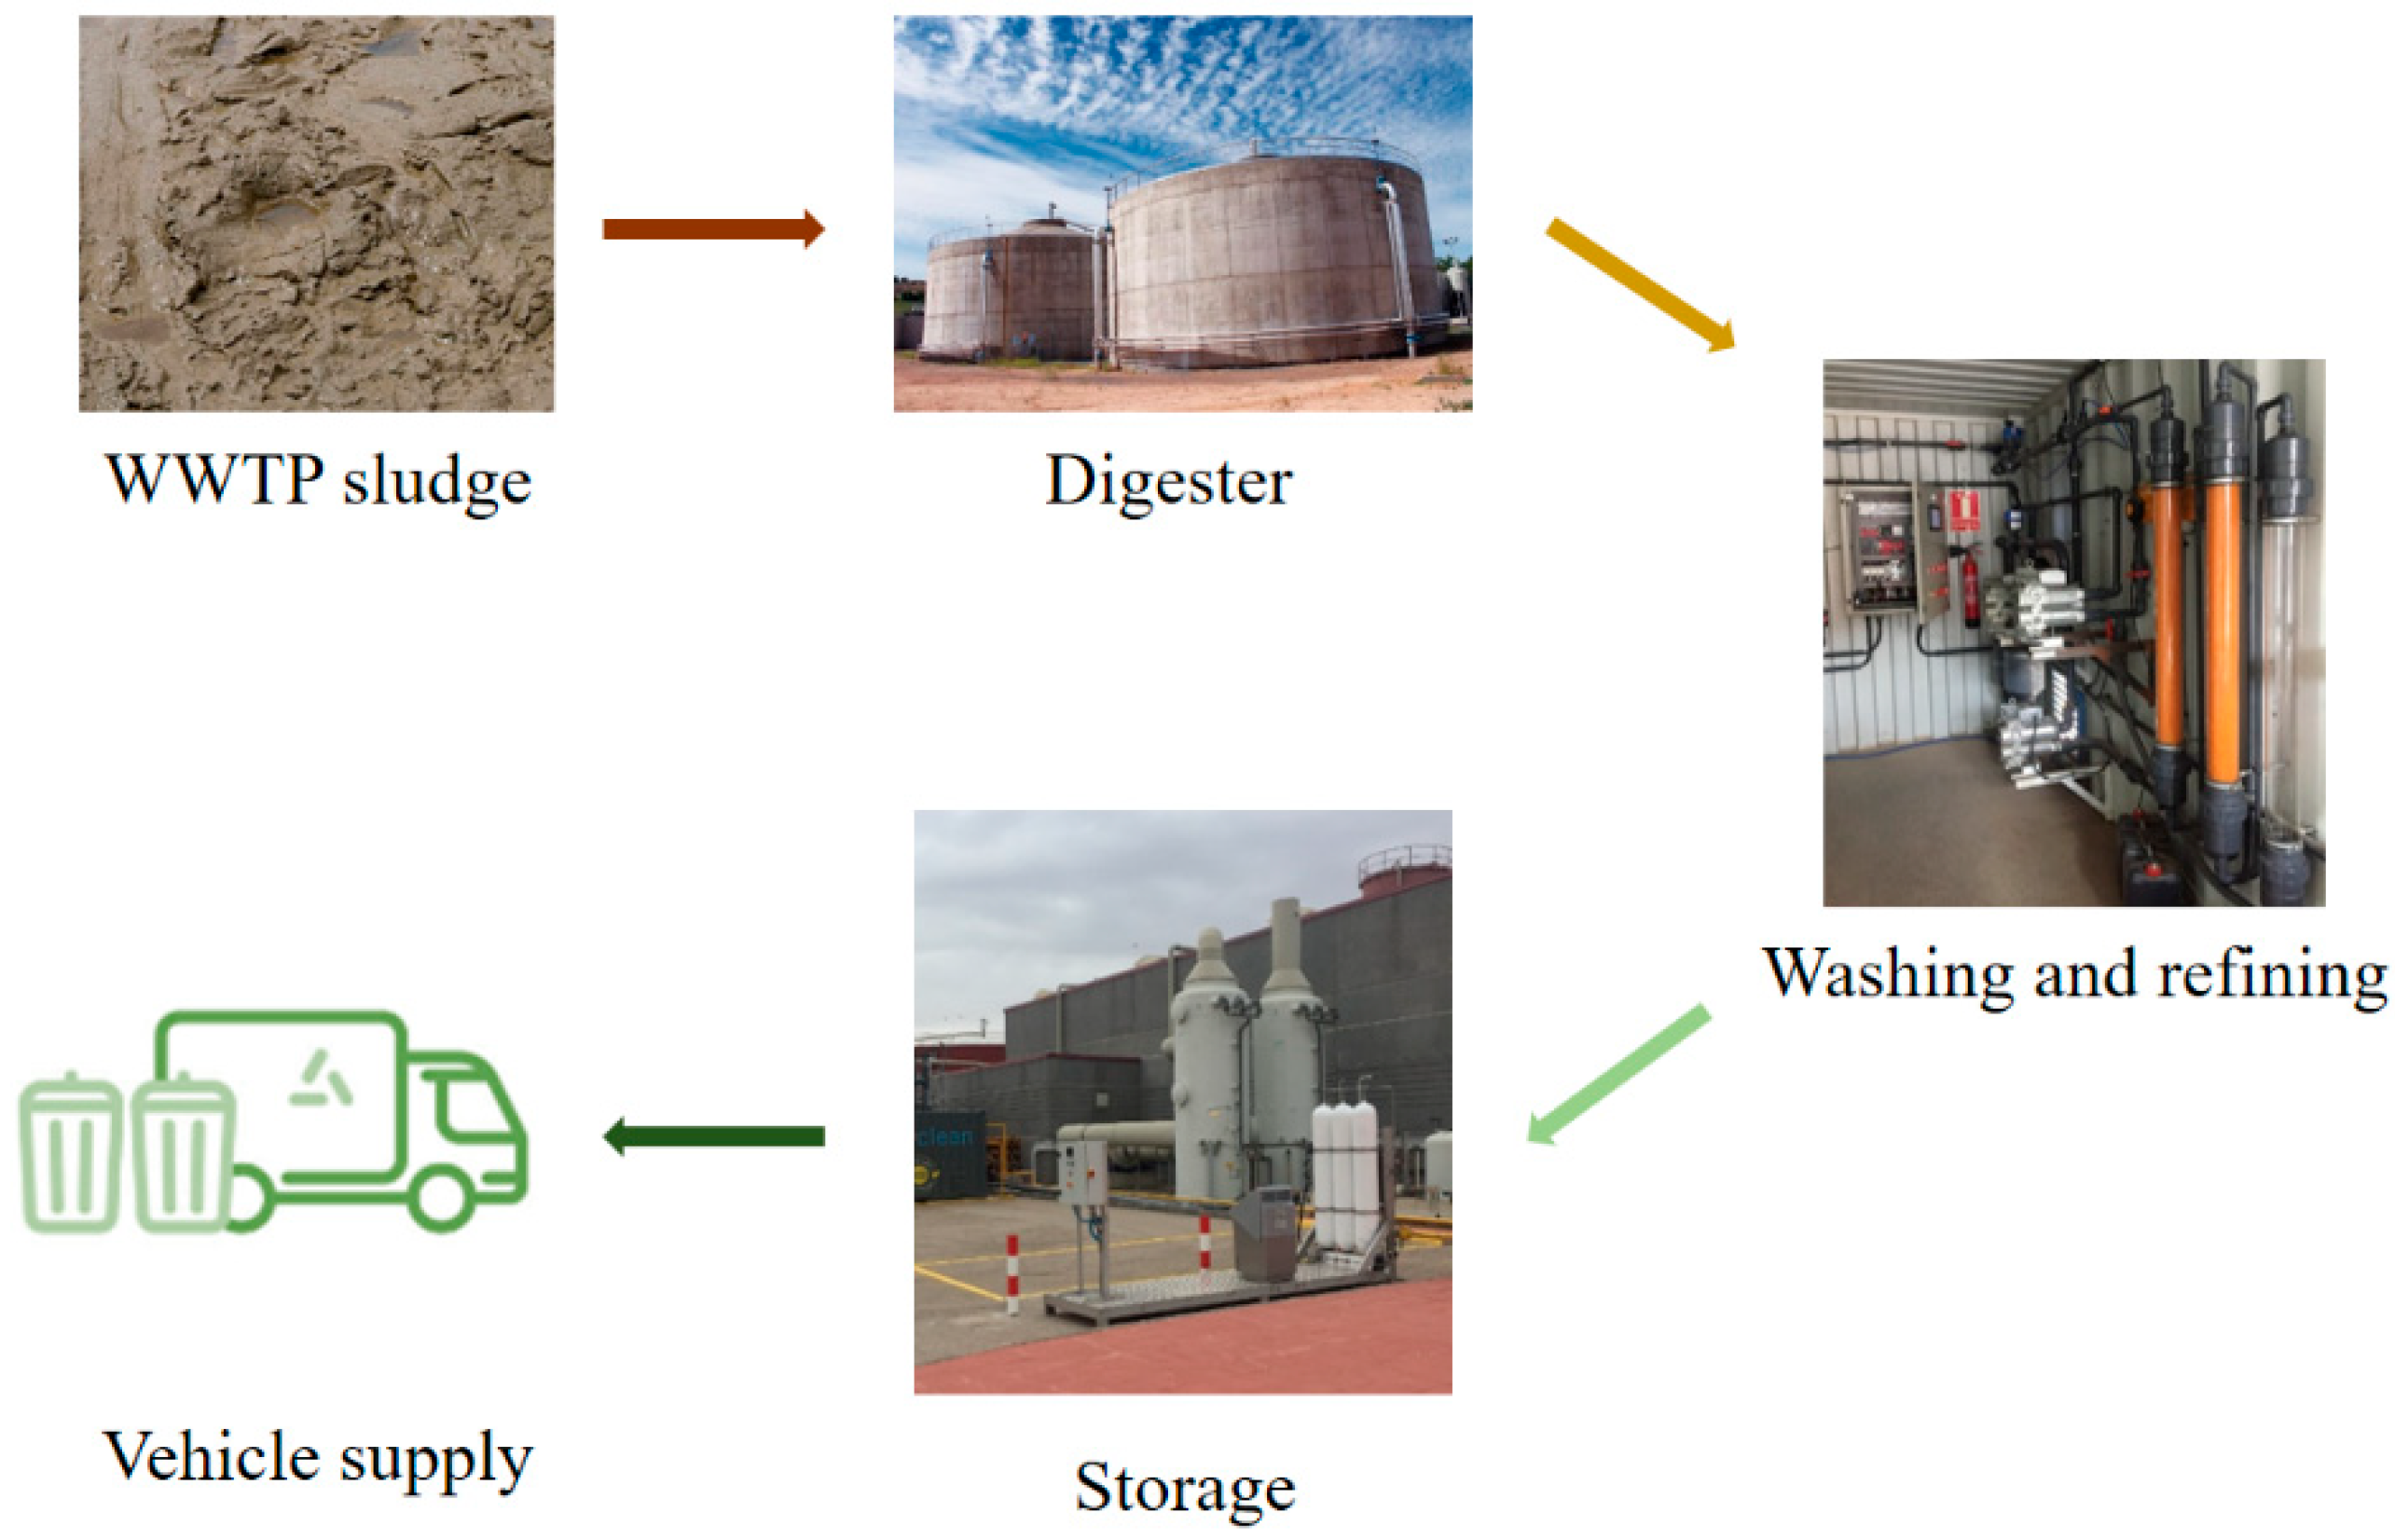
2.1.2. Biomethane Production from WWTP

Wastewater treatment plants (WTTPs) have become essential infrastructure in cities around the world, enabling sewage treatment before reuse or discharge. Depending on the population size, a city may have one or several WWTPs to ensure efficient effluent treatment.
The treatment process in WWTPs begins with passing the wastewater through a series of screens at the inlet of the plant, which remove large quantities of suspended or floating solids. It is then fed to primary treatment, where the suspended solids are separated by decantation, resulting in a cleaner liquid and sewage sludge that require specific treatment.
In the next stage, secondary treatment and chemical and biological processes are applied to remove the remaining contaminants. Through flocculation reactions and the action of microorganisms, wastewater is purified to levels that allow it to be reused for tasks such as garden irrigation or street sweeping. Excess treated wastewater, now free of contaminants, is safely discharged into rivers or other natural waterways.
As mentioned above, one of the by-products generated in this process is sewage sludge, with a high concentration of organic matter. The proper management of this by-product is the main objective of the project. Thus, to take advantage of its energy potential, the sludge is sent to anaerobic digesters, where, after a fermentation period, biogas is produced with a composition of approximately 66% methane, 30% carbon dioxide, and traces of other compounds, such as carbon monoxide, sulphur gases, and suspended microparticles.
Traditionally, all biogas generated at WWTPs is burned in flares, resulting in a large loss/wastage of a potential valuable renewable energy source and unnecessary air pollution/release of air pollutants. To reverse this situation, the Smart Met Value project, implemented at the Guadalajara WWTP in Spain, developed a process to recover the sludge produced at the facility.
The process developed started with the installation of cogeneration engines that used the biogas as fuel to generate electricity and reduce the WWTP’s energy costs. However, the use of unpurified biogas caused serious maintenance problems in the engines, as the impurities present in the gas (such as sulphides, microparticles, and aromatics in the form of siloxanes) accelerate the wear of pistons, rings, and cylinder liners.
To overcome this limitation, biogas refining and purification processes were incorporated. First, a backwash system was employed using treated water from the WWTP to separate methane from carbon dioxide and solid particles. Subsequently, the gas was passed through conventional absorption columns, where sulphur and aromatic compounds were removed and dried to avoid the presence of residual moisture. The overall valorisation project flowsheet is shown in Figure 2.
The final result of the process was biomethane with a purity of more than 95%, which met the standards required by vehicle manufacturers for its use as a fuel. This high purity is essential to ensure efficient engine performance and avoid mechanical problems. To achieve this, biomethane must meet several technical conditions: a minimum concentration of 90% methane, absence of aromatic compounds, elimination of micro-particles, sulphurous gases, and moisture [28].
By meeting these conditions, the biomethane obtained could be used directly in trucks and light vehicles without the need to modify the engines. In addition, a refuelling station was set up at the WWTP itself, allowing vehicles to refuel autonomously, without relying on conventional filling stations or incurring their high costs.
This case demonstrates not only the technical feasibility of the process but also its potential for replication on a larger scale. In this sense, the aim of this article is to analyse the general potential for biomethane production from WWTPs in the Spanish context.
Thus, the potential has been estimated using primary data from the Smart Met Value, whereby the calculated biomethane production capacity of a WWTP was 1.72 m3 per equivalent inhabitant. This value is called (η). Then, η is multiplied by the Wobbe index to obtain the average production per equivalent inhabitant, as shown in Equation (2).
B i o m e t h a n e G W h e q . h a b = η m 3 e q . h a b × W o b b e I n d e x G W h m 3
Finally, to obtain the potential in Spain, the average production per equivalent inhabitant is multiplied by the equivalent inhabitant capacity of each plant in Spain, obtained from the Spanish Ministry for Ecological Transition and Demographic Challenge [29]. In Appendix B.2, Figure A1 shows the location of the WWTPs in Spain. To assess the biomethane production potential, small-scale plants (under 10.000 m3 of water treated) have not been considered, as they have no feasibility and cost-effectiveness for biomethane production.

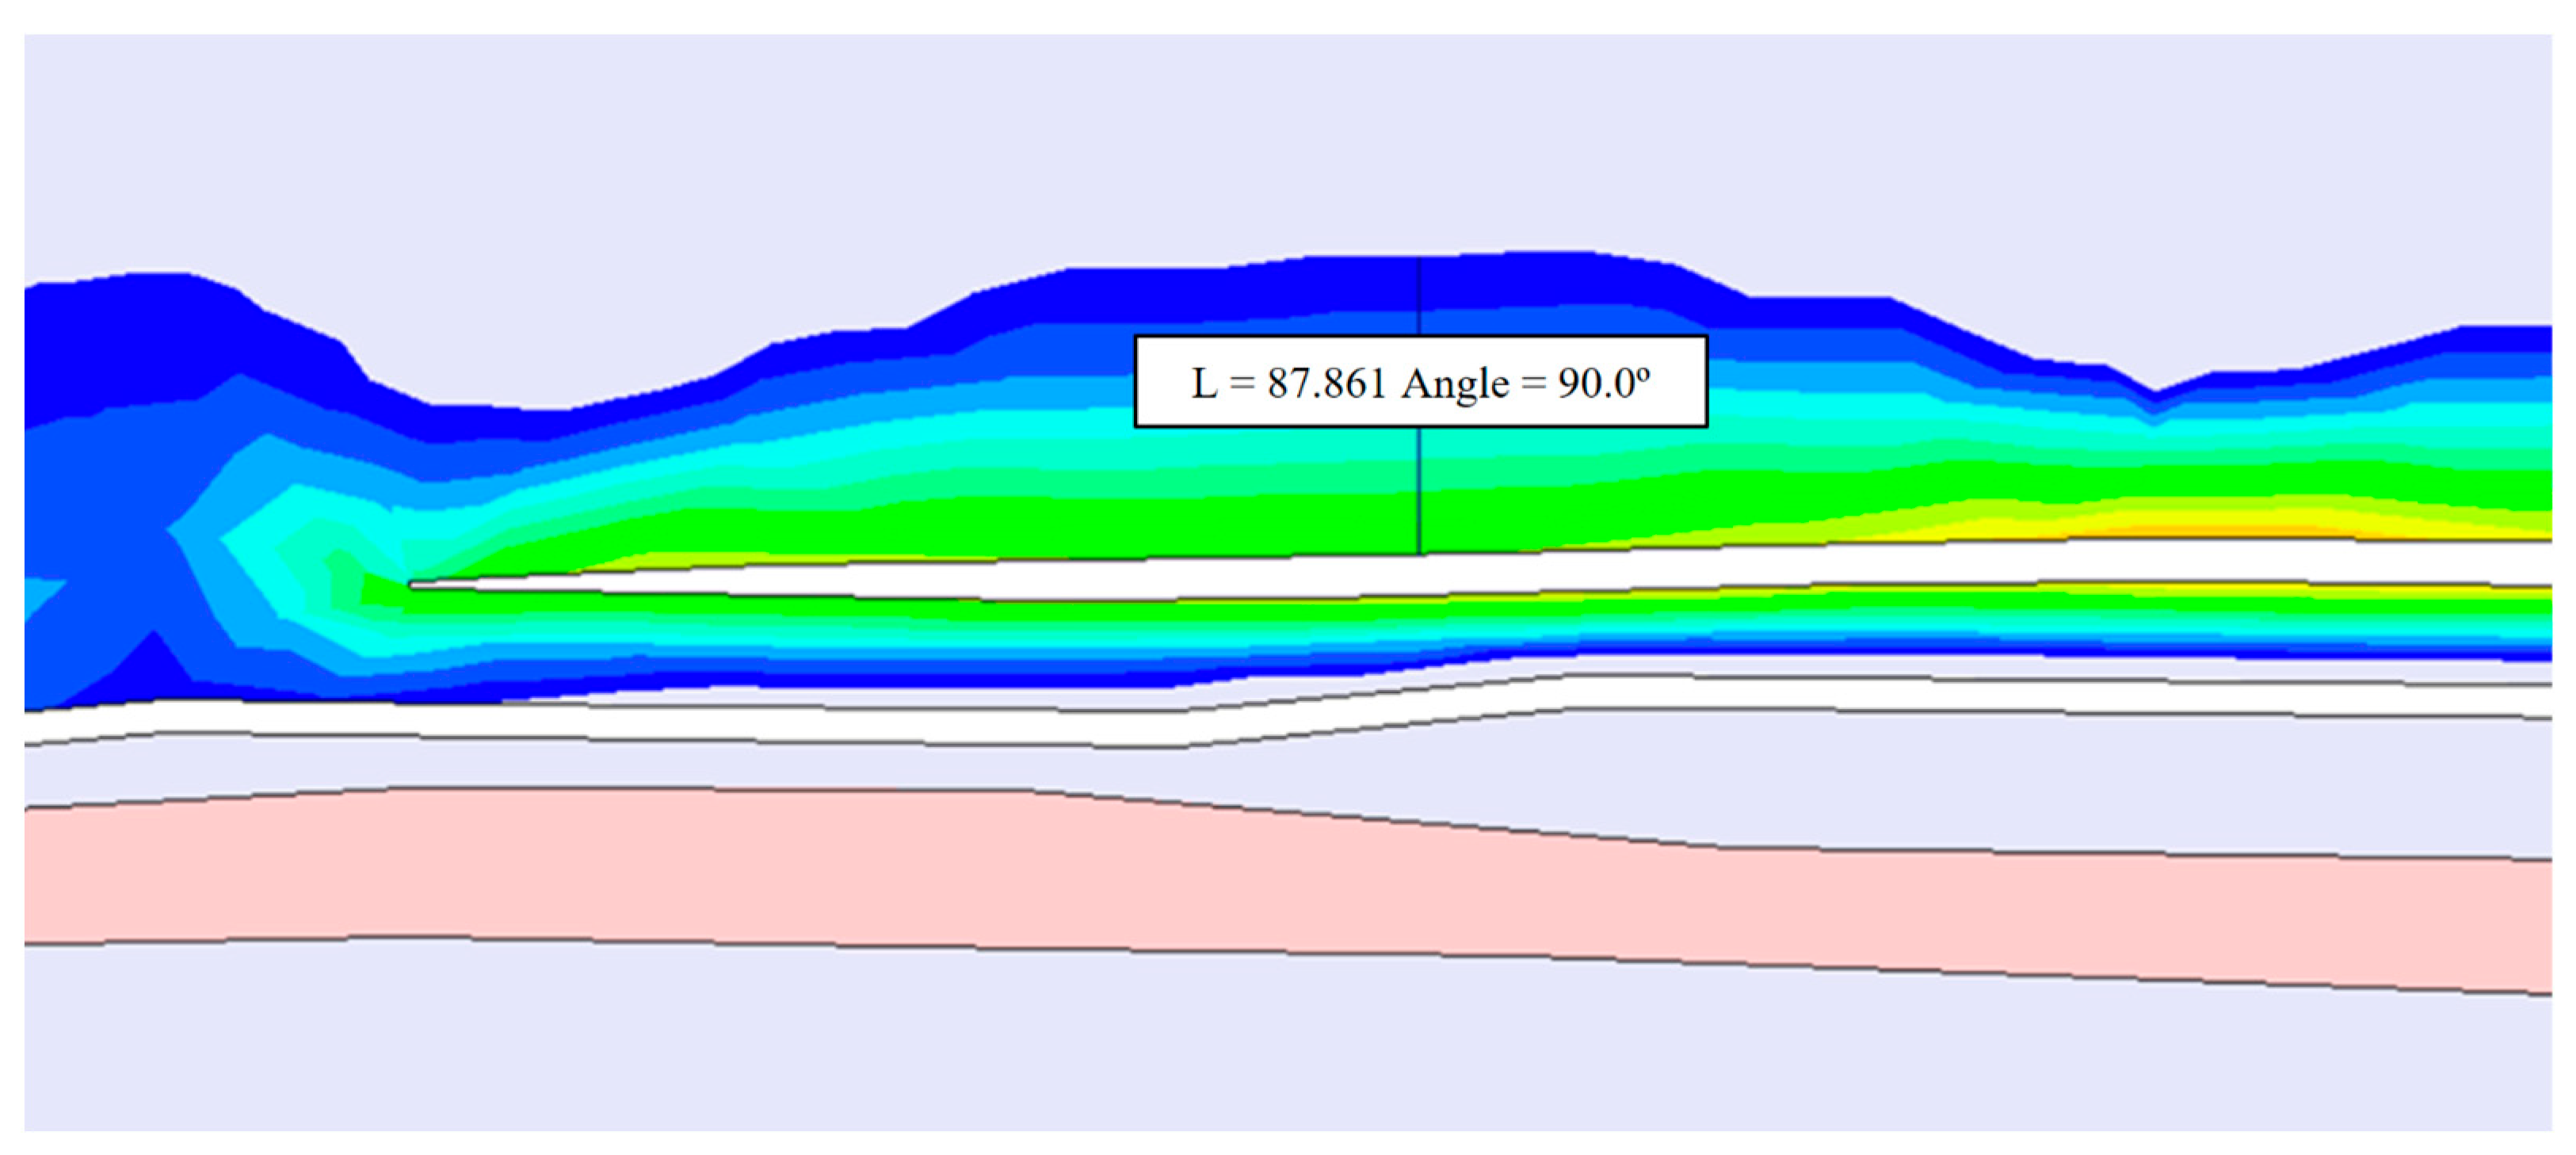
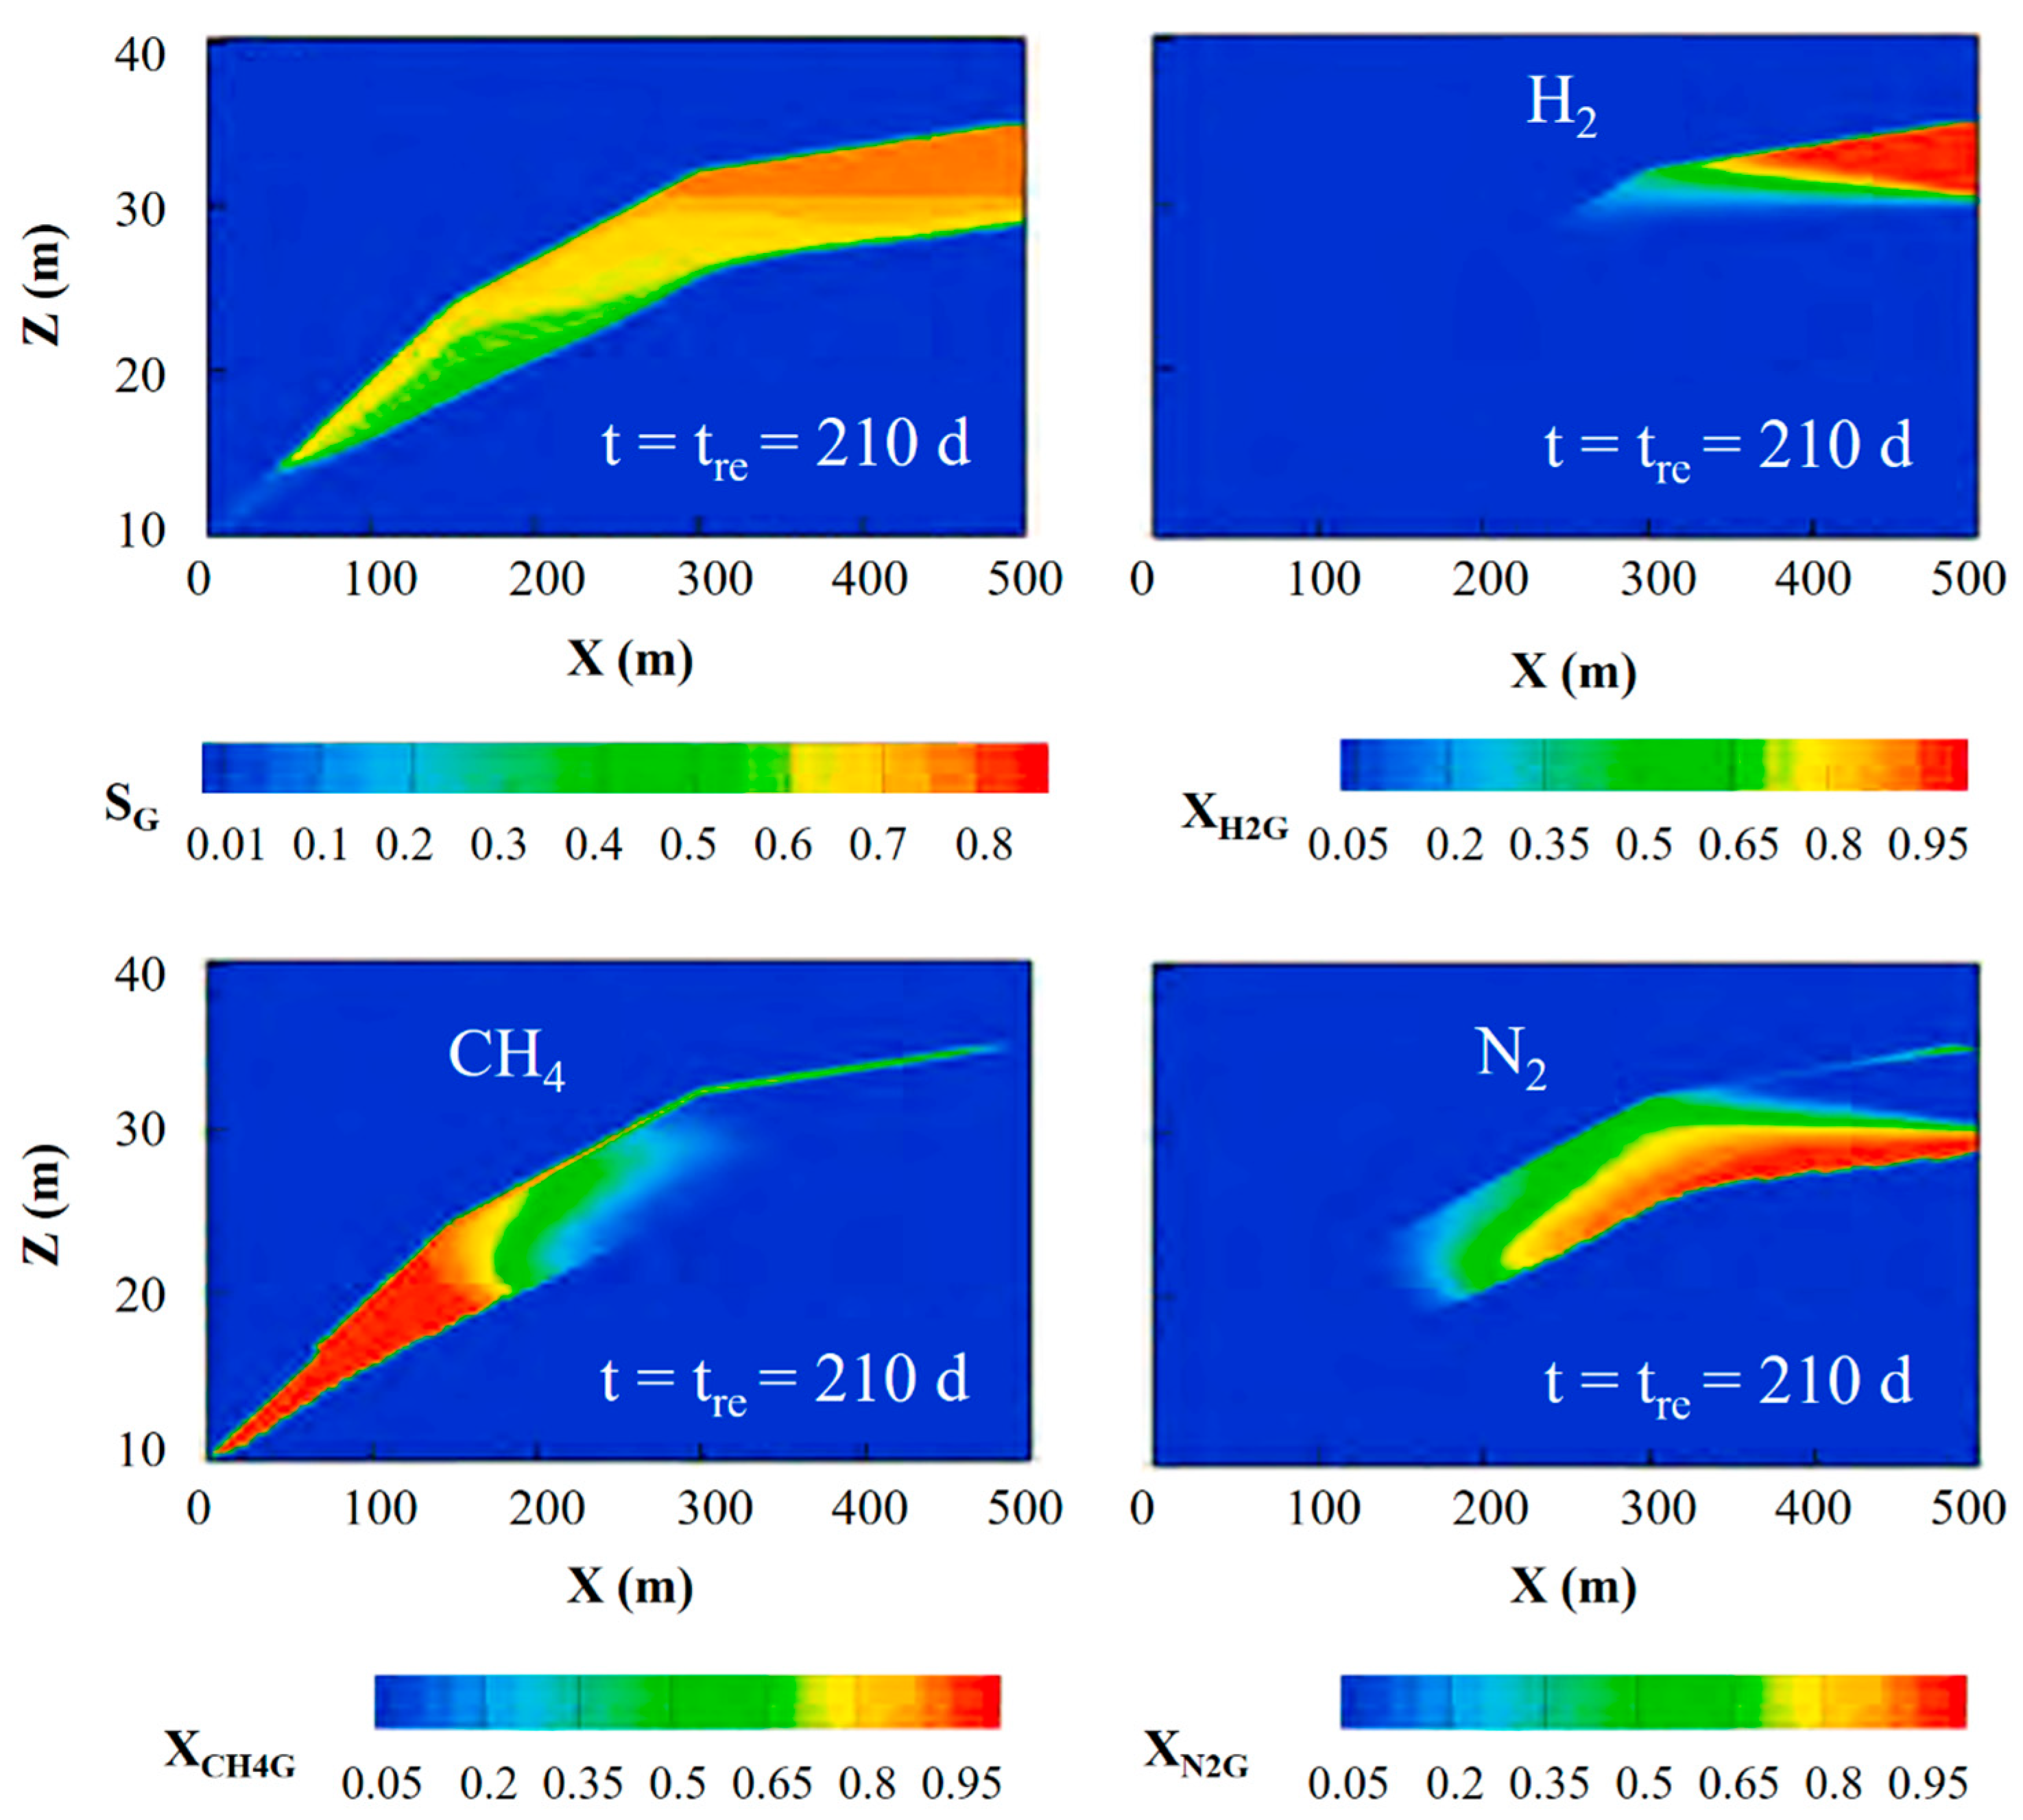
2.1.3. Hydrogen Storage

One of the main challenges of using green hydrogen as an energy source is its storage capacity and the process required to achieve this efficiently. Although hydrogen has many advantages as an alternative to fossil fuels, such as the absence of carbon dioxide emissions, its implementation has been limited by several factors [30]. One of the most important problems is the high cost of production compared to traditional fuels [31]. However, with the rising price of fossil fuels and the improved efficiency of electrolysers, the key equipment for hydrogen production, the economic viability of green hydrogen has increased considerably.
In this context, the UNDERGY project, in which the research team is participating, has identified several key points for the adoption of green hydrogen as a sustainable energy source in Spain. Firstly, there are surpluses of renewable energy that need to be harnessed, and hydrogen may be a suitable candidate to be explored [32]. Secondly, it has been shown that it is possible to identify suitable geographical areas for hydrogen storage using existing infrastructure or facilities that also generate renewable energy above ground. Finally, by combining hydrogen generation and storage in these areas, it is possible to move towards energy independence in Europe, reducing dependence on fossil fuels. Figure 3 shows the flowsheet developed by the UNDERGY project team.
Despite the key points addressed above, hydrogen presents a major technical challenge: its ability to cause embrittlement of the materials used in storage and transport infrastructures, such as existing pipelines and wells [33]. The project has therefore investigated hydrogen-resistant materials and technologies to ensure their long-term viability. The project has carried out work on resistant pumps, valves, and pipelines and has explored the use of above-ground storage tanks for short-term storage.
In addition to meeting long-term energy needs, the project explored the possibility of seasonal hydrogen storage in large underground reservoirs. The case study was a depleted natural gas field converted into a hydrogen storage facility. The storage capacity, together with its geochemical and geomechanical stability, was analysed by means of advanced simulations with the FLAC3D and TOUGH+ programmes, which allow the behaviour of hydrogen under these extreme conditions to be accurately modelled, as shown in the figures in the results section.
As for the operating pressures, based on previous experience with the reservoir, it has been established that the reservoir is capable of withstanding pressures of between 18 and 86 bar, respectively. To fill the 130 million cubic metres of reservoir capacity, it has been proposed to take advantage of the months with the greatest surplus of renewable energy, for example, from March to September (tre = 210 days), where photovoltaic and wind energy production is greatest. In this way, during the winter months, when energy demand is highest and natural gas prices rise, it will be possible to extract the stored hydrogen to meet market needs.
Finally, to calculate the volume of hydrogen storage potential, depleted gas deposits, aquifers, and salt caverns were considered. The hydrogen storage capacity for depleted gas deposits was obtained from [34]; for aquifers, it is obtained from the results of the project Hystories [35]; and for hydrogen stored in salt caverns formed in diapirs, data of diapirs in Spain were obtained from Instituto Geológico y Minero de España (IGME) [36].
To transform the storage volume into energy capacity, the following conditions are considered:
  • For depleted hydrocarbon deposits and aquifers, the density of hydrogen is considered at the lithostatic pressure. The lithostatic pressure is dependent on the depth, as 10 MPa/km [37]. According to data obtained for different storages, the density of hydrogen for depleted hydrocarbon deposits is 16 kg/m3 (considering an average depth of 2.2 km), and for aquifers, it is 6.56 kg/m3 (considering an average depth of 800 m). The low heating value (LHV) for hydrogen is 120 MJ/kg [38].
  • For salt caverns formed in diapirs, the energy density is considered to be 280 kWh/m3 [39], and for caves of 500,000 m3 [39]. In Appendix A, there is a detailed table of caverns considered.
  • The potential of hydrogen would represent only the operational volume of the storage, not the total volume. The operation volume is considered as 60% of the total volume [40].
In summary, to calculate the potential hydrogen storage for depleted hydrocarbon deposits and aquifers, Equation (3) below was used:
H y d r o g e n s t o r e d G W h m 3 = L H V G W h k g × u n d e r g r o u d d e n s i t y k g m 3

3. Results and Discussion

This section discusses the results obtained from the three projects, namely: LIFE Smart Agromobility, Smart Met Value, and Undergy, which are related to the production of biomethane and hydrogen and the storage of hydrogen, respectively. In addition, the potential for their replication across Spain is highlighted.

3.1. Potential Replication of Biomethane Production from Pig Manure

Results of LIFE Smart Agromobility show that 1 kg of manure produces 2.79 litres of biomethane in the psychrophilic range (0–35 °C) with a Wobbe Index of 45.5 MJ/m3. This results in a production of 35.2 Wh per kg of manure. This project manages 1300 tonnes of manure, so there is a total production of 45.8 MWh per year [19].
This biomethane allows for covering 89,014 km/yr. This value was calculated by comparing diesel consumption with biomethane. Diesel consumption is around 5 litres per 100 km [41], and the low heating value of diesel is 10.28 kWh/L [42]. The calculated Wobbe index of biomethane of 45.5 MJ/m3 resulted in the equivalence of 1.23 litres of diesel to 1 m3 of biomethane. Considering that a car travels an average of 14,627 km annually [43,44], it can be calculated that a car requires 595.5 m3 of biomethane annually. The plant produces 302 m3/month, which results in 89,014 km/year. This represents the annual distance travelled by six light-duty vehicles.
During the production of biomethane, 0.11 kWh of electricity is consumed by pumps and the compressor to produce 1 MJ of biomethane, resulting in emissions of 31 g of CO2-eq per MJ of biomethane [45]. However, the CO2 removed from biogas is not taken into account because it is considered as biogenic CO2, according to the Environmental Footprint v3.1 methodology, supported by the European Union [46]. The amount of CO2-eq per MJ complies with European Regulation 2015/1513, which mandates that fuels must achieve at least a 60% reduction in emissions compared to the reference fuel to be considered sustainable [47]. The reference fuel emissions are defined as 94 g CO2-eq/MJ in European Regulation 2023/1185 [48]. This implies a reduction of 76%; therefore, this fuel could be considered sustainable.
To estimate the biomethane production potential, primary data of LIFE Smart Agromobility was used, considering a mesophilic range (35 °C), as explained in Section 2.1.1. Furthermore, data from the Agricultural Census of the Spanish National Institute of Statistics was used to obtain the number of heads.
Results of the potential from pig manure per province in Spain are shown in Figure 4, and in Appendix B, there is a detailed table of the potential of each province. Results indicate that Spain has 4.85 TWh/year of biomethane potential, most of it concentrated in the North-East of Spain in Catalonia (1346.82 GWh/year) and Aragon (642.84 GWh/year), and other regions stand out as well, such as Toledo (304.47 GWh/year) or Murcia (410.18 GWh/year). These results are in line with those of Scarlat et al. [49], who found that most Spanish potential was concentrated in the North-East.

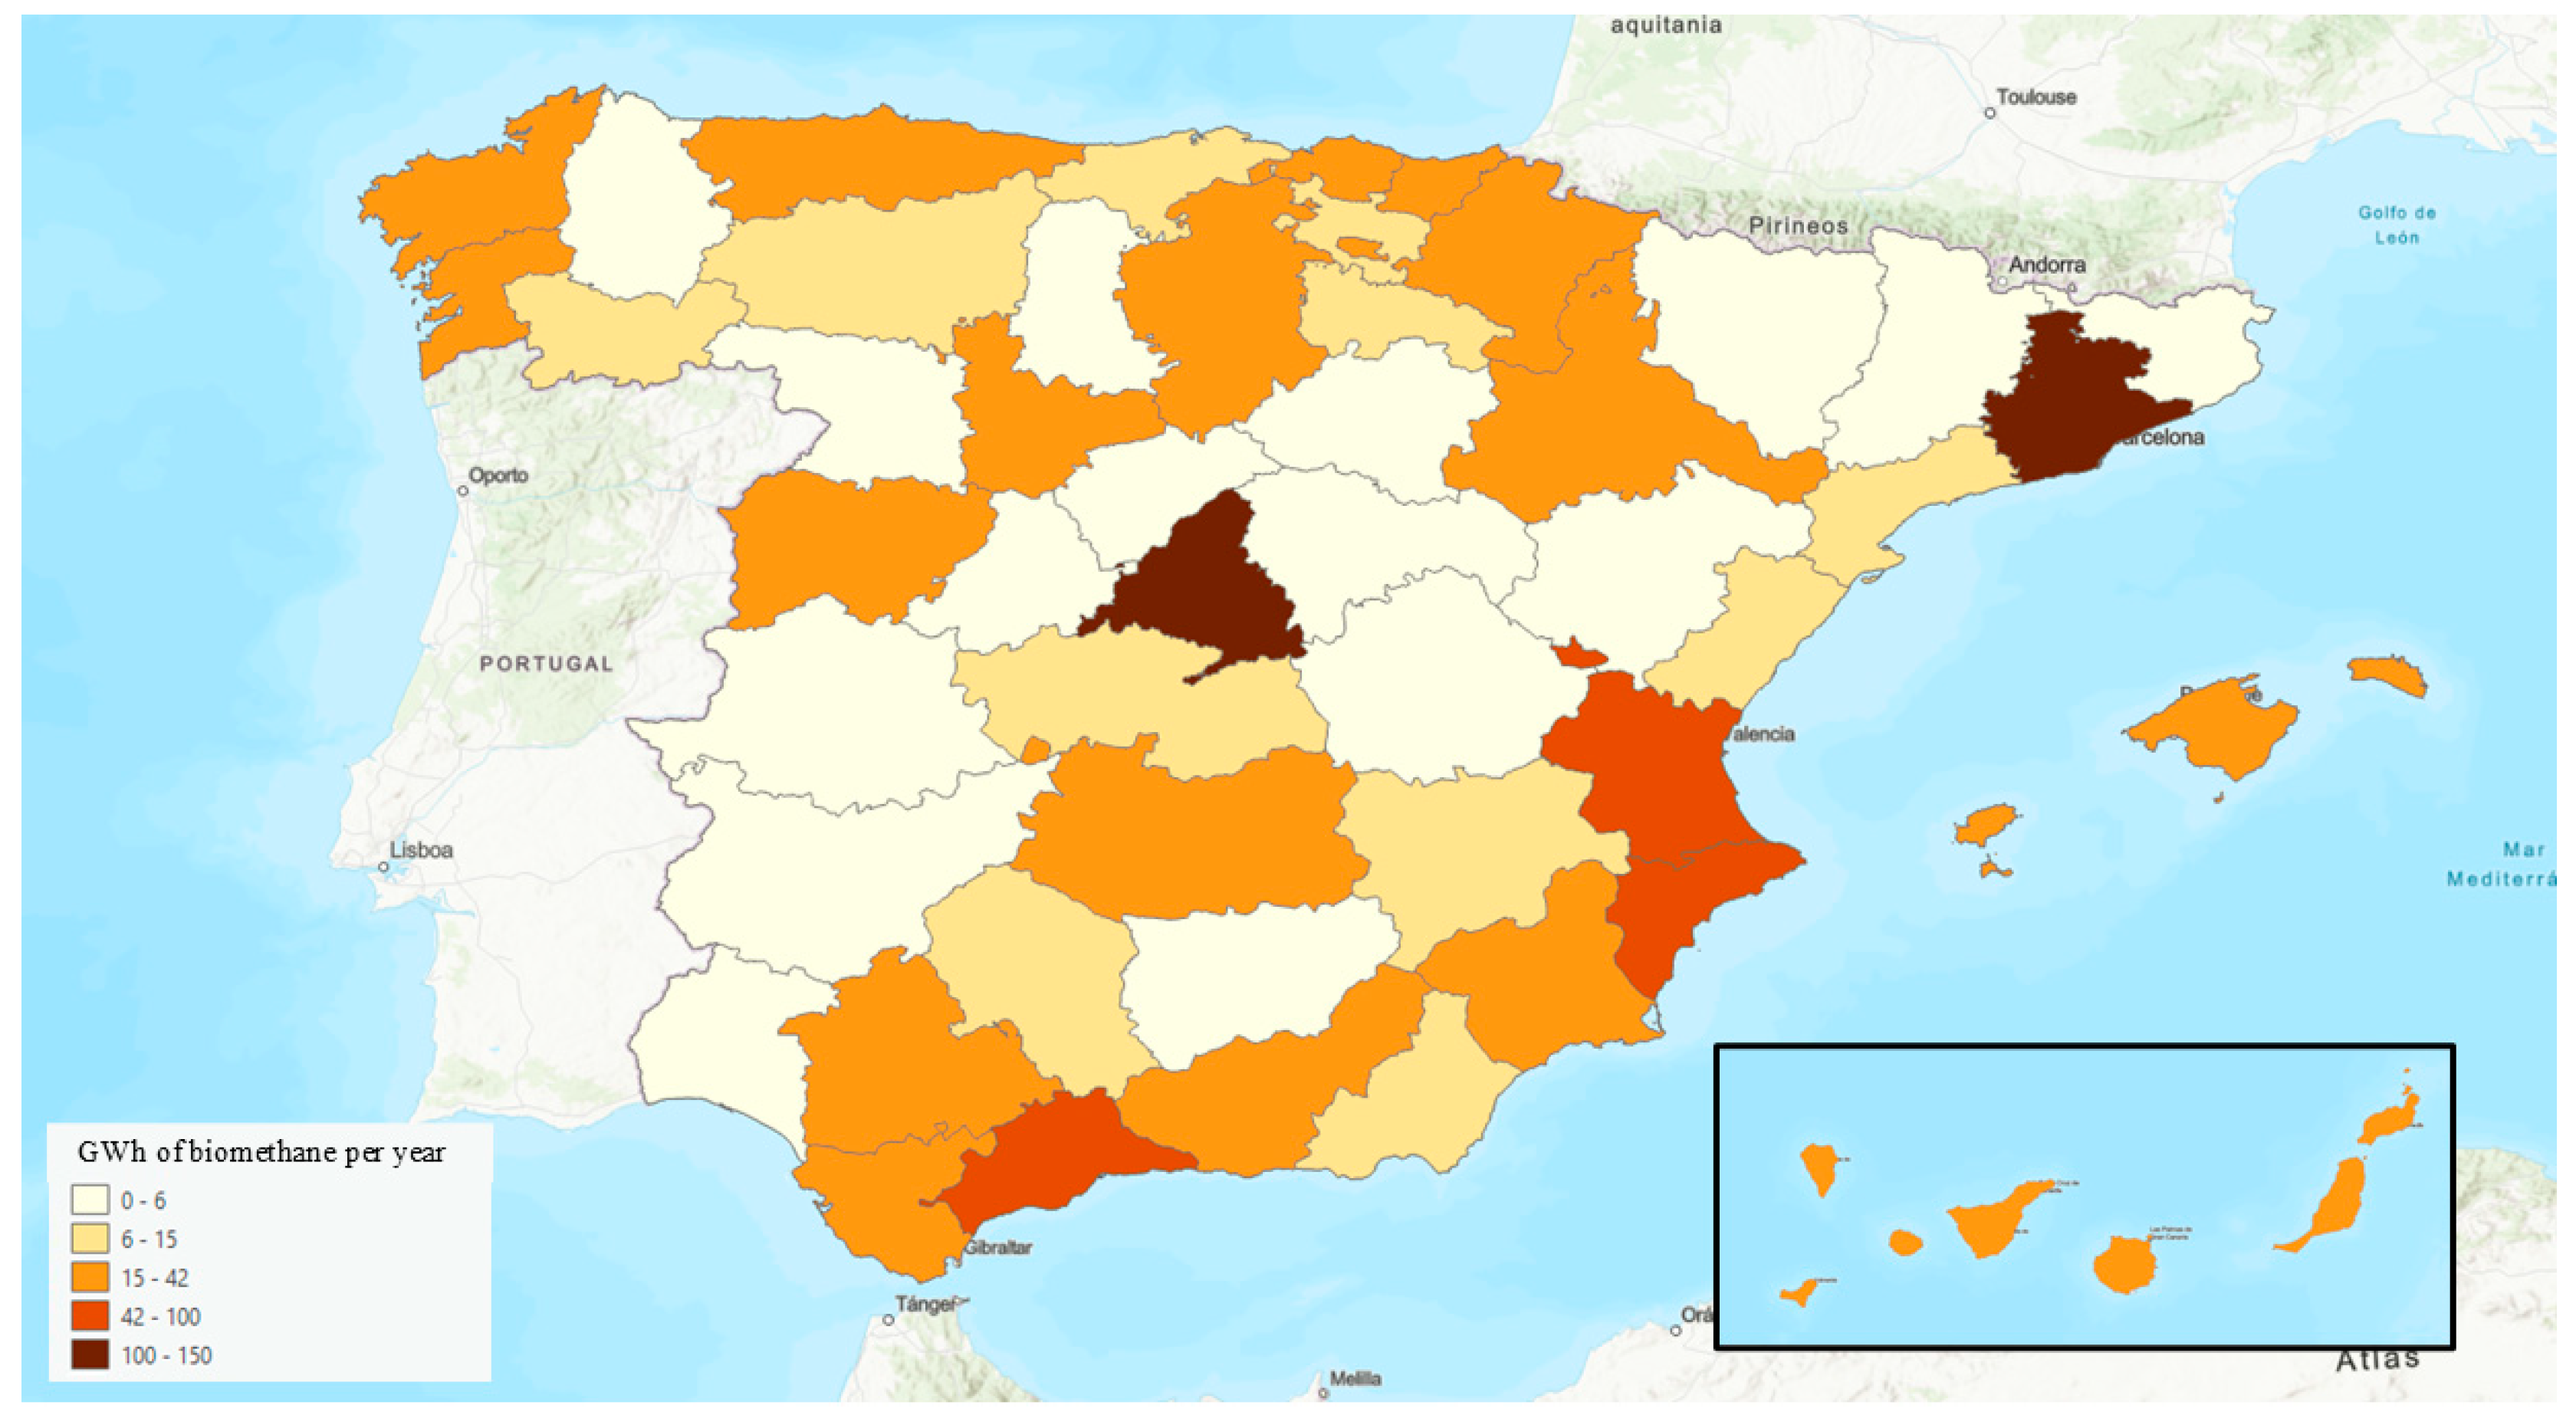
3.2. Potential Replication of Biomethane Production from WWTP

The results of the Smart Met Value project were very positive. A traditional WWTP was transformed into a gas plant capable of supplying biomethane to vehicles in the city of Guadalajara (Spain) [20]. In this city, with more than 93,000 inhabitants and a WWTP capable of treating 45,000 m3 of sewage per day, 285 kg of biomethane per day have been produced. Considering that a waste collection truck consumes 27.22 kg of natural gas per 100 km travelled, biomethane production could be sufficient to supply a fleet of seven trucks travelling 150 km per day.
These results demonstrate that the transformation of sewage sludge into biofuel is not only feasible but can also be applied in any WWTP in the world, allowing cities to reduce their dependence on fossil fuels and improve their energy efficiency in a sustainable manner.
Based on the data obtained in the project, the replication potential of the project has been estimated on a national scale, as explained in Section 2.1.2. It is estimated that Spain has a total potential of 1.026 TWh per year of biomethane potential from WWTP, with significant concentration in the main metropolitan areas. Figure 5 shows the estimated potential biomethane production of WWTPs by province, and a detailed table with the data by province is included in Appendix B. The largest cities, such as Madrid (139.1 GWh/year), Barcelona (139.08 GWh/year), and Valencia (91.77 GWh/year), concentrate most of this potential due to the high volume of treated sewage, in contrast to less populated provinces such as Teruel or Soria. These results are in line with the estimates given in the Sedigas report related to the potential biomethane production in Spain [24].

3.3. Potential Replication of Hydrogen Storage

Following the principles set out in Section 2.1.3 and in order to simulate the geological hydrogen storage process in the reservoir under study, the UNDERGY project obtained interesting results.
Firstly, the geomechanical simulations, represented in Figure 6, demonstrated that the reservoir is stable up to pressures of 95 bar, with a sufficient safety margin, as the operating range will be below 90 bar, as required by regulations.
In addition, the geochemical simulations, represented in Figure 7, showed that the different gases present (hydrogen, methane, and nitrogen) would behave in a practically immiscible manner, with hydrogen located at the top of the reservoir, ensuring efficient recovery.
As for the characteristics of the reservoir, in the case study of the project, the rock material is porous sandstone, which, although slightly carbonated, is free from problematic compounds such as sulphur or cyanobacteria, making it ideal for hydrogen storage. The sealing material is a highly impermeable and non-reactive marl, which ensures that gas does not escape from the reservoir, creating the perfect conditions for safe long-term storage.
As discussed above, the reservoir gas behaviour modelled in the simulations shows that hydrogen is positioned at the top of the reservoir, whereas pre-existing gases, such as methane and nitrogen, act as cushion gases that move to the lower layers of the reservoir. This immiscible behaviour of gases ensures efficient separation and precise control over the amount of hydrogen stored.
In addition, the simulation of the aqueous phase of the brine at the bottom of the reservoir, also carried out in the framework of the UNDERGY project, indicated that there is no evidence of halite precipitation, which is relevant to avoid the reduction of sandstone porosity and permeability, two essential factors to maintain storage efficiency.
In summary, the project has demonstrated the feasibility of storing hydrogen in geological reservoirs, such as old natural gas fields, with the possibility of harnessing surplus renewable energy to produce hydrogen and store it on a large scale, providing Europe with a sustainable and efficient solution for its energy transition.
Furthermore, following the methodology described in Section 2.1.3, Spain’s potential for Underground Hydrogen Storage (UHS) across three main geological formations was analysed. The application of the calculation methods, considering lithostatic pressure and operational volume explained in Section 2.1.3, was used to estimate the potential storage capacity in Spain. Figure 8 shows the total potential storage estimated, taking into account all geological formations, and in Appendix C, the storage per type of geological formation and province is shown. Results show a total potential of hydrogen storage is 2865 TWh.
Depleted hydrocarbon reservoirs dominate this capacity landscape, accounting for 1864 TWh (65.1% of the overall potential). This significant capability is geographically concentrated, with just three provinces hosting the major installations. The Gaviota facility in Bizkaia stands as the cornerstone of Spain’s UHS infrastructure, with a capacity of 857.9 TWh (46% of the total from depleted reservoirs). The remaining capacity flows through installations in Guadalajara (Yela, 640 TWh), Huesca (Serrapablo, 320 TWh), and Huelva (Marismas, 47 TWh).
While depleted reservoirs offer concentrated storage potential, aquifers present a more distributed alternative, contributing 999 TWh (34.9% of the total capacity). In stark contrast to the concentrated nature of depleted reservoirs, this aquifer storage potential spreads across 29 provinces throughout the country. Cuenca emerges as the leader with 255.8 TWh, followed by Alicante (97 TWh), Toledo (66.9 TWh), Teruel (57.7 TWh), and Guadalajara (53.8 TWh). Notably, these findings are in line with the EU Geocapacity Project’s evaluation of potential CO2 storage in Spain [37], which similarly identified the central Iberian Peninsula as a region of exceptional storage potential.
Complementing these primary storage options, salt caverns formed in diapirs contribute the smallest yet strategically valuable share to Spain’s UHS portfolio. Despite providing only 756 GWh (0.026% of total capacity), these formations offer unique technological advantages for hydrogen cycling operations that the other formations cannot match. The distribution analysis further reveals geographic concentration, with 44.4% of the country’s salt cavern capacity located in Navarra, creating a potential regional hub for this specialised storage technology.

3.4. End-Use Applications for Biomethane and Hydrogen

The analysis of biomethane potential (4.85 TWh/year from pig manure and 1.54 TWh/year from WWTPs) reveals significant opportunities for multiple applications. When examining the transport sector specifically, the data indicate that the biomethane purity levels achieved in both the LIFE Smart Agromobility project (90–95%) and Smart Met Value project (>95%) exceed the minimum requirements for vehicle fuel applications. These purities are aligned with Spanish regulations, which require that biomethane should have at least 90% methane content [50] and a maximum of 1% oxygen [51] to enable its direct utilisation in heavy and light-duty vehicles.
The results from pig manure processing demonstrated that a facility managing 1500 tonnes of manure could produce 41.1 MWh annually, sufficient to power six light-duty vehicles travelling approximately 14,627 km each per year. Similarly, the analysis of WWTP showed that a facility serving 93,000 inhabitants could produce 285 kg of biomethane daily, enough for seven collection trucks and two maintenance vehicles. These suggest that biomethane offers a viable technical solution for vehicle fleets with predictable routes and centralised refuelling infrastructure.
While the technical analysis confirms biomethane’s suitability for transport applications, the economic assessment indicates challenges for grid injection applications. This explains why, despite the substantial technical potential this study has identified across Spain, direct vehicle applications currently represent more economically viable pathways than grid injection.
When comparing biomethane and hydrogen applications based on our findings, several patterns emerged. The identified hydrogen storage capacity (2865 TWh) significantly exceeds the annual biomethane production potential (6.39 TWh/year), suggesting different but complementary roles in the energy transition. While biomethane production shows relatively consistent year-round availability, as confirmed in the project measurements, hydrogen storage offers seasonal flexibility that addresses intermittency challenges.
The analysis of hydrogen storage distribution across Spain reveals interesting geographical patterns that influence potential applications. The concentration of depleted hydrocarbon reservoirs in three provinces (Bizkaia, Guadalajara, and Huesca) suggests that large-scale industrial applications would be most practical in these regions. When compared with industrial hydrogen demand patterns, these locations align with existing chemical and refining sectors that require hydrogen for ammonia and methanol production.
Conversely, the widespread distribution of aquifer storage capacity across 29 provinces matches more closely with distributed power generation needs. The data support the technical feasibility of hydrogen blending with natural gas [52,53] to serve these geographically dispersed demands. The relatively small but technologically advantageous salt cavern capacity (756 GWh) offers rapid cycling capabilities that, according to the analysis, would be particularly valuable for power generation applications through gas turbines [54,55] and microturbines [56], especially in the Navarra region, where 44.4% of this capacity is located.

4. Conclusions

The three case studies presented—LIFE Smart Agromobility, Smart Met Value, and UNDERGY—demonstrate that waste recovery and renewable energy integration are not only technically feasible but also scalable and high-impact strategies to advance the energy transition in Spain. Each project validates a different, albeit complementary, pathway: the local production of biomethane from agricultural and urban waste and the seasonal storage of surplus renewable energy in the form of hydrogen.
Specifically, LIFE Smart Agromobility demonstrated that a single livestock facility processing 1300 tonnes of pig manure per year can generate 42.2 MWh of biomethane, equivalent to 89,000 km of vehicle travel per year. The Smart Met Value project demonstrated that a wastewater treatment plant serving 93,000 inhabitants can produce 285 kg/day of biomethane, enough for seven rubbish trucks travelling 150 km per day. In both cases, high levels of biomethane purity (>90%) were demonstrated that meet vehicle fuel standards, making these systems economically viable for fleet applications.
Similarly, the UNDERGY project confirmed the technical feasibility of underground hydrogen storage from depleted natural gas fields. With a national storage potential of up to 2865 TWh, Spain has one of the largest capacities in Europe, enabling large-scale seasonal storage and helping to stabilise intermittent renewable generation. Advanced geomechanical and geochemical simulations validated the integrity and long-term security of these storage formations.
From a future perspective, the combined potential of biomethane from pig manure and WWTPs in Spain exceeds 6.39 TWh/year, enough to power thousands of vehicles or replace a significant fraction of fossil heat demand in residential and industrial settings. At the same time, the enormous storage potential of hydrogen lies at the foundation of a hybrid energy system capable of balancing daily and seasonal fluctuations in renewable energy supply.
Scaling up these models on a national scale would require targeted investments, political support for biomethane injection and hydrogen infrastructure, and incentives to integrate circular economy principles into local and regional planning. However, the basic technologies have already been validated. These projects offer applicable models that could be replicated to accelerate Europe’s path towards climate neutrality, energy independence, and local economic revitalisation.

Author Contributions

Conceptualisation, J.P.d.l.F.; methodology, E.G.-F.; software, M.-P.M.-H. and J.P.C.; validation, M.F.O. and R.P.; formal analysis, R.P. and J.P.C.; investigation, E.G.-F.; data curation, M.-P.M.-H.; writing—original draft preparation, J.P.d.l.F., R.P., M.-P.M.-H., E.G.-F.; writing—review and editing, J.P.C., M.F.O.; visualisation, J.P.C. and M.-P.M.-H.; supervision, M.F.O.; project administration, M.F.O. and J.P.d.l.F.; funding acquisition, M.F.O. and J.P.d.l.F. All authors have read and agreed to the published version of the manuscript.

Funding

This research was funded by the European Commision, LIFE Smart Agromobility (LIFE19 CCM ES 515001206) founded by the LIFE program; by the Spanish Ministry of Science and Innovation AND the Next Generation EU Fund, Undergy (Ref. MIG-20211018) founded by the ‘Programa Misiones CDTI 2021’.

Institutional Review Board Statement

Not applicable.

Informed Consent Statement

Not applicable.

Data Availability Statement

The original contributions presented in this study are included in the article. Further inquiries can be directed to the corresponding author.

Acknowledgments

The authors are grateful to SPANISH “MINISTERIO DE UNIVERSIDADES” for the grants FPU22/00900 and FPU19/06577.

Conflicts of Interest

The authors declare no conflicts of interest.

Abbreviations

The following abbreviations are used in this manuscript:
GHGGreenhouse gas
UHSUnderground Hydrogen Storage
LHVLow Heating Value
VSVolatile Solids
WWTPsWastewater treatment plants

Appendix A

Table A1. Salt diapirs in Spain [36].
NameProvinceVolume (m3)
Poza de la SalBurgos500,000
LorcaNavarra500,000
ArtetaNavarra500,000
Salinas de Oro y falla de EtxauriNavarra500,000
EstellaNavarra500,000
MadaxAlbacete500,000
Contacto mecánico entre el diapiro triásico y la serie miocena en El Cenajo.Albacete500,000
RosaMurcia500,000
MorrónMurcia500,000
PinosoAlicante500,000
Only diapirs with a minimum depth of 100 m are considered, and their volume is assumed to be constant according to [39].

Appendix B

Appendix B.1

Table A2. Potential of biomethane production from pig manure.
ProvinceSwine Heads [26] Outdoor Temperature (°C) [57]Boiler Percentagem3 of Biomethane per YearGWh of Biomethane per Year
Almería463,3752128%6,193,77183.02
Cádiz80,2882028%1,067,33514.31
Córdoba293,1952029%3,865,66151.81
Granada271,8411734%3,316,89044.46
Huelva232,4672029%3,056,52240.97
Jaén126,9821931%1,627,97621.82
Málaga398,2802127%5,352,67071.74
Sevilla680,2811930%8,795,862117.89
Huesca1,858,2931637%21,523,942288.49
Teruel609,9171441%6,620,32988.73
Zaragoza1,648,8481735%19,818,397265.63
Asturias73191440%81,3091.09
Illes Balears85,7391931%1,092,97614.65
Las Palmas15,2652323%217,3802.91
Santa Cruz de Tenerife22,6662323%321,9494.32
Cantabria20821637%24,2670.33
Ávila246,3741244%2,557,65034.28
Burgos509,8741343%5,330,21571.44
León139,2991342%1,496,80320.06
Palencia136,2241441%1,488,56019.95
Salamanca662,6761440%7,289,50897.70
Segovia1,281,5741441%13,864,154185.82
Soria558,4761343%5,858,63378.52
Valladolid409,2841342%4,397,85958.94
Zamora481,2341440%5,346,18971.65
Albacete407,1591538%4,686,32962.81
Ciudad Real79,2431636%938,03912.57
Cuenca395,1321441%4,288,95157.48
Guadalajara19,0151637%221,6292.97
Toledo1,884,2571735%22,716,508304.47
Barcelona1,922,6731932%24,299,669325.69
Girona1,006,3411735%12,169,036163.10
Lleida4,665,6261734%56,588,287758.45
Tarragona598,1561833%7,429,11799.57
Alacant/Alicante58,0292028%767,20210.28
Castelló/Castellón758,1601930%9,775,215131.02
València/Valencia565,5941931%7,210,02796.64
Badajoz1,478,7351931%18,904,319253.37
Cáceres203,3501832%2,555,22834.25
A Coruña316,3841637%3,699,12049.58
Lugo254,7771440%2,802,57537.56
Ourense434,9431637%5,069,46067.95
Pontevedra402,7131735%4,811,10164.48
Madrid19,2901637%223,4292.99
Murcia2,366,9281930%30,603,784410.18
Navarra827,5301440%9,193,307123.22
Araba/Álava20,8221441%226,7703.04
Bizkaia29841538%34,3450.46
Gipuzkoa58581538%67,2110.90
La Rioja175,6621538%2,015,44327.01

Appendix B.2

Figure A1. Map of WWTP in Spain.
Applsci 15 07514 g0a1
Table A3. Potential of biomethane production from WWTP.
ProvinceWWTP Equivalent Habitants [29]m3 of Biomethane per YearGWh of Biomethane per Year
Las Palmas1,502,7292,597,51234.81
Santa Cruz de Tenerife1,111,2641,920,85325.75
Araba/Álava467,864808,71710.84
Albacete673,9891,165,01015.61
Alacant/Alicante3,904,6146,749,24290.46
Almería702,8171,214,84016.28
Ávila505,487873,74911.71
Badajoz1,015,1011,754,63223.52
Illes Balears2,001,3823,459,44946.37
Barcelona7,019,38012,133,208162.62
Burgos1,034,1291,787,52323.96
Cáceres589,4421,018,86813.66
Cádiz2,744,8291,587,95636.79
Castelló/Castellón990,3261,711,80822.94
Ciudad Real1,217,7632,104,94028.21
Córdoba947,1621,637,19821.94
A Coruña1,431,6092,474,57933.17
Cuenca308,873533,8967.16
Girona750,5211,297,29817.39
Granada947,3941,637,59921.95
Guadalajara291,376503,6526.75
Gipuzkoa1,129,1531,951,77526.16
Huelva719,9371,244,43316.68
Huesca355,530614,5448.24
Jaén573,795991,82213.29
León672,4401,162,33315.58
Lleida311,168537,8637.21
La Rioja456,492789,06010.58
Lugo296,730512,9076.87
Madrid6,883,56811,898,453159.47
Málaga2,206,2143,813,50751.11
Murcia2,435,9984,210,69556.44
Navarra1,264,9192,186,45029.30
Ourense494,431854,63911.45
Asturias1,377,1942,380,52131.91
Palencia336,645581,9017.80
Pontevedra1,607,4712,778,56237.24
Salamanca818,9801,415,63118.97
Cantabria656,3481,134,51715.21
Segovia261,660452,2876.06
Sevilla2,424,4134,190,67056.17
Soria167,044288,7413.87
Tarragona734,1791,269,05017.01
Teruel190,909329,9924.42
Toledo1,251,2192,162,76928.99
València/Valencia5,280,8249,128,062122.34
Valladolid1,009,0071,744,09923.38
Bizkaia1,570,2922,714,29736.38
Zamora205,368354,9854.76
Zaragoza1,771,9393,062,84941.05
Ceuta114,595198,0812.65
Melilla100,000172,8532.32

Appendix C

Table A4. Potential of underground hydrogen storage.
Aquifers (GWh)Depleted Gas Deposits (GWh)Salt Caverns (GWh)
A Coruña000
Alacant/Alicante97,08800
Albacete52480168
Almería000
Araba/Álava000
Asturias000
Ávila000
Badajoz000
Barcelona000
Bizkaia0857,9200
Burgos31,488084
Cáceres000
Cádiz131200
Cantabria39,36000
Castelló/Castellón131200
Ceuta000
Ciudad Real000
Córdoba393600
Cuenca255,84000
Gipuzkoa000
Girona000
Granada787200
Guadalajara53,792640,0000
Huelva11,80847,0400
Huesca37,248320,0000
Illes Balears000
Jaén38,04800
La Rioja23,61600
Las Palmas000
León11,80800
Lleida31,48800
Lugo000
Madrid31,48800
Málaga000
Melilla000
Murcia47,2320168
Navarra52,4800336
Ourense000
Palencia000
Pontevedra000
Salamanca000
Santa Cruz de Tenerife000
Segovia000
Sevilla000
Soria11,80800
Tarragona10,49600
Teruel57,72800
Toledo66,91200
València/Valencia000
Valladolid49,85600
Zamora000
Zaragoza19,68000

References

  1. Red Eléctrica de España. Evolution of Renewable and Non-Renewable Generation (%), Electricity System; Red Eléctrica de España: Madrid, Spain, 2025. [Google Scholar]
  2. Gobierno de España. Spain’s Integrated National Energy and Climate Plan 2021–2030; Climate Change Laws of the World: London, UK, 2023.
  3. Gobierno de España. Energy Balance of Spain; Ministerio para la Transición Ecológica y el Reto Demográfico: Madrid, Spain, 2023.
  4. European Parliament, European Council. Directive (EU) 2023/2413 of the European Parliament and of the Council of 18 October 2023 Amending Directive (EU) 2018/2001, Regulation (EU) 2018/1999 and Directive 98/70/EC as Regards the Promotion of Energy from Renewable Sources, and Repealing Council Directive (EU) 2015/652; Official Journal of the European Union: Luxemburg, 2023. [Google Scholar]
  5. Gobierno de España. Biogas Roadmap; Ministerio para la Transición Ecológica y el Reto Demográfico: Madrid, Spain, 2022.
  6. García Álvaro, A.; Martínez-Hernando, M.-P.; García-Martínez, M.-J.; Ruiz Palomar, C.; Suárez Rodríguez, M.d.C.; Hermosilla, D.; Ortega, M.F.; de Godos Crespo, I. Life cycle assessment of swine manure management: A comparison of different management systems with Montecarlo simulation. J. Clean Prod. 2025, 502, 145368. [Google Scholar] [CrossRef]
  7. Ankathi, S.K.; Chaudhari, U.S.; Handler, R.M.; Shonnard, D.R. Sustainability of Biogas Production from Anaerobic Digestion of Food Waste and Animal Manure. Appl. Microbiol. 2024, 4, 418–438. [Google Scholar] [CrossRef]
  8. de Jong, W.; van Ommen, J.R. Biomass as a Sustainable Energy Source for the Future: Fundamentals of Conversion Processes; Wiley: Hoboken, NJ, USA, 2014; Available online: https://books.google.es/books?hl=en&lr=&id=wZWwBAAAQBAJ&oi=fnd&pg=PR13&dq=delft+biomass+wiebren+de+jong+book&ots=ioVSmYSqxD&sig=TUOn-fwY5g1HUi17QjFBr-Jeh1o&redir_esc=y#v=onepage&q=delft%20biomass%20wiebren%20de%20jong%20book&f=false (accessed on 11 February 2025).
  9. Oh, S.T.; Martin, A.D. Thermodynamic equilibrium model in anaerobic digestion process. Biochem. Eng. J. 2007, 34, 256–266. [Google Scholar] [CrossRef]
  10. Vu, H.P.; Nguyen, L.N.; Wang, Q.; Ngo, H.H.; Liu, Q.; Zhang, X.; Nghiem, L.D. Hydrogen sulphide management in anaerobic digestion: A critical review on input control, process regulation, and post-treatment. Bioresour. Technol. 2022, 346, 126634. [Google Scholar] [CrossRef]
  11. Eisted, R.; Larsen, A.W.; Christensen, T.H. Collection, transfer and transport of waste: Accounting of greenhouse gases and global warming contribution. Waste Manag. Res. 2009, 27, 738–745. [Google Scholar] [CrossRef]
  12. Ferdeș, M.; Paraschiv, G.; Ionescu, M.; Dincă, M.N.; Moiceanu, G.; Zăbavă, B.Ș. Anaerobic Co-Digestion: A Way to Potentiate the Synergistic Effect of Multiple Substrates and Microbial Diversity. Energies 2023, 16, 2116. [Google Scholar] [CrossRef]
  13. Blumenstein, B.; Siegmeier, T.; Bruckhaus, C.; Anspach, V.; Möller, D. Integrated Bioenergy and Food Production—A German Survey on Structure and Developments of Anaerobic Digestion in Organic Farming Systems. Sustainability 2015, 7, 10709–10732. [Google Scholar] [CrossRef]
  14. Mudhoo, A.; Kumar, S. Effects of heavy metals as stress factors on anaerobic digestion processes and biogas production from biomass. Int. J. Environ. Sci. Technol. 2013, 10, 1383–1398. [Google Scholar] [CrossRef]
  15. Peces, M.; Astals, S.; Mata-Alvarez, J. Assessing total and volatile solids in municipal solid waste samples. Environ. Technol. 2014, 35, 3041–3046. [Google Scholar] [CrossRef]
  16. Wang, W.; Lee, D.J. Valorization of anaerobic digestion digestate: A prospect review. Bioresour. Technol. 2021, 323, 124626. [Google Scholar] [CrossRef]
  17. Zhang, J.; Zhang, L.; Hu, S. Underground hydrogen storage in depleted gas fields: Progress, challenges, and outlook. J. Energy Storage 2024, 102, 113842. [Google Scholar] [CrossRef]
  18. Ozarslan, A. Large-scale hydrogen energy storage in salt caverns. Int. J. Hydrogen Energy 2012, 37, 14265–14277. [Google Scholar] [CrossRef]
  19. LIFE Smart Agromobility. 2019. Available online: https://webgate.ec.europa.eu/life/publicWebsite/project/LIFE19-CCM-ES-001206/processing-of-livestock-waste-for-the-production-of-biomethane-for-use-in-agricultural-vehicles-and-biofertilizers (accessed on 8 April 2025).
  20. Ayuntamiento de Guadalajara. I+D+i de protección Ambiental—Smart-Met-Value; Ayuntamiento de Guadalajara: Guadalajara, Spain, 2018.
  21. Underground Energy. UNDERGY Project. 2024. Available online: https://undergy.eu/en/project-summary-english-version (accessed on 8 April 2025).
  22. Ruiz Palomar, C.; García Álvaro, A.; Muñoz, R.; Repáraz, C.; Ortega, M.F.; de Godos, I. Pre-Commercial Demonstration of a Photosynthetic Upgrading Plant: Investment and Operating Cost Analysis. Processes 2024, 12, 2794. [Google Scholar] [CrossRef]
  23. Petersen, S.O.; Olsen, A.B.; Elsgaard, L.; Triolo, J.M.; Sommer, S.G. Estimation of methane emissions from slurry pits below pig and cattle confinements. PLoS ONE 2016, 11, e0160968. [Google Scholar] [CrossRef]
  24. Sedigas. A Study of the Capacity for Biomethane Production in Spain; Sedigas: Barcelona, Spain, 2023. [Google Scholar]
  25. García Álvaro, A.; Ruiz Palomar, C.; Valenzuela, E.I.; Hermosilla Redondo, D.; Muñoz Torre, R.; de Godos Crespo, I. Microbial analysis of anaerobic digester reveals prevalence of manure microbiota. J. Water Process Eng. 2024, 60, 105162. [Google Scholar] [CrossRef]
  26. Instituto Nacional de Estadística. Censo Agrario 2020. 2020. Available online: https://www.ine.es/jaxi/Datos.htm?tpx=51176 (accessed on 27 May 2024).
  27. Instituto Geográfico Nacional. Recintos Provinciales. 2024. Available online: https://centrodedescargas.cnig.es/CentroDescargas/catalogo.do?Serie=CAANE (accessed on 18 May 2025).
  28. Chiaramonti, D.; Testa, L. Deploying EU biomethane potential for transports: Centralized/decentralized biogasrefinery schemes to SAF and maritime fuels. Appl. Energy 2024, 366, 123306. [Google Scholar] [CrossRef]
  29. Ministerio para la Transición Ecológica y el Reto Demográfico. Aglomeraciones Urbanas y Estaciones Depuradoras de Aguas Residuales. 2021. Available online: https://www.miteco.gob.es/es/cartografia-y-sig/ide/descargas/agua/situacion-q2021.html (accessed on 6 February 2025).
  30. Kraviarová, D.; Janošovský, J.; Variny, M. The feasibility study of alternative fuels production following National Hydrogen Strategy in Slovakia. Int. J. Hydrog. Energy 2024, 86, 1386–1400. [Google Scholar] [CrossRef]
  31. Freire Ordóñez, D.; Ganzer, C.; Halfdanarson, T.; González Garay, A.; Patrizio, P.; Bardow, A.; Guillén-Gosálbez, G.; Shah, N.; MacDowell, N. Quantifying global costs of reliable green hydrogen. Energy Adv. 2023, 2, 2042–2054. [Google Scholar] [CrossRef]
  32. Niroula, S.; Kafle, N.; Chitrakar, S.; Thapa, B.S. Green hydrogen production from surplus hydroelectric power: A case study in Nepal. Int. J. Hydrogen Energy 2024, 92, 527–534. [Google Scholar] [CrossRef]
  33. Wang, J.; Zhao, J.; Yang, X.; Lv, R.; Li, J.; Yu, B.; Yan, D.; Zhang, H.; Guo, W.; Hao, R.; et al. Study on the synergistic failure of hydrogen embrittlement and corrosion in high-pressure hydrogen-blended natural gas pipelines. J. Mater. Res. Technol. 2025, 36, 6099–6112. [Google Scholar] [CrossRef]
  34. Enagás. Folleto Almacenamientos Subterráneos; Enagás: Madrid, Spain, 2024. [Google Scholar]
  35. Hystories. Hydrogen Storage in European Subsurface. 2024. Available online: https://bgs.maps.arcgis.com/apps/dashboards/630ec7b3cbd54e39b4111e397315ae99 (accessed on 17 February 2025).
  36. IGME. Base de Datos del Inventario Español de Lugares de Interés Geológico. 2007. Available online: https://info.igme.es/ielig/default.aspx (accessed on 27 March 2025).
  37. Martínez, R.; Suárez, I.; Zapatero, M.A.; Saftic, B.; Kolenkovic, I.; Car, M.; Persoglia, S.; Donda, F. The EU Geocapacity Project—Saline aquifers storage capacity in Group South countries. Energy Procedia 2009, 1, 2733–2740. [Google Scholar] [CrossRef]
  38. MITECO. Annex 7. CO2 Emission Factors and Lower Heating Value (LHV) of Fuels; MITECO: Madrid, Spain, 2023.
  39. Caglayan, D.G.; Weber, N.; Heinrichs, H.U.; Linßen, J.; Robinius, M.; Kukla, P.A.; Stolten, D. Technical potential of salt caverns for hydrogen storage in Europe. Int. J. Hydrogen Energy 2020, 45, 6793–6805. [Google Scholar] [CrossRef]
  40. Valle-Falcones, L.M.; Grima-Olmedo, C.; Mazadiego-Martínez, L.F.; Hurtado-Bezos, A.; Eguilior-Díaz, S.; Rodríguez-Pons, R. Green Hydrogen Storage in an Underground Cavern: A Case Study in Salt Diapir of Spain. Appl. Sci. 2022, 12, 6081. [Google Scholar] [CrossRef]
  41. Repsol. Aprende Como Calcular el Consumo de Tu Coche. 2024. Available online: https://www.repsol.es/particulares/asesoramiento-consumo/calcular-consumo-coche/ (accessed on 6 August 2024).
  42. Sobrino, F.H.; Monroy, C.R.; Pérez, J.L.H. Critical analysis on hydrogen as an alternative to fossil fuels and biofuels for vehicles in Europe. Renew. Sustain. Energy Rev. 2010, 14, 772–780. [Google Scholar] [CrossRef]
  43. Dirección General de Tráfico. Kilómetros Anualizados Recorridos Por El Parque Móvil Español; Dirección General de Tráfico: Madrid, Spain, 2022. [Google Scholar]
  44. Dirección General de Tráfico. Anuario Estadístico General 2022; Dirección General de Tráfico: Madrid, Spain, 2022. [Google Scholar]
  45. Martínez-Hernando, M.-P.; Ruiz Palomar, C.; García Álvaro, A.; Suárez Rodríguez, M.C.; Bolonio, D.; García-Martínez, M.-J.; de Godos Crespo, I.; Ortega, M.F. Life Cycle Assessment of LIFE Smart Agromobility Project. 2024. Available online: https://www.researchgate.net/publication/381301959_Life_Cycle_Assessment_of_LIFE_Smart_Agromobility_project (accessed on 18 May 2025).
  46. European Commission. Commission Recommendation (EU) 2021/2279 of 15 December 2021 on the Use of the Environmental Footprint Methods to Measure and Communicate the Life Cycle Environmental Performance of Products and Organisations. 2021. Available online: https://www.consilium.europa.eu/media/40928/st12791-en19.pdf (accessed on 21 June 2025).
  47. European Parliament. Directive (EU) 2015/1513 of the European Parliament and of the Council of 9 September 2015; European Parliament: Luxembourg, 2015. [Google Scholar]
  48. European Commission. Commission Delegated Regulation (EU) 2023/1185 of 10 February 2023; European Commission: Luxembourg, 2023. [Google Scholar]
  49. Scarlat, N.; Fahl, F.; Dallemand, J.F.; Monforti, F.; Motola, V. A spatial analysis of biogas potential from manure in Europe. Renew. Sustain. Energy Rev. 2018, 94, 915–930. [Google Scholar] [CrossRef]
  50. Ministerio para la Transición Ecológica. Resolución de 8 de Octubre de 2018, de la Dirección General de Política Energética y Minas, por la que se Modifican las Normas de Gestión Técnica del Sistema NGTS-06, NGTS-07 y los Protocolos de Detalle PD-01 y PD-02; Ministerio para la Transición Ecológica: Madrid, Spain, 2018.
  51. UNE-EN_16723-2:2018; Gas Natural y Biometano para uso en Transporte y Biometano para Inyección en la red de Gas Natural—Parte 2: Especificaciones del Combustible para Automoción. Asociación Española de Normalización: Madrid, Spain, 2018.
  52. Tangöz, S.; Kahraman, N.; Akansu, S.O. The effect of hydrogen on the performance and emissions of an SI engine having a high compression ratio fuelled by compressed natural gas. Int. J. Hydrogen Energy 2017, 42, 25766–25780. [Google Scholar] [CrossRef]
  53. Ortenzi, F.; Chiesa, M.; Scarcelli, R.; Pede, G. Experimental tests of blends of hydrogen and natural gas in light-duty vehicles. Int. J. Hydrogen Energy 2008, 33, 3225–3229. [Google Scholar] [CrossRef]
  54. Koç, Y.; Yağlı, H.; Görgülü, A.; Koç, A. Analysing the performance, fuel cost and emission parameters of the 50 MW simple and recuperative gas turbine cycles using natural gas and hydrogen as fuel. Int. J. Hydrogen Energy 2020, 45, 22138–22147. [Google Scholar] [CrossRef]
  55. Nam, J.; Lee, Y.; Joo, S.; Yoon, Y.; Yoh, J.J. Numerical analysis of the effect of the hydrogen composition on a partially premixed gas turbine combustor. Int. J. Hydrogen Energy 2019, 44, 6278–6286. [Google Scholar] [CrossRef]
  56. di Gaeta, A.; Reale, F.; Chiariello, F.; Massoli, P. A dynamic model of a 100 kW micro gas turbine fuelled with natural gas and hydrogen blends and its application in a hybrid energy grid. Energy 2017, 129, 299–320. [Google Scholar] [CrossRef]
  57. Suelo Solar. Temperaturas Ambiente Medias en Horas de Sol en las Provincias de España. 2025. Available online: https://suelosolar.com/guiasolares/acs/temproves.asp (accessed on 15 May 2025).
Figure 1. Process Flow Chart of the Life Smart Agromobility project. Photos have been taken by the authors or other members of the consortium of the project. The authors obtained permission from the project consortium to use these photographs.
Applsci 15 07514 g001
Figure 2. Flowsheet of Smart Met Value project. Prepared by the author based on project images.
Applsci 15 07514 g002
Figure 3. Flowsheet of the UNDERGY project. Prepared by the authors within the framework of the UNDERGY project.
Applsci 15 07514 g003
Figure 4. Potential biomethane production from pig manure per province in GWh/year.
Applsci 15 07514 g004
Figure 5. Potential biomethane production from WWTP per province in GWh/year.
Applsci 15 07514 g005
Figure 6. Geomechanical simulation at 100 bars. Prepared by the authors using Flac3D within the framework of the UNDERGY project.
Applsci 15 07514 g006
Figure 7. Geochemical simulation of gas conditions in tanks at 90 bars and 60 °C, developed with TOUGH+ as part of the UNDERGY project.
Applsci 15 07514 g007
Figure 8. Potential UHS per province in GWh.
Applsci 15 07514 g008
Disclaimer/Publisher’s Note: The statements, opinions and data contained in all publications are solely those of the individual author(s) and contributor(s) and not of MDPI and/or the editor(s). MDPI and/or the editor(s) disclaim responsibility for any injury to people or property resulting from any ideas, methods, instructions or products referred to in the content.

