1. Introduction
Carbon fiber prepreg is a pre-impregnated sheet material fabricated by impregnating a polymer matrix into reinforcing fibers, serving as an essential intermediate for composite materials [
1]. As a critical substrate for high-performance composites, defects in the prepreg—often introduced during the production process—can significantly lead to the unreliability of the final product [
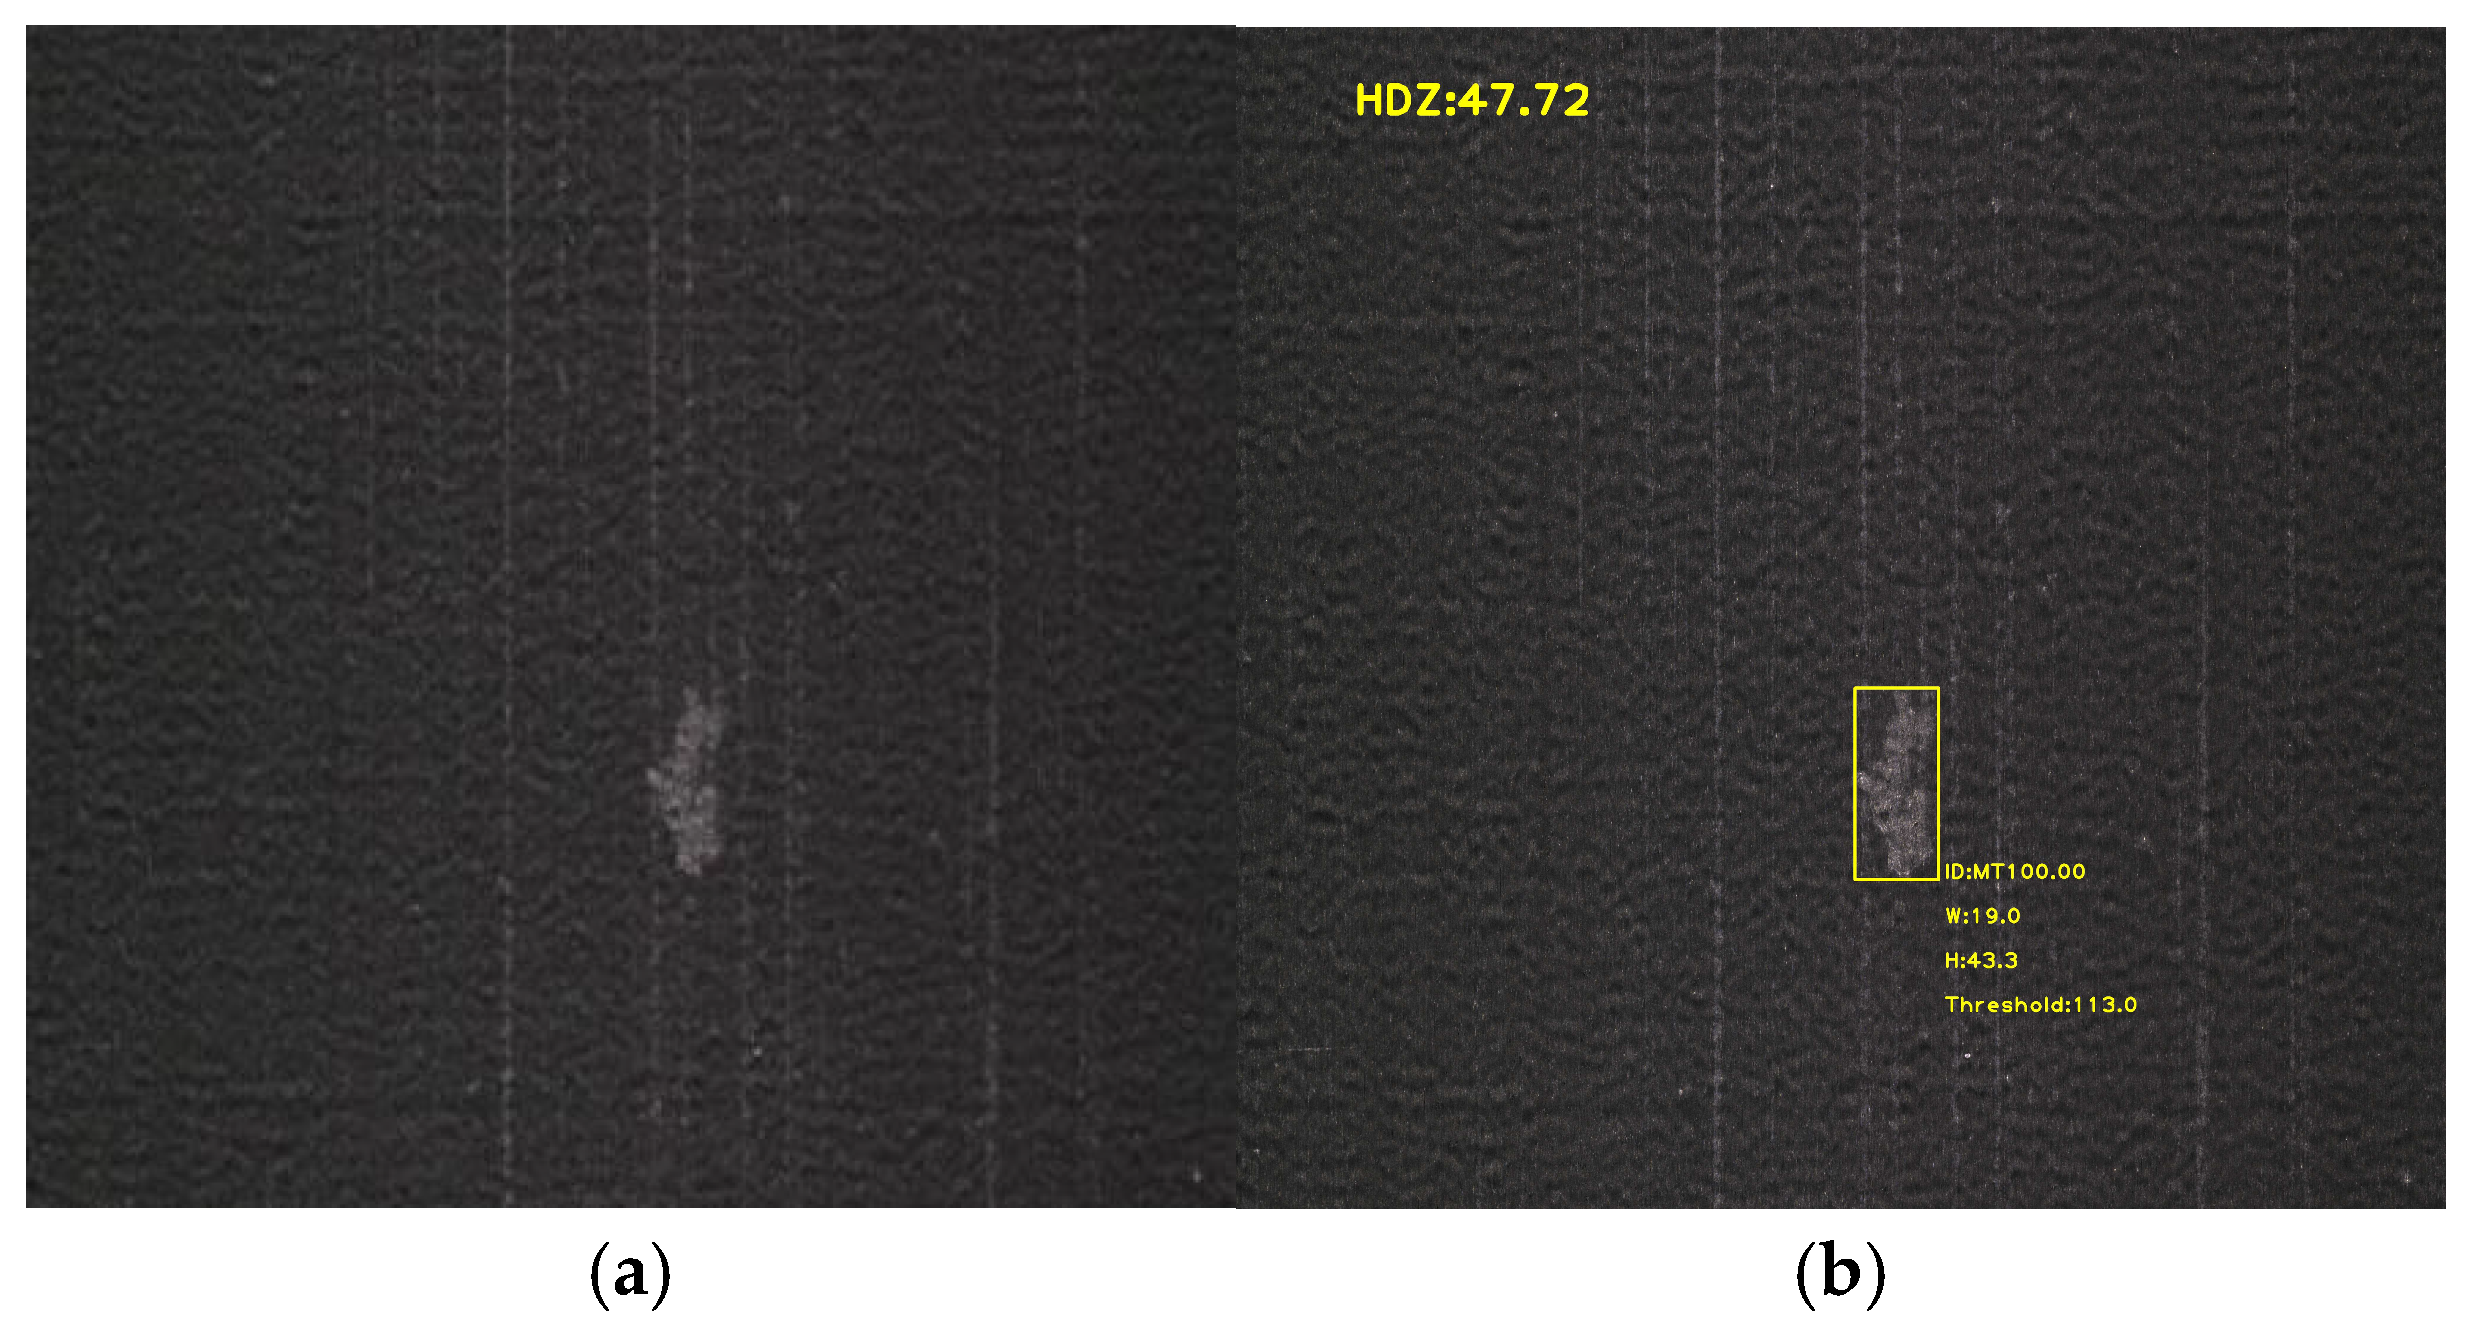
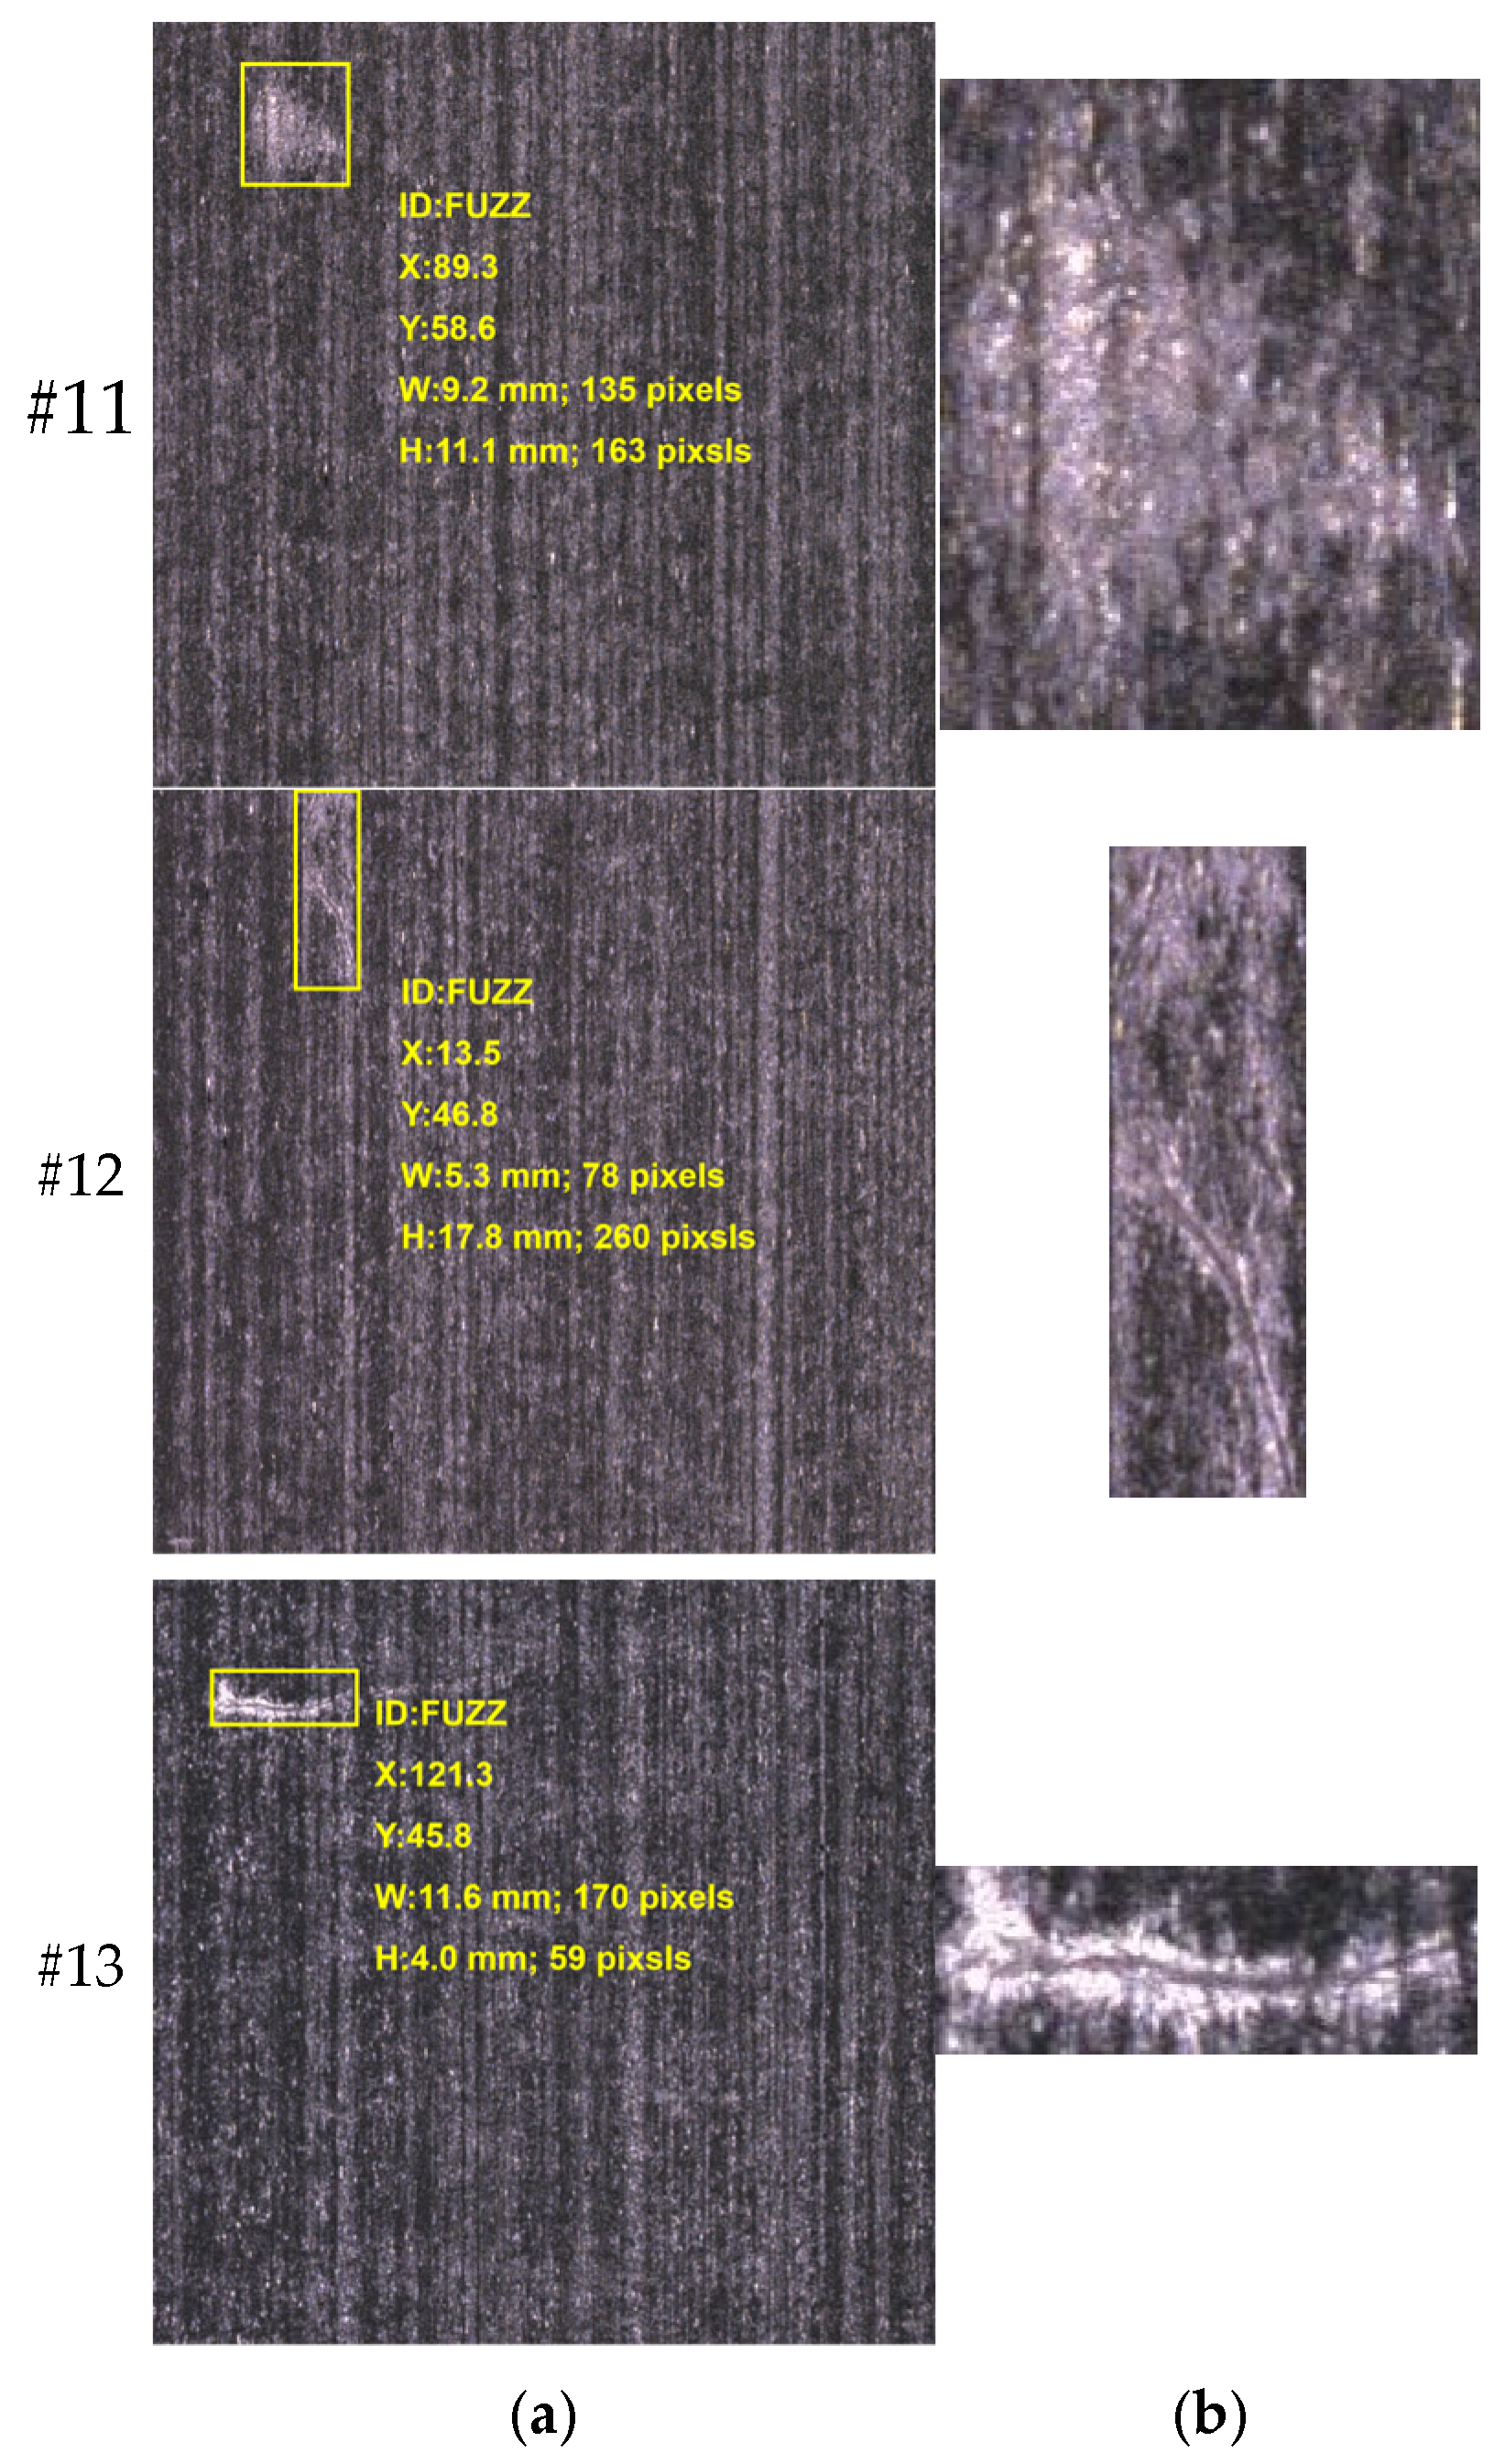
2]. These defects are usually divided into six categories: fuzz, wrinkles, poor glue, seam separation, foreign objects, and resin-rich areas. They have a substantial adverse effect on the mechanical properties, interfacial bonding, and long-term durability of composite structures. Among these, fuzz defects exhibit considerable morphological variability in the prepreg. Their colors are influenced by different material backgrounds and lighting conditions. Their shapes are affected by the distribution of carbon fibers, manifesting as clustered, strip-shaped, or dispersed patterns. Although deep learning techniques have shown remarkable progress in industrial defect detection, they still face notable technical challenges in accurately evaluating the severity of fuzz defects in carbon fiber prepreg. Traditional machine vision systems are either limited to defect type recognition [
3] or lack the ability to grade and assess the severity of defects, which these are two crucial needs for refined quality inspection in industrial production. Consequently, the urgent need for quantitative severity metrics of fuzz defects in prepreg manufacturing has prompted the development of evaluation methods to classify surface imperfection criteria and enable precise inspection systems.
Surface defect detection based on image processing typically encompasses three categories: traditional image processing algorithms, machine learning-based methods, and deep learning approaches [
4]. Faced with the demand for defect detection in carbon fiber prepreg, researchers have proposed diverse strategies to address the challenges of defect identification. For instance, Li et al. [
5] developed a vision-based automatic recognition system that leverages an artistic conception drawing revert algorithm, exploiting repeated surface pattern features for defect identification, matching, and classification. Similarly, Liu et al. [
6] introduced a structural-constrained low-rank decomposition method for fabric defect detection, which constructs a fused image by extracting energy features from both the original and energy images to enhance defect visibility. Houssein [
7] proposed a multi-level threshold image segmentation method based on the Black Widow Optimization algorithm, which effectively reduces computational costs by using Otsu or Kapur as the objective function. Versaci et al. [
8] proposed a new edge detection method based on fuzzy divergence and fuzzy entropy minimization, and introduced an adaptive S-shaped fuzzy membership function and a new fuzzy degree quantization index, effectively improving the edge detection performance of grayscale images under fuzzy conditions. Shi et al. [
9] further combined low-rank decomposition with a structured graph algorithm, segmenting images into defect and defect-free blocks through local feature analysis while incorporating an adaptive threshold mechanism based on cycle counts during block merging.
Neural network-based deep learning models have also been applied to defect detection [
10]. Lin et al. [
11] introduced the Swin Transformer module into the YOLOv5 framework, significantly improving the detection of small-scale defects on fabric surfaces. Yuan et al. [
12] proposed an improved YOLOv5 model, YOLO-HMC, which combines modules such as HorNet, MCBAM, and CARAFE to effectively improve the detection accuracy and efficiency of small defects on PCB surfaces. Building on this, Su et al. [
13] optimized the YOLOv8 architecture by introducing Deformable Large Kernel Attention and Global Attention mechanisms, achieving substantial accuracy gains for prepreg surface defect detection. These studies demonstrate the evolving focus from basic defect recognition to more sophisticated feature extraction and model optimization.
Quantification of defects in images typically involves critical steps such as threshold segmentation, histogram analysis, and structural optimization. Zhu et al. [
14] proposed an adaptive threshold method based on Adaptive cuckoo search optimization, coupled with genetic algorithms to determine optimal Gabor filter parameters for fabric defect extraction. Palletmulla et al. [
15] systematically analyzed how grayscale quantization and window size affect the performance of grayscale co-occurrence matrix features in fabric defect detection. Meanwhile, Wiskin et al. [
16] applied threshold segmentation in medical imaging to quantify breast density for cancer risk assessment, while Sun [
17] developed a color space-based framework for the quantitative evaluation of flame stability. Wang et al. [
18] proposed an acne grading method and severity assessment index based on lesion classification, and constructed a lightweight model called Acne RegNet, which achieved high-precision acne lesion recognition and severity assessment close to the level of dermatologists. Rahman et al. [
19] developed an automatic acquisition system and image processing algorithm for rice leaf images, which achieved estimation of leaf infection area percentage based on pixel statistics. These works underscore the importance of accurate quantification for enhancing detection system practicality, though they also reveal inherent limitations in image-based severity assessment due to variations in background-target contrast and lighting conditions.
To address these challenges, researchers have extensively studied image-enhancement techniques [
20]. Gray-level histogram equalization has emerged as a pivotal method for improving image quality and analysis reliability. Zhu et al. [
21] proposed a threshold segmentation algorithm based on the statistical curve difference method to solve the problem of multi-target image segmentation with a small target area and grayscale close to the background. Uzun et al. [
22] optimized adaptive histogram equalization through real-coded genetic algorithms and war strategy optimization, effectively enhancing image clarity. Fan [
23] proposed a constrained histogram equalization approach with adjustable contrast parameters to overcome shortcomings in traditional methods. Pang et al. [
24] further developed a variable contrast and saturation enhancement model using contrast-limited histogram equalization for local contrast correction. In low-light environments, Oztur et al. [
25] introduced a dual-approach enhancement method combining histogram equalization with adaptive gamma correction in HSI color space, effectively resolving brightness inhomogeneity issues. Lv et al. [
26] proposed an adaptive high grayscale image enhancement algorithm based on logarithmic mapping and simulated exposure, which effectively improves the visual quality and contrast of high grayscale low contrast images. These advancements in image preprocessing highlight the necessity of robust enhancement strategies to enable accurate detection and evaluation in image detection.
This study proposes a quantitative evaluation metric to assess the severity of surface fuzz defects in carbon fiber prepreg. Most deep learning-based object detectors output rectangular bounding boxes that only indicate the approximate location of defects. These bounding boxes do not provide information about the shape or severity of the defect. To address this limitation, the proposed method incorporates traditional image processing techniques, including adaptive thresholding and histogram normalization, to extract the actual defect region and suppress the background within the detection box. The contributions of this study can be summarized as follows:
Select pixels of fuzz defects from the detection boxes bounded by the deep learning models;
Propose a standard for representing the severity of defects per unit area through grayscale histograms of defective pixels and background pixels;
Calculate the effective area of fuzz defects;
Obtain an evaluation score that reflects the severity of the fuzz defects.
2. Materials and Methods
2.1. Selection of Defective Pixels
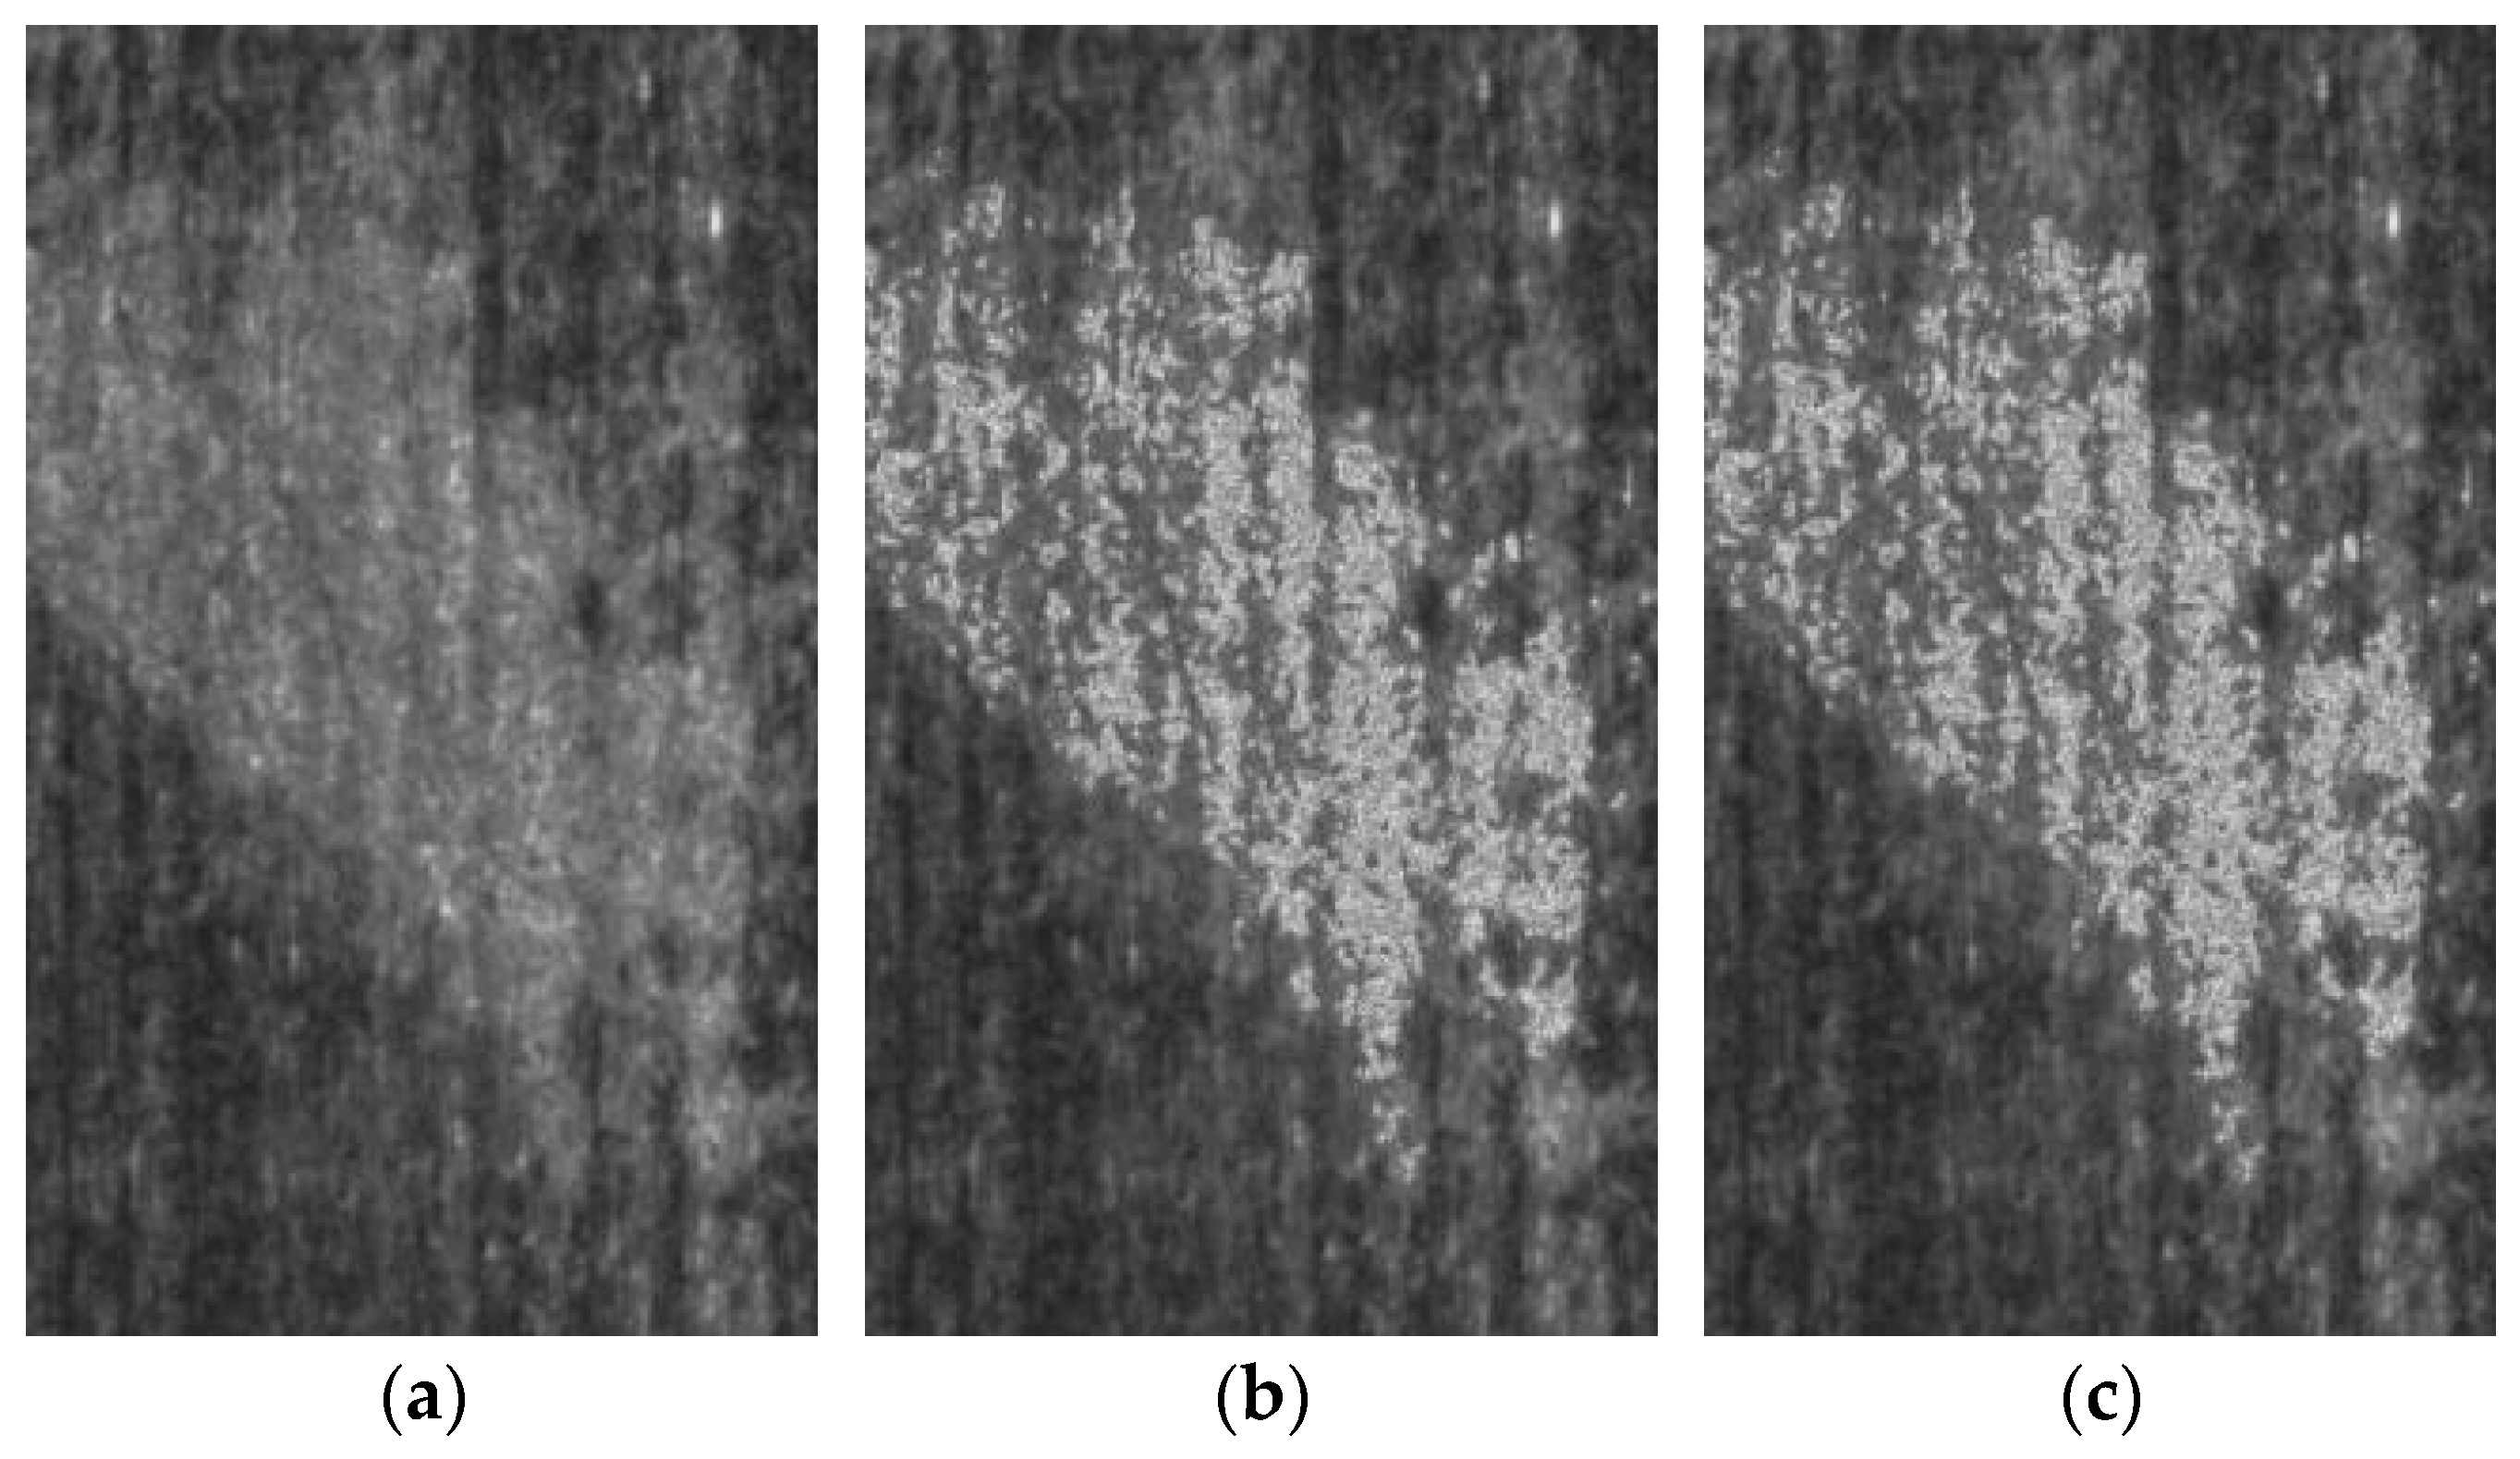
The first step in the proposed method involves converting the color image into a grayscale image, followed by the selection of defective pixels based on the grayscale representation. Due to the inherently uneven surface color distribution in carbon fiber prepreg, global grayscale thresholding proves insufficient for effectively distinguishing defects from the background while suppressing noise and illumination variations. To address this challenge, a localized thresholding strategy is adopted, taking into account the characteristics of the prepreg background—specifically, its irregular horizontal variations and relatively subtle vertical changes. In this approach, the average grayscale value of a local region is utilized as the threshold for segmentation, thereby improving the robustness and accuracy of defect pixel identification under varying background conditions.
To determine whether a given pixel contains a fuzz defect, a local grayscale analysis is performed. Specifically, the average grayscale value of a
neighborhood centered at the target pixel is calculated. This process is equivalent to applying a mean filter using a square convolution kernel of size
, which helps suppress local noise and smooth intensity variations for more reliable defect detection. The mathematical formulation for the mean grayscale value is given by the following:
In Equation (1),
represents the dimension of the input grayscale image, where m and n represent the number of rows and columns, respectively. The img
mean is generated from the original image by applying a mean filter with convolution kernels of size
, thereby achieving local intensity smoothing and background balance. Average the pixel grayscale values along the row direction of the image to generate an
vector. The method is to repeatedly fill the image and calculate the average grayscale of
pixels centered on the pixel to obtain an
sequence, as follows:
Here, the i-th element in the summation corresponds to the i-th row, and j spans the
pixel window centered at column y. This operation provides a column-wise reference of the average grayscale value, which is used for subsequent thresholding. Based on the results of Equations (1) and (2), a binary mask is constructed to identify the fuzz defect regions. The mask is defined using a threshold criterion that compares the local mean grayscale value img
mean ith mean gray, as follows:
The resulting image mask1 is the mask of the fuzz region selected through the first threshold. For images with a ratio of m to n greater than 3, using the average grayscale of the pixels as the threshold is too high due to the excessive presence of fuzz areas within the
pixels. The maximum value of m is 4096, and the maximum value of n is 1366. Within the 1366 pixel range, the horizontal variation in the image is relatively small. Therefore, the average grayscale of
pixels centered on the pixel is taken as the grayscale threshold. This is shown as follows:
In the computation of the first defect mask, the grayscale threshold is derived by incorporating both the fuzz defect regions and the background. However, since this initial threshold may be biased due to the inclusion of fuzz pixels, a second threshold step is introduced to refine the segmentation. In this step, the background is first cleaned by excluding the previously identified fuzz pixels using the first mask, and a new column-wise grayscale threshold is computed based on the purified background. Specifically, the second column-wise average grayscale value, meangray2, is calculated as follows:
Here, mask1 is the binary mask obtained from the first threshold step, where a value of 1 indicates a fuzz defect pixel and 0 indicates a background pixel. Equation (6) computes the average grayscale of the background region after removing the fuzz defect areas, thereby providing a more accurate column-wise threshold for the second segmentation stage. Then, a second defect mask2 is generated by comparing the local average grayscale img
mean with the threshold defined by Equation (6):
The calculation for images with a ratio of m to n greater than 3 is as follows:
To enhance the robustness of the final defect mask and minimize the risk of pixel omission due to improper threshold selection, the mask with the higher number of identified defect pixels among mask1 and mask2 is selected as the final result. This selection is formalized as follows:
In the resulting mask, the value 1 denotes a fuzz defect pixel, while 0 indicates a background pixel. This approach ensures that the threshold process is adaptive to the spatial characteristics of the image, thereby improving the accuracy and reliability of fuzz defect detection in carbon fiber prepreg surfaces.
2.2. Severity of Defects per Unit Area
In practical applications, different images may exhibit variations in grayscale values for the same severity of fuzz defects due to differences in lighting conditions and the inherent color properties of the fuzz itself [
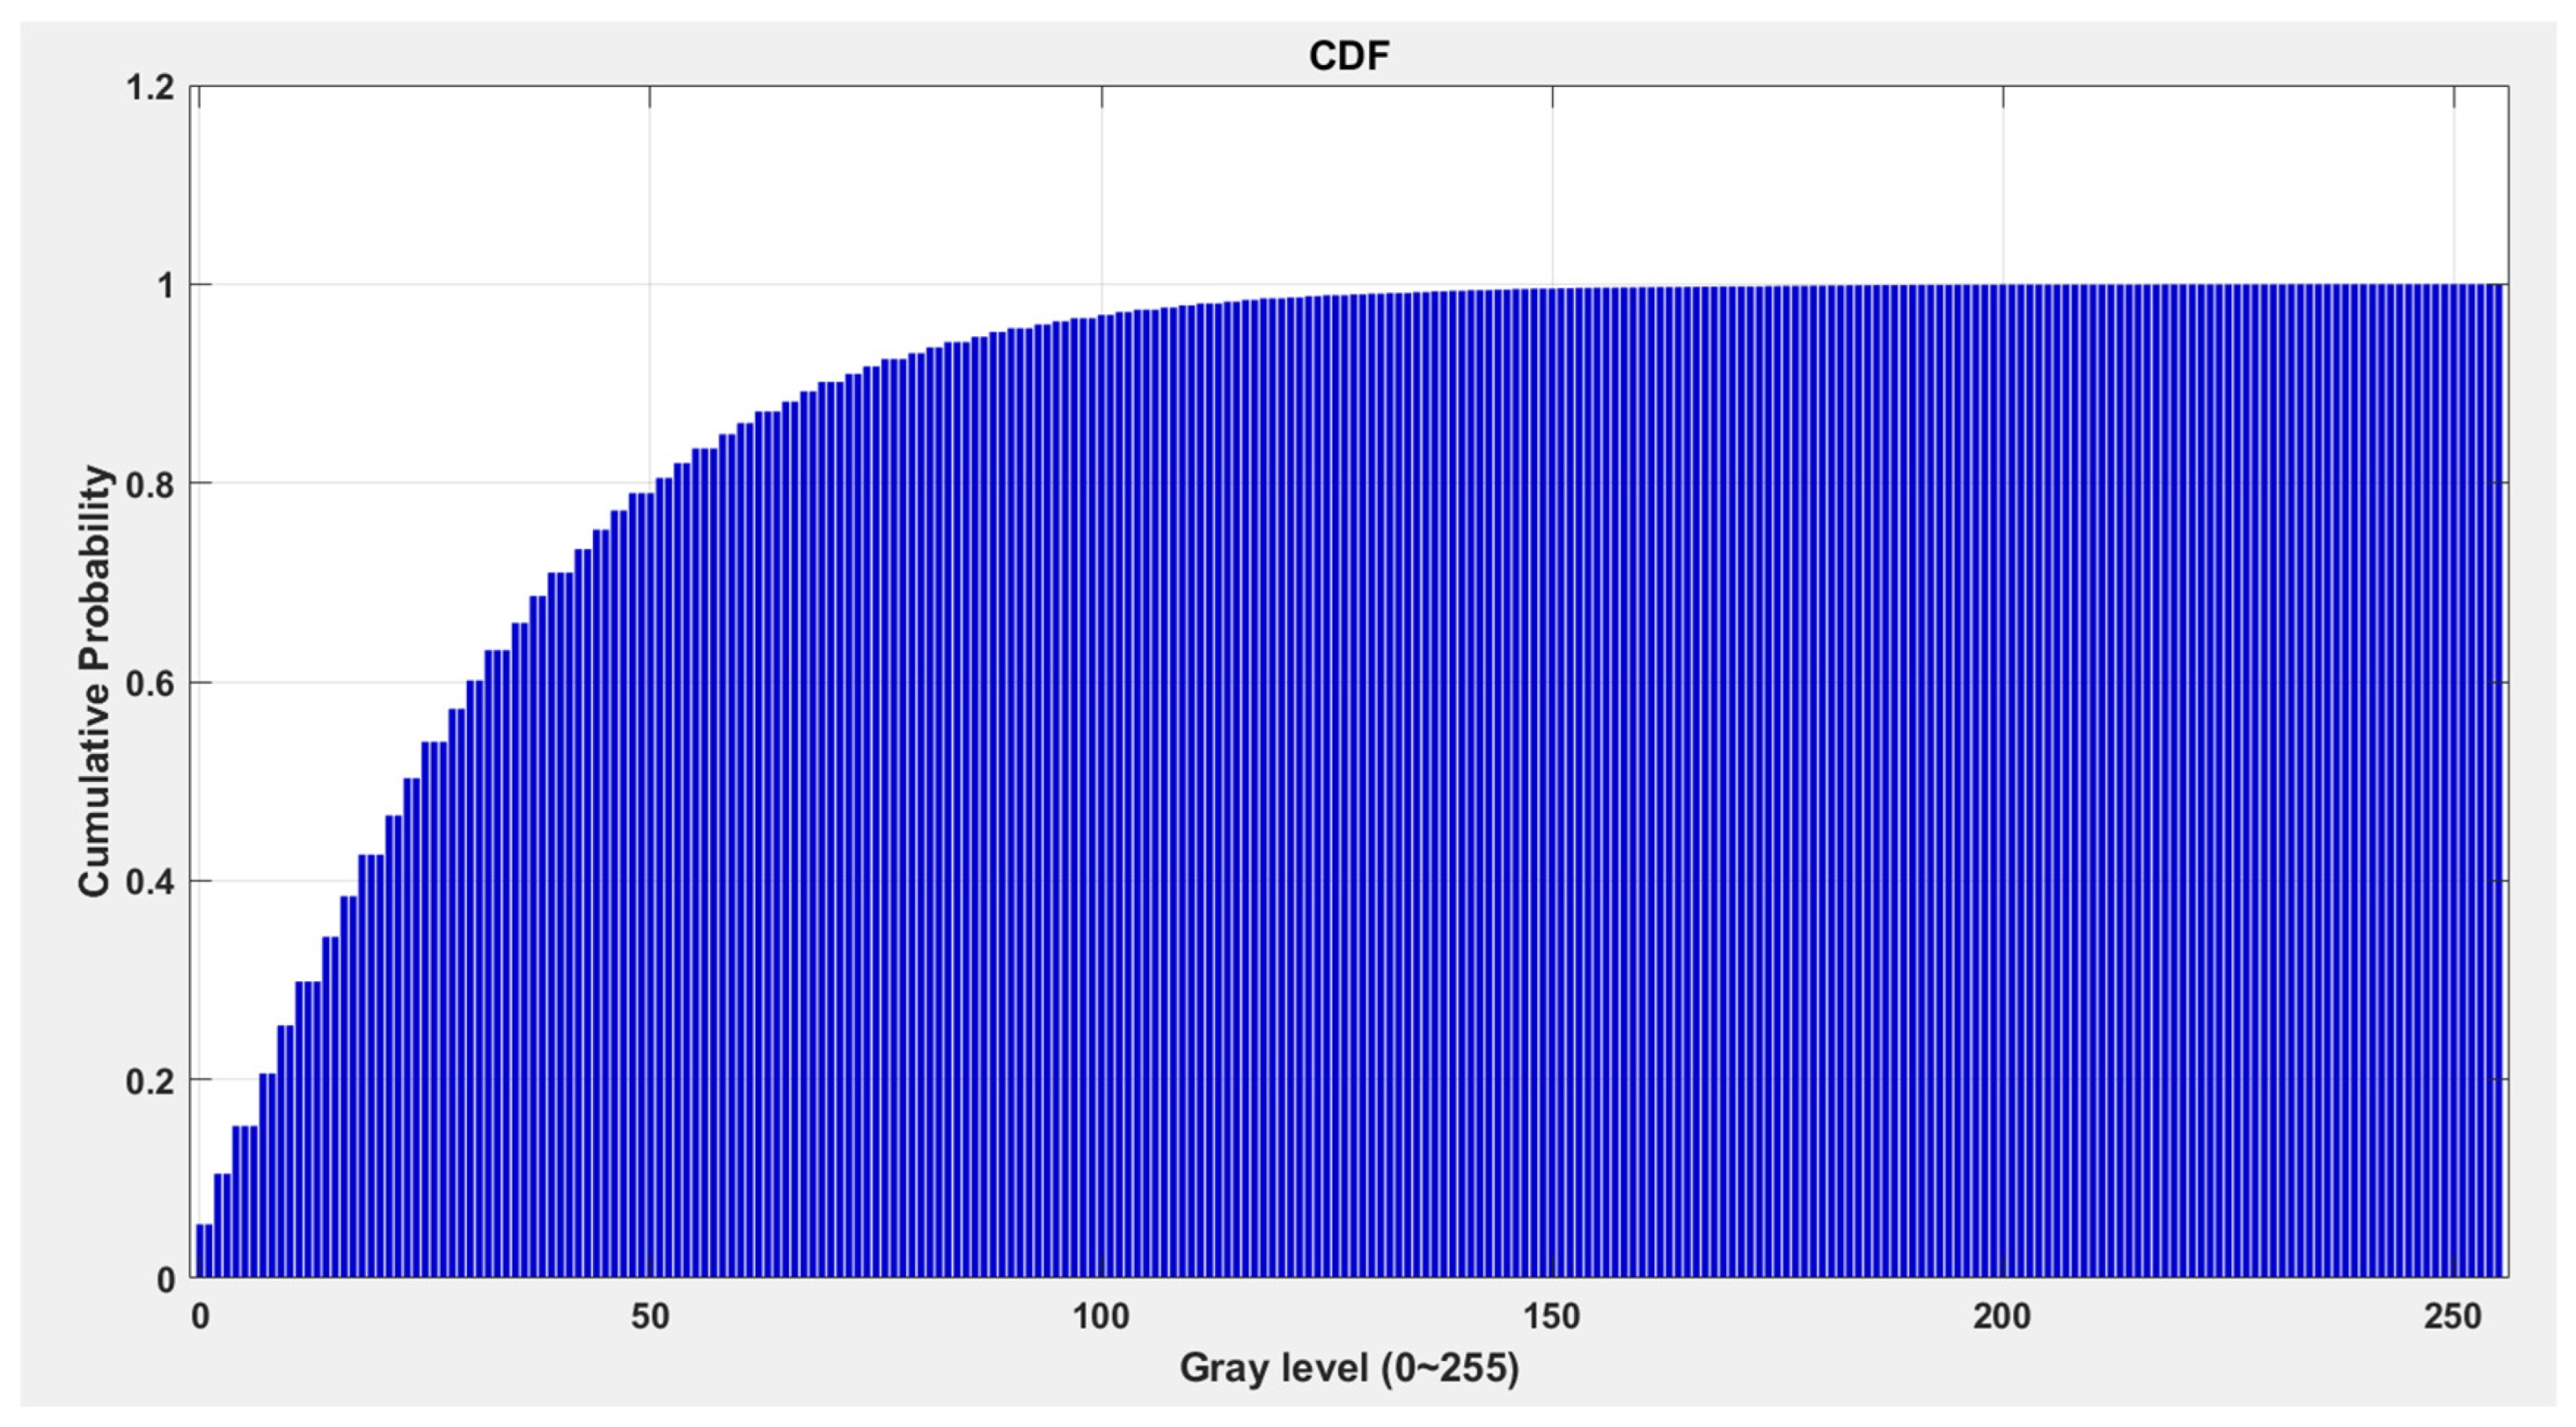
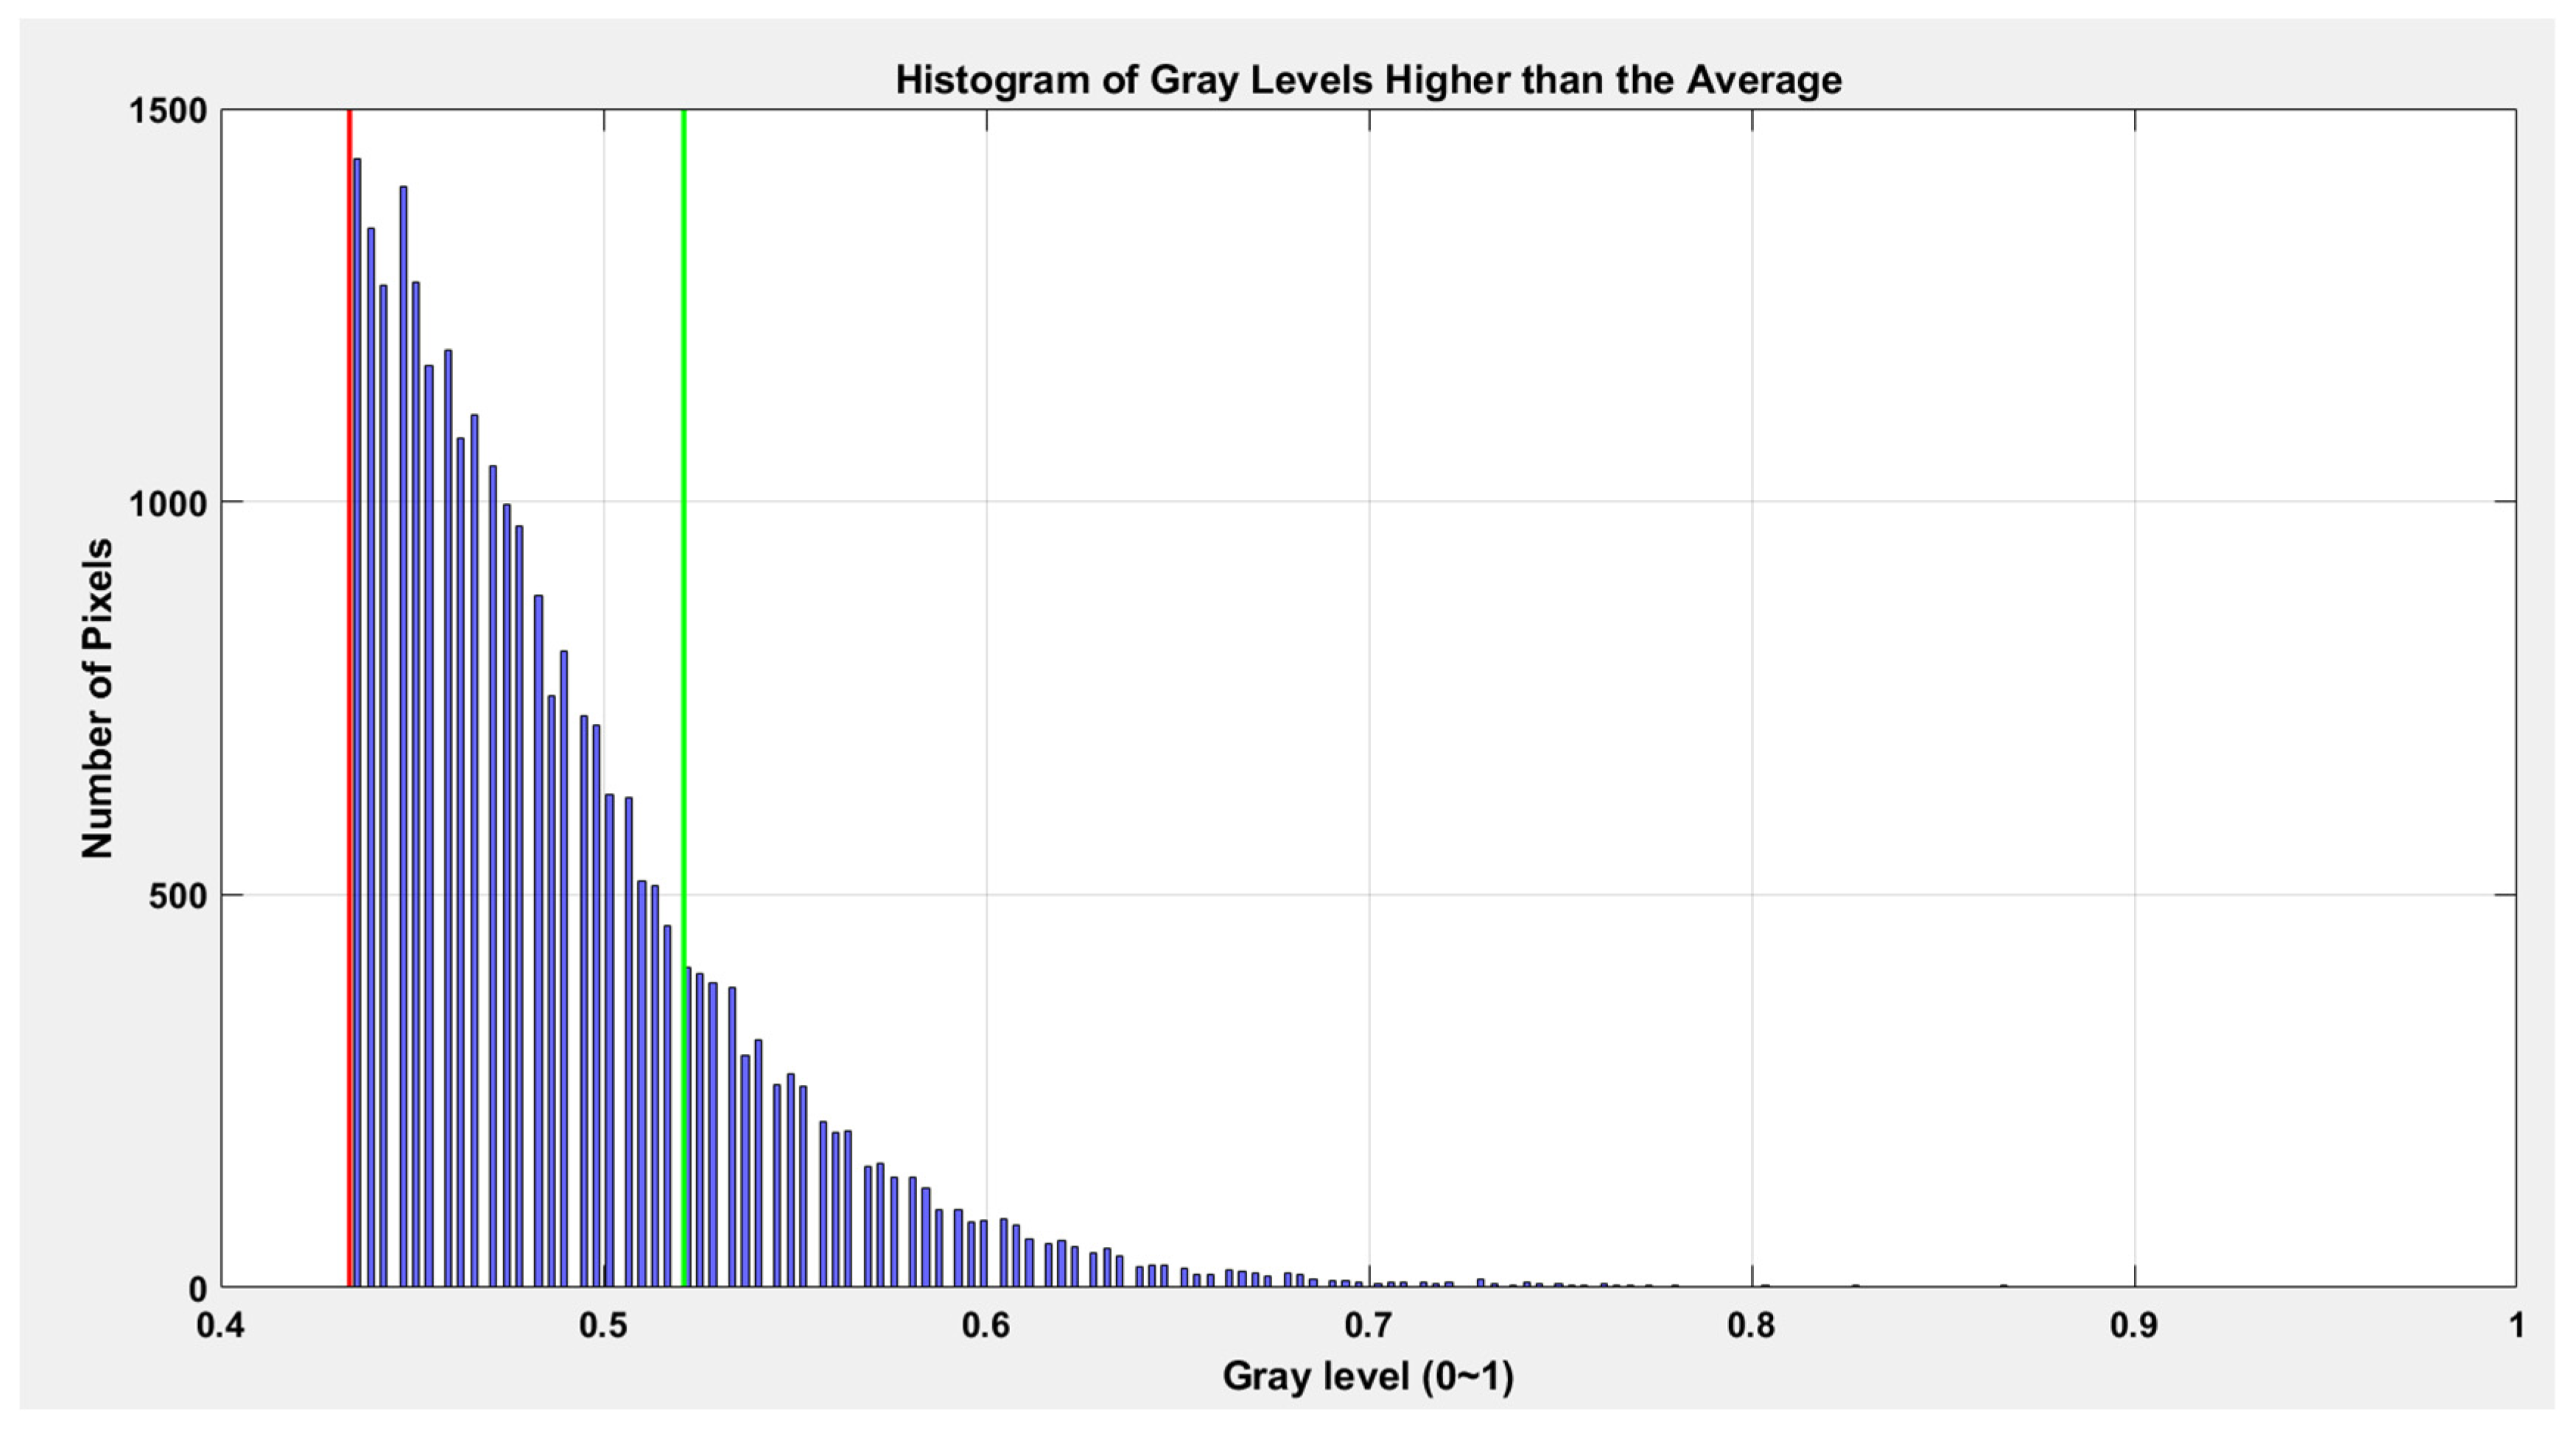
27]. To eliminate the influence of these external factors on the defect assessment, this study employs a localized grayscale histogram equalization method. This approach is applied specifically to the regions containing fuzz defects, with the lower bound of the local grayscale range defined as the average grayscale value of the fuzz area. The upper bound is determined based on the 80th percentile of the cumulative grayscale probability distribution within the same region. This technique enhances the comparability of images and improves the objectivity and consistency of defect severity evaluation.
Firstly, the grayscale image is normalized from the integer range to the floating-point range, using the following transformation:
The k represents the grayscale level, ranging from 0 to 255 as an integer. Separate grayscale histograms, denoted as hist
ob and hist
bg, are computed for the fuzz area and the background area as follows:
The grayscale probability distributions for the fuzz and background areas are then derived by normalizing the respective histograms:
The
and
represent where the average grayscale values of the fuzz area and background area, respectively, as follows:
To determine the lower threshold of the grayscale range for the fuzz area, the grayscale level g(a) that is closest to mean
ob is identified as follows:
The upper threshold b is determined as the 80th percentile of the grayscale probability distribution of the fuzz area. Specifically, b is the smallest grayscale level that satisfies the following conditions:
Subsequently, the grayscale histogram and probability distribution for the interval are extracted as follows:
The cumulative distribution function (CDF) over this interval is then computed as follows:
To perform histogram equalization, the grayscale values in the fuzz area are mapped to a new range [
28]. The c is the maximum grayscale value of the image. The equalized grayscale value g
1(k) is calculated as follows:
After mapping, the updated grayscale histogram and probability distribution for the fuzz area are obtained by the following:
It is worth noting that color variations may exist between different materials or even within different regions of the same material. These variations can lead to differences in the grayscale values of fuzz defects, even when their severity is the same. To mitigate the impact of such color differences on the evaluation process, the focus is shifted from the absolute grayscale values of the fuzz region to the relative difference between the fuzz and background regions.
To achieve this, the grayscale level g(b) that is closest to mean
bg is determined as follows:
The relative grayscale difference between the fuzz and background is then calculated by the following:
Here, g(b) is the grayscale level closest to the average of the background region. Since the image of fuzz defects is captured on the background material, the grayscale probability distribution derived from the masked area inherently includes contributions from both the fuzz and background regions. To eliminate the background influence on the fuzz severity assessment, the background grayscale probability distribution outside the mask is subtracted from that inside the mask. This operation is defined as follows:
Finally, the severity of blurring per unit area is quantified as the absolute sum of weighted grayscale differences above the average grayscale value, as follows:
The metric s effectively captures the deviation of the fuzz region from the background in terms of relative grayscale, thereby providing a robust and material-independent measure of defect severity.
2.3. Effective Area
The fuzz defect regions identified in the processed image are further analyzed using a learning approach based on neural networks. In this context, the neural network automatically detects potential fuzz defects and annotates them with rectangular bounding boxes. While these bounding boxes provide a convenient and intuitive representation of the defect region, they may not accurately reflect the true extent of the defect, particularly for irregularly or skewed-distributed defects.
Specifically, when the fuzz defect is not aligned with the axes of the image, the area of the axis-aligned bounding box tends to overestimate the actual defect size. To address this issue and improve the accuracy of area-based severity calculation, the effective area Aeff is defined as the smallest area of the rotated bounding rectangle that tightly encloses the detected fuzz defect. This is achieved by rotating the image and recalculating the bounding rectangle until the minimum enclosing area is found.
The effective area Aeff serves as a more precise geometric descriptor of the fuzz defect, allowing for a more reliable and robust assessment of its severity. By using Aeff instead of the standard axis-aligned bounding box area, the method reduces the impact of spatial misalignment and improves the consistency of quantitative defect evaluation across different orientations and shapes of fuzz regions.
2.4. Quantitative Evaluation Score
To comprehensively evaluate the overall severity of fuzz defects, a composite scoring metric S is introduced, which integrates both the severity per unit area l and the effective area S of the detected defect. This scoring mechanism is formulated as follows:
In Equation (31), l represents the normalized grayscale deviation-based severity index defined by (30), while S is the effective area defined in 2.4. The parameter θ is introduced as an adjustable weighting factor that governs the relative contribution of the unit severity and the spatial extent of the defect in the final assessment. The value of θ should be empirically determined according to the specific application requirements and the desired emphasis on either the intensity of the defect or its physical size.
The use of a square root function on the product of θ and s ensures a balanced contribution between the two components, while the logarithmic term with base θ on the effective area Aeff mitigates the overemphasis of large-area defects and enhances the sensitivity to moderate or small defects with high severity. This formulation allows for a more nuanced and application-adaptive quantification of fuzz defect severity, improving the discriminability and interpretability of the final evaluation results.
