Abstract
This study presents a novel method for automatically extracting Doppler envelopes from Frequency-Modulated Continuous Wave (FMCW) radar signals for gait analysis. In contrast to conventional percentile-based approaches that require manual selection of Doppler envelopes for specific body parts (Spine, Leg, and Foot), the proposed contour-based method enables fully automated estimation of representative speed values from the Doppler map. Experiments were conducted on five participants with varying physical characteristics, and key gait parameters—such as walking speed, step length, and stride time—were estimated and compared against motion capture-based ground truth. The proposed method demonstrated relative errors typically below 10%, with key parameters such as Foot Speed and Leg Speed falling below the commonly cited 5% clinical threshold. Paired t-tests revealed no statistically significant differences between the proposed estimates and the ground truth across all gait parameters (), supporting the method’s accuracy and reliability.
1. Introduction
Gait is an essential activity in daily life and is closely associated with an individual’s health status. In particular, gait analysis plays a significant role in predicting physical changes due to aging and in the early diagnosis of diseases such as neurodegenerative disorders, joint abnormalities, and musculoskeletal conditions [1]. Several studies have examined the relationship between gait speed, cognitive function, and the risk of dementia, reporting that slower gait speed may predict the onset of dementia, and that everyday gait information can help prevent fall risks [2,3]. Quantitative gait analysis is increasingly emphasized in the medical and healthcare fields as a means to address and prevent these issues. The gait parameters used in this study, such as walking speed, step length, and stride time, are widely recognized as standard indicators for assessing mobility and health status in clinical gait analysis [4,5,6].
Currently, gait analysis systems using motion capture sensors [7] or camera-based technologies [8], which are primarily employed in hospitals or specialized centers, offer high accuracy. However, these systems typically require attaching sensors or markers to the body or wearing specific outfits for data extraction. Such constraints can cause discomfort or reluctance in users, making it difficult to accurately reflect their natural gait patterns. Moreover, the requirement for analysis in controlled environments such as laboratories or hospitals reduces the reliability of the assessment.
To overcome these limitations, non-contact radar technology is gaining attention in gait analysis research [3,9,10,11,12,13,14,15]. Radar can detect user movements without the need for wearable devices like sensors or markers, thereby addressing their drawbacks. It imposes no additional burden on users and allows the collection of natural gait data. Additionally, radar is not affected by lighting conditions or background environments, making it flexible for use in various settings outside of hospitals, such as homes or hallways. In the future, radar’s Doppler effect can be used to analyze body movement and speed during walking in real time, enabling the development of real-time monitoring and automated analysis systems.
The core of radar-based gait analysis lies in analyzing the Doppler envelope, which measures parameters like gait speed and stride length. Conventional radar-based approaches extract multiple Doppler envelopes from the Doppler map using percentile-based techniques [16,17,18,19]. These methods normalize the accumulated power according to velocity at each time point in the Doppler map to generate a probability density function (PDF), from which Doppler envelopes are derived at various percentile levels, such as 5%, 25%, 75%, and 95%. However, this approach requires researchers to manually select the Doppler envelope corresponding to the subject, which hinders automation and real-time application, reducing practical efficiency.
To address these limitations, this study proposes a new method for automatically extracting Doppler envelopes based on the characteristic power patterns of different body parts (Spine, Leg, Foot). A 60 GHz FMCW (Frequency Modulated Continuous Wave) radar (Bitsensing, MOD630) is used. The proposed method generates contour lines based on specific power values in the Doppler map and uses them to automatically determine Doppler envelopes corresponding to the Spine, Leg, and Foot. This approach resolves the manual selection issue inherent in traditional percentile-based methods. To validate the accuracy of the proposed method, experiments are conducted using motion capture sensors as ground truth on subjects exhibiting normal gait. The speeds of body parts measured by ground truth are compared with those extracted using the proposed Doppler envelope method. A performance analysis between the proposed method and the existing percentile-based approach demonstrates the superiority of the proposed technique.
2. Methods
2.1. FMCW Radar
Radar is a sensor that transmits radio waves and receives the signals reflected from objects to detect their position and velocity. There are various types of transmission and reception signals and methods used in radar systems; however, in this study, a linearly modulated FMCW (Frequency Modulated Continuous Wave) radar signal, as shown in Figure 1, is used. This signal can be represented by (1). FMCW radar transmits a signal that consists of a single or multiple chirps during each scan. The frequency of the transmitted signal (TX) increases linearly and is radiated into space. The signal reflected by the target is received as the received signal (RX). The RX signal exhibits a delay , which can be observed in (2). In this context, , , , , S and represent the transmission time, time delay between transmission and reception, chirp duration, carrier frequency, signal slope, and bandwidth of the radar signal, respectively. In general radar systems, distance is calculated by measuring the time delay of the reflected signal. However, in FMCW radar, the distance is calculated using the beat frequency , which is the frequency difference between the transmitted and received signals.
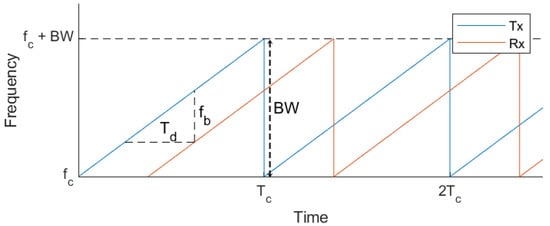
Figure 1.
TX and RX signal of FMCW radar.
Figure 2 shows the functional block diagram of an FMCW radar. To calculate the beat frequency, the signal is first demodulated using a mixer, and then passed through a low-pass filter (LPF) to isolate the low-frequency component—the beat frequency—which is then digitized using an analog-to-digital converter (ADC). The demodulated radar signal is sampled at a rate of over the chirp duration , resulting in discrete samples (n). Multiple chirps (m) are accumulated and considered as one scan (t). Using multiple chirps improves velocity resolution and reduces the impact of clutter. The accumulated data can be represented as (3), with parentheses, e.g., Equations (1) and (2). In this context, the beat frequency is used to calculate distance, as shown in (4), and the phase difference between consecutive chirps is used to estimate velocity, as shown in (5).
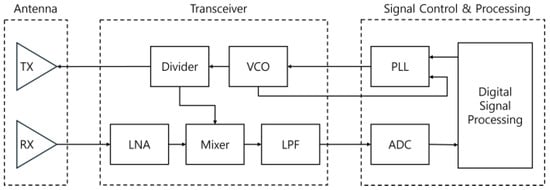
Figure 2.
Functional block diagram of FMCW radar.
2.2. FMCW Radar Signal Processing
To extract the distance and velocity information contained in the received signal described in (3) using an FMCW radar, a signal processing procedure is required. First, a Range FFT is performed along the n-dimension of the data in (3), which corresponds to the fast time (sampling within a single chirp). By removing symmetric components, the result becomes (6), where n represents information about distance r. Next, a Velocity FFT is performed along the m-dimension, corresponding to the slow time (across chirps), resulting in (7). Here, m represents information about velocity v. By accumulating the results from these two FFT processes, a three-dimensional matrix is obtained, representing distance, velocity, and time.
To observe the distance and velocity information of a moving object over time, the range map and the Doppler map are defined as follows.
The range map represents distance information over time, where the corresponding values indicate the signal strength. If there is a moving object at a certain distance, the signal strength appears strong; otherwise, it appears weak. The Doppler map represents velocity information over time, and like the range map, its values also indicate signal strength. Figure 3 shows the range map and Doppler map for a walking motion from approximately 1 m to 5.5 m.
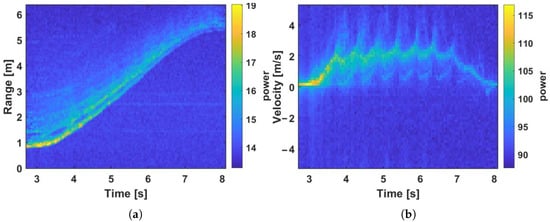
Figure 3.
During walking: (a) range map and (b) Doppler map.
The Doppler map contains velocity information for all moving objects. During walking, different parts of the body—Spine, Leg, and Foot—move at different speeds, which can be verified using motion sensors (Model: Perception Neuron Studio, Noitom). As shown in Figure 4, which presents the results obtained from the motion sensor, Foot moves the fastest (approximately 3 m/s), followed by the Leg (approximately 2 m/s), while Spine moves the slowest (approximately 1 m/s).
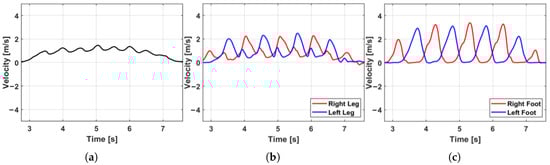
Figure 4.
Velocity by body part measured using a motion sensor: (a) Spine, (b) Leg, (c) Foot.
In the Doppler map shown in Figure 3, various patterns reflecting differences in body part velocities are present, and the speeds corresponding to Foot, Leg, and Spine can be visually distinguished. Therefore, by analyzing these distinct patterns, it is possible to extract the velocities of individual body parts. For gait analysis, it is essential to extract multiple Doppler envelopes that represent the velocity variations of each body part. In previous studies, percentile-based methods have been used to extract Doppler envelopes [16,17,18,19].
To remove noise from the Doppler map in (7), a denoising process is applied, as described in (8) and (9), resulting in an improved Doppler map . Figure 5 shows the denoised Doppler map , based on Figure 3b.
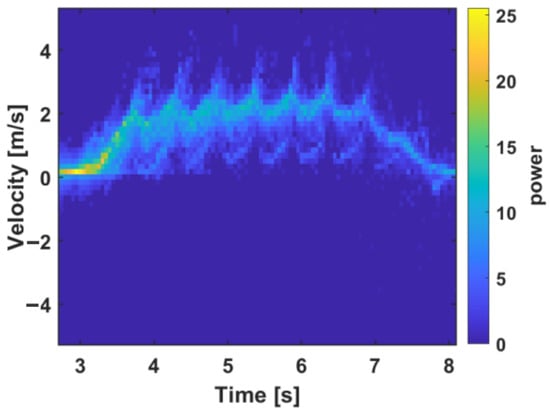
Figure 5.
Noise-reduced Doppler map.
In conventional gait analysis, a probability density function (PDF) of the velocity distribution in the Doppler map is first computed. Then, specific percentiles are manually selected to extract Doppler envelopes that represent the velocity information of individual body parts. For example, the velocities corresponding to the toe, ankle, and knee are experimentally chosen at the 95th, 75th, and 50th percentiles, respectively [12]. Figure 6 shows the Doppler envelopes corresponding to the 5th, 25th, 50th, 75th, and 95th percentiles, applied to the denoised Doppler map in Figure 5.
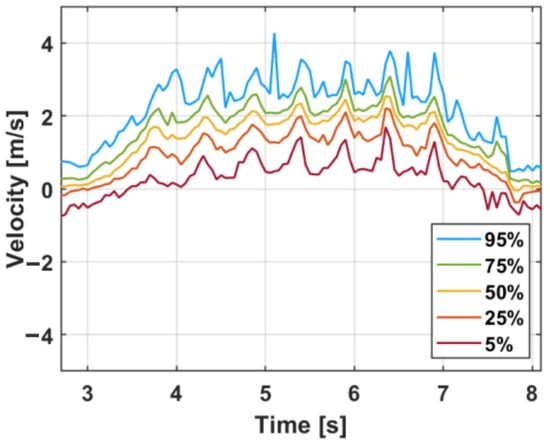
Figure 6.
Five Doppler envelopes extracted using the conventional method.
The conventional percentile-based method for extracting Doppler envelopes has several limitations, as it relies on manually analyzing various experimental results to determine the appropriate percentiles. First, the outcome of gait analysis can be influenced by the expertise of the individual conducting the manual analysis. Second, the manual selection of percentiles hinders the automation of gait analysis. Third, when experimental conditions such as the walker, gait type, or radar setup change, applying the same percentiles may not yield accurate Doppler envelopes. This necessitates recalibrating the percentile values for each new environment.
2.3. Proposed Method
In this study, we propose a method to automatically extract Doppler envelopes for different body parts from the Doppler map using contour analysis. Similar to how a contour connects points of equal elevation, the Doppler map is converted into a contour map, where points with the same signal intensity are connected. This allows the exploration of Doppler envelopes corresponding to various body parts.
First, for each time frame in the Doppler map, the velocity value with the highest signal strength is extracted to construct a baseline envelope, as defined in (10). This baseline envelope serves as the most distinct and representative envelope in gait analysis. It is used as a reference when selecting envelopes corresponding to major body parts from the various envelopes extracted using the contour-based method.
Figure 7 shows the baseline envelope extracted from the Doppler map.
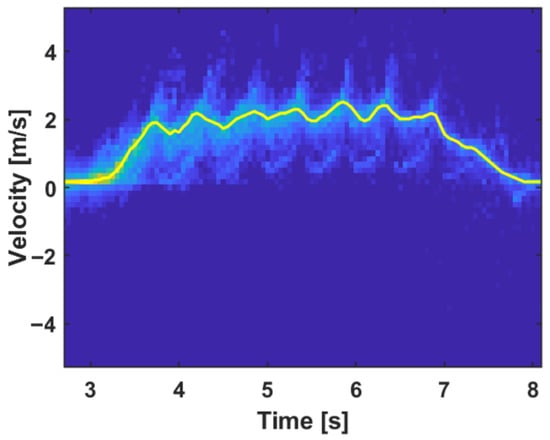
Figure 7.
Baseline envelope .
A total of n contour levels are extracted from the Doppler map. Higher levels correspond to stronger reflected signals, making it more likely that they correspond to specific moving body parts (Foot, Leg, Spine). Figure 8a shows the Doppler map for normal walking, and Figure 8b illustrates the 7 contours extracted from the Doppler map.
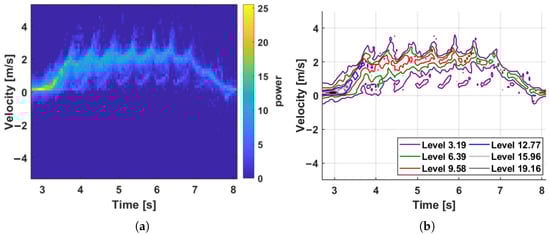
Figure 8.
Doppler map for normal walking, , and the extracted contours (Contour plot): (a) Doppler map; (b) extracted contours.
The various contours extracted from the Doppler map may result in multiple velocity values at the same time frame, so a process of connecting them into a single line is necessary. This can be achieved by calculating the average of the velocity values at each level to generate a representative velocity , as shown in (13).
The index i refers to the level. For each , the gaps are filled using a moving average to create . Figure 9 shows the results after applying the interpolation process.
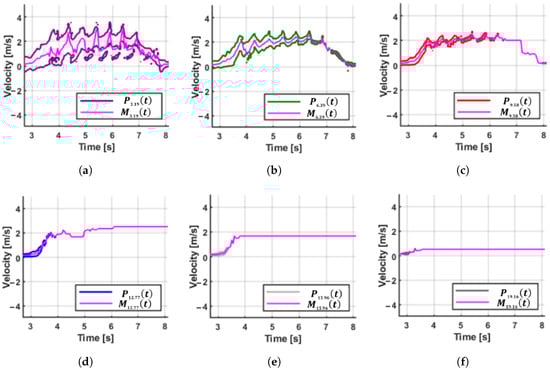
Figure 9.
Interpolated power values for and : (a) Level 3.19; (b) Level 6.39; (c) Level 9.58; (d) Level 12.77; (e) Level 15.96; (f) Level 19.16.
The correlation between the baseline envelope in Figure 7 and the contour-based envelope obtained from Figure 9 is calculated using (14), quantifying the similarity with the baseline envelope. For similarity calculation, we use the Pearson correlation, which is simple and widely used [20,21]. Table 1 shows the results of the correlation calculation. The top three levels with the highest correlation scores are selected as candidate envelopes for Foot, Leg, and Spine. The three envelopes with the highest values are considered to have significant periodicity, and the corresponding level power values are chosen as parameters to extract the Doppler envelope. In Table 1, the level power values of 3.1927, 6.3853, and 9.578 are selected.

Table 1.
MAC values between the baseline envelope and the contour-based envelopes. The first row indicates the power level, and the second row shows the corresponding MAC value.
After profiling the relationship between the level power values and various speeds, as shown in Figure 9, the representative speed values corresponding to the three representative level powers obtained from Table 1 are selected as the representative speed values. In Figure 10a, the 8 representative speed values are selected. Among them, the speed values corresponding to Foot, Leg, and Spine are determined as follows.
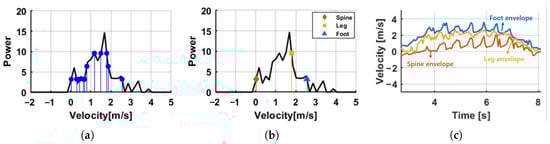
Figure 10.
Envelope extraction process: (a) speeds corresponding to level powers 3.19, 6.38, and 9.58; (b) speed points corresponding to Spine, Leg, and Foot; (c) extracted Spine, Leg, and Foot envelopes.
- Foot: Generally, during walking, the foot moves the fastest, so the highest speed is selected.
- Leg: The speed closest to the baseline envelope is selected.
- Spine: Since the spine moves slower than the leg during walking, the smallest speed is selected.
Figure 10b shows the three speed values corresponding to Foot, Leg, and Spine, which were determined based on the criteria from (14)–(16) for several speed values selected in Figure 10a. Figure 10c shows the Doppler envelopes corresponding to Foot, Leg, and Spine.
A step-by-step pseudocode of the proposed Doppler envelope extraction algorithm is presented in Appendix A.
3. Experiments and Result
3.1. Radar and Experimental Processing
The radar used in the experiment is the Bitsensing MOD630 FMCW RADAR, and Table 2 shows the radar specifications.
Table 2.
MOD630 FMCW radar specifications.
Figure 11 shows the experimental setup and the positions where motion capture sensors were attached. The experiment was conducted in a hallway with a width of 1.85 m. Participants walked approximately 5 m, from the 1-meter mark to the 6-meter mark, with their backs facing a radar installed at a height of 1.15 m. The radar signals were converted into a Doppler map, and the proposed method was used to automatically extract Doppler envelopes corresponding to each body part (Spine, Leg, Foot). Ground truth data was obtained using motion capture sensors, which were attached to the top of Foot, Leg, and Spine, in order to measure the actual speed of each body part during walking. The motion capture system used in this study was the Perception Neuron Studio (Noitom Ltd., Beijing, China), which provides full-body wireless tracking at an output rate of up to 240 Hz. A total of five inertial sensors were used, attached to Spine, both Legs, and both Feet. The marker placement followed a standard full-body tracking protocol to capture the representative motion of each region. The experiment was conducted with five participants, each with different physical characteristics, and Table 3 shows the physical conditions of the participants.
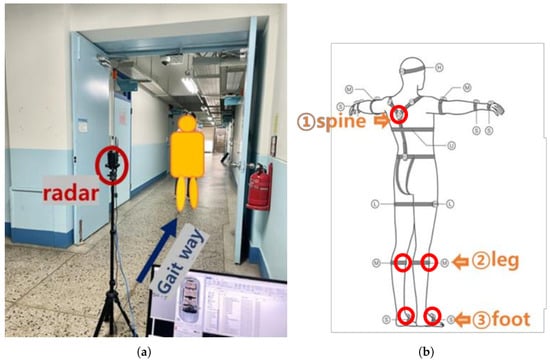
Figure 11.
(a) Experimental environment (b) motion capture sensor placement.
Table 3.
Physical characteristics of experimental subjects.
3.2. Result
3.2.1. Doppler Envelope
The experimental data is used to extract Doppler envelopes using both the traditional percentile-based method and the proposed method. For comparison, the conventional method extracts Doppler envelopes by selecting the 5%, 25%, 50%, 75%, and 95%, while the proposed method automatically extracts three Doppler envelopes corresponding to the Foot, Leg, and Spine. As shown in Figure 6 and Figure 10c, the Doppler envelopes are extracted for the subjects using the existing method and the proposed method, respectively.
To evaluate the effectiveness of the proposed Doppler envelope extraction method, we compared the speed values estimated using three methods: the conventional percentile-based method, the proposed contour-based method, and the ground truth. The average velocity of a Doppler envelope is defined as the mean of its peak values. Figure 12 presents the estimated speeds for each body part (Foot, Leg, Spine) across Subject 3.
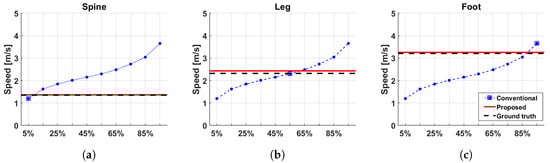
Figure 12.
Speed comparison of Subject 3 obtained using the conventional method, the proposed method, and the ground truth. (a) Spine, (b) Leg, (c) Foot.
As shown in Figure 12, the proposed method consistently produced speed estimates that closely align with those of the ground truth across all body parts. While the conventional method requires manual selection of percentiles for each body part, the proposed method automatically determines the representative velocities without the need for manual tuning. This not only simplifies the process but also improves consistency and robustness in speed estimation.
3.2.2. Gait Parameters
The gait parameters can be computed using the Doppler envelope extracted by the proposed method, as outlined in (19)–(23). Figure 13 shows the range envelope and Doppler envelope for each subject, with the steps marked on the graphs.
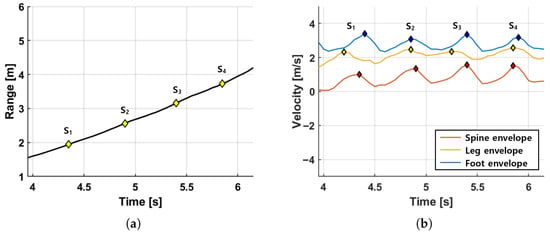
Figure 13.
Range and Doppler envelopes of Subject 3 with walking steps marked. (a) Range envelope, (b) Doppler envelopes of Spine, Leg, and Foot.
Speed refers to the walking speed, Step time is the time it takes to take one step, Step length is the distance of one step, Stride time is the time it takes to take two steps, and Stride length is the distance of two steps.
Figure 14 presents a subject-wise comparison of the speed values estimated by the conventional method, the proposed method, and the ground truth for each body part (Spine, Leg, Foot). This figure allows for direct visual comparison of the actual estimated values. It can be observed that the proposed method consistently provides speed values closer to the ground truth compared to the conventional method, especially for the Spine and Leg.
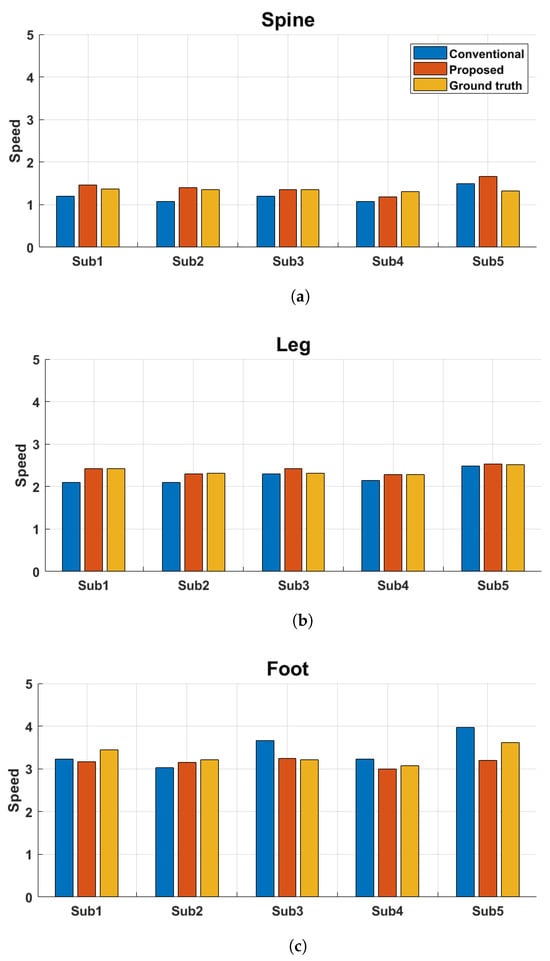
Figure 14.
Comparison of speed values for each subject using three methods: conventional (blue), proposed (red), and ground truth (yellow). (a) Spine, (b) Leg, (c) Foot.
Figure 15 illustrates the distribution of relative errors (%) in five gait parameters—Speed, Step Time, Step Length, Stride Time, and Stride Length—across the Foot, Leg, and Spine regions. The blue and orange boxes represent the conventional percentile-based method and the proposed contour-based method, respectively.
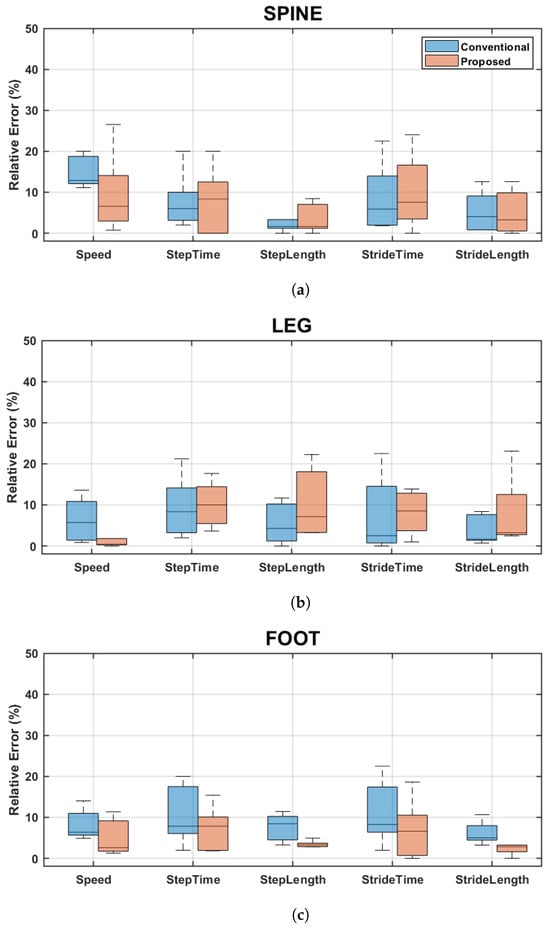
Figure 15.
Boxplots showing the relative errors between estimated values and ground truth across 5 subjects, categorized by body part (Spine, Leg, Foot) and gait parameter (Speed, Step Time, Step Length, Stride Time, Stride Length) for both the conventional and proposed methods. (a) Spine, (b) Leg, (c) Foot.
The relative error for each parameter was computed as:
This metric quantifies the percentage deviation of the radar-estimated value from the ground truth provided by the motion capture system.
In general, both methods demonstrate comparable levels of accuracy, with the proposed method showing slightly reduced variability in several parameters. Notably, the proposed approach exhibits more compact error distributions for Foot Speed, Leg Speed, and Foot Stride Length, while a few parameters such as Leg Step Length and Spine Stride Time show wider spreads, indicating the presence of occasional outliers.
To provide a quantitative summary of these distributions, Table 4 reports the mean and standard deviation of the relative errors for each gait parameter and body region.
Table 4.
Mean and standard deviation of the relative error (%) for each gait parameter and body region.
Table 4 presents the mean and standard deviation of the relative errors (%) for each gait parameter and body region. The results indicate that the proposed method achieves similar or slightly improved accuracy compared to the conventional method in most cases. Although the average relative error for some parameters exceeds the often-cited clinical threshold of 5%, key metrics such as Foot Speed (5.10% ± 4.52%), Leg Speed (1.28% ± 1.96%), and Foot Stride Length (2.29% ± 1.35%) remain well within acceptable ranges.
When interpreted together, the figure and table offer complementary insights; the boxplots highlight the typical distribution and spread of errors, showing that the proposed method often reduces variability and outliers; meanwhile, the summary statistics in Table 4 capture the overall accuracy and stability of both methods. For example, while the mean error for Spine Stride Time in the proposed method exceeds 10%, the boxplot reveals that this is primarily due to one or two outlying cases, with most estimates clustered below that level. This comparison reinforces the observation that the proposed method achieves consistent and reliable performance across most gait parameters, even in the presence of individual variations.
Compared to conventional radar-based gait estimation methods, which often rely on fixed percentile thresholds [16,17,18,19], the proposed contour-based method offers a more adaptive and automated approach to envelope extraction. This adaptability reduces the dependency on human expertise and enhances robustness across individuals with different gait characteristics.
To quantitatively evaluate the performance of the proposed Doppler envelope extraction method, paired t-tests were conducted between the gait parameter values obtained using the proposed method and the ground truth.
Table 5 presents the results of a paired t-test comparing the average values of gait parameters estimated by the proposed method against the ground truth. Across all parameters and body regions (Spine, Leg, Foot), the p-values were greater than 0.05, indicating no statistically significant difference between the proposed method and the ground truth. This result suggests that the proposed method provides gait parameter estimates that are statistically equivalent to those obtained using the motion capture system.
Table 5.
Paired t-test results comparing the gait parameter values obtained by the proposed method and the ground truth for Spine, Leg, Foot.
However, some gait parameters showed relatively large numerical differences despite being statistically insignificant. For instance, the Foot speed showed a difference of 0.16 m/s (Proposed: 3.150 m/s, GT: 3.310 m/s; ), and the Step Length of the Leg differed by 0.05 m (Proposed: 0.700 m, GT: 0.650 m; ). Although these differences were not statistically significant, they may reflect slightly higher estimation variability in parameters involving more dynamic movement, such as the Foot.
These results demonstrate that the proposed method closely approximates the gold-standard values provided by the motion capture system. The consistency across various gait parameters supports its potential as a reliable and non-invasive tool for radar-based gait analysis, though further validation with a larger sample size could help reduce variability and improve generalizability.
4. Conclusions
This paper introduced a contour-based method for Doppler envelope extraction that addresses key limitations of conventional percentile-based approaches in FMCW radar gait analysis. The conventional percentile-based Doppler envelope extraction method required manual selection of Doppler envelopes for the Spine, Leg, and Foot, which limited its practicality and consistency. In contrast, the proposed method automatically extracts the Doppler envelopes for these body parts, addressing the limitations of the conventional approach.
To verify the accuracy and generalizability of the proposed method, experiments were conducted on five participants (three female and two male) with varying heights. Key gait parameters—such as walking speed, step length, and stride time—were compared with ground truth values obtained from a motion capture system. In most cases, the relative error remained within an acceptable range, typically below 10%. Notably, the proposed method consistently estimated the speeds of the Foot, Leg, and Spine regions with relative error levels comparable to the conventional method, demonstrating that it can serve as a viable alternative.
Since the manual work required in percentile-based methods is eliminated, the proposed technique is expected to significantly improve the practicality of radar-based gait analysis. This contactless approach can be utilized not only in hospitals or rehabilitation centers but also in everyday environments such as homes.
For example, if a radar is mounted on a wall in the residence of an elderly person living alone, the system can automatically extract Doppler envelopes without the need for expert supervision. This enables continuous daily monitoring of walking patterns, where any abnormal changes can trigger alerts—facilitating early detection of potential health issues or incidents.
Moreover, the proposed algorithm exhibits low computational complexity, making it suitable for real-time applications. In our MATLAB R2023a implementation, the algorithm processed 30 s of radar data in approximately 1.74 s on a workstation equipped with a 32-core CPU and 128 GB of RAM. We believe the computational cost is acceptable, and further improvements could be achieved through algorithmic optimization or GPU acceleration.
Nevertheless, this study has several limitations. The sample size is modest, and the validation was conducted only on participants with normal gait patterns. This limits the generalizability of the results to pathological gait conditions.
Additionally, while statistical tests showed no significant differences, a few parameters exhibited larger deviations that may impact clinical interpretation—particularly in detecting small changes over time in longitudinal gait monitoring. Therefore, while the proposed method holds strong potential as a practical and fully automated alternative for long-term gait monitoring systems, further evaluation in pathological and dynamic real-world settings is necessary to confirm its clinical reliability.
Future research should therefore include individuals with abnormal gait and explore integration with machine learning or deep learning techniques to further enhance the accuracy and robustness of the Doppler envelope extraction process.
Author Contributions
Conceptualization, S.K.; Data curation, S.K.; Formal analysis, S.K.; Investigation, S.K.; Methodology, S.K.; Project administration, H.-C.S.; Resources, H.-C.S.; Software, S.K.; Supervision, H.-C.S.; Validation, H.-C.S.; Visualization, S.K. and H.-C.S.; Writing—original draft, S.K.; Writing—review & editing, H.-C.S. All authors have read and agreed to the published version of the manuscript.
Funding
This work was supported by the National Research Foundation of Korea (NRF) grant funded by the Ministry of Science and ICT (MSIT) of the Korean government (RS-2024-00422599).
Institutional Review Board Statement
This study did not involve any physical or behavioral intervention and did not collect any personally identifiable or biometric information. According to the Bioethics and Safety Act of the Republic of Korea (Articles 2 and 15), and Article 13 of its Enforcement Rule, such research is exempt from IRB review. Therefore, ethics committee approval was not required. All procedures involving human participants were conducted in accordance with the ethical standards of the relevant institutional and national research committees.
Informed Consent Statement
Informed consent was obtained from all subjects involved in the study.
Data Availability Statement
The raw data supporting the conclusions of this article will be made available by the authors on request.
Conflicts of Interest
The authors declare no conflicts of interest.
Appendix A. Pseudocode of Proposed Doppler Envelope Extraction
| Algorithm A1 Pseudocode of Proposed Doppler Envelope Extraction. |
| Input: : Denoised Doppler map (velocity vs time), : Number of contour levels (e.g., 7) Output: , , : Estimated velocity envelopes
|
References
- Morris, R.; Lord, S.; Bunce, J.; Burn, D.; Rochester, L. Gait and cognition: Mapping the global and discrete relationships in ageing and neurodegenerative disease. Neurosci. Biobehav. Rev. 2016, 64, 245–326. [Google Scholar] [CrossRef] [PubMed]
- Hackett, R.A.; Davies-Kershaw, H.; Cadar, D.; Orrell, M.; Steptoe, A. Walking speed, cognitive function and dementia risk in the English longitudinal study of ageing. J. Am. Geriatr. Soc. 2018, 66, 1670–1675. [Google Scholar] [CrossRef] [PubMed]
- Saho, K.; Shioiri, K.; Fujimoto, M.; Kobayashi, Y. Micro-Doppler Radar Gait Measurement to Detect Age- and Fall Risk-Related Differences in Gait: A Simulation Study on Comparison of Deep Learning and Gait Parameter-Based Approaches. IEEE Access 2021, 9, 18518–18526. [Google Scholar] [CrossRef]
- Perry, J.; Burnfield, J.M. Gait Analysis: Normal and Pathological Function, 2nd ed.; Slack Incorporated: Thorofare, NJ, USA, 2010. [Google Scholar]
- Bohannon, R.W. Comfortable and maximum walking speed of adults aged 20–79 years: Reference values and determinants. Age Ageing 1997, 26, 15–19. [Google Scholar] [CrossRef] [PubMed]
- Schwartz, M.H.; Rozumalski, A.; Steele, K.M. Gait Analysis: Clinical and Instrumented; Elsevier: Amsterdam, The Netherlands, 2022. [Google Scholar]
- Gholami, F.; Trojan, D.A.; Kövecses, J.; Haddad, W.M.; Gholami, B. A Microsoft Kinect-Based Point-of-Care Gait Assessment Framework for Multiple Sclerosis Patients. IEEE J. Biomed. Health Inform. 2016, 21, 1376–1385. [Google Scholar] [CrossRef] [PubMed]
- Lee, H.; Guan, L.; Lee, I. Video Analysis of Human Gait and Posture to Determine Neurological Disorders. EURASIP J. Image Video Process. 2008, 2008, 380867. [Google Scholar] [CrossRef]
- Abedi, H.; Boger, J.; Morita, P.P.; Wong, A.; Shaker, G. Hallway Gait Monitoring Using Novel Radar Signal Processing and Unsupervised Learning. IEEE Sens. J. 2022, 22, 15133–15145. [Google Scholar] [CrossRef]
- Seifert, A.K.; Amin, M.G.; Zoubir, A.M. Toward Unobtrusive In-Home Gait Analysis Based on Radar Micro-Doppler Signatures. IEEE Trans. Biomed. Eng. 2019, 66, 2629–2640. [Google Scholar] [CrossRef] [PubMed]
- Wang, F.; Skubic, M.; Rantz, M.; Cuddihy, P.E. Quantitative Gait Measurement with Pulse-Doppler Radar for Passive In-Home Gait Assessment. IEEE Trans. Biomed. Eng. 2014, 61, 2434–2443. [Google Scholar] [CrossRef] [PubMed]
- Quaiyum, F.; Tran, N.; Piou, J.E.; Kilic, O.; Fathy, A.E. Noncontact Human Gait Analysis and Limb Joint Tracking Using Doppler Radar. IEEE J. Electromagn. RF Microw. Med. Biol. 2018, 3, 61–70. [Google Scholar] [CrossRef]
- Alshamaa, D.; Soubra, R.; Chkeir, A. A Radar Sensor for Automatic Gait Speed Analysis in Walking Tests. IEEE Sens. J. 2021, 21, 13886–13894. [Google Scholar] [CrossRef]
- Li, H.; Mehul, A.; Le Kernec, J.; Gurbuz, S.Z.; Fioranelli, F. Sequential Human Gait Classification with Distributed Radar Sensor Fusion. IEEE Sens. J. 2020, 21, 7590–7603. [Google Scholar] [CrossRef]
- Wang, D.; Park, J.; Kim, H.J.; Lee, K.; Cho, S.H. Noncontact Extraction of Biomechanical Parameters in Gait Analysis Using a Multi-Input and Multi-Output Radar Sensor. IEEE Access 2021, 9, 138496–138508. [Google Scholar] [CrossRef]
- Seifert, A.K.; Grimmer, M.; Zoubir, A.M. Doppler Radar for the Extraction of Biomechanical Parameters in Gait Analysis. IEEE J. Biomed. Health Inform. 2020, 25, 547–558. [Google Scholar] [CrossRef] [PubMed]
- Saho, K.; Shioiri, K.; Kudo, S.; Fujimoto, M. Estimation of Gait Parameters from Trunk Movement Measured by Doppler Radar. IEEE J. Electromagn. RF Microw. Med. Biol. 2022, 6, 461–469. [Google Scholar] [CrossRef]
- Karabacak, C.; Gurbuz, S.Z.; Gurbuz, A.C.; Guldogan, M.B.; Hendeby, G.; Gustafsson, F. Knowledge Exploitation for Human Micro-Doppler Classification. IEEE Geosci. Remote Sens. Lett. 2015, 12, 2125–2129. [Google Scholar] [CrossRef]
- Saho, K.; Uemura, K.; Sugano, K.; Matsumoto, M. Using Micro-Doppler Radar to Measure Gait Features Associated with Cognitive Functions in Elderly Adults. IEEE Access 2019, 7, 24122–24131. [Google Scholar] [CrossRef]
- Benesty, J.; Chen, J.; Huang, Y.; Cohen, I. Pearson Correlation Coefficient. In Noise Reduction in Speech Processing; Springer Topics in Signal Processing; Springer: Berlin/Heidelberg, Germany, 2009; Volume 2, pp. 1–4. [Google Scholar]
- Rodgers, J.L.; Nicewander, W.A. Thirteen Ways to Look at the Correlation Coefficient. Am. Stat. 1988, 42, 59–66. [Google Scholar] [CrossRef]
Disclaimer/Publisher’s Note: The statements, opinions and data contained in all publications are solely those of the individual author(s) and contributor(s) and not of MDPI and/or the editor(s). MDPI and/or the editor(s) disclaim responsibility for any injury to people or property resulting from any ideas, methods, instructions or products referred to in the content. |
© 2025 by the authors. Licensee MDPI, Basel, Switzerland. This article is an open access article distributed under the terms and conditions of the Creative Commons Attribution (CC BY) license (https://creativecommons.org/licenses/by/4.0/).