

Assessment of Multi-Depth Water Quality Dynamics in an Artificial Lake: A Case Study of the Ribnica Reservoir in Serbia


Abstract
1. Introduction
2. Materials and Methods
2.1. Study Area and Sampling
- Sampling was conducted at three profiles within Ribnica Reservoir (Figure 1):
- Profile A1: 43.68547° N, 19.66423° E.
- Profile B1: 43.68358° N, 19.67232° E.
- Profile C1: 43.68136° N, 19.68158° E.
- Sampling depths included:
- Profile A1: 50 cm, 200 cm, 350 cm, 500 cm, 800 cm, 1000 cm, 1200 cm.
- Profile B1: 50 cm, 200 cm, 350 cm, 400 cm, 450 cm.
- Profile C1: 50 cm.

2.2. Water Quality Indices (WQI) Analysis
2.3. Data Processing and Analysis
3. Results
3.1. Serbian Water Quality Index (SWQI)
3.2. Canadian Water Quality Index (CWQI)
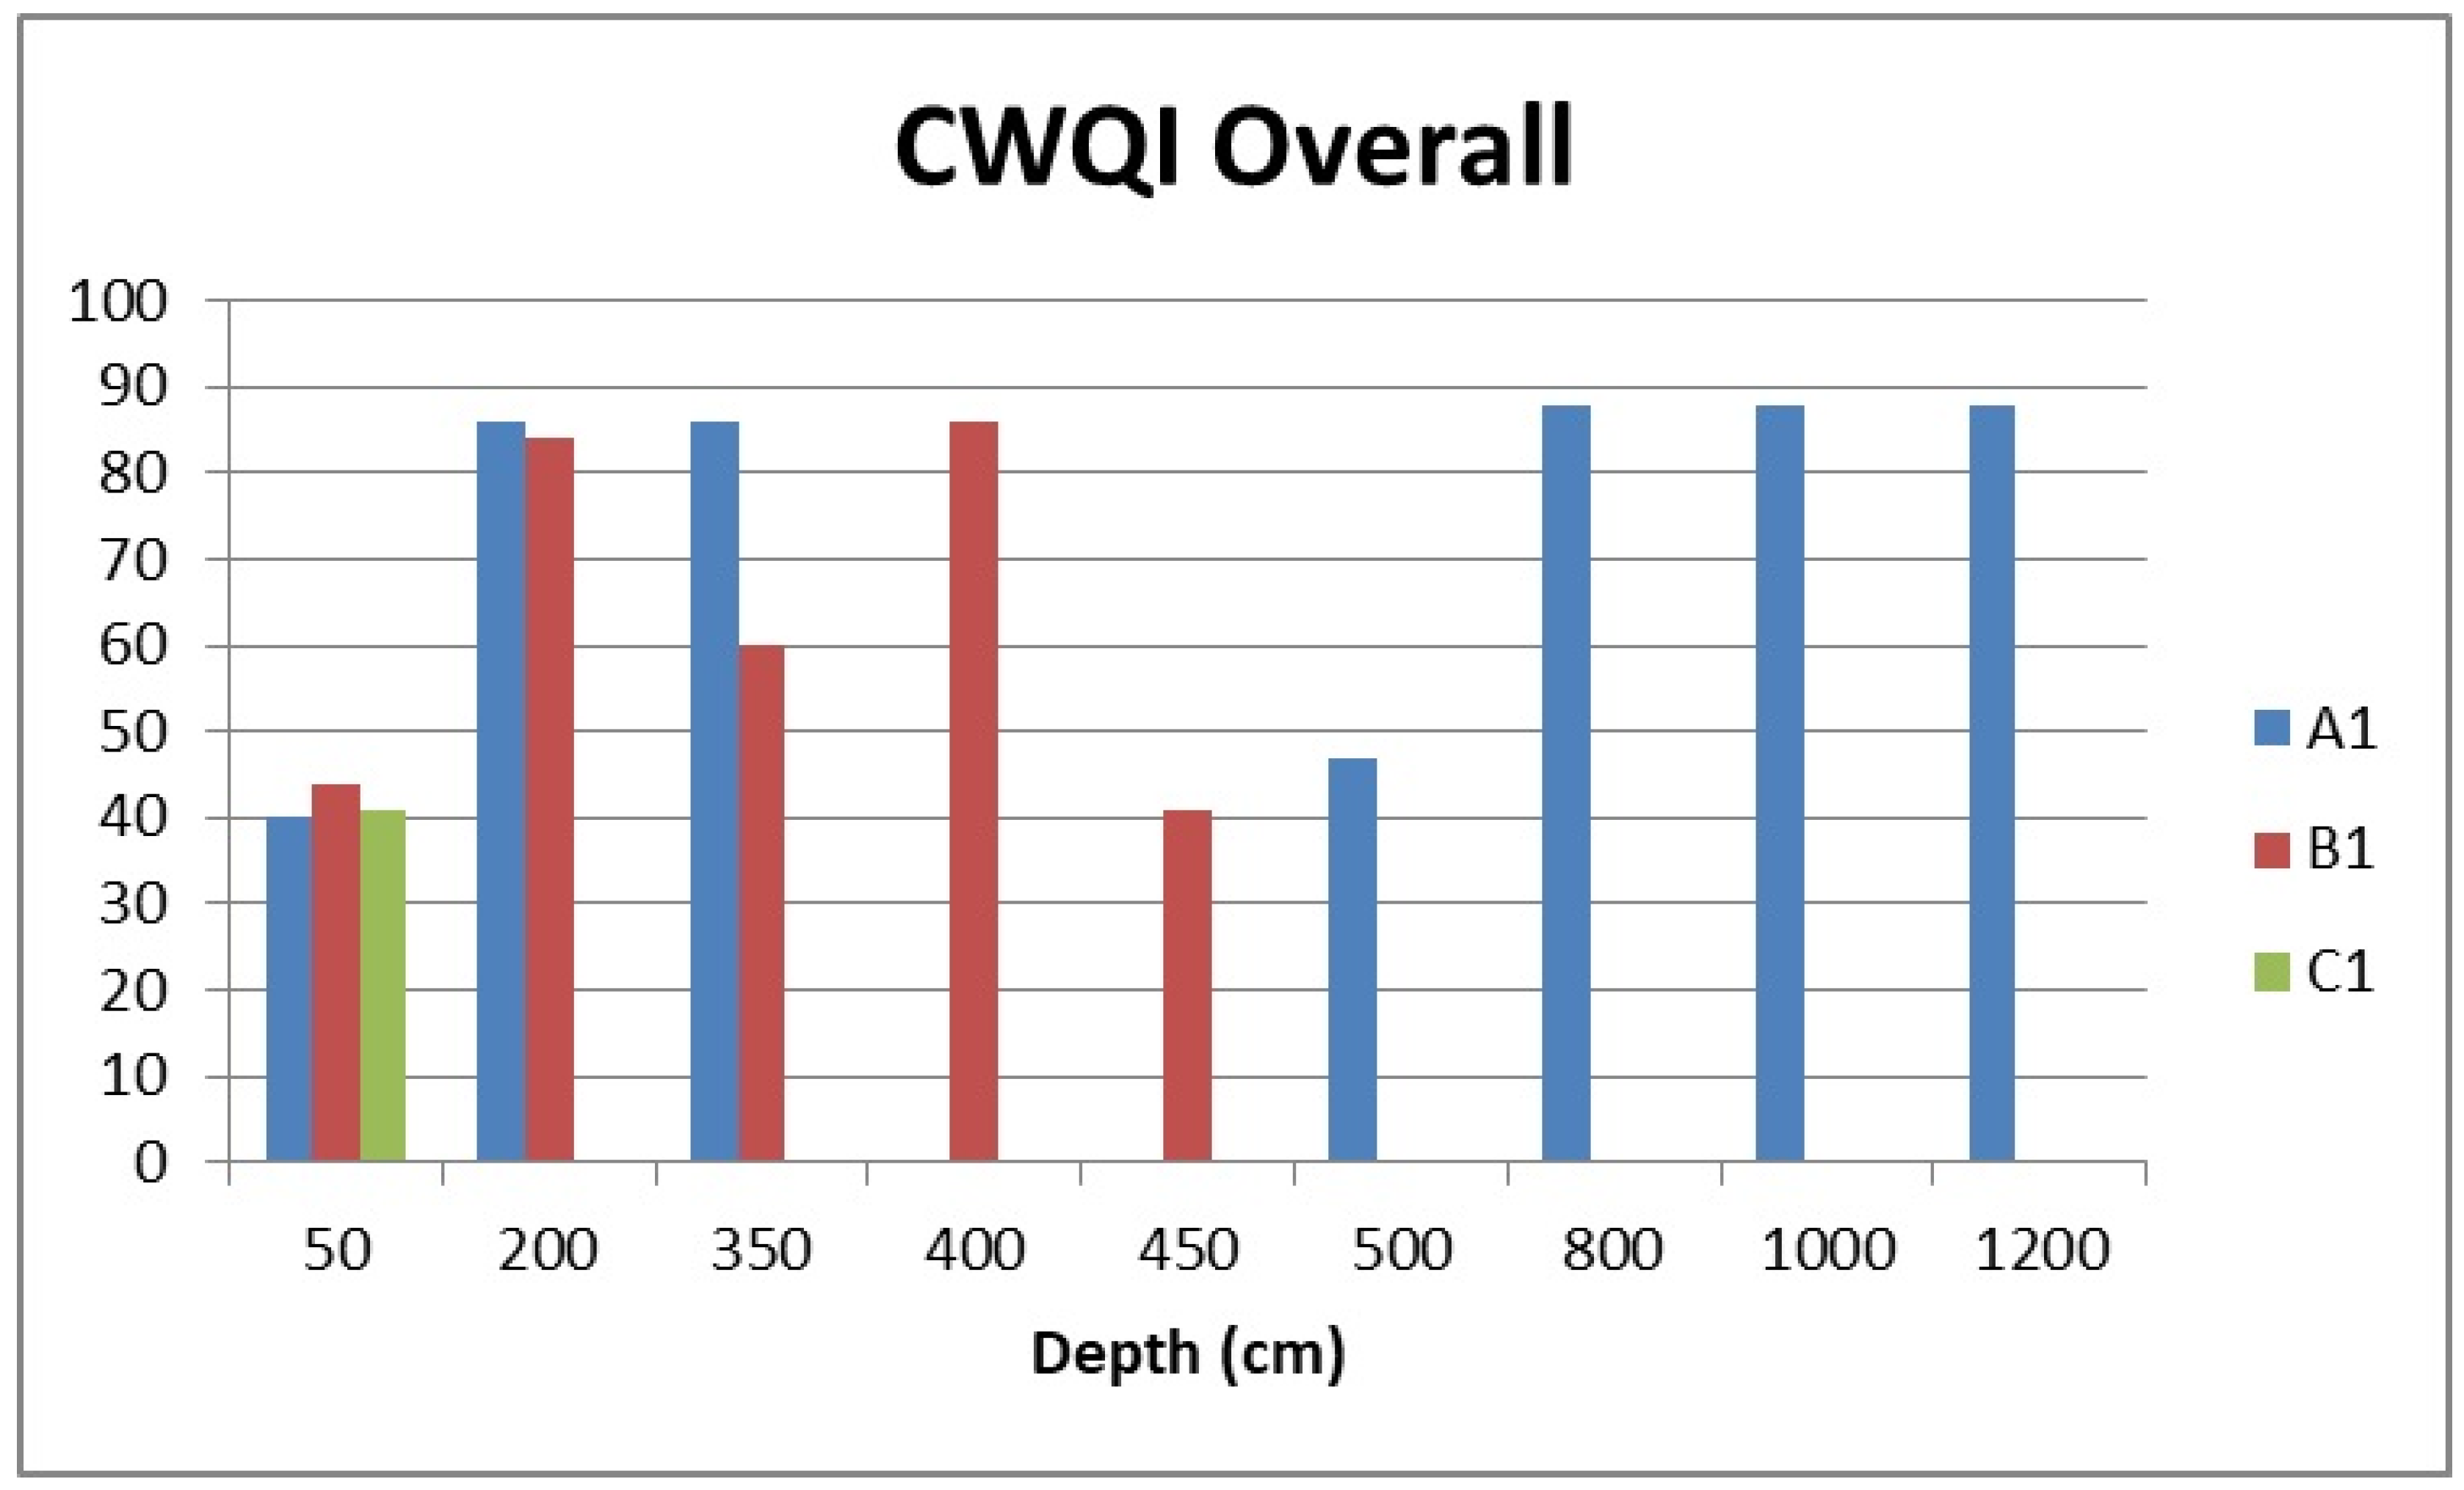
3.2.1. Overall Water Quality
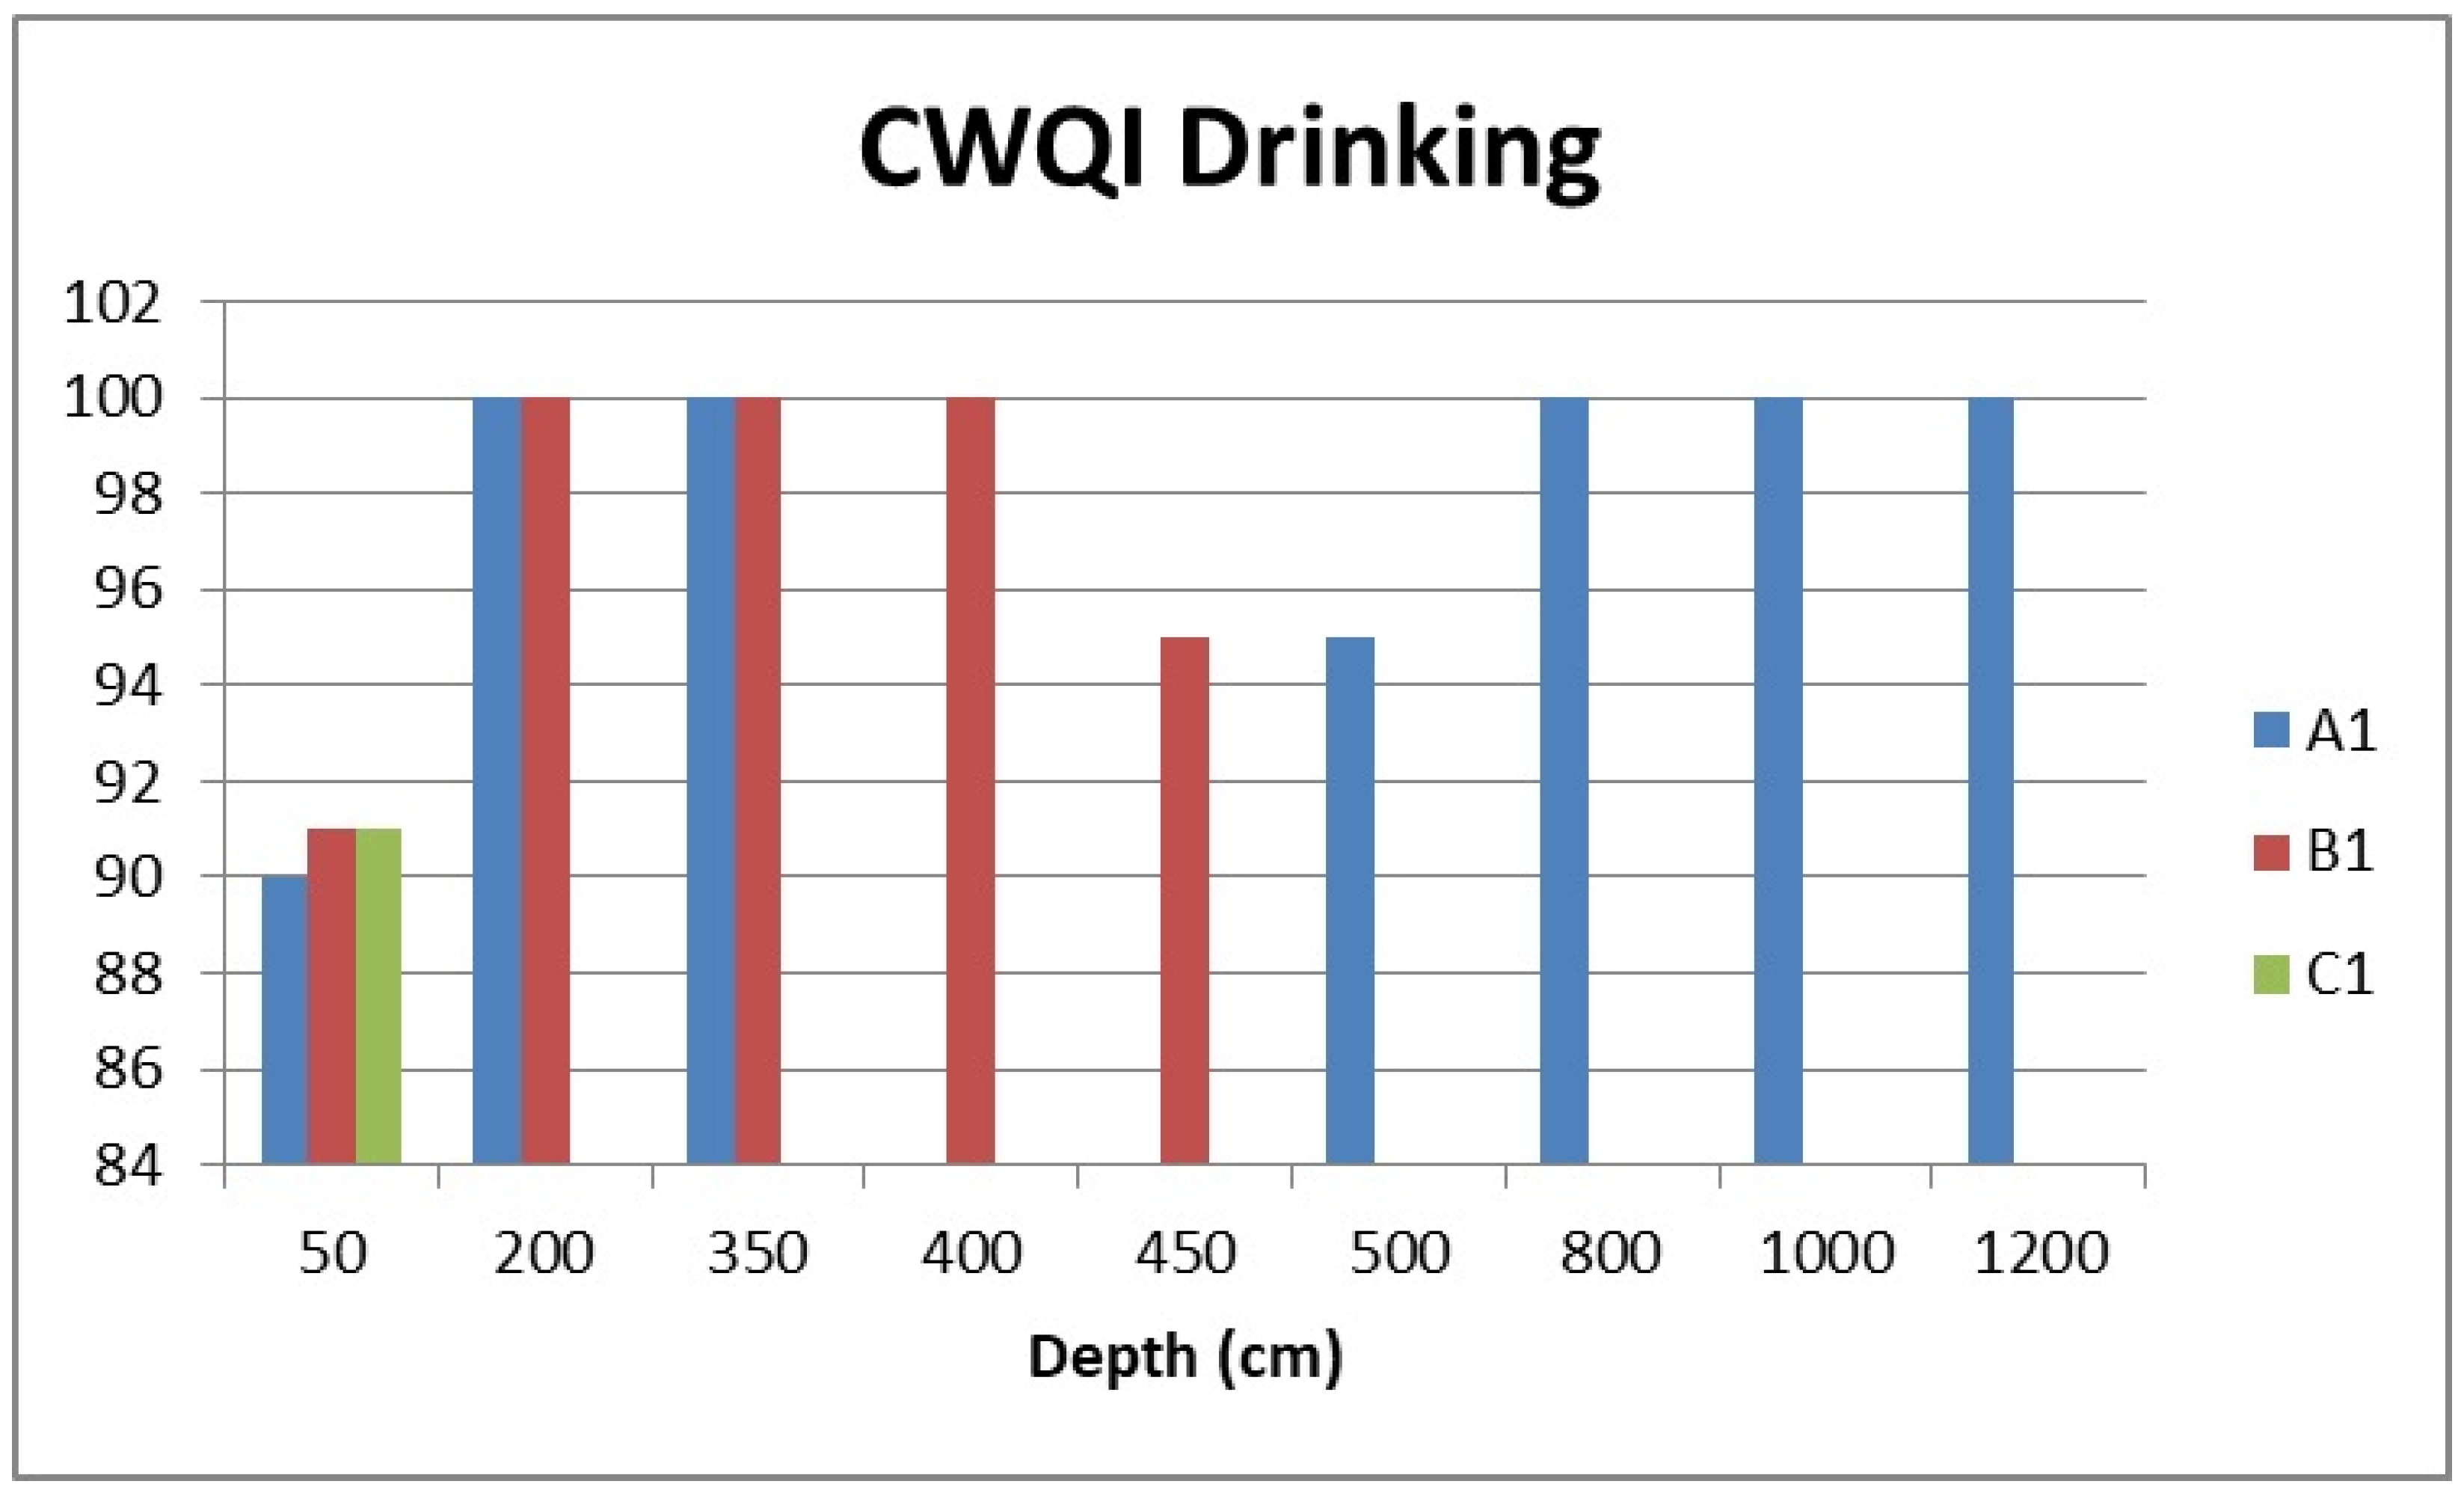
3.2.2. Drinking Water Quality
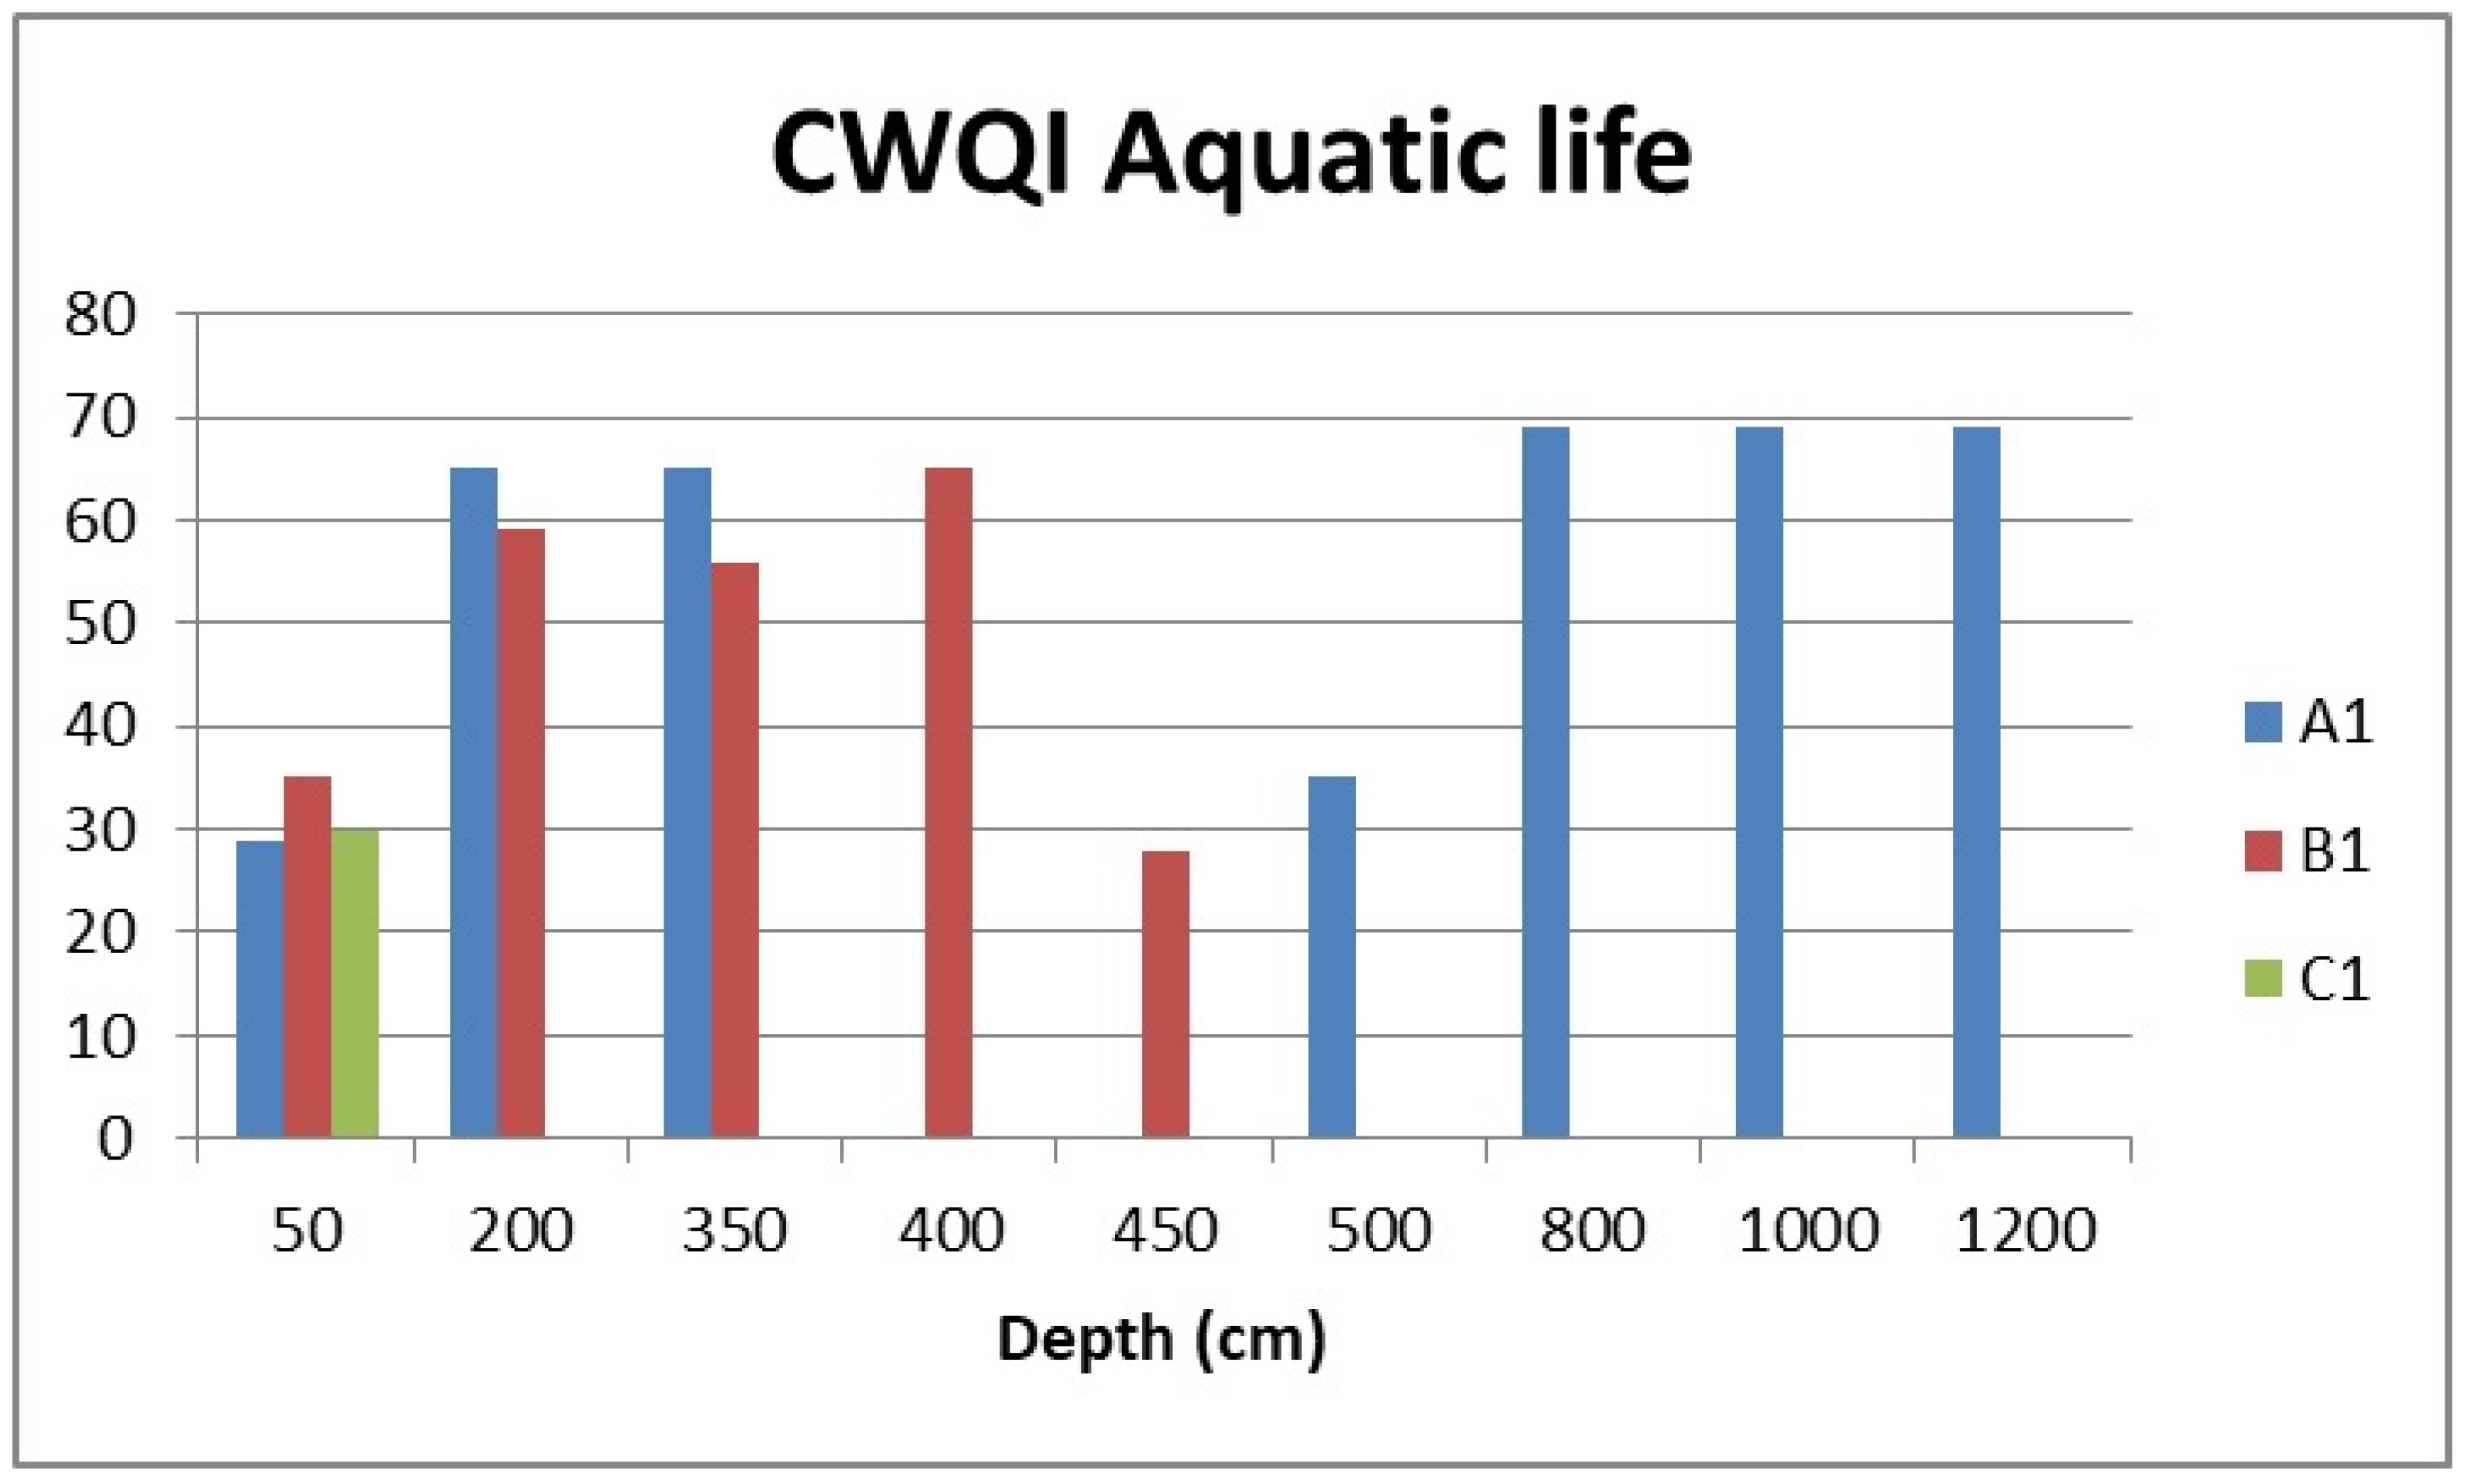
3.2.3. Water Quality for Aquatic Life
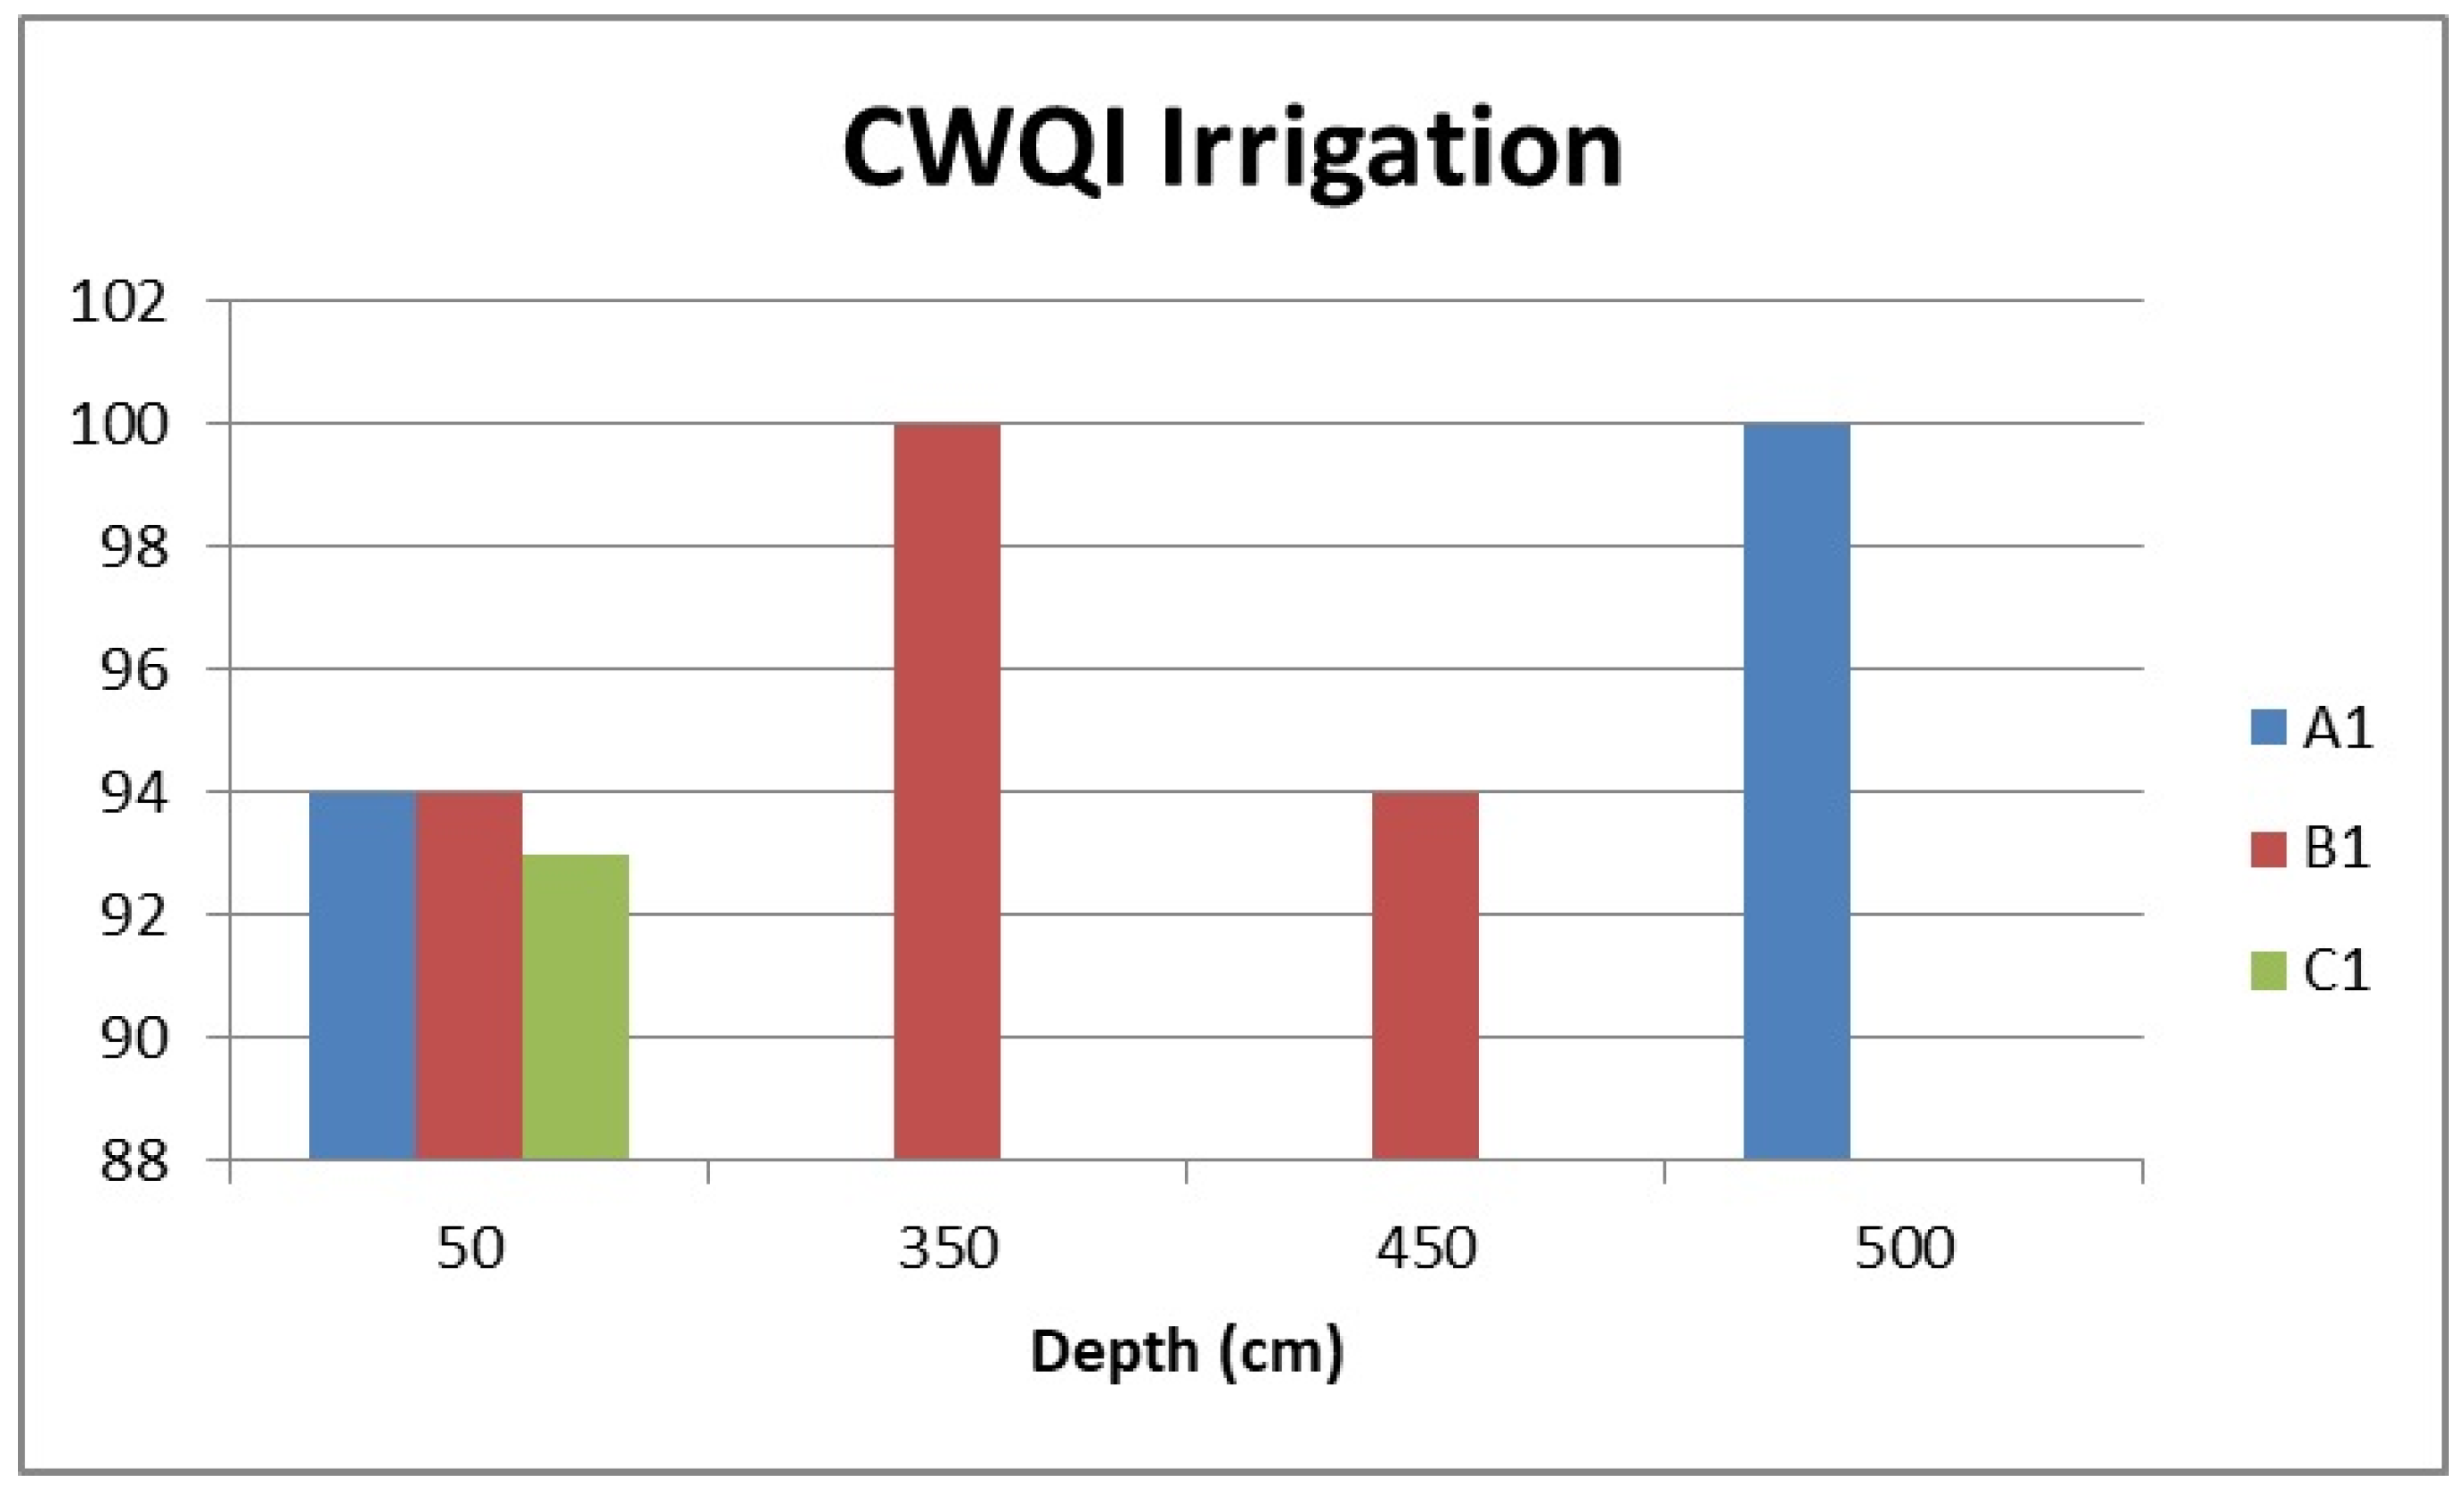
3.2.4. Water Quality for Agriculture
4. Discussion
4.1. Cumulative Ecological Impacts
4.2. Comparative Analysis of SWQI and CWQI in the Ribnica Reservoir
5. Conclusions
Author Contributions
Funding
Institutional Review Board Statement
Informed Consent Statement
Data Availability Statement
Conflicts of Interest
References
- Janicka, E.; Kanclerz, J.; Agaj, T. Ecological Importance of Alkaline Phosphatase Activity and Acid Phosphatase Activity in Lakes with Different Catchment Use Structures. Appl. Sci. 2024, 14, 497. [Google Scholar] [CrossRef]
- Saxena, V. Water Quality, Air Pollution, and Climate Change: Investigating the Environmental Impacts of Industrialization and Urbanization. Water Air Soil Pollut. 2025, 236, 73. [Google Scholar] [CrossRef]
- Mezhevova, A.; Berestneva, Y.; Belyaev, A. The current chemical composition of inland water bodies of the Volga-Akhtuba floodplain (Russia). J. Geogr. Inst. Jovan Cvijic SASA 2024, 74, 147–164. [Google Scholar] [CrossRef]
- Liu, S.; Lu, J.; Adriaenssens, E.M.; Wang, J.; McCarthy, A.J.; Sekar, R. Industrial and agricultural land uses affected the water quality and shaped the bacterial communities in the inflow rivers of Taihu Lake. Front. Environ. Sci. 2024, 12, 1340875. [Google Scholar] [CrossRef]
- Ma, L.; Song, X.; Tang, C.; Yang, S. Water quality degradation caused by human activities and the management strategies in China: A review. Sci. Total Environ. 2022, 807, 150842. [Google Scholar] [CrossRef]
- Zou, X.Y.; Peng, X.Y.; Zhao, X.X.; Chang, C.P. The impact of extreme weather events on water quality: International evidence. Nat. Hazards 2023, 115, 1–21. [Google Scholar] [CrossRef]
- Woolway, R.I.; Sharma, S.; Smol, J.P. Lakes in Hot Water: The Impacts of a Changing Climate on Aquatic Ecosystems. BioScience 2022, 72, 1050–1061. [Google Scholar] [CrossRef]
- Jiang, X.L.; Wang, W.F. Climate change and aquatic ecosystem health: Impacts, adaptation strategies, and future challenges. Int. J. Aquac. 2024, 14, 221–231. [Google Scholar] [CrossRef]
- Bogdanović, M.; Blagajac, I. Decentralization of the urban tourist zone of Zlatibor. In Proceedings of the 31st International conference Ecological Truth & Environmental Research-EcoTER’24, Sokobanja, Serbia, 18–21 June 2024. [Google Scholar]
- Karadžić, V.; Subakov-Simić, G.; Krizmanić, J.; Natić, D. Phytoplankton and eutrophication development in the water supply reservoirs Garaši and Bukulja (Serbia). Desalination 2010, 255, 91–96. [Google Scholar] [CrossRef]
- Devic, G.; Đorđevic, D.; Sakan, S. Freshwater environmental quality parameters of man-made lakes of Serbia. Environ. Monit. Assess. 2014, 186, 5221–5234. [Google Scholar] [CrossRef]
- Sunjog, K.; Kolarević, S.; Kračun-Kolarević, M.; Višnjić-Jeftić, Ž.; Skorić, S.; Gačić, Z.; Lenhardt, M.; Vasić, N.; Vuković-Gačić, B. Assessment of status of three water bodies in Serbia based on tissue metal and metalloid concentration (ICP-OES) and genotoxicity (comet assay). Environ. Pollut. 2016, 213, 600–607. [Google Scholar] [CrossRef]
- Čađo, S.; Novaković, B.; Đurković, A.; Denić, L.; Glišić, T.D.; Stojanović, Z.; Veljković, N.; Domanović, M.; Žarić, D. Ecological potential of accumulations for water supply in Serbia. Voda Sanit. Technol. 2020, 50, 19–40. [Google Scholar]
- Marković, G.; Kostić, A.Ž.; Pantelić, N.Đ.; Maletić, R.; Štrbački, J.; Cakić, J.; Kaluđerović, L.; Dojčinović, B.P.; Giuffrè, A.M.; Popović-Djordjević, J.B. Spatial distribution of major and trace elements in artificial lakes in Serbia: Health risk indices and suitability of water for drinking and irrigation purposes. Environ. Monit. Assess. 2023, 195, 1237. [Google Scholar] [CrossRef]
- Jakovljević, D.; Milijašević Joksimović, D.; Petrović, A.M. Assessment of Lake Water Quality in Central Serbia—Using Serbian and Canadian Water Quality Indices on the Example of the Garaši Reservoir. Sustainability 2025, 17, 4074. [Google Scholar] [CrossRef]
- Milivojević, M.; Obradović, S.; Stevanetić, V.; Drndarević, D. Bicubic Spline Estimator for Probability Density Functions of Raw Water Properties. In Proceedings of the 10th International Scientific Conference Science and Higher Education in Function of Sustainable Development, Mećavnik–Drvengrad, Užice, Serbia, 6–7 October 2017. [Google Scholar]
- Milanović Pešić, A.; Jojić Glavonjić, T.; Denda, S.; Jakovljević, D. Sustainable Tourism Development and Ramsar Sites in Serbia: Exploring Residents’ Attitudes and Water Quality Assessment in the Vlasina Protected Area. Sustainability 2023, 15, 15391. [Google Scholar] [CrossRef]
- Rakićević, T. Klimatske i hidrološke osobine Zlatibora. In Bulletin of the Serbian Geographical Society; Serbian Geographical Society: Belgrade, Serbia, 1963; pp. 17–34. (In Serbian) [Google Scholar]
- Ršumović, R.; Milojević, M.; Lazarević, M. Zlatibor; Serbian Academy of Sciences and Arts: Belgrade, Serbia, 1991; pp. 1–288. (In Serbian) [Google Scholar]
- Official Gazette of the Republic of Serbia, No. 91/2017. Uredba o Proglašenju Parka Prirode “Zlatibor”. Available online: https://pravno-informacioni-sistem.rs/eli/rep/sgrs/vlada/uredba/2017/91/3 (accessed on 3 April 2025). (In Serbian).
- Serbian Environmental Protection Agency. Rezultati Ispitivanja Kvaliteta Površinskih I Podzemnih Voda. 2022–2023. Available online: https://sepa.gov.rs/publikacije/ (accessed on 3 March 2025). (In Serbian)
- Google Earth Pro V 7.3.6.10201. (9 July 2022). Lake Ribnica, Serbia. 43°40′55.58″ N, 19°40′37.00″ E, Eye alt 3.04 km. CNES/Airbus 2025. Available online: https://www.google.com/earth/about/versions/#earth-pro (accessed on 16 April 2025).
- Zotou, I.; Tsihrintzis, V.A.; Gikas, G.D. Comparative assessment of various water quality indices (WQIs) in Polyphytos Reservoir-Aliakmon River, Greece. Proceedings 2018, 2, 611. [Google Scholar] [CrossRef]
- Alexakis, D.; Tsihrintzis, V.A.; Tsakiris, G.; Gikas, G.D. Suitability of water quality indices for application in lakes in the Mediterranean. Water Resour. Manag. 2016, 30, 1621–1633. [Google Scholar] [CrossRef]
- Deep, A.; Gupta, V.; Bisht, L.; Kumar, R. Application of WQI for water quality assessment of high-altitude snow-fed sacred Lake Hemkund, Garhwal Himalaya. Sustain. Water Resour. Manag. 2020, 6, 89. [Google Scholar] [CrossRef]
- Chen, L.; Tian, Z.; Zou, K. Water quality evaluation based on the water quality index method in Honghu Lake: One of the largest shallow lakes in the Yangtze River Economic Zone. Water Supp. 2020, 20, 2145–2155. [Google Scholar] [CrossRef]
- Horvat, M.; Horvat, Z.; Pastor, K. Multivariate analysis of water quality parameters in Lake Palic, Serbia. Environ. Monit. Assess. 2021, 193, 410. [Google Scholar] [CrossRef]
- Khan, M.H.R.B.; Ahsan, A.; Imteaz, M.; Shafiquzzaman, M.; Al-Ansari, N. Evaluation of the surface water quality using global water quality index (WQI) models: Perspective of river water pollution. Sci. Rep. 2023, 13, 20454. [Google Scholar] [CrossRef] [PubMed]
- Baghapour, M.A.; Nasseri, S.; Djahed, B. Evaluation of Shiraz wastewater treatment plant effluent quality for agricultural irrigation by Canadian Water Quality Index (CWQI). Iran J. Environ. Health Sci. Eng. 2013, 10, 27. [Google Scholar] [CrossRef] [PubMed]
- Fataei, E.; Seyyedsharifi, A.; Seiiedsafaviyan, T.; Nasrollahzadeh, S. Water quality assessment based on WQI and CWQI indexes in Balikhlou River, Iran. J. Basic Appl. Sci. Res. 2013, 3, 263–269. [Google Scholar]
- Davies, J.-M. Application and Tests of the Canadian Water Quality Index for Assessing Changes in Water Quality in Lakes and Rivers of Central North America. Lake Reserv. Manag. 2006, 22, 308–320. [Google Scholar] [CrossRef]
- Konare, M.; Gültekin, F.; Hatipoğlu Temizel, E. Using Canadian Water Quality Index method to evaluate the spatio-variation of water quality and the impacts of quality parameters: A case study of Amasya’s surface water (Northern Turkey). Environ. Monit. Assess. 2023, 195, 188. [Google Scholar] [CrossRef]
- Jakovljević, D. Serbian and Canadian Water Quality Index of Danube River in Serbia in 2010. J. Geogr. Inst. Jovan Cvijić SASA 2012, 62, 1–18. [Google Scholar] [CrossRef]
- Leščešen, I.; Pantelić, M.; Dolinaj, D.; Lukić, T. Assessment of water quality of the Tisa River (Vojvodina, North Serbia) for ten-year period using Serbian Water Quality Index (SWQI). Geogr. Pannon. 2014, 18, 102–107. [Google Scholar] [CrossRef]
- Milijašević Joksimović, D.; Gavrilović, B.; Obradović Lović, S. Application of the water quality index in the Timok River basin (Serbia). J. Geogr. Inst. Jovan Cvijić SASA 2018, 68, 333–344. [Google Scholar] [CrossRef]
- Horvat, Z.; Horvat, M.; Pastor, K. Assessment of spatial and temporal water quality distribution in shallow lakes: Case study for Lake Ludas, Serbia. Environ. Earth Sci. 2023, 82, 11. [Google Scholar] [CrossRef]
- Veljković, N.D. Sustainable development indicators: Case study for South Morava river basin. Hem. Ind. 2013, 67, 357–364. [Google Scholar] [CrossRef]
- Canadian Council of Ministers of the Environment (CCME). Canadian Water Quality Index 1.0 Calculator. Available online: https://www.gov.nl.ca/mpa/cwqi/ (accessed on 31 January 2025).
- Scottish Development Department. Development of a Water Quality Index; Applied Research & Development Report Number ARD3; Scottish Development Department: Edinburgh, UK, 1976. [Google Scholar]
- Howarth, R.W.; Chan, F.; Swaney, D.P.; Marino, R.M.; Hayn, M. Role of external inputs of nutrients to aquatic ecosystems in determining prevalence of nitrogen vs. phosphorus limitation of net primary productivity. Biogeochemistry 2021, 154, 293–306. [Google Scholar] [CrossRef]
- Wu, L.; Han, C.; Zhu, G.; Zhong, W. Responses of active ammonia oxidizers and nitrification activity in eutrophic lake sediments to nitrogen and temperature. Appl. Environ. Microbiol. 2019, 85, e00258-19. [Google Scholar] [CrossRef] [PubMed]
- Tambi, A.; Brighu, U.; Gupta, A. Methods for detection and enumeration of coliforms in drinking water: A review. Water Supply 2023, 23, 4047–4058. [Google Scholar] [CrossRef]
- Biguioh, R.M.; Sali Ben Béchir, A.; Nkamedjie Pete, P.M.; Sobze, M.S.; Kemogne, J.B.; Colizzi, V. Microbiological quality of water sources in the West region of Cameroon: Quantitative detection of total coliforms using Micro Biological Survey method. BMC Public Health 2020, 20, 346. [Google Scholar] [CrossRef]
- Nikić, Z.; Srećković-Batoćanin, D.; Burazer, M.; Ristić, R.; Papić, P.; Nikolić, V. A conceptual model of mildly alkaline water discharging from the Zlatibor ultramafic massif, western Serbia. Hydrogeol. J. 2013, 21, 1147–1163. [Google Scholar] [CrossRef]
- Milenić, D.; Milanković, Đ.; Petrić, M.; Savić, N.; Vranješ, A. Integrated management of karstic waters—A case study of the Zlatibor mountain massif, Serbia. Glob. NEST J. 2014, 16, 717–731. [Google Scholar]
- Cvijović, M.; Murić, M.; Čudić, V. Improved chemical treatment of Sušica surface water, Zlatibor area, and sludge application. Mil. Technol. Cour. 2020, 68, 293–320. [Google Scholar] [CrossRef]
- Radibratović, Z.Z.; Cakić, B.B.; Vilotijević, M.N.; Radović, I.R.; Kijevčanin, M.L. Implementation of emergency measures to improve the efficiency of nickel removal from water at the existing water treatment plant. Hem. Ind. 2025, 79, 9–17. [Google Scholar] [CrossRef]
- Sharma, M.; Kant, R.; Sharma, A.K.; Sharma, A.K. Exploring the impact of heavy metals toxicity in the aquatic ecosystem. Int. J. Energ. Water Res. 2025, 9, 267–280. [Google Scholar] [CrossRef]
- El-Sharkawy, M.; Alotaibi, M.O.; Li, J.; Du, D.; Mahmoud, E. Heavy Metal Pollution in Coastal Environments: Ecological Implications and Management Strategies: A Review. Sustainability 2025, 17, 701. [Google Scholar] [CrossRef]
- Drobnjaković, M.; Panić, M.; Stanojević, G.; Doljak, D.; Kokotović Kanazir, V. Detection of the Seasonally Activated Rural Areas. Sustainability 2022, 14, 1604. [Google Scholar] [CrossRef]
- Mihajlović, L.; Potić, I.; Milinčić, M.; Đorđević, D. The influence of rural areas transformation on the urban heat islands occurrence—Tourist center Zlatibor case study. Időjárás 2024, 128, 345–366. [Google Scholar] [CrossRef]


| Parameter | Method/Standard |
|---|---|
| pH | SRPS H.Z1.111:1987 |
| Electrical Conductivity | US EPA 120.1:1982 |
| Oxygen Saturation | SEV:1977 |
| Biochemical Oxygen Demand | SRPS ISO 5815:1994 |
| Ammonium Ion | HACH Method 8155 |
| Total Nitrogen | UP 1.27/PC 12, Chemiluminescence detector CLD |
| Suspended Solids | SRPS H.Z1.160:1987 |
| Orthophosphate | HACH Method 8048 |
| Total Coliforms | SRPS EN ISO 9308-1:2010 |
| Turbidity | UP 1.88/PC 12 |
| Dissolved Oxygen | SRPS ISO 5813:1994 |
| Calcium | ISO 6058:1984 |
| Sulphate | HACH Method 8051 |
| Chloride, Nitrate, Nitrite | SRPS ISO 9297:1997 |
| Arsenic, Cadmium, Chromium, Copper, Iron, Nickel, Zinc, Manganese | EP A 6020A:2014 |
| Mercury | EPA Method 245.7 |
| Lead | EPA 6020 A: 2007 |
| Overall | Drinking | Aquatic | Recreation | Irrigation | Livestock | ||||||
|---|---|---|---|---|---|---|---|---|---|---|---|
| Variables | Units | Lower | Upper | Lower | Upper | Lower | Upper | Lower | Upper | Upper | Upper |
| Al | mg/L | 0.005 | 0.005 | 5 | 5 | ||||||
| As | mg/L | 0.005 | 0.025 | 0.005 | 0.1 | 0.025 | |||||
| Cd | mg/L | 0.005 | 0.005 | 0.0051 | 0.08 | ||||||
| Cr | mg/L | 0.001 | 0.05 | 0.001 | 0.0049 | 0.05 | |||||
| Cu | mg/L | 0.002 | 1 | 0.002 | 0.2 | 0.5 | |||||
| Fe | mg/L | 0.3 | 0.3 | 0.3 | 5 | ||||||
| Hg | µ/L | 0.003 | 1 | 0.1 | 0.003 | ||||||
| Mn | mg/L | 0.05 | 0.05 | 0.2 | |||||||
| Ni | mg/L | 0.025 | 0.025 | 0.2 | 1 | ||||||
| Pb | mg/L | 0.001 | 0.01 | 0.001 | 0.02 | 0.05 | |||||
| Zn | mg/L | 0.03 | 5 | 0.03 | 1 | 50 | |||||
| T (°C) | pH | EC (µS/cm) | OS (%) | BOD (mg/L) | NH4+ (mg/L) | TN (mg/L) | SS (mg/L) | PO43− (mg/L) | TC Coli/100 mg | |||
|---|---|---|---|---|---|---|---|---|---|---|---|---|
| 93–109 | 18 | |||||||||||
| 88–92 | 110–119 | 17 | ||||||||||
| 85–87 | 120–129 | 16 | ||||||||||
| 81–84 | 130–134 | 0–0.9 | 15 | |||||||||
| 78–80 | 135–139 | 1–1.9 | 14 | |||||||||
| 75–77 | 140–144 | 2–2.4 | 13 | |||||||||
| 72–74 | 145–154 | 2.5–2.9 | 0–0.09 | 0–249 | 12 | |||||||
| 69–71 | 155–164 | 3–3.4 | 0.1–0.14 | 250–999 | 11 | |||||||
| 66–68 | 165–179 | 3.5–3.9 | 0.15–0.19 | 1000–3999 | 10 | |||||||
| 6.5–7.9 | 63–65 | 180+ | 4–4.4 | 0.2–0.24 | 4000–7999 | 9 | ||||||
| 6–6.4 | 8–8.4 | 59–62 | 4.5–4.9 | 0.25–0.29 | 0–0.49 | 0–0.029 | 8000–14,999 | 8 | ||||
| 5.8–5.9 | 8.5–8.7 | 55–58 | 5–5.4 | 0.3–0.39 | 0.5–1.49 | 0–9 | 0.03–0.059 | 15,000–24,999 | 7 | |||
| 5.6–5.7 | 8.8–8.9 | 0–188 | 50–54 | 5.5–6.1 | 0.4–0.49 | 1.5–2.49 | 10–14 | 0.06–0.099 | 25,000–44,999 | 6 | ||
| 0–17.4 | 5.4–5.5 | 9–9.1 | 189–239 | 45–49 | 6.2–6.9 | 0.5–0.59 | 2.5–3.49 | 15–19 | 0.1–0.129 | 45,000–79,999 | 5 | |
| 17.5–19.4 | 5.2–5.3 | 9.2–9.4 | 240–289 | 40–44 | 7–7.9 | 0.6–0.99 | 3.5–4.49 | 20–29 | 0.13–0.179 | 80,000–139,999 | 4 | |
| 19.5–21.4 | 5–5.1 | 9.5–9.9 | 290–379 | 35–39 | 8–8.9 | 1–1.99 | 4.5–5.49 | 30–44 | 0.18–0.219 | 140,000–249,999 | 3 | |
| 21.5–22.9 | 4.5–4.9 | 10–10.4 | 380–539 | 25–34 | 9–9.9 | 2–3.99 | 5.5–6.99 | 45–64 | 0.22–0.279 | 250,000–429,999 | 2 | |
| 23–24.9 | 3.5–4.4 | 10.5–11.4 | 540–839 | 10–24 | 10–14.9 | 4–9.99 | 7–9.99 | 65–119 | 0.28–0.369 | 430,000–749,999 | 1 | |
| 25+ | 0–3.4 | 11.5–14 | 840+ | 0–9 | 15+ | 10+ | 10+ | 120+ | 0.37 | 750,000+ | 0 | |
| Index | Category | Score Range |
|---|---|---|
| SWQI | Excellent | 90–100 |
| SWQI | Good | 84–89 |
| SWQI | Medium | 72–83 |
| SWQI | Bad | 39–71 |
| SWQI | Very Bad | 0–38 |
| CWQI | Excellent | 95–100 |
| CWQI | Good | 80–94 |
| CWQI | Fair | 65–79 |
| CWQI | Marginal | 45–64 |
| CWQI | Poor | 0–44 |
| Profile | A1 | A1 | A1 | A1 | A1 | A1 | A1 | B1 | B1 | B1 | B1 | B1 | C1 |
|---|---|---|---|---|---|---|---|---|---|---|---|---|---|
| Depth (cm) | 50 | 200 | 350 | 500 | 800 | 1000 | 1200 | 50 | 200 | 350 | 400 | 450 | 50 |
| Temperature (°C) | 18.5 | 17.3 | 15.4 | 13 | 9.2 | 5.7 | 5.4 | 19.1 | 16.8 | 15.5 | 14.9 | 13.8 | 19.0 |
| pH | 8.15 | 8.21 | 8.21 | 7.65 | 7.48 | 7.50 | 7.46 | 8.19 | 8.26 | 8.18 | 7.73 | 7.81 | 8.22 |
| Electrical Conductivity (µS/cm) | 190.0 | 189.5 | 188.5 | 167.5 | 158.0 | 158.5 | 159.5 | 196.0 | 194.0 | 194.0 | 182.5 | 179.0 | 201.0 |
| Oxygen Saturation (%) | 90.0 | 89.0 | 86.5 | 71.0 | 64.5 | 66.5 | 62.5 | 92.0 | 91.0 | 88.5 | 79.5 | 68.0 | 95.0 |
| Biochemical Oxygen Demand (mg/L) | 4.8 | - | - | 5.1 | - | - | - | 4.7 | - | 4.2 | - | 4.8 | 5.3 |
| Suspended Solids (mg/L) | 4 | - | - | 4 | - | - | - | 4 | - | 4 | - | 4 | 4 |
| Total Nitrogen Oxides (mg/L) | 0.295 | 0.185 | 0.205 | 0.375 | 0.515 | 0.530 | 0.480 | 0.315 | 0.320 | 0.310 | 0.320 | 0.65 | 0.715 |
| Orthophosphates (mg/L) | 0.030 | 0.028 | 0.033 | 0.033 | 0.028 | 0.029 | 0.034 | 0.027 | 0.029 | 0.027 | 0.023 | 0.025 | 0.029 |
| Ammonium (mg/L) | 0.035 | 0.045 | 0.045 | 0.070 | 0.070 | 0.080 | 0.085 | 0.045 | 0.045 | 0.055 | 0.055 | 0.055 | 0.045 |
| Profile | A1 | A1 | A1 | A1 | A1 | A1 | A1 | B1 | B1 | B1 | B1 | B1 | C1 |
|---|---|---|---|---|---|---|---|---|---|---|---|---|---|
| Depth (cm) | 50 | 200 | 350 | 500 | 800 | 1000 | 1200 | 50 | 200 | 350 | 400 | 450 | 50 |
| Temperature (°C) | 19.4 | 16.9 | 11.9 | 9.1 | 6.8 | 6.0 | 5.8 | 19.5 | 16.3 | 12.5 | 11.4 | 10.4 | 19.5 |
| pH | 7.93 | 8.05 | 7.91 | 7.65 | 7.5 | 7.47 | 7.46 | 7.89 | 7.98 | 7.93 | 7.86 | 7.78 | 7.92 |
| Electrical Conductivity (µS/cm) | 181 | 172 | 68 | 163 | 158 | 157 | 157 | 179 | 172 | 181 | 179 | 171 | 188 |
| Oxygen Saturation (%) | 95 | 100 | 94 | 86 | 80 | 79 | 78 | 94 | 95 | 94 | 91 | 88 | 96 |
| Biochemical Oxygen Demand (mg/L) | 3.49 | - | - | - | - | - | - | 1.23 | - | - | - | 1.41 | 1.34 |
| Suspended Solids (mg/L) | 4 | - | - | - | - | - | - | 4 | - | - | - | 4 | 4 |
| Total Nitrogen Oxides (mg/L) | 0.400 | 0.400 | 0.500 | 0.700 | 0.800 | 0.600 | 0.600 | 0.600 | 0.600 | 0.300 | 0.300 | 0.300 | 0.400 |
| Orthophosphates (mg/L) | 0.032 | 0.026 | 0.032 | 0.031 | 0.032 | 0.035 | 0.038 | 0.048 | 0.054 | 0.039 | 0.038 | 0.048 | 0.013 |
| Ammonium (mg/L) | 0.060 | 0.060 | 0.100 | 0.040 | 0.050 | 0.050 | 0.120 | 0.040 | 0.030 | 0.030 | 0.030 | 0.020 | 0.030 |
| Profile | A1 | A1 | A1 | A1 | A1 | A1 | A1 | B1 | B1 | B1 | B1 | B1 | C1 |
|---|---|---|---|---|---|---|---|---|---|---|---|---|---|
| Depth (cm) | 50 | 200 | 350 | 500 | 800 | 1000 | 1200 | 50 | 200 | 350 | 400 | 450 | 50 |
| 2021 | 88 | 95 | 95 | 83 | 85 | 86 | 85 | 88 | 95 | 90 | 94 | 82 | 86 |
| 2022 | 93 | 98 | 95 | 95 | 92 | 89 | 89 | 94 | 95 | 97 | 97 | 97 | 95 |
| Profile | A1 | A1 | A1 | A1 | A1 | A1 | A1 | B1 | B1 | B1 | B1 | B1 | C1 |
|---|---|---|---|---|---|---|---|---|---|---|---|---|---|
| Depth (cm) | 50 | 200 | 350 | 500 | 800 | 1000 | 1200 | 50 | 200 | 350 | 400 | 450 | 50 |
| 2021 | 41 | 84 | 84 | 44 | 87 | 87 | 87 | 47 | 84 | 57 | 84 | 46 | 45 |
| 2022 | 40 | 100 | 100 | 100 | 100 | 100 | 100 | 41 | 84 | 100 | 100 | 42 | 36 |
| Profile | A1 | A1 | A1 | A1 | A1 | A1 | A1 | B1 | B1 | B1 | B1 | B1 | C1 |
|---|---|---|---|---|---|---|---|---|---|---|---|---|---|
| Depth (cm) | 50 | 200 | 350 | 500 | 800 | 1000 | 1200 | 50 | 200 | 350 | 400 | 450 | 50 |
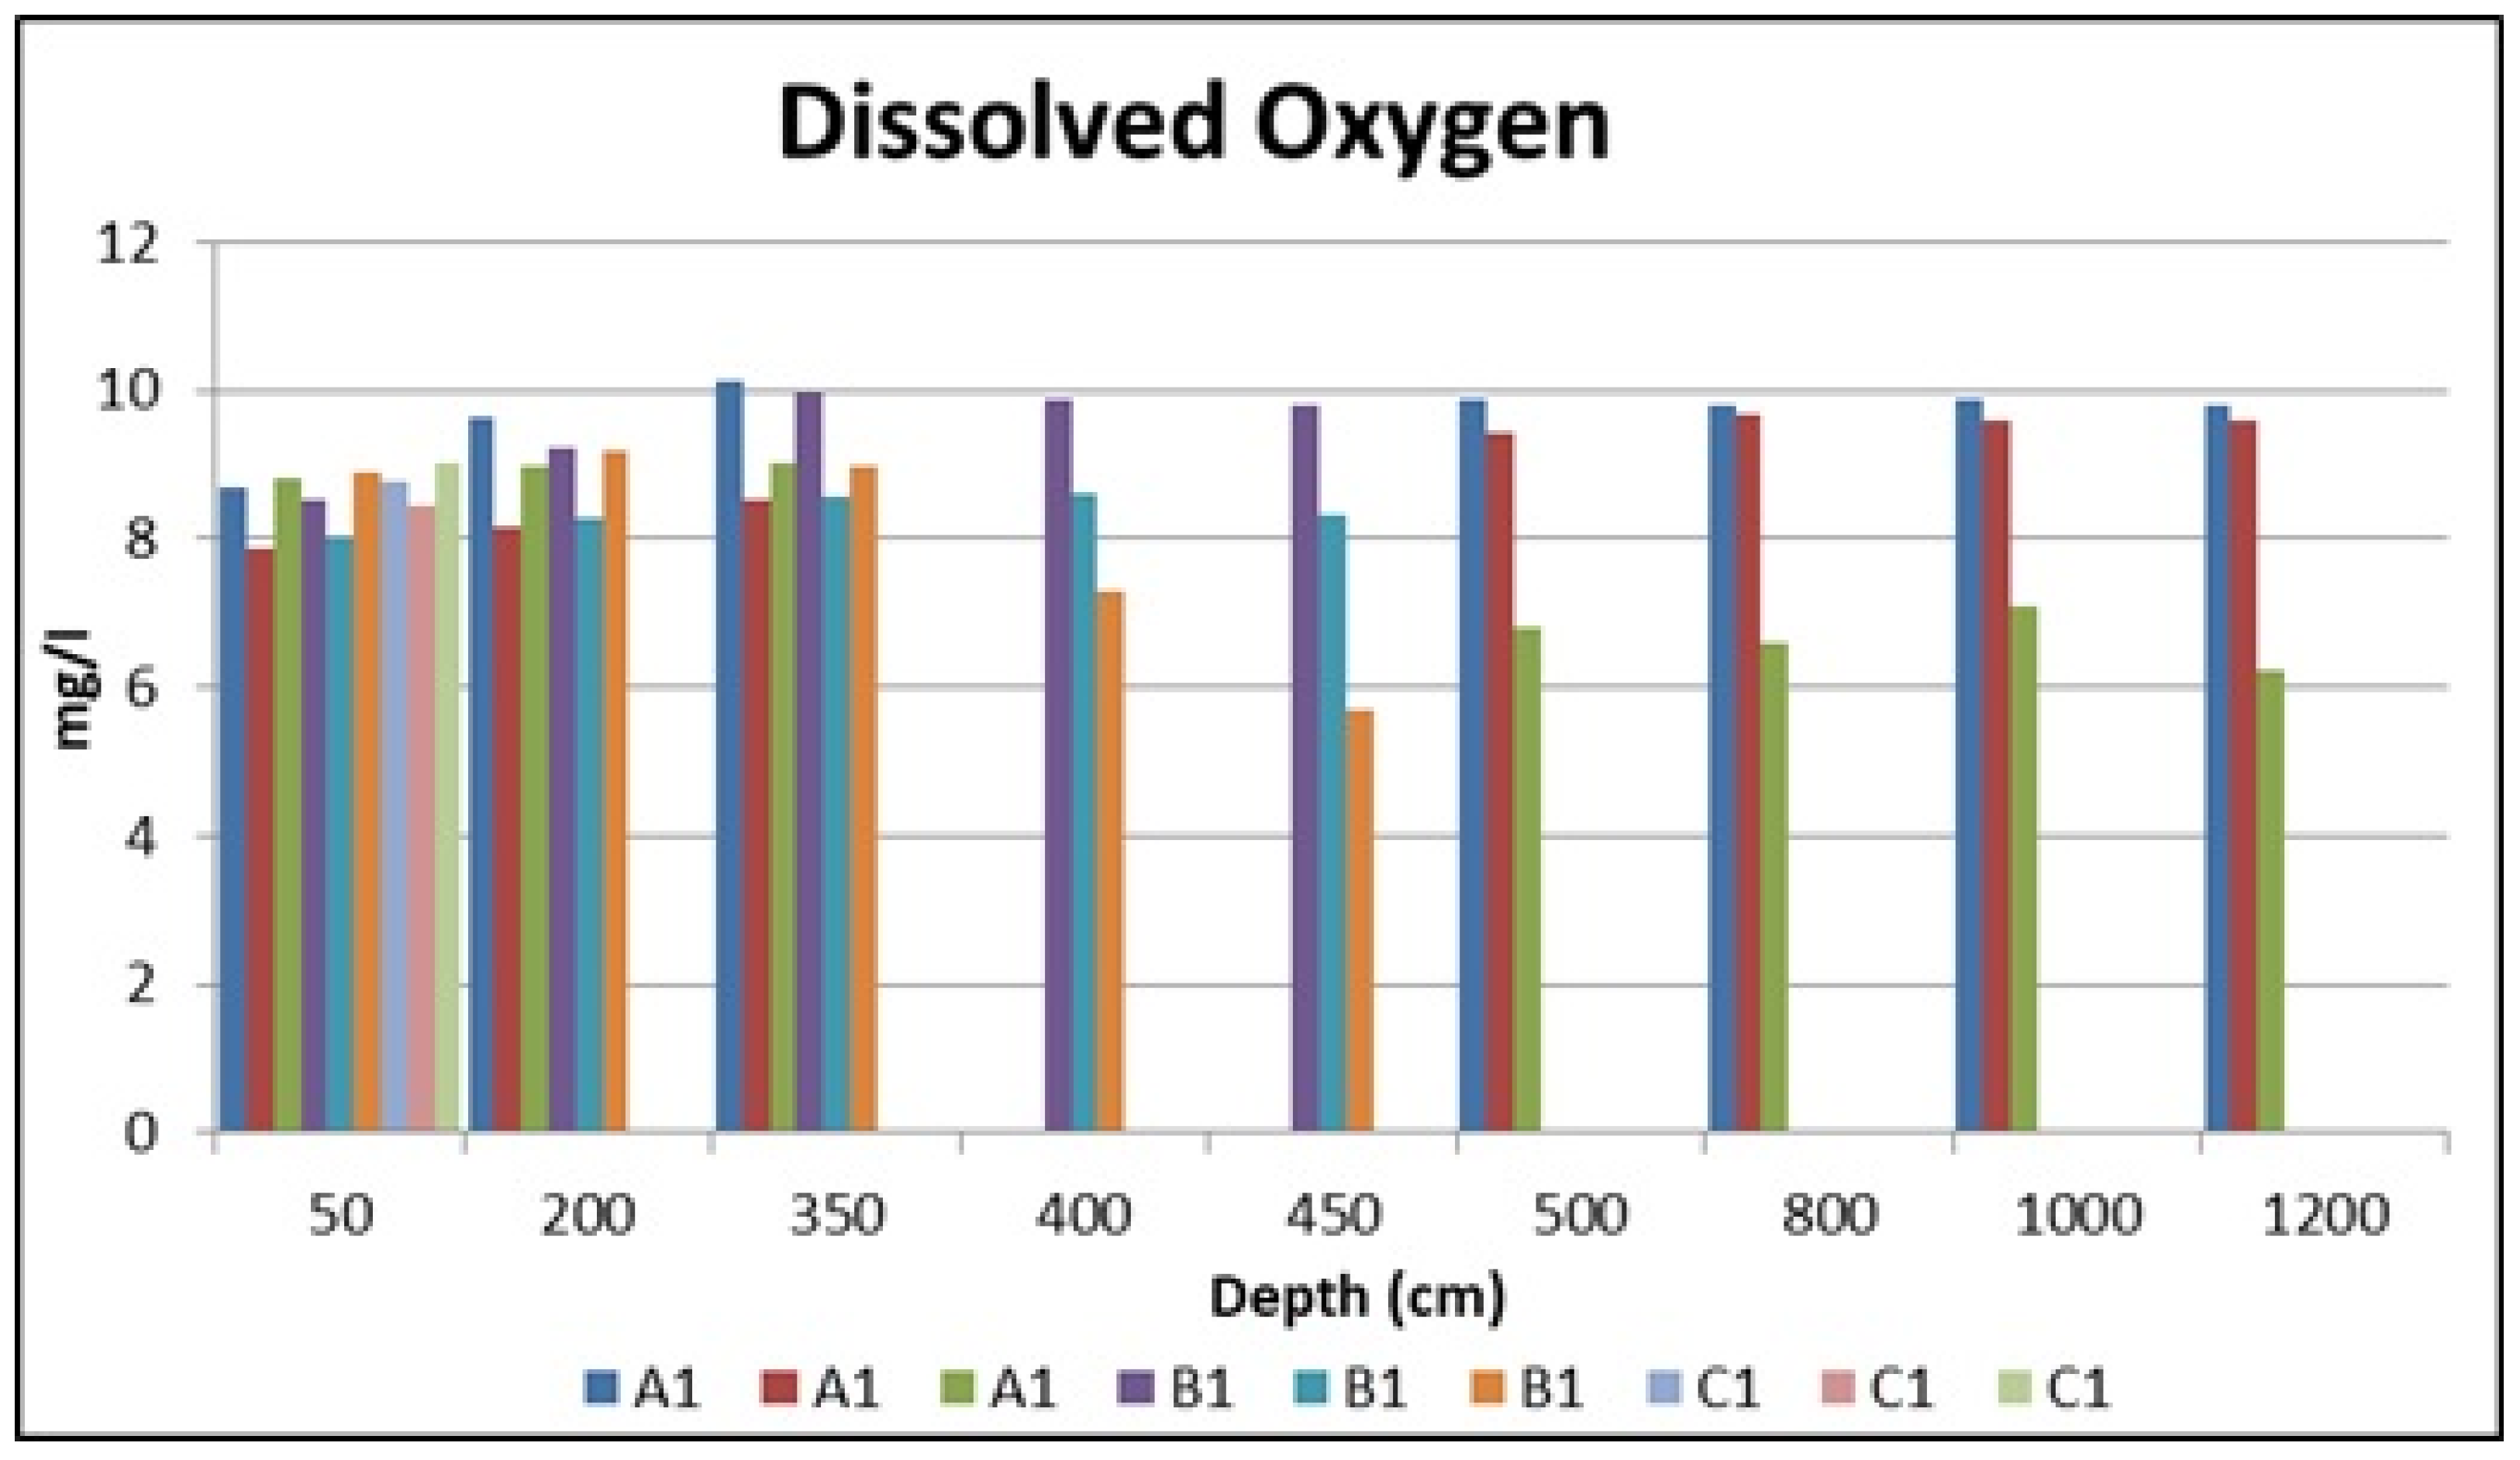
| Dissolved Oxygen (mg/L) | 8.335 | 8.585 | 8.785 | 8.120 | 8.135 | 8.350 | 7.905 | 8.470 | 8.745 | 8.780 | 7.970 | 6.995 | 8.735 |
| Al (mg/L) | 0.218 | - | - | 0.438 | - | - | - | 0.186 | - | 0.094 | - | 0.426 | 0.180 |
| Hg (μg/L) | 0.07 | - | - | 0.07 | - | - | - | 0.07 | - | 0.07 | - | 0.07 | 0.07 |
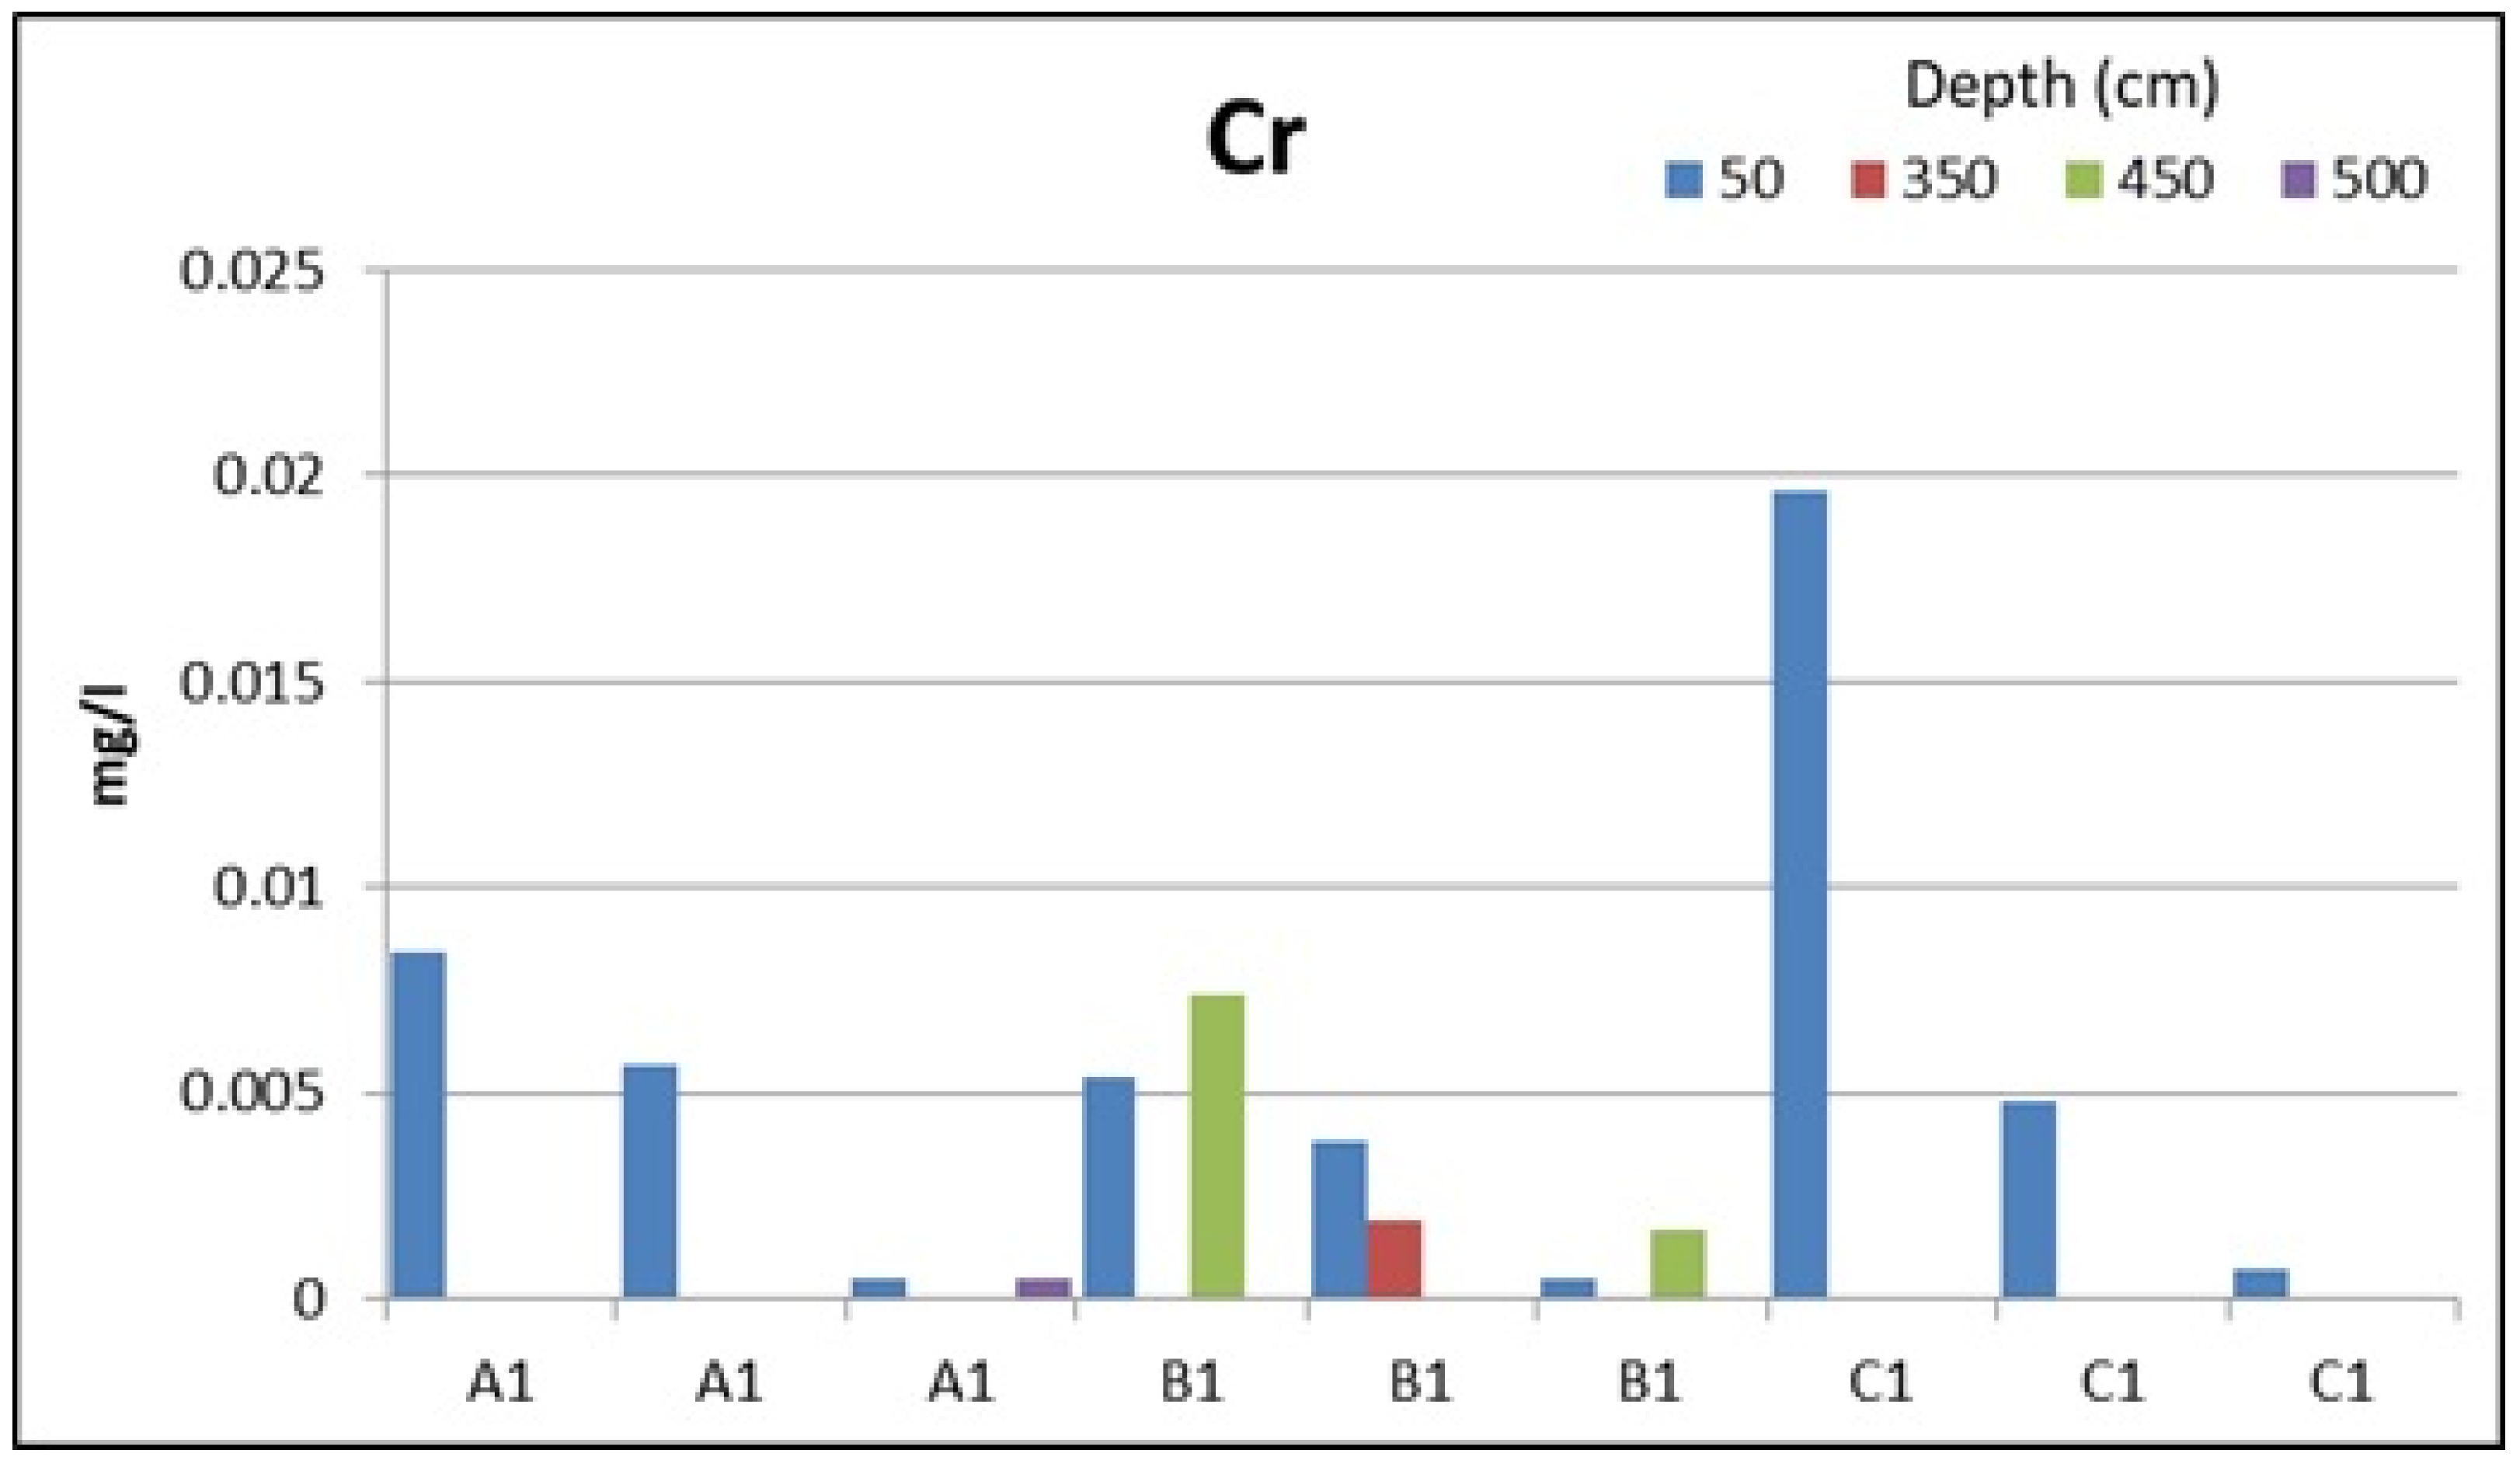
| Cr (mg/L) | 0.0031 | - | - | 0.0005 | - | - | - | 0.0022 | - | 0.0037 | - | 0.0017 | 0.0028 |
| Cu (mg/L) | 0.0024 | - | - | 0.0039 | - | - | - | 0.0021 | - | 0.0019 | - | 0.0067 | 0.002 |
| Mn (mg/L) | 0.059 | - | - | 0.049 | - | - | - | 0.037 | - | 0.010 | - | 0.048 | 0.004 |
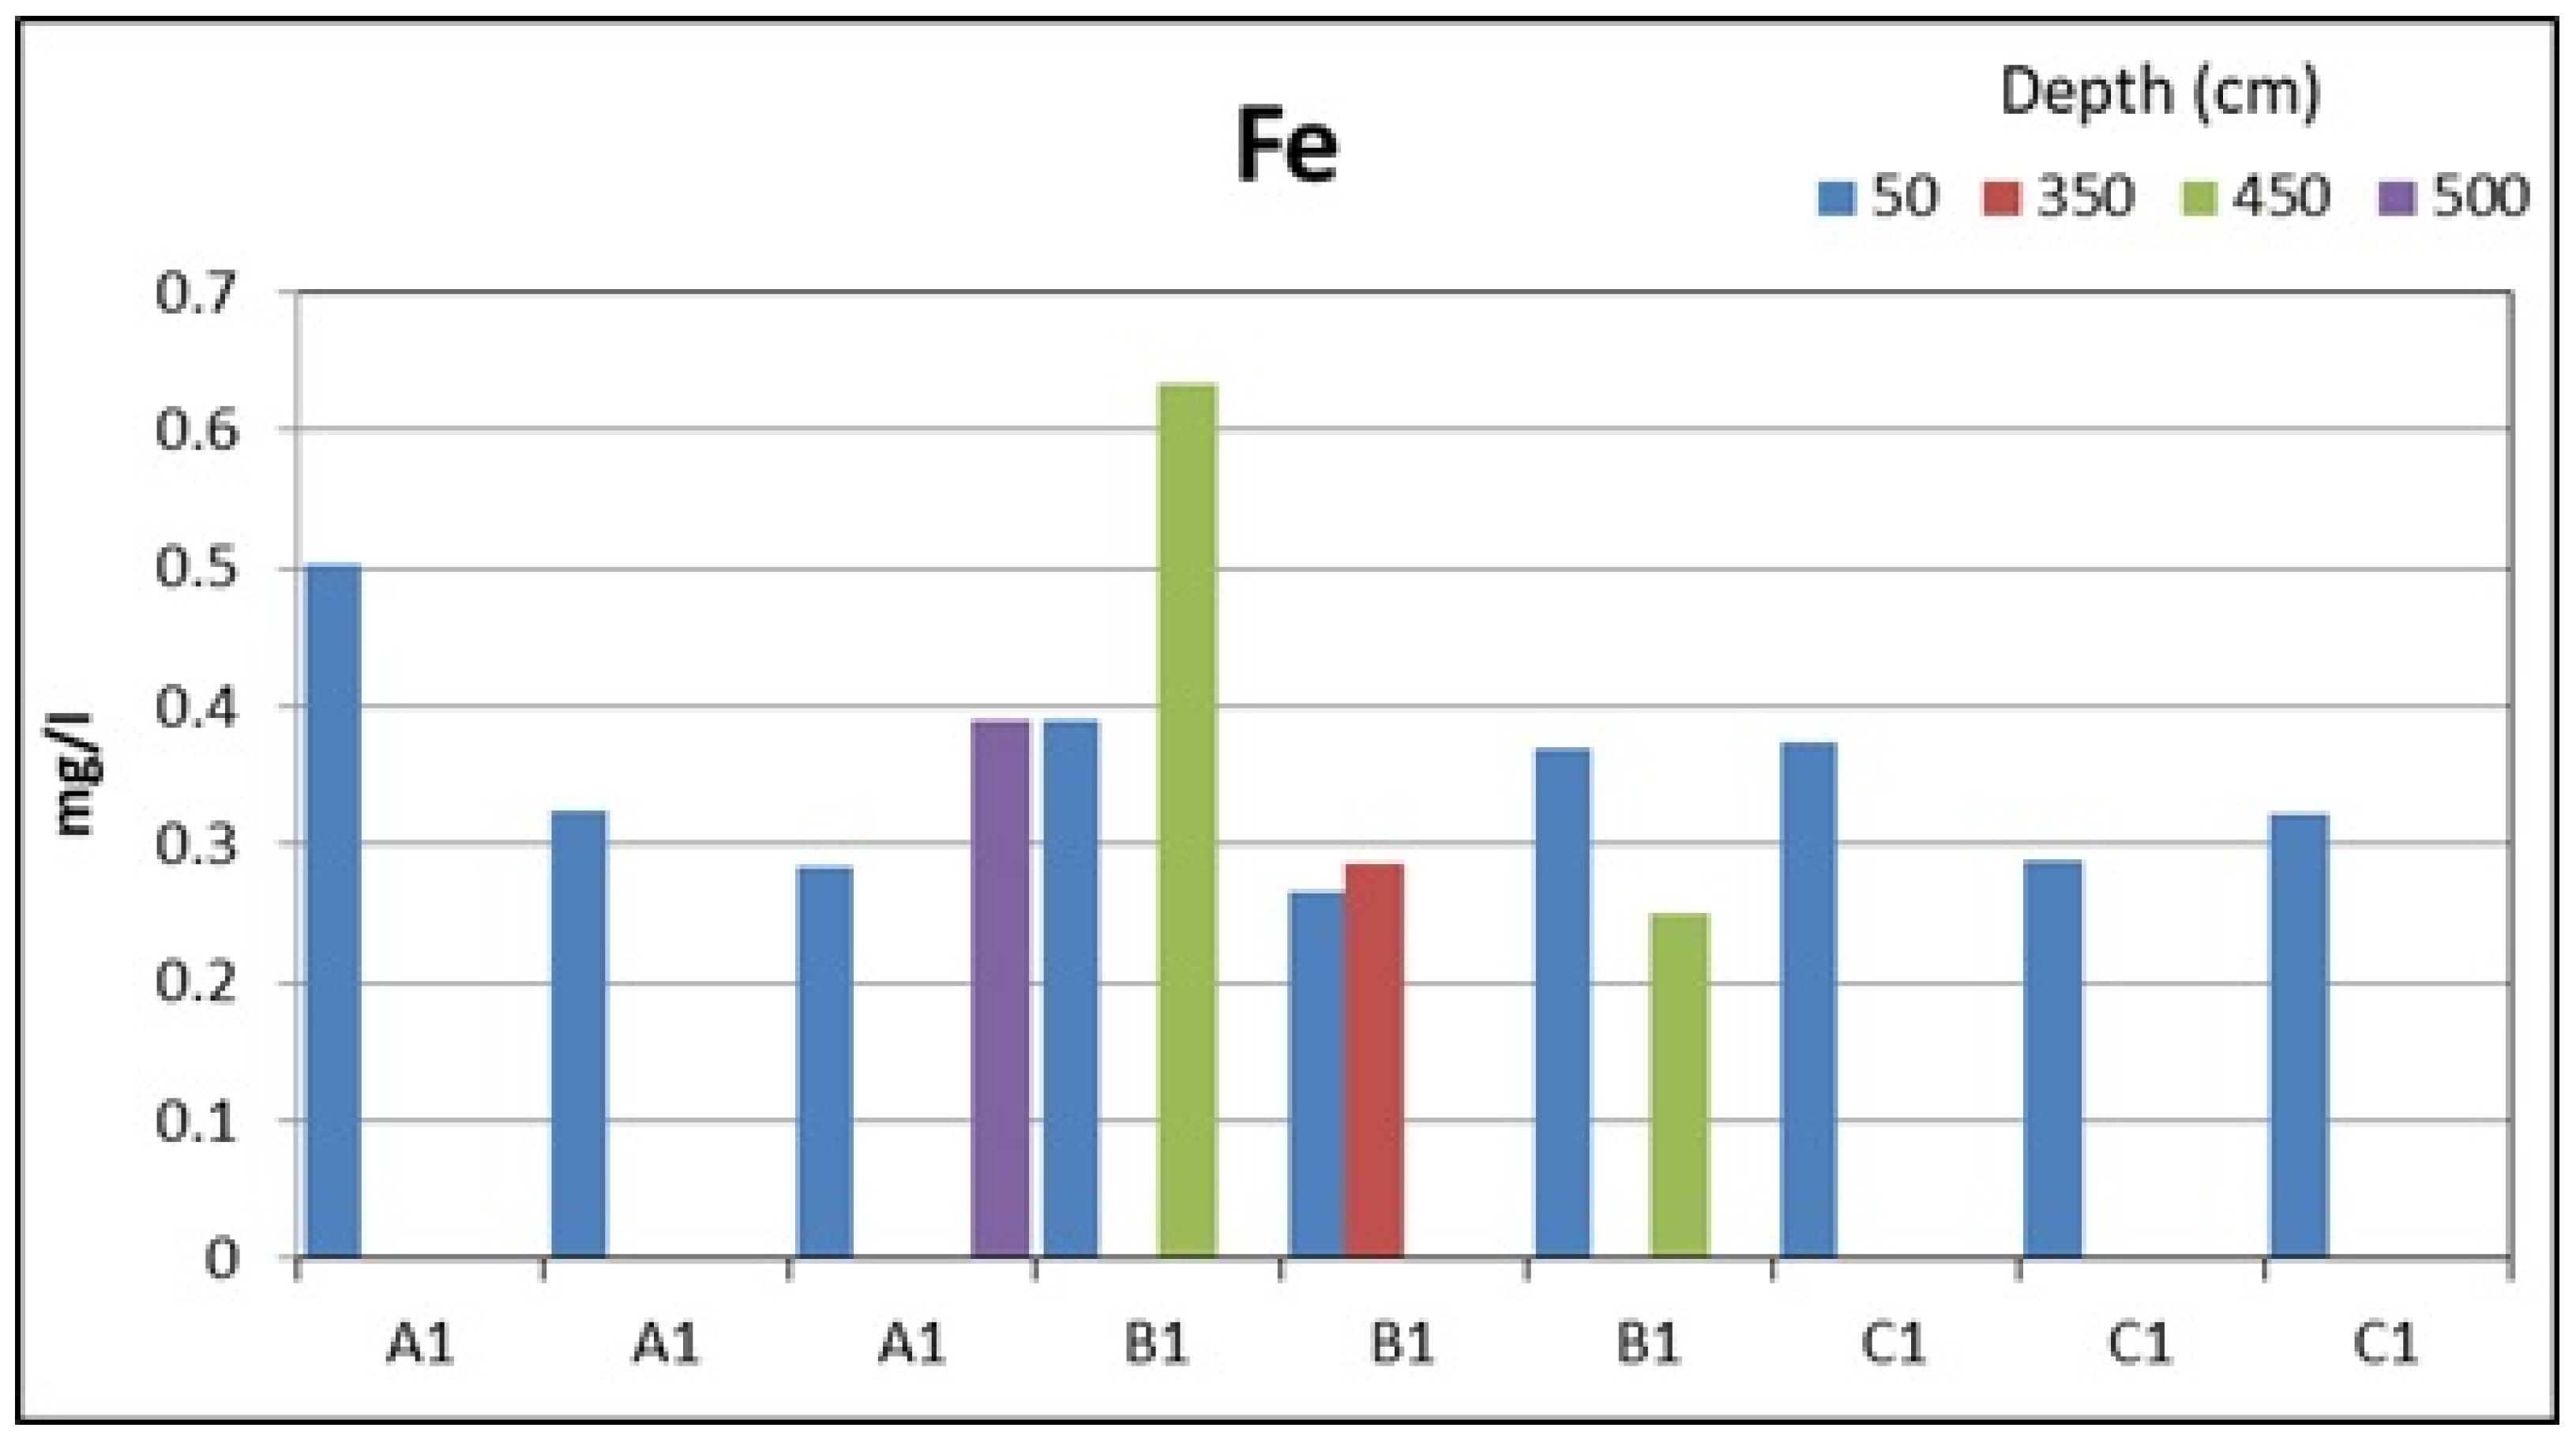
| Fe (mg/L) | 0.304 | - | - | 0.389 | - | - | - | 0.318 | - | 0.287 | - | 0.249 | 0.306 |
| Profile | A1 | A1 | A1 | A1 | A1 | A1 | A1 | B1 | B1 | B1 | B1 | B1 | C1 |
|---|---|---|---|---|---|---|---|---|---|---|---|---|---|
| Depth (cm) | 50 | 200 | 350 | 500 | 800 | 1000 | 1200 | 50 | 200 | 350 | 400 | 450 | 50 |
| Dissolved Oxygen (mg/L) | 8.71 | 9.65 | 10.14 | 9.90 | 9.79 | 9.87 | 9.81 | 8.55 | 9.24 | 9.98 | 9.87 | 9.80 | 8.77 |
| Al (mg/L) | 0.288 | - | - | - | - | - | - | 0.235 | - | - | 0.292 | 0.233 | |
| Hg (μg/L) | 0.07 | - | - | - | - | - | - | 0.07 | - | - | 0.07 | 0.07 | |
| Cr (mg/L) | 0.0084 | - | - | - | - | - | - | 0.0054 | - | - | 0.0074 | 0.0196 | |
| Cu (mg/L) | 0.0064 | - | - | - | - | - | - | 0.0052 | - | - | 0.0086 | 0.0179 | |
| Mn (mg/L) | 0.011 | - | - | - | - | - | - | 0.010 | - | - | 0.013 | 0.022 | |
| Fe (mg/L) | 0.504 | - | - | - | - | - | - | 0.390 | - | - | 0.634 | 0.374 |
Disclaimer/Publisher’s Note: The statements, opinions and data contained in all publications are solely those of the individual author(s) and contributor(s) and not of MDPI and/or the editor(s). MDPI and/or the editor(s) disclaim responsibility for any injury to people or property resulting from any ideas, methods, instructions or products referred to in the content. |
© 2025 by the authors. Licensee MDPI, Basel, Switzerland. This article is an open access article distributed under the terms and conditions of the Creative Commons Attribution (CC BY) license (https://creativecommons.org/licenses/by/4.0/).
Share and Cite
Milijašević Joksimović, D.; Jakovljević, D.; Doljak, D. Assessment of Multi-Depth Water Quality Dynamics in an Artificial Lake: A Case Study of the Ribnica Reservoir in Serbia. Appl. Sci. 2025, 15, 7425. https://doi.org/10.3390/app15137425
Milijašević Joksimović D, Jakovljević D, Doljak D. Assessment of Multi-Depth Water Quality Dynamics in an Artificial Lake: A Case Study of the Ribnica Reservoir in Serbia. Applied Sciences. 2025; 15(13):7425. https://doi.org/10.3390/app15137425
Chicago/Turabian StyleMilijašević Joksimović, Dragana, Dejana Jakovljević, and Dejan Doljak. 2025. "Assessment of Multi-Depth Water Quality Dynamics in an Artificial Lake: A Case Study of the Ribnica Reservoir in Serbia" Applied Sciences 15, no. 13: 7425. https://doi.org/10.3390/app15137425
APA StyleMilijašević Joksimović, D., Jakovljević, D., & Doljak, D. (2025). Assessment of Multi-Depth Water Quality Dynamics in an Artificial Lake: A Case Study of the Ribnica Reservoir in Serbia. Applied Sciences, 15(13), 7425. https://doi.org/10.3390/app15137425