
Study on the Fire Resistance of Axially Restrained H-Shaped Steel Beams Under Real Fire

Abstract
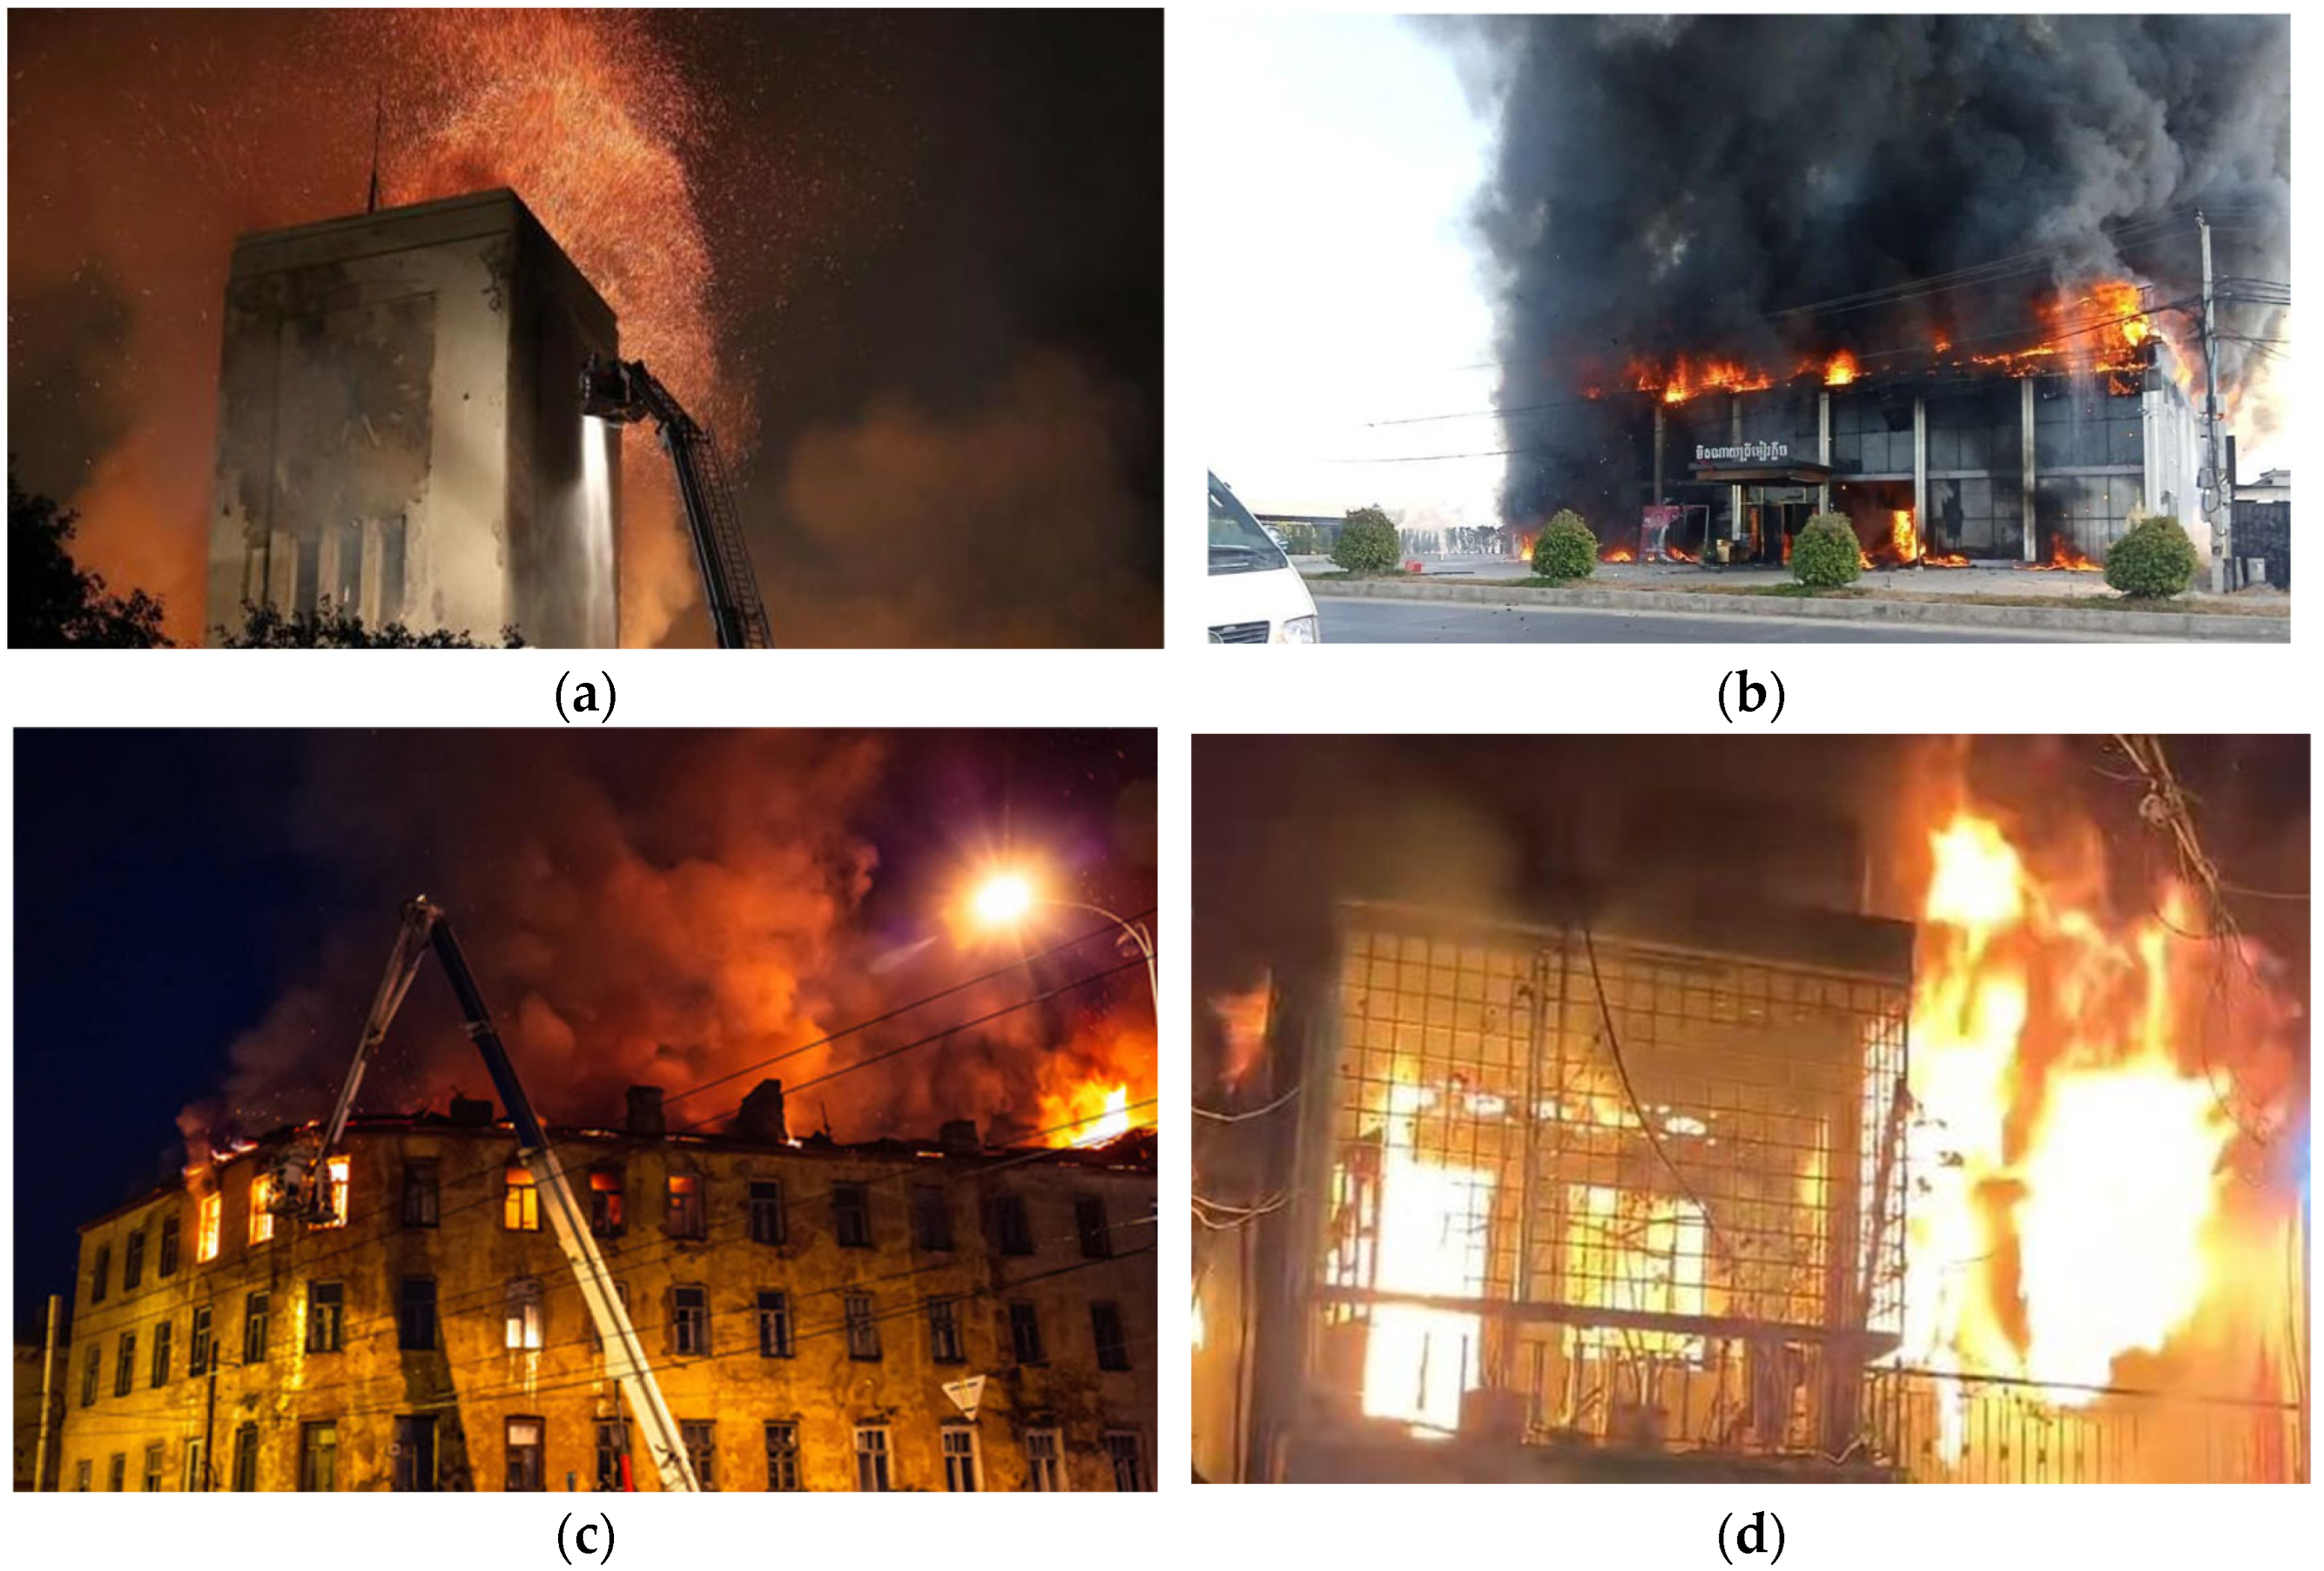
1. Introduction
2. Study on the Development Law of Temperature Field Under Different Fire Conditions
2.1. Uniform Fire Conditions
2.1.1. Model Parameters
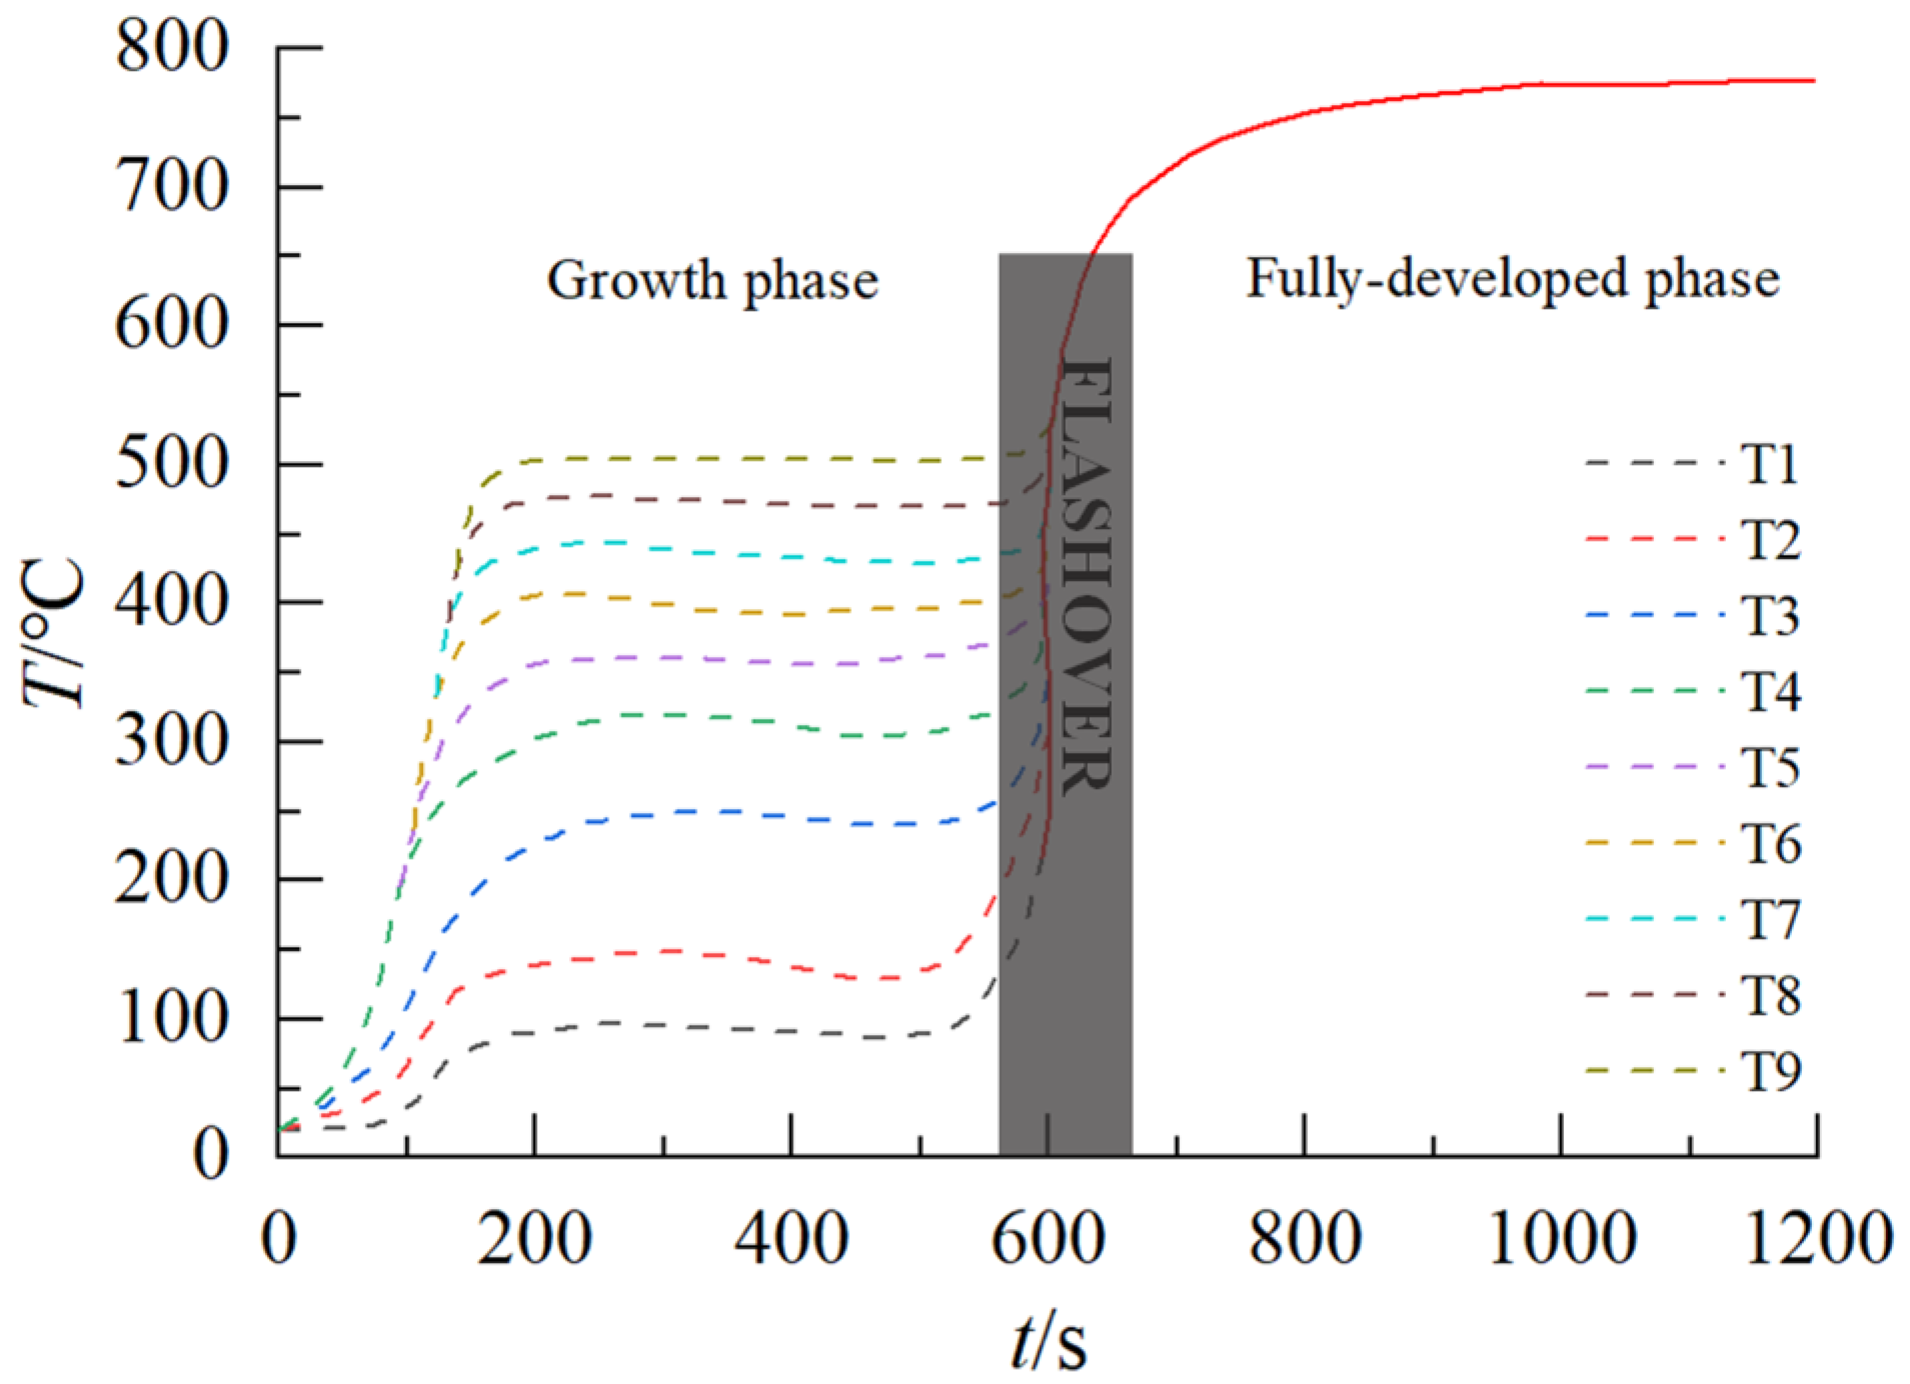
2.1.2. Study on the Early Heating Law of Uniform Fire Conditions
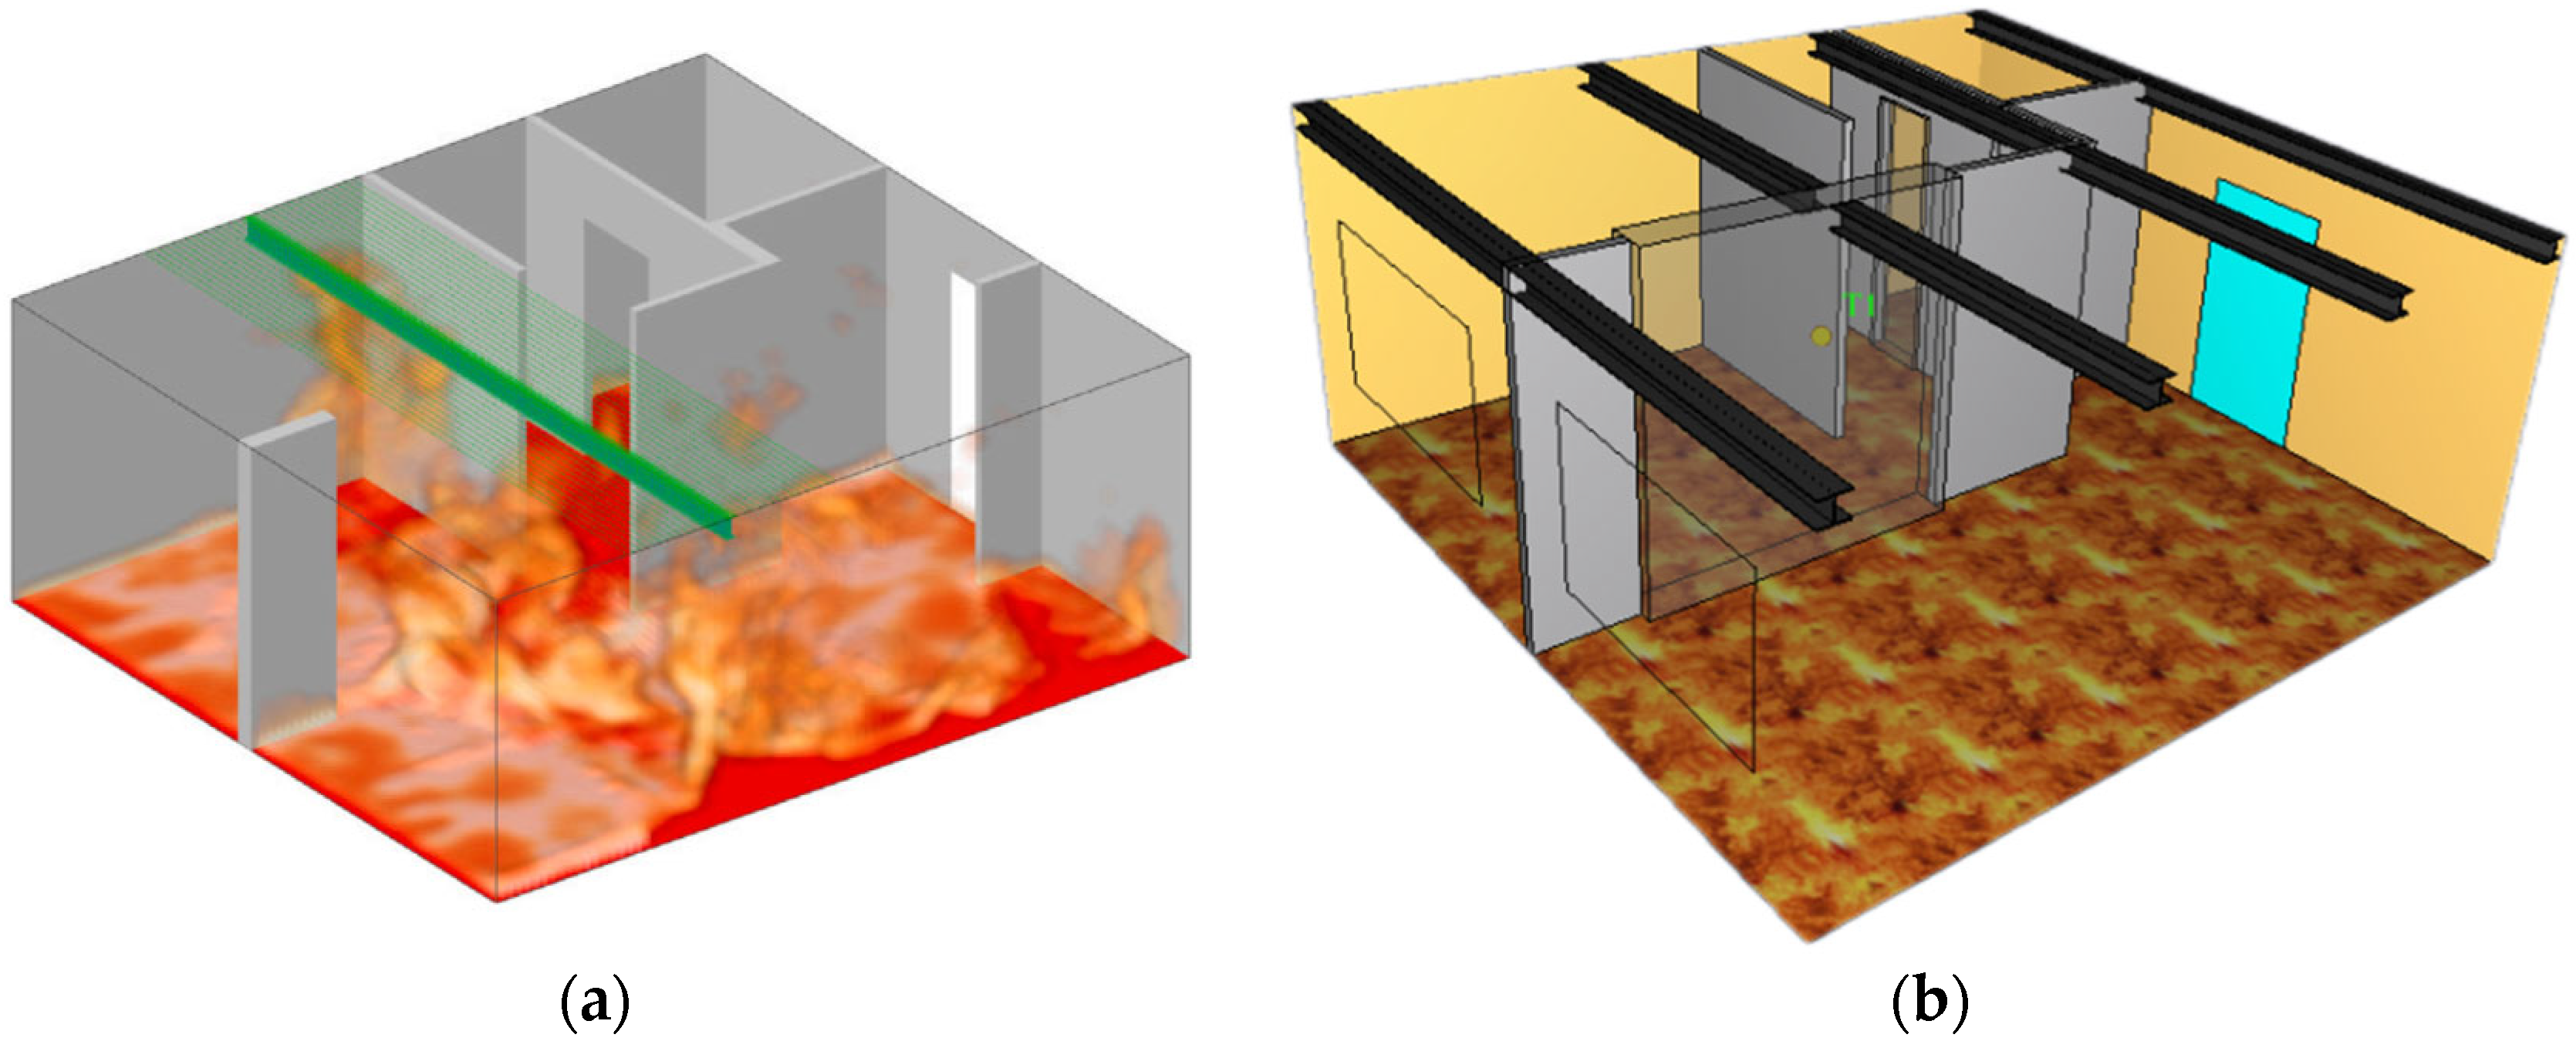
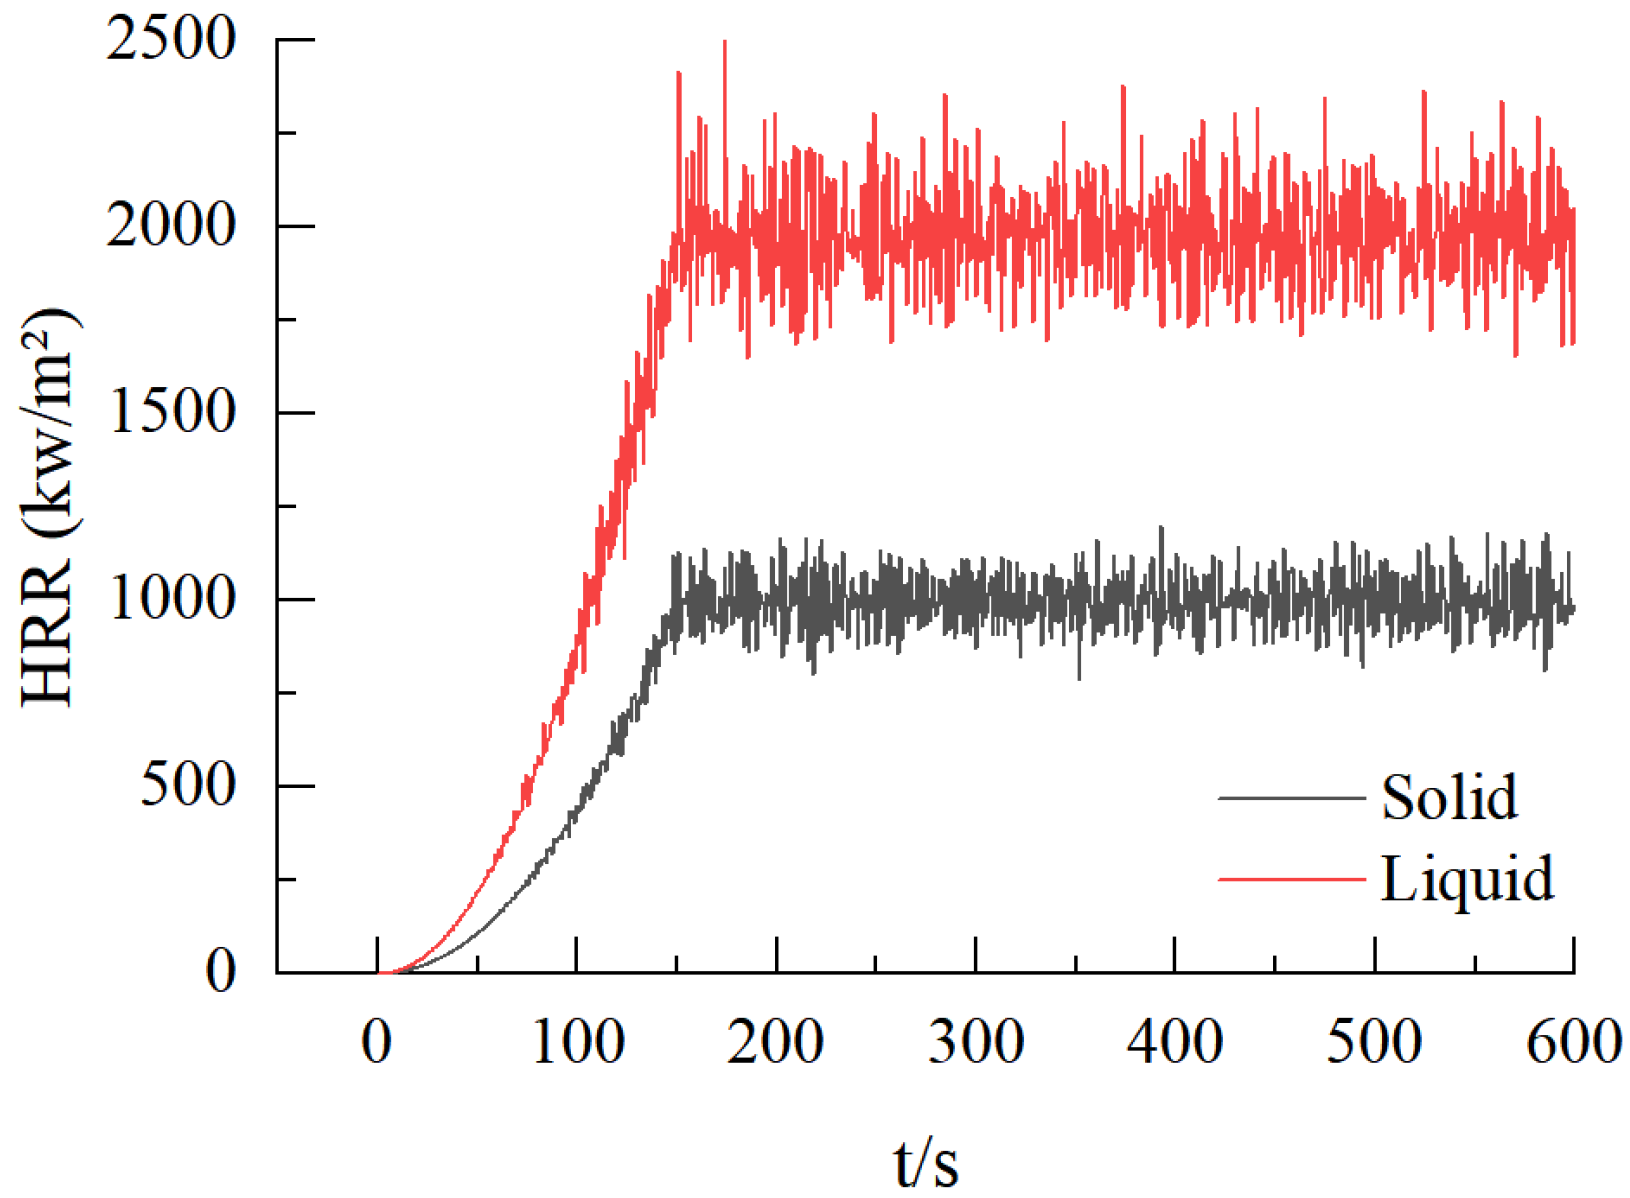
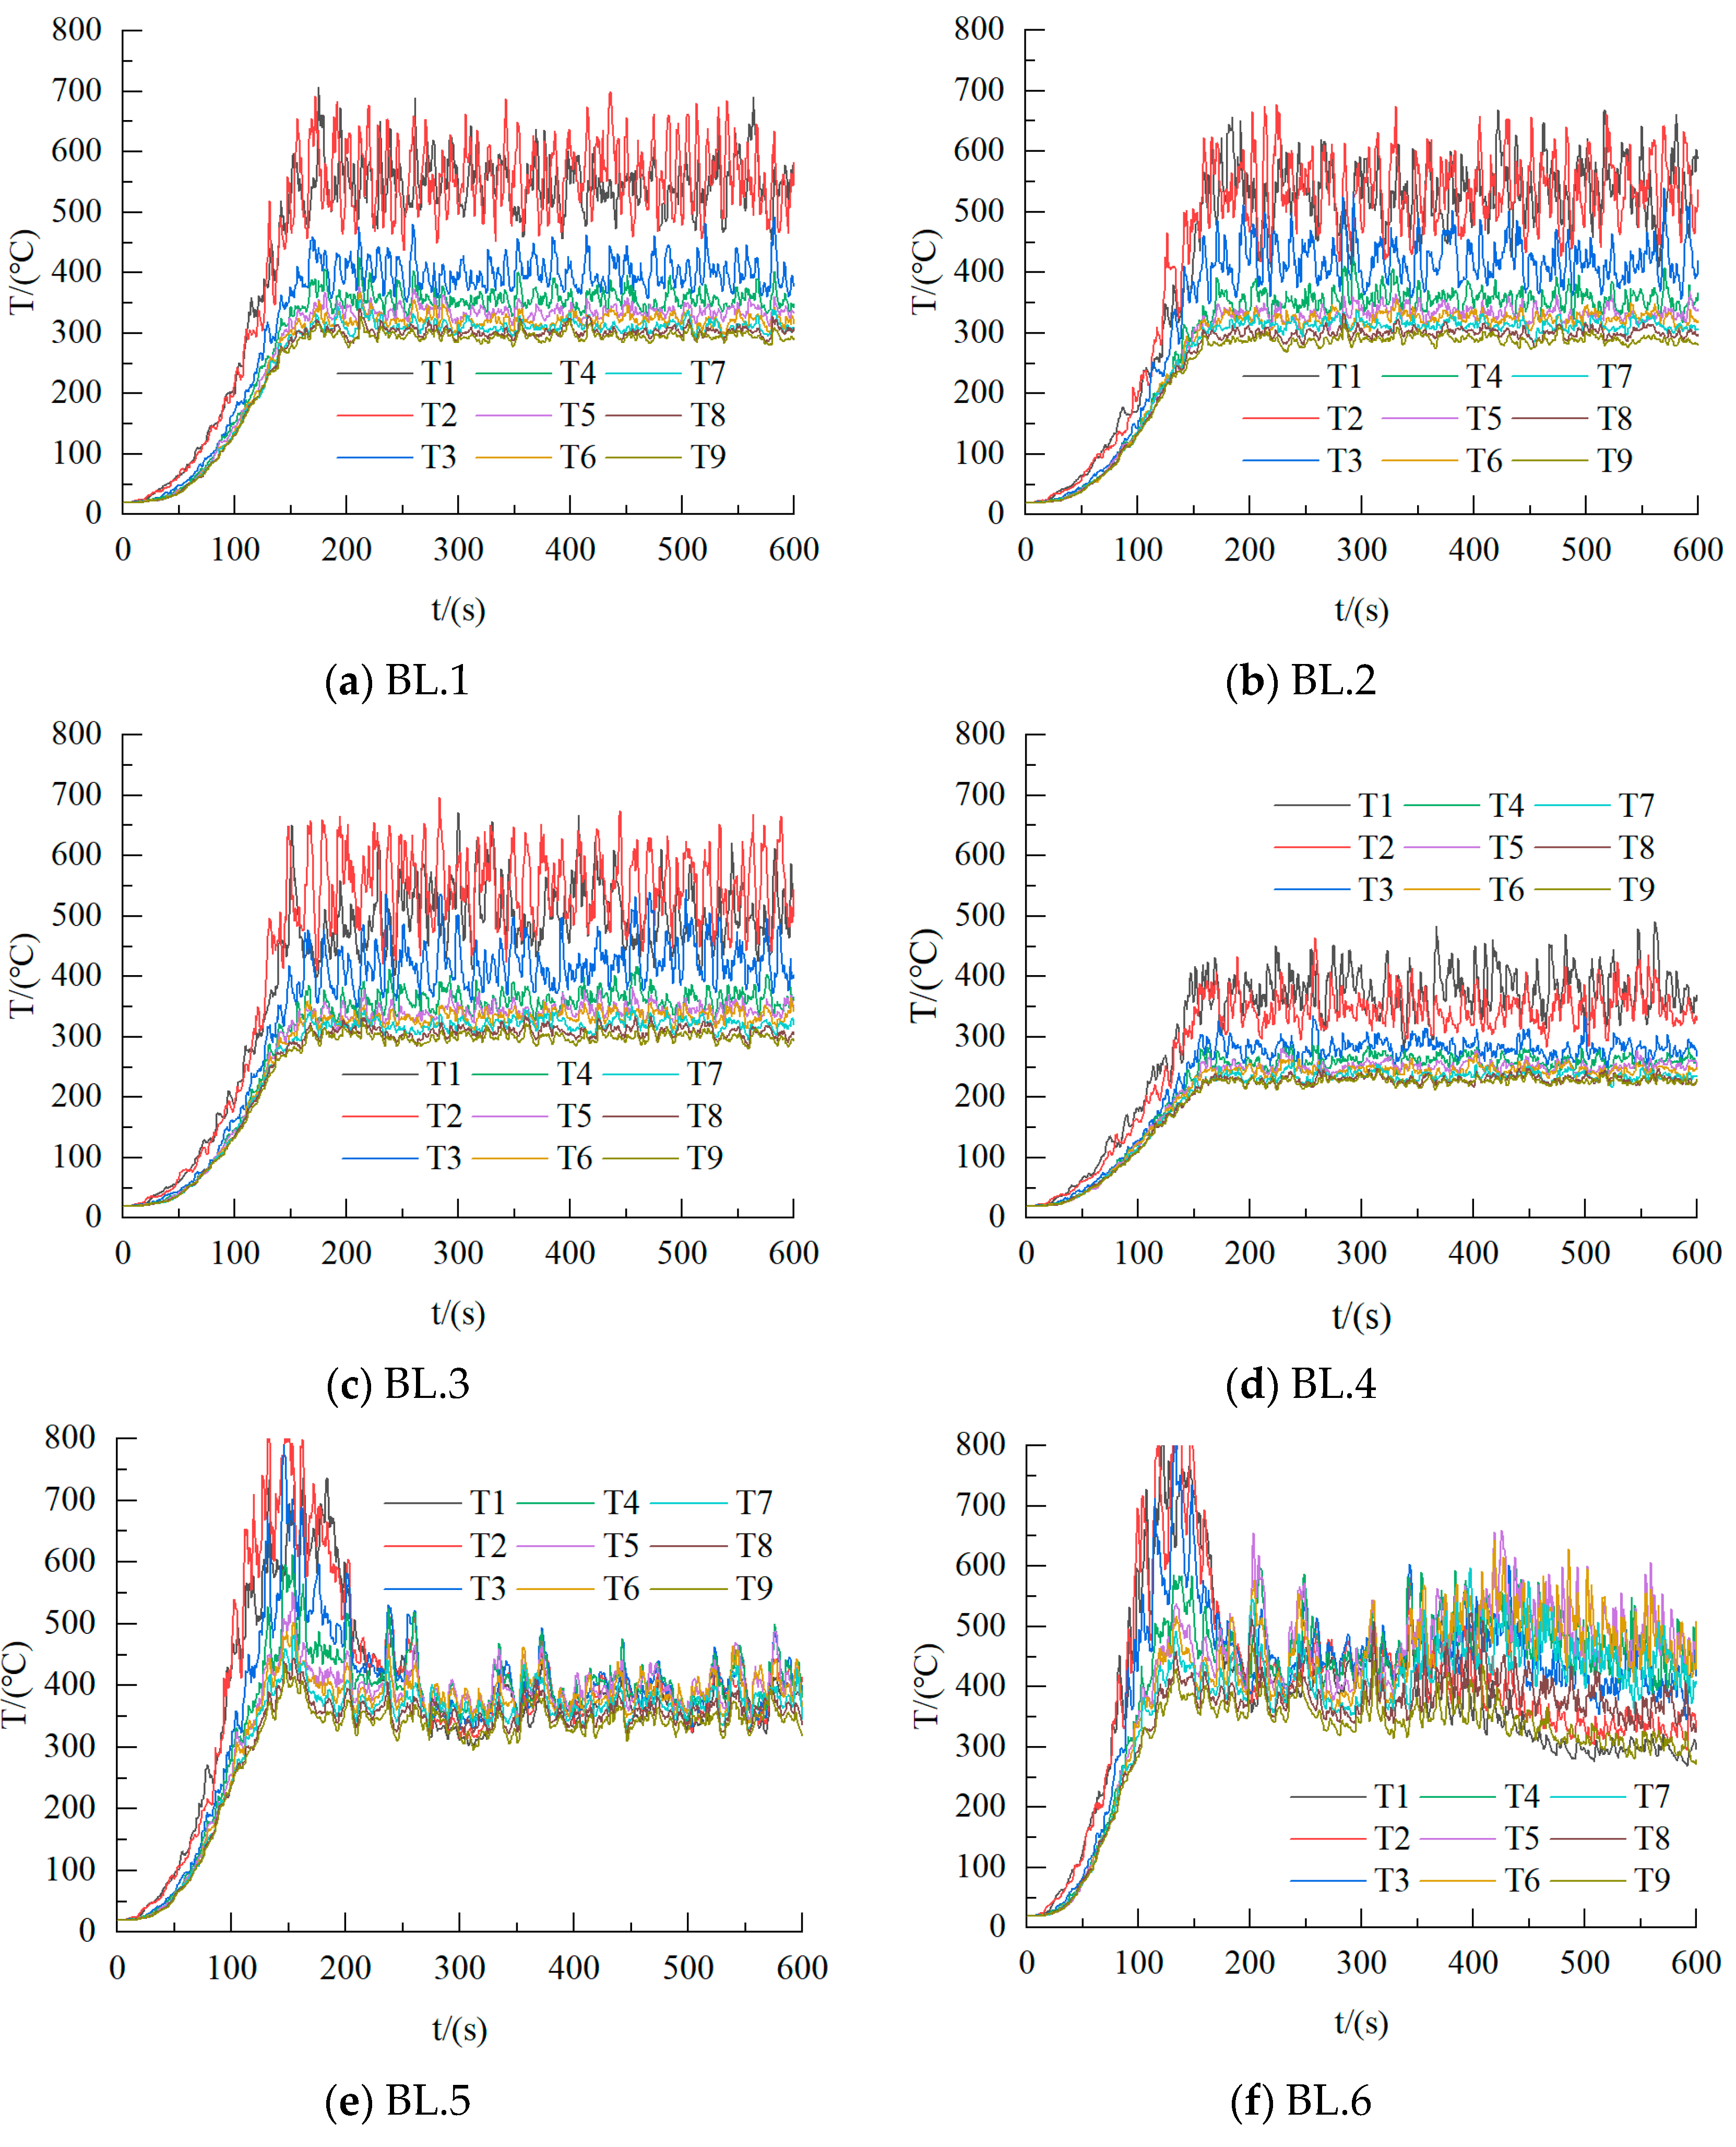
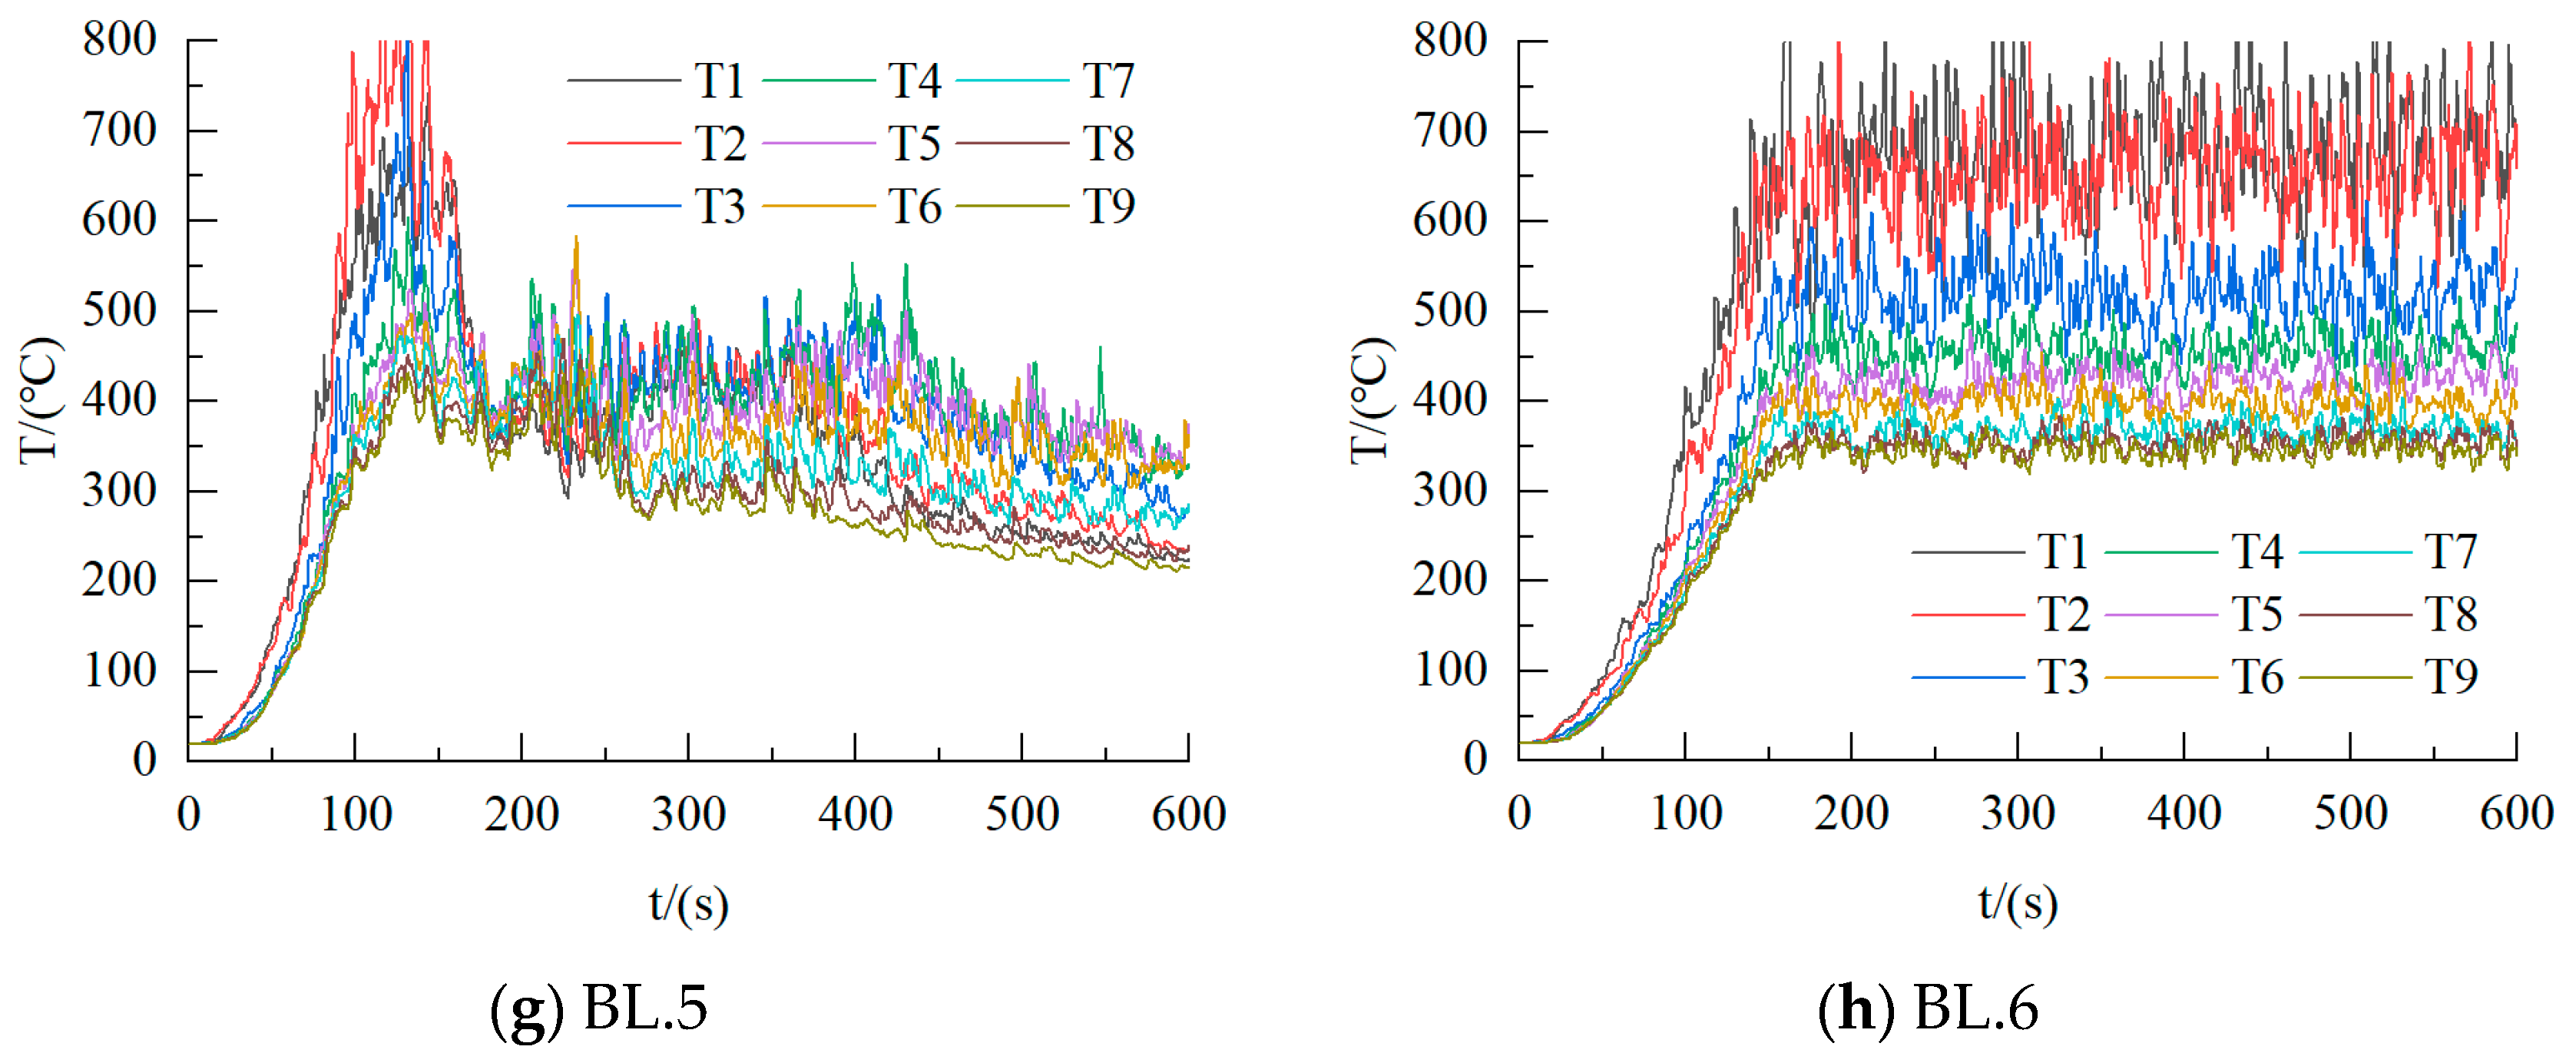
2.2. Local Fire Conditions
2.2.1. Model Parameters
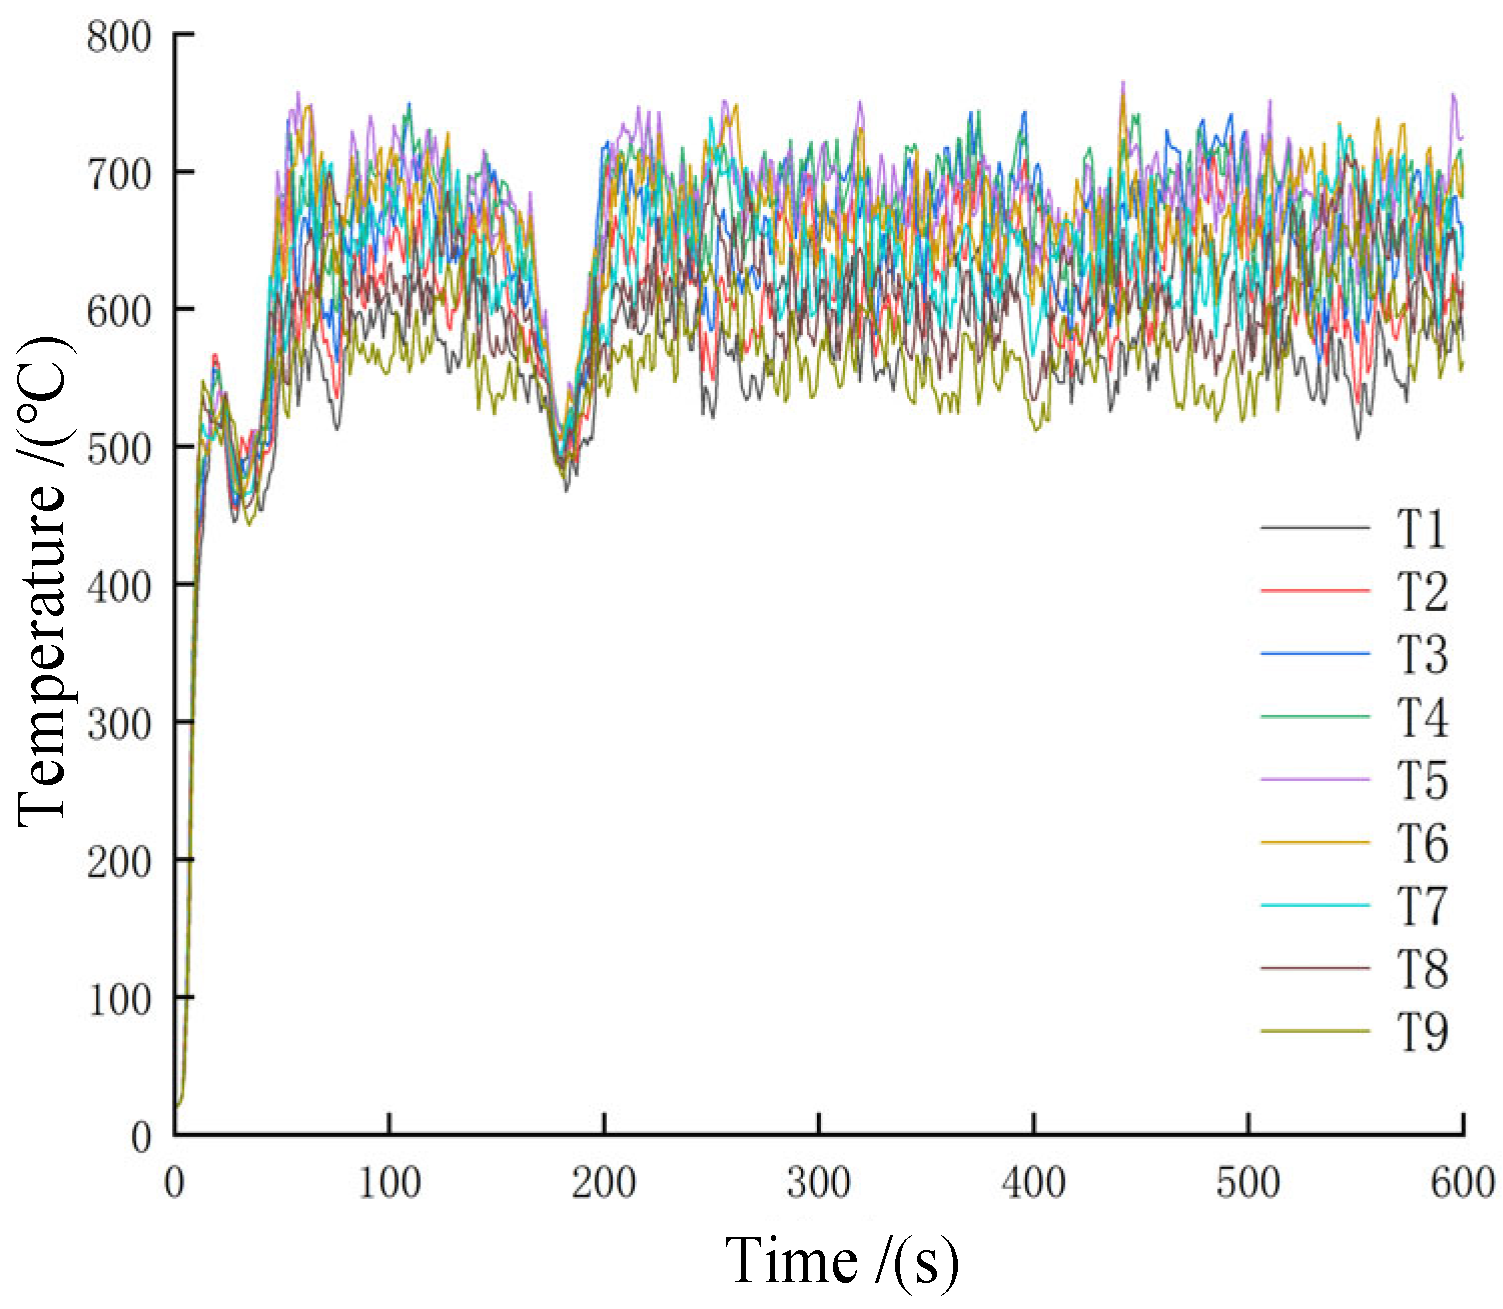
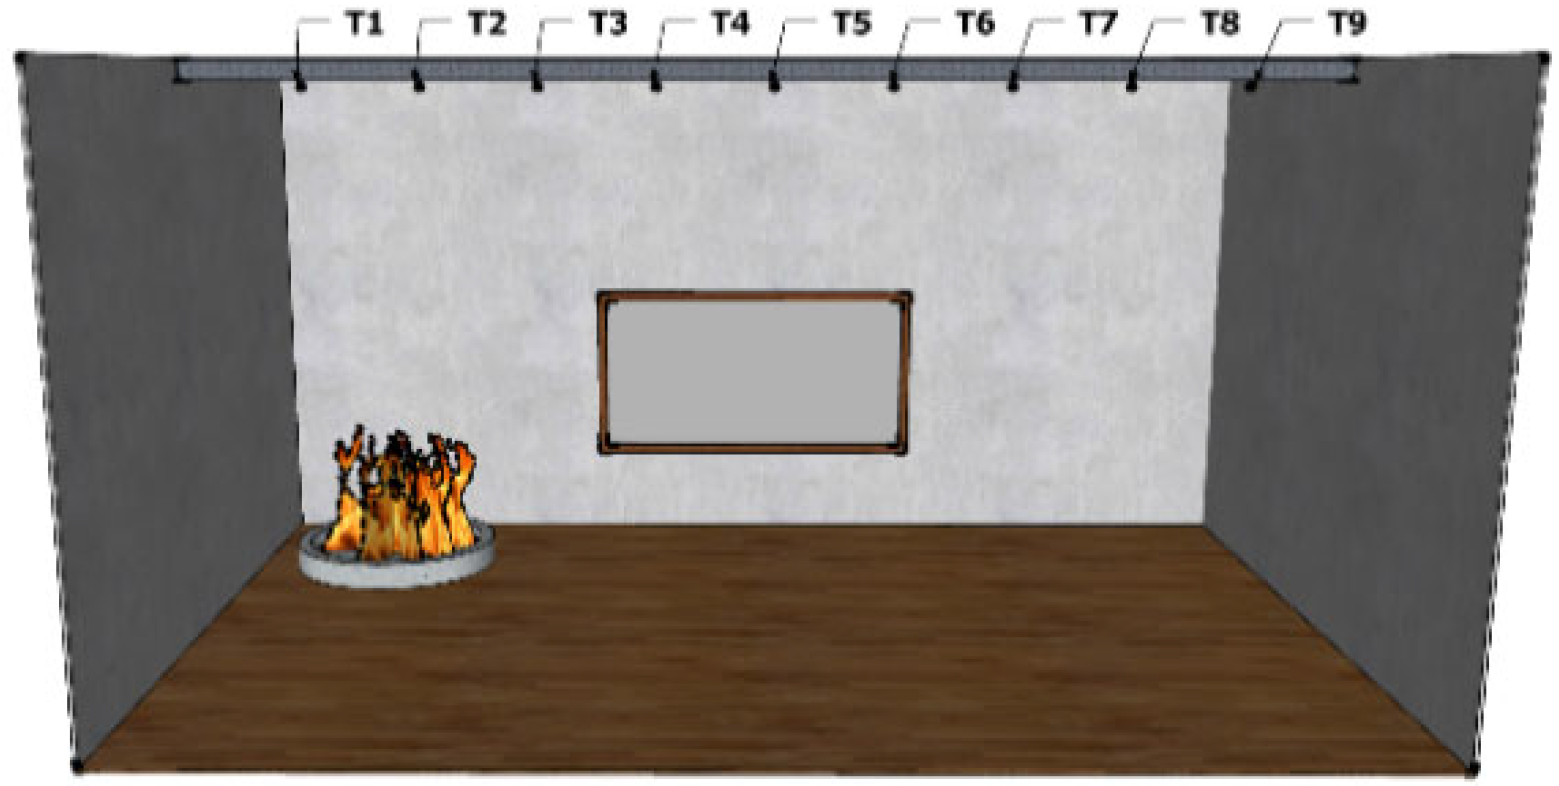
2.2.2. Study on the Law of Temperature Rise in the Early Stage of Local Fire Conditions
2.3. Quasi-Real Fire Temperature–Time Curve
3. Analysis of Fire Resistance of Steel Columns Based on Quasi-Real Fire Heating Curve
3.1. Establishment of Finite Element Model of H-Section Steel Beam
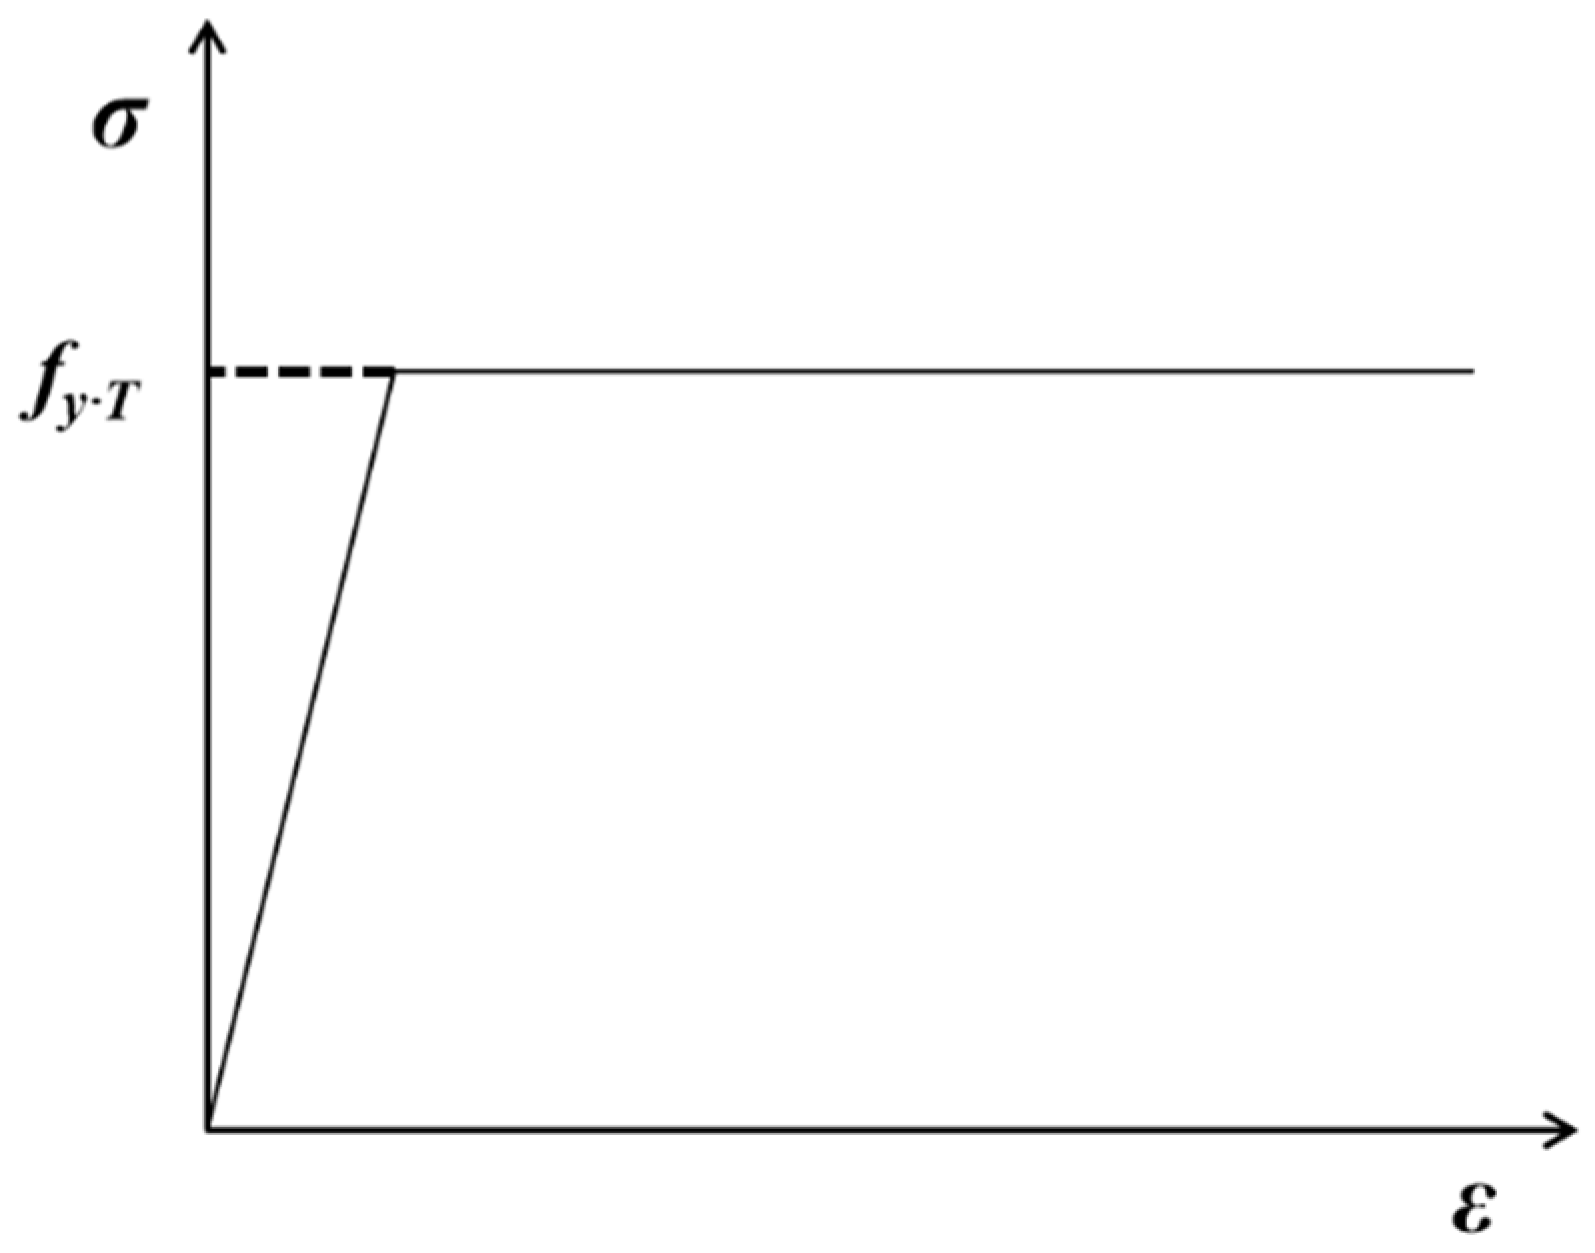
3.1.1. High-Temperature Material Properties of Q460 Steel
3.1.2. High-Temperature Mechanical Properties of Steel
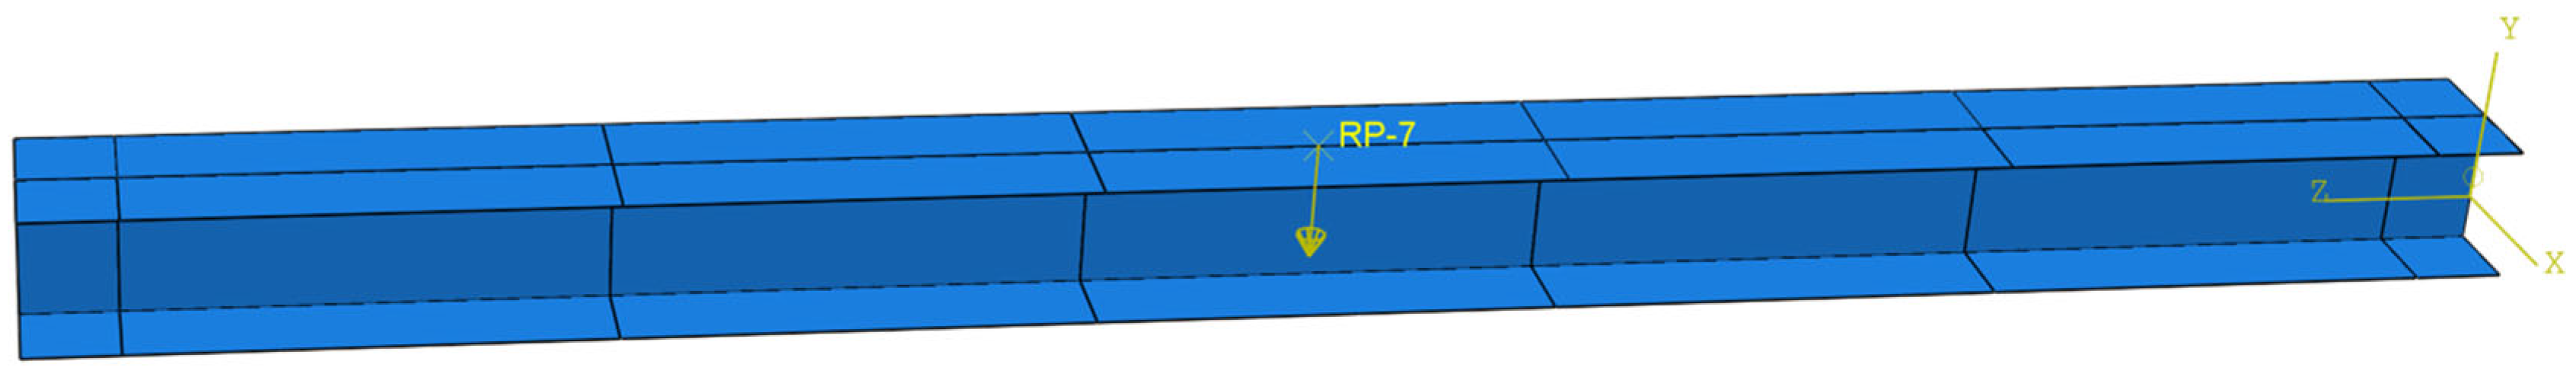
3.1.3. Steel Beam Model Establishment
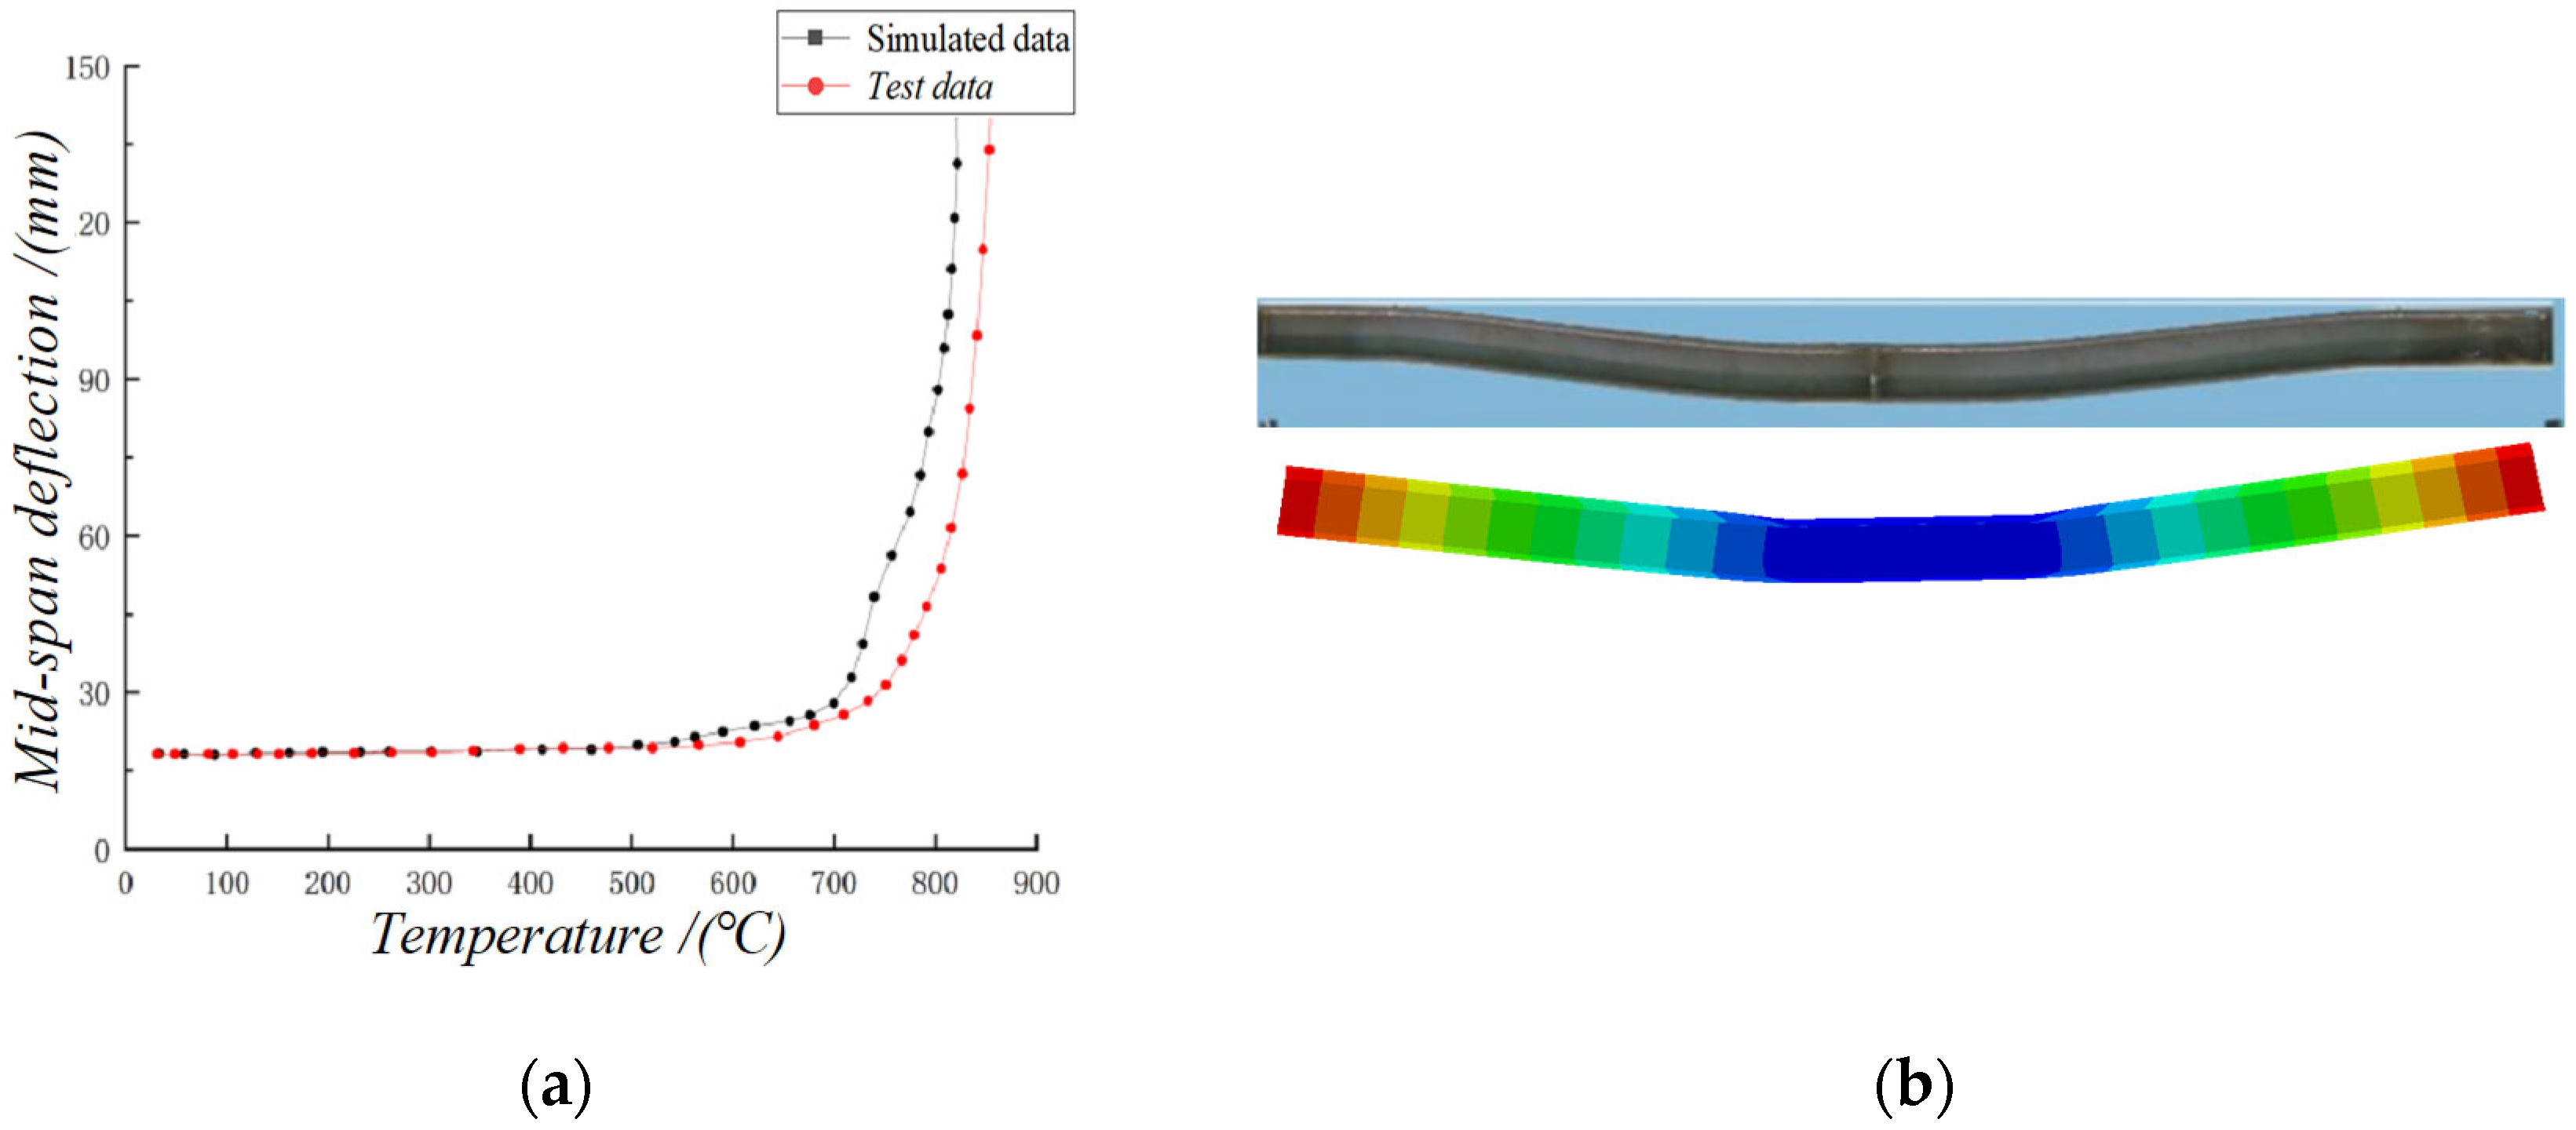
3.1.4. Model Verification
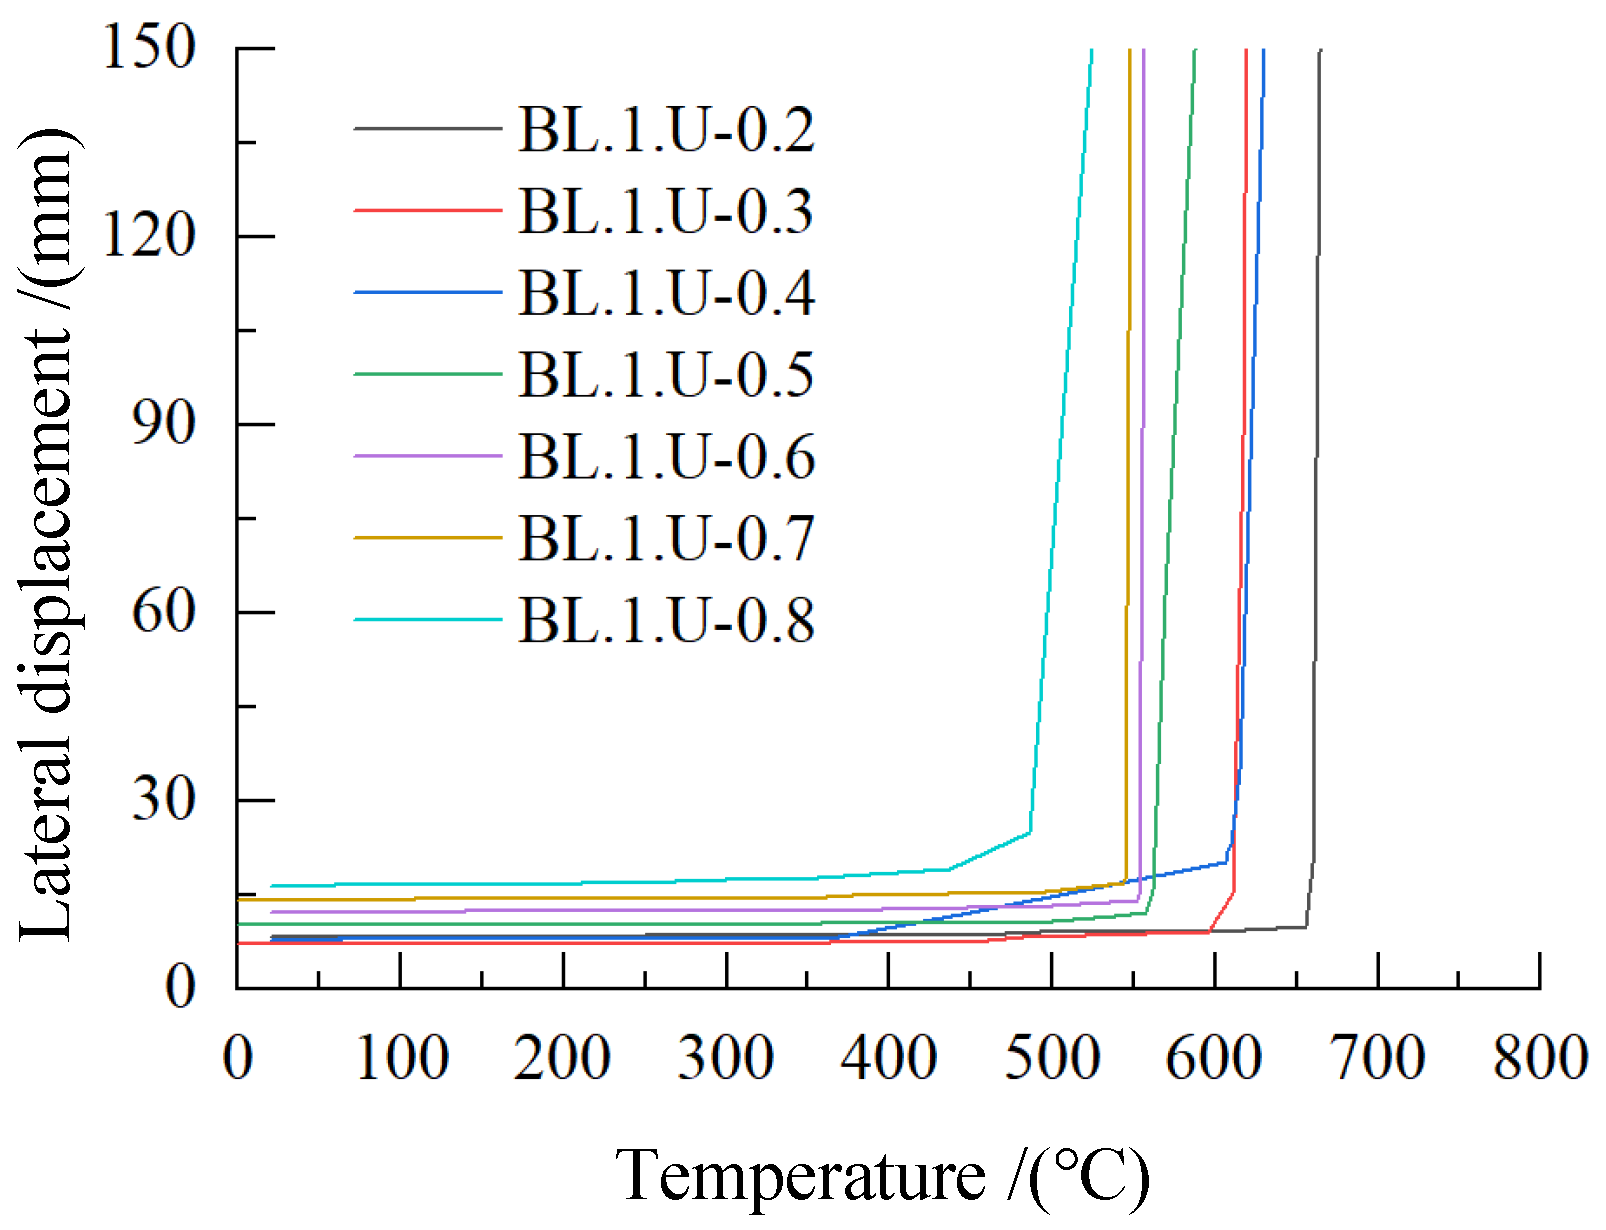
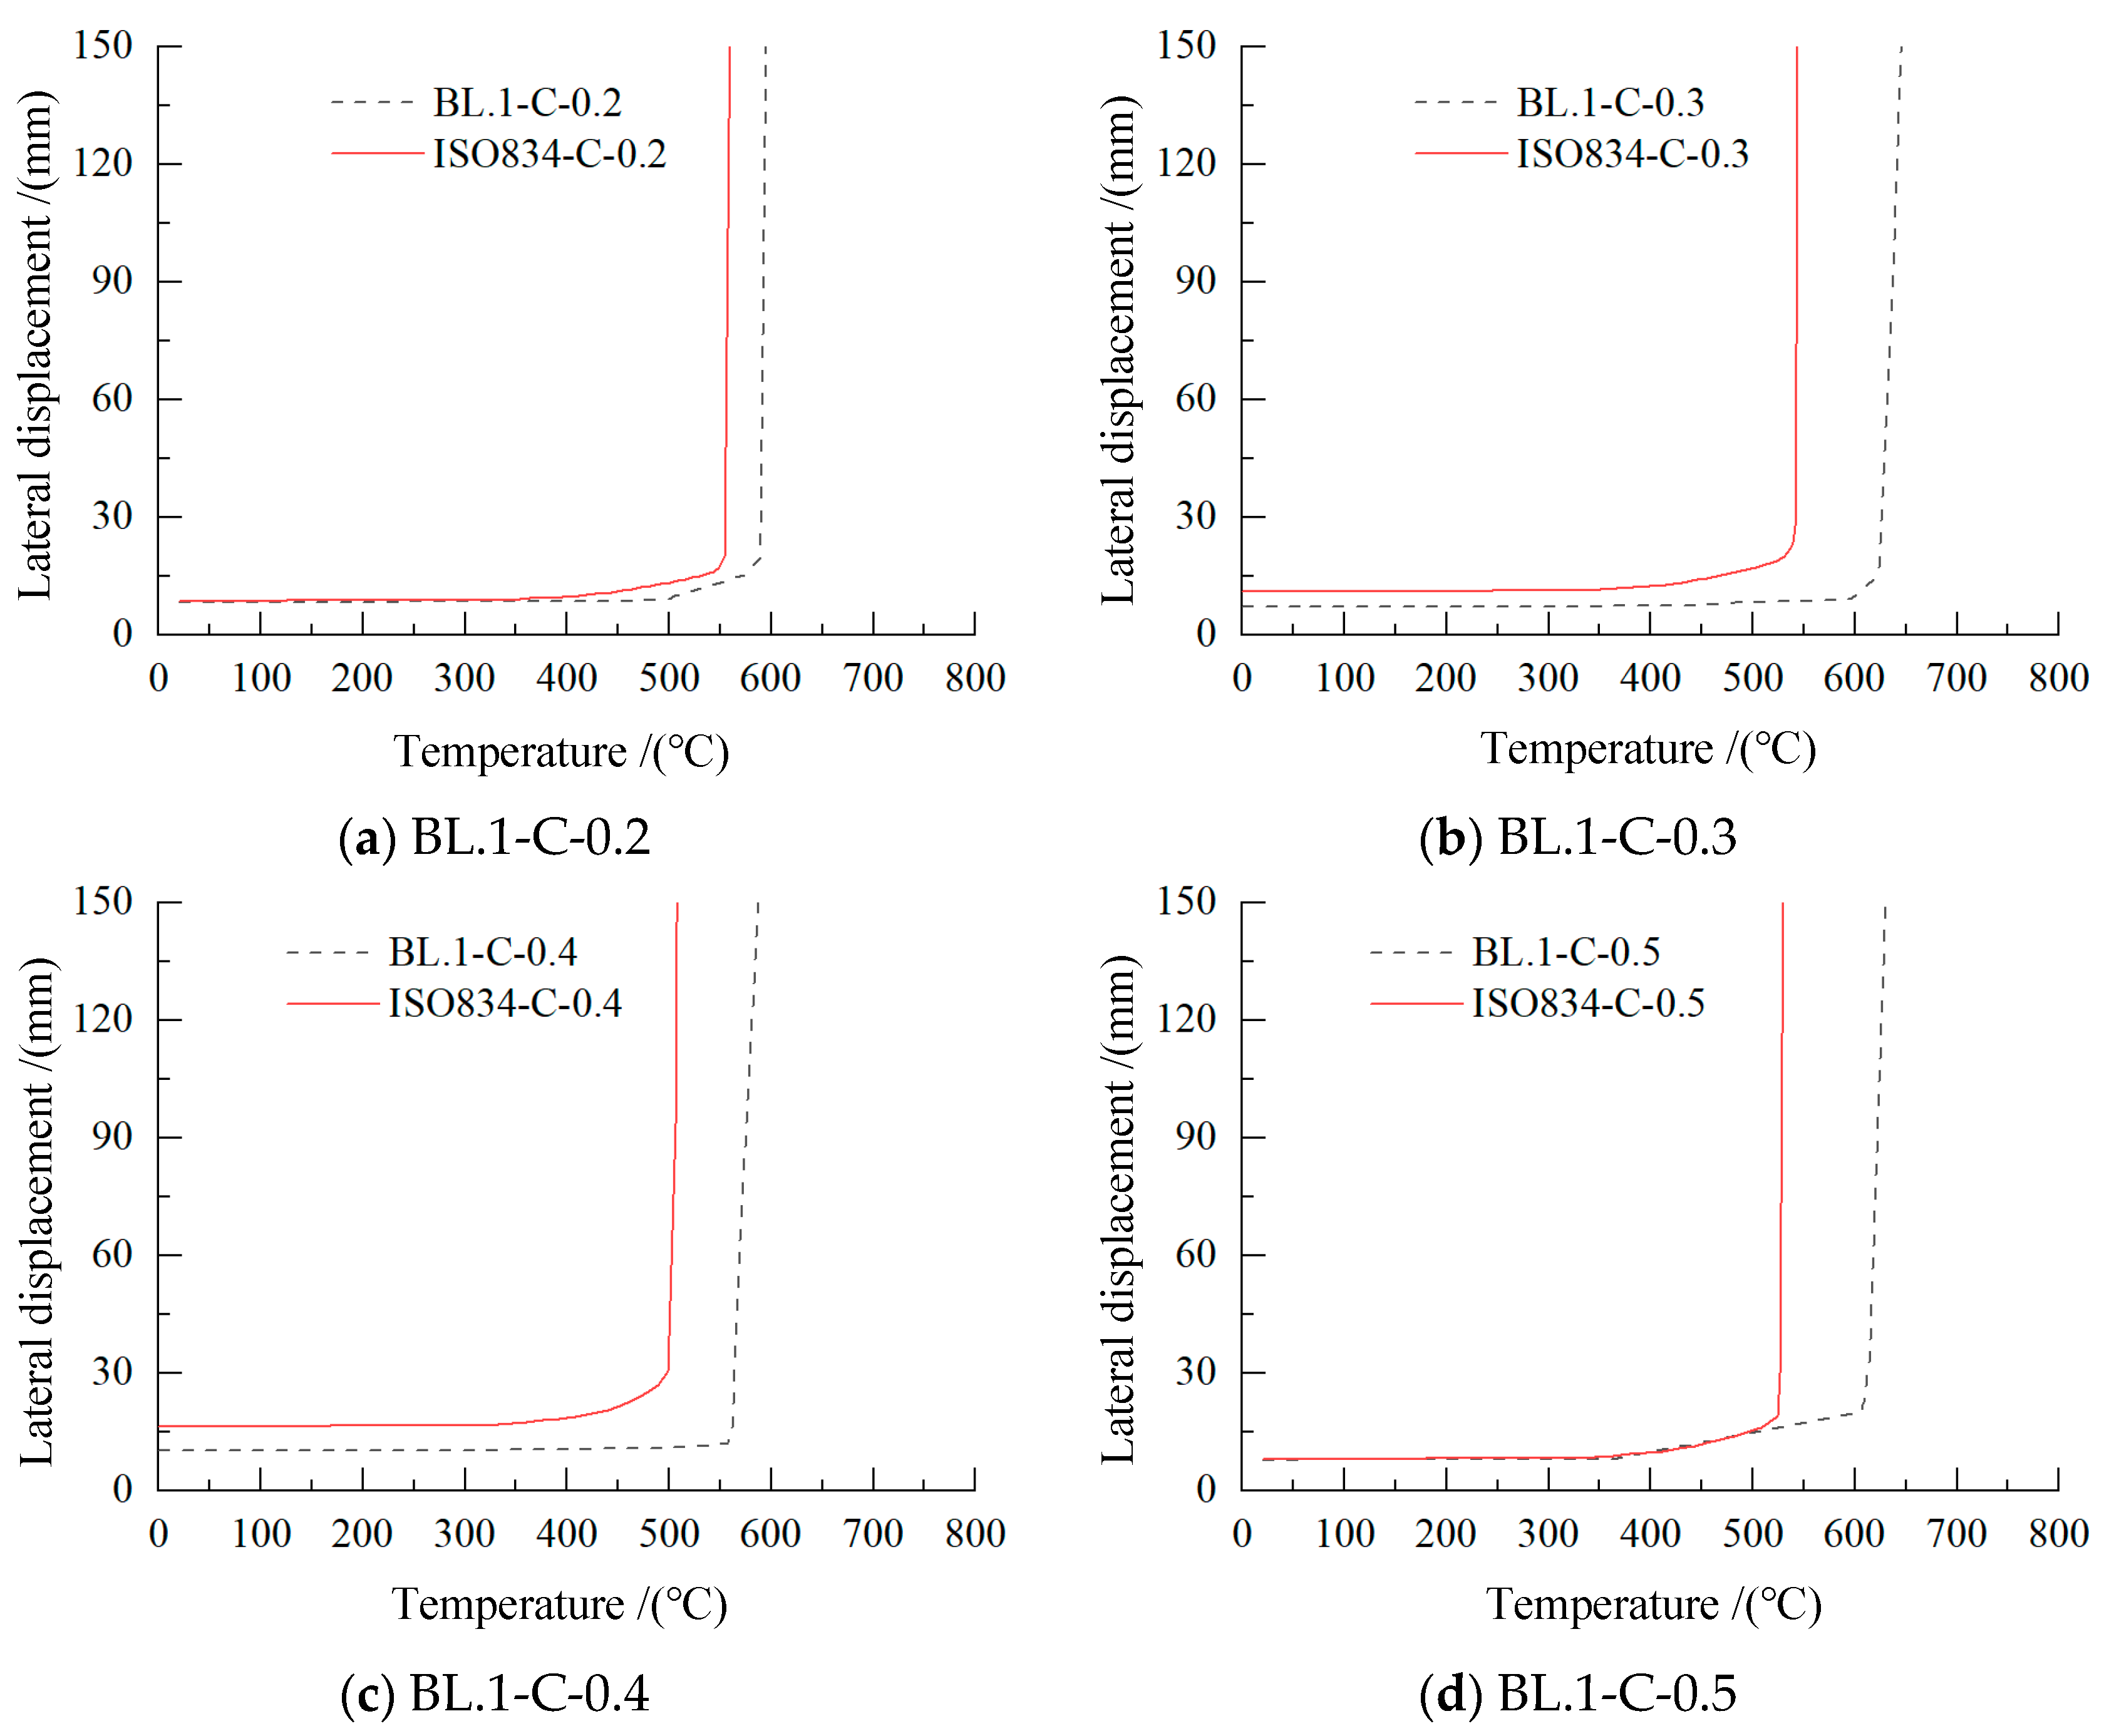
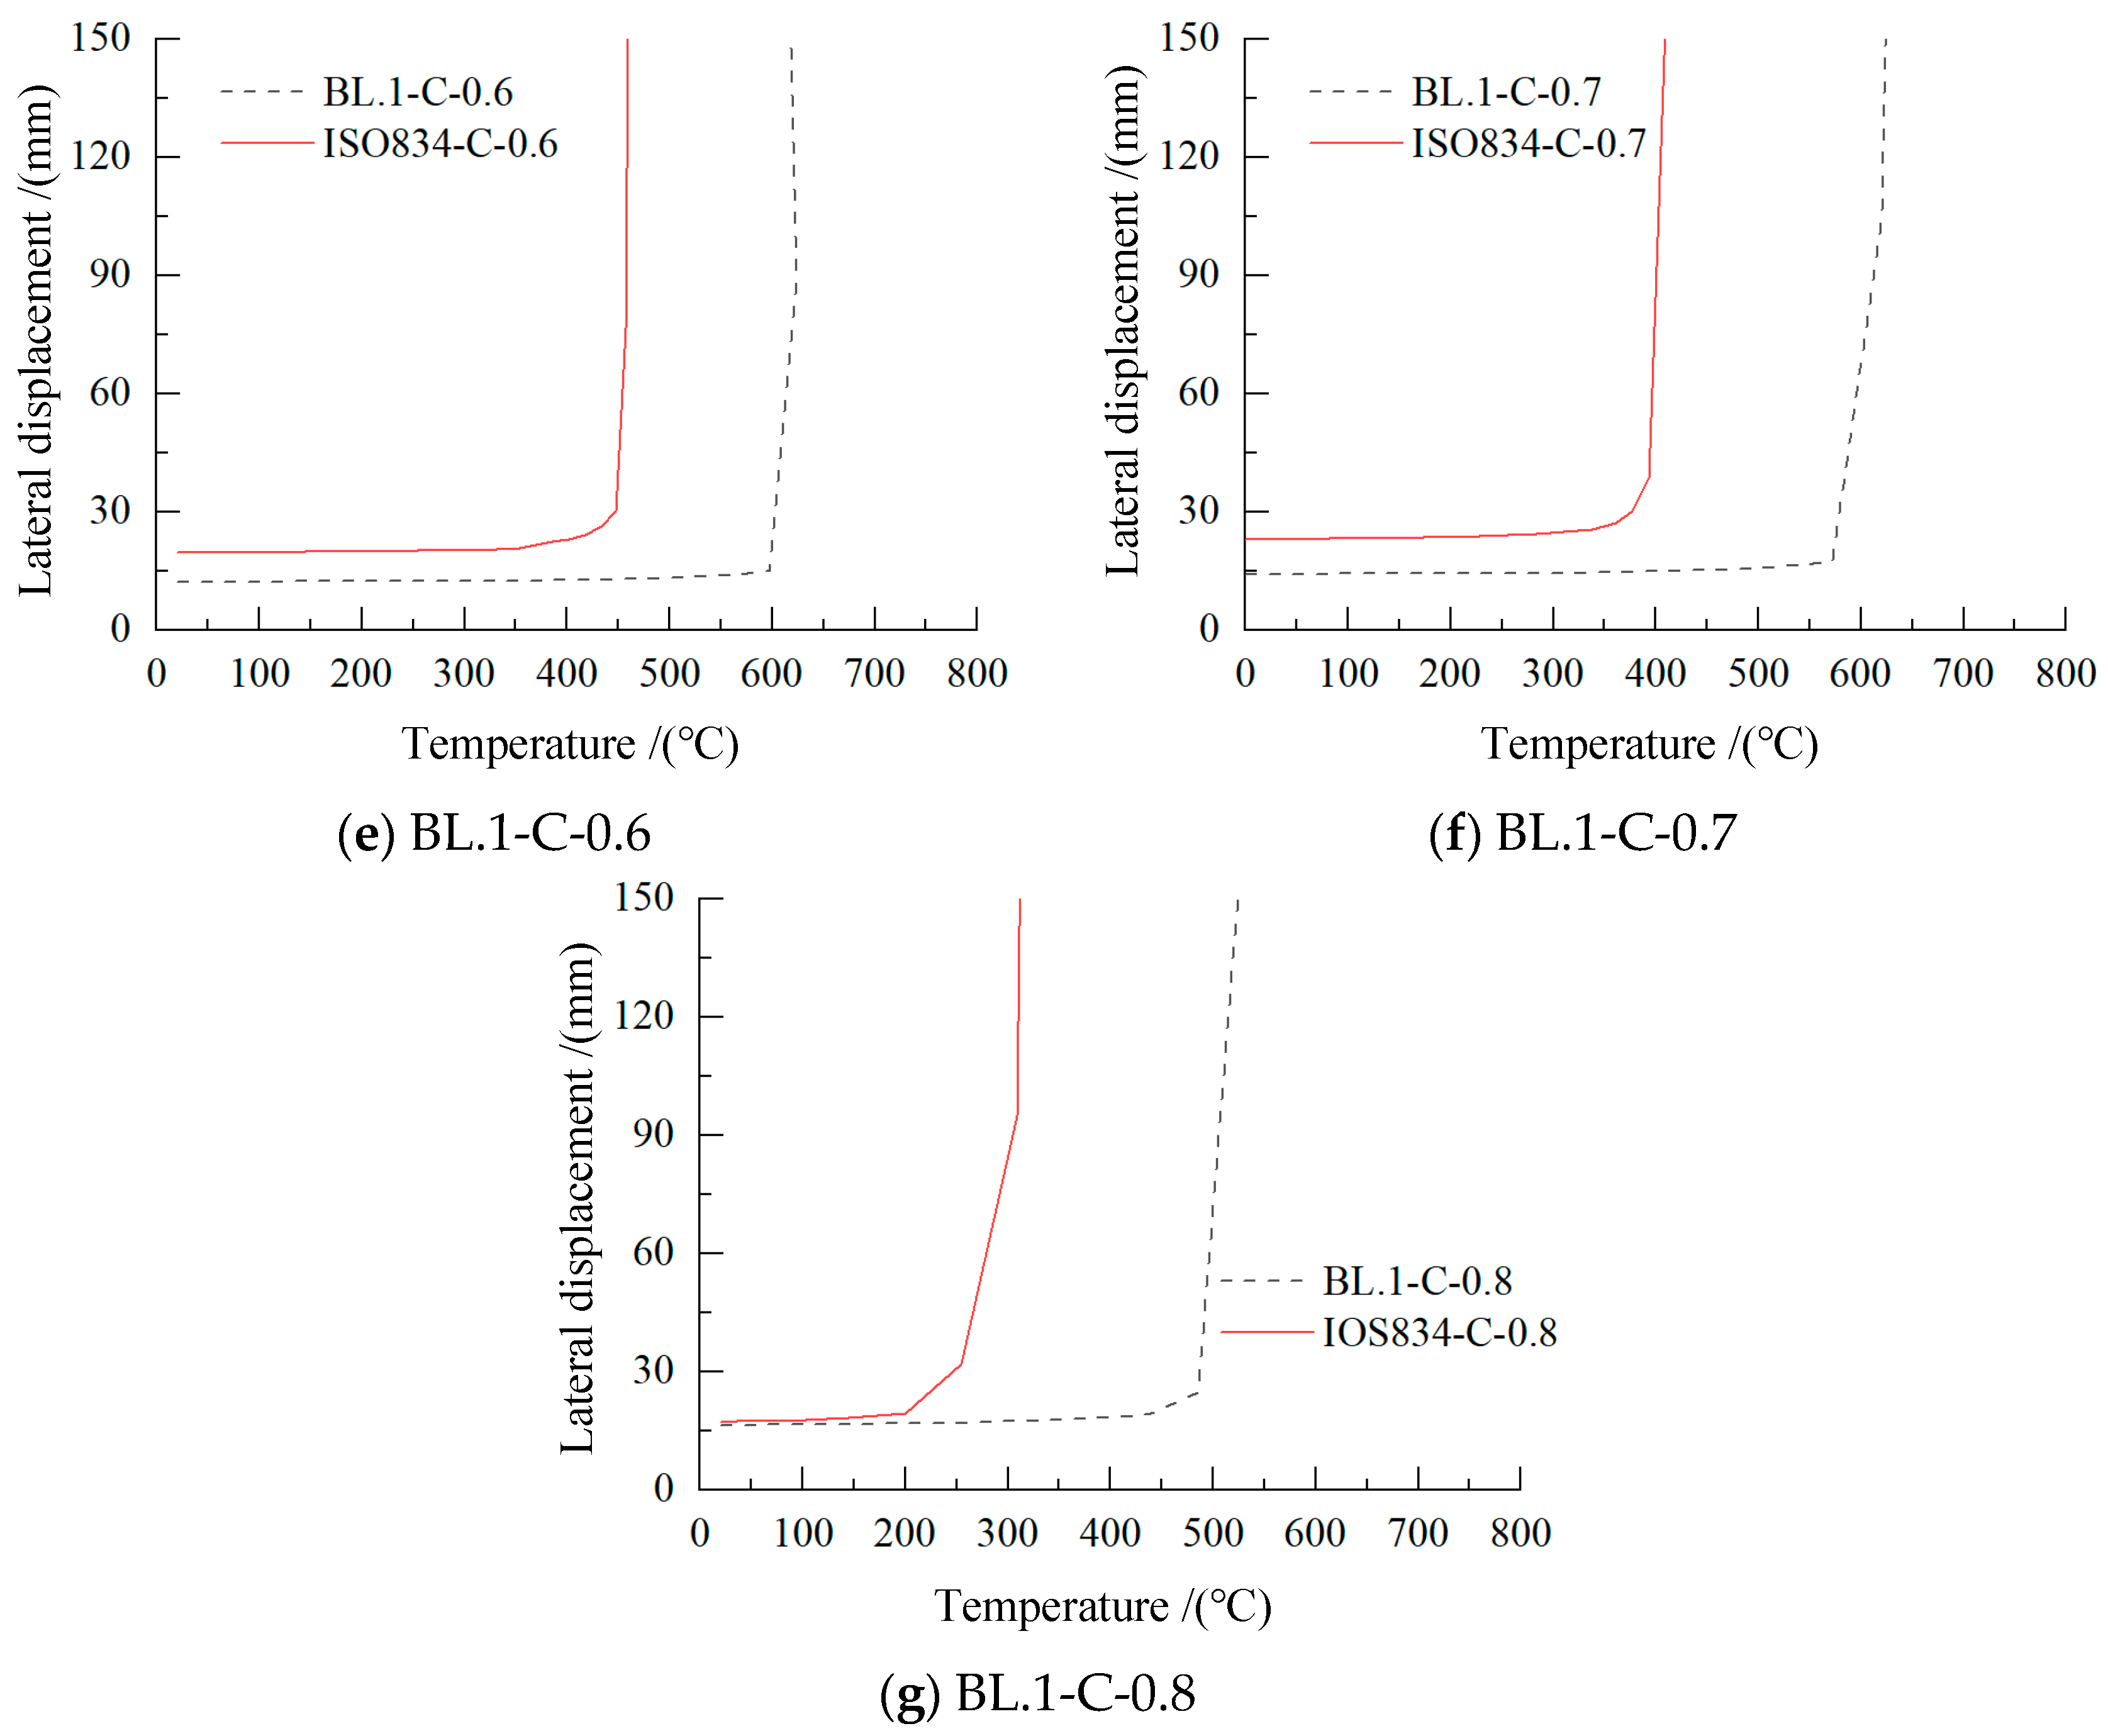
3.2. The Whole Process of Behavior Analysis and Failure Mode of the Steel Beam Under Fire
3.2.1. Behavior Analysis and Failure Modes Under Fire
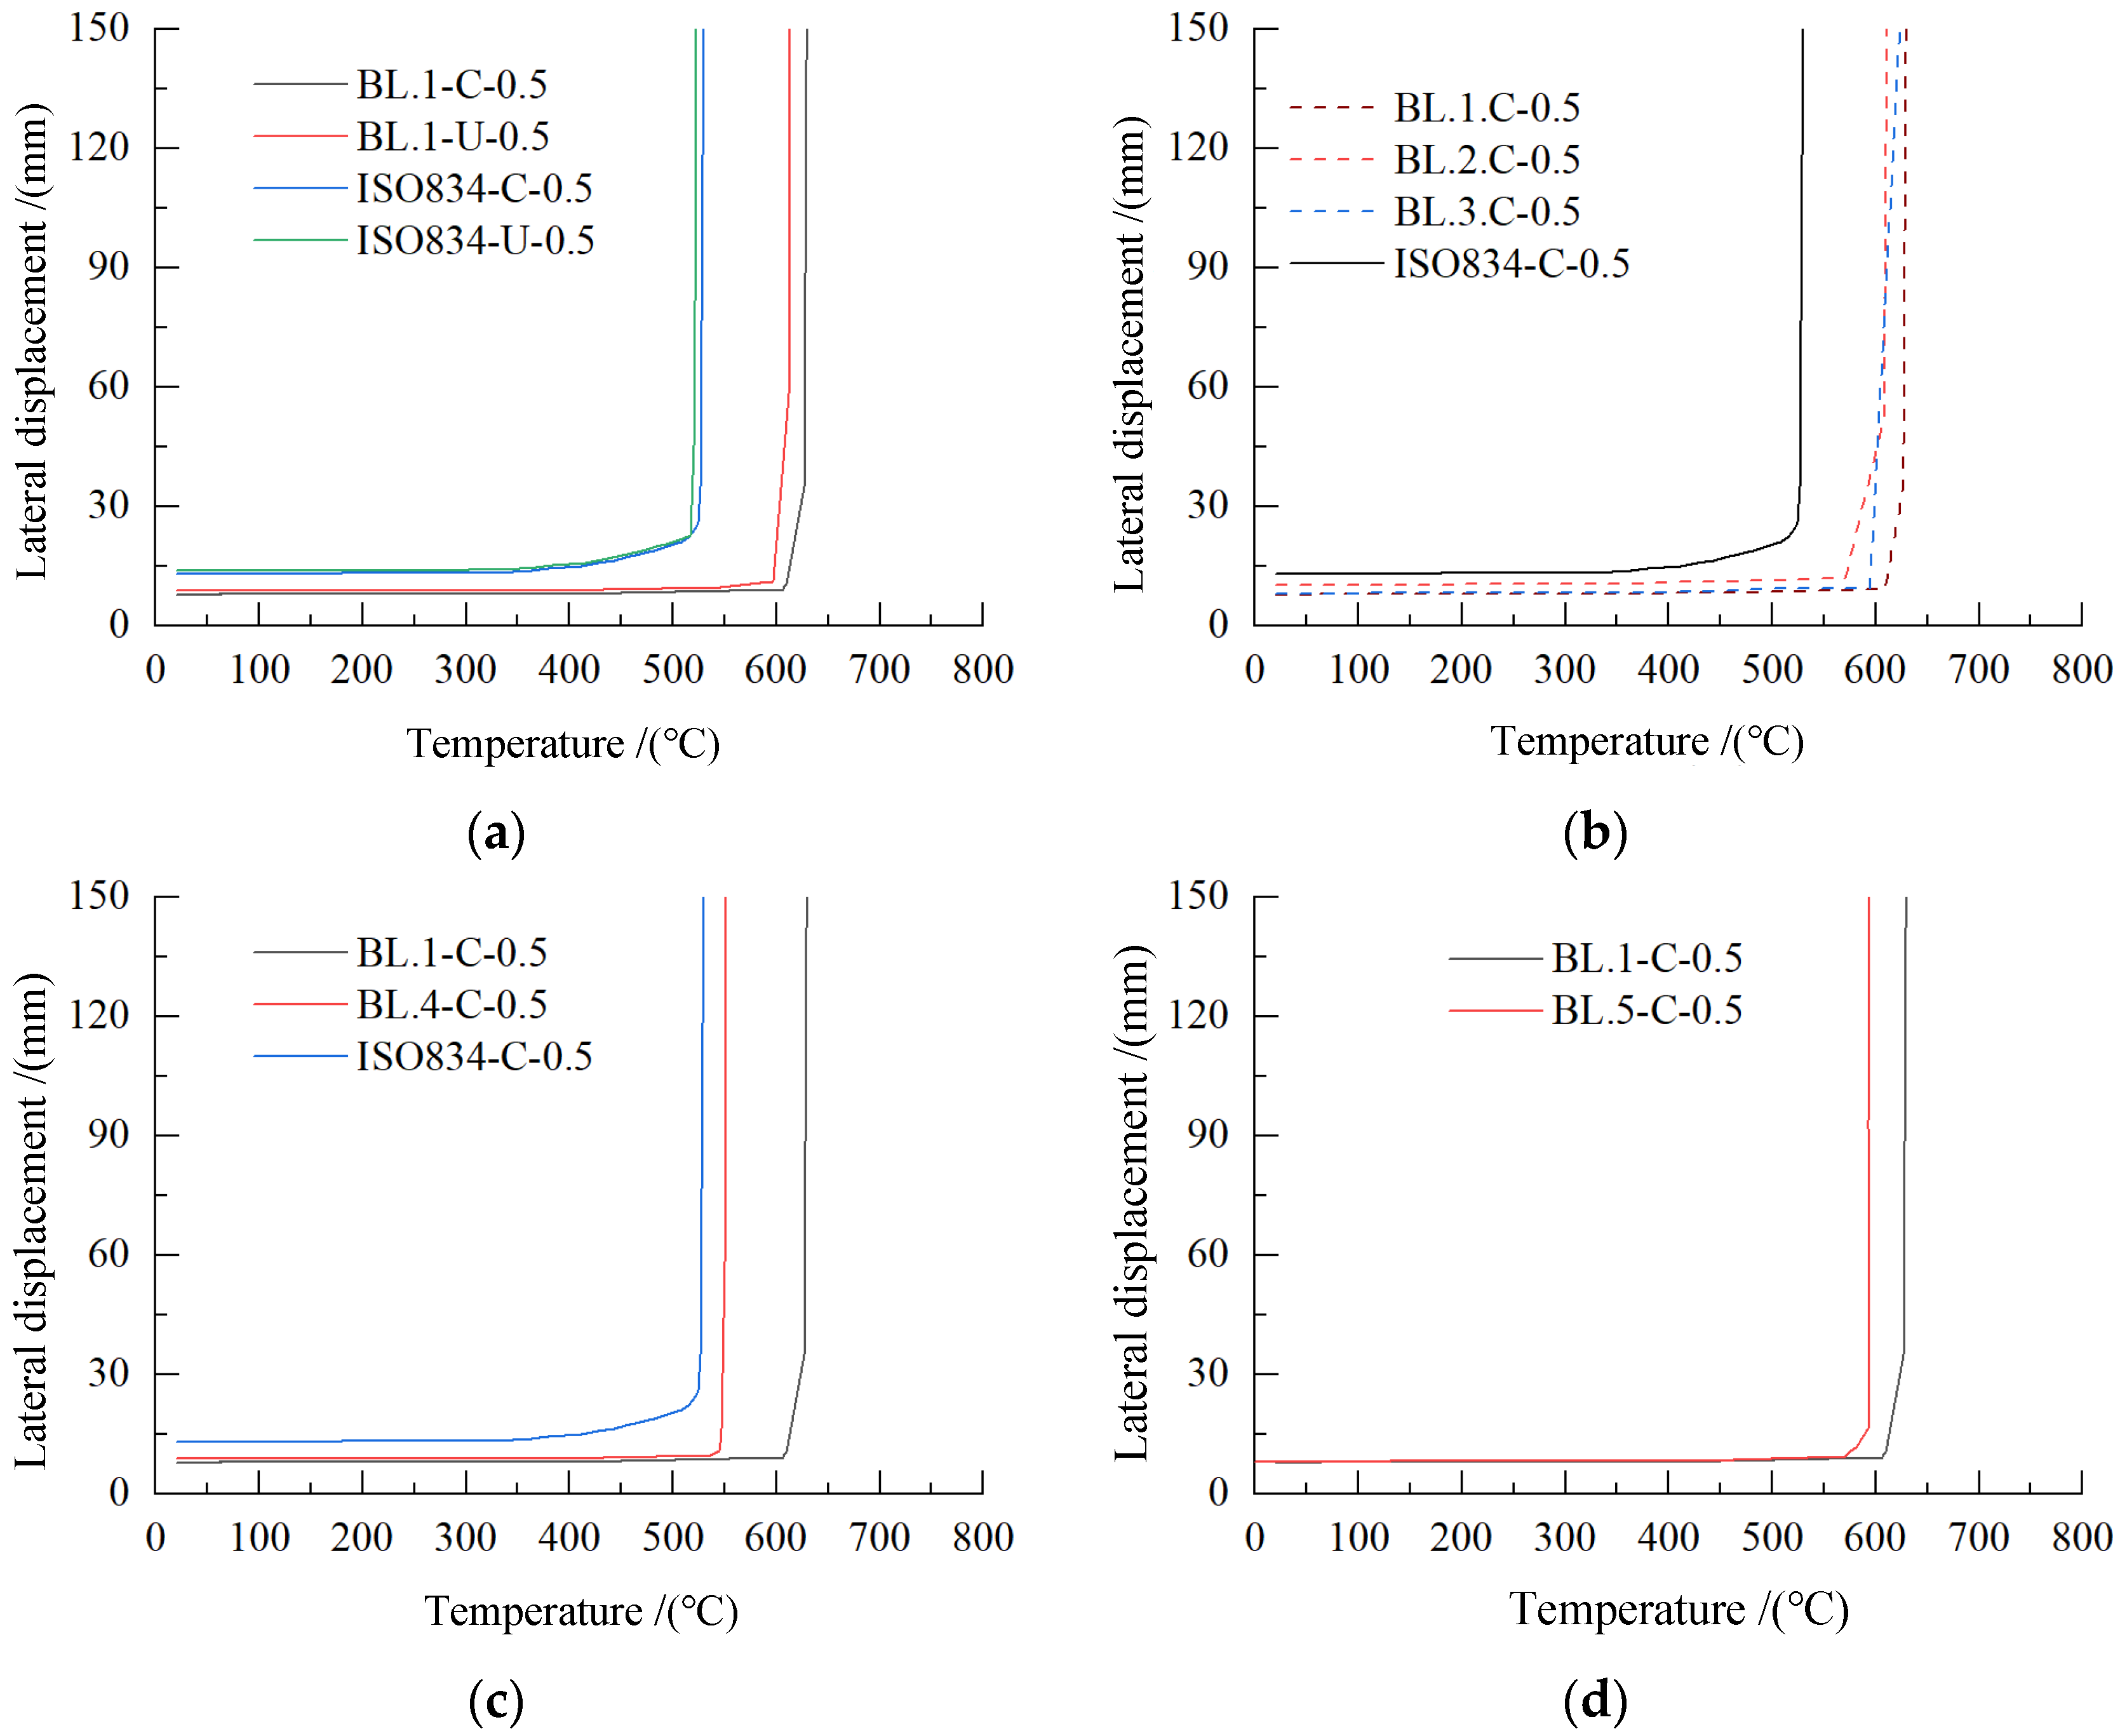
3.2.2. Comparison of Fire Resistance Temperature of Steel Beam
3.2.3. Failure Temperature Parameter Analysis of Steel Beam
4. Correction of Critical Temperature Calculation Formula of Steel Beam
4.1. Formula Correction
4.2. Verification of Simplified Calculation Formula
4.3. Limitations of the Formula
5. Conclusions
Author Contributions
Funding
Institutional Review Board Statement
Informed Consent Statement
Data Availability Statement
Conflicts of Interest
References
- Wu, Y.; Fan, S.; He, B.; Liu, M.; Zhou, H. Research on the fire resistance design of high-strength steel hollow columns under axial compression. Eng. Struct. 2021, 234, 111943. [Google Scholar] [CrossRef]
- Wang, W.; Zhang, L.; Li, G. Experimental study on fire resistance of high strength Q690 steel column. J. Build. Struct. 2019, 40, 155–162. [Google Scholar]
- Feng, C.; Li, G.; Jiang, B. Research on the influence of steel high temperature material model on the collapse simulation of steel frame structure under fire. Eng. Mech. 2019, 36, 24–36+78. [Google Scholar]
- Jiang, B.; Yin, Z.; Zhang, J.; Fan, C.; Li, Y. Effect of rotational restraint conditions on performance of steel columns in fire. Eng. Struct. 2021, 238, 112237. [Google Scholar] [CrossRef]
- Bailey, C.G.; Newman, G.M.; Robinson, J.T.U. Fire Safe Design: A New Approach to Multi-Storey Steel-Framed Buildings, 2nd ed.; SCI Publication; Steel Construction Institute: Bracknell, UK, 2006. [Google Scholar]
- Liu, M.; Fan, S.; Ding, R.; Chen, G.; Du, E.; Wang, K. Experimental investigation on the fire resistance of restrained stainless steel H-section columns. J. Constr. Steel Res. 2019, 163, 105770. [Google Scholar] [CrossRef]
- Wang, Y.C.; Dai, X.H.; Bailey, C.G. An experimental study of relative structural fire behaviour and robustness of different types of steel joint in restrained steel frames. J. Constr. Steel Res. 2011, 67, 1149–1163. [Google Scholar] [CrossRef]
- Li, G.Q.; Guo, S.X. Analysis of Restrained Steel Beams Subjected to Heating and Cooling Part I: Theory. Steel Compos. Struct. 2008, 8, 1–18. [Google Scholar] [CrossRef]
- Li, G.Q.; Guo, S.X. Experiment on Restrained Steel Beams Subjected to Heating and Cooling. J. Constr. Steel Res. 2008, 64, 268–274. [Google Scholar] [CrossRef]
- Li, X.; Dong, Y.; Cong, S. Experimental study on fire resistance of H-section steel beam. J. Build. Struct. 2006, 94–96+102. [Google Scholar] [CrossRef]
- Li, X. Experimental Study and Nonlinear Finite Element Analysis on Fire Resistance of H-Section Steel Frame. Ph.D. Thesis, Xi’an University of Architecture and Technology, Xi’an, China, 2006. [Google Scholar]
- Sun, D.; Xia, J.; Long, M. Experimental study on the performance of restrained steel beam during cooling stage at high temperature. J. Build. Struct. 2009, 39, 85–90. [Google Scholar]
- Sun, D.; Xia, J.; Chang, H.; Bu, L. Finite Element and Experimental Analysis of Restrained Steel Beams in the Whole Process of Rise-Cooling. J. Disaster Prev. Mitig. Eng. 2010, 30, 71–76. [Google Scholar]
- Liu, M.; Fan, S.; Guo, Y.; Gui, H.; Ding, R.; Zhou, H. Research on the Judgement Method for Catenary Action of Restrained Steel Beams in Fire. Int. J. Steel Struct. 2020, 20, 692–704. [Google Scholar] [CrossRef]
- Yin, Y.Z.; Wang, Y.C. A numerical study of large deflection behaviour of restrained steel beams at elevated temperatures. J. Constr. Steel Res. 2004, 60, 1029–1047. [Google Scholar] [CrossRef]
- Yin, Y.Z.; Wang, Y.C. Analysis of catenary action in steel beams using a simplified hand calculation method, Part 1: Theory and validation for uniform temperature distribution. J. Constr. Steel Res. 2005, 61, 183–211. [Google Scholar] [CrossRef]
- Kodur, V.K.R.; Dwaikat, M.M.S. Response of steel beam–columns exposed to fire. Eng. Struct. 2009, 31, 369–379. [Google Scholar] [CrossRef]
- Dwaikat, M.K.V. Effect of Location of Restraint on Fire Response of Steel Beams. Fire Technol. 2010, 46, 109–128. [Google Scholar] [CrossRef]
- Xi, F.; Luan, Y. Criteria of Limiting Temperature and Parametric Analysis of the Large Deflection Behavior for Fully Restrained Steel Beams in Fire. Sci. China Technol. Sci. 2012, 55, 264–275. [Google Scholar] [CrossRef]
- ISO-834; Fire-Resistance Tests-Elements of Building Construction. International Standard, ISO834: Amendment 1, Amendment 2. ISO: Geneva, Switzerland, 1980.
- Quintiere, J.G. Fundamentals of Enclosure Fire “Zone” Models. J. Fire Prot. Eng. 1989, 1, 99–119. [Google Scholar] [CrossRef]
- Pape, R.; Waterman, T.E.; Eichler, T.V. Development of a Fire in a Room from Ignition to Full Room Involvement—RFIRES, NBS-GCR-81-301. NASA STI/Recon Tech. Rep. N 1981, 81, 27337. [Google Scholar]
- Walton, W.D. ASET-B: A room fire program for personal computers. Fire Technol. 1985, 21, 293–309. [Google Scholar] [CrossRef]
- Peacock, R.D.; Jones, W.; Reneke, P.; Forney, G. CFAST—Consolidated Model of Fire Growth and Smoke Transport (Version 7) Volume 2: User’s Guide; National Institute of Standards and Technology: Gaithersburg, MD, USA, 2023.
- Luo, M.; He, Y.; Beck, V. Application of field model and two-zone model to flashover fires in a full-scale multi-room single level building. Fire Saf. J. 1997, 29, 1–25. [Google Scholar] [CrossRef]
- Yakush, S.E. Uncertainty of Tenability Times in Multiroom Building Fires. Combust. Sci. Technol. 2012, 184, 1080–1092. [Google Scholar] [CrossRef]
- Dellepiani, M.G.; Munoz, G.R.; Yanez, S.J.; Guzmán, C.F.; Flores, E.I.S.; Pina, J.C. Numerical study of the thermo-mechanical behavior of steel–timber structures exposed to fire. J. Build. Eng. 2023, 65, 105758. [Google Scholar] [CrossRef]
- Quintiere, J. Fundamentals of Fire Phenomena; Wiley: Hoboken, NJ, USA, 2006. [Google Scholar]
- Xing, Y.; Wang, W.; Al-Azzani, H. Assessment of thermal properties of various types of high-strength steels at elevated temperatures. Fire Saf. J. 2021, 122, 103348. [Google Scholar] [CrossRef]
- Ding, Y. Experimental Study on Fire Resistance of High Strength Q460 Steel Beam. Master’s Thesis, Chongqing University, Chongqing, China, 2022. [Google Scholar]
- GB 51249-2017; Ministry of Housing and Urban-Rural Development of the People’s Republic of China Technical Code for Fire Protection of Building Steel Structures. China Planning Press: Beijing, China, 2017.
- Wang, W.Y.; Liu, B.; Kodur, V. Effect of Temperature on Strength and Elastic Modulus of High-Strength Steel. J. Mater. Civ. Eng. 2013, 25, 174–182. [Google Scholar] [CrossRef]
- GB/T 9978-1999; National Technical Committee for Fire Protection Standardization Test Methods for Fire Resistance of Building Components. China Standards Press: Beijing, China, 1999.


| Model Number | HRRPUA/kw/m2 | H/mm | S/m2 |
|---|---|---|---|
| BE.1 | 250 | 500 | 2 |
| BE.2 | 250 | 1500 | 2 |
| BE.3 | 250 | 1000 | 2 |
| BE.4 | 250 | 1000 | 4 |
| BE.5 | 350 | 500 | 2 |
| BE.6 | 350 | 1500 | 2 |
| BE.7 | 350 | 1000 | 2 |
| BE.8 | 350 | 1000 | 4 |
| Model Number | HRRPUA/kw/m2 | H/mm | S/m2 |
|---|---|---|---|
| BL.1 | 1000 | 500 | 2 |
| BL.2 | 1000 | 1500 | 2 |
| BL.3 | 1000 | 1000 | 2 |
| BL.4 | 1000 | 1000 | 4 |
| BL.5 | 2000 | 500 | 2 |
| BL.6 | 2000 | 1500 | 2 |
| BL.7 | 2000 | 1000 | 2 |
| BL.8 | 2000 | 1000 | 4 |
| Temperature | Thermal Expansion Coefficient of Q460 Steel | Temperature | Thermal Expansion Coefficient of Q460 Steel |
|---|---|---|---|
| °C | ×10−5 m/(m·°C) | °C | ×10−5 m/(m·°C) |
| 25 | 1.42 | 750 | 0 |
| 200 | 1.44 | 800 | 0 |
| 300 | 1.45 | 850 | 0 |
| 400 | 1.47 | 900 | 0 |
| 500 | 1.48 | 950 | 1.96 |
| 600 | 1.49 | 1000 | 1.96 |
| 700 | 1.50 |
| Temperature | Thermal Conductivity of Q460 Steel | Temperature | Thermal Conductivity of Q460 Steel |
|---|---|---|---|
| °C | W/(m·°C) | °C | W/(m·°C) |
| 25 | 50.971 | 600 | 36.820 |
| 100 | 49.125 | 700 | 34.359 |
| 200 | 46.664 | 800 | 31.898 |
| 300 | 44.203 | 900 | 29.437 |
| 400 | 41.742 | 1000 | 29.437 |
| 500 | 39.281 |
| Temperature | Specific Heat Capacity of Q460 Steel | Temperature | Specific Heat Capacity of Q460 Steel |
|---|---|---|---|
| °C | J/(kg·°C) | °C | J/(kg·°C) |
| 25 | 462.40 | 600 | 733.57 |
| 100 | 495.55 | 700 | 895.14 |
| 200 | 529.10 | 800 | 840.68 |
| 300 | 559.68 | 900 | 628.41 |
| 400 | 597.27 | 1000 | 595.00 |
| 500 | 651.90 |
| Temperature | Elastic Modulus Reduction Factor | Yield Strength Reduction Factor | Temperature | Elastic Modulus Reduction Factor | Yield Strength Reduction Factor |
|---|---|---|---|---|---|
| °C | ET/E | fy.T/fy | °C | ET/E | fy.T/fy |
| 20 | 1.000 | 1.000 | 500 | 0.836 | 0.855 |
| 100 | 0.983 | 0.879 | 550 | 0.809 | 0.744 |
| 200 | 0.960 | 1.072 | 600 | 0.764 | 0.730 |
| 300 | 0.928 | 1.143 | 700 | 0.636 | 0.362 |
| 400 | 0.862 | 1.058 | 800 | 0.480 | 0.177 |
| 450 | 0.862 | 1.058 |
Disclaimer/Publisher’s Note: The statements, opinions and data contained in all publications are solely those of the individual author(s) and contributor(s) and not of MDPI and/or the editor(s). MDPI and/or the editor(s) disclaim responsibility for any injury to people or property resulting from any ideas, methods, instructions or products referred to in the content. |
© 2025 by the authors. Licensee MDPI, Basel, Switzerland. This article is an open access article distributed under the terms and conditions of the Creative Commons Attribution (CC BY) license (https://creativecommons.org/licenses/by/4.0/).
Share and Cite
Chen, W.; Qin, Q.; Wang, X.; Li, J.; Liang, M.; Chen, Z.; Yang, T. Study on the Fire Resistance of Axially Restrained H-Shaped Steel Beams Under Real Fire. Appl. Sci. 2025, 15, 7424. https://doi.org/10.3390/app15137424
Chen W, Qin Q, Wang X, Li J, Liang M, Chen Z, Yang T. Study on the Fire Resistance of Axially Restrained H-Shaped Steel Beams Under Real Fire. Applied Sciences. 2025; 15(13):7424. https://doi.org/10.3390/app15137424
Chicago/Turabian StyleChen, Wenwen, Qinghe Qin, Xiaoming Wang, Jie Li, Meng Liang, Zhihao Chen, and Taochun Yang. 2025. "Study on the Fire Resistance of Axially Restrained H-Shaped Steel Beams Under Real Fire" Applied Sciences 15, no. 13: 7424. https://doi.org/10.3390/app15137424
APA StyleChen, W., Qin, Q., Wang, X., Li, J., Liang, M., Chen, Z., & Yang, T. (2025). Study on the Fire Resistance of Axially Restrained H-Shaped Steel Beams Under Real Fire. Applied Sciences, 15(13), 7424. https://doi.org/10.3390/app15137424